Article

Future Land Use and Habitat Quality Dynamics: Spatio-Temporal Analysis and Simulation in the Taihu Lake Basin

1
School of Geography and Tourism, Anhui Normal University, Wuhu 241003, China
2
Key Laboratory of Earth Surface Processes and Regional Response in the Yangtze Huaihe River Basin, Anhui Normal University, Wuhu 241003, China
*
Author to whom correspondence should be addressed.
Sustainability 2024, 16(17), 7793; https://doi.org/10.3390/su16177793
Submission received: 24 June 2024 / Revised: 4 September 2024 / Accepted: 5 September 2024 / Published: 6 September 2024

Abstract

:
Land use change profoundly impacts habitat quality, necessitating an understanding of historical and future trends for effective regional planning and ecological protection, particularly in ecologically sensitive areas. This study examines the Taihu Lake Basin (TLB), a region undergoing significant land use changes and exhibiting considerable ecological vulnerability. Utilizing the InVEST model (v3.14.2), we analyzed the dynamics of land use and habitat quality in the TLB from 2000 to 2020. We subsequently employed the PLUS model (v1.40) to predict future land use and habitat quality under various scenarios. Our key findings include the following: (1) From 2000 to 2020, TLB experienced a 97.62% increase in construction land, alongside significant reductions in cultivated land and forestland. (2) Population density, precipitation, DEM, and temperature were identified as the main drivers of land use expansion in TLB. (3) Habitat quality declined by 11.20% over the study period, exhibiting spatial disparities including higher quality in the southwest and central regions and lower quality in the east and north. (4) Scenarios prioritizing urban development led to substantial construction land expansion and reduced habitat quality, whereas scenarios emphasizing ecological protection effectively mitigated habitat fragmentation. This study highlights the critical need to integrate ecological protection into regional planning to balance economic development with environmental sustainability. The findings underscore the importance of prioritizing ecological conservation in land use policies to maintain habitat quality and promote sustainable development in the TLB. These insights are valuable for guiding future land use planning and ecological management in similarly sensitive regions.

1. Introduction

Habitat quality is a vital indicator of regional ecosystem carrying capacity and biodiversity levels, essential for ecosystem stability, urban development, and human well-being [1,2,3]. However, since the 1950s, over 60% of global ecosystems have undergone degradation [4]. Land use/land cover change (LULCC), a prominent outcome of human activities, has been recognized as a primary factor contributing to the decline in ecosystem quantity, quality, and capacity to provide service [5,6,7]. In recent years, global climate change has further exacerbated the degradation of habitat quality [2,8,9], especially in ecologically vulnerable areas [10]. This dual threat underscores the urgent need to balance ecological conservation with regional development to achieve sustainable development [11].
Effective management of habitat quality necessitates a comprehensive understanding of how land use changes impact ecosystems. Despite considerable research on historical land use changes, the effects of future land use changes on habitat quality remain underexplored [12]. Historical and future spatial distribution patterns of LULCC need to be disclosed to advance ecosystem management and optimize land use [13].
Rapid social and economic development has dramatically altered land use, making sensible regional planning critical [14]. Predicting future land use changes is complex, often involving multiple factors like climate change and socio-economic developments. With the continuous development of machine learning technology, land use prediction models continue to emerge. Empirical models predict land use changes by correlating land use types and drivers [15]. Temporal and spatial forecasts are crucial for future land use planning and ecosystem management. Temporal forecasting aids in comprehending land use change trends to formulate long-term land use policies and ecological protection measures [16]. Therefore, the selected model should incorporate temporal and spatial predictions [17]. Models that fulfill this criterion primarily include CLUE-S, CA-Markov, and FLUS [18]. Nonetheless, these models possess limitations, particularly in assessing regional habitat quality, stemming from their incapacity to simulate the synchronous evolution of land use patches, lacking spatial–temporal dynamics [19].
To address these limitations, Liang proposed a cellular automaton (CA) model based on a multi-type Patch Generation Strategy. The PLUS model, adept at simulating changes at the land patch level, was used in Wuhan to assess its simulation accuracy compared to other land use models [18]. The findings indicated higher simulation accuracy and more remarkable similarity in landscape patterns. Wang and Zhang compared the CA-Markov model, the FLUS model, and the PLUS model in an ecological reserve in the western part of Beijing and found that the PLUS model could obtain higher simulation accuracy [20]. Wang validated the PLUS model in the Shiyang River Basin, a typical arid zone, and compared it with analogous models. The PLUS model has a better simulation effect than similar models [21]. The preceding studies demonstrate that the PLUS model exhibits satisfactory generalization and accuracy compared with other models. Nevertheless, its application remains relatively small. Because of this, the PLUS model is chosen to simulate the future land use of Taihu Lake Basin (TLB).
LULCC affects habitat quality by modifying physical land surface properties such as albedo, roughness, and evapotranspiration [3,22,23]. Additionally, the spatial differentiation of human activity patterns leads to spatial differentiation of LULCC, impacting ecosystem services. In future land use prediction, many past studies primarily consider the influence of climate change on land use, establishing a single simulation scenario while often disregarding the diversity of development strategies. This oversight can result in varying change patterns among different land use types. Consequently, this further affects the spatial distribution pattern of land use [24,25,26,27]. These differences directly affect the accuracy of habitat quality assessment [2,28,29]. Hence, to guarantee the logic and accuracy of future land use forecasts, we must comprehensively consider multiple impact factors, including climate change, different policy choices, economic development patterns, and the direct and indirect impact of human activities on land use. Multi-scenario simulations can effectively forecast and analyze land use changes across various planning scenarios, thereby identifying potential regional habitat quality decline and conflict issues [19,25].
In the context of habitat quality assessment, since Costanza defined the value of ecosystem services in the 1990s and assessed them by converting values into monetary units [30], the field of habitat quality assessment has seen the emergence of several new methods. One such method is the InVEST model, which has gained considerable traction due to its ability to operate with less data input, faster speeds, and produce more precise conclusions than traditional methods [31,32]. The InVEST model integrates ecological processes, allowing for a comprehensive analysis of habitat quality over time, which is crucial for understanding the impacts of land use changes on ecosystems. While other econometric approaches, such as Boosted Regression Trees, can also be used for land use and habitat quality forecasting, they often require extensive data and may not incorporate ecological processes as effectively as the InVEST model. Studies using the InVEST model, such as Wu’s in the Hong Kong–Macao Greater Bay Area and Lei on Hainan Island, have focused on historical and contemporary habitat quality assessment [33,34]. However, the majority of studies concentrate on analyzing the historical and contemporary situation of habitat quality assessment. Simultaneously, there is a paucity of research investigating the impact of future land use changes on habitat quality and the role of these changes in habitat degradation [25]. While some scholars have integrated prediction models with the InVEST model for habitat quality forecasting, fewer studies have combined the PLUS model with the InVEST model to assess habitat quality’s spatial and temporal dynamics and forecast future habitat quality using multi-scenario simulation. Hence, further investigation into future LULCC patterns in watersheds under the combined influence of human activities and climate change is imperative. This research will explore the specific impacts of LULCC on watershed ecosystems, providing insights for future urban land utilization and ecological conservation decisions.
Being densely populated and economically advanced, the TLB undergoes rapid land use changes. Nevertheless, swift urbanization further fragments regional habitats, exacerbating habitat fragmentation and quality decline. Hence, strategic land utilization planning and appropriate development strategies are imperative for optimizing overall benefits and fostering sustainable regional land utilization in the TLB. This study utilizes the PLUS and InVEST models to investigate land utilization dynamics and habitat quality across various scenarios in the TLB until 2030, offering theoretical backing for future economic growth and ecological preservation. Specifically, this study’s objectives encompass the following: (1) Utilizing the InVEST model to analyze spatio-temporal trends in habitat quality in the TLB for 2000, 2010, and 2020. (2) Conducting future land utilization simulations in the basin under diverse scenarios, considering the influence of environmental change and development models. (3) Assessing future habitat quality in the TLB across various development scenarios, contributing theoretical insights for ecological preservation and spatial planning.

2. Materials and Methods

2.1. Study Area

The Taihu Lake Basin (TLB) spans an area of over 36,900 km2, stretching from the alluvial plain in the east to the Maoshan and Tianmu Mountains in the west and from the Yangtze River in the north to the Qiantang River in the south. It encompasses Shanghai, Jiangsu, Zhejiang, and Anhui provinces and cities within the Yangtze River Delta urban cluster (106°7′ to 121°47′ E, 24°30′ to 33°54′ N) [35]. The region comprises approximately 62 districts and counties, experiences 4 distinct seasons, and receives abundant precipitation due to its subtropical monsoon climate. Terrain elevations are higher in the south and lower in the north, featuring plains, mountains, and hills (Figure 1). It ranks among China’s fastest-growing regions regarding economic development and urbanization. Occupying roughly 0.4% of the nation’s land area, it is home to 3% of its population and contributes over 10% to its GDP. However, it also faces significant human–land conflicts and environmental challenges, making it one of China’s most pressing areas for environmental management and ecological restoration [36,37]. Over the past two decades, rapid and extensive urbanization in the TLB has triggered significant alterations in regional land utilization patterns, disturbance to local habitats, exacerbated conflicts between human activities and the environment, and posed severe challenges to sustainable development. Consequently, the analysis of land use changes and the performance of multi-scenario simulations are paramount for land planning and ecological management in the TLB [38].

2.2. Data Sources

We obtained land use data for the TLB from the Resources and Environment Data Sharing Center of the Chinese Academy of Sciences, covering the years 2000, 2010, and 2020. These data were classified into six categories—cultivated land, forestland, grassland, water, construction land, and unused land—following a first-level classification system detailed in Table 1. To accurately model land use changes, we selected a comprehensive set of natural and socio-economic driving variables for the PLUS model based on previous studies [15,19,39].
The natural factors—average annual temperature, precipitation, altitude, slope, and soil type—were chosen for their critical roles in determining land suitability and influencing vegetation patterns. These variables are essential for understanding how environmental conditions shape land use. Additionally, socio-economic factors such as the distance from railways, cities, national highways, rivers, population density, and GDP were included due to their significant impact on human activities and urban expansion, which are primary drivers of land use change in rapidly developing regions like the TLB.

2.3. Methods

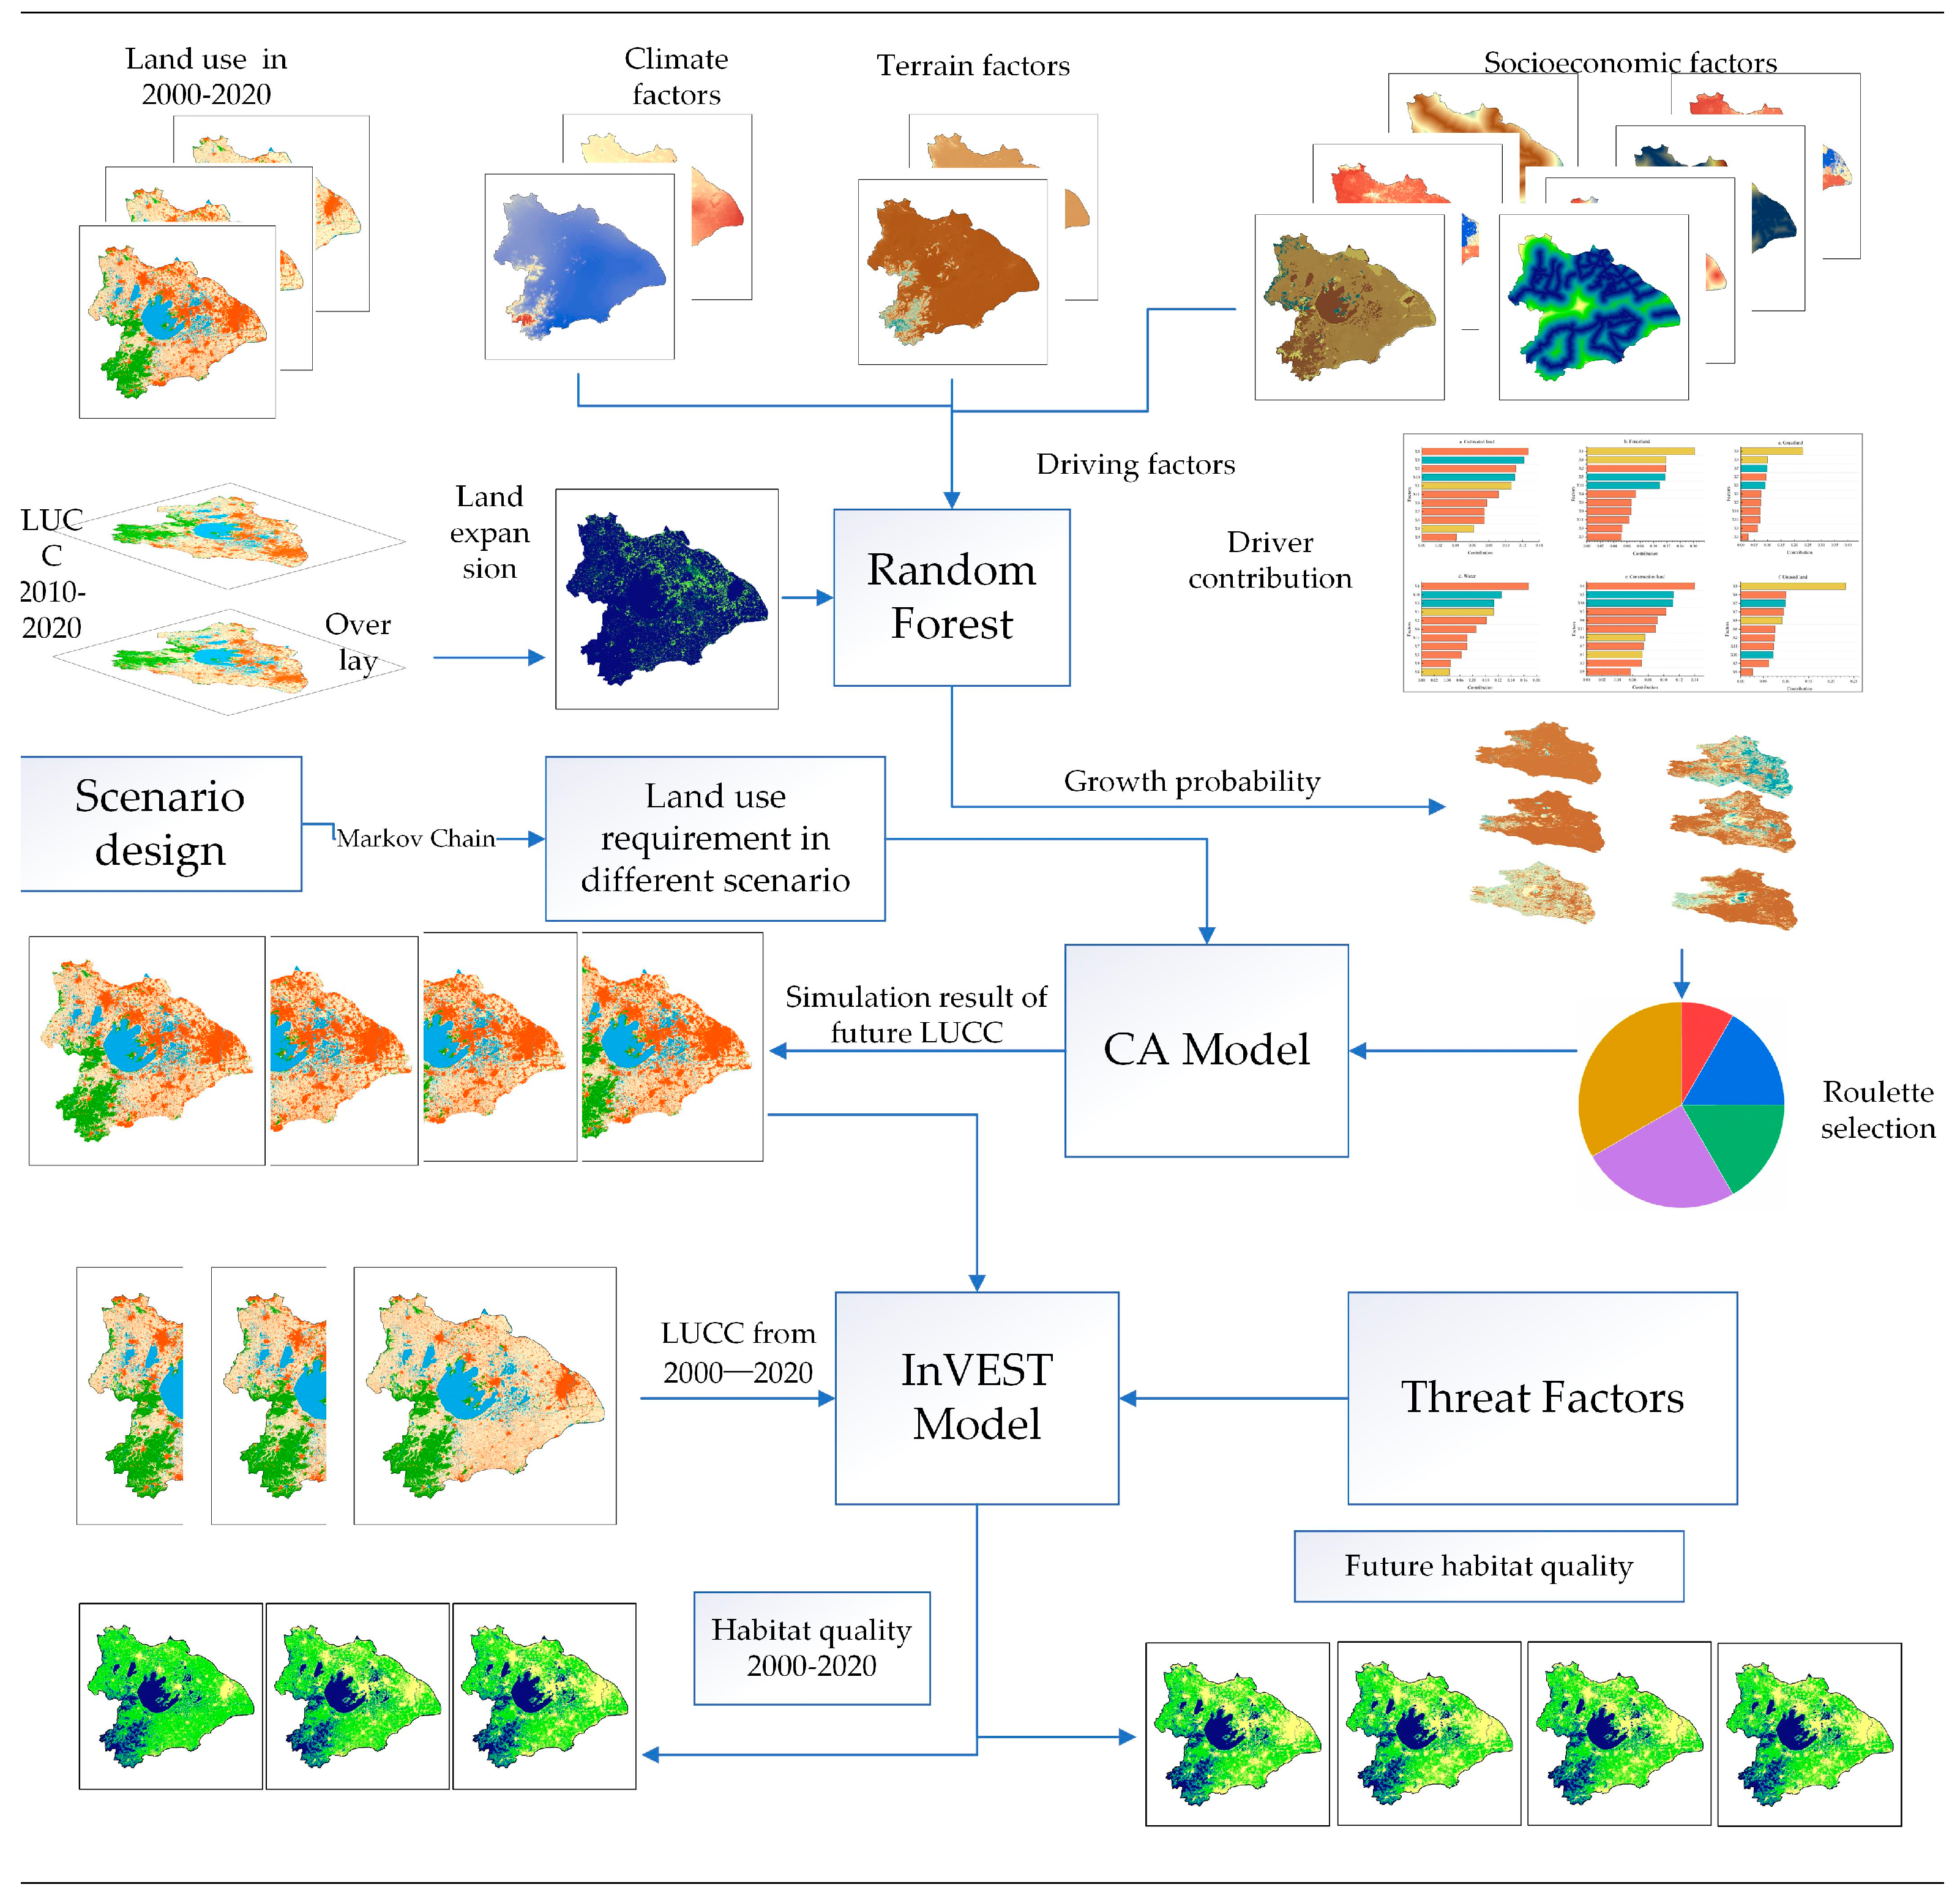
The research framework is depicted in Figure 2. Initially, land use data and drivers are input into the PLUS model as a dataset. The Random Forest model identifies the relative importance of various drivers in influencing the changes observed in land use types and the corresponding development probabilities. Subsequently, the CARS model and Markov Chain are utilized to forecast prospective land use requirements under various scenarios and produce the corresponding spatial distribution patterns. Finally, the simulated data are fed into the InVEST model to assess future habitat quality.

2.3.1. PLUS Model

This research utilized the PLUS model to simulate prospective land use alterations within the TLB. The model integrates Cellular Automata (CA) and Patch Generation Strategy (PGS) to improve the precision of land use drivers and patch-level changes [18,40]. The model satisfied this study well and was therefore chosen. The model comprises two principal modules: Land Expansion Analysis Strategy (LEAS) and Cellular Automata, based on multi-type random patch seeds (CARS) [40,41]. This research employed the PLUS model V1.4.0 software to extract the land use expansion areas in the TLB from 2000 to 2010. The relevant parameters were set through the LEAS module. This module incorporates the Random Forest algorithm (RF) to determine each driver’s influence weight on land use type change and its development probability. The CARS module is employed to simulate land use alterations in the TLB under different scenarios by combining the land use transfer matrix and neighborhood weights with the number of land use pixels.
P z , k b x = n = 1 V   I h n x = d V
where Pbz,k (x) denotes the cumulative probability of the z spatial unit transitioning to site type k at the given moment; b refers to either 1 or 0, where 1 represents the conversion of other land use types to land use type k, and 0 represents other changes. I() represents the index function of the decision tree, where x is a vector composed of spatial driver factors. In the Nth decision tree, the type of land use predicted by vector x is represented by hn, while V represents the aggregate count of decision trees.

2.3.2. Kappa Consistency Test

In order to construct the 2020 land use scenario, data from 2000 and 2010 were employed. Subsequently, the consistency of this scenario with actual 2020 data was evaluated. The accuracy was measured using the Kappa coefficient, which yielded a value of 0.779 in this study. The Kappa coefficient measures overall accuracy by evaluating the consistency between simulated and actual land use data per random specimen. The formula is as follows:
Kappa = O A o O A e 1 O A e
O A o = k = 1 n   O A kk N
where OAO indicates the likelihood that the results for each sample align with the actual land use data. The ratio value is equal to the number of correct pixels divided by the total number of pixels. The variable “n” represents the land use type, while “N” represents the total number of samples. OAkk represents the number of correctly classified land type k samples. OAe represents an accidental agreement between projections and actual land use data. Higher overall accuracy values and the Kappa coefficient signify superior simulation results and more excellent model reliability.

2.4. Scenario Design

Multi-scenario simulations can be employed to describe the potential impacts of current decisions on future environments and facilitate comparisons of the outcomes of of disparate future development scenarios [28,29,36]; based on previous studies, four scenarios were designed to simulate future land use in TLB: business as usual (BAU), urban development priority scenario (UDP), priority of ecological protection scenario (EEP), and balanced urban development and ecological protection scenario (BUE) [42].
(1) The BAU is developed from the observed trends in land use change and development in the TLB from 2010 to 2020, excluding other change scenarios. The Markov Chain component of the PLUS model is applied to the 2020 land use data in order to predict the TLB’s land use patterns for 2030 with a ten-year span. This forms the basis for simulating and forecasting other scenarios.
(2) The UDP takes urban development and construction as the primary goal and fixates on the BAU, increases the probability of transferring cultivated land, forestland, grassland, and unused land to construction land by 20%, and reduces the probability of construction land to forest land, grassland, water, and unused land by 30%. The likelihood of conversion of construction land to cultivated land remains unchanged.
(3) The EPP prioritizes ecological protection, aiming to safeguard the environment. It elevates the probability of turning construction land into other land types (excluding cultivated land) under the BAU. It also reduces the probability of other land types being developed into construction land by 30%.
(4) The BUE is designed to strike a balance between city growth and environmental conservation. Under the BUE, the probability of cultivated land, forest land, water area, and grassland turning into construction land is reduced by 10%, 20%, 20%, and 20%, respectively. The probability of construction land turning to forest land, water area, grassland, and unused land is reduced by 20%, respectively. Due to the low ecological value of unused land, the probability of converting it into construction land increases by 20%.

2.5. InVEST Model

This study utilized the habitat quality module of the InVEST model to assess the influence of human activities on the habitat ecological environment and quantify habitat quality [12].
Q xj = H j 1 T xj z T xj z + r z
where Qxj represents the habitat quality index of grid x for land use type j, Hj signifies the suitability of land use type j as habitat, Tzxj denotes the habitat degradation degree of grid x for land use type j, z is the default parameter of the model, and r represents the half-saturation constant, which is selected as 0.53 according to the actual situation of this study. The model parameters are shown in Table 2 and Table 3. According to previous studies [34,43], the habitat quality score was divided into five levels, including low [0–0.2], relatively low [0.2–0.4], medium [0.4–0.6], relatively high [0.6–0.8] and high [0.8–1], with a range of 0.2.

2.6. Random Forest Model

The Random Forest model is an integrated learning algorithm comprising a decision tree as the fundamental building block. Random Forest improves prediction accuracy and generalization ability by combining multiple weak classifiers (decision trees). The interpretability of these classifiers and moderate time complexity are conducive to reflecting the contribution of each spatial variable [26,44]. Therefore, the algorithm was employed to conduct a quantitative assessment of the drivers of each land use type.

3. Results

3.1. Analysis of Land Use Change

3.1.1. Spatial–Temporal Characteristics of Land USE Change in Taihu Lake Basin from 2000 to 2020

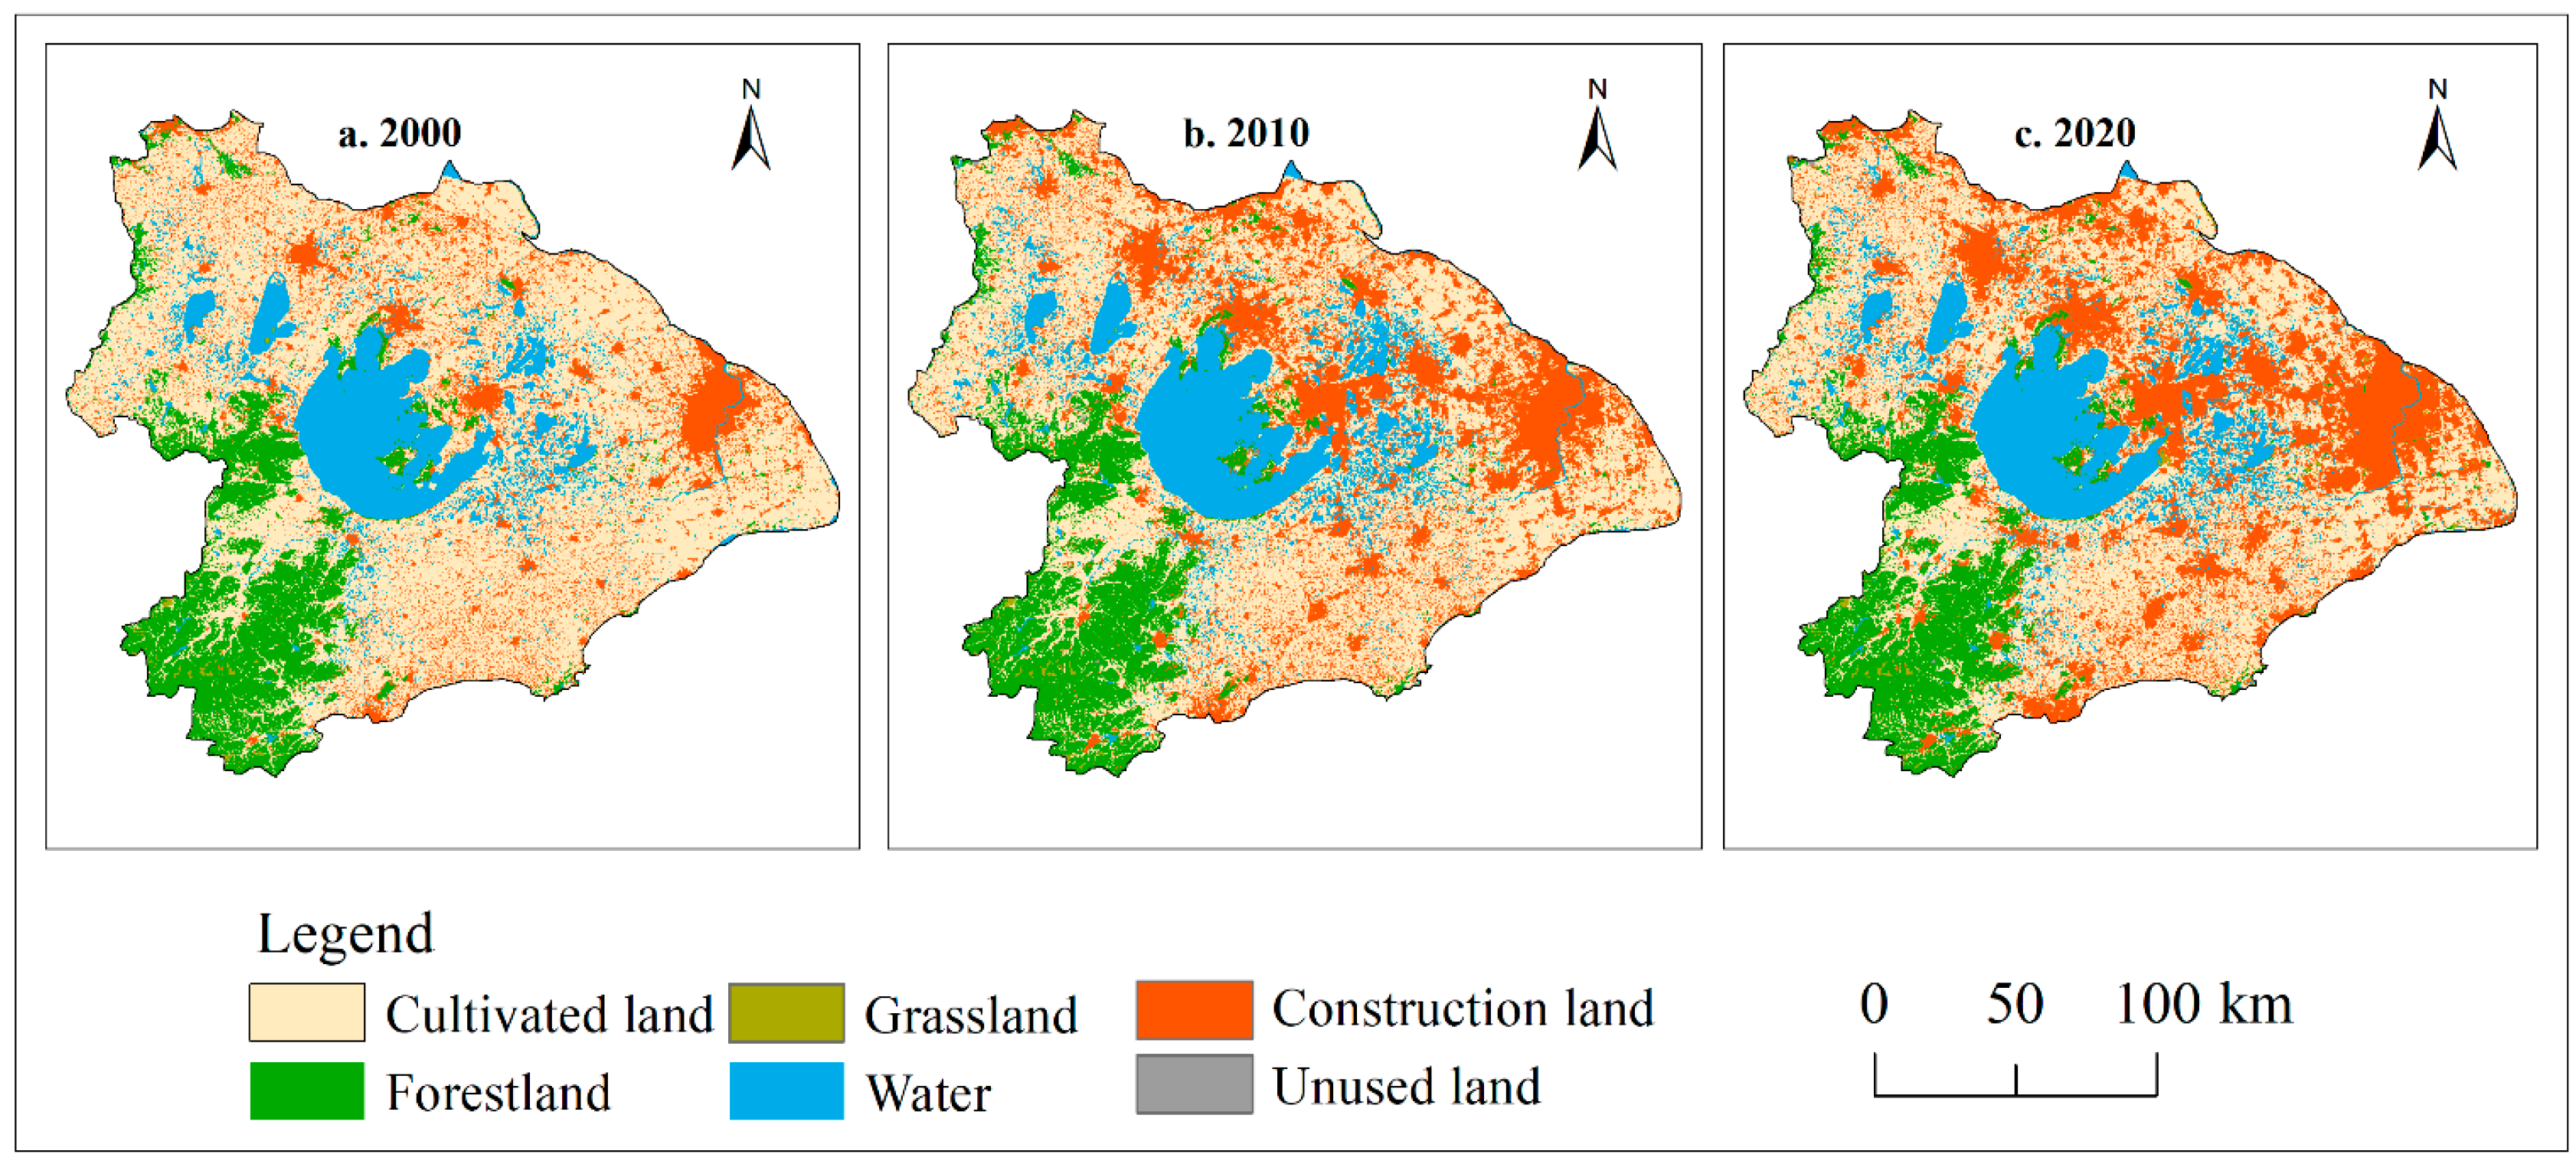
Figure 3 depicts the land utilization distribution in the TLB from 2000 to 2020. Cultivated land predominated, comprising 59.12%, 48.42%, and 44.69% of the total area in 2000, 2010, and 2020, respectively (Table 4). Construction land followed closely, projected to cover 27.74% of the total area by 2020, while forestland and grassland collectively accounted for 13.80% of the TLB. A notable growth of construction land, amounting to 3579.75 km2, occurred between 2000 and 2010, with a growth rate of 69.66%. In contrast, a significant decline in cultivated land occurred during the same period, with a reduction of 3914.44 km2. Other land use types remained stable, highlighting that urbanization in the TLB primarily encroached upon cultivated land. Notably, the unused land in the TLB surged by approximately 341.19% from 2000 to 2010, albeit only by 43.57 km2. Both cultivated land and forestland continued to shrink from 2010 to 2020.
Cultivated land area shrunk by 1363.99 km2, with a reduced shrinkage rate of 7.69%, while the change in forestland was negligible. Between 2010 and 2020, construction land expansion slowed considerably, increasing by 1437 km2, primarily as a result of the transformation of cultivated land (Figure 4); the growth rate decreased to 16.48%. Regarding spatial evolution, most of the growth of construction land is in the northeast of the TLB, such as Suzhou, Changzhou, and the vicinity of Shanghai, as well as the southeast of Jiaxing and Huzhou areas. Grassland area increased by 57.91 km2 from 2010 to 2020, representing a growth rate of approximately 37.74%, predominantly in the eastern region of the TLB, possibly due to urban environmental improvement efforts and expansion of urban green areas.

3.1.2. Land Use Simulations under Different Scenarios in 2030

The arrangement of land utilization classifications in TLB 2030 under the four scenarios was predicted using the 2020 land utilization data combined with the PLUS model (Figure 5). (1) Following the BAU, the overall changes in the TLB will continue the development trend observed between 2020 and 2030. This will create a land utilization pattern described as “two increases and four decreases”. Cultivated land is anticipated to continue being the primary contributor to the increase in construction land. The construction land and grassland area increased by 1129.57 km2 and 46.01 km2, respectively, while the forestland area in the TLB decreased by 64.58 km2, and the cultivated land decreased by 1049.85 km2 (Table 5). (2) According to the UDP, the development of the TLB is dominated by economic construction. Consequently, the area of growth of the construction land area is going to be greater than in the other three scenarios, with an additional 1683.97 km2; in contrast, the cultivated land and water area have been further reduced by 1506.35 km2 and 145.82 km2, respectively, while other types of land have exhibited minimal change. (3) Following the EPP, the growth in construction land is effectively constrained, with only 451.39 km2 of ecological land, such as forestland and water, undergoing a certain degree of expansion. In comparison, cultivated land has contracted by 497.27 km2. (4) The BUE represents a balance between urban development and ecological conservation. Consequently, the transformation of land utilization in TLB is characterized by “two increases and four decreases”. There is an increase in construction land and a slight expansion of waters. There is also growth and decline in each category. However, these changes are relatively minor compared to the other three scenarios.

3.2. Habitat Quality Changes

3.2.1. Spatial and Temporal Characteristics of Habitat Quality from 2000 to 2020

The habitat quality model was used to calculate the habitat quality of the TLB in 2000, 2010, and 2020. This analysis revealed spatial and temporal distributions (refer to Figure 6). Overall, the habitat quality in the TLB showed a relatively low level of temporal evolution, with average habitat quality in the study area being 0.4185, 0.3865, and 0.3716 for the years 2000, 2010, and 2020, respectively, indicating a gradual downward trend over the 20 years (Table 6). From 2000 to 2010, rapid urbanization in the TLB caused a 7.65% decline in regional habitat quality. Low-quality regions expanded dramatically by 3579.75 km2 (69.66% growth), while high-quality areas remained unchanged. From 2010 to 2020, the degradation of habitat quality slowed, with a 3.85% decline. Over the past two decades, low-quality areas have emerged and gradually expanded, encroaching on higher-quality areas. This expansion has led to continuous habitat fragmentation.
Spatially, lower habitat quality areas dominate. Higher and higher quality habitats are found in forestlands in the southwestern part of the TLB and watersheds in the central part. In general, habitat quality is lower in the northern and eastern parts of the TLB than elsewhere. This is due to large expanses of low-quality habitats characterized by dense urbanization and rapid economic development. This has led to the construction of numerous buildings, which has resulted in the degradation of the surrounding environment. Conversely, the western and southern regions are distinguished by high vegetation cover, low threat factors, and reduced human activities due to extensive water sources and forestlands. The urban densities in these regions are relatively lower than in the north and east, which results in higher habitat quality.

3.2.2. Habitat Quality Changes in TLB in 2030 under Different Scenarios

A simulation using the InVEST model produced a spatial arrangement graph of future habitat quality (Figure 7). Following the BAU, the expansion of the TLB continues the trend observed between 2000 and 2020. Consequently, the habitat quality of the entire TLB exhibits a general trend of decreasing quality over time. This is evidenced by the decrease in the overall habitat quality from 0.3716 to 0.3627 (Table 7). Many areas of medium habitat quality have been degraded to relatively low or low habitat quality.
A primary outcome of the UDP is expanding construction land within the TLB. This expansion has led to a reduction in ecological land across the entire region and a decline in the mean value of habitat quality, which has dropped to 0.3564. The area of moderate and higher habitat quality was reduced by 177.62 km2. In contrast, low-quality habitats expand in the east and central regions.
Under the EPP scenario, overall habitat quality notably improves compared to other scenarios, with an average of 0.3707. Medium- and lower-quality areas reduce by 197.02 km2, and high-quality areas increase by 26.4%. Low-quality growth in the east is curbed, and high-value areas expand. The expansion of low-quality habitats in the southwest is a notable phenomenon. The quality of habitats in forestland and grassland areas in the southwest improved, and the low-quality habitat area in the center of TLB was further reduced. Overall, the likelihood of converting other land to cultivated land was reduced following the principle of ecological protection priority. The transformation of a proportion of manufactured surfaces and agricultural land into forests and grasslands has resulted in a notable expansion of the region’s ecological footprint. This has contributed to enhanced connectivity of landscapes across the area, reduced habitat fragmentation, and improved habitat quality.
The BUE entails a more holistic consideration of the study area, integrating environmental factors and economic considerations to align more closely with the actual circumstances. The global habitat quality is 0.3654. In comparison to 2020, the regional habitat quality has undergone a slight decline, yet the extent of degradation is relatively modest. Notably, the proportion of regions displaying above-medium habitat quality has risen significantly and is now at 26.1%. With regard to spatial distribution, the areas of low habitat quality have expanded most significantly in the eastern urban areas. The area of high habitat quality of forest and grassland in southwest China has been expanded to a certain extent.

4. Discussion

4.1. Driving Force of Land Use Change

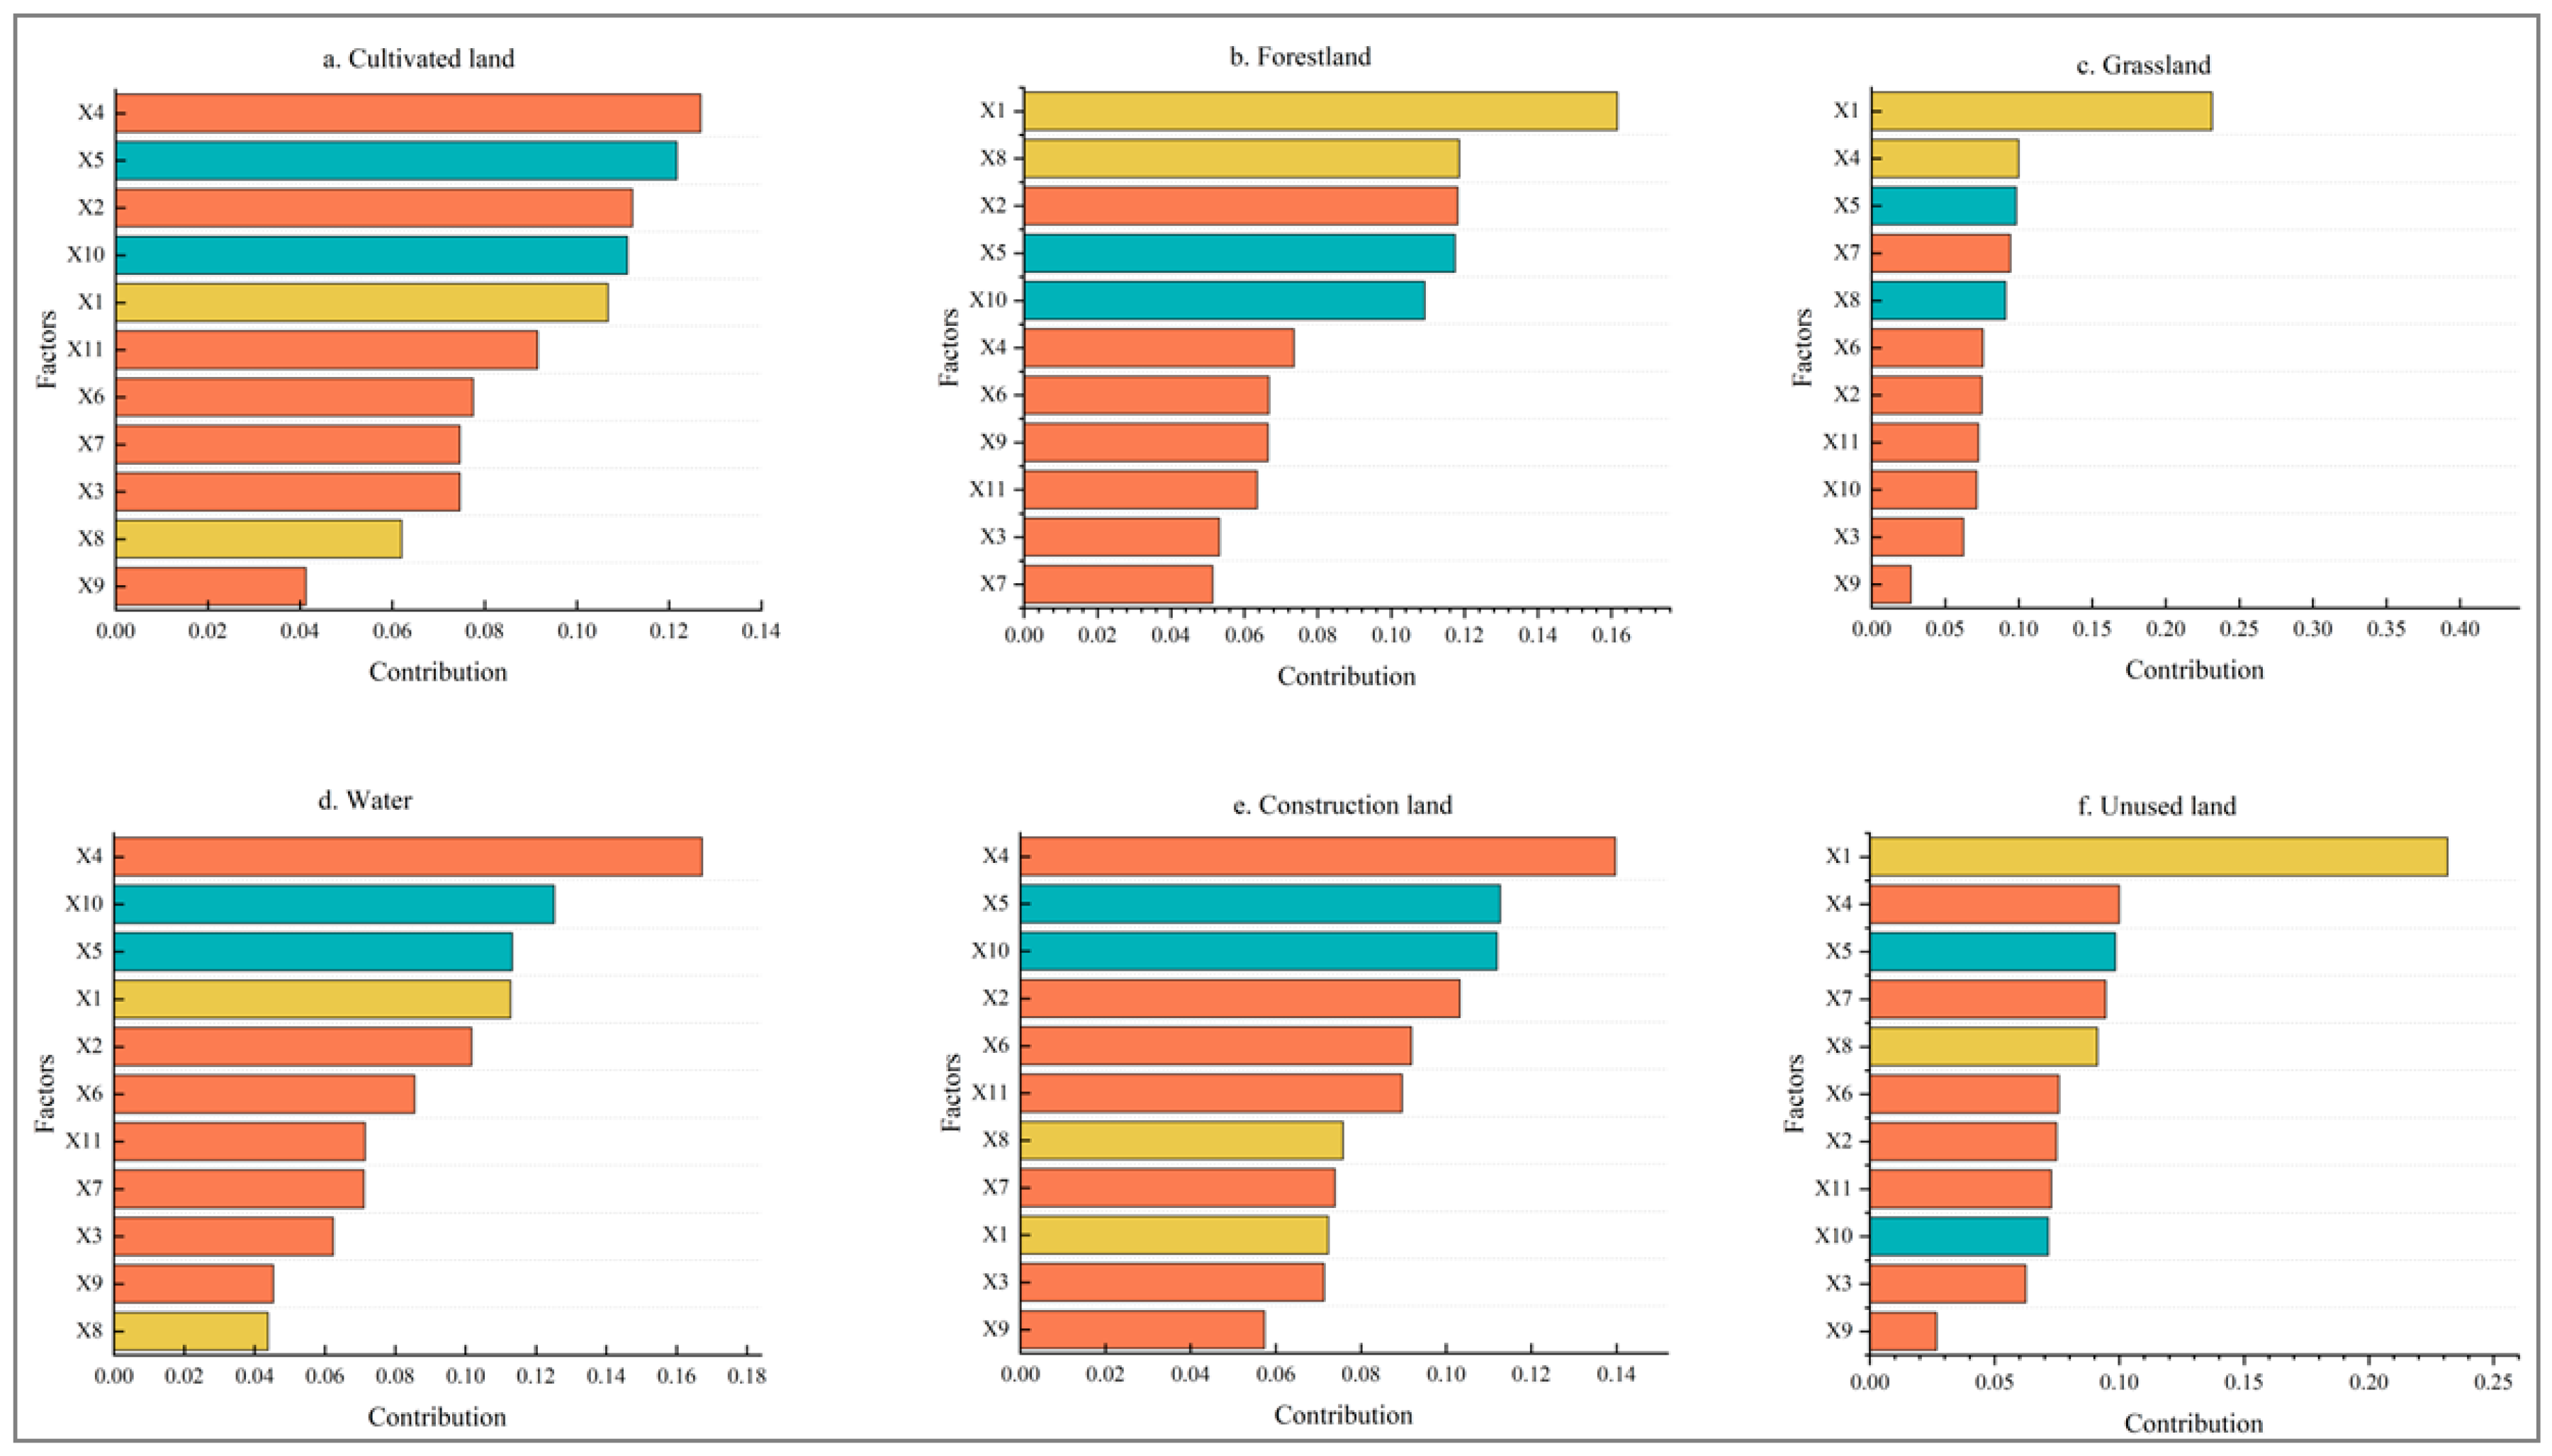
Clarifying the processes and rules for land use change and identifying key drivers are vital for adjusting the land use policy towards efficient, green, and intensive use of land resources [40]. According to the RF model, this study sorted the importance of the different regional influence factors (Figure 8) to elucidate the different drivers of land use in the TLB (Figure 9). The outcomes showed that population density, annual precipitation, and GDP contributed most to the expansion of cultivated land, followed by average annual temperatures; this suggested that human activity and climate factors played a pivotal role in the extension of the cultivated land, consistent with the findings of other researchers [12,25,28,45], which posit that population growth necessitates an increased food supply. In contrast, an increase in the amount of food required necessitates an expansion of cultivated land to supply food. Thus, population densities had the most prominent effect on expanding cultivated land. In addition, the land resources in the TLB are very tight, and the cost of cultivated land expansion is greater than that in other places, so economic development significantly impacts cultivated land expansion [15,46]. DEM is the most important driving factor of forestland expansion. Most newly established forestland is situated in the higher elevations of the Tianmu Mountain area, less affected by human activities. DEM is the main factor affecting grassland growth, indicating that grasses are more sensitive to elevation responses [47].
Meanwhile, the expansion of water is predominantly shaped by several factors, including population density, temperature, and precipitation. Socio-economic and climatic factors emerge as pivotal in driving land use changes across the TLB, aligning with earlier studies [26,40]. Rising population density necessitates further land expansion for construction to accommodate the growing populace. Favorable temperatures and precipitation play critical roles in attracting settlements, whereas DEM and slope exhibit lesser influence than demographic factors, which depart from prior research findings [28,41]. This divergence might be attributed to the predominantly flat topography of the TLB, where urban expansion tends to avoid significant topographical variations. Consequently, the factors driving the expansion of different land types vary, underscoring the necessity for policymakers to consider these nuances when formulating land use policies [40,48].

4.2. Response of Habitat Quality to Land Use

Land use change is widely acknowledged as the primary driver affecting habitat quality [5]. Consequently, it is crucial to gain an understanding of LULCC under different scenarios and their impact on habitat quality, as well as how habitat quality responds to these changes. This is essential for formulating explicit land use plans that balance human activities with natural ecosystems, mitigate ecological risks, and facilitate sustainable development. The results demonstrate significant differences in habitat quality in the TLB under four future development scenarios (Figure 7). Its change trend is highly consistent with land use change and is in line with the results of other studies (Figure 5) [12,25,28]. Threats to habitat quality stem from changes in construction land, unused land, and cultivated land, as alterations in these land use types directly influence habitat quality [33]. The region’s habitat quality value under the EPP is enhanced by the increased probability of conversion of construction land to other land types, the limited probability of conversion of other lands to construction land, the increasing trend of forest and grassland cover, and the reduction of construction land. Conversely, the construction land expansion observed in the UDP harms habitat quality by continuously fragmenting habitats and degrading regional ecosystems. The growth of construction land is most pronounced under the UDP. The construction of various types of infrastructure and transportation facilities results in the continuous erosion of habitats, leading to habitat fragmentation and degradation of regional ecosystems. This, in turn, harms the quality of forestlands, grasslands, and waters.
In contrast, the UDP has the most remarkable expansion of construction land and the continuous erosion of habitats with the construction of various basic transportation facilities, leading to the disruption of habitats, seriously affecting the ecosystem quality of TLB, resulting in continuous degradation of forestland, grasslands, and thickets. This confirms previous findings that accelerated economic development leads to gradual ecological degradation [19,49,50].
Comparing habitat quality under the EPP and BUE scenarios, we concluded that the impact of cultivated land and unused land on habitat quality is lower than that of construction land, which emerges as the greatest threat to the region’s habitat quality, consistent with prior research [12,15,25,28]. Nevertheless, economic and social development, technological innovation, and heightened environmental protection efforts suggest that construction land expansion can offer technical and financial support for habitat restoration.
Furthermore, a comparison of habitat quality under the BAU and UDP reveals that the impact of expanding ecological lands like forestlands, grasslands, and water bodies is less than that of cultivated and construction land. This discrepancy might stem from the greater ecological harm caused by land construction, including environmental pollution and biodiversity loss. These findings align with earlier research, indicating that ecological restoration costs exceed the damage [45]. Incorrect land use guidance could precipitate declining ecological quality in the TLB, exacerbating tensions between economic development and ecological preservation [25,27].

4.3. Limitations and Future Work

This research analyzes land use dynamics and habitat quality changes in the TLB between 2000 and 2020 amid rising climate and socio-economic uncertainties. It quantifies the influence that different driving factors exert upon land use change. Furthermore, this study predicts future urban land use under the joint influence of human activities and climate change. It assesses the habitat quality of the TLB under future land use changes and discusses their interrelationship, offering insights for crafting habitat protection, economic development policies, and land use planning in the region. However, the present study also has certain limitations. Firstly, this paper sets four typical development modes, but the development mode of the region is confined to the four. Meanwhile, TLB, as a frontier of reform and opening and an essential economic center in China, is subject to the impacts of national policies and may have its unique development mode, which may not be captured by the selected scenarios and may lead to a certain degree of bias in the simulation results. Consequently, subsequent studies will address this deficiency to enhance the scientific and reliability of the simulation results. Secondly, there are many cities in the TLB, and most are large. This study does not consider underground land use, which may lead to the actual habitat quality being lower than the simulated value. The outcomes of the land use simulation will influence subsequent habitat quality assessments. In this study, the PLUS model was employed for simulation, and the simulation accuracy was 0.779, which is a high simulation accuracy. However, whether other models are more suitable for this study area has yet to be compared and discussed in this paper.

4.4. Suggestion

The results of this study indicate that the expansion of construction land is a major factor contributing to the decline in habitat quality on the Tibetan Plateau. In order to address this issue, a comprehensive and proactive land use planning strategy must be adopted. Specifically, policies should prioritize the protection of high-quality habitats and prevent further habitat degradation by enforcing strict zoning regulations, especially in densely populated urban areas. Retrofit and upgrade older, highly polluted industrial sites to meet green building and green business standards and promote the expansion of high-quality green buildings.
In addition, it is crucial to formulate and strictly implement sustainable land use policies, including the implementation of policies such as returning farmland to lakes, returning farmland to forests, establishing ecological protection red lines to limit development in sensitive areas, and designating forested areas in the southwestern part of the study area and Lake Taihu in the central part of the study area as urban growth boundaries to limit their development. Protecting and restoring essential ecosystems, such as water bodies, forests, and grasslands, must be a central component of these policies. By controlling the rate of expansion of construction land and incorporating ecological considerations into urban development plans, we can ensure that sufficient ecological land and green infrastructure are retained within the land and soil boundaries.

5. Conclusions

In this study, we used the InVEST model to deeply analyze the spatial and temporal changes in land use and habitat quality in the TLB from 2000 to 2020 and combined it with the PLUS model to classify four simulation scenarios based on the possible future development direction and predicted the land use and habitat quality under different scenarios in 2030. The conclusion is as follows:
  • Land use distribution within the TLB has profoundly shifted from 2000 to 2020. Overall, there was a decline in cultivated and forest land, while land dedicated to construction saw a dramatic increase, reaching a total area of 998.83 km2, representing a 97.62% expansion. The expansion of the construction land base was primarily attributable to the conversion of cultivated land, with minimal change observed in other land types, indicating a pattern of “two decreases and one increase”.
  • TLB’s primary drivers of land use expansion are population density, precipitation, DEM, and temperature. Consequently, future land use simulations should prioritize incorporating these factors to represent potential development scenarios accurately.
  • The quality of habitats in the TLB continued declining between 2000 and 2020, with an average decrease of 0.047 in habitat quality, from 0.4185 to 0.3715. Spatially, habitat quality across the region exhibits a distribution pattern, with “high in the southwest and center, low in the east and north”. The quality of habitats is inextricably linked to the type of land use. Construction land was the most significant threat to habitat quality, directly influencing its regional decline.
  • In the BAU, the habitat quality of the whole region generally declined, and the area of medium habitat quality decreased significantly. In the UDP, the habitat quality was further degraded, and the development mode of purely pursuing economic benefits inevitably increased the fragmentation of habitats; compared with the BUE, the development of the TLB considered the economic and ecological needs so that the quality of the habitats within the study area improved to some extent. The areas of low habitat quality were reduced, and the overall habitat quality was improved. In contrast, under the BUE, the development of the TLB considers economic and ecological needs. It improves the habitat quality in the study area to a certain extent, reduces the low habitat quality areas, and improves the overall habitat quality.
In conclusion, the transformation of land use in the TLB is a natural consequence of regional development, but it poses significant challenges for ecological conservation. This study provides a comprehensive understanding of land use changes and their impacts on habitat quality, offering valuable insights for future land use planning and ecological management. Balancing urban development with ecological conservation is crucial to ensure sustainable land use, maintain ecosystem health, and promote sustainable socio-economic development in the TLB. Future research should focus on the long-term impacts of climate change and socio-economic developments on land use and habitat quality, as well as the effectiveness of different ecological protection strategies under various scenarios.

Author Contributions

C.H.: Writing—Original Draft and Data Curation. X.C. and Z.Z.: Data Curation, Software, and Supervision. All authors have read and agreed to the published version of the manuscript.

Funding

This work was supported by the National Natural Science Foundation of China (Grant No. 41977194).

Institutional Review Board Statement

Not applicable.

Informed Consent Statement

Not applicable.

Data Availability Statement

The original contributions presented in this study are included in the article, and further inquiries can be directed to the corresponding author.

Conflicts of Interest

The authors declare no conflicts of interest.

References

  1. Hillard, E.M.; Nielsen, C.K.; Groninger, J.W. Swamp Rabbits as Indicators of Wildlife Habitat Quality in Bottomland Hardwood Forest Ecosystems. Ecol. Indic. 2017, 79, 47–53. [Google Scholar] [CrossRef]
  2. Zhang, X.R.; Zhou, J.; Li, G.N.; Chen, C.; Li, M.M.; Luo, J.M. Spatial Pattern Reconstruction of Regional Habitat Quality Based on the Simulation of Land Use Changes from 1975 to 2010. J. Geogr. Sci. 2020, 30, 601–620. [Google Scholar] [CrossRef]
  3. Xie, B.; Zhang, M.M. Spatio-Temporal Evolution and Driving Forces of Habitat Quality in Guizhou Province. Sci. Rep. 2023, 13, 8278. [Google Scholar] [CrossRef]
  4. Bongaarts, J. Summary for Policymakers of the Global Assessment Report on Biodiversity and Ecosystem Services of the Intergovernmental Science-Policy Platform on Biodiversity and Ecosystem Services. Popul. Dev. Rev. 2019, 45, 680–681. [Google Scholar] [CrossRef]
  5. Pereira, P. Ecosystem Services in a Changing Environment. Sci. Total Environ. 2020, 702, 135008. [Google Scholar] [CrossRef]
  6. Dai, X.A.; Gao, Y.; He, X.W.; Liu, T.; Jiang, B.H.; Shao, H.Y.; Yao, Y.Z. Spatial-Temporal Pattern Evolution and Driving Force Analysis of Ecological Environment Vulnerability in Panzhihua City. Environ. Sci. Pollut. R 2021, 28, 7151–7166. [Google Scholar] [CrossRef] [PubMed]
  7. Janus, J.; Bozek, P. Land Abandonment in Poland after the Collapse of Socialism: Over a Quarter of a Century of Increasing Tree Cover on Agricultural Land. Ecol. Eng. 2019, 138, 106–117. [Google Scholar] [CrossRef]
  8. Huang, J.L.; Tang, Z.; Liu, D.F.; He, J.H. Ecological Response to Urban Development in a Changing Socio-Economic and Climate Context: Policy Implications for Balancing Regional Development and Habitat Conservation. Land. Use Policy 2020, 97, 104772. [Google Scholar] [CrossRef]
  9. Guo, X.Y.; Zhang, Y.X.; Guo, D.F.; Lu, W.T.; Xu, H. How Does Ecological Protection Redline Policy Affect Regional Land Use and Ecosystem Services? Environ. Impact Asses. 2023, 100, 107062. [Google Scholar] [CrossRef]
  10. Fang, Z.; Ding, T.H.; Chen, J.Y.; Xue, S.; Zhou, Q.; Wang, Y.D.; Wang, Y.X.; Huang, Z.D.; Yang, S.L. Impacts of Land Use/Land Cover Changes on Ecosystem Services in Ecologically Fragile Regions. Sci. Total Environ. 2022, 831, 154967. [Google Scholar] [CrossRef]
  11. Eitelberg, D.A.; van Vliet, J.; Doelrnan, J.C.; Stehfest, E.; Verburg, P.H. Demand for Biodiversity Protection and Carbon Storage as Drivers of Global Land Change Scenarios. Glob. Environ. Chang. 2016, 40, 101–111. [Google Scholar] [CrossRef]
  12. Wei, Q.Q.; Abudureheman, M.; Halike, A.; Yao, K.X.; Yao, L.; Tang, H.; Tuheti, B. Temporal and Spatial Variation Analysis of Habitat Quality on the Plus-Invest Model for Ebinur Lake Basin, China. Ecol. Indic. 2022, 145, 109632. [Google Scholar] [CrossRef]
  13. Wu, Y.F.; Wang, J.B.; Gou, A.P. Research on the Evolution Characteristics, Driving Mechanisms and Multi-Scenario Simulation of Habitat Quality in the Guangdong-Hong Kong-Macao Greater Bay Based on Multi-Model Coupling. Sci. Total Environ. 2024, 924, 171263. [Google Scholar] [CrossRef] [PubMed]
  14. Li, Z.; Jiang, W.G.; Peng, K.F.; Wang, X.Y.; Deng, Y.W.; Yin, X.G.; Ling, Z.Y. Comparative Analysis of Land Use Change Prediction Models for Land and Fine Wetland Types: Taking the Wetland Cities Changshu and Haikou as Examples. Landsc. Urban. Plan 2024, 243, 104975. [Google Scholar] [CrossRef]
  15. Li, X.; Liu, Z.S.; Li, S.J.; Li, Y.X. Multi-Scenario Simulation Analysis of Land Use Impacts on Habitat Quality in Tianjin Based on the Plus Model Coupled with the Invest Model. Sustainability 2022, 14, 6923. [Google Scholar] [CrossRef]
  16. Huang, C.; Zhou, Y.; Wu, T.; Zhang, M.Y.; Qiu, Y. A Cellular Automata Model Coupled with Partitioning Cnn-Lstm and Plus Models for Urban Land Change Simulation. J. Environ. Manage. 2024, 351, 119828. [Google Scholar] [CrossRef]
  17. Jiao, M.Y.; Hu, M.M.; Xia, B.C. Spatiotemporal Dynamic Simulation of Land-Use and Landscape-Pattern in the Pearl River Delta, China. Sustain. Cities Soc. 2019, 49, 101581. [Google Scholar] [CrossRef]
  18. Liang, X.; Guan, Q.F.; Clarke, K.C.; Liu, S.S.; Wang, B.Y.; Yao, Y. Understanding the Drivers of Sustainable Land Expansion Using a Patch-Generating Land Use Simulation (Plus) Model: A Case Study in Wuhan, China. Comput. Environ. Urban 2021, 85, 101569. [Google Scholar] [CrossRef]
  19. Gao, L.A.; Tao, F.; Liu, R.R.; Wang, Z.L.; Leng, H.J.; Zhou, T. Multi-Scenario Simulation and Ecological Risk Analysis of Land Use Based on the Plus Model: A Case Study of Nanjing. Sustain. Cities Soc. 2022, 85, 104055. [Google Scholar] [CrossRef]
  20. Wang, J.; Zhang, J.P.; Xiong, N.N.; Liang, B.Y.; Wang, Z.; Cressey, E.L. Spatial and Temporal Variation, Simulation and Prediction of Land Use in Ecological Conservation Area of Western Beijing. Remote Sens. 2022, 14, 1452. [Google Scholar] [CrossRef]
  21. Wang, Q.Z.; Guan, Q.Y.; Sun, Y.F.; Du, Q.Q.; Xiao, X.; Luo, H.P.; Zhang, J.; Mi, J.M. Simulation of Future Land Use/Cover Change (Lucc) in Typical Watersheds of Arid Regions under Multiple Scenarios. J. Environ. Manage. 2023, 335, 117543. [Google Scholar] [CrossRef] [PubMed]
  22. McKinney, M.L. Urbanization, Biodiversity, and Conservation. Bioscience 2002, 52, 883–890. [Google Scholar] [CrossRef]
  23. Feng, H.H.; Wang, S.; Zou, B.; Nie, Y.F.; Ye, S.C.; Ding, Y.; Zhu, S.J. Land Use and Cover Change (Lucc) Impacts on Earth?S Eco-Environments: Research Progress and Prospects. Adv. Space Res. 2023, 71, 1418–1435. [Google Scholar] [CrossRef]
  24. He, Y.Q.; Ai, B.; Yao, Y.; Zhong, F.J. Deriving Urban Dynamic Evolution Rules from Self-Adaptive Cellular Automata with Multi-Temporal Remote Sensing Images. Int. J. Appl. Earth Obs. 2015, 38, 164–174. [Google Scholar] [CrossRef]
  25. Wu, J.Y.; Luo, J.A.; Zhang, H.; Qin, S.; Yu, M.J. Projections of Land Use Change and Habitat Quality Assessment by Coupling Climate Change and Development Patterns. Sci. Total Environ. 2022, 847, 157491. [Google Scholar] [CrossRef]
  26. Zhou, L.; Dang, X.W.; Sun, Q.K.; Wang, S.H. Multi-Scenario Simulation of Urban Land Change in Shanghai by Random Forest and Ca-Markov Model. Sustain. Cities Soc. 2020, 55, 102045. [Google Scholar] [CrossRef]
  27. Ma, T.Q.; Liu, R.; Li, Z.; Ma, T.T. Research on the Evolution Characteristics and Dynamic Simulation of Habitat Quality in the Southwest Mountainous Urban Agglomeration from 1990 to 2030. Land 2023, 12, 1488. [Google Scholar] [CrossRef]
  28. Gomes, E.; Inacio, M.; Bogdzevic, K.; Kalinauskas, M.; Karnauskaite, D.; Pereira, P. Future Scenarios Impact on Land Use Change and Habitat Quality in Lithuania. Environ. Res. 2021, 197, 111101. [Google Scholar] [CrossRef] [PubMed]
  29. Lin, X.F.; Fu, H. Multi-Scenario Simulation Analysis of Cultivated Land Based on Plus Model—A Case Study of Haikou, China. Front. Ecol. Evol. 2023, 11, 1197419. [Google Scholar] [CrossRef]
  30. Costanza, R.; dArge, R.; deGroot, R.; Farber, S.; Grasso, M.; Hannon, B.; Limburg, K.; Naeem, S.; Oneill, R.V.; Paruelo, J.; et al. The Value of the World’s Ecosystem Services and Natural Capital. Nature 1997, 387, 253–260. [Google Scholar] [CrossRef]
  31. De Simone, S.; Sigura, M.; Boscutti, F. Patterns of Biodiversity and Habitat Sensitivity in Agricultural Landscapes. J. Environ. Plan. Man. 2017, 60, 1173–1192. [Google Scholar] [CrossRef]
  32. Kunwar, R.M.; Evans, A.; Mainali, J.; Ansari, A.S.; Rimal, B.; Bussmann, R.W. Change in Forest and Vegetation Cover Influencing Distribution and Uses of Plants in the Kailash Sacred Landscape, Nepal. Environ. Dev. Sustain. 2020, 22, 1397–1412. [Google Scholar] [CrossRef]
  33. Wu, L.L.; Sun, C.G.; Fan, F.L. Estimating the Characteristic Spatiotemporal Variation in Habitat Quality Using the Invest Model—A Case Study from Guangdong–Hong Kong–Macao Greater Bay Area. Remote Sens. 2021, 13, 1008. [Google Scholar] [CrossRef]
  34. Lei, J.R.; Chen, Y.Q.; Li, L.M.; Chen, Z.Z.; Chen, X.H.; Wu, T.T.; Li, Y.L. Spatiotemporal Change of Habitat Quality in Hainan Island of China Based on Changes in Land Use. Ecol. Indic. 2022, 145, 109707. [Google Scholar] [CrossRef]
  35. Qiao, X.N.; Gu, Y.Y.; Zou, C.X.; Xu, D.L.; Wang, L.; Ye, X.; Yang, Y.; Huang, X.F. Temporal Variation and Spatial Scale Dependency of the Trade-Offs and Synergies among Multiple Ecosystem Services in the Taihu Lake Basin of China. Sci. Total Environ. 2019, 651, 218–229. [Google Scholar] [CrossRef]
  36. Li, G.Y.; Li, L.Z.; Kong, M. Multiple-Scale Analysis of Water Quality Variations and Their Correlation with Land Use in Highly Urbanized Taihu Basin, China. B Environ. Contam. Tox. 2021, 106, 218–224. [Google Scholar] [CrossRef]
  37. Wan, R.R.; Yang, G.S. Changes of Land Use and Landscape Pattern in Taihu Lake Basin. J. Appl. Ecol. 2005, 16, 475–480. (In Chinese) [Google Scholar]
  38. Xu, L.T.; Chen, S.S.; Xu, Y.; Li, G.Y.; Su, W.Z. Impacts of Land-Use Change on Habitat Quality During 1985–2015 in the Taihu Lake Basin. Sustainability 2019, 13, 3513. [Google Scholar] [CrossRef]
  39. Li, X.; Fu, J.Y.; Jiang, D.; Lin, G.; Cao, C.L. Land use optimization in Ningbo City with a coupled GA and PLUS model. J. Clean. Prod. 2022, 375, 134004. [Google Scholar] [CrossRef]
  40. Guo, P.F.; Wang, H.Y.; Qin, F.; Miao, C.H.; Zhang, F.F. Coupled Mop and Plus-Sa Model Research on Land Use Scenario Simulations in Zhengzhou Metropolitan Area, Central China. Remote Sens. 2023, 15, 3762. [Google Scholar] [CrossRef]
  41. Xu, W.J.; Song, J.X.; Long, Y.Q.; Mao, R.C.; Tang, B.; Li, B.J. Analysis and Simulation of the Driving Mechanism and Ecological Effects of Land Cover Change in the Weihe River Basin, China. J. Environ. Manage. 2023, 344, 118320. [Google Scholar] [CrossRef] [PubMed]
  42. Nie, W.B.; Xu, B.; Yang, F.; Shi, Y.; Liu, B.T.; Wu, R.W.; Lin, W.; Pei, H.; Bao, Z.Y. Simulating Future Land Use by Coupling Ecological Security Patterns and Multiple Scenarios. Sci. Total Environ. 2023, 859, 160262. [Google Scholar] [CrossRef] [PubMed]
  43. Ji, X.L.; Sun, Y.L.; Guo, W.; Zhao, C.W.; Li, K. Land Use and Habitat Quality Change in the Yellow River Basin: A Perspective with Different Cmip6-Based Scenarios and Multiple Scales. J. Environ. Manage. 2023, 345, 118729. [Google Scholar] [CrossRef] [PubMed]
  44. Mao, W.L.; Lu, D.B.; Hou, L.; Liu, X.; Yue, W.Z. Comparison of Machine-Learning Methods for Urban Land-Use Mapping in Hangzhou City, China. Remote Sens. 2020, 12, 2817. [Google Scholar] [CrossRef]
  45. Yang, Y.Y. Evolution of Habitat Quality and Association with Land-Use Changes in Mountainous Areas: A Case Study of the Taihang Mountains in Hebei Province, China. Ecol. Indic. 2021, 129, 107967. [Google Scholar] [CrossRef]
  46. Tian, L.; Tao, Y.; Fu, W.X.; Li, T.; Ren, F.; Li, M.Y. Dynamic Simulation of Land Use/Cover Change and Assessment of Forest Ecosystem Carbon Storage under Climate Change Scenarios in Guangdong Province, China. Remote Sens. 2022, 14, 2330. [Google Scholar] [CrossRef]
  47. Birhanu, A.; Adgo, E.; Frankl, A.; Walraevens, K.; Nyssen, J. Modelling Spatial Relationships between Land Cover Change and Its Drivers in the Afro-Alpine Belt of Mount Guna (Ethiopia). Land. Degrad. Dev. 2021, 32, 3946–3961. [Google Scholar] [CrossRef]
  48. Huang, X.X.; Wang, H.J.; Xiao, F.T. Simulating Urban Growth Affected by National and Regional Land Use Policies: Case Study from Wuhan, China. Land. Use Policy. 2022, 112, 105850. [Google Scholar] [CrossRef]
  49. Hu, J.Y.; Zhang, J.X.; Li, Y.Q. Exploring the Spatial and Temporal Driving Mechanisms of Landscape Patterns on Habitat Quality in a City Undergoing Rapid Urbanization Based on Gtwr and Mgwr: The Case of Nanjing, China. Ecol. Indic. 2022, 143, 109333. [Google Scholar] [CrossRef]
  50. Li, W.; Geng, J.W.; Bao, J.L.; Lin, W.X.; Wu, Z.Y.; Fan, S.S. Spatial and Temporal Evolution Patterns of Habitat Quality under Tea Plantation Expansion and Multi-Scenario Simulation Study: Anxi County as an Example. Land 2023, 12, 1308. [Google Scholar] [CrossRef]
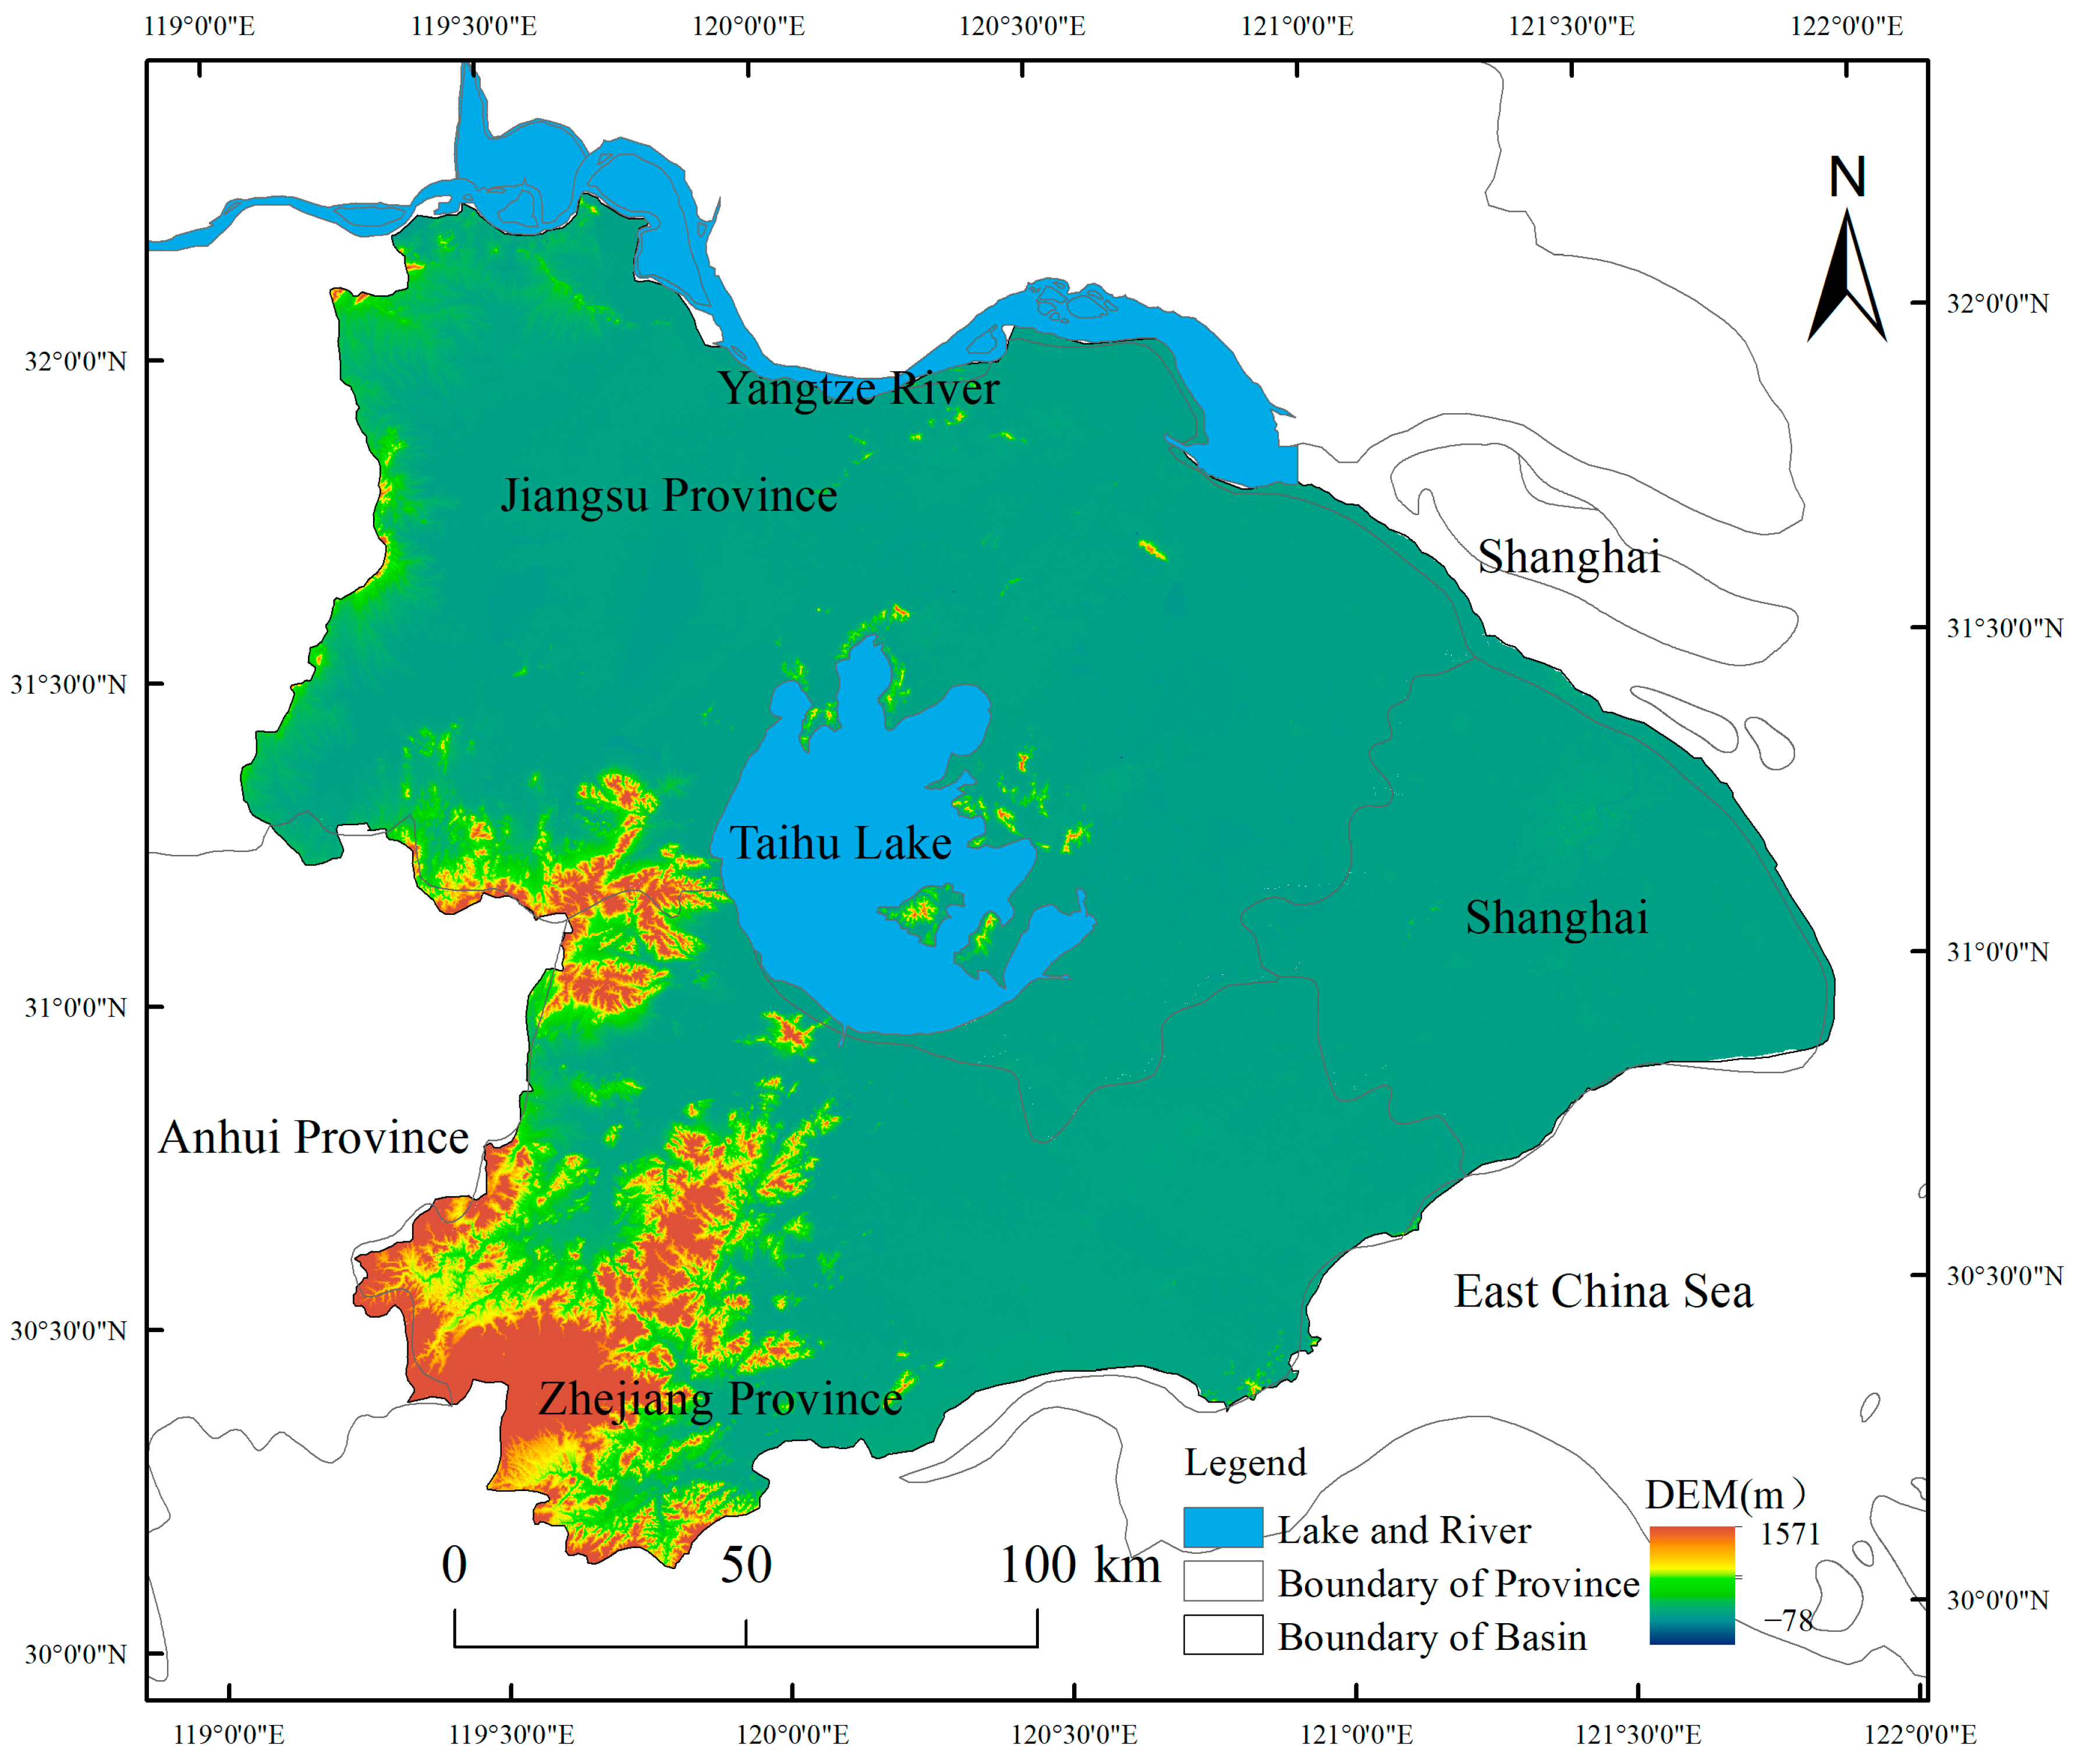
Figure 1. Location of the TLB in China.
Sustainability 16 07793 g001
Figure 2. Research framework diagram.
Sustainability 16 07793 g002
Figure 3. Land use types in (a) 2000, (b) 2010, and (c) 2020.
Sustainability 16 07793 g003
Figure 4. Three-phase land use transfer Sankey diagram.
Sustainability 16 07793 g004
Figure 5. Prediction of land use type in Taihu Basin under (a) BAU (business as usual), (b) UDP (priority given to urban development), (c) EPP (priority given to ecological protection), and (d) BUE (balanced urban development and ecological protection) scenarios in 2030.
Sustainability 16 07793 g005
Figure 6. Changes in habitat quality pattern: (a) 2000 habitat quality; (b) 2010 habitat quality; (c) 2020 habitat quality.
Sustainability 16 07793 g006
Figure 7. Spatial distribution of habitat quality levels in the TLB under separate future scenarios.
Sustainability 16 07793 g007
Figure 8. The importance of the contribution of each factor to the growth of six land use types. X1: DEM; X2: GDP; X3: distance to the road; X4: population; X5: precipitation; X6: distance to the railway; X7: distance to the river; X8: slope; X9: soil type; X10: temperature; X11: distance to the town.
Sustainability 16 07793 g008
Figure 9. Spatial distribution of driving factors affecting land use.
Sustainability 16 07793 g009
Table 1. Data used in this study.
CategoryDataFormSource
Land useLand useGrid (100 m)Resource and Environment Science and Data Center
Meteorological factorsPrecipitationGrid (100 m)Resource and Environment Science and Data Center
TemperatureGrid (100 m)
Terrain factorsElevationGrid (100 m)Geospatial Data Cloud (http://www.gscloud.cn)
SlopeGrid (100 m)
Road and river networksDistance to townGrid (100 m)National catalog service for geographic information (http://www.webmap.cn)
Distance to riverGrid (100 m)
Distance to roadGrid (100 m)
Distance to railwayGrid (100 m)
Socio-economic factorsPopulation densityGrid (100 m)Resource and Environment Science and Data Center
GDPGrid (100 m)
Environmental factorsSoil typeGrid (100 m)Harmonized World Soil Database (http://www.ncdc.ac.cn/)
Basic geospatial
data
Administrative boundariesVectorResource and Environment Science and Data Center
Table 2. Threat factor parameter.
ThreatMax Distance (km)WeightDecay
Cultivated land20.6Linear
Construction land80.7Exponential
Unused land10.5Linear
Table 3. Threat factor sensitivity.
Land CoverHabitat SuitabilityCultivated LandConstruction LandUnused Land
No data0000
Cultivated land0.400.80.4
Forestland10.70.70.2
Grassland0.90.60.50.3
Water10.50.60.2
Construction land0000
Unused land0.50.40.4 0
Table 4. Land use type and area in 2000–2020.
Land Use Type2000
Area (km2)
2010
Area (km2)
2020
Area (km2)
Cultivated land21,637.7417,723.3016,359.31
Forestland4906.424842.624808.74
Grassland160.65153.45211.36
Water4739.645103.175015.34
Construction land5138.718718.4610,155.46
Unused land12.7756.3453.24
Table 5. The area of each land use type under different scenarios in TLB in 2030 is simulated by the PLUS model. BAU (business as usual); UDP (urban development priority); EPP (Priority of ecological protection); BUE (balanced urban development and ecological protection).
Land Use TypeBAU
Area (km2)
UDP
Area (km2)
EPP
Area (km2)
BUE
Area (km2)
Cultivated land15,309.4614,852.9615,862.0415,493.25
Forestland4771.374741.664818.024780.78
Grassland257.37250.29207.29181.76
Water4929.344869.525056.705026.56
Construction land11,285.0311,839.4310,606.8511,066.10
Unused land50.8849.5952.2549.90
Table 6. Areas of different levels of habitat quality under the three scenarios from 2000 to 2020.
Level2000
Area (km2)
2010
Area (km2)
2020
Area (km2)
0–0.25138.718718.4610,155.46
0.2–0.421,636.8417,722.4716,358.53
0.4–0.6487.65621.65634.04
0.6–0.84436.964766.704796.04
0.8–14895.774768.064659.38
Mean of habitat quality0.41850.38650.3715
Standard deviation0.27470.30180.3095
Table 7. Areas of different levels of habitat quality under the four scenarios.
LevelBAU
Area (km2)
UDP
Area (km2)
EPP
Area (km2)
BUE
Area (km2)
0–0.211,285.0311,839.4310,606.8511,066.10
0.2–0.415,308.6814,852.1815,861.2815,497.57
0.4–0.6481.47485.26482.88481.19
0.6–0.84767.754676.974834.954760.49
0.8–14760.524749.614817.494798.10
Mean of habitat quality0.36270.35640.37070.3654
Standard deviation0.31710.31940.31440.3164
Disclaimer/Publisher’s Note: The statements, opinions and data contained in all publications are solely those of the individual author(s) and contributor(s) and not of MDPI and/or the editor(s). MDPI and/or the editor(s) disclaim responsibility for any injury to people or property resulting from any ideas, methods, instructions or products referred to in the content.