Article

Environmental Life Cycle Assessment of Innovative Ejectors Plant Technology for Sediment by-Pass in Harbours and Ports

by
Marco Pellegrini
1,2,*,
Cesare Saccani
1 and
Alessandro Guzzini
1,2
1
Department of Industrial Engineering, University of Bologna, 40126 Bologna, Italy
2
Interdepartmental Centre for Industrial Research in Renewable Resources, Environment, Sea and Energy, University of Bologna, 48123 Ravenna, Italy
*
Author to whom correspondence should be addressed.
Sustainability 2024, 16(17), 7809; https://doi.org/10.3390/su16177809
Submission received: 13 June 2024 / Revised: 31 August 2024 / Accepted: 5 September 2024 / Published: 7 September 2024
(This article belongs to the Section Resources and Sustainable Utilization)

Abstract

:
Sedimentation is the natural process of sediment transportation and deposition in quiescent water conditions. Sedimentation can affect the functionality of ports, harbours and navigation channels by reducing water depth, making navigation difficult, if not impossible. Different solutions are available to guarantee infrastructure functionality against sedimentation, with maintenance dredging being the most widely adopted. Alternative technologies for dredging have been developed and tested to reduce the environmental concerns related to dredging operations. Among other solutions, applying a sediment by-pass system based on a jet pump emerged as one of the most promising. While the existing literature covers the techno-economic aspects of sediment by-pass systems, the environmental impacts must be better evaluated and assessed. This paper aims to resolve this gap by evaluating, through the ReCiPe2016 life cycle assessment (LCA) methodology, the environmental impact of an innovative sediment by-pass system called an “ejectors plant”. The LCA results are based on the demonstrator established in Cervia Harbour in Italy, which was extensively monitored for 15 months during its operation. This paper shows how energy consumption during the operation phase highly affects the considered midpoint and endpoint categories. For example, the GWP100 of the ejectors plant, considering the Italian electricity mix, equals 1.75 million tons of equivalent CO2 over 20 years, while under a low-carbon scenario, it is reduced to 0.17. In that case, material consumption in the construction phase becomes dominant, thus highlighting the importance of eco-innovation of ejectors plants to minimise oxidant formation. Finally, this paper compares the ejectors plant and traditional dredging through environmental LCA. The ejectors plant had a lower impact in all categories except for GWP-related categories. The sensitivity analysis showed how such a conclusion may be mitigated by considering different electricity mixes and maintenance dredging working cycles.

1. Introduction

In recent years, interest in the environmental aspects of the shipping industry has increased, leading to changes in business management agendas [1]. Shipping industry supply chain management involves several actors, such as freight transport operators, shipping companies, port authorities and terminals, and some have started adopting green practices in their logistics operations to improve economic and social performance while at the same time respecting environmental sustainability [2,3]. Port companies must disclose environmental, social and governance policies to increase performance [4]. Therefore, in the context of global competition, these business activities allow the development of so-called “green ports” [5]. Ports and harbours are at the heart of industrial and recreational activities related to the shipping industry [6], and their commitment to reaching higher sustainability targets involves several actors that are part of the complex port ecosystem and beyond [7,8].
Sediment management in ports and harbours is critical to marine and river infrastructures. Since the earliest settlements along coasts and rivers were established, removing deposited material from basins has been a standard feature shared by many ports and harbours [9]. Waves, tides and density gradients usually generate sedimentation, thus obstructing waterways. Sedimentation characteristics depend on the intensity of water currents that carry large amounts of sediment released due to their interaction with human infrastructures and to the energy of their movement [10]. Longshore sediment transport can also be responsible for almost continuous sediment movement in suspension or bedload flows [11]. Furthermore, the construction of jetties has been repeatedly demonstrated to cause significant erosion in the downdrift area, with relevant consequences to economic activities related to beach services [12]. Sediment management impacts several topics related to the strategy development of green ports, like water and air pollution, and waste management [13]. Moreover, sedimentation threatens navigation safety and reduces infrastructure accessibility, negatively impacting economic activities like fishing, recreational boating and maritime transport [14]. The most widely used solution to remove sediment deposits is dredging, which is a well-known, reliable and widespread technology [15]. Nevertheless, dredging has some limitations. For example, in shallow water (i.e., smaller marinas and channels), dredging may require scaled technologies that are less productive and more expensive than standard configurations. Moreover, dredging does not impact the sedimentation source, so it cannot guarantee the prevention of sedimentation over time. Furthermore, dredging operations usually interfere with other nautical activities and often involve the prohibition of navigation. The research into alternative technologies to dredging was thus initially driven by techno-economic factors. Additionally, dredging has a considerable environmental impact on the ecosystem [16]. Sediments are an essential habitat for flora and fauna [17], and dredging operations can destroy or significantly modify that habitat. Dredging can disturb contaminants already present in the seabed [18], thus increasing the suspended solid concentration (SSC) in the water column with adverse effects on the ecosystem. The results of sediment disturbance are not only recognised in the short term—they can also have relevant impacts on the long-term ecological footprint, i.e., by affecting the bioaccumulation of chemicals [19]. Dredging operation also results in greenhouse gas (GHG) and air and water pollutant emissions generated by the large fossil-fuelled engines currently used to move and feed dredging equipment [20]. Moreover, dredging can impact underwater noise, thus further interfering with the water body’s natural ecosystem. Finally, dredged sediment disposal may be relevant due to more restrictive international legislation [21,22], moving from sea disposal to landfilling. As a result, dredging operations are often becoming too expensive or are not allowed by regulations.
An option to reduce the environmental impacts of sediment management through dredging is to redesign and adapt dredging equipment and operations to increase their sustainability. An example might be the use of electric motors or e-fuels instead of fossil-fuelled engines to power dredging equipment [23,24] or a circular approach in sediment management in which dredging is combined and integrated with nature-based solutions [25], aiming to make the best use of sediment as a precious resource for the whole ecosystem. On the other hand, some drawbacks of dredging remain, even if electrification and circularity approaches are used for the equipment and dredging process redesign. For this reason, new techniques have been developed over the years as alternative methods to dredging. A vast body of literature exists about innovative solutions to limit or solve sedimentation. In [26], a comparison is made by considering previously published studies to assess the sustainability and the environmental impact of different alternative technologies to dredging, including anti-sedimentation structures [27], remobilising sediment plants (like water injection dredging [28]) and sediment by-pass plants [29].
The comparison by [26] shows that dredging has higher costs and environmental impacts, while fixed sediment by-pass plants are characterised by the lowest environmental impact and operation costs that are competitive with dredging. Nevertheless, a limitation of that study is that the environmental assessment was made only through a qualitative evaluation. In [30], the techno-economic sustainability of the so-called “ejectors plant” technology is analysed. The ejectors plant core element is the ejector, an open-jet pump with a converging discharge section, and it is designed to operate a sediment by-pass for human infrastructures interfering with natural sediment transport [31]. Ejectors plants have been tested in a pilot configuration in the harbours of Riccione (2005–2007) and Portoverde (2012–2014), while demonstrators have been established in the harbours of Cervia (2019–2020) and Cattolica (2018, and is still in operation). All the installations mentioned above were in Italy. In particular, [30] compared the operation and maintenance costs of the Cervia ejectors plant with the yearly average cost of maintenance dredging and found that the annual savings for the municipality, due to the ejectors plant operation, could range from EUR 55,000 to 105,000 depending on the energy consumption assumption. In [31], the authors analysed ecological parameters like sediment characteristics, and benthic and fish assemblages in the area of ejectors plant operation in Cervia to evaluate the short-term ecological impact of the ejectors plant. The parameters were assessed in the impacted regions, i.e., the area from which sediment was removed and the area in which sediment was discharged, and in four control locations. Samples were taken and analysed once before and twice after the ejectors plant activation. Ejectors plant operation reduced the organic fraction and mud in the sediment. Changes in shell debris amount in the impacted areas were also observed. While the abundance and species richness of benthic macroinvertebrates in the impacted regions were lower if compared with the four control locations, they returned to the expected values after the ejectors plant continuous operation phase. The impacted regions were located in the harbour entrance, which was the area where maintenance dredging was often performed. On the other hand, the control locations were placed far away from the harbour entrance, thus, they were not directly affected by maintenance dredging operations. Consequently, the cause of the lower ecological parameters detected in the impacted regions could be traced back to the harmful effects of maintenance dredging. Moreover, the diversity of fish fauna increased in the impacted regions during the operation period. Long-term ecological impacts were not measured or assessed due to the demonstrator’s relatively short operating time. Therefore, while it was somewhat confirmed by on-field measurement that sediment by-pass systems can be cost-competitive while reducing the short-term ecological impact of sediment management in comparison with traditional dredging, poor information is available regarding other environmental concerns, like GHG and pollutant emissions.
This paper aims to address this research gap by investigating the environmental effect of the ejectors plant technology through the life cycle assessment (LCA) method, thus allowing for a quantitative estimation of the impacts of ejectors plant manufacturing and operation on climate change, terrestrial acidification, fine particulate matter formation and photochemical ozone formation. The results of the LCA will support ejectors plant designers and managers, and will be used as effective feedback on the system’s environmental performance. Moreover, based on the results of this study, it will be possible to evaluate technological improvements and adopt better solutions to reduce environmental impacts. The assessment includes a comparison with dredging equipment.

2. Materials and Methods

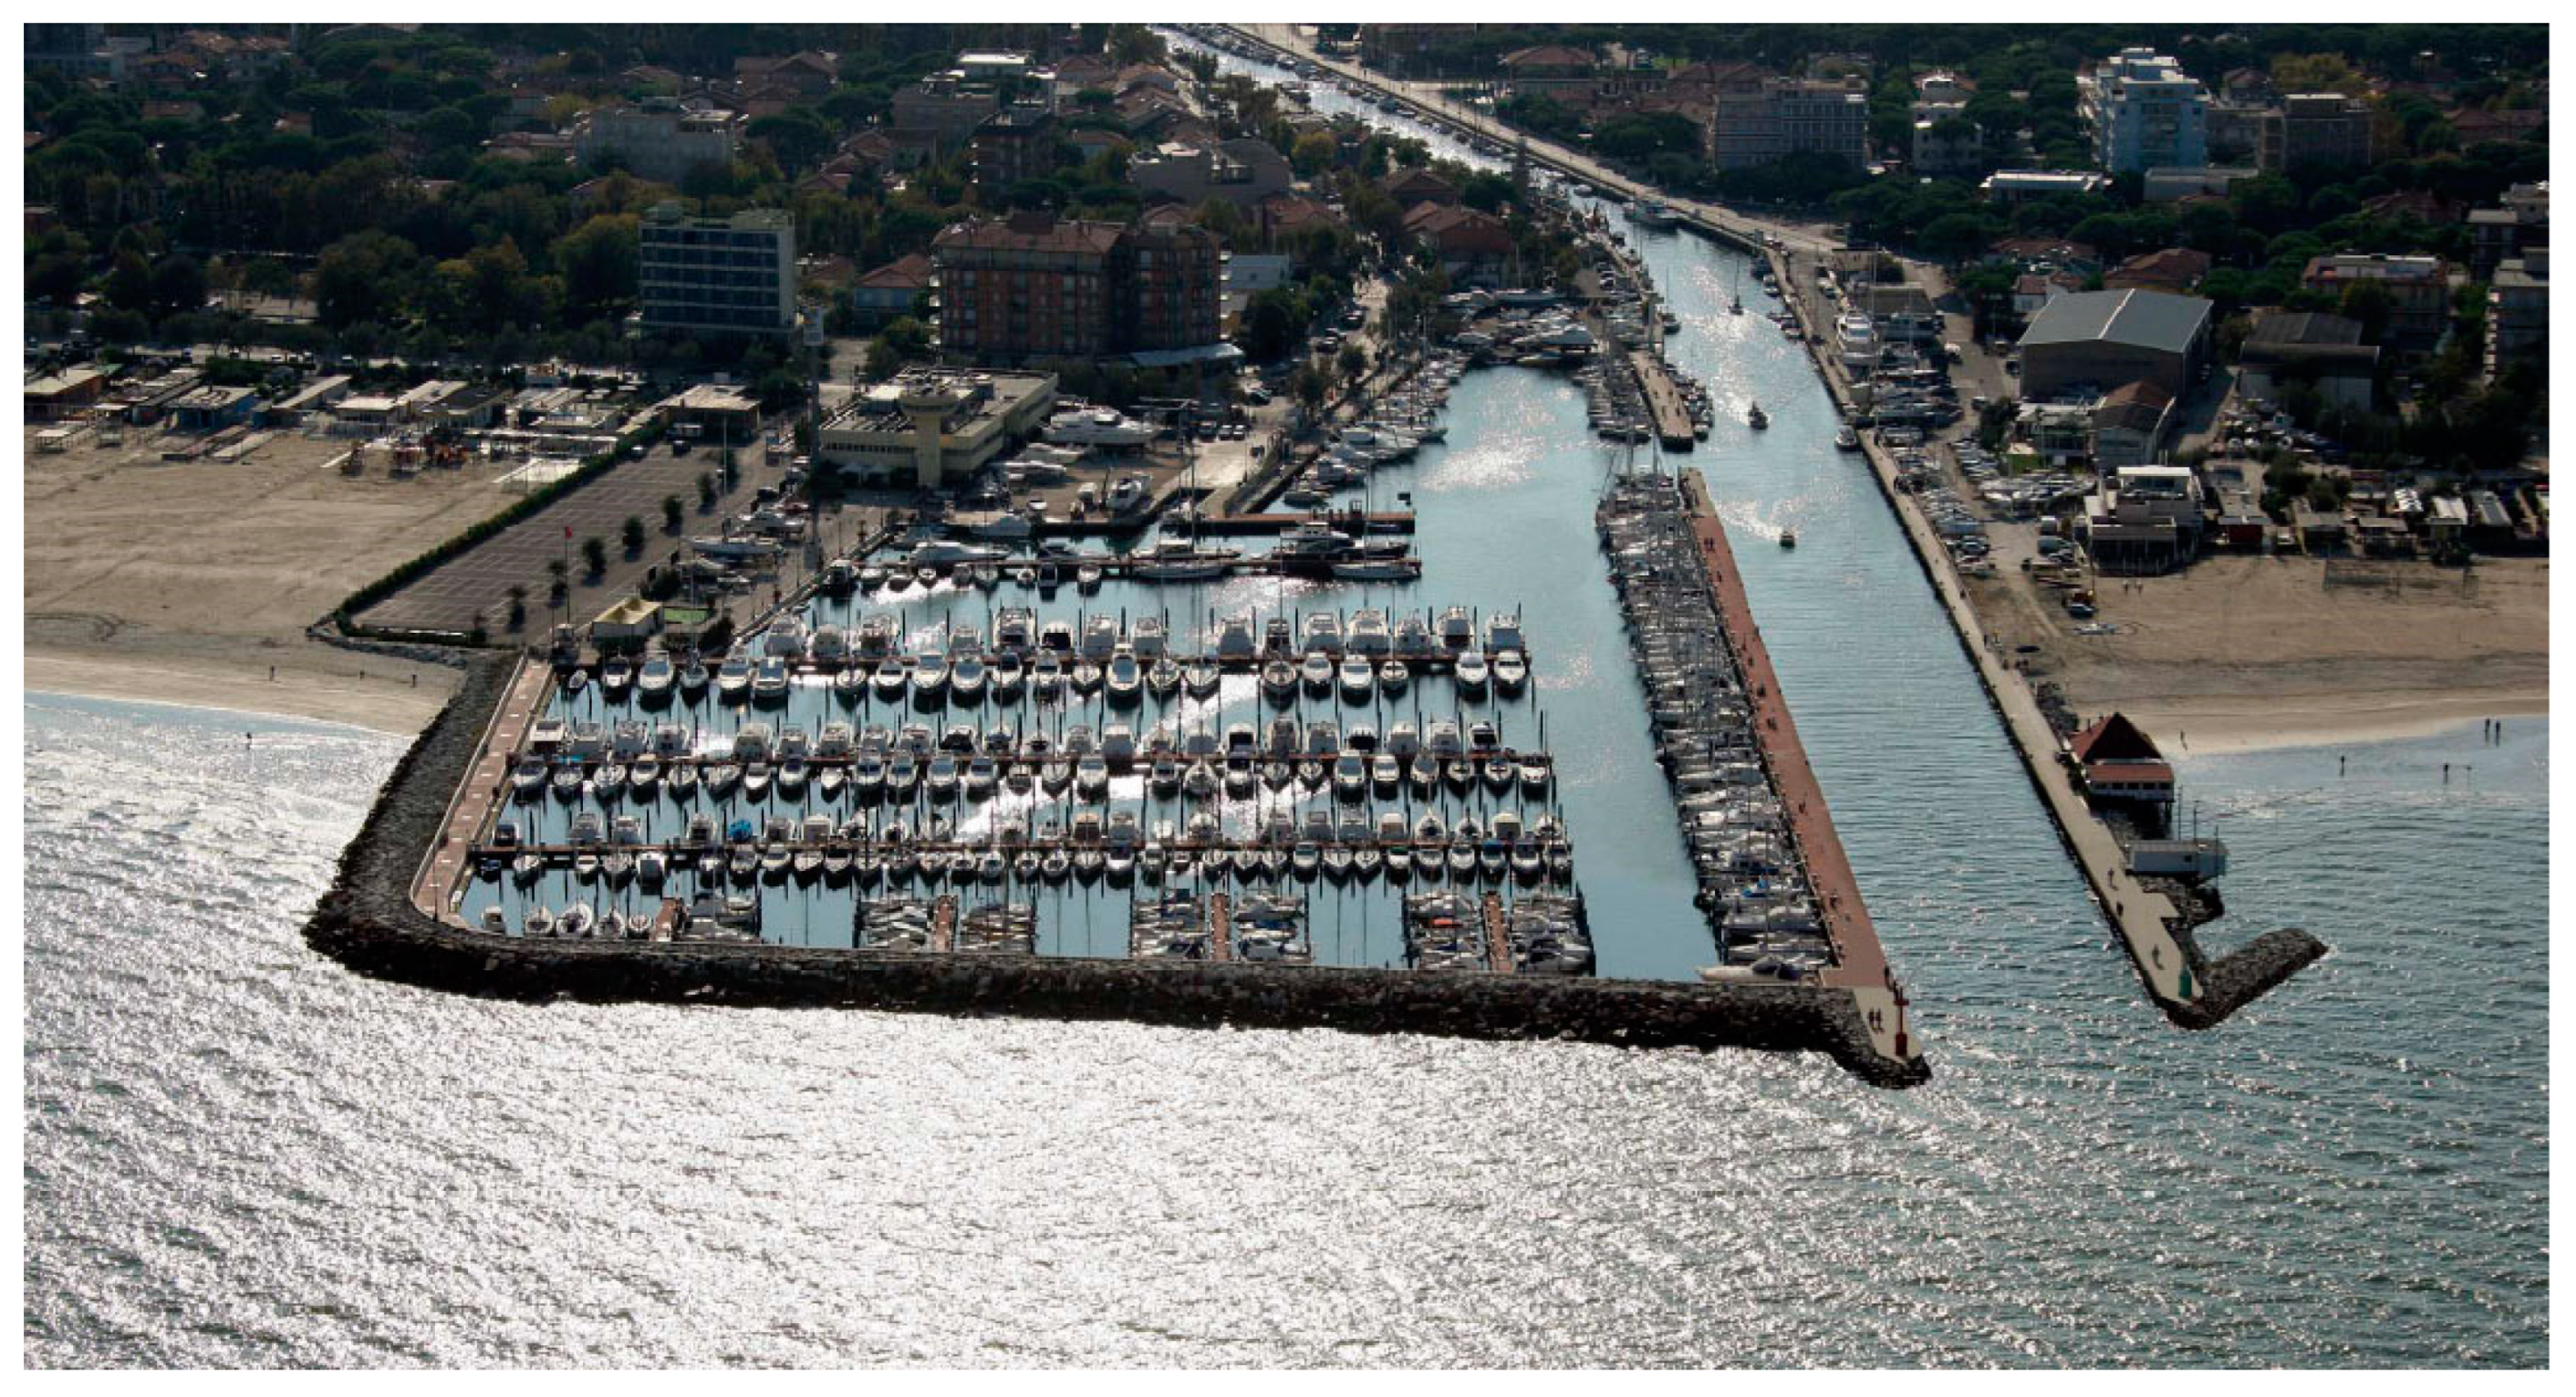
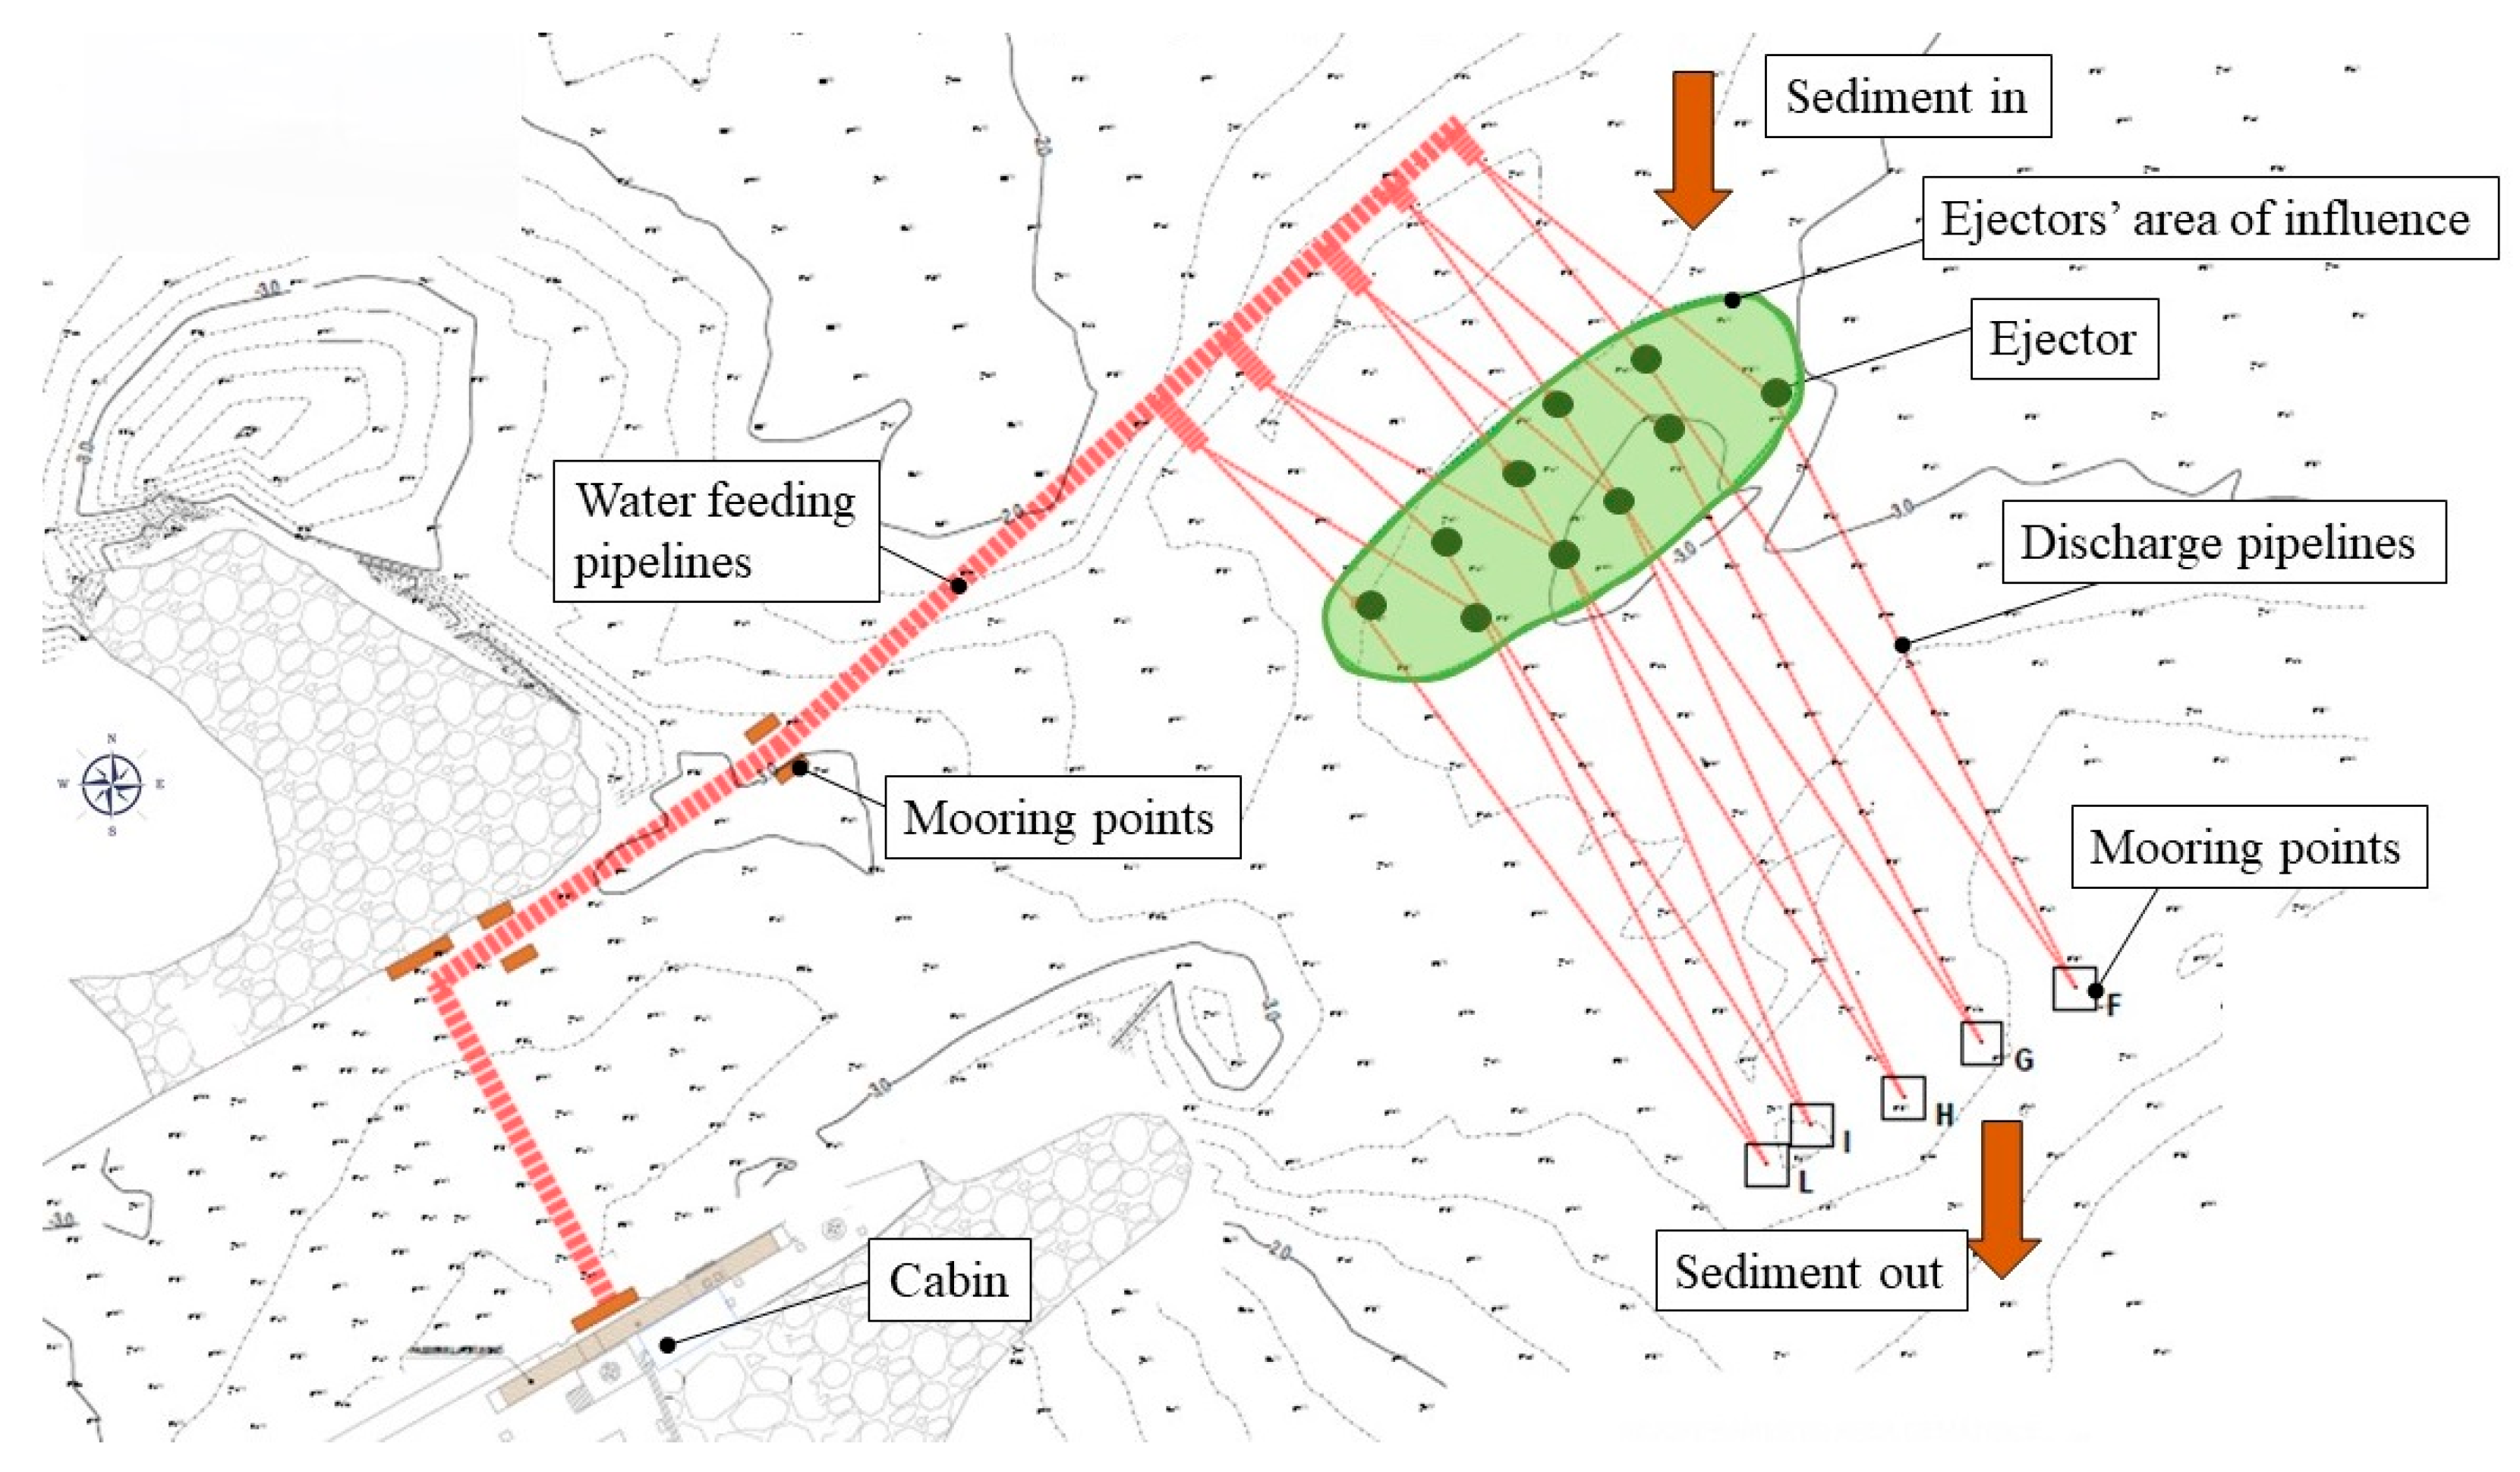
2.1. Ejectors Plant Demonstrator Description

The reference ejectors plant analysed for the scope of this paper is the demonstrator installed in Cervia Harbour (Italy) in 2019 and operated for 15 months. Cervia is a small municipality (30,000 inhabitants) situated on the northwestern Adriatic coast. The harbour covers 43,000 m2 and has a capacity of around 300 berths (Figure 1), with sandy beaches extending northwards and southwards.
From the annual longshore sediment transport view, Cervia can be seen as a convergence point. The exact location of this convergence may change over time due to the yearly wave climate. This sediment transport dynamic results in opposed longshore currents from the north and south of Cervia, which tend to meet and accumulate sediments in the entrance area of Cervia’s harbour. Sediment transport and coastal changes are mainly driven by sea storm events, primarily generated by northeasterly winds (or bora). However, southeasterly winds (or sirocco) may also exert relevant seasonal impacts.
The Cervia demonstrator consists of 10 ejectors. The ten ejectors are installed at the harbour entrance waterbed. The ejector (Figure 2) can be defined as an open-jet pump (i.e., without a closed suction chamber and mixing throat) with a converging section instead of a diffuser and a series of nozzles positioned circularly around the ejector [32]. The ejector’s diameter is about 250 mm, while the ejector’s length is about 400 mm. Each ejector influences sediment dynamics in a specific circular area created by the pressurised water outgoing from the central and circular nozzles. The ejector transfers momentum from a high-speed primary water jet flow to a secondary flow of water and surrounding sediment [32]. At the ejector outlet, the momentum is transformed into dynamic pressure, which can convey the sediment–water mixture through pipelines.
Figure 3 shows the layout of the Cervia demonstrator [32,33]. The pipelines (red lines in Figure 3) and ejectors (black dots in Figure 3) are installed on the seabed. Several mooring points guarantee stability on the seabed of the water feeding and discharge pipelines. The ejectors are located at the harbour entrance and operate on a central area of influence (qualitatively reported in green in Figure 3). The sediment–water mixture is taken from the influence area, transported and discharged south of the Cervia Harbour entrance channel. The discharge area was selected so that the sediment released there could be picked up again from the natural water current. The water feeding and discharge pipelines were DN80 spiral tubes with an external diameter of about 90 mm. The Cervia demonstrator included a technical cabin (Figure 4) with a fully automated and remotely accessible pumping station and auto-purging filters. The total installed power was about 80 kW. Plant operation can be related to sea weather conditions due to a local measure of wind speed and direction and a video camera. The water flow rate feeding the ejectors can be adjusted to the wind speed and direction to guarantee that the ejectors have sufficient sediment suction and conveying capacity. A complete description of the demonstrator is available in [30,32,33].

2.2. LCA Methodology

2.2.1. Goal and Scope Definition

This paper aims to analyse the environmental impacts of the novel ejectors plant technology. Therefore, the functional unit of the analysis is the ejectors plant demonstrator in Cervia described in Section 2.1. All input of energy and materials, as well as the emissions of GHGs and pollutants, are defined based on this functional unit. The LCA method in this study is carried out in strict accordance with the requirements of the International Standards Organisation (ISO) 14040 [34] and 14044 [35].
According to the existing literature, about 93–94% of GHG and pollutant emissions in pumping stations directly result from energy consumption during plant operation [36]. In [35], the exclusion of life-cycle stages or unit processes shown to have no significance and the exclusion of inputs and outputs which were not significant to the results of the study was allowed. Therefore, considering only plant operation would be enough for the scope of the present study. Nevertheless, excluding all life-cycle stages, except for the operation stage, would result in misleading results, especially in applications where the electricity mix has a high rate of renewables and low GHG and pollutant emission factors. To address this gap, since some specific components of the ejectors plant are characterised by relatively high emissions related to raw material processing, the impacts connected with raw materials processing have been considered as a life-cycle stage for all the components. Including raw materials processing allows for evaluating the effect of non-operation stages in the LCA, significantly when the impact of energy consumption is reduced. Future studies will explore the effect of optimised ejectors plant design and manufacturing on the environmental LCA, including the supply chain. Therefore, due to this study’s goal, the choice of system boundaries considered only emissions related to raw materials processing and plant operation phases. The other stages of plant construction (component manufacturing, transport and assembly) and the decommissioning phase are not included. The exclusion of the decommissioning phase was decided since the inclusion of this stage in the LCA would have required setting additional assumptions and using further secondary sources of information that would increase the uncertainty of the LCA. Figure 5 provides a schematic representation of the system boundaries considered.

2.2.2. Life Cycle Inventory

Life cycle inventory (LCI) is the methodology step that involves creating an inventory of input and output flows for a product system. Such flows include water, energy and raw material inputs and outputs to air, land and water. The inventory can be based on analysis of the literature or process simulation [37].
Information about energy and materials consumption during the construction and operation phases of the ejectors plant construction and operation phases was obtained from different sources. The energy consumption of the Cervia demonstrator was deeply analysed in [30]. The average yearly energy consumption is 252,000 kWh. The demonstrator’s bill of materials (BOM) was used as a primary source to identify each component’s number and characteristics (i.e., material composition). The BOM cannot be included in this paper for confidentiality reasons. Nevertheless, Figure 6 shows a simplified piping and instrumentation diagram (P&ID) to highlight the main components of the ejectors plant.
Also, spare parts and component wear were considered. Due to the relatively short time of demonstrator operation, it was impossible to assess the impact of maintenance on materials consumption based on historical data. Therefore, it was estimated based on the demonstrator’s use [30] and maintenance manual or by relevant literature [38,39]. The following assumptions were made: (i) substitution of 5 m per year of underwater pipeline; (ii) 10 years of expected lifetime for each inverter; (iii) 10 years of expected lifetime for each pump; (iv) 10 years of expected lifetime for pipeline brackets (metallic).
Emission factors (i.e., GHG and pollutant emissions related to materials and energy consumption) were analysed by considering different kinds of emissions, namely carbon dioxide (CO2), sulfur oxides (SOX), nitrogen oxides (NOx), particulate matter (PM2.5) and non-methane volatile organic compounds (NMVOCs). Data sources were identified in relevant international and national databases.

2.2.3. Life Cycle Impact Assessment

Life cycle impact assessment (LCIA) is the step in which the LCI results are assigned to impact categories and then translated into impact indicators, thus being the most critical part of the LCA process. Due to the specificity and complexity of each LCA, there is yet to be a universally acknowledged standard assessment method. Usually, the LCIA procedure is divided into two sub-steps: the first one is the classification into impact categories, and the second one is the characterisation of the impact using characterisation factors. The impact categories are defined and selected to describe the impacts caused by the emissions and the consumption of natural resources induced by the activity of the two systems. After the impact categories are chosen and defined, the relative contribution of each input and output within the product system to the environmental load is assigned to these categories and converted into indicators representing the corresponding potential impacts on the environment. This is achieved by multiplying the inventory results obtained in the classification phase by the characterisation factors of each substance within each impact category. For each impact category, a category indicator is identified; every category indicator is an environmentally relevant factor that reflects the consequences of the LCI results on the category endpoints.
The selection of an appropriate methodology is a crucial issue in a LCA study. Each methodology describes its characterisation model to attribute the LCI results to the relative impact category. The relevant categories, category indicators and characterisation model can be selected by following available guidelines, such as [40,41,42]. In this study, CO2 emissions were the main expected LCI output and the most significant issue for evaluating the ejectors plant. Therefore, the choice of the methodology followed the most scientifically robust method that linked CO2eq and GHG emissions to radiative forcing, temperature and ecosystem impacts. Among the five methodologies compared in the previously cited guidelines, the most fitting method is ReCiPe2016 [43] because no uncertainty factors are included, it refers to the most up-to-date data, and it contains scenarios (i.e., the opportunity to evaluate the sensitivity of different technical options). ReCiPe2016 is the updated and integrated 2008 version, and it is a harmonised life cycle impact assessment method at the midpoint and endpoint levels. ReCiPe2016 presents three time horizons for almost all characterisation models: individualistic (20 years), hierarchic (100 years) and egalitarian (1000 years). The value choice chosen for this study is the hierarchic one, based on scientific consensus concerning the time frame and plausibility of impact mechanisms. When specified, country-related characterisation factors have been used.
Within the ReCiPe methodology, the impact categories selected were climate change, terrestrial acidification, fine particulate matter formation and photochemical ozone formation. The widely used midpoint characterisation factor for assessing climate change impacts is the global warming potential (GWP) [44]. The GWP expresses the amount of additional radiative forcing integrated over time (here 20, 100 or 1000 years) caused by the emission of 1 kg of GHG relative to the additional radiative forcing integrated over that same time horizon caused by the release of 1 kg of CO2. The GWP is expressed in kg CO2 eq/kg GHG. At the damage level, the endpoints considered are the impacts on human health, terrestrial ecosystems and freshwater ecosystems. The atmospheric deposition of inorganic substances, such as sulphates, nitrates and phosphates, causes soil acidity change. This change in acidity can affect the plant species living in the soil, causing them to disappear. Significant acidifying emissions are NOx, NH3 or SOX [45]. The midpoint characterisation factor for the acidification is the kilograms of SO2 equivalent per mass unit of each acidification potential emission. At the damage level, the endpoint is the rate of potentially not occurring number of plant species in terrestrial ecosystems. This characterisation factor is calculated on a country-specific basis. Air pollution that causes primary and secondary aerosols to form in the atmosphere can substantially negatively impact human health, ranging from respiratory symptoms to hospital admissions and death [46]. Fine particulate matter (PM) with a diameter of less than 2.5 μm (PM2.5) represents a complex mixture of organic and inorganic substances. When inhaled, PM2.5 causes human health problems as it reaches the upper part of the airways and lungs. Secondary PM2.5 aerosols are formed in the air from emissions of sulfur dioxide (SO2), ammonia (NH3), and nitrogen oxides (NOx), among other elements. WHO studies show that chronic PM exposure’s mortality effects are likely attributable to PM2.5, rather than coarser PM particles. Particles with a diameter of 2.5–10 μm (PM2.5–10) are related to respiratory morbidity [46]. The midpoint characterisation factor for this category is the particulate matter formation potential (PM2.5-eq/kg), whereas the endpoint is the disability-adjusted life years (DALY). Finally, photochemical ozone formation is caused by the degradation of volatile organic compounds (VOCs) in the presence of light and NOx (“smog” as a local impact and “tropospheric ozone” as a regional impact). The exposure of plants to ozone may damage the leaf surface, damage their photosynthetic functioning, discolour the leaves, cause dieback of leaves, and, finally, damage the whole plant. The exposure of humans to ozone may result in eye irritation, respiratory problems, and chronic damage to the respiratory system. The midpoints are the region-specific ozone formation potentials for human health damage (HOFP in kg NOx-eq/kg) and ecosystem damage (EOFP in kg NOx-eq/kg). The endpoints are the region-specific endpoint characterisation factors for human health damage and ecosystem damage due to ozone formation. An overview of the midpoint and endpoint categories and their characterisation factors is reported in Table 1, which provides an overview of the midpoint categories according to ReCiPe2016, and in Table 2, which provides an overview of the endpoint categories according to ReCiPe2016. The endpoint categories affected are human health and the natural environment.
Table 3 defines, within each category, the emissions defined in Section 2.2.2 that contribute to the impacts described by the category. Based on the LCI results, all the emissions are identified and quantified. They were compared to the previous categories and assigned to one or more related categories. According to the descriptions provided, selecting the categories mentioned above by the emissions identified was possible.

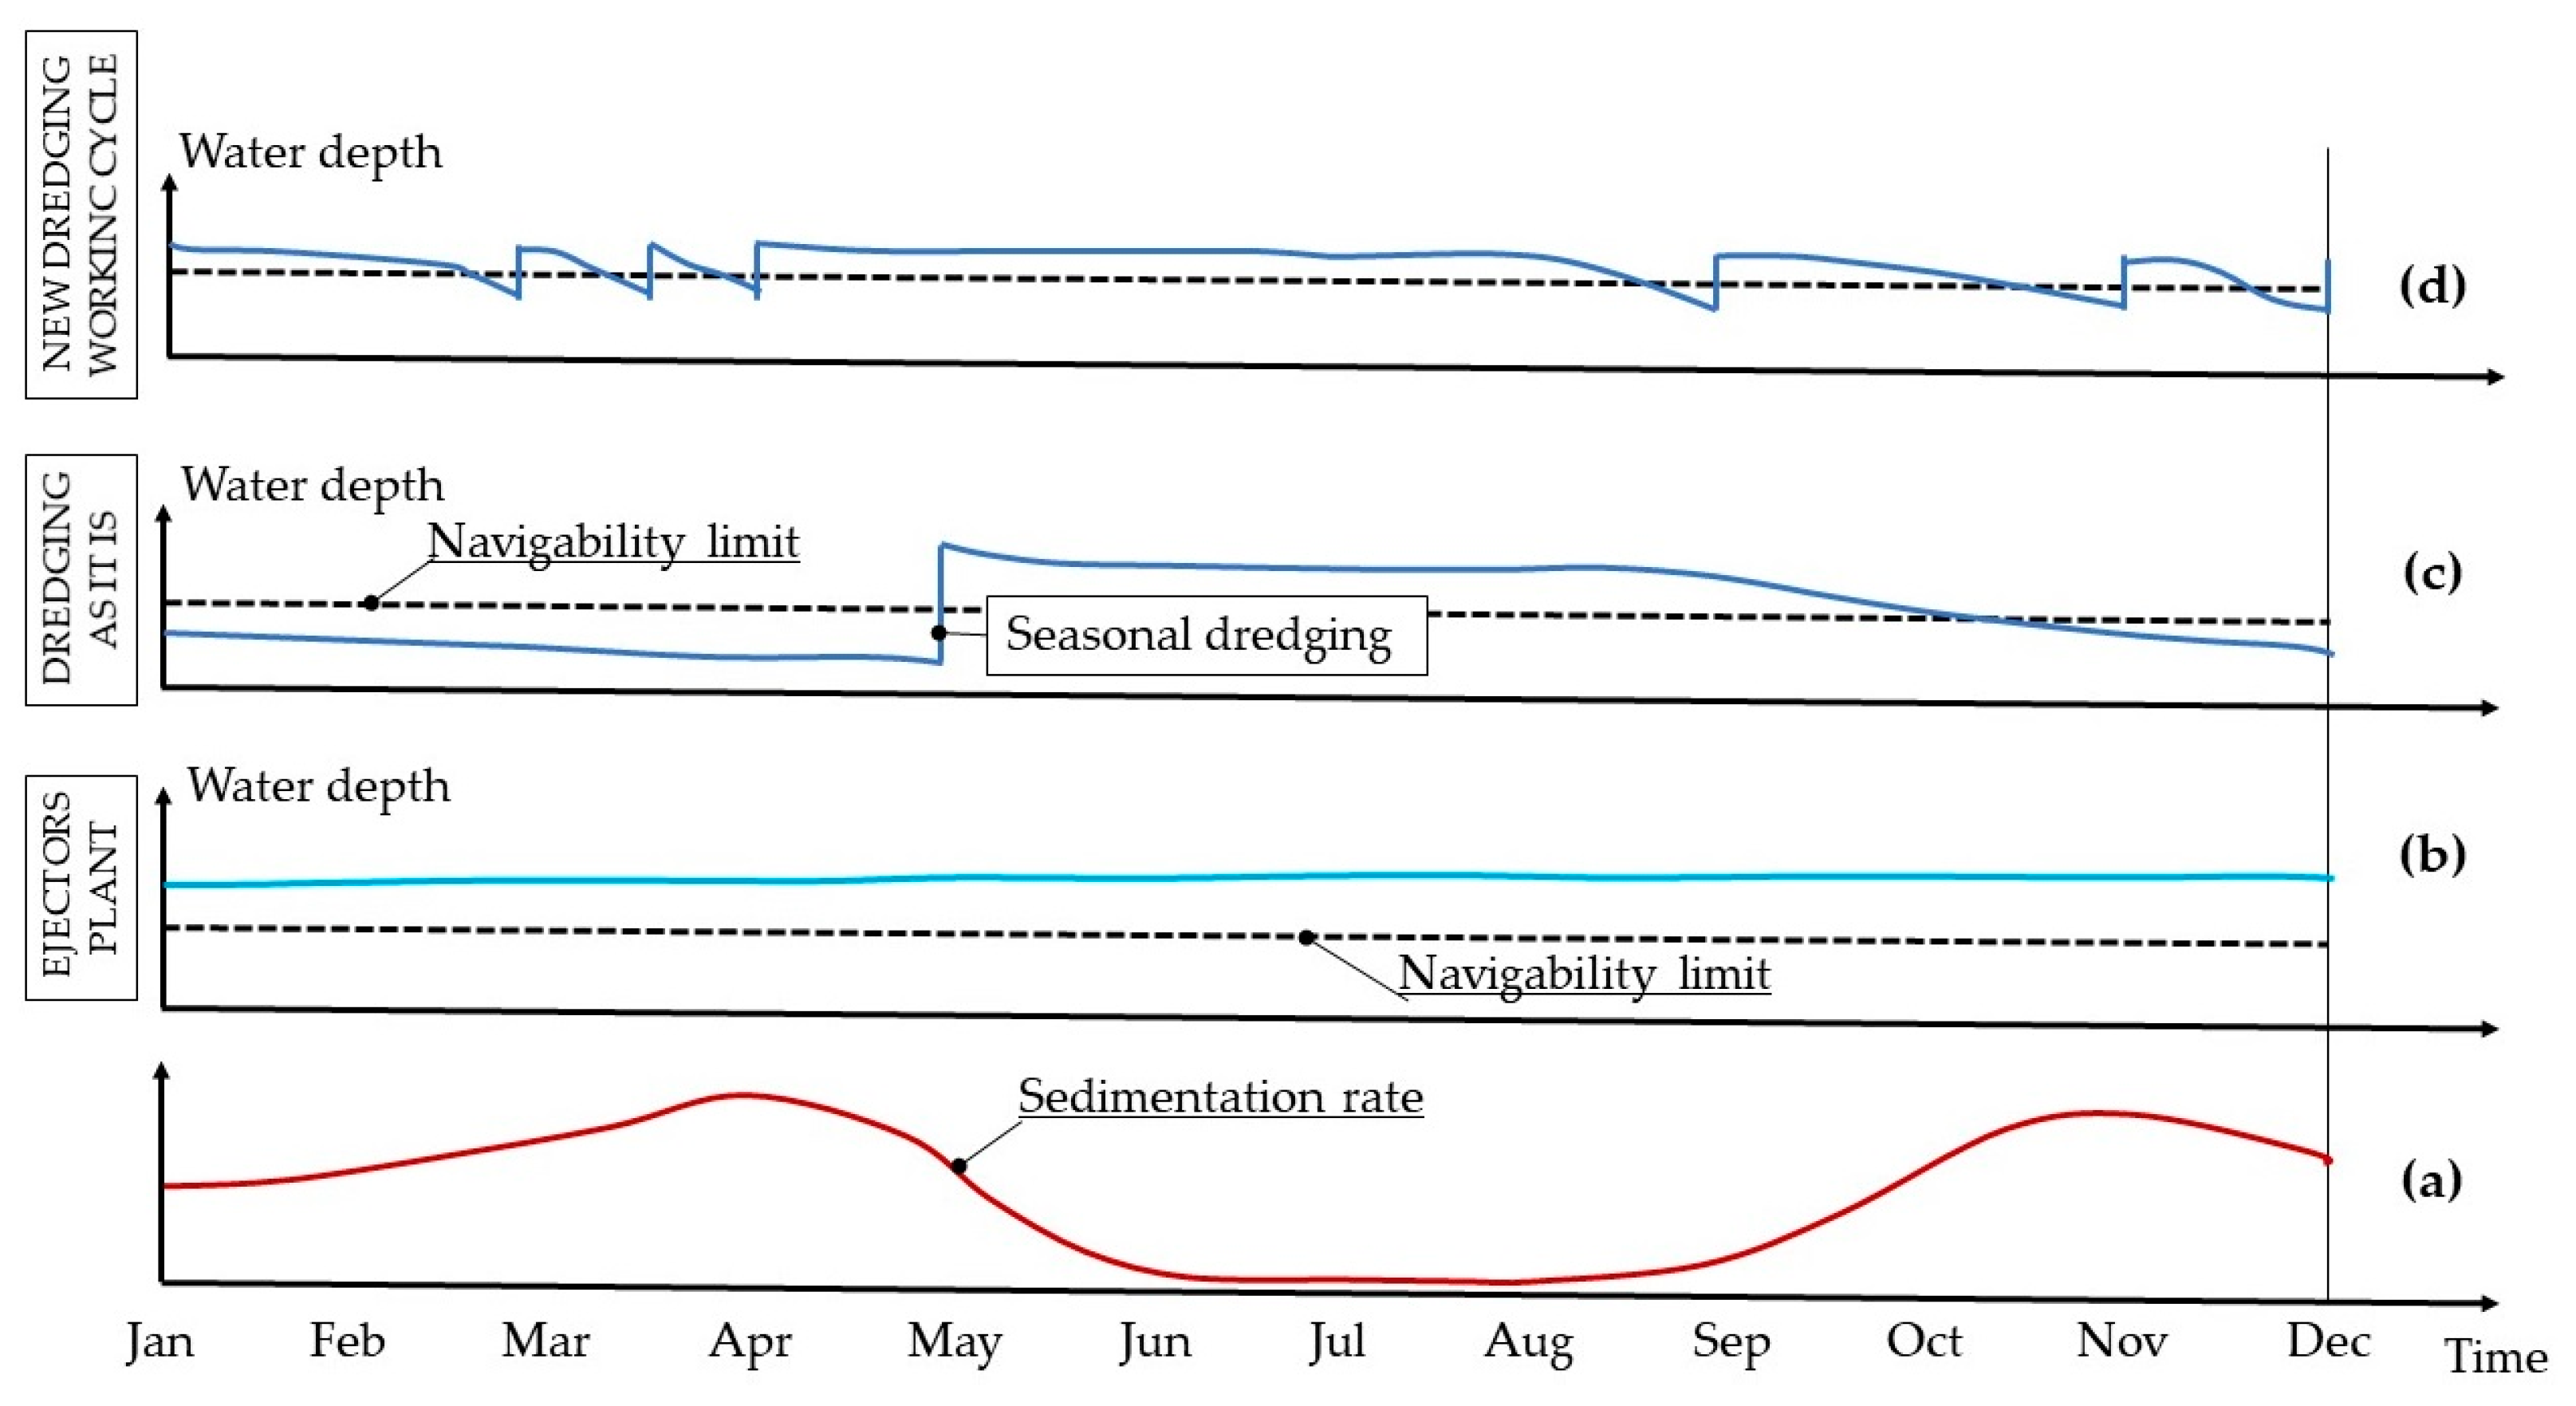
2.3. Comparison between Maintenance Dredging and the Ejectors Plant

The different operation modes hindered the comparison between maintenance dredging and the ejectors plant. While an ejectors plant operates continuously to instantaneously remove the sediment approaching its influence area, the dredge removes the sediment accumulated over a specific timeframe. Figure 7 illustrates, through a qualitative assessment, why a direct comparison between the ejectors plant and dredging operation cannot be performed. Figure 7a shows qualitatively the sedimentation rate characterising Cervia Harbour’s inlet. The sedimentation rate is seasonal and highly affected by single events like storms. While the ejectors plant can continuously remove from the sedimentation area the sediment affecting navigability (Figure 7b), the traditional seasonal dredging (Figure 7c) can guarantee navigability only from May to October–November. For the rest of the year, navigability cannot be guaranteed over 2.5 m (usually falling under 2.0 m when seasonal dredging is realised).
The different operating modes pose two barriers to the comparison:
  • While the effect of dredging on sediment removal can be measured in volume or mass (i.e., through bathymetries before and after dredging or direct measurements on the dredge), the effect of ejectors plant on sediment handling can only be estimated [33], since the sediment is continuously removed and transported away from the sedimentation area;
  • While the ejectors plant can guarantee a certain water depth over time [33], maintenance dredging cannot.
Therefore, if a comparison has to be made between the two technologies, it makes sense to consider how maintenance dredging might be planned to guarantee navigability over time as the ejectors plant can. In Figure 7d, a qualitative example is shown: dredging operation is no longer seasonal, but it is connected to the single weather events that can cause a rapid increase in sedimentation rate. As a result, the two technologies are compared not in terms of sediment handling or removal (i.e., cubic meters or tons of sediment), but based on being able to guarantee navigability. Following this assumption, in the following sub-paragraphs, a description of dredging equipment usually used in Cervia is introduced, as well as a literature analysis of existing studies on maintenance dredging LCA, with the final aim of defining a dredging plan able to satisfy navigability requirements all over the year.

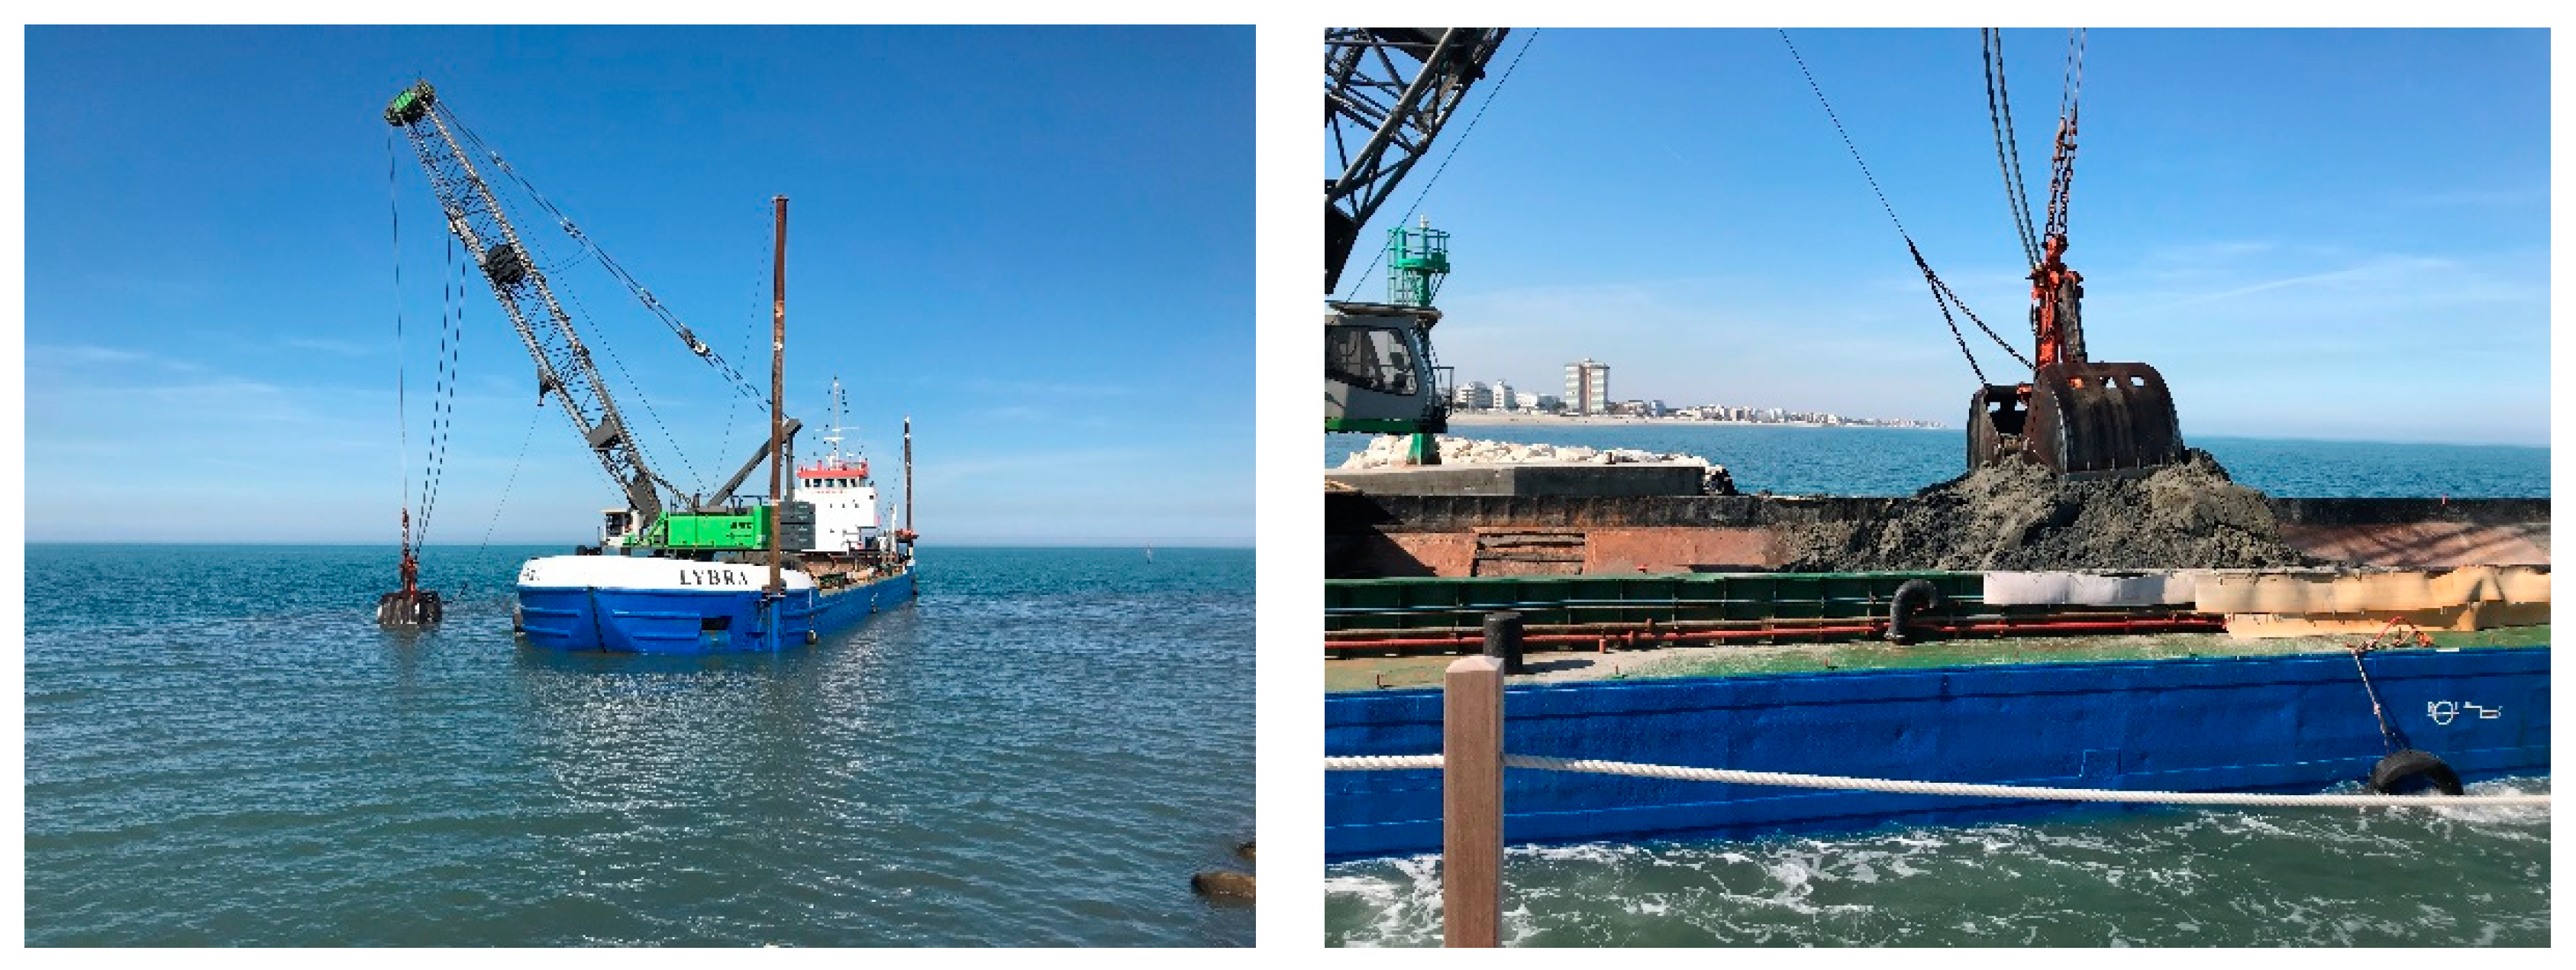
2.3.1. Dredging Equipment Description

The grab dredger (Figure 8) is the most commonly used in the framework of Cervia Harbour. The capacity of a grab dredger is expressed in the volume of the grab. Grab capacity varies between less than 1 m3 up to 200 m3; in the case of Cervia harbour, the grab capacity may vary between 2 and 4 m3. While dredging, the method of anchoring and the positioning system play an essential role in the effectiveness of the dredger; in particular, the dredgers can be moored by anchors or poles (or “spuds”). In the latter, the ship has a hold in which it stores the dredge material. The grab dredger used in Cervia Harbour usually has a 200–400 m3 capacity. Once the hold is complete, the dredger has to discharge it to the disposal site. Depending on the chemical and physical characteristics of the sediment, it can be used for beach nourishment, disposed of in the deeper sea or landfilled. Usually, the sediment dredged at the harbour entrance of Cervia is disposed of more than 5 miles (9.3 km) from the coast.
Localising every bite of the grab is crucial, as is employing a positioning system. This helps the dredge master to place the next bite after the previous. The dredging process is discontinuous and cyclic. The operation phases include (i) lowering the grab to the bottom, (ii) closing the grab by pulling the hoisting wire, (iii) hoisting starting when the bucket is completely closed, (iv) swinging to the barge or hopper, (v) lowering the filled bucket into the barge or hopper, and (vi) finally opening the bucket by releasing the closing wire. Once the dredger hold is complete, the dredger moves to the disposal site, releases the dredged sediment utilising slurry pumps, and then returns to the dredging site.
Sometimes, the dredge is not used for sediment removal, but for sediment handling through propeller operation. In this case, the dredge positions and anchors in the area of operation and then turns the propellers on at high speed. Propeller operation puts in resuspension the sediment from the seabed. Then, the sediment is transported away by an uncontrolled and random combination of propeller boost, natural marine current and tidal effect, similar to water injection dredging. Table 4 summarises the characteristics of a grab dredger used for dredging and propeller operations at Cervia Harbour. Data about mean diesel consumption were also taken from the dredger datasheet.

2.3.2. Literature Analysis of Environmental LCA of the Maintenance Dredging Operation

While comprehensive literature exists about the environmental LCA of complex dredging and beach nourishment plans [47,48], to the author’s best knowledge, only one study addressed dredging environmental LCA by considering the dredge equipment lifecycle. In [49], the LCA of a trailing suction hopper dredger (TSHD) and a cutter suction dredger (CSD) were analysed. The LCA of both dredgers revealed the relative contribution of each life cycle stage and each system onboard. The results indicated that the use phase was dominant due to the use of fossil fuels and the environmental burden related to its emissions. The results also showed the importance of fuel use in all life cycle phases. The maintenance was also modelled separately and had a minimal contribution to the environmental impact. Therefore, in this paper, it will be assumed that considering the emissions during maintenance dredging operation would be enough to compare with the ejectors plant.

2.3.3. Definition of Maintenance Dredging Operations Able to Guarantee Navigability over the Year

A working cycle similar to the one shown in Figure 7d must be defined to evaluate the environmental impact of a grab dredger operating at Cervia’s harbour entrance. In the case of dredging operation, the following working cycle can be defined:
  • Time for dredging: 1 min to grab the sediment from the seabed and to discharge it on the hold, which means 100 min to fill in the hold;
  • Time for reaching the disposal site and coming back: about 1 h;
  • Time for sediment discharging: about 15 min.
Therefore, the complete dredging and disposal of 300 m3 of sediment would require about 3 h and 302.3 L of diesel. Based on historical data available from Cervia Municipality about bathymetries [33], it is assumed that, with optimised management of dredging and propeller operation, it would be possible to manage the sedimentation to guarantee almost continuously navigability with a working cycle including:
  • Dredging of 5000 m3 of sediment;
  • Twelve days of propeller operation (6 h a day).
Such a plan would produce a marine diesel consumption of about 5038 L for dredging and 16,963 L for propeller operation.

2.4. Summary of Study’s Assumptions and Limitations

Regarding the construction phase, as anticipated, the environmental impacts related to manufacturing, transport and assembly have been neglected for both the ejectors plant and maintenance dredging. The hypothesis is expected to introduce an acceptable error in the environmental LCA of the ejectors plant since the main impact is expected to be related to the energy consumption during plant operation. The error might be increased if the energy mix feeding the ejectors plant mainly comes from renewable sources instead of fossil fuels. For this reason, the impact of raw material processing for the ejectors plant is added to the study.
The ejectors plant lifetime is supposed to be 20 years. This estimation is based on mean values for equipment, machinery, consumables and buildings found in the literature, and the ejectors plant is considered complex infrastructure [38,50]. Nevertheless, the lifetime of some components of the ejectors plant will be reasonably shorter than the ejectors plant lifetime. Therefore, some hypotheses have been made (see Section 2.2.2) on specific components (i.e., pipelines, pumps and ejectors) starting from literature and the 15 months of operation carried out in Cervia, including previous experience in similar installations and the ejectors plant manufacturing information (i.e., pipeline, pumps, fittings duration and spare parts needs).
Due to some issues arising during operation, the power consumption of the Cervia installation has been higher than expected [30]. However, since the origins of the problems have been identified (namely, the high Joule effect on electric cable connections due to insufficient section size and pipelines fouling) and solutions can be implemented to eliminate (i.e., the proper design of electric cables) or minimise (i.e., adoption of anti-fouling systems) the negative impacts on power consumption, the yearly energy need of the demo plant was estimated by following the best performance hypothesis [30] based on actual power consumption of the demonstrator in a period not affected by the abovementioned issues.
The comparison of the ejectors plant and traditional maintenance dredging is performed through the definition of a dredging working cycle, which has some practical issues, like permit, cost and management, that hinder its actual realisation. Nevertheless, the definition of the dredging working cycle must have a benchmark for comparison. Since there are no available references for the scope, the authors designed the dredging working cycle based on historical operations in Cervia Harbour and by considering the bathymetric dynamics over the years.
Suppose a pollutant emission relates to two or more characterisation factor categories. In that case, its impacts were not apportioned between the categories but were classified to contribute to all the related categories.
Table 5 summarises the main assumptions and hypotheses, including the relevant references.
This study’s main limitation is that the framework conditions defined for the environmental LCA assessment are highly dependent on the specific design of the Cervia ejectors plant and the site’s characteristics (i.e., sediment chemical–physical characteristics, sedimentation rate and harbour size). On the other hand, adopting sediment by-pass technologies, including the ejectors plant, is characterised by the need for a tailored system design. For example, the location and number of ejectors required may vary for each application as a function of sediment characteristics and extension of the sedimentation area. At the same time, the system’s efficiency is influenced by the distance for the sediment transport from the sedimentation area to the discharge point (the longer the distance, the higher the energy required). Therefore, while the ejectors plant is theoretically scalable at any size (from small marinas to large industrial ports), some practical barriers may hinder the economic sustainability of the solution in ports, since the number of ejectors to be installed and the distances to be covered may result in being poor economic attractiveness. An interesting option for port sediment management is integrating sediment by-pass systems with maintenance dredging, which could save costs and reduce environmental impact while increasing navigability in critical areas. Further research, including onsite validation, is needed to demonstrate this option’s sustainability. Therefore, the results presented in this study can be considered replicable in small harbours and marinas characterised by sandy sediment. At the same time, additional investigation is needed to extend the findings to ports and large marine infrastructures, especially if the sediment is muddy.
Another limitation of this paper is that it does not compare the ejectors plants and traditional maintenance dredging. The assessment is performed based on the capability of both to guarantee navigability. To achieve such a goal, a working cycle is designed for maintenance dredging without considering any permit limitations and authorisation limitations. Moreover, dredging operation is not always possible because the dredge is not available or cannot operate due to poor weather conditions. Therefore, dredging availability and working capability are not limited, but they actually are. Finally, the cost of the dredging working cycle is also not considered.

2.5. Sensitivity Analysis

To limit the uncertainties generated by the assumptions listed in Table 5, a sensitivity analysis was performed on specific parameters to evaluate the robustness of the results. The sensitivity analysis was applied to the midpoint categories, since a similar qualitative impact was expected on endpoint categories.

2.5.1. Electricity Mix

Studies have shown that the electricity mix chosen in an LCA study can strongly influence the LCA results, particularly for long-lifespan services or goods like buildings [51] or electric vehicles [52], since the parameter is subjected to changes during this period or is influenced by the location (country or region). Nevertheless, the scope of this paper is not to investigate the influence of the electricity mix on the environmental impacts of the ejectors plant, but to first assess these impacts and compare them with the ones from traditional maintenance dredging. Therefore, this paper will consider the Italian electricity mix as a reference for grid-connected applications. The influence of the electricity mix might be evaluated in future research.
On the other hand, it is possible to feed the ejectors plant with locally generated electricity, i.e., from renewable sources like photovoltaics or wind turbines. Another available option is to purchase certified renewable energy from the grid. In this paper, two different electricity mix scenarios will be evaluated: a mid-carbon scenario, in which the emission factors of the Italian grid will be taken as reference, and a low-carbon scenario, in which the emission factors will be reduced to 5% of the Italian grid. The reduction to 5% considers residual access to the grid to integrate electricity production from local renewables or compensate for purchasing certified renewable electricity when the cost is too high.

2.5.2. Ejectors Plant Lifetime

The expected ejectors plant lifetime was estimated at 20 years, with few exceptions for some components (see Table 5). Owing to the limited operation time of the Cervia demonstrator, the impact of a decrease (10 years) and increase (30 years) in the lifetime is evaluated.

2.5.3. Ejectors Plant Maintenance

Due to the limited operation time of the Cervia demonstrator, the impact of maintenance on environmental LCA required some assumptions. To evaluate the effect of these assumptions on the assessment results, the maintenance requirements were increased by factors 2 and 4.

2.5.4. Maintenance Dredging Operation Working Cycle

The definition of the maintenance dredging operation working cycle able to guarantee navigability over the year is affected by a high level of uncertainties. Based on the assumptions in Section 2.3.3, the diesel consumption associated with the defined working cycle was 22,001 L. The sensitivity analysis will evaluate the impact of a reduction (−50%) or increase (+50%) in diesel consumption.

3. Results

3.1. Ejectors Plant Inventory Analysis

The LCI evaluates the quantities of the materials and energy consumed. In this part of the study, the ejectors plant’s related materials and energy flows are explained in detail to quantify inputs, emissions and outputs per functional unit. Having stated the system boundaries during construction and operation only, as discussed above, consumption, input/output material and emissions not comprehended inside the boundaries are not considered. The primary elements of this assessment are (i) BOM analysis to identify and classify the components used for the realisation of the ejectors plant, (ii) energy consumption in operation and (iii) components substitution for damage or wear over the years.

3.1.1. Raw Materials Processing Inventory for the Construction Phase

From the analysis of the BOM of the Cervia ejectors plant and after evaluating the datasheets of all the components, Table 6 summarises all the materials used. In contrast, Table 7 includes the emission factors considered for materials processing. Only primary materials are considered in the study.

3.1.2. Energy Inventory for the Operation Phase

The yearly energy consumption of the ejectors plant is 252,000 kWh. The emission factors of the consumed energy depend highly on the energy source used to supply the system. In the Cervia application, the ejectors plant was grid-connected. Table 8 shows the Italian electricity grid’s emission factors in 2019–2020. The values were calculated by considering the following energy mix [58,59], which included about 13% of the total gross electricity supply that was imported: 42.63% natural gas, 36.42% renewable source, 13.69% coal, 3.62% nuclear (all imported), 2.88% other sources and 0.76% oil. Renewable sources, nuclear and other energy sources are supposed not to contribute to the emission factors, while natural gas, coal and oil emission factors are taken from [60].

3.1.3. Raw Materials Processing Inventory for the Operation Phase

Material consumption for component damage and wear was also quantified to consider the impact of spare parts or component substitution, according to the assumptions made in Section 2. The resulting materials processing requirement for the expected lifetime of the ejectors plant is summarised in Table 9. The same data in Table 7 can be used as emission factors.

3.2. Ejectors Plant Impacts Related to the Functional Unit

Table 10 summarises the effects of the ejectors plant construction and operation phases, referred to as the functional unit.

3.3. Ejectors Plant Category Indicator Calculation

The midpoint characterisation identifies an impact indicator for each category. All the other substances within the same category are related to the impact factors by characterisation factors. The midpoint characterisation provides an estimation of the impact factors’ equivalents. It is possible to run the characterisation to the endpoint level (damage level) by attributing category indicators to the emissions and consumption of resources at the level of the three main areas of protection: ecosystem quality, human health and natural resources. The ejectors plant’s midpoint and endpoint characterisation model results are reported in Table 11 and Table 12, respectively.

3.4. Maintenance Dredging Plan Life Cycle Inventory and Life Cycle Impact Assessment

According to the maintenance dredging plan in Section 2.3.3, the yearly diesel marine consumption can be estimated at 22,001 L. The life cycle inventory for the maintenance dredging plan includes only fuel consumption during operation, which is coherent with the literature findings. Table 13 reports the emission factors of a marine engine fuelled by marine diesel [61].
Considering the same timeframe of the ejectors plant’s lifetime (20 years), it is possible to compute the midpoint and endpoint impacts of the maintenance dredging plan, summarised in Table 14 and Table 15, respectively.

3.5. Sensitivity Analysis Results

3.5.1. Electricity Mix

Low-carbon electricity supply can be reached through various approaches, like local renewable energy generation or renewable certified electricity purchasing. Therefore, low-carbon emission electricity is considered as a realistic option. The emission factors of low-carbon emission electricity are fixed at 5% of the values in Table 8. The ejectors plant’s midpoint characterisation model results are reported for the low-carbon energy scenario in Table 16.

3.5.2. Ejectors Plant Lifetime

By varying the ejectors plant lifetime, we are assuming that the durability of the ejectors plant increases or decreases without any impact on the yearly energy consumption. In this case, the relevant parameters to be assessed are the characterisation factors divided by years. While maintenance dredging operation is not affected by ejectors plant lifetime (being dredging emissions related only to fuel consumption), the ejectors plant lifetime is expected to increase the specific (yearly) characterisation factor due to the lower timespan over which the emission during the raw material processing phase is distributed. Figure 9 shows how the ejectors plant lifetime impacts yearly characterisation factors for the ejectors plant.

3.5.3. Ejectors Plant Maintenance

Figure 10 shows the impact of ejectors plant maintenance on the midpoint characterisation factors. The analysis includes an increase of 100% and 300% in material consumption compared with the baseline condition. A reduction in maintenance impact is not considered since it is not realistic.

3.5.4. Maintenance Dredging Operation Working Cycle

Based on the assumptions made on the environmental LCA of dredging operation, a reduction or increase in fuel consumption will have a proportional impact on the midpoint characterisation factors for maintenance dredging operation reported in Table 14.

4. Discussion

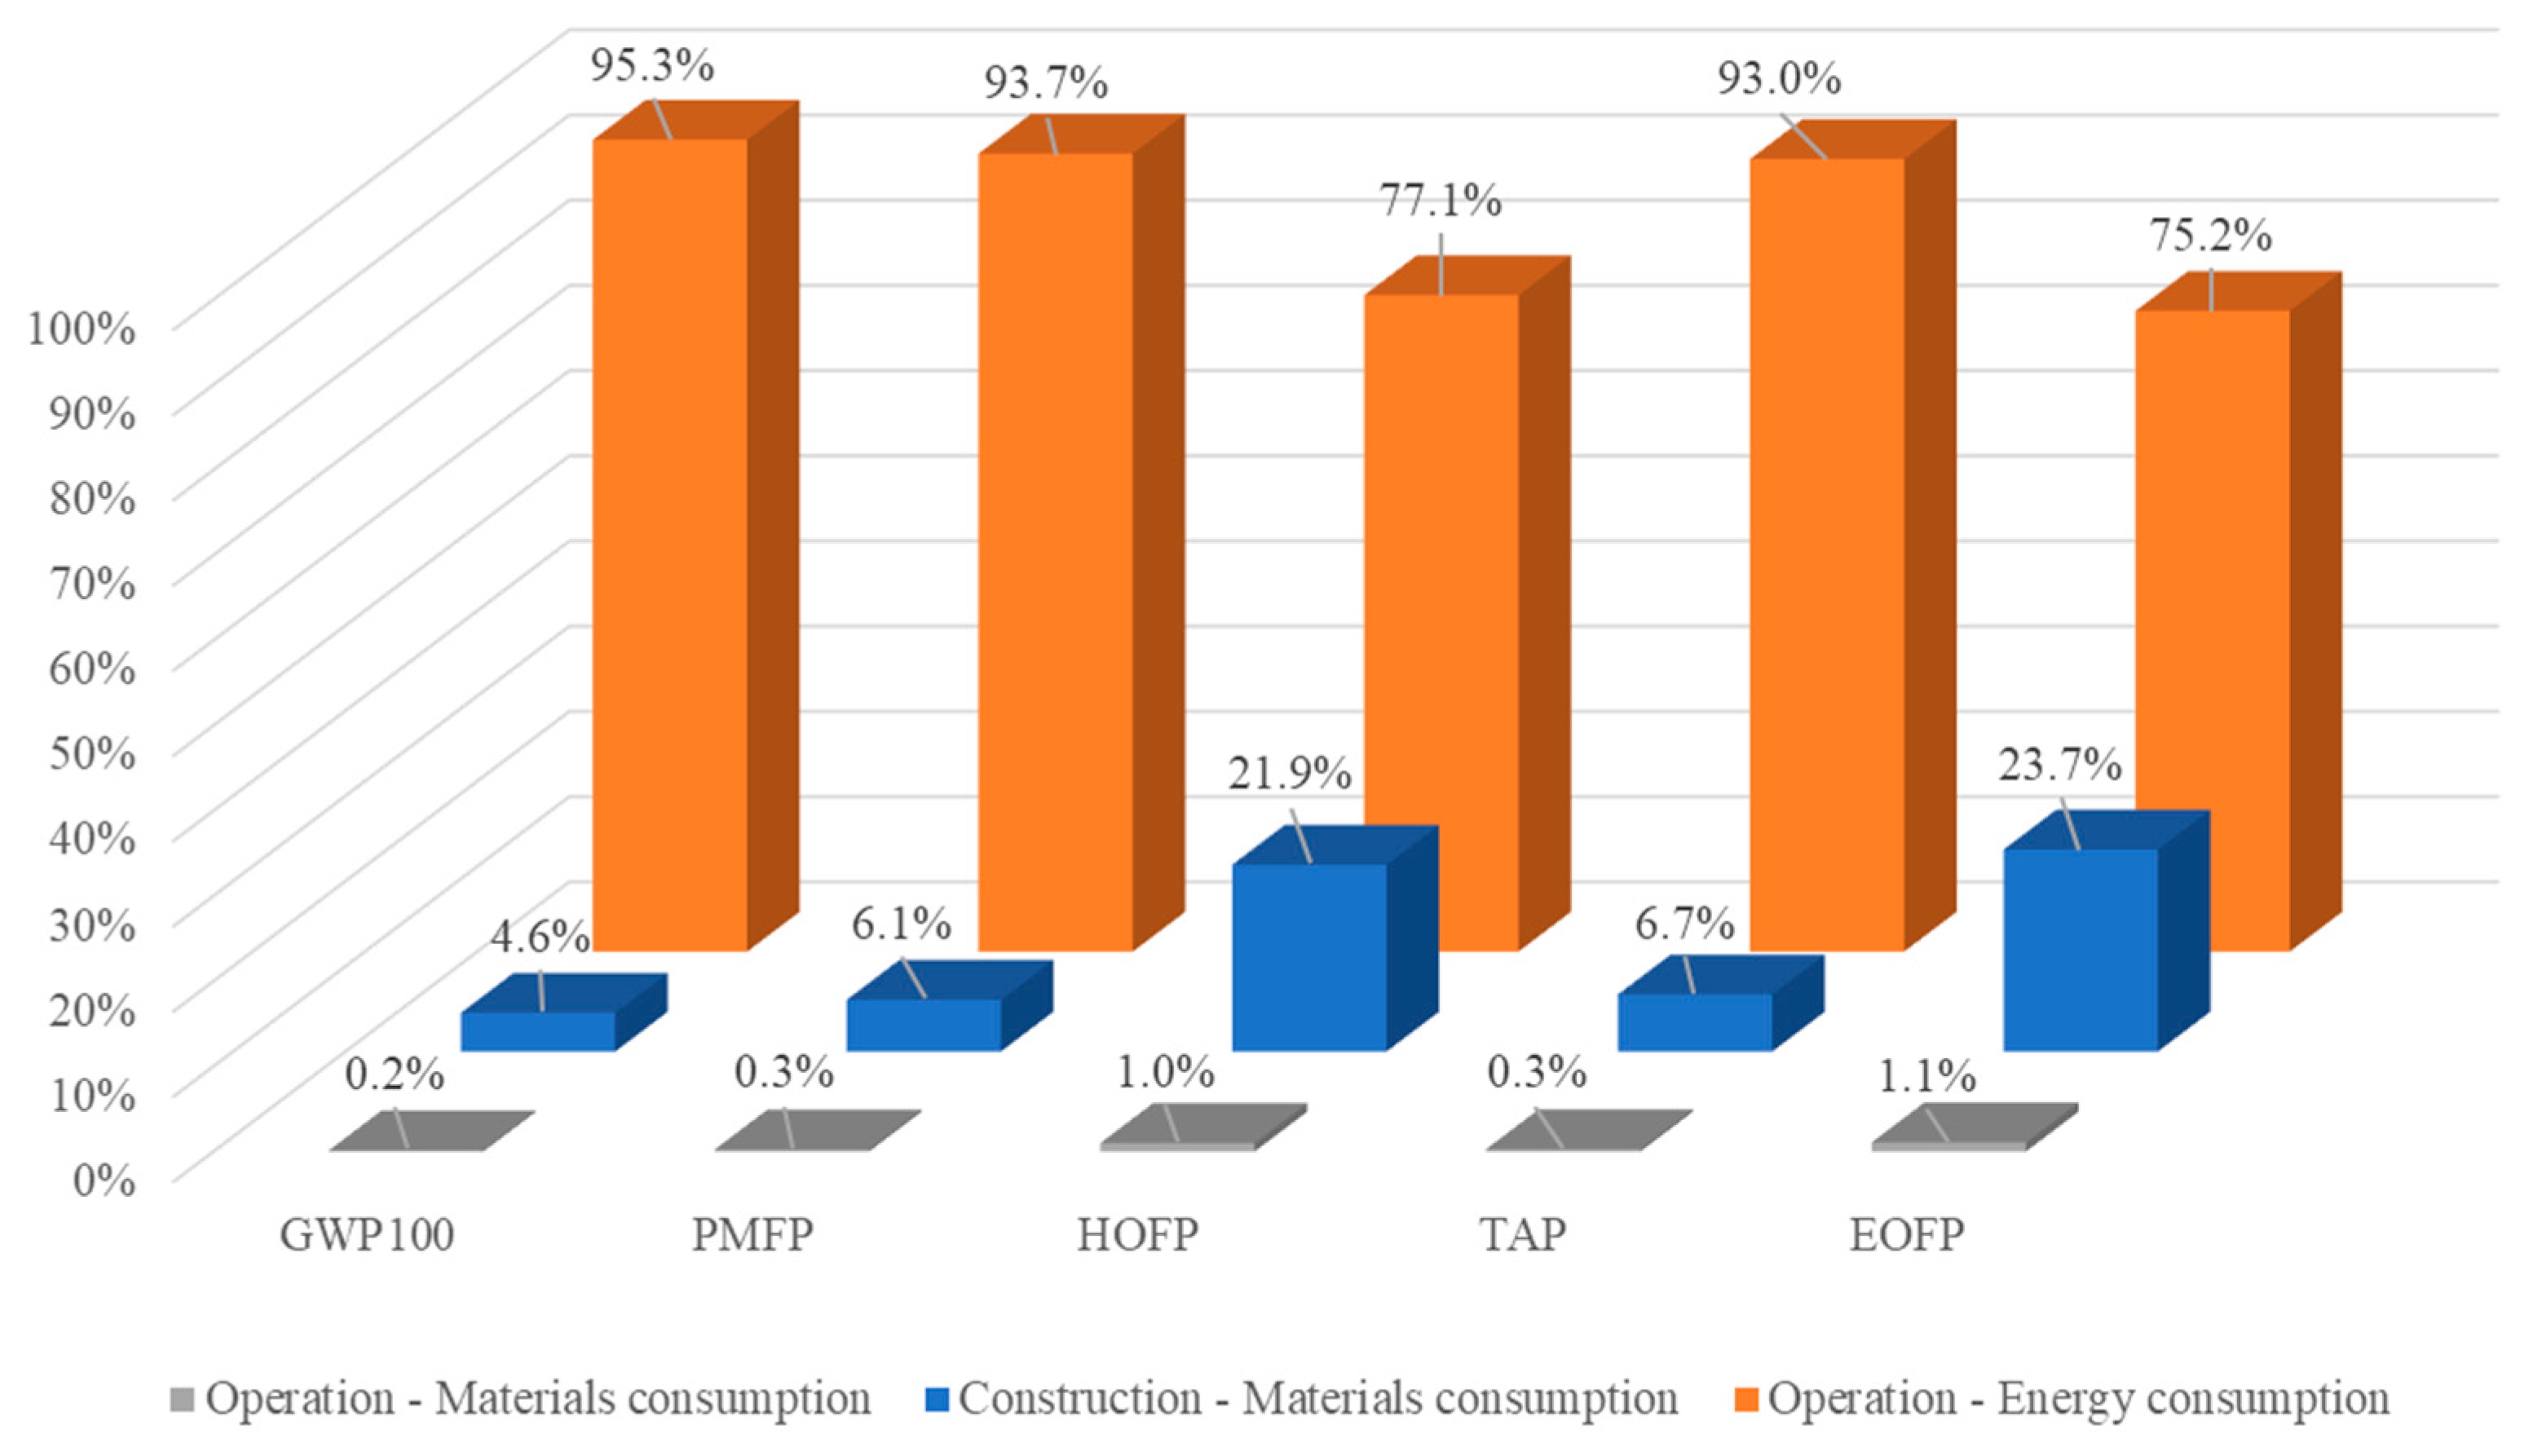
4.1. Ejectors Plant Environmental Impact Analysis

The first relevant result of this paper is to assess through LCA methodology the midterm and long-term environmental impacts of a sediment by-pass plant, based on the 15 months of operation of the ejectors plant located in Cervia (Italy).
Figure 11 shows how the construction and operation phases, the latter being divided into energy and materials consumption, differently impact the characterisation factors analysed in this paper. As expected, the environmental performance of the ejectors plant was highly affected by energy consumption during operation. In particular, GWP100 equalled almost 1750 tons of CO2 released into the air, 95% generated by energy consumption. When the other characterisation factors were analysed, it is interesting to note how the impact of energy consumption during operation is reduced. A higher effect of materials consumption in the construction phase is observed for the HOFP and EOFP factors, reaching about 30%. This is justified by the higher NMVOC emissions estimated in the construction phase compared with energy consumption during operation (see Table 10). The material consumption estimated during the operation phase has no relevant impact on all the characterisation factors.

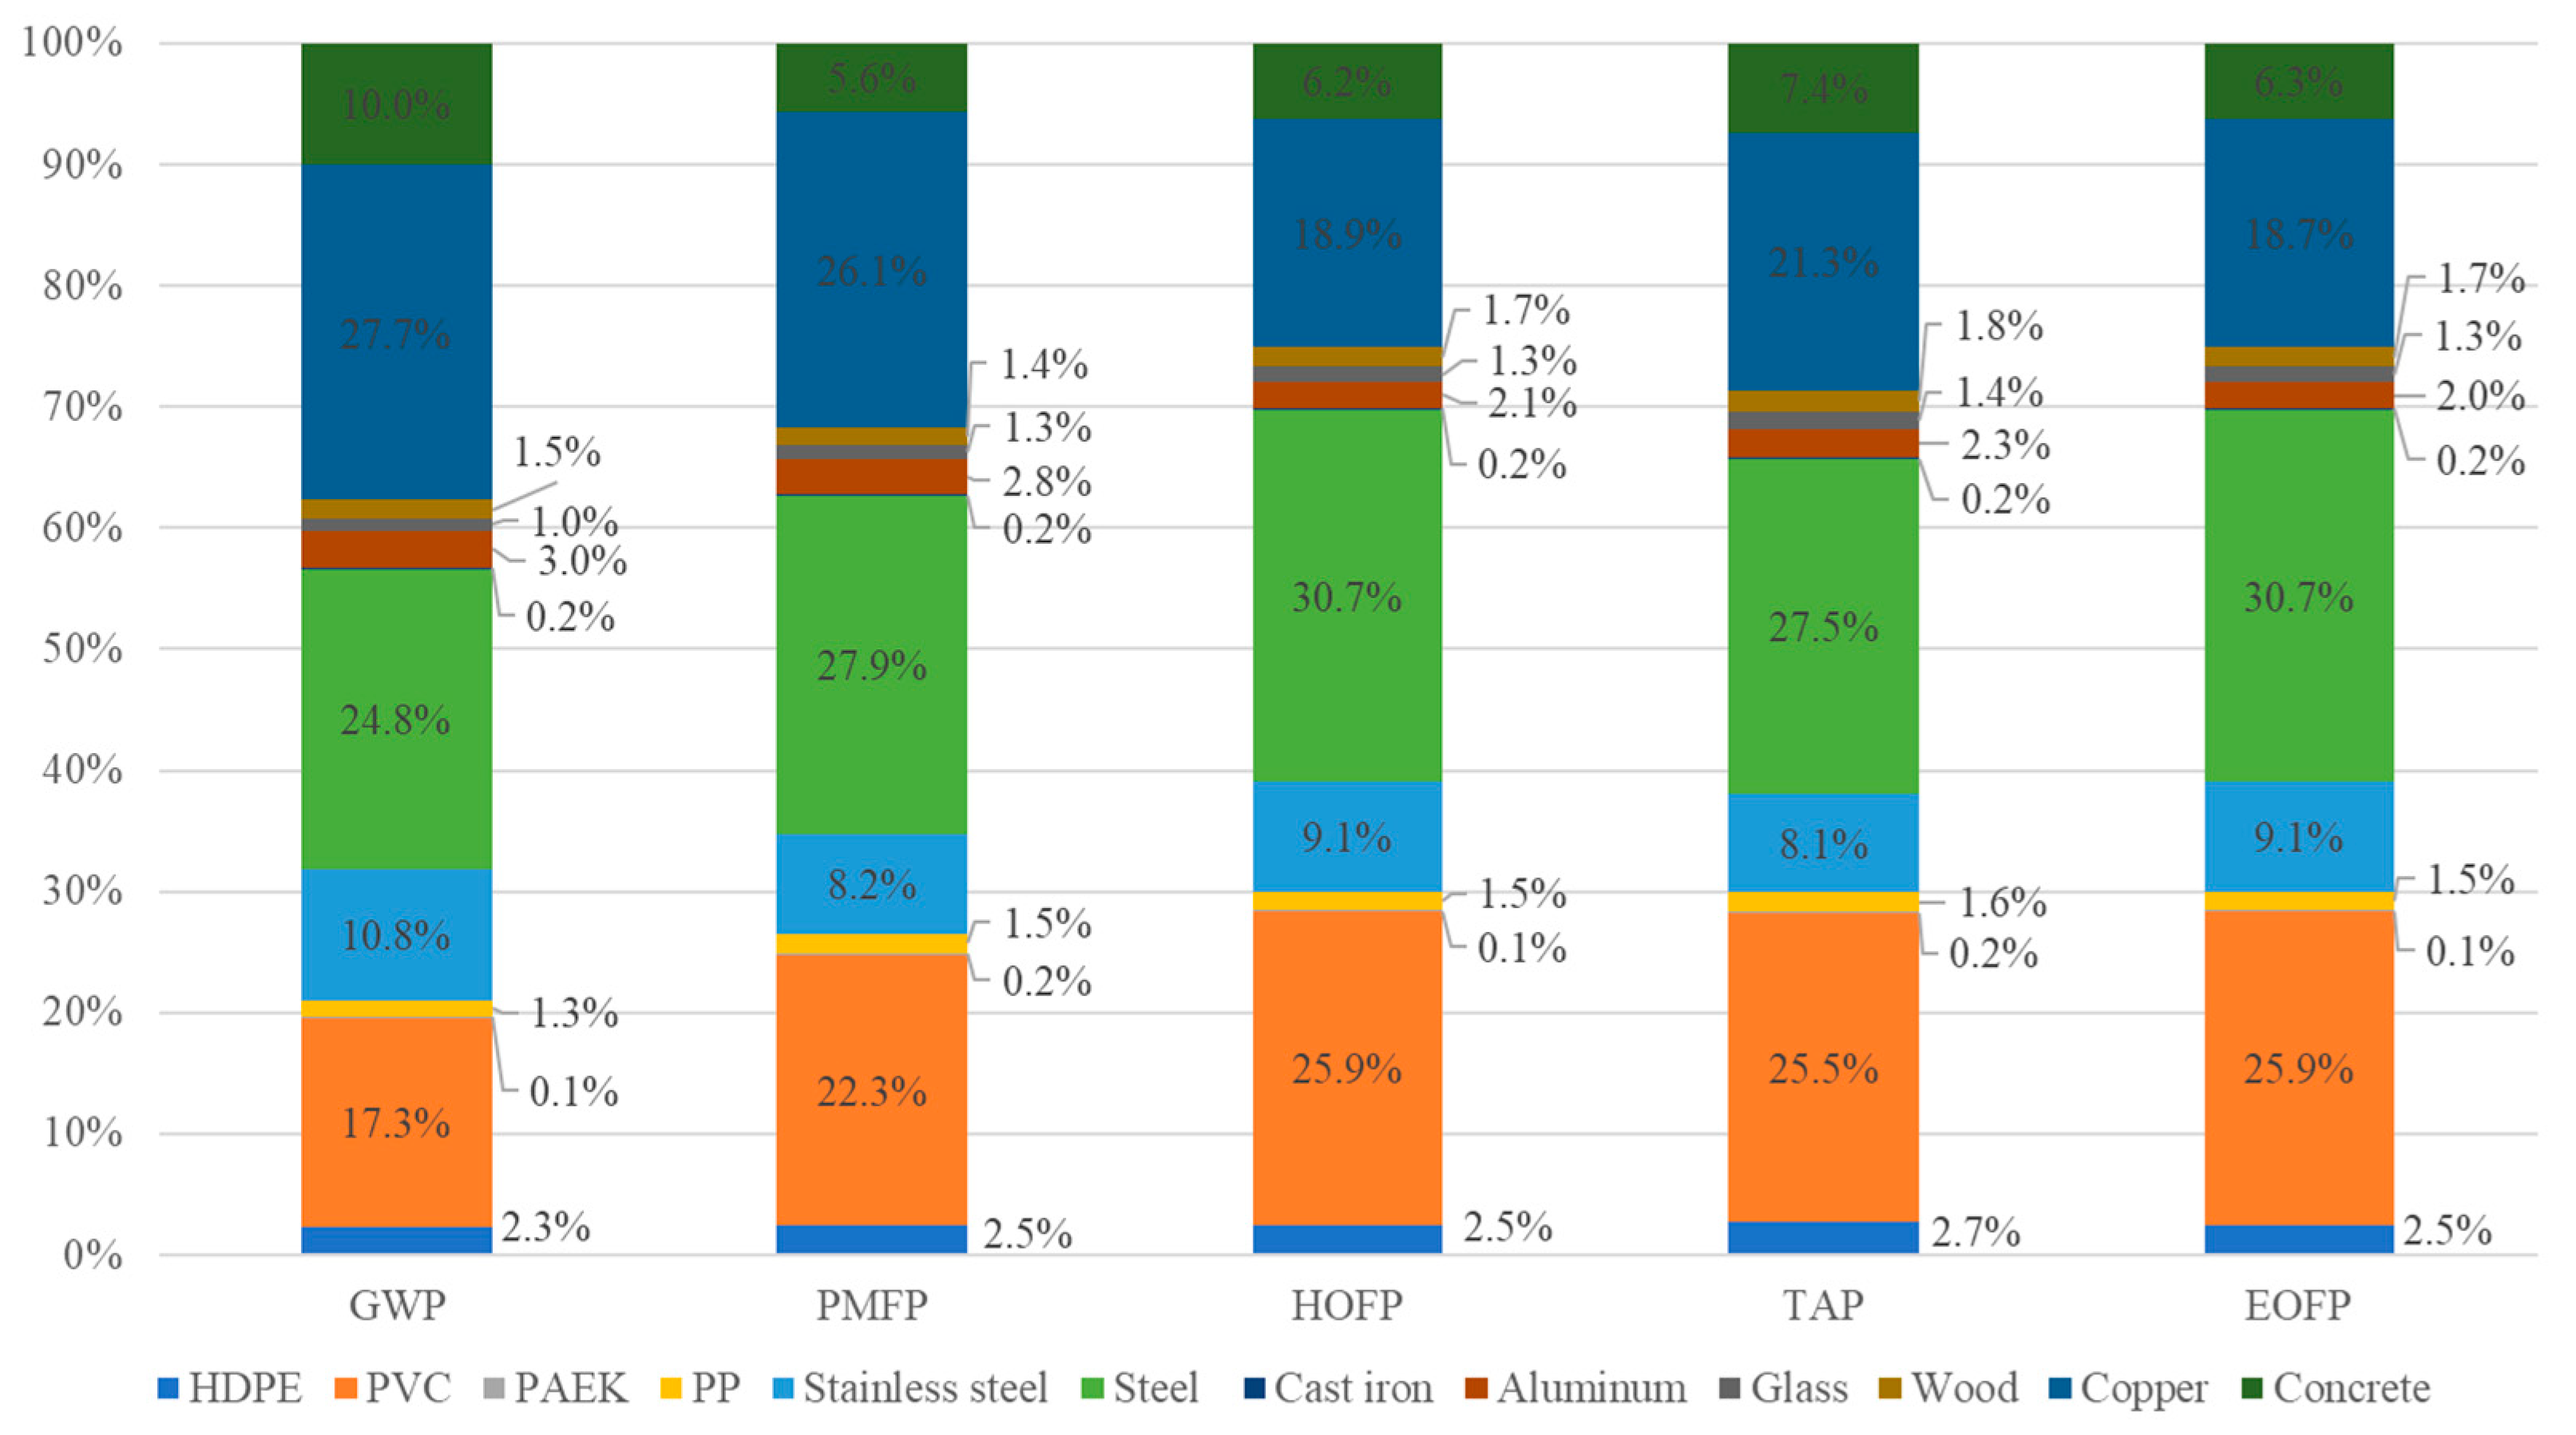
4.2. Effect of Materials Selection on Ejectors Plant Environmental Impact

Figure 12 shows the impact of the different materials on the characterisation factors for the ejectors plant construction phase. In general, the weight or volume of materials is related to the capacity of the ejectors plant (i.e., number of ejectors, cubic metres of water pumped per hour or kilowatts installed) and to specific site requirements, like ejector position and distance between the pumps and ejectors, and the ejectors and sediment–water discharge area.
PVC, steel and copper emerged as the main contributors to the impacts analysed in this paper. The use of PVC is connected to the marine installation, since both water delivery and discharge pipelines are made of PVC. PVC is also used for ejector manufacturing and in technical cabin realisation. In the case of the Cervia demonstrator, the total length of the water delivery pipelines is more than 2000 m. In comparison, the discharge pipelines are about 600 m. This means an average value of 200 m in length for the water delivery pipeline and 60 m in size for the discharge pipeline for each ejector. The amount of PVC in the ejectors plant is highly influenced by the number of ejectors and the distances to be covered by the pipelines, i.e., from the technical cabin outlet to the ejectors and from the ejectors to the sediment–water mixture discharge area. Therefore, the impact of PVC is susceptible to the specific ejectors plant application. Steel was mainly used for the realisation of mooring points. In particular, steel infrastructures were installed on the seabed in the first stretch of the water-feeding pipeline. Concrete may be used instead of steel to reduce the ecological footprint of the ejectors plant. The number and weight of mooring points are influenced by the specific ejectors plant design so that they might differ from one application to another. Copper was used for the electrical wiring inside the technical cabin, and it was also present in some of the plant components (i.e., the inverters or the pumps’ electric motors). Still, most of the weight originated from the connection between the main electric panel in the technical cabin and the connection point to the electric grid. Therefore, once again, the need for copper is influenced by the peculiarity of the specific ejectors plant application.

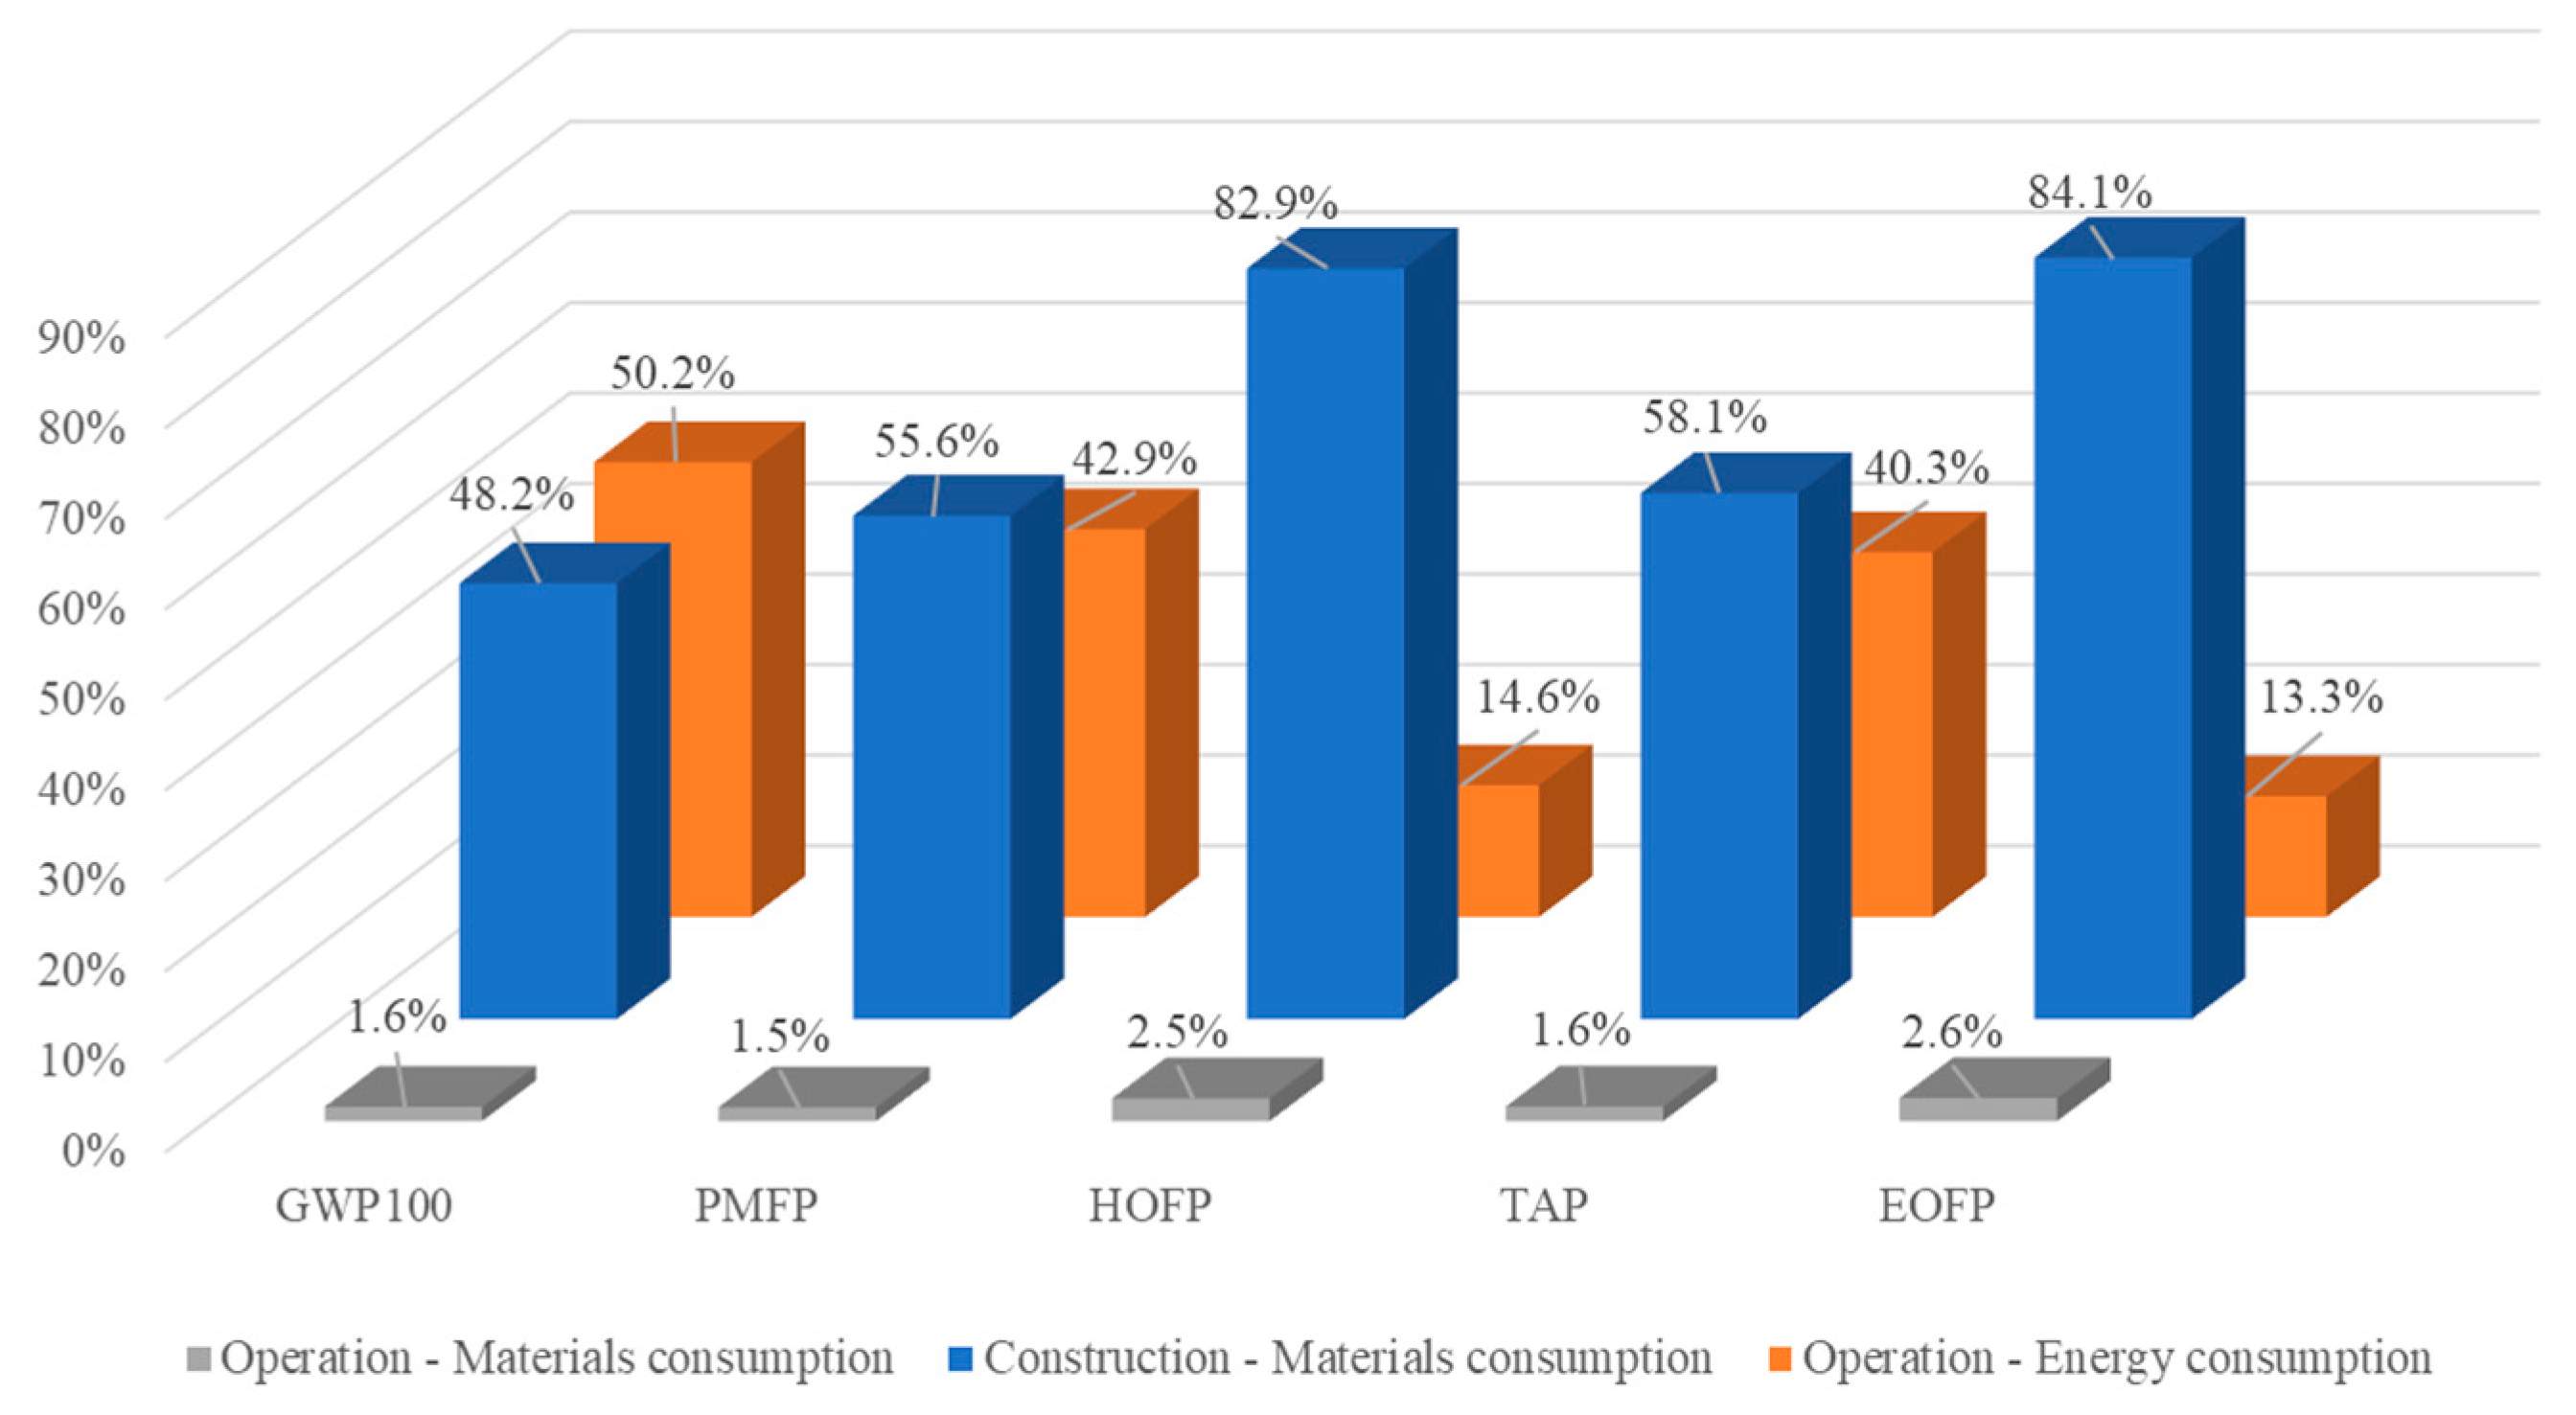
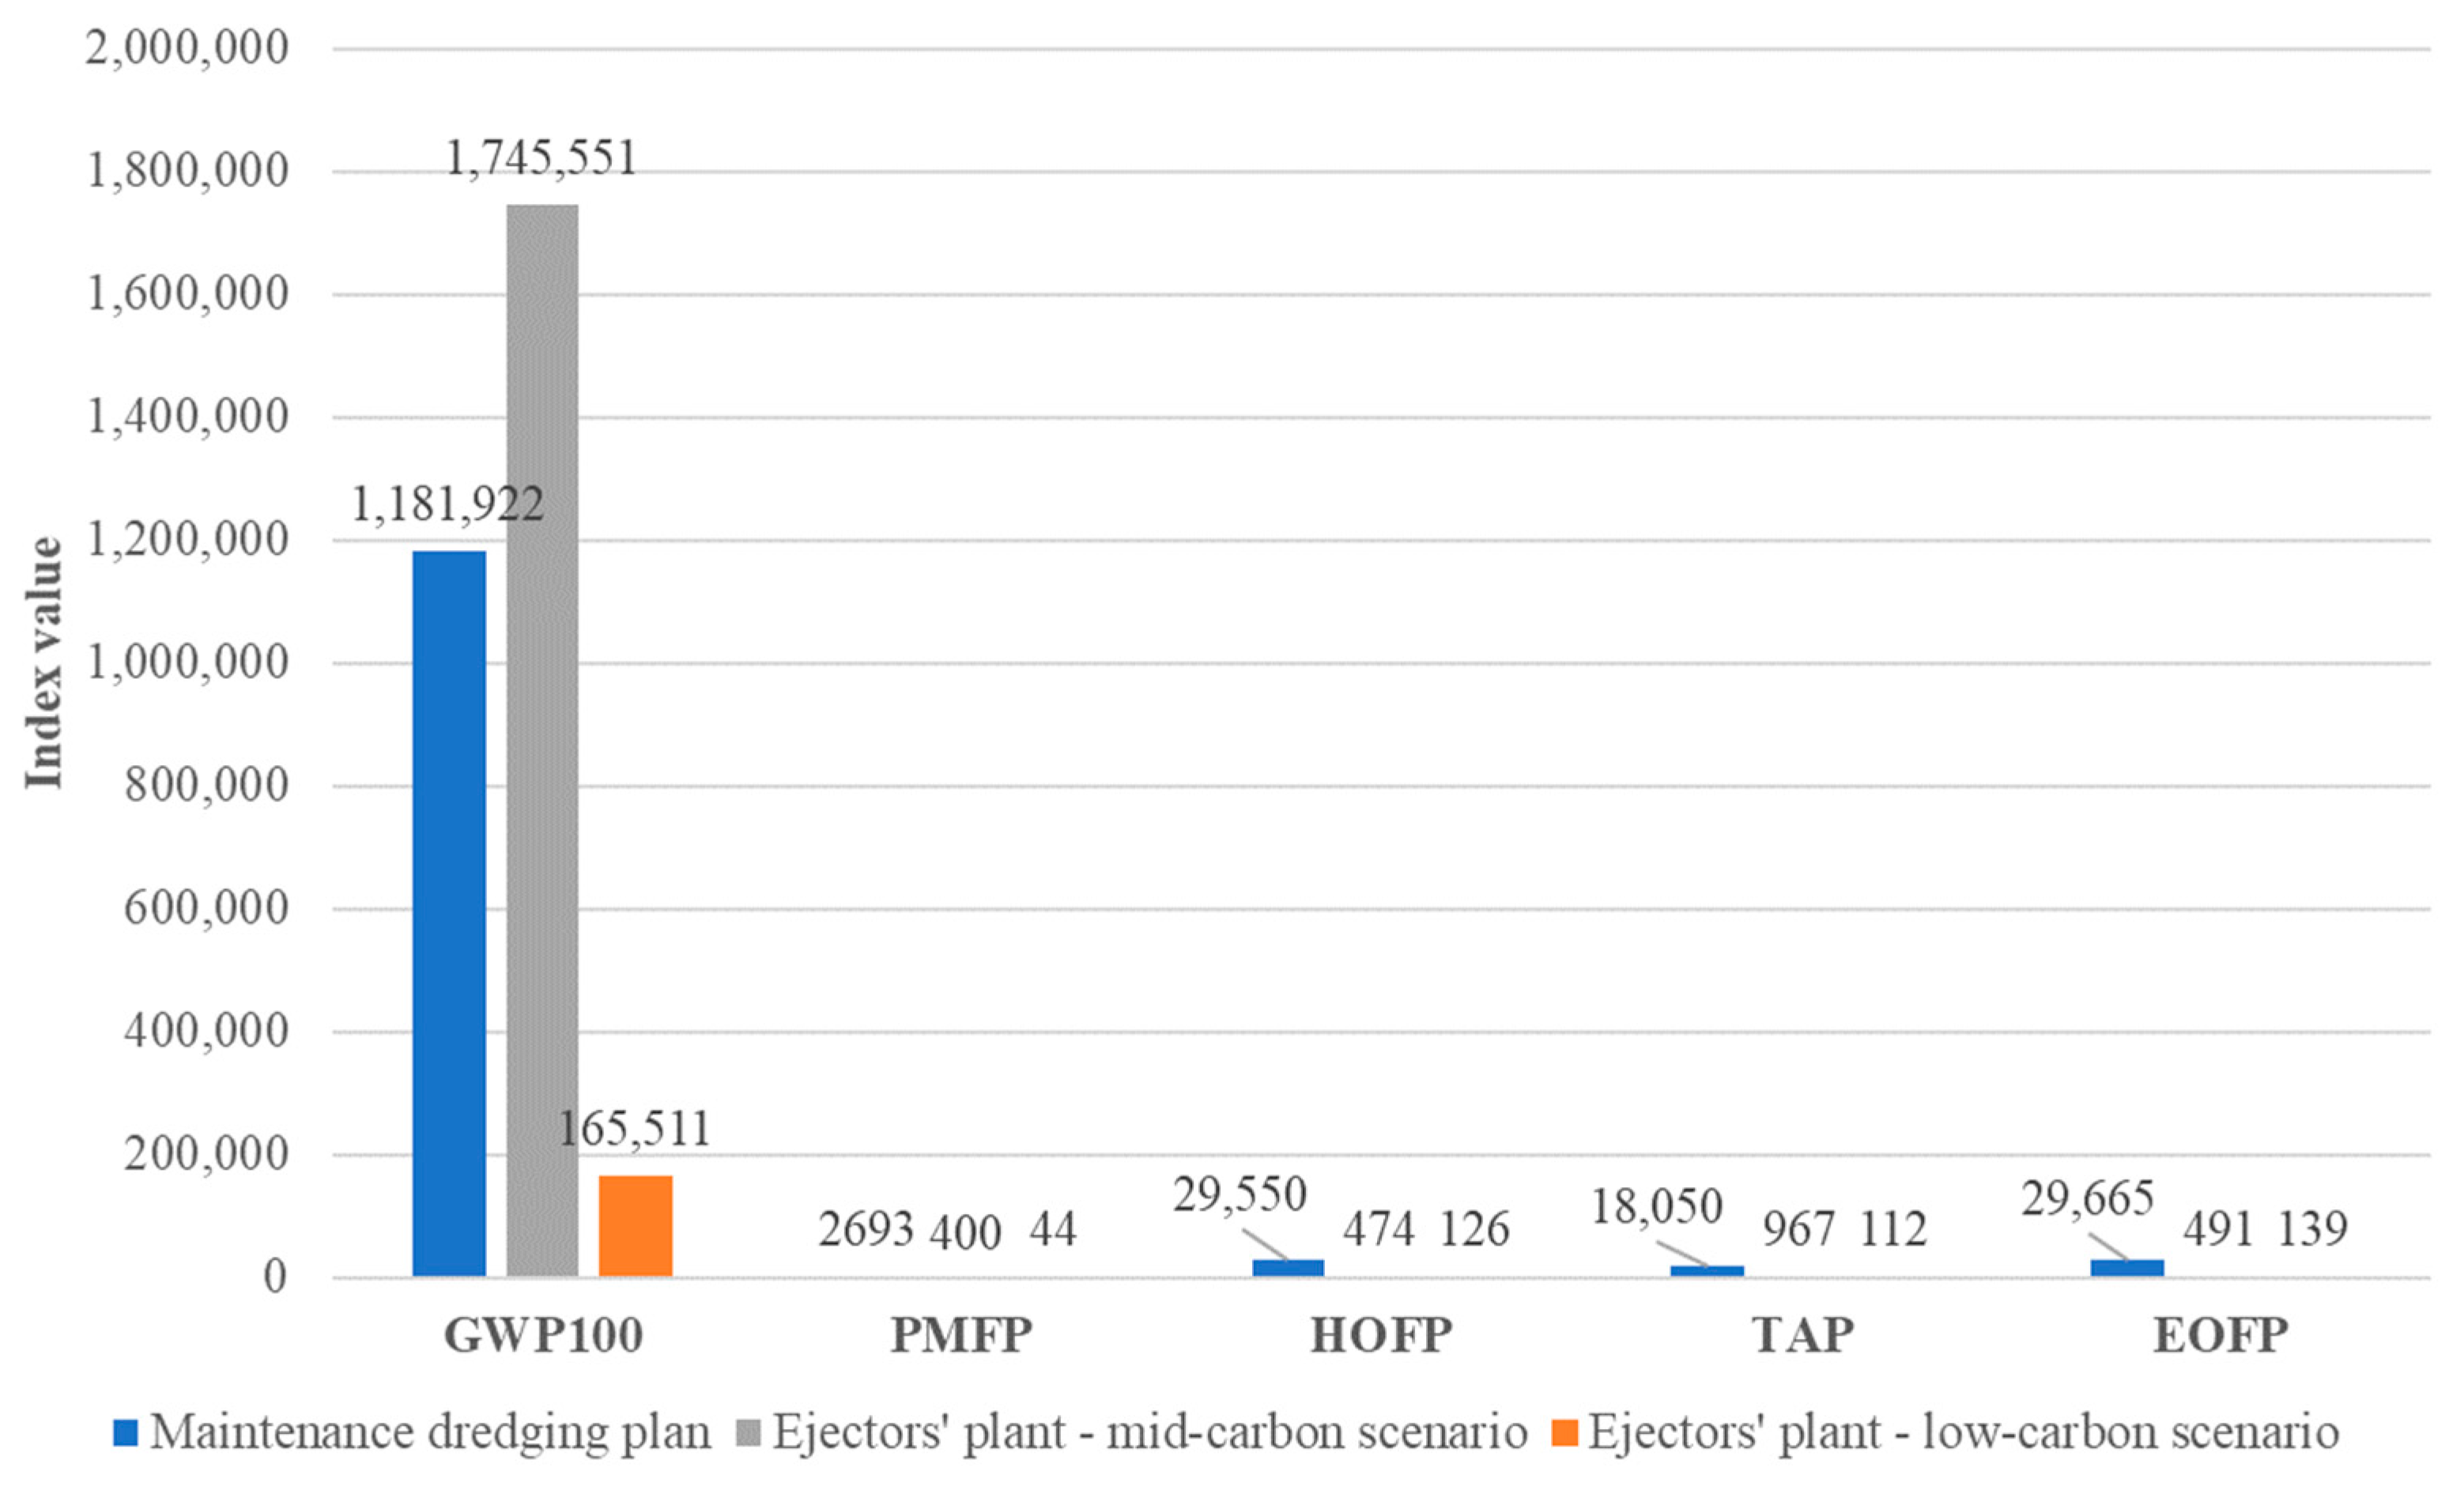
4.3. Comparison between Ejectors Plant and Dredging

Several factors hinder comparing the ejectors plants with traditional maintenance dredging. First of all, the two approaches are entirely different. While traditional maintenance dredging is used to solve the issue of sedimentation when it becomes a problem for navigation, the ejectors plant can guarantee navigability over time. Therefore, the comparison can be made only by assuming that maintenance dredging is designed to guarantee navigability over time. The design that can confirm this hypothesis is hard to define, since maintenance dredging usually has economic and permit limitations that do not allow consecutive operations in short timeframes. Therefore, the following comparison is more ideal than realistic, but it is helpful for the scope of this paper and to provide a benchmark for the ejectors plant technology.
Figure 13 compares the impact on the midpoint parameters of the ejectors plant and maintenance dredging. Based on the assumptions of this paper and the experimental measurements provided by the Cervia demonstrator, the ejectors plant seems to have higher CO2 equivalent emissions than maintenance dredging in the mid-carbon energy scenario. By analysing Figure 13, it is also evident how adopting the ejectors plant is highly beneficial for all the remaining categories (HOFP, TAP and EOFP in particular), impacting one or two orders of magnitude lower than traditional maintenance dredging.
Figure 14 and Figure 15 show the endpoint categories computed for the ejectors plant and the maintenance dredging plan defined in Section 2. The endpoint impact analysis highlights how, in the mid-carbon scenario, the ejectors plant’s effect on climate change for both DALY and PDF is expected to be higher than traditional dredging. Nevertheless, ejectors plants are marginally affected by all the other endpoint impact categories compared with conventional dredging.

4.4. Impact of Selected Parameters on Environmental LCA

4.4.1. Electricity Mix

By comparing Table 11 with Table 16, it is evident how the use of low-carbon electricity can enormously reduce the impact of the ejector plant. GWP is the characterisation factor that is mainly affected, with a decrease of about 90%. Once again, the high NMVOC emission factor in the construction phase related to materials consumption led to a smoother reduction in HOFP and EOFP of 66% and 64%, respectively. Figure 16 shows how a reduction in the impacts related to energy consumption due to grid decarbonisation or local renewable power generation can affect the weight of construction and operation phases on the characterisation factors. Under this scenario, materials consumption in the construction phase becomes the most relevant contributor to all the characterisation factors, except for climate change, which is divided into halves with energy consumption. Figure 16 demonstrates that moving towards a more sustainable energy supply for the ejectors plant can promote the environmental impact reduction. Moreover, if the energy impact is reduced, implementing an eco-innovation approach [62] to the ejectors plant is the only way to decrease the ecological footprint of the technology further.
Figure 17 shows the impact of the low-carbon energy mix scenario on the midpoint characterisation factors, including a comparison with maintenance dredging operation. By following the hypothesis of a low-carbon scenario, it is possible to strongly reduce the impact of the ejectors plant on GWP100. Since the energy mix does not affect the ejectors plant’s efficiency and effectiveness, the only limitation to adopting decarbonised electricity is economic. On the other hand, the benefits of PMFP, HOFP, TAP and EOFP reduction compared with maintenance dredging related to the availability of low-carbon energy to power the ejectors plant are less relevant.

4.4.2. Ejectors Plant Lifetime

Figure 9 shows how the variation in ejectors plant lifetime substantially impacts the yearly midpoint characterisation factors if the lifetime is reduced. In particular, a relevant impact is observed for the parameters HOFP and EOFP. The justification is given by the dependence of both parameters on NMVOC emissions, which are substantially provided by raw materials processing only. Nevertheless, the main impact of a lifetime reduction would be on the economy of the ejectors plant.

4.4.3. Ejectors Plant Maintenance

Figure 10 shows how the assumptions about the impact of ejectors plant maintenance on the midpoint characterisation factors are negligible. Even if emissions related to the maintenance activities are multiplied by a factor of four, the increase in midpoint characterisation factors is limited to a few percentage points. On the other hand, such an increase might have relevant consequences on the economic sustainability of the system, especially in comparison with traditional dredging.

4.4.4. Maintenance Dredging Operation Working Cycle

A linear decrease and increase can be observed in all the midpoint characterisation factors by varying the maintenance dredging operation working cycle from −50% to +50% in fuel consumption. What is interesting to note is that, through a percentage increase of 47.7%, the GWP100 impact of the maintenance dredging operation working cycle equalled the one of the ejectors plant.

5. Conclusions and Future Development

Sediment by-pass systems represent an exciting alternative to traditional maintenance dredging for sediment management in water bodies, especially in small harbours. The paper presents the first-of-a-kind analysis through environmental LCA of the ejectors plant technology, in which the sediment by-pass is realised through the application of the ejector, i.e., an innovative open-jet pump with a converging outlet.
The environmental LCA analysis shows that the ejectors plant generally has a lower impact (one or two orders of magnitude) than dredging on both midpoint and endpoint factors regarding terrestrial acidification, fine particulate matter formation and photochemical oxidant formation, independently from the energy scenario. In the case of climate change, the ejectors plant’s impact appears higher than that of dredging, but if the low-carbon energy scenario and the uncertainty about the dredging operation working cycle are considered, both the midpoint and endpoint GWP100 difference might be strongly affected, thus resulting in dredging values much lower than are traditional. The sensitivity analysis shows that ejectors plant lifetime and maintenance had a relatively low impact on the environmental LCA results.
A more detailed assessment of the environmental impact of the ejectors plant can be reached by including the environmental LCA manufacturing, transport and decommissioning phases, which were not included in this paper. Including these stages is essential to further reduce the impact of the technology through a re-design of the ejectors plant itself and the evaluation of the whole supply chain of the main components. Moreover, the comparison between the ejectors plant and maintenance dredging operation might be enhanced by simulating the impacts of different dredging planning on sedimentation, thus guaranteeing a more robust comparison between the two technologies.
Nevertheless, this paper’s results clearly demonstrate how the ejectors plant can be a much more environmentally friendly solution than dredging. This new finding can be added to the previous one regarding the ecological and economic benefits of the ejectors plant compared with dredging. Harbour and port operators should consider the ejectors plant, or more generally, sediment by-pass system, as an eco-friendly and sustainable solution alternative or complementary to traditional maintenance dredging.
Also, policy makers can benefit from this paper’s results for more effective and sustainable maritime spatial planning. The integration of ejectors plant technology into EU, national and regional maritime spatial planning strategies can contribute in the reduction in negative pressures on the marine environment produced during sediment management by dredging equipment. Alternative solutions to dredging should be included by policy makers in the sediment management plans of national and regional authorities, thus forcing public and private actors to take action against inefficient and environmentally harmful technologies.
Future research activities will focus on generalising the results in this paper to larger installations, i.e., for applications in industrial ports. A mix of on-field data and simulation is still needed to translate the results from an ejectors plant, like the Cervia demonstrator (10 ejectors), to a larger scale (from 50 to 100 ejectors), including longer distances to be covered from sedimentation to discharge area.

Author Contributions

Conceptualization, M.P. and C.S.; methodology, M.P.; software, M.P.; validation, C.S.; formal analysis, M.P.; investigation, M.P.; resources, C.S.; data curation, M.P.; writing—original draft preparation, M.P.; writing—review and editing, A.G. and C.S.; visualisation, M.P.; supervision, C.S.; project administration, M.P. and A.G.; funding acquisition, C.S. All authors have read and agreed to the published version of the manuscript.

Funding

This research was funded by the European Union through the LIFE Programme funds, “Marinaplan plus” Project Life15 ENV/IT/000391.

Institutional Review Board Statement

Not applicable.

Informed Consent Statement

Not applicable.

Data Availability Statement

The data presented in this study are available on request from the corresponding author. The data are not publicly available due to project embargo reasons.

Conflicts of Interest

The authors declare no conflicts of interest.

References

  1. Tadros, M.; Ventura, M.; Guedes Soares, C. Review of current regulations, available technologies, and future trends in the green shipping industry. Ocean. Eng. 2023, 280, 114670. [Google Scholar] [CrossRef]
  2. Li, G.; Ren, Y.; Jiang, C.; Wang, W.; Guo, Y. Coordinated evolution game of marine supply chain from the perspective of sustainable development based on system dynamics. Ocean. Coast. Manag. 2024, 254, 107195. [Google Scholar] [CrossRef]
  3. Wang, J.; Zhang, B.; Dai, Q.; Kong, Y. Vertical structure selection and evolution in shipping supply chains under bilateral bargaining. Expert. Syst. Appl. 2024, 238, 122032. [Google Scholar] [CrossRef]
  4. Gavalas, D. Does sustainability reporting affect firm performance? Evidence from the port sector. Marit. Technol. Res. 2024, 6, 266092. [Google Scholar] [CrossRef]
  5. Zhang, Z.; Song, C.; Zhang, J.; Chen, Z.; Liu, M.; Aziz, F.; Kurniawan, T.A.; Yap, P.S. Digitalization and innovation in green ports: A review of current issues, contributions and the way forward in promoting sustainable ports and maritime logistics. Sci. Total Environ. 2024, 912, 169075. [Google Scholar] [CrossRef]
  6. Saha, R.C. Chattogram Port: A dedicated service institution to evolve the country boldly. Marit. Technol. Res. 2023, 5, 258294. [Google Scholar] [CrossRef]
  7. Okada, T.; Mito, Y.; Akiyama, Y.B.; Tokunaga, K.; Sugino, H.; Kubo, T.; Endo, T.; Otani, S.; Yamochi, S.; Kozuki, Y.; et al. Green port structures and their ecosystem services in highly urbanized Japanese bays. Coast. Eng. J. 2021, 63, 310–322. [Google Scholar] [CrossRef]
  8. Gerlitz, L.; Meyer, C. Small and medium-sized ports in the TEN-T network and nexus of Europe’s twin transition: The way towards sustainable and digital port service ecosystems. Sustainaibility 2021, 13, 4386. [Google Scholar] [CrossRef]
  9. Polrot, A.; Kirby, J.R.; Birkett, J.W.; Jenkinson, I.; Sharples, G.P. Steps towards the sustainable management of sediment in ports and harbours. In Towards Coastal Resilience and Sustainability, 1st ed.; Heidkamp, C.P., Morrissey, J., Eds.; Taylor & Francis Group: London, UK, 2018; Volume 16, pp. 258–271. [Google Scholar] [CrossRef]
  10. Wang, X.H.; Andutta, F.P. Sediment transport dynamics in ports, estuaries and other coastal environments. In Sediment Transport Processes and Their Modelling Applications, 1st ed.; Manning, A.J., Ed.; InTech: London, UK, 2013; Volume 1, pp. 1–34. [Google Scholar] [CrossRef]
  11. Saengsupavanich, C.; Yun, L.S.; Lee, L.H.; Sanitwong-Na-Ayutthaya, S. Intertidal intercepted sediment at jetties along the Gulf of Thailand. Front. Mar. Sci. 2022, 9, 970592. [Google Scholar] [CrossRef]
  12. Saengsupavanich, C.; Rif’atin, H.Q.; Magdalena, I.; Ariffin, E.H. A systematic review of jetty-induced downdrift coastal erosion management. Reg. Stud. Mar. Sci. 2024, 74, 103523. [Google Scholar] [CrossRef]
  13. European Sea Ports Organisation. ESPO Green Guide 2021—A Manual for European Ports towards a Green Future. 2021. Available online: https://www.espo.be/media/ESPO%20Green%20Guide%202021%20-%20FINAL.pdf (accessed on 10 June 2024).
  14. Sarma, K.G.S. Siltation and coastal erosion at shoreline harbours. Procedia Eng. 2015, 116, 12–19. [Google Scholar] [CrossRef]
  15. Bray, R.N.; Bates, A.D.; Land, J.M. Dredging—A Handbook for Engineers, 2nd ed.; Butterworth-Heinemann: Oxford, UK, 1996. [Google Scholar] [CrossRef]
  16. Newell, R.C.; Seiderer, L.J.; Hitchcock, D.R. The impact of dredging works in coastal waters: A review of the sensitivity to disturbance and subsequent recovery of biological resources on the sea bed. Oceanogr. Mar. Biol. 1998, 36, 127–178. [Google Scholar]
  17. Palmer, M.A.; Covich, A.P.; Lake, S.; Biro, P.; Brooks, J.J.; Cole, J.; Dahm, C.; Gibert, J.; Goedkoop, W.; Martnes, K.; et al. Linkages between aquatic sediment biota and life above sediments as potential drivers of biodiversity and ecological processes: A disruption or intensification of the direct and indirect chemical, physical, or biological interactions between aquatic sediment biota and biota living above the sediments may accelerate biodiversity loss and contribute to the degradation of aquatic and riparian habitats. BioScience 2000, 50, 1062–1075. [Google Scholar] [CrossRef]
  18. Torres, R.J.; Abessa, D.M.S.; Santos, F.C.; Maranho, L.A.; Davanso, M.B.; do Nascimento, M.R.L.; Mozeto, A.A. Effects of dredging operations on sediment quality: Contaminant mobilization in dredged sediments from the Port of Santos, SP, Brazil. J. Soils Sediments 2009, 9, 420–432. [Google Scholar] [CrossRef]
  19. Su, S.H.; Pearlman, L.C.; Rothrock, J.A.; Iannuzzi, T.J.; Finley, B.L. Potential long-term ecological impacts caused by disturbance of contaminated sediments: A case study. Environ. Manag. 2002, 29, 234–249. [Google Scholar] [CrossRef]
  20. Goncalves Castro, M.B.; Ooijens, S.; Van Ingen, L.W. Approaching emissions in dredging. Terra Aqua 2014, 137, 19–26. [Google Scholar]
  21. Mink, F.; Dirks, W.; Van Raalte, G.; De Vlieger, H.; Russell, M. Impact of European union environmental law on dredging. Terra Aqua 2006, 104, 3–10. [Google Scholar]
  22. Nicholson, S.; Szewczyk, E. Regulation and management of marine aggregate dredging in England. Terra Aqua 2022, 168, 28–37. [Google Scholar]
  23. Goncalves Castro, M.B.; Mestemaker, B.T.W.; Van Den Heuvel, H. Towards zero emission work vessels: The case of a dredging vessel. In Proceedings of the 2nd International Conference on Modelling and Optimisation of Ship Energy Systems (MOSES), Glasgow, UK, 8 May 2019. [Google Scholar]
  24. Ban, D.; Bebic, J. An introduction of future fuels on working ship for GHGs reduction: Trailing suction hopper dredger case study. J. Clean. Prod. 2023, 405, 137008. [Google Scholar] [CrossRef]
  25. Herman, P.M.J.; Simeon Moons, J.J.; Wijsman, J.W.M.; Luijendijk, A.P.; Ysebaert, T. A mega-nourishment (Sand Motor) affects landscape diversity of subtidal benthic fauna. Front. Mar. Sci. 2021, 8, 643674. [Google Scholar] [CrossRef]
  26. Bianchini, A.; Cento, F.; Guzzini, A.; Pellegrini, M.; Saccani, C. Sediment management in coastal infrastructures: Techno-economic and environmental impact assessment of alternative technologies to dredging. J. Environ. Manag. 2019, 15, 109332. [Google Scholar] [CrossRef]
  27. Memos, C.; Chiavaccini, P.; Dornhelm, R.; Hoekstra, R.; Inglis, P.; Sannasiraj, S.A.; Stoschek, O.; Willemsen, A.; Mink, E.; Sundar, V. Report n°130-2015 - Anti-Sedimentation Systems for Marinas and Yacht Harbours; PIANC Secrétariat Général: Bruxelles, Belgium, 2015; ISBN 978-2-87223-227-7. [Google Scholar]
  28. Kirichek, A.; Cronin, K.; de Wit, L.; van Kessel, T. Advances in maintenance of ports and waterways: Water injection dredging. In Sediment Transport—Recent Advances, 1st ed.; Wallingford, H.R., Ed.; InTech: London, UK, 2022; Volume 6, pp. 1–20. [Google Scholar] [CrossRef]
  29. Bruun, P. Navigation and sand bypassing at inlets: Technical management and cost aspects. J. Coast. Res. 1996, 23, 113–119. [Google Scholar]
  30. Pellegrini, M.; Guzzini, A.; Saccani, C. Techno-economic assessment of the innovative ejectors plant technology for sediment management in harbours. J. Soils Sediments 2022, 22, 2844–2852. [Google Scholar] [CrossRef]
  31. Mikac, B.; Abbiati, M.; Adda, M.; Colangelo, M.A.; Desiderato, A.; Pellegrini, M.; Saccani, C.; Turicchia, E.; Ponti, M. The environmental effects of the innovative ejectors plant technology for the eco-friendly sediment management in harbors. J. Mar. Sci. Eng. 2022, 10, 182. [Google Scholar] [CrossRef]
  32. Pellegrini, M.; Abbiati, M.; Bianchini, A.; Colangelo, M.A.; Guzzini, A.; Mikac, B.; Ponti, M.; Preda, G.; Saccani, C.; Willemsen, A. Sustainable sediment management in coastal infrastructures through an innovative technology: Preliminary results of the MARINAPLAN PLUS LIFE project. J. Soils Sediments 2020, 20, 2685–2696. [Google Scholar] [CrossRef]
  33. Pellegrini, M.; Aghakhani, A.; Gaeta, M.G.; Archetti, R.; Guzzini, A.; Saccani, C. Effectiveness assessment of an innovative ejector plant for port sediment management. J. Mar. Sci. Eng. 2021, 9, 197. [Google Scholar] [CrossRef]
  34. ISO 14040:2006; Environmental Management—Life Cycle Assessment—Principles and Framework. ISO: Geneva, Switzerland, 2006.
  35. ISO 14044:2006; Environmental Management—Life Cycle Assessment—Requirements and Guidelines. ISO: Geneva, Switzerland, 2006.
  36. Jocanovic, M.; Agarski, B.; Karanovic, V.; Orosnjak, M.; Ilic Micunovic, M.; Ostojic, G.; Stankovski, S. LCA/LCC model for evaluation of pump units in water distribution systems. Symmetry 2019, 11, 1181. [Google Scholar] [CrossRef]
  37. Islam, S.; Ponnambalan, S.G.; Lam, H.L. Review on life cycle inventory: Methods, examples and applications. J. Clean. Prod. 2016, 136, 266–278. [Google Scholar] [CrossRef]
  38. Erumban, A.A. Lifetimes of machinery and equipment: Evidence from Dutch manufacturing. Rev. Income Wealth 2008, 54, 237–268. [Google Scholar] [CrossRef]
  39. Nini, B.; Adne, C.; Terje, S.; Steinar, T.; Thom, A. Expected service lives and depreciation profiles for capital assets: Evidence based on a survey of Norwegian firms. J. Econ. Soc. Meas. 2016, 41, 329–369. [Google Scholar] [CrossRef]
  40. EC-JRC. ILCD Handbook: Recommendations for Life Cycle Impact Assessment in the European Context for the Choice of the Impact Categories; Publication Office of the European Commission: Luxemburg, 2011. [Google Scholar]
  41. EC-JRC. Characterisation Factors of the ILCD Recommended Life Cycle Impact Assessment Methods and EC-JRC; Publication Office of the European Commission: Luxemburg, 2012. [Google Scholar]
  42. JRC TR. Supporting Information to the Characterisation Factors of Recommended EF Life Cycle Impact Assessment Method for the Attribution of the Characterization Factors; European Commission, Ispra: Rome, Italy, 2018. [Google Scholar]
  43. Huijbregts, M.A.J.; Steinmann, Z.J.N.; Elshout, P.M.F.; Stam, G.; Verones, F.; Vieira, M.D.M. ReCiPe 2016—A Harmonized Life Cycle Impact Assessment Method at Midpoint and Endpoint Level—Report I: Characterization; National Institute for Public Health and the Environment, RIVM: Bilthoven, The Netherlands, 2016. [Google Scholar]
  44. Huijbregts, M.A.J.; Steinmann, Z.J.N.; Elshout, P.M.F.; Stam, G.; Verones, F.; Vieira, M.D.M.; Zijp, M.; Hollander, A.; van Zelm, R. ReCiPe2016: A harmonised life cycle impact assessment method at midpoint and endpoint level. Int. J. Life Cycle Assess. 2017, 22, 138–147. [Google Scholar] [CrossRef]
  45. Van Zelm, R.; Roy, P.O.; Hauschild, M.Z.; Huijbregts, M.A.J. Acidification. In Life Cycle Impact Assessment, 1st ed.; Hauschild, M., Huijbregts, M., Eds.; Springer: Dordrecht, the Netherlands; Berlin, Germany, 2015. [Google Scholar] [CrossRef]
  46. WHO. Health Risks of Particulate Matter from Long-Range Transboundary Air Pollution. 2006. Available online: https://iris.who.int/bitstream/handle/10665/107691/E88189.pdf?sequence=1 (accessed on 10 June 2024).
  47. Ferrans, L.; Nilsson, A.; Schmieder, F.; Pal, D.; Rahmati-Abkenar, M.; Marques, M.; Hogland, W. Life cycle assessment of management scenarios for dredged sediments: Environmental impacts caused during landfilling and soil conditioning. Sustainability 2022, 14, 13139. [Google Scholar] [CrossRef]
  48. Pasciucco, F.; Pecorini, I.; Di Gregorio, S.; Pilato, F.; Iannelli, R. Recovery strategies of contaminated marine sediments: A life cycle assessment. Sustainability 2021, 13, 8520. [Google Scholar] [CrossRef]
  49. Goncalves Castro, M.B.; Holtkamp, M.J.; Vercruijsse, P.M.; van der Blom, E.C.; van Woerden, D. Using life cycle analysis methodology to assess the sustainability of dredging equipment and its manufacturing processes. In Proceedings of the CEDA Dredging Days 2011: Dredging and Beyond, Rotterdam, the Netherlands, 10 November 2011. [Google Scholar]
  50. Murakami, S.; Oguchi, M.; Tasaki, T.; Daigo, I.; Hashimoto, S. Lifespan of commodities, Part I—The creation of a database and its review. J. Ind. Ecol. 2010, 14, 598–612. [Google Scholar] [CrossRef]
  51. Potrč Obrecht, T.; Jordan, S.; Legat, A.; Passer, A. The role of electricity mix and production efficiency improvements on greenhouse gas (GHG) emissions of building components and future refurbishment measures. Int. J. Life Cycle Assess. 2021, 26, 839–851. [Google Scholar] [CrossRef]
  52. Faria, R.; Marques, P.; Moura, P.; Freire, F.; Delgado, J.; de Almeida, A.T. Impact of the electricity mix and use profile in the life-cycle assessment of electric vehicles. Renew. Sust. Energ. Rev. 2013, 24, 271–287. [Google Scholar] [CrossRef]
  53. Available online: https://support.ecoinvent.org/ecoinvent-version-3.7.1 (accessed on 10 June 2024).
  54. IPPC. 2019 Refinement to the 2006 IPCC Guidelines for National Greenhouse Gas Inventories. 2019. Available online: https://www.ipcc.ch/report/2019-refinement-to-the-2006-ipcc-guidelines-for-national-greenhouse-gas-inventories/ (accessed on 10 June 2024).
  55. World Steel Association. Steel Statistical Yearbook 2019. 2019. Available online: http://srvcalidad.mincomercio.gov.co/Practicas-Comerciales/Mincomercio/ED-215-49-110_perfiles%20en%20LyU_publico_T10.pdf (accessed on 10 June 2024).
  56. Available online: https://ec.europa.eu/eurostat/statistics-explained/index.php?title=Air_pollution_statistics_-_emission_inventories (accessed on 10 June 2024).
  57. European Aluminium Association. Environmental Profile Report. 2018. Available online: https://european-aluminium.eu/wp-content/uploads/2023/01/European-Aluminium_Environmental-Profile-Report-2018_full-version.pdf (accessed on 10 June 2024).
  58. Terna. General Data. 2018. Available online: https://download.terna.it/terna/2018_Eng_1-GENERAL_DATA_8d8d35ce7ff3424.pdf (accessed on 10 June 2024).
  59. GSE. Complementary Energy Mix. 2021. Available online: https://www.gse.it/servizi-per-te/fonti-rinnovabili/fuel-mix/documenti (accessed on 10 June 2024).
  60. ISPRA. Italian Emission Inventory 1990–2021; Ispra: Rome, Italy, 2023. [Google Scholar]
  61. EMEP; EEA. EMEP/EEA Air Pollutant Emission Inventory Guidebook 2019—1.A.3.d.i, 1.A.3.d.ii, 1.A.4.c.iii; Publications Office of the European Union: Luxemburg, 2019. [Google Scholar]
  62. Paipa Sanabria, E.; Orozco-Lopez, M.B.; Escalante-Torres, F.; Camargo-Diaz, C.P.; Zapata-Cortes, J.A. Exploring the landscape of eco-innovation: A bibliometric analysis of concepts and trends in the manufacturing and shipbuilding industries. Sustainability 2024, 16, 5188. [Google Scholar] [CrossRef]
Figure 1. Aerial picture of Cervia Harbour. The downdrift side is on the left of the image.
Sustainability 16 07809 g001
Figure 2. Schematisation of the ejector’s components and working principle.
Sustainability 16 07809 g002
Figure 3. Ejectors plant layout in Cervia demonstrator. The layout is schematised over a bathymetric map in which numbers have been made unreadable for confidential reasons. The black dots represent the ejectors, the red lines represent the water feeding and discharge pipelines and the green area is a qualitative indication of the ejectors’ influence area.
Sustainability 16 07809 g003
Figure 4. Aerial view of the technical cabin.
Sustainability 16 07809 g004
Figure 5. LCA system boundaries.
Sustainability 16 07809 g005
Figure 6. Simplified P&ID of the ejectors plant demonstrator. Only one ejector water feeding line is shown in the manifold to avoid complex drawing, while each currently has five water feeding lines connected.
Sustainability 16 07809 g006
Figure 7. Qualitative comparison between ejectors plant, traditional maintenance dredging and a new maintenance operation working cycle able to guarantee navigability over time. The figure includes (a) a qualitative monthly variation of sedimentation rate; (b) water depth vs. navigability limit for the ejectors plant; (c) water depth vs. navigability limit for traditional maintenance dredging operation, i.e., seasonal dredging; and (d) water depth vs. navigability limit for a new maintenance dredging operation working cycle.
Sustainability 16 07809 g007
Figure 8. Grab dredger in operation at the Cervia Harbour inlet before installing the ejectors plant.
Sustainability 16 07809 g008
Figure 9. Impact of ejectors plant lifetime on yearly midpoint characterisation factors.
Sustainability 16 07809 g009
Figure 10. Impact of ejectors plant maintenance on midpoint characterisation factors.
Sustainability 16 07809 g010
Figure 11. Impact of construction and operation phases of the ejectors’ plant on the characterisation factors considered in this paper. The energy scenario is the mid-carbon one.
Sustainability 16 07809 g011
Figure 12. Impact of materials consumption in the construction phase on the characterisation factors considered in this paper.
Sustainability 16 07809 g012
Figure 13. Impact on midpoint GWP100, PMFP, HOFP, TAP and EOFP of ejectors plant and maintenance dredging. GWP100 is measured in kilograms of CO2 in the air, PMFP in kilograms of PM2.5 in the air, EOFP and HOFP in kilograms of NOx in the air and TAP in kilograms of SO2 in the air.
Sustainability 16 07809 g013
Figure 14. Impact on endpoint HOFP, TAP, EOFP and GWP100 of ejectors plant and maintenance dredging. The effect of the ejectors plant is evaluated by considering the mid-carbon energy consumption scenario. DALY is measured in years, while PDF is measured in species·year.
Sustainability 16 07809 g014
Figure 15. Impact on endpoint GWP100 and PMFP of ejectors plant and maintenance dredging. The effect of the ejectors plant is evaluated by considering the mid-carbon energy consumption scenario. DALY is measured in years.
Sustainability 16 07809 g015
Figure 16. Impact of construction and operation phases of the ejectors plant on the characterisation factors considered in this paper. The energy scenario is the low-carbon one.
Sustainability 16 07809 g016
Figure 17. Impact on midpoint GWP100, PMFP, HOFP, TAP and EOFP of ejectors plant and maintenance dredging. GWP100 is measured in kilograms of CO2 in the air, PMFP in kilograms of PM2.5 in the air, EOFP and HOFP in kilograms of NOx and TAP in kilograms of SO2 in the air. The two different electricity mix scenarios are compared.
Sustainability 16 07809 g017
Table 1. Overview of the midpoint categories and characterisation factor (CF) according to ReCiPe2016.
Impact CategoryIndicatorCFmAbbr.Unit
Climate changeInfra-red radiative forcing increaseGlobal warming potentialGWPkg CO2 to air
Fine particulate matter formationPM2.5 population intake increaseParticulate matter formation potentialPMFPkg PM2.5 to air
Photochemical oxidant formation:
ecosystem quality
Photochemical oxidant formation:
ecosystem quality
Photochemical oxidant formation potential:
ecosystems
EOFPkg NOx to air
Photochemical oxidant formation:
human health
Tropospheric ozone population intake increase (M6M)Photochemical oxidant formation potential:
humans
HOFPkg NOx to air
Terrestrial acidificationProton increase in natural soilsTerrestrial acidification potentialTAPkg SO2 to air
Table 2. Overview of the endpoint categories according to ReCiPe2016.
Area of ProtectionEndpointAbbr.NameUnit
Human healthDamage to human healthHHDisability-adjusted loss of life yearsyear
Natural environmentDamage to ecosystem qualityEDTime-integrated species lossspecies·yr
Resource scarcityDamage to resource availabilityRASurplus costEuro
Table 3. Impact categories and related emissions.
ImpactEmissions
Climate ChangeCO2
Terrestrial AcidificationNOx
SOx
Fine Particulate Matter FormationPM2.5
SOx
Photochemical Oxidant FormationNOx
NMVOC
Table 4. Characteristics of the grab dredger and mean diesel consumption of each main motorised component.
ItemCharacteristicsMean Diesel Consumption
N°2 propeller engines381 Hp (284 kW) each117.8 L/h each
N°1 grab crane engine291 Hp (217 kW)31.5 L/h
N°4 pumps6000 L/min, 75 kW each14.2 L/h each
Grab capacity3 m3-
Hold300 m3-
Speed16.7 km/h (9 knots)-
Table 5. List of assumptions and the related references.
AssumptionReferences
Components manufacturing, transport and assembly are neglected in the ejectors plant environmental LCA and comparison with maintenance dredging.[36,49]
Ejectors plant has a lifetime of 20 years[38,47]
Inverters, pumps and brackets have a lifetime of 10 years[38,39]
Substitution of 5 m per year of underwater pipeline[30]
Ejector plant yearly energy consumption of 252,000 kWh[30]
Definition of a dredging working cycle able to guarantee navigability over the year[30,33]
Table 6. Summary of all the materials used to realise the Cervia ejectors plant.
MaterialsWeight (kg)Weight (%)
High-density polyethylene (HDPE)1016.22.9
Polyvinyl chloride (PVC)7242.220.7
Polyaryletherketone (PAEK)44.30.1
Polypropylene (PP)620.11.8
Stainless steel (AISI 316)1268.33.6
Steel8588.924.6
Cast iron63.50.2
Aluminium217.90.6
Glass528.01.5
Wood1360.03.9
Copper4007.811.5
Concrete10,000.028.6
Total weight34,957.1100.0
Table 7. Emission factors (measured by kilograms of emission per kilogram of material) for processing the materials used to realise the ejectors plant.
MaterialsCO2SOXNOxPM2.5NMVOCReferences
HDPE1.80.0010.0020.00030.003[53]
PVC1.90.00120.0030.00040.004[53,54]
PAEK2.20.00140.00250.00050.0035[53]
PP1.70.0010.0020.00030.003[53]
Stainless steel6.80.0020.0060.0010.008[55]
Steel 2.30.0010.0030.00050.004[55]
Cast iron2.10.0010.00280.00040.0038[53,56]
Aluminium11.00.0040.0080.0020.010[57]
Glass1.50.0010.0020.00030.003[53,54]
Wood0.90.00050.0010.00010.0015[53,54]
Copper5.50.0020.0040.0010.005[56]
Concrete0.80.00030.00050.00050.0008[53,54]
Table 8. Emission factors (measured by grams of emission per kilowatt-hours of gross energy produced) for electricity consumption in the mid-carbon scenario.
CO2SO2NOxPM2.5NMVOC
3300.1018 0.0475 0.02000.0046
Table 9. Summary of the materials used to repair or substitute damaged or worn components during ejectors plant lifetime.
MaterialsWeight (kg)Weight (%)
PVC169.533.1
Stainless steel336.465.7
Copper6.01.2
Total weight511.9100.0
Table 10. Summary of the impacts on emissions of the different phases of ejectors plant LCA during the 20-year lifetime.
BoundarySourceCO2 (kg)SO2 (kg)NOx (kg)PM2.5 (kg)NMVOC (kg)
ConstructionMaterials79,70834.783.914.2112.6
OperationEnergy1,663,200513.2239.5100.723.3
Materials26430.92.60.43.4
Total1,745,551548.8325.9115.3139.3
Table 11. Results of the characterisation model for the ejectors plant at the midpoint level for the mid-carbon energy scenario.
Impact CategoriesCharacterisation
Factor
Measuring
Unit
Value
Climate changeGWP100kg CO2 to air1,745,551
Terrestrial
acidification
TAPkg SO2 to air666.1
Fine particulate
matter formation
PMFPkg PM2.5 to air274.5
Photochemical
oxidant formation:
Human health
HOFPkg NOx to air351.0
Photochemical
oxidant formation:
ecosystem quality
EOFPkg NOx to air366.3
Table 12. Results of the characterisation model for the ejectors plant at the endpoint level for the mid-carbon energy scenario. DALY: disability-adjusted life years. PDF: potentially disappeared fraction of species.
Impact CategoriesArea of
Protection
Measuring
Unit
Value
Climate changeHH-DALYyears1.62
ED-PDFspecies·year0.005
Terrestrial
acidification
ED-PDFspecies·year0.0001
Fine particulate
matter formation
HH-DALYyears0.173
Photochemical
oxidant formation:
Human health
HH-DALYyears0.0003
Photochemical
oxidant formation:
ecosystem quality
ED-PDFspecies·year0.00005
Table 13. Tier 1 default emission factors [61] for marine diesel oil/marine gas oil (MDO/MGO). The density of MDO/MGO is 0.85 kg/l.
Emission Factor (kg/ton)
CO2SO2NOxPM2.5NMVOC
31602078.51.42.8
Table 14. Results of the characterisation model for the maintenance dredging plan at the midpoint level.
Impact CategoriesCharacterisation
Factor
Measuring
Unit
Value
Climate changeGWP100kg CO2 to air1,181,922
Terrestrial
acidification
TAPkg SO2 to air18,050
Fine particulate
matter formation
PMFPkg PM2.5 to air2693
Photochemical
oxidant formation:
Human health
HOFPkg NOx to air29,550
Photochemical
oxidant formation:
Ecosystem quality
EOFPkg NOx to air29,665
Table 15. Results of the characterisation model for the maintenance dredging plan at the endpoint level. DALY: disability-adjusted life years. PDF: potentially disappeared fraction of species.
Impact CategoriesArea of
Protection
Measuring
Unit
Value
Climate changeHH-DALYyears1.10
ED-PDFspecies·year0.0033
Terrestrial
acidification
ED-PDFspecies·year0.0038
Fine particulate
matter formation
HH-DALYyears1.697
Photochemical
oxidant formation:
Human health
HH-DALYyears0.027
Photochemical
oxidant formation:
Ecosystem quality
ED-PDFspecies·year0.0039
Table 16. Results of the characterisation model for the ejectors plant at the midpoint level for the low-carbon-energy scenario.
Impact CategoriesCharacterisation
Factor
Measuring
Unit
Value
Climate changeGWP100kg CO2 to air165,511
Terrestrial
acidification
TAPkg SO2 to air96.6
Fine particulate
matter formation
PMFPkg PM2.5 to air37.4
Photochemical
oxidant formation:
Human health
HOFPkg NOx to air119.5
Photochemical
oxidant formation:
Ecosystem quality
EOFPkg NOx to air132.4
Disclaimer/Publisher’s Note: The statements, opinions and data contained in all publications are solely those of the individual author(s) and contributor(s) and not of MDPI and/or the editor(s). MDPI and/or the editor(s) disclaim responsibility for any injury to people or property resulting from any ideas, methods, instructions or products referred to in the content.

