Abstract
Examining urban growth in metropolitan areas from both morphological and functional perspectives is paramount for sustainable development in developing and developed countries. As a collaborative and critical approach, polycentrism operates concurrently at local, regional, and national levels. However, the decentralized morphologies and functional attributes of polycentric urban spaces are yet to be adequately explored, despite their significant influence on sustainable urban planning and management. Colombo, the only metropolitan area in Sri Lanka, has experienced considerable yet ambiguously imbalanced spatial growth due to insufficient data. This study employed time-series satellite imagery from 1988 to 2022, in conjunction with a network model, to elucidate Colombo’s uneven urban patterns, while achieving an accuracy of over 80% throughout the period. The results revealed that the metropolis has evolved into a polynuclear city, complicating the identification of centers and their corresponding developmental stages. Nevertheless, the study successfully pinpointed the morphological and functional Grama Niladhari divisions, disclosing the morphological features of centralized dispersion and the functional traits of decentralized concentration. These insights provide significant implications for local government, guiding urban planning initiatives to achieve sustainable development goals.
1. Introduction
The rapid rise in urbanization over the past few decades has been attributed to expanding opportunities and globalization [1]. According to the United Nations Department of Economic and Social Affairs [2], 68 percent of the global population is projected to reside in urban areas by 2050 [3]. Increase of urban growth results in urban activities alters the spatial organization of cities, including metropolitan areas [4]. Identifying the historical evolution of spatial structures and their current status [5] is crucial for the development of urban areas, leading towards sustainable cities [6]. During different eras, varying levels of urban development can be seen due to policies implemented and other local factors. However, in the field of urban development, the spatial organization in most cities has evolved from monocentric to polycentric [7].
In general, a monocentric spatial structure has a dominant city that acts as the core, influencing the development of surrounding cities [8]. In contrast, a polycentric spatial structure involves several cities sharing the functions of a core city [5,7]. In a polycentric structure, other cities are interconnected with core city by transportation networks [9]. The concept of polycentricity has its roots in the early 20th century, with initial ideas proposed by Burgess (1925), as cited in [10], and Harris and Ullman (1945) [10,11]. Despite these early contributions, monocentric models remained more prevalent. It was not until after the 1960s that polycentricity began to attract significant attention, leading to the development of various models and theories [12]. A notable contribution came from Garreau (1991) [11], who introduced the concept of “edge cities” to describe emerging urban areas located at major freeway interchanges. In 1996, Krugman offered a theoretical framework to explain the development of polycentric structures, focusing on the economic interactions among firms influenced by both centripetal and centrifugal forces [11,13]. Anas and Kim (1996) further expanded on this by creating a computable general equilibrium model. Numerous empirical studies, including Anas’s comprehensive study of polycentric cities in the United States [14,15], have since been conducted.
Today, most developed and developing countries have polycentric cities [16]. Cities in Australia and Saudi Arabia [17], and those in Europe [18], the United Kingdom [19], the United States [20], and the Netherlands [19] paid attention to polycentric spatial structures. In many of these developed nations, planning towards polycentric structures encourages the decentralization of urbanization. In contrast, developing nations especially in South Asia, are also paying attention to polycentric structures, as seen in India [21], Bangladesh [22], and Nepal [23]. However, while developing countries exhibit this trend, it often has negative implications [24]. In developed nations, polycentric development primarily aims to generate employment in sub-centers, whereas in developing countries, it typically leads to the expansion of built-up areas [17,25]. In summary, countries with urban sprawl exhibit polycentric development, but it may significantly deviate from international standards. Despite substantial urban expansion in South Asia, Sri Lanka [26] has a notable gap in understanding how these trends manifest.
Sri Lanka is an island in the Indian Ocean, and Sri Lankan cities also experienced urban spawl at unprecedented rate from 1990 [27], including the nation’s capital city, Colombo. Sri Lanka currently stands at an urban paradox with regard to urbanization [28]. The country demonstrates an urban sprawl [3], in which the expansion rate of urban areas exceeds the population growth rate. This is due to the un-planned city development strategies within the country and resulting population concentration around city centers. Assembling all the economic activities and working places in the city center is the most common characteristic of Sri Lankan cities [29].
There was an increasing trend of decentralization of Sri Lankan cities during the post-war era due to new under government policies and projects, [30]. The Colombo district, the main economic hub of the country generated 40% of Sri Lanka’s GDP in 2023, which is exceptionally high when compared with other 24 districts even though the district makes up only 5.7% of the country’s land area and 25% of its people [31]. However, the study area of this research, the Colombo Metropolitan Area (CMA), includes the Colombo district and 27% of the Western Province. Therefore, the factors discussed above regarding the Colombo District have significant relevance to the CMA. Nevertheless, there are still challenges with the way in which the CMA is now developing. For example, Colombo’s high-density developments are emerging on their own, regardless of the availability of infrastructure to sustain them, which causes a number of problems [28].
The identification of polycentricity within the Colombo Metropolitan Area is challenging due to insufficient local administrative data. Sri Lanka is divided into nine provinces, 25 districts, and 14,022 Grama Niladhari divisions, with the Grama Niladhari system being the smallest administrative unit responsible for local governance and data collection [32]. However, in Sri Lanka, such statistical variables are often not collected or are not in a suitable format for analysis. Therefore, conducting an ideal analysis of polycentricity is a challenging task using conventional methods. As a developing nation, Sri Lanka faces issues such as poor data availability, a lack of statistical data, and limited integration between local authorities [25,33]. Additionally, there are problems with the accuracy and consistency of boundaries for urban areas, cities, or towns over time.
Much of the research on polycentricity has concentrated on cities or metropolitan areas in developed nations, whereas rapidly growing cities in developing countries, such as Sri Lanka, have received comparatively little attention. Addressing the urban development of the Colombo Metropolitan Area (CMA) presents several challenges. To date, no study has thoroughly investigated the urban polycentricity of CMA or any other area in Sri Lanka. Traditionally, identifying polycentric cities has relied on statistical data, including census and socioeconomic. This study aims to address this gap by utilizing geographical information systems (GIS) and remote sensing (RS) [34] to identify polycentricity, focusing on both morphological and functional aspects. The study pays particular attention to morphological polycentricity, which refers to the geographical distribution of cities varying in size and development. The flows of people, information, or commuters are mainly considered in functional polycentricism.
In this study, polycentric urban development of the CMA is investigated by utilizing spatial analysis. The key objective is to explore the polycentricity in urbanization within the CMA. The aim of this study is to identify multiple cities within the CMA’s urban agglomeration and then, by applying spatial analysis, to differentiate morphological and functional centers. The results will provide insights into the urbanization process in the CMA and its implications for future urban planning and policy-making. Finally, this study seeks to contribute to a better understanding of urban expansion patterns in developing cities like the CMA and offer recommendations for more effective and sustainable urban management.
2. Materials and Methods
2.1. Study Area
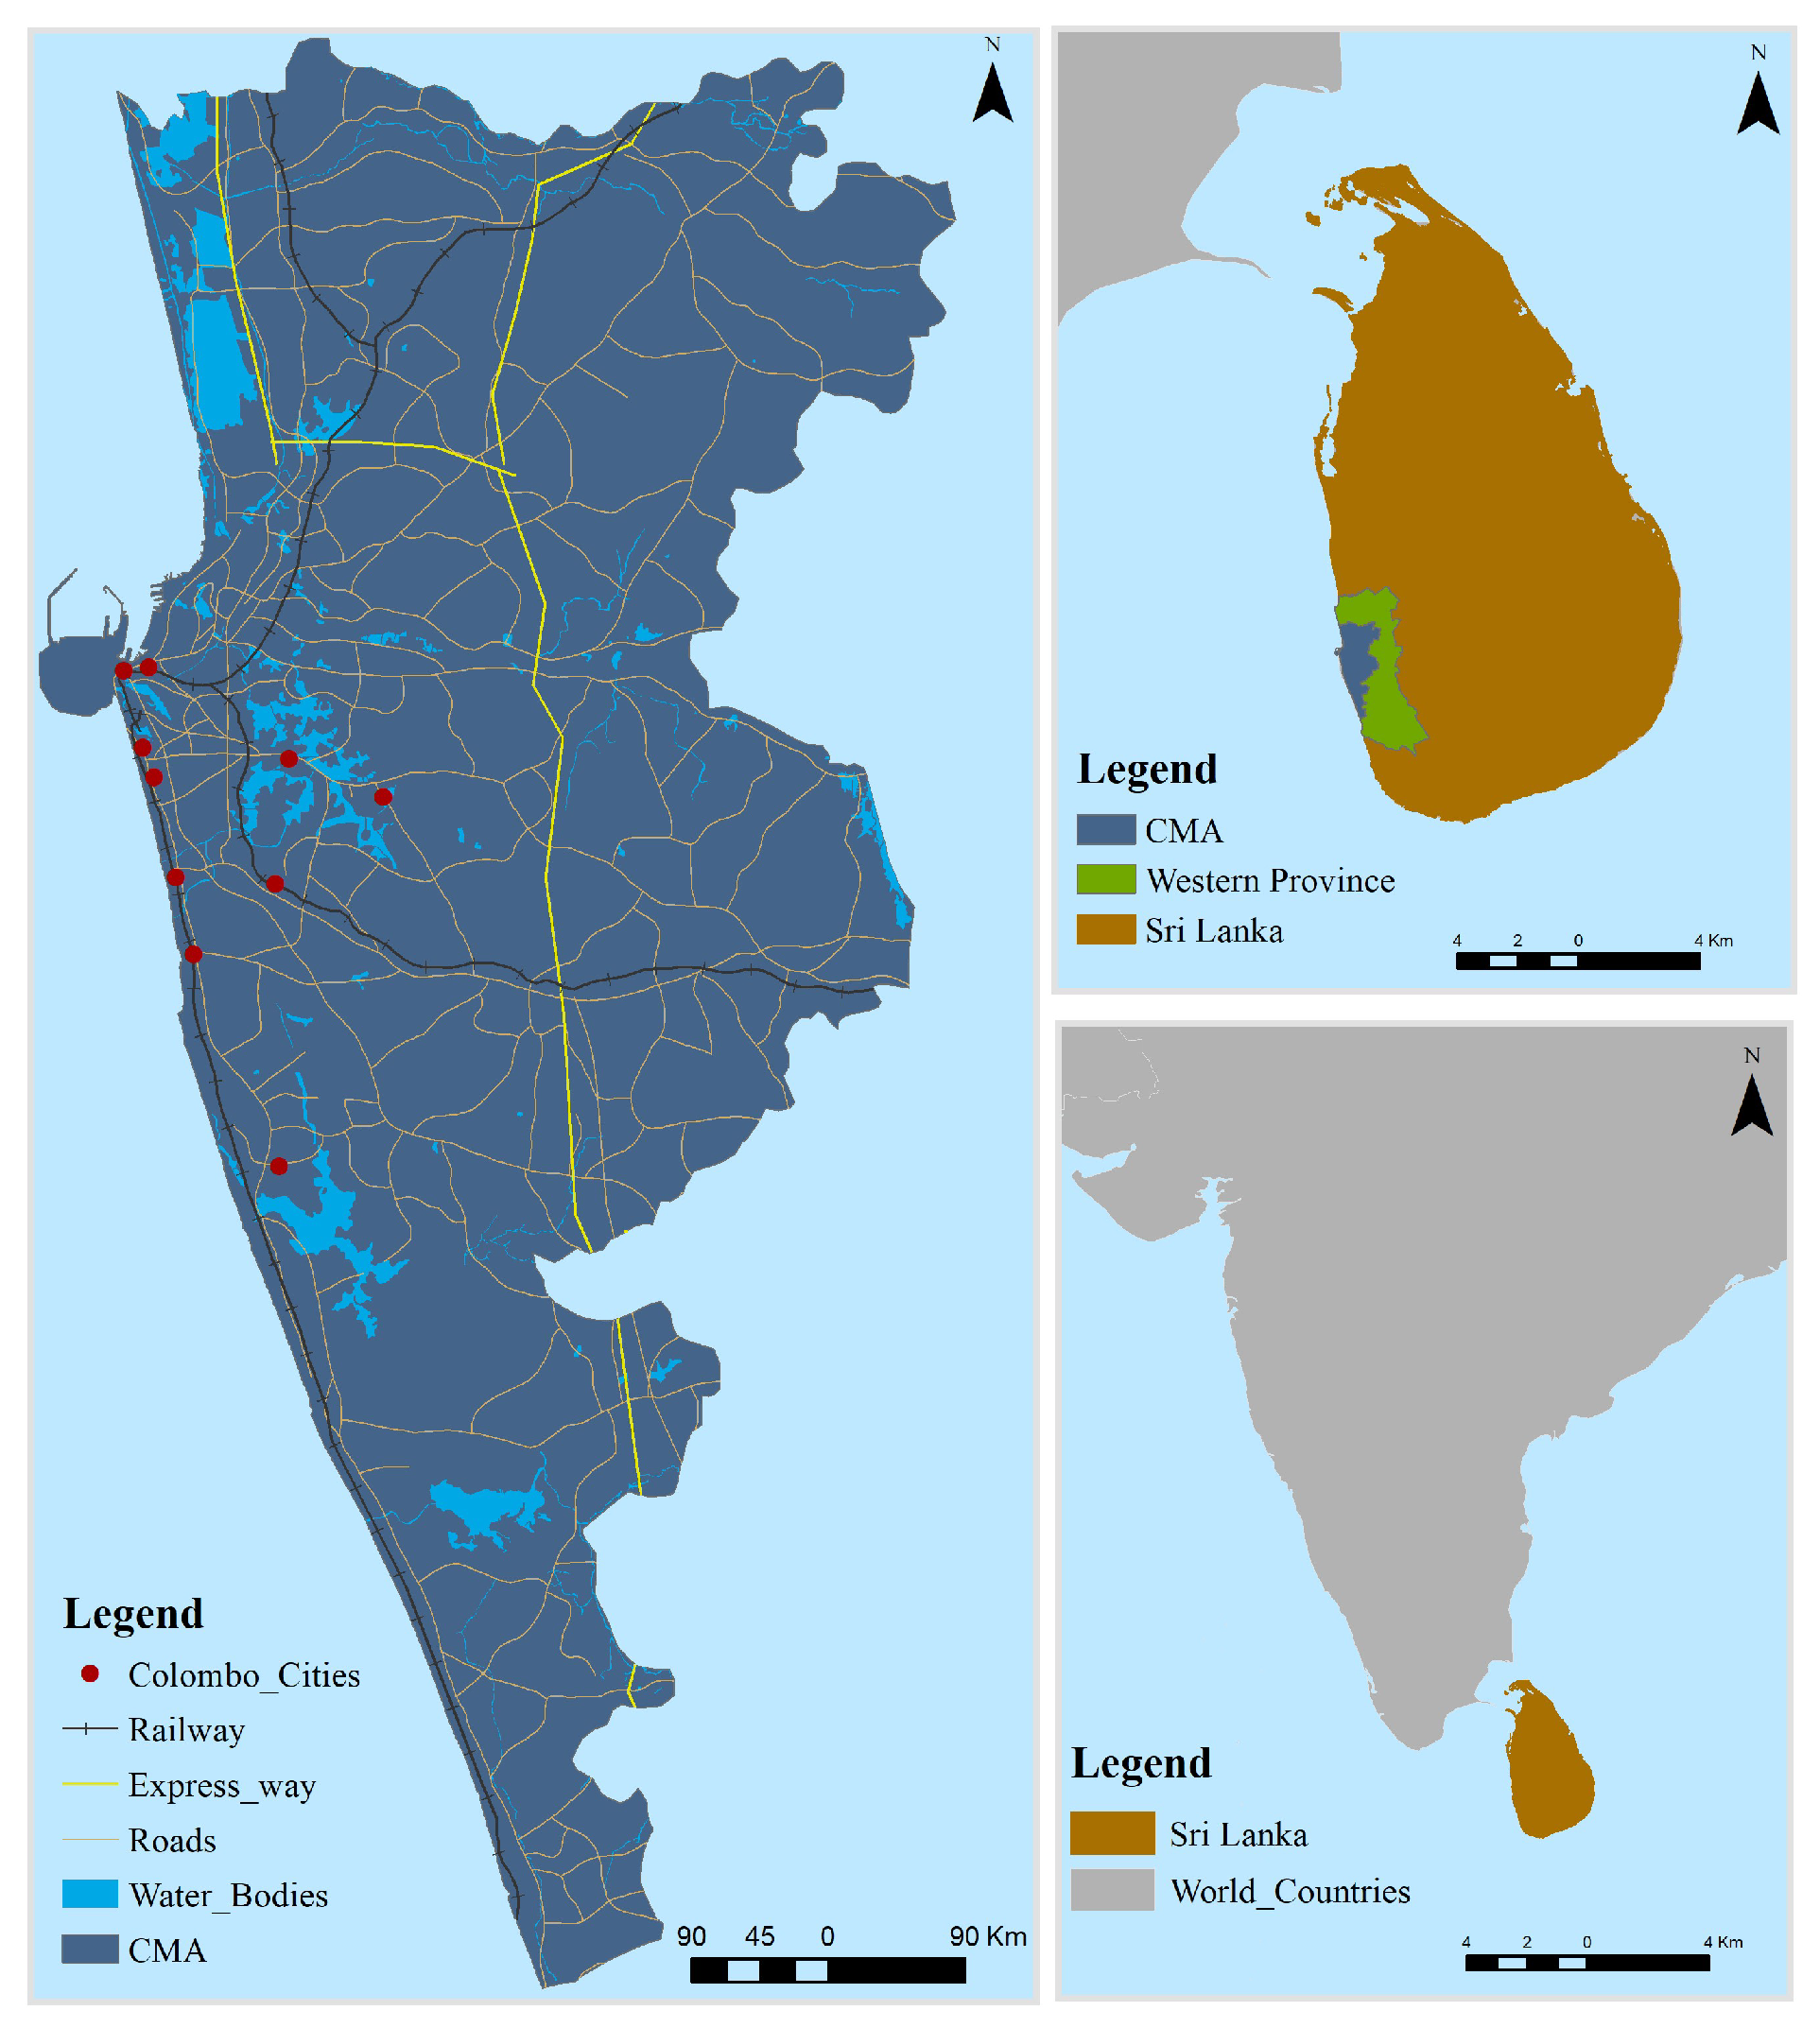
Colombo, the capital of Sri Lanka, is considered one of Asia’s emerging cities. Urbanization in Colombo has proliferated during the past few decades. After the Civil War, the city began implementing new development initiatives [35], especially during the last ten years. Colombo is generally a low-density city with large amounts of greenery and low-rise structures, but it contains densely packed medium-rise structures along the main thoroughfares. As shown in Figure 1, due to the limitations caused by natural boundaries, marshlands to the east, and the Indian Ocean to the west, the city has typically expanded along the national highways in a north–south orientation.
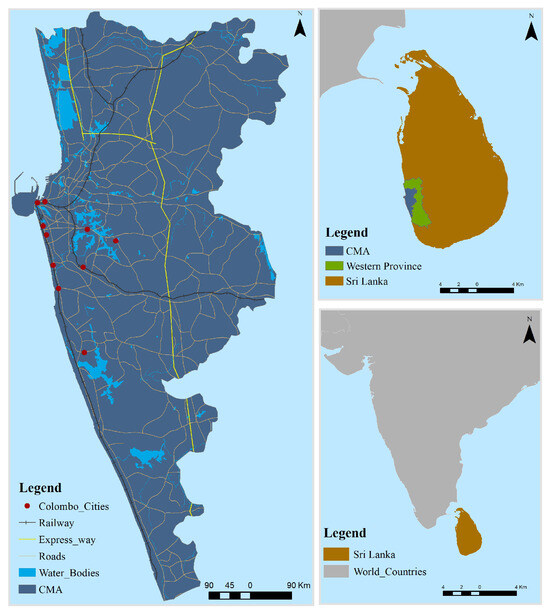
Figure 1.
Geographic location of the study area.
2.2. Data Sources
This study processed time-series Landsat data from 1998 to 2022 to obtain the urban land cover changes over the Colombo Metropolitan Area (the CMA). Landsat 5 Thematic Mapper (TM), Landsat 8 Operational Land Imager (OLI), and Thermal Infrared Sensor (TIRS) were utilized in this study. Landsat images have a spatial resolution of 30 m, providing adequate detail for analyzing urban land cover changes over large areas. The Landsat data were retrieved from the U.S. Geological Survey (USGS) website (Reston, VA, USA) at https://www.usgs.gov/ (accessed on 10 November 2022).
For analyzing polycentricity based on available data, several layers were utilized: the built-up layer, the road layer, composite function points, and administrative divisions published by the Survey Department of Sri Lanka. The composite function point’s layer includes shopping centers, administrative centers, schools, hospitals, banks, enterprises, and hotel locations, which were verified and updated using Google Earth Pro Version 7.1.8. Additionally, the road layer was employed to develop the road network.
2.3. Urban Land Cover Classification from Time-Series Images
Landsat images were utilized to analyze transitions in land use and land cover from 1988 and at subsequent five-year intervals. To achieve this, the random forest classification algorithm was employed using pixel-based supervised classification techniques [36]. Training samples and signature file preparation were completed, and classification was performed using Google Earth Engine (Mountain View, CA, USA) available at https://earthengine.google.com/ (accessed on 12 February 2023). A quantitative evaluation of the confusion matrix revealed an overall accuracy rate ranging from 80.31% to 90.94% and a Kappa coefficient of 0.8–0.9 across the study period. These results met the data accuracy and consistency standards, providing a better understanding of the spatial temporal characteristics of urban expansion, including its mechanisms and driving forces.
2.4. Analysing the Dynamics of Urban Expansion
When quantifying spatial and temporal variability and urban development patterns, researchers commonly use indicators such as the spatial expansion index and the landscape expansion index (LEI) [37]. Typical metrics for urban quantification include the annual increment (AI) (Yang, et al., [38]), the annual growth rate (AGR) [36], and urban expansion intensity (UEI) [37,39]. These indicators enable researchers to better understand the rate and intensity of urban expansion and how these affect the landscape and spatial characteristics of the surrounding area. By utilizing such indicators and metrics, researchers can gain valuable insights into the impact of urban expansion and make informed decisions regarding land use and urban planning.
This study uses UEI and AI to look at the urban growth of the CMA within several periods. The most popular index for measuring urban development is the urban expansion index (UEI), which is used to analyze the intensity of urbanization across time. Urban land expansion intensity is divided into four categories [40]: non-strength (UEI = 0), medium strength (0.2 < UEI ≤ 0.5), low strength (0 < UEI ≤ 0.2), and high strength (0.5 < UEI). The general scope and trends were described using AI [41], as follows:
where S stands for the research area’s total land area, S1 and S2 for the study period’s first and last urban land areas, respectively, and T for the number of years
The landscape expansion index (LEI) [42] is used to determine the link between the existing urban patch and the new urban patch spatially, which depicts the dynamic process of urban land expansion.
To categorize different types of urban growth, several criteria are used. In Equation (3), P represents the perimeter of the new urban patch, and L represents the distance along the common boundary between the new and existing urban patches. Three criteria used to recognize types of urban growth are outlying type (LEI = 0), edge-expansion type (0 < LEI ≤ 0.5), and infilling type (0.5 < LEI ≤ 1) [17].
Distinguishing between new and original urban parts is crucial when examining urban expansion. A new urban patch in the outlying is a separate, autonomous area of urban development from the original urban patches. New urban patches frequently emerge along the boundaries of the initial urban patch and spread outward during the process of urban growth. The steady outward growth of urban development from current urban centers characterizes this sort of urban growth, which is referred to as edge expansion. The last type of urban expansion, infill, denotes the new urban patches that are created within the gaps or spaces of the existing urban fabric.
2.5. Characterizing the Urbanization Process
Core areas that have a higher density of built-up zones are considered natural cities, and when urban areas become denser, the concentration of different kinds of interactions also increases. The main assumption in this step is that “concentration of different kinds of interactions proportionally increases with the density of urban area”. The identification of natural cities frequently involves the use of a gravity model. Urban centers are located using the gravity model, which also makes use of other theories, like the First and Second Laws of Geography [43,44]. The idea of “action at a distance”, according to which an area’s rate of urbanization can be impacted by nearby urban areas, is the foundation of the First and Second Laws of Geography. These hypotheses ensure that the gravity model [45] can be used to determine the area with the highest density and better explain the occurrences of many city centers. This information can then be used to guide land use and development decisions, ensuring that urban growth is sustainable and meets the needs of local communities.
The gravity law was utilized to assess the spatial relations between urban pixels. The law was applied to a binary image with a specified window size, and the resulting percentage of urbanization was calculated using Equation (4). The resultant images were normalized into 1 to 10 for better visualization. It was assumed that this linear standardization did not impact the change in urban density. The use of the gravity law in combination with binary images allows for a more accurate and efficient calculation of urbanization patterns and density.
Next, natural cities were derived based on three strategies [46]: (1) selecting the portion of the pixels that correspond to highly urbanized areas; (2) converting the chosen pixels (from raster data to vector data) into polygons; and (3) determining the area of every polygon and eliminating any that are too small (less than 1 km2). The remaining polygons are considered to be natural cities. Throughout the procedure of extracting natural urban areas, some pixels with low values may be surrounded by pixels with high values, leading to small gaps appearing within certain natural urban areas. These gaps are typically much smaller than the total area of the natural cities, and filling them allows the natural cities to become more distinct spatial entities. Although this process has no effect on natural city identification, it can improve the accuracy of quantitative analysis. As outlined in Table 1, three indices were utilized to determine whether a natural city qualified as an urban center. These indices include the area (A), standard deviation (SD), and elongation (EL). To be considered as an urban center, a natural city must satisfy the assessment standards for each of these three indices. The definitions for these indices are provided in Table 1. This approach ensures that only natural cities with specific characteristics are classified as urban centers, providing a more accurate representation of the distribution of urbanization.

Table 1.
Indices used in the identification of urban centers.
The area of a natural city is represented by index A, which is computed as N × PA, where N is the number of pixels and PA is their size. According to the literature review, only natural cities larger than 2 km2 were regarded as urban centers for this study [47,48]. The degree of dispersion of each and every pixel in a natural city is measured by the SD index [46]. Whereas a smaller SD number suggests that these values are closer to the mean, a higher SD value shows that the majority of the dataset’s values vary from their mean values. Using SD serves the objective of excluding certain natural cities, like ports and airports, which are not regarded as urban centers. The elongation (EL), or the spatial distribution of rural cities in different directions, is the third index. LLA and SLA, stand for the lengths of the major and minor axes, respectively, of the minimum bounding rectangle of the natural cities. The purpose of EL is to eliminate the natural cities that result from roadways that are too narrow.
2.6. Identification of Morphological Polycentric Areas
To identify morphological polycentric areas, several layers of data were utilized in the process, including the built-up layer, the road layer, land use and land cover layer, etc. The composite function points were analyzed in terms of their geographical distribution, and areas with a high density of these points were identified as candidate function centers. This analysis was carried out using kernel density analysis [49], which allowed for a more accurate identification of areas with a high concentration of activity and development. To identify the morphological polycentric areas, a two-step process was carried out.
Firstly, density layers were created using Hotspot analysis for natural cities and the integration of other layers. These layers provided information about the concentration of activity and development in different areas. Secondly, these layers were superimposed on top of each other in order to identify the morphological polycentric areas. To identify polycentric areas based on administrative divisions, the Grama Niladari file overlapped with other relevant data layers. This approach allowed for a more comprehensive understanding of the spatial dynamics of urban areas at the administrative division level. By examining the overlap between different data layers, it was possible to identify areas that exhibited a polycentric morphology [50].
2.7. Identification of Functional Polycentric Areas
When identifying functional polycentric areas, it is common practice to delineate areas based on the daily travel patterns of commuters. However, in many cases, data on daily travel patterns are not readily available at the relevant time-series scale. To address this challenge, researchers have proposed using the density of roads as a proxy for commuter travel patterns [50]. Specifically, the density of the road network is identified by weighting factors such as road usage, type, and scale. By using this approach, it is possible to estimate the level of commuter activity in different areas and identify functional polycentric areas based on these estimates. Although this approach is not a perfect substitute for direct measures of daily travel, it can provide valuable insights into the spatial dynamics of urban areas and inform policies and planning efforts.
To measure the proximity of each building within the transportation network, researchers utilized the Urban Network Analysis (UNA) tool, developed in 2022 by Sevtsuk and Mekonnen attached to the City Form Lab at the Massachusetts Institute of Technology (Cambridge, MA, USA) [51]. With the aid of this tool, the proximity function of every building in the road network was computed, revealing information on the degree of accessibility and connectivity of various locations. Spatial autocorrelation analysis was used to determine important hotspots based on the results. This approach [50] allowed the researchers to identify areas that exhibited high levels of connectivity and accessibility, and to better understand the spatial dynamics of the urban area under study [43].
3. Results
3.1. Urban Land Cover Changes in the CMA
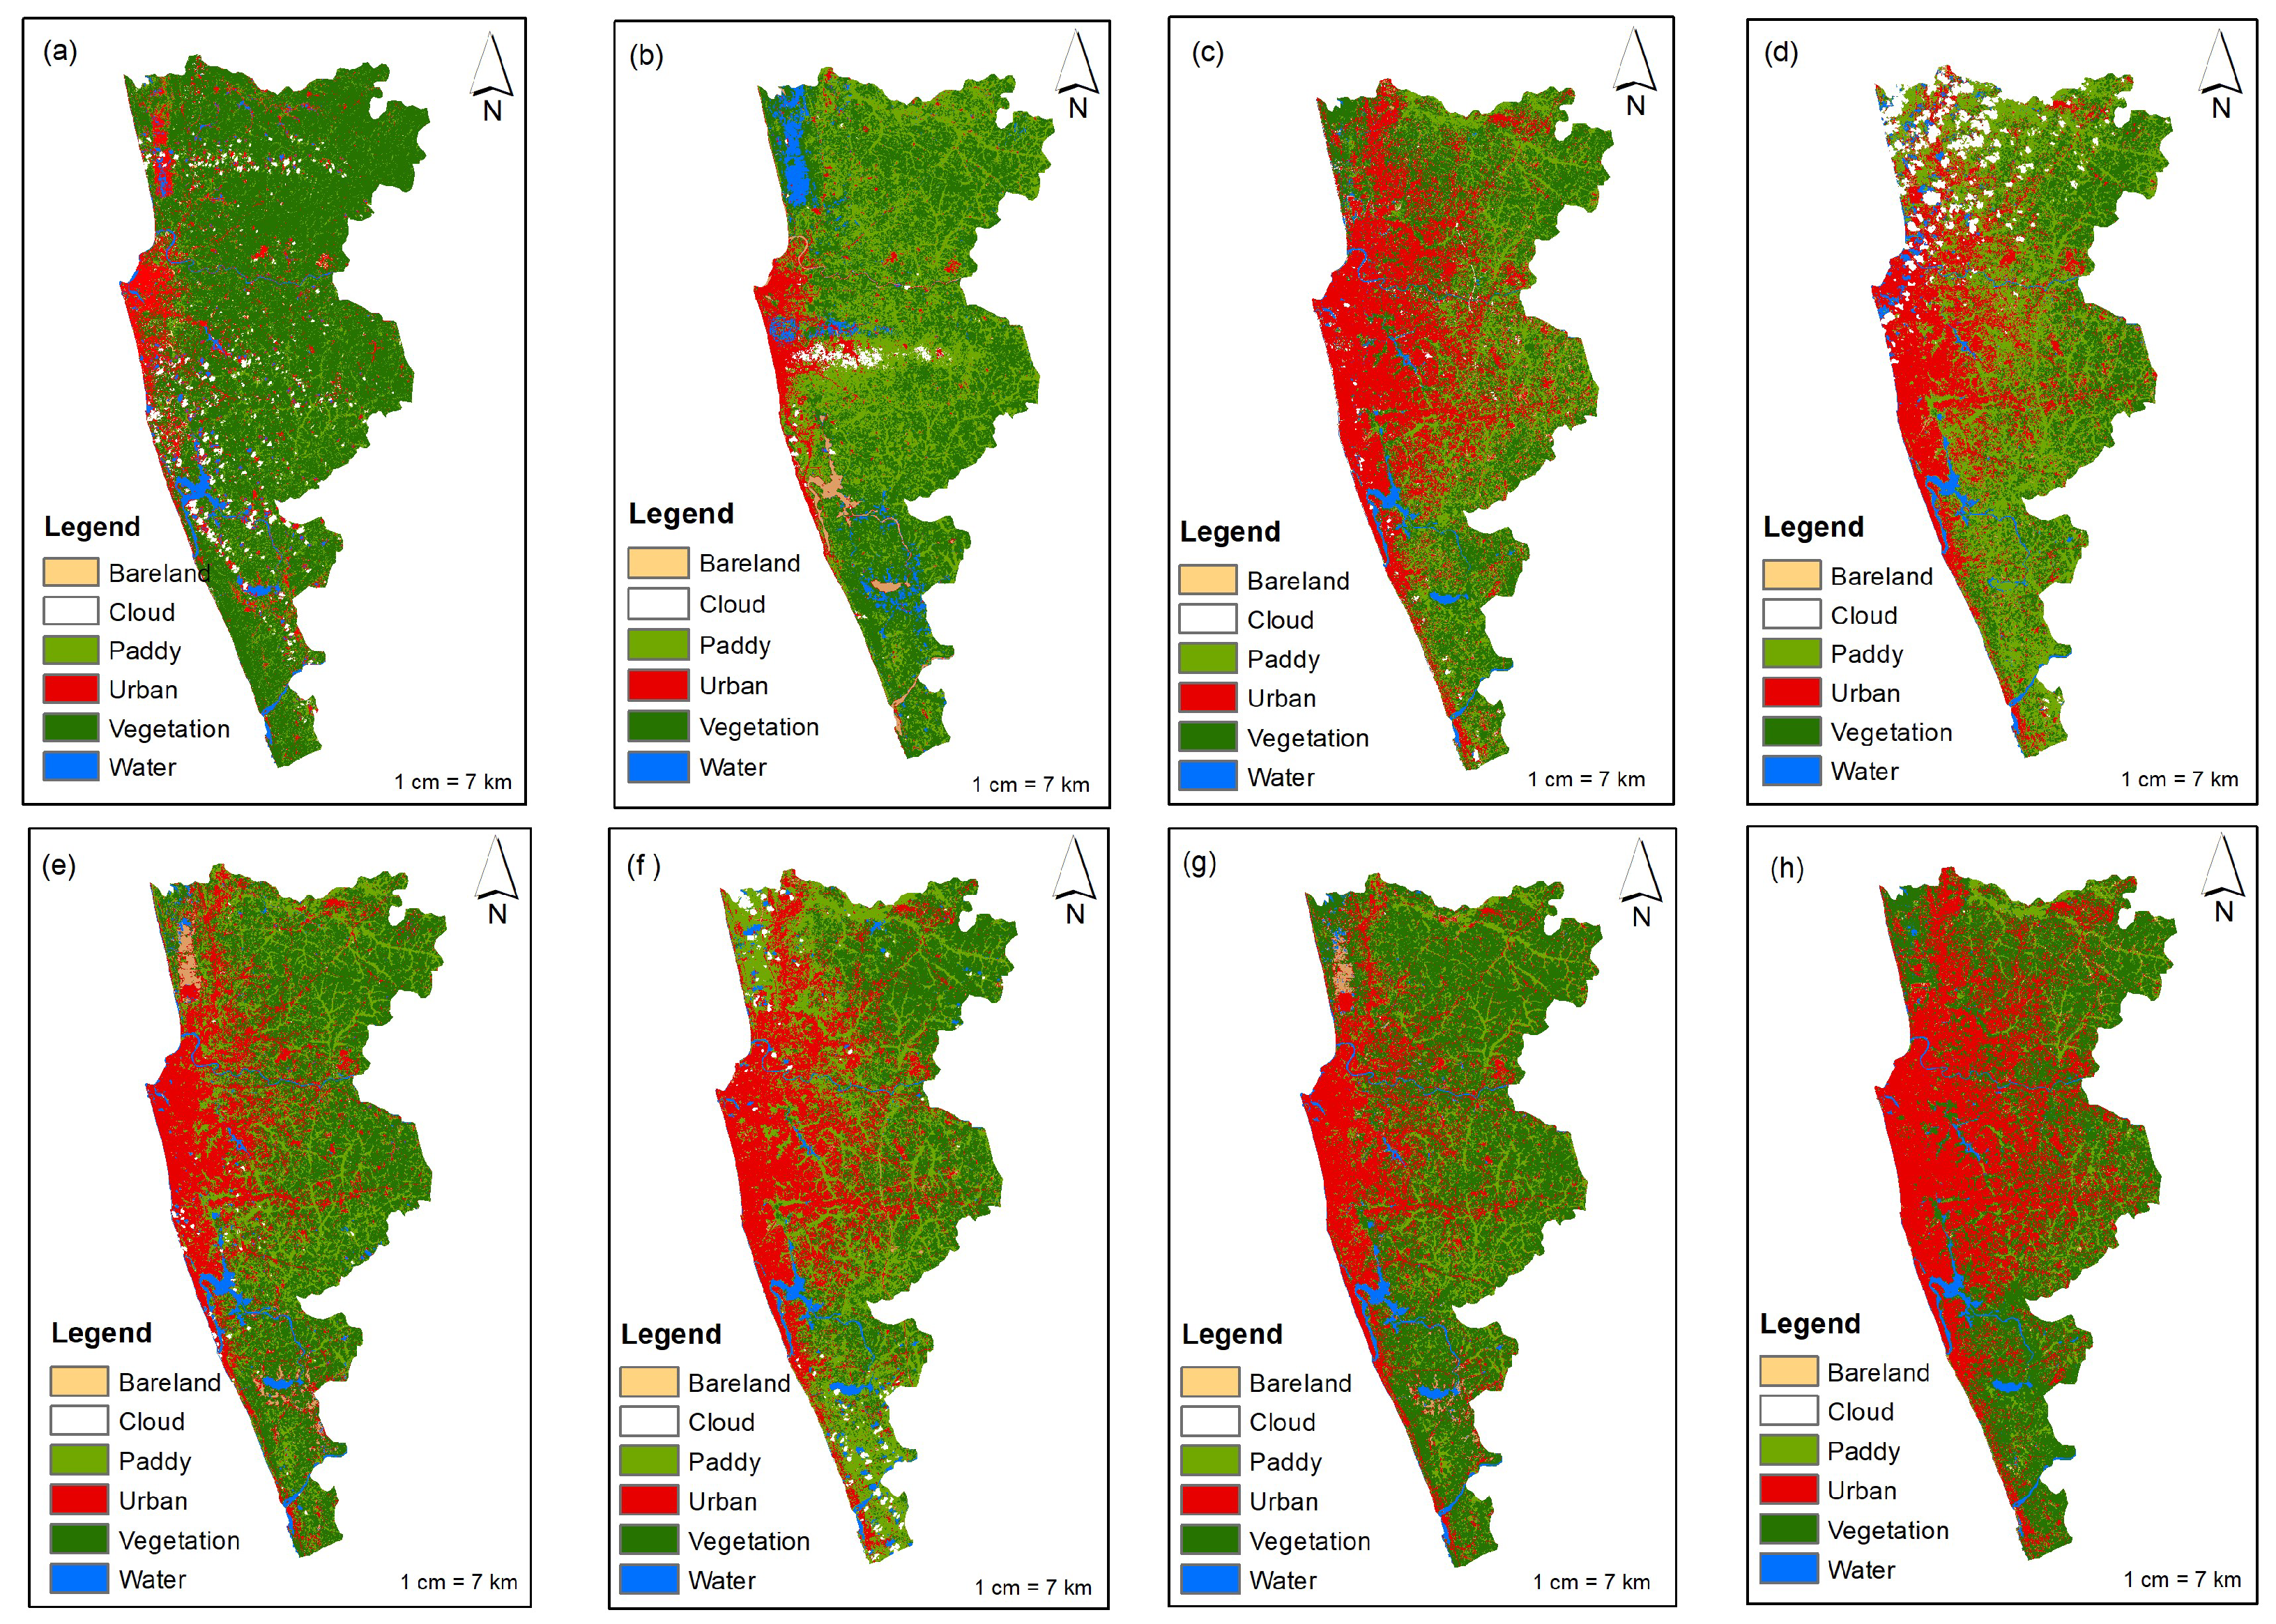
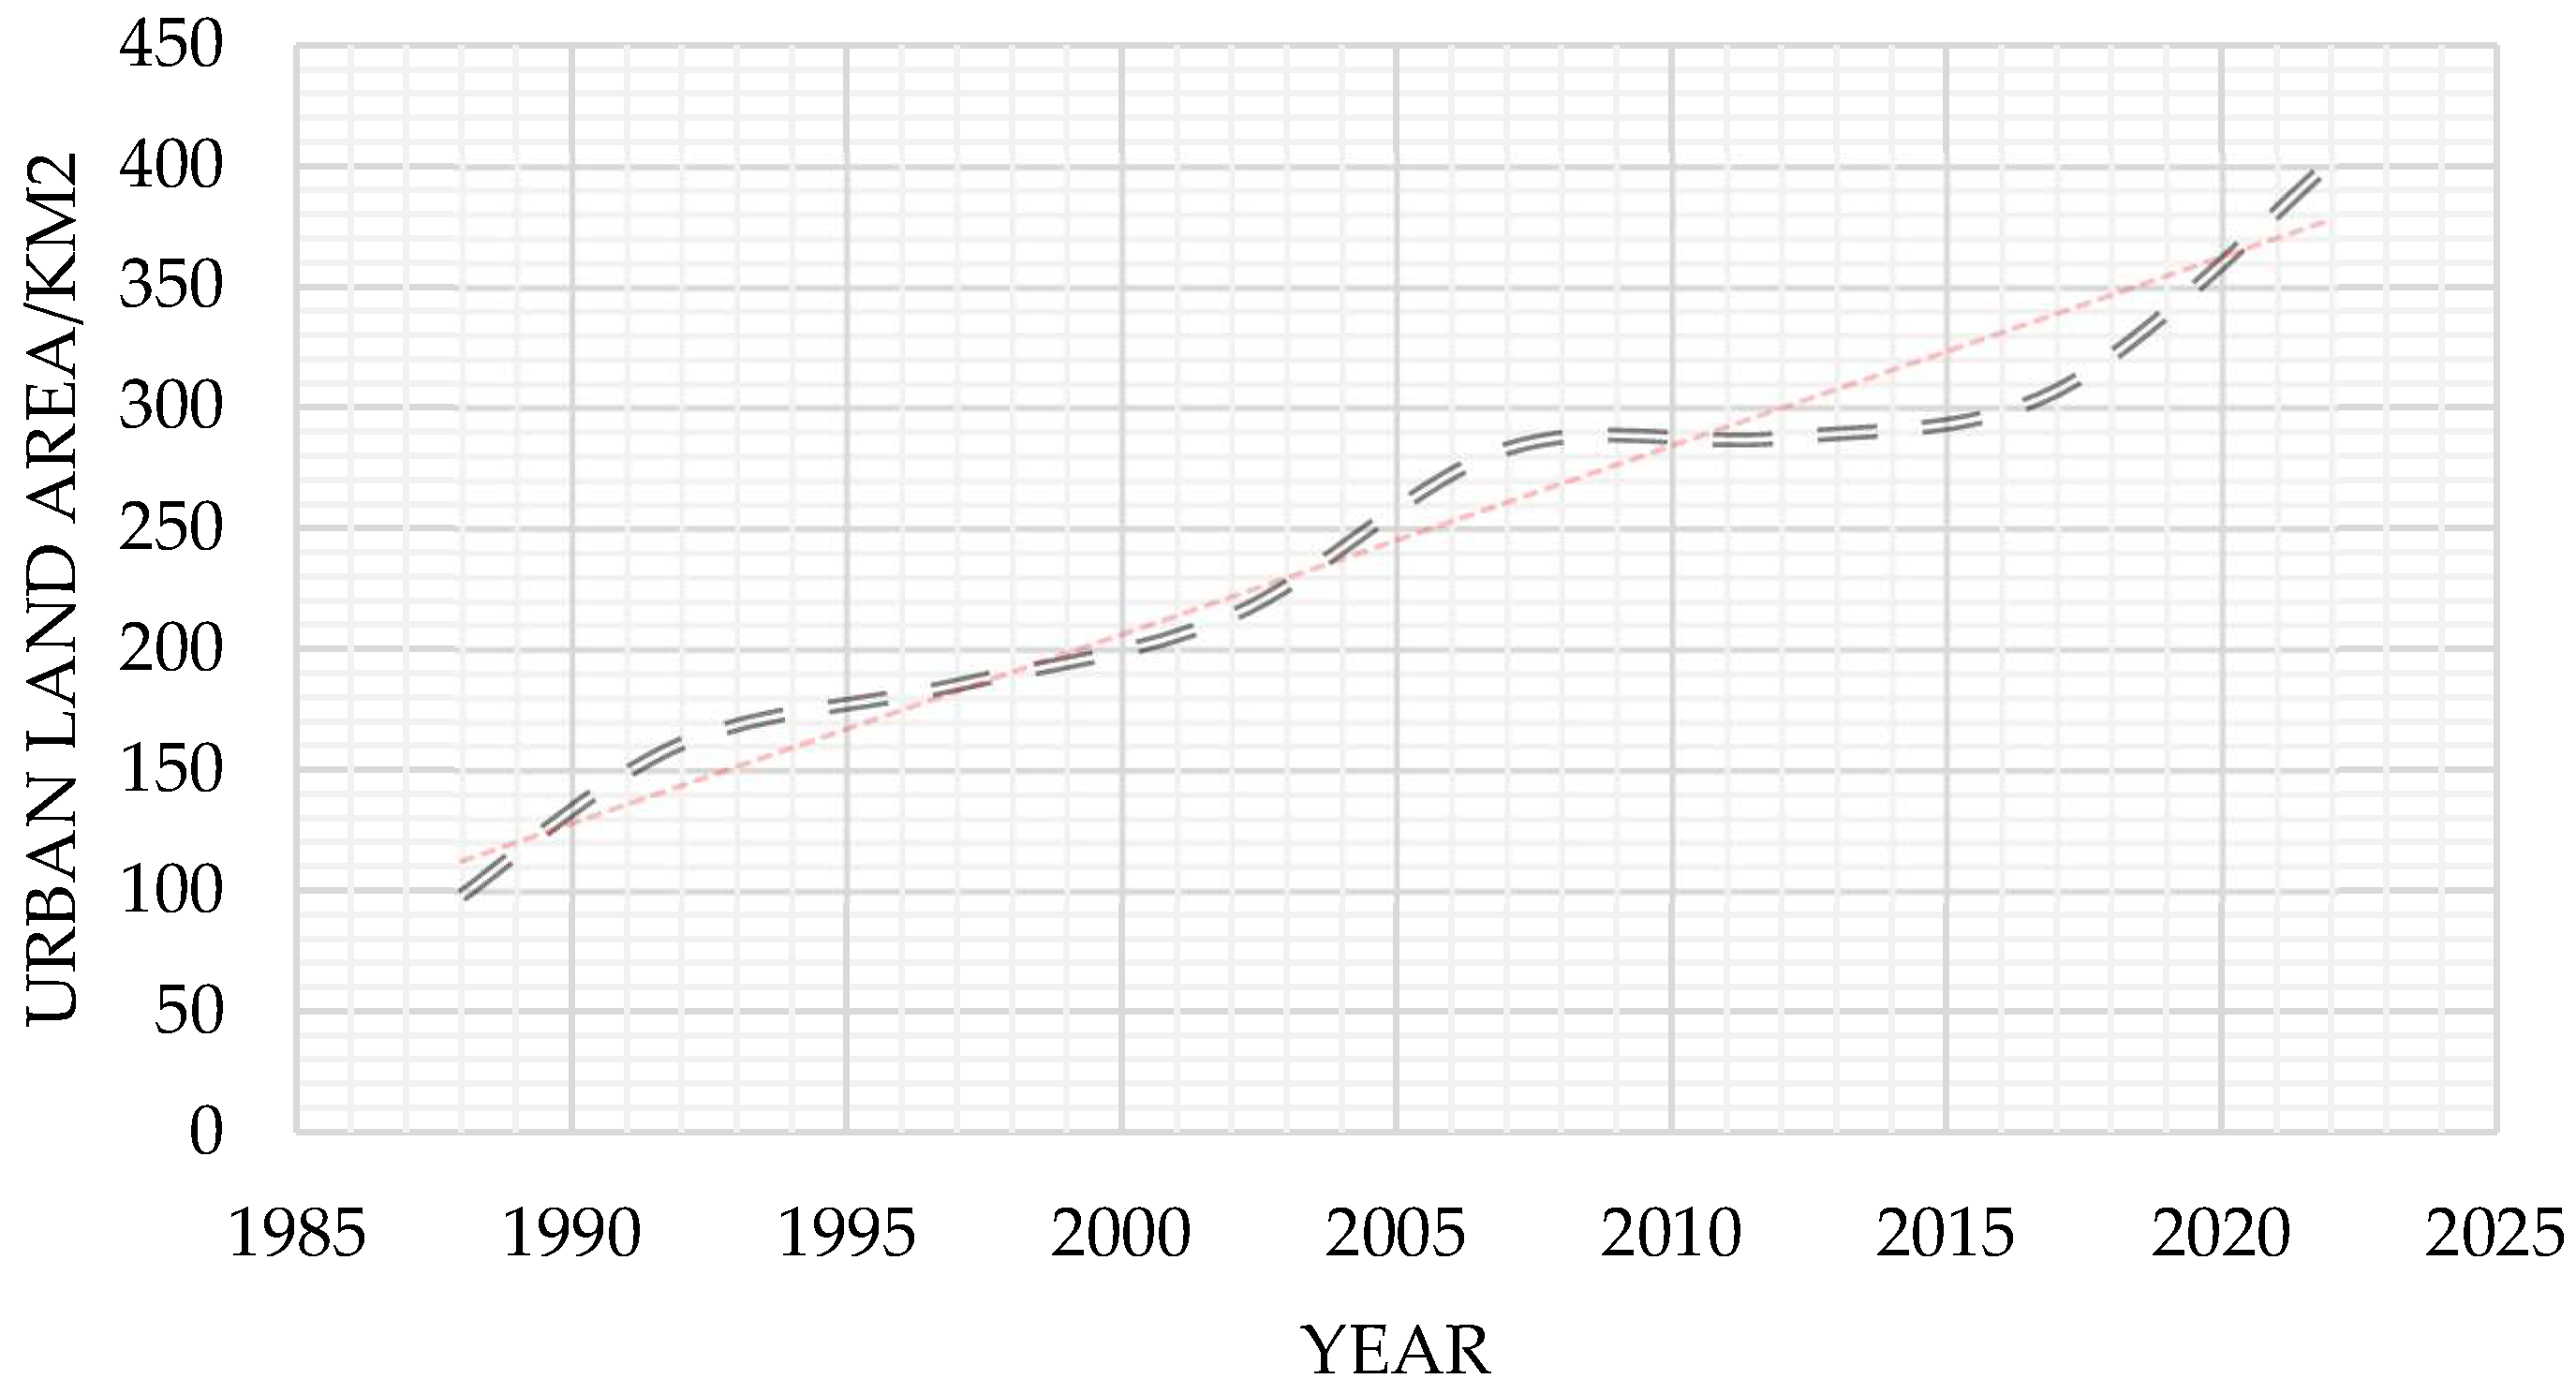
Upon obtaining the classification results, it became apparent that cities tend to expand beyond their established limits. As illustrated in Figure 2, the urbanized area in the CMA has grown dramatically over the last three decades. As shown in Figure 3, the urban area in 1988 was 98.037 km2, but by 2022, it had grown up to 401.68 km2. This indicates a significant increase in the urban area over the last 34 years. Specifically, it is estimated that the urban area has increased by approximately 9.1 km2 per year during this period. It can be noted that in 1988, the urban area accounted for 9.6% of the whole area, and in 2022, it accounted for 39.6%. A detailed analysis of the urbanization results reveals a few characteristics associated with urban sprawl. These include low-density development, leapfrog development, scattered development, and commercial strip or ribbon development. This phenomenon was further explained in the studies conducted by a number of scholars [29,52,53], which indicate that, although urbanization is happening, it tends to be more on the unhealthy side.
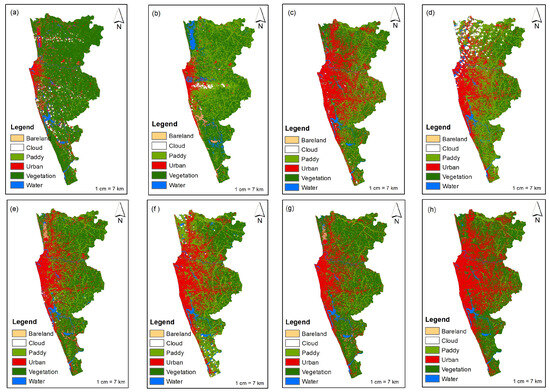
Figure 2.
The results of random forest classification in the CMA: (a) 1988 (b) 1992 (c) 1997 (d) 2002 (e) 2007 (f) 2012 (g) (2017) and (h) 2022.
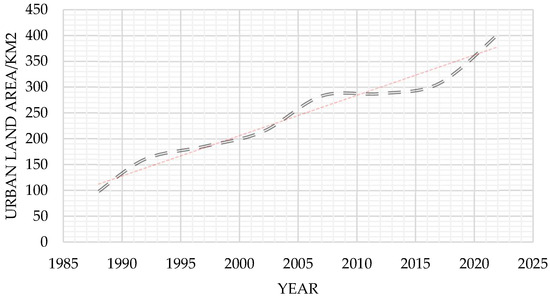
Figure 3.
Quantity change of urban land in the CMA from 1988 to 2022.
As per the statistics revealed by Subasinghe et al. (2022) [26], the ribbon-type expansion is the reason for Colombo’s “messy” urbanization. This type of urban expansion is beyond the boundaries of urban planning. Therefore, these areas have a high concentration of urban features, which ultimately challenges sustainable urban development [54].
Attention needs to be paid to urban sprawl because the above patterns not only exhibit land use change within the considered time period, but also show the impact on transportation and socioeconomic development. The problems of climate change and rising environmental pollution can be worsened due to the prevailing expansion pattern observed during the study. AI and UEI indices were calculated for further in-depth analysis of the expansion intensity in different time periods (Table 2).
Table 2.
Index calculation for built-up areas for the CMA.
3.2. The Urbanization Process in the CMA
This study has shown that Colombo experienced low, medium, and high urbanization strength during the time span analyzed. There are three stages of urbanization expansion that can be distinguished when analyzing horizontal urbanization: low-, medium-, and high-strength.
As depicted in Table 2, the urban expansion intensity was higher during 1992–1997 than in the earlier period. During the 1990s, Sri Lanka underwent significant changes as a result of a number of social, political, and economic factors. This period was marked by several disruptive events, including the civil insurrection, which took place from 1987 to 1989, as well as the ethnic conflict that lasted from 1983 to 2009, causing significant disruptions and changes in the country. The main reason for this can be identified as rural-to-urban migration, which happened during this period [29].
As per Hewavitharana [55], the policy was implemented to encourage rural-to-urban migration for economic gains, aiming to reduce the poverty level of rural communities due to the lower productivity of the agricultural sector. This may be the reason for the high strength shown in Table 2 for the period from 2002 to 2006. Further, from 2007 to 2012, the same figure remained high. The reasons for this would have been the ending of the civil war in 2009, and the policy decisions taken by the government, which resulted in a gradual increase in urbanization in Colombo due to the commencement of development projects [35].
The Western Region Megapolis Planning Project (WRMPP) is the flagship project of the area’s urban development program. The two key transformations that the WRMPP seeks to achieve are geographical transformation of urban agglomerations in the Western Region and the structural change of the entire national economy. This project seeks to achieve these objectives by creating a more sustainable and integrated urban development plan that promotes the balanced growth of urban and rural areas. The implementation of this project has led to a slowdown in the urbanization of Colombo and the spread of built-up areas in the Western Region of Sri Lanka [26].
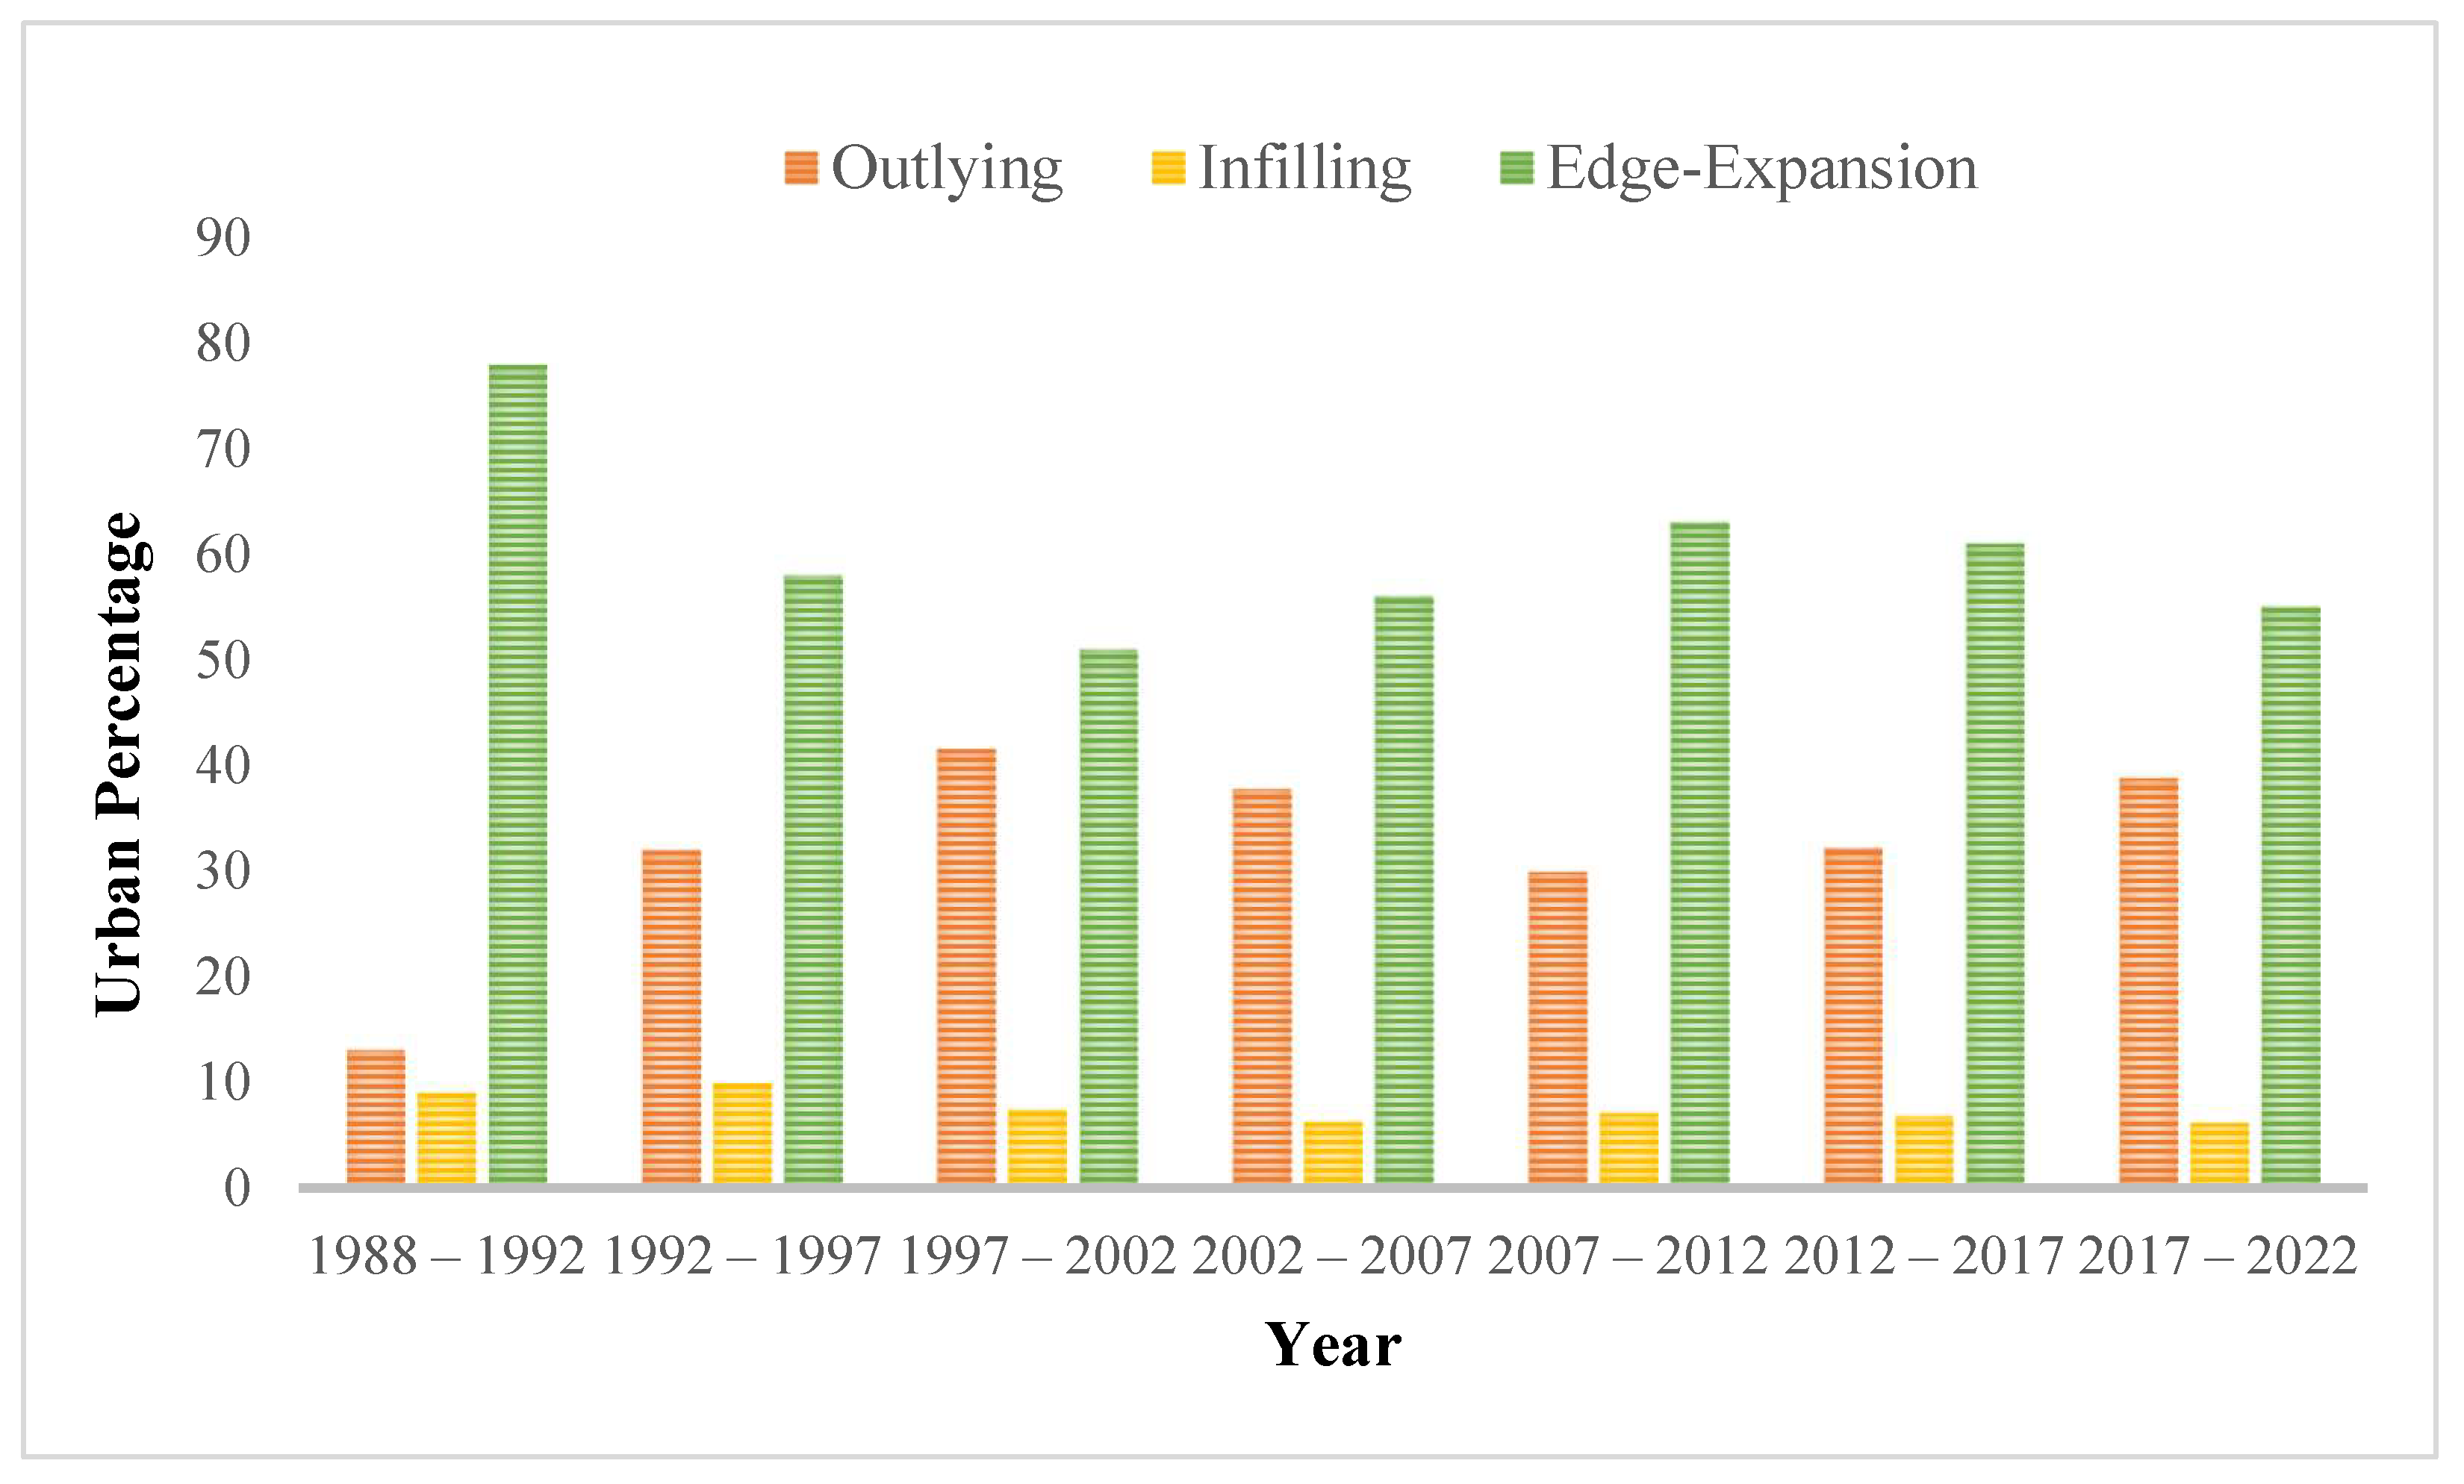
The landscape expansion index is a useful indicator for analyzing changes in the spatial structure of urbanization. By studying urban spatial patterns, we can gain insight into the development of a city and use this knowledge to improve urban planning and management. In the case of Colombo, the landscape expansion index was used to analyze the city’s spatial expansion pattern from 1990 to 2022. The results indicate that edge and outlying expansion were prominent during this period, while infilling expansion was the weakest form. This information is displayed in Figure 4.
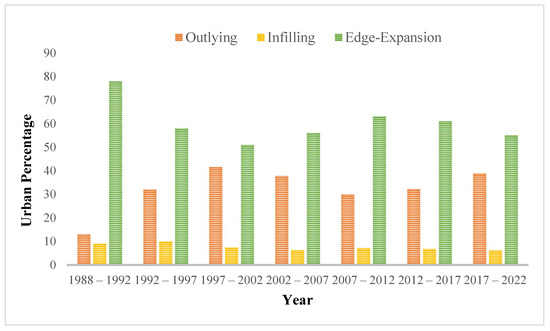
Figure 4.
Percentages of three spatial growth types during 1992–2022.
Between 1990 and 2000, Colombo’s expansion pattern was characterized by a combination of edge expansion and outlying growth patterns. This spatial heterogeneity is a typical feature of the urbanization process. When urban areas expand with edge expansion, they become urban agglomerations. Accordingly, Colombo’s outlying growth exhibits a linear and clustered pattern, with a small percentage of isolated growth in some areas.
The main reason for outlying urbanization has been the physical development occurring along the transport corridors. This can be seen in Figure 2 by way of the increase in the number of built-up patches and the decrease in the distance among them. In contrast to the decrease in the mean distances between built-up patches, which can be attributed to the combined effects of diffusion, expansion, and the development of new patches near or between existing ones—a process known as infill urban development—the increase in the size of built-up patches was a result of extension or expansion [29].
The above evidence suggests that the study area is currently in the early stages of an oscillating process. At present, the study area is currently experiencing more diffusion and less coalescence, which could be the result of urban sprawl. Conversely, coalescence typically leads to an infilling growth pattern, where development fills in existing gaps within the urban fabric. In the CMA, absence of geographical obstacles, such as high elevation and steep slopes, which could limit the urbanization process has facilitated urban sprawl. Since urbanization is happening along roads with the development of road networks, city centers and suburbs link together and make poly cities. Currently, the impact of growth nodes on the CMA is not clearly evident. Therefore, in the next section, try to identify the growth nodes, both morphological and functional.
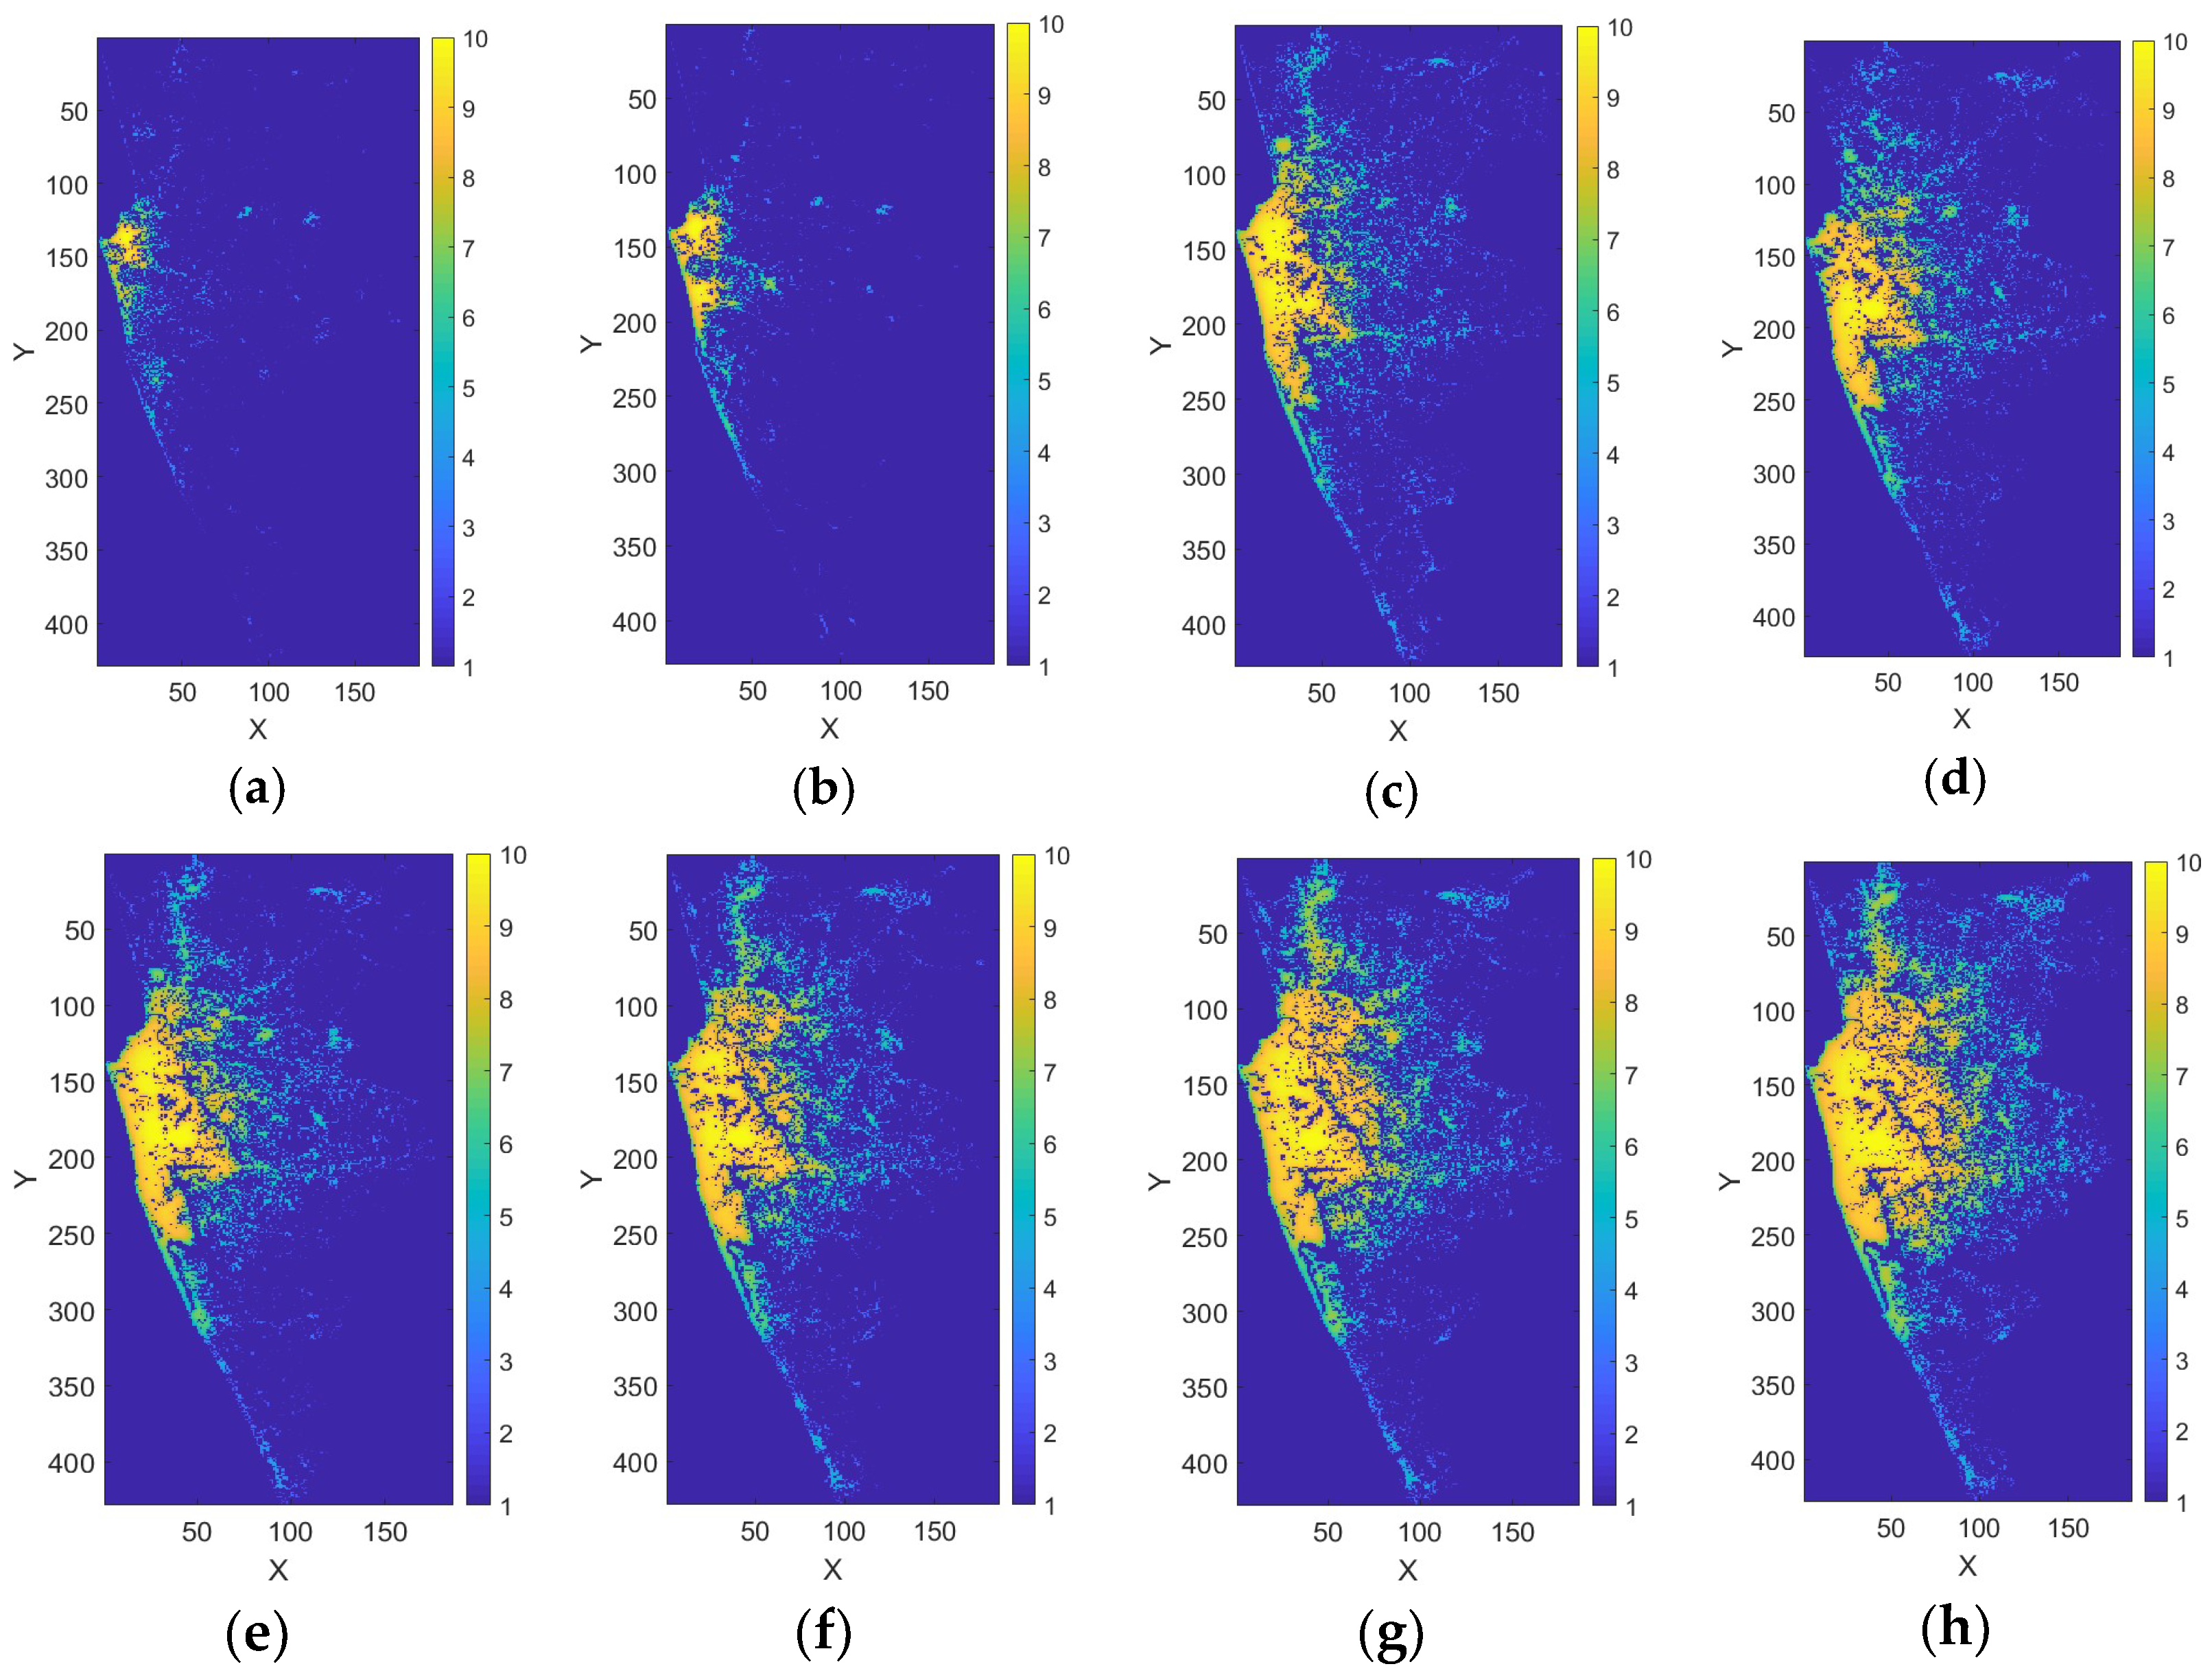
Furthermore, the urban centers in the CMA were identified using the urban density maps in Figure 5. The city boundary limits have expanded year by year. The natural cities created were identified, and they show urban agglomeration throughout the study area and cannot differentiate the cities. Therefore Therefore, in the further identification of morphological and functional cities in the next section the smallest administrative unit of Sri Lanka, Grama Niladhari Division, is overlapped with the results for better visualization.
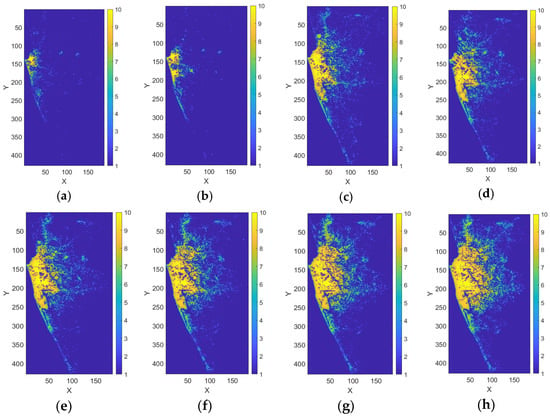
Figure 5.
The results of gravity model for the CMA: (a) 1988 (b) 1992 (c) 1997 (d) 2002 (e) 2007 (f) 2012 (g) (2017) and (h) 2022.
3.3. Morphological Polycentric Areas
The identification of morphological polycentric areas begins with selecting the core areas that form the city centers. Rather than using a population threshold, we identify the presence of local authorities, which typically indicate an area exhibiting higher population density than the adjacent areas. After identifying the morphological polycentric areas, the density values were converted into percentages for clearer representation and then classified into five classes. This classification aims to differentiate varying levels of polycentricity based on the intensity of development. In the identification of morphological polycentric areas, initially, the most contiguous Grama Niladari Divisions were identified. Therefore, the resultant areas are considered as urban centers.
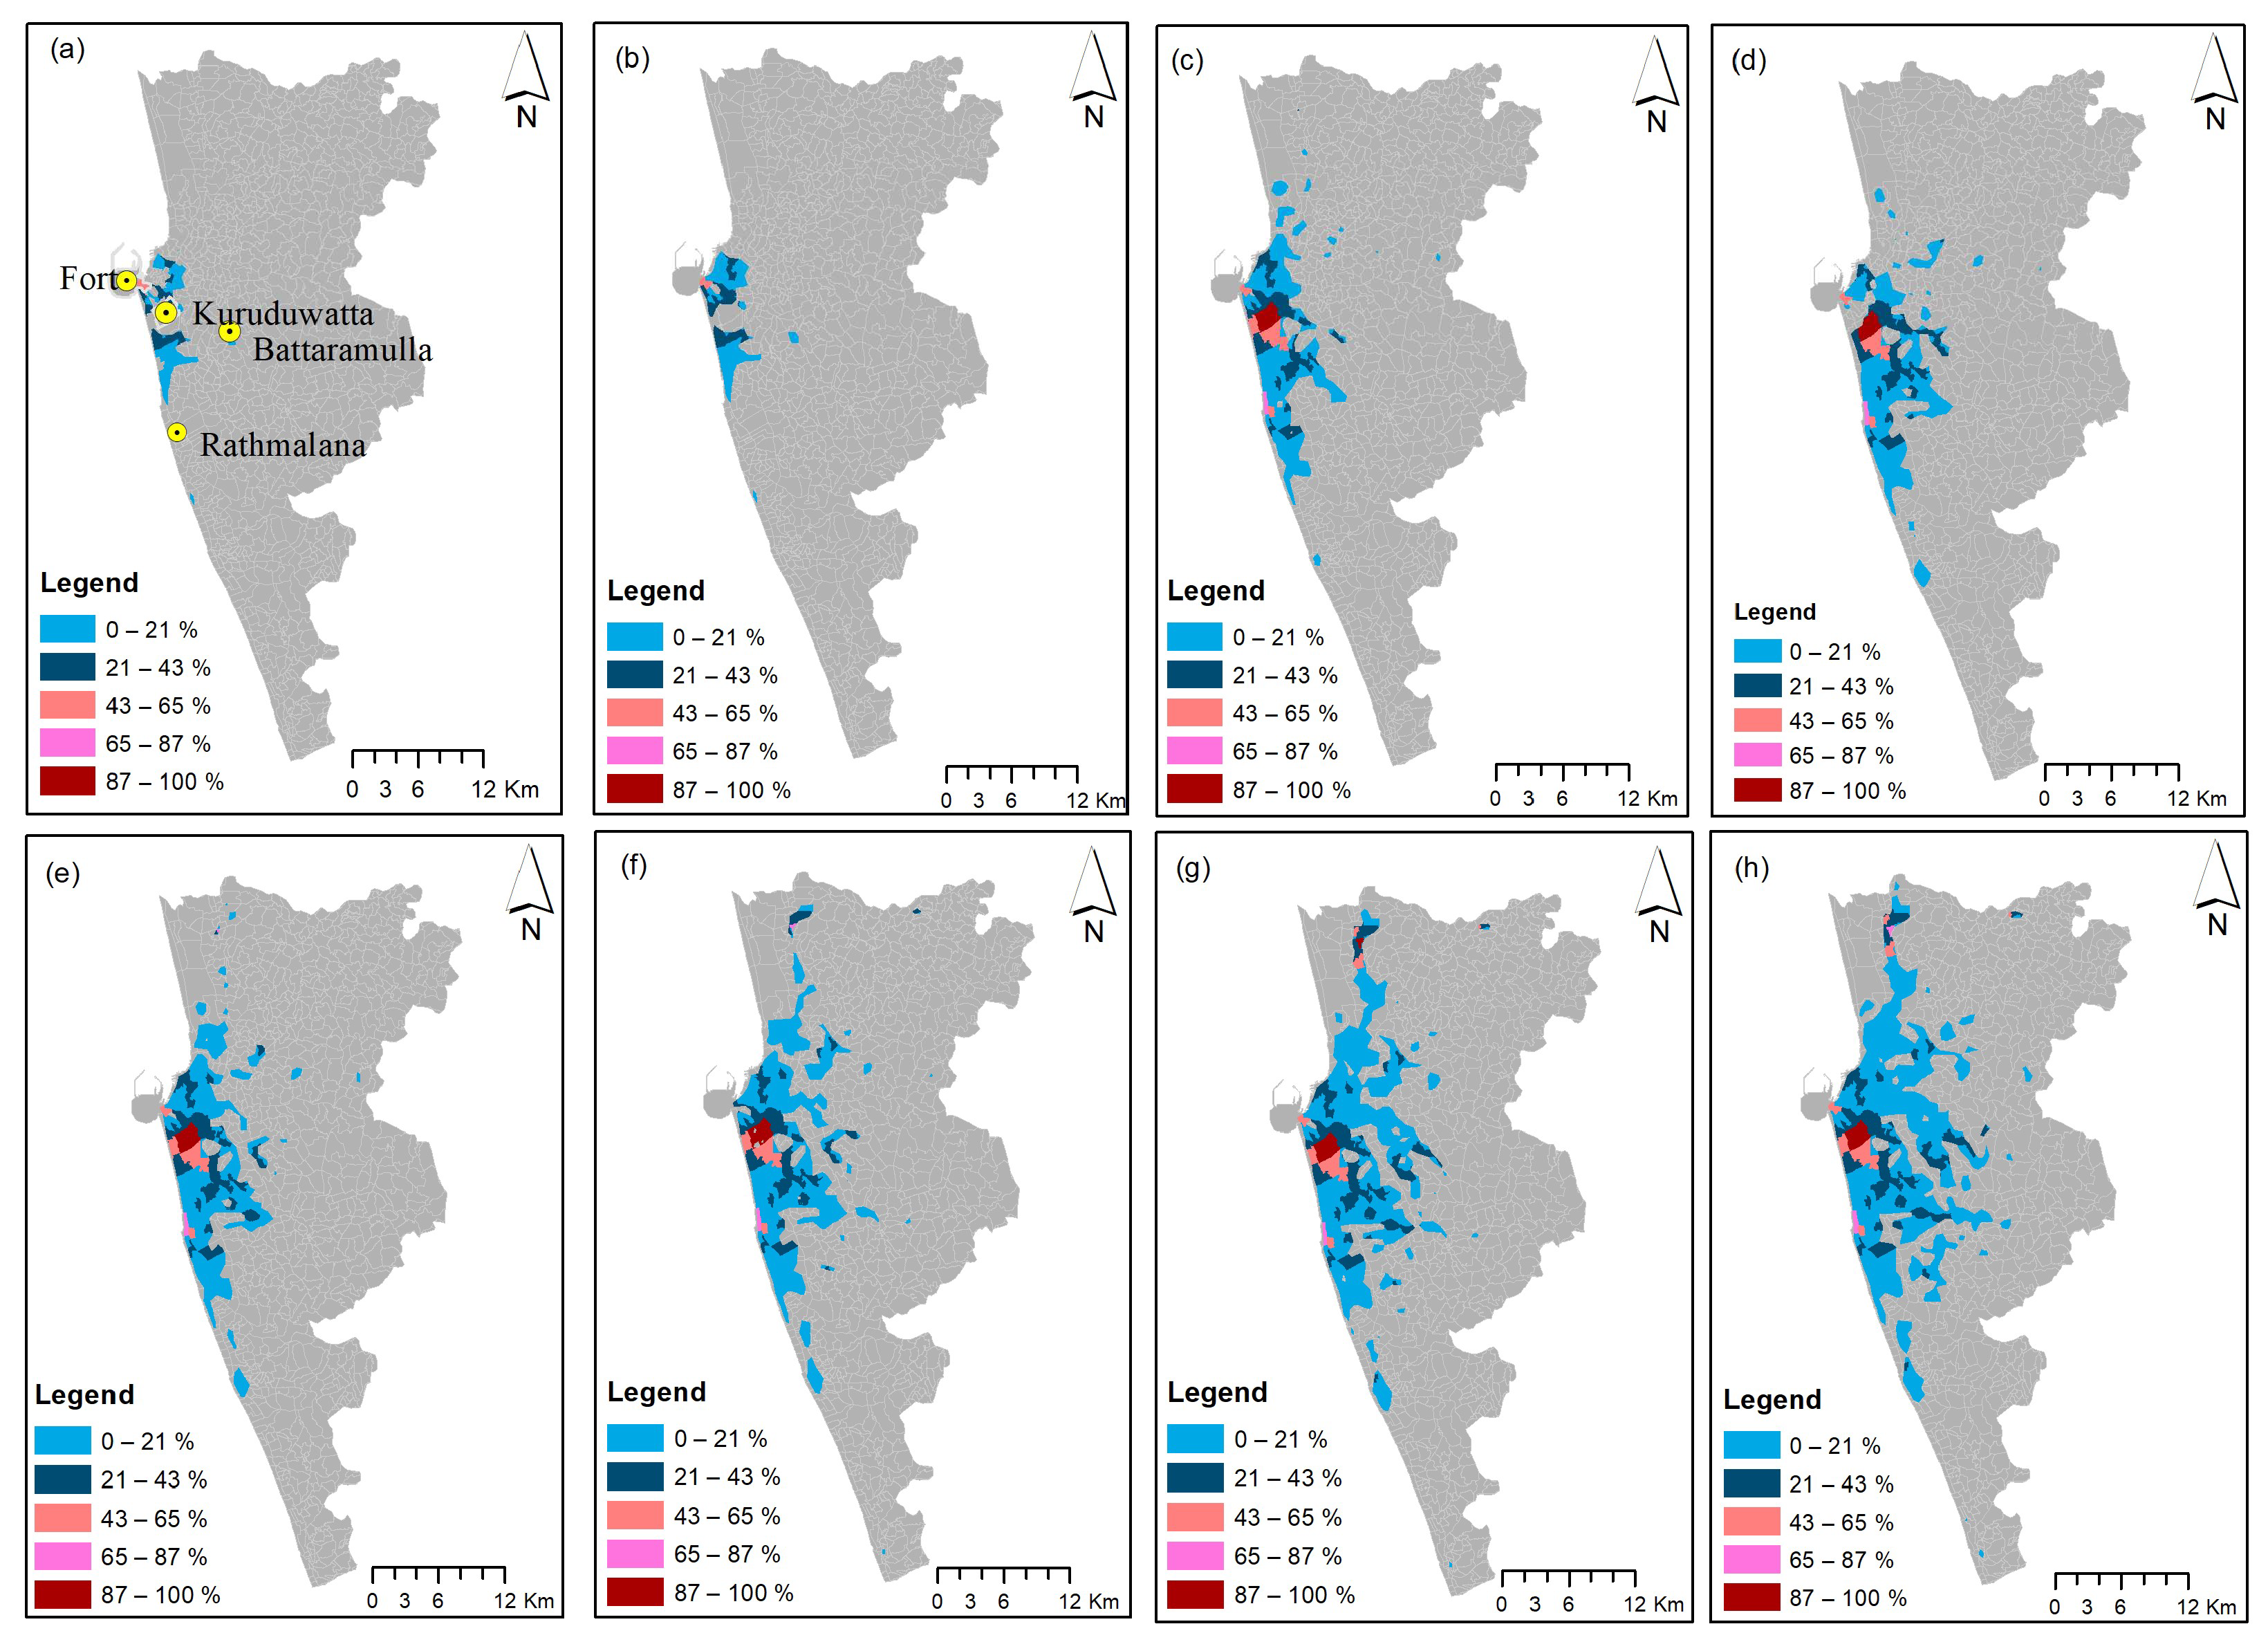
As demonstrated in Figure 6, Battaramulla was identified as a high-density morphological urban center. The area comprises a mix of residential houses, government offices, and administrative complexes. One of the reasons for this is that the government targeted Battaramulla for development to reduce congestion in Colombo through infrastructure development. Despite the historical and economic significance of Colombo Fort as the central business district, its morphology has been impacted by suburban sprawl. When an area experiences extensive suburban sprawl, characterized by low-density structures and a dispersed urban form lacking cohesive characteristics, it tends to exhibit low morphological attributes. However, Kuruduwatta has emerged as a major morphological center since 1997, and continues to be so. Today, the most significant buildings in this area include the University of Colombo, the United Nations head office, the police quarters, ministerial flats, official residences, and so on. This concentration makes the area more developed in terms of morphology without significant urban sprawl. In contrast, Rathmalana shows moderate morphological development. Rathmalana is an area established for industrial purposes outside Colombo city [26,28] and is, therefore, a more well-planned area with structured residential zones.

Figure 6.
Morphological urban areas of Colombo Metropolitan: (a) 1988 (b) 1992 (c) 1997 (d) 2002 (e) 2007 (f) 2012 (g) (2017) and (h) 2022.
Polycentricity, on the other hand, is associated with the balanced distribution of resources, economic opportunities, and services across the entire region. However, according to the findings depicted in Figure 6, the study reveals a greater degree of polynuclearity rather than polycentricity, which indicates a fragmented distribution of resources and economic activities. Polynuclearity is considered one of the causes of urban sprawl, which leads to unhealthy urbanization. The phenomenon of polynuclearization in metropolitan areas can be attributed to urban sprawl and the weakening of the leading role of historic city centers. Other cities in the metropolitan area have taken over specific functions, such as financial centers, technology centers, shopping centers, industrial centers, and more, as reported by Lityński and Serafin [56]. Since morphological urban centers only focus on physical arrangements of urban structures within the spatial layout of the region, functions and activities need to be monitored.
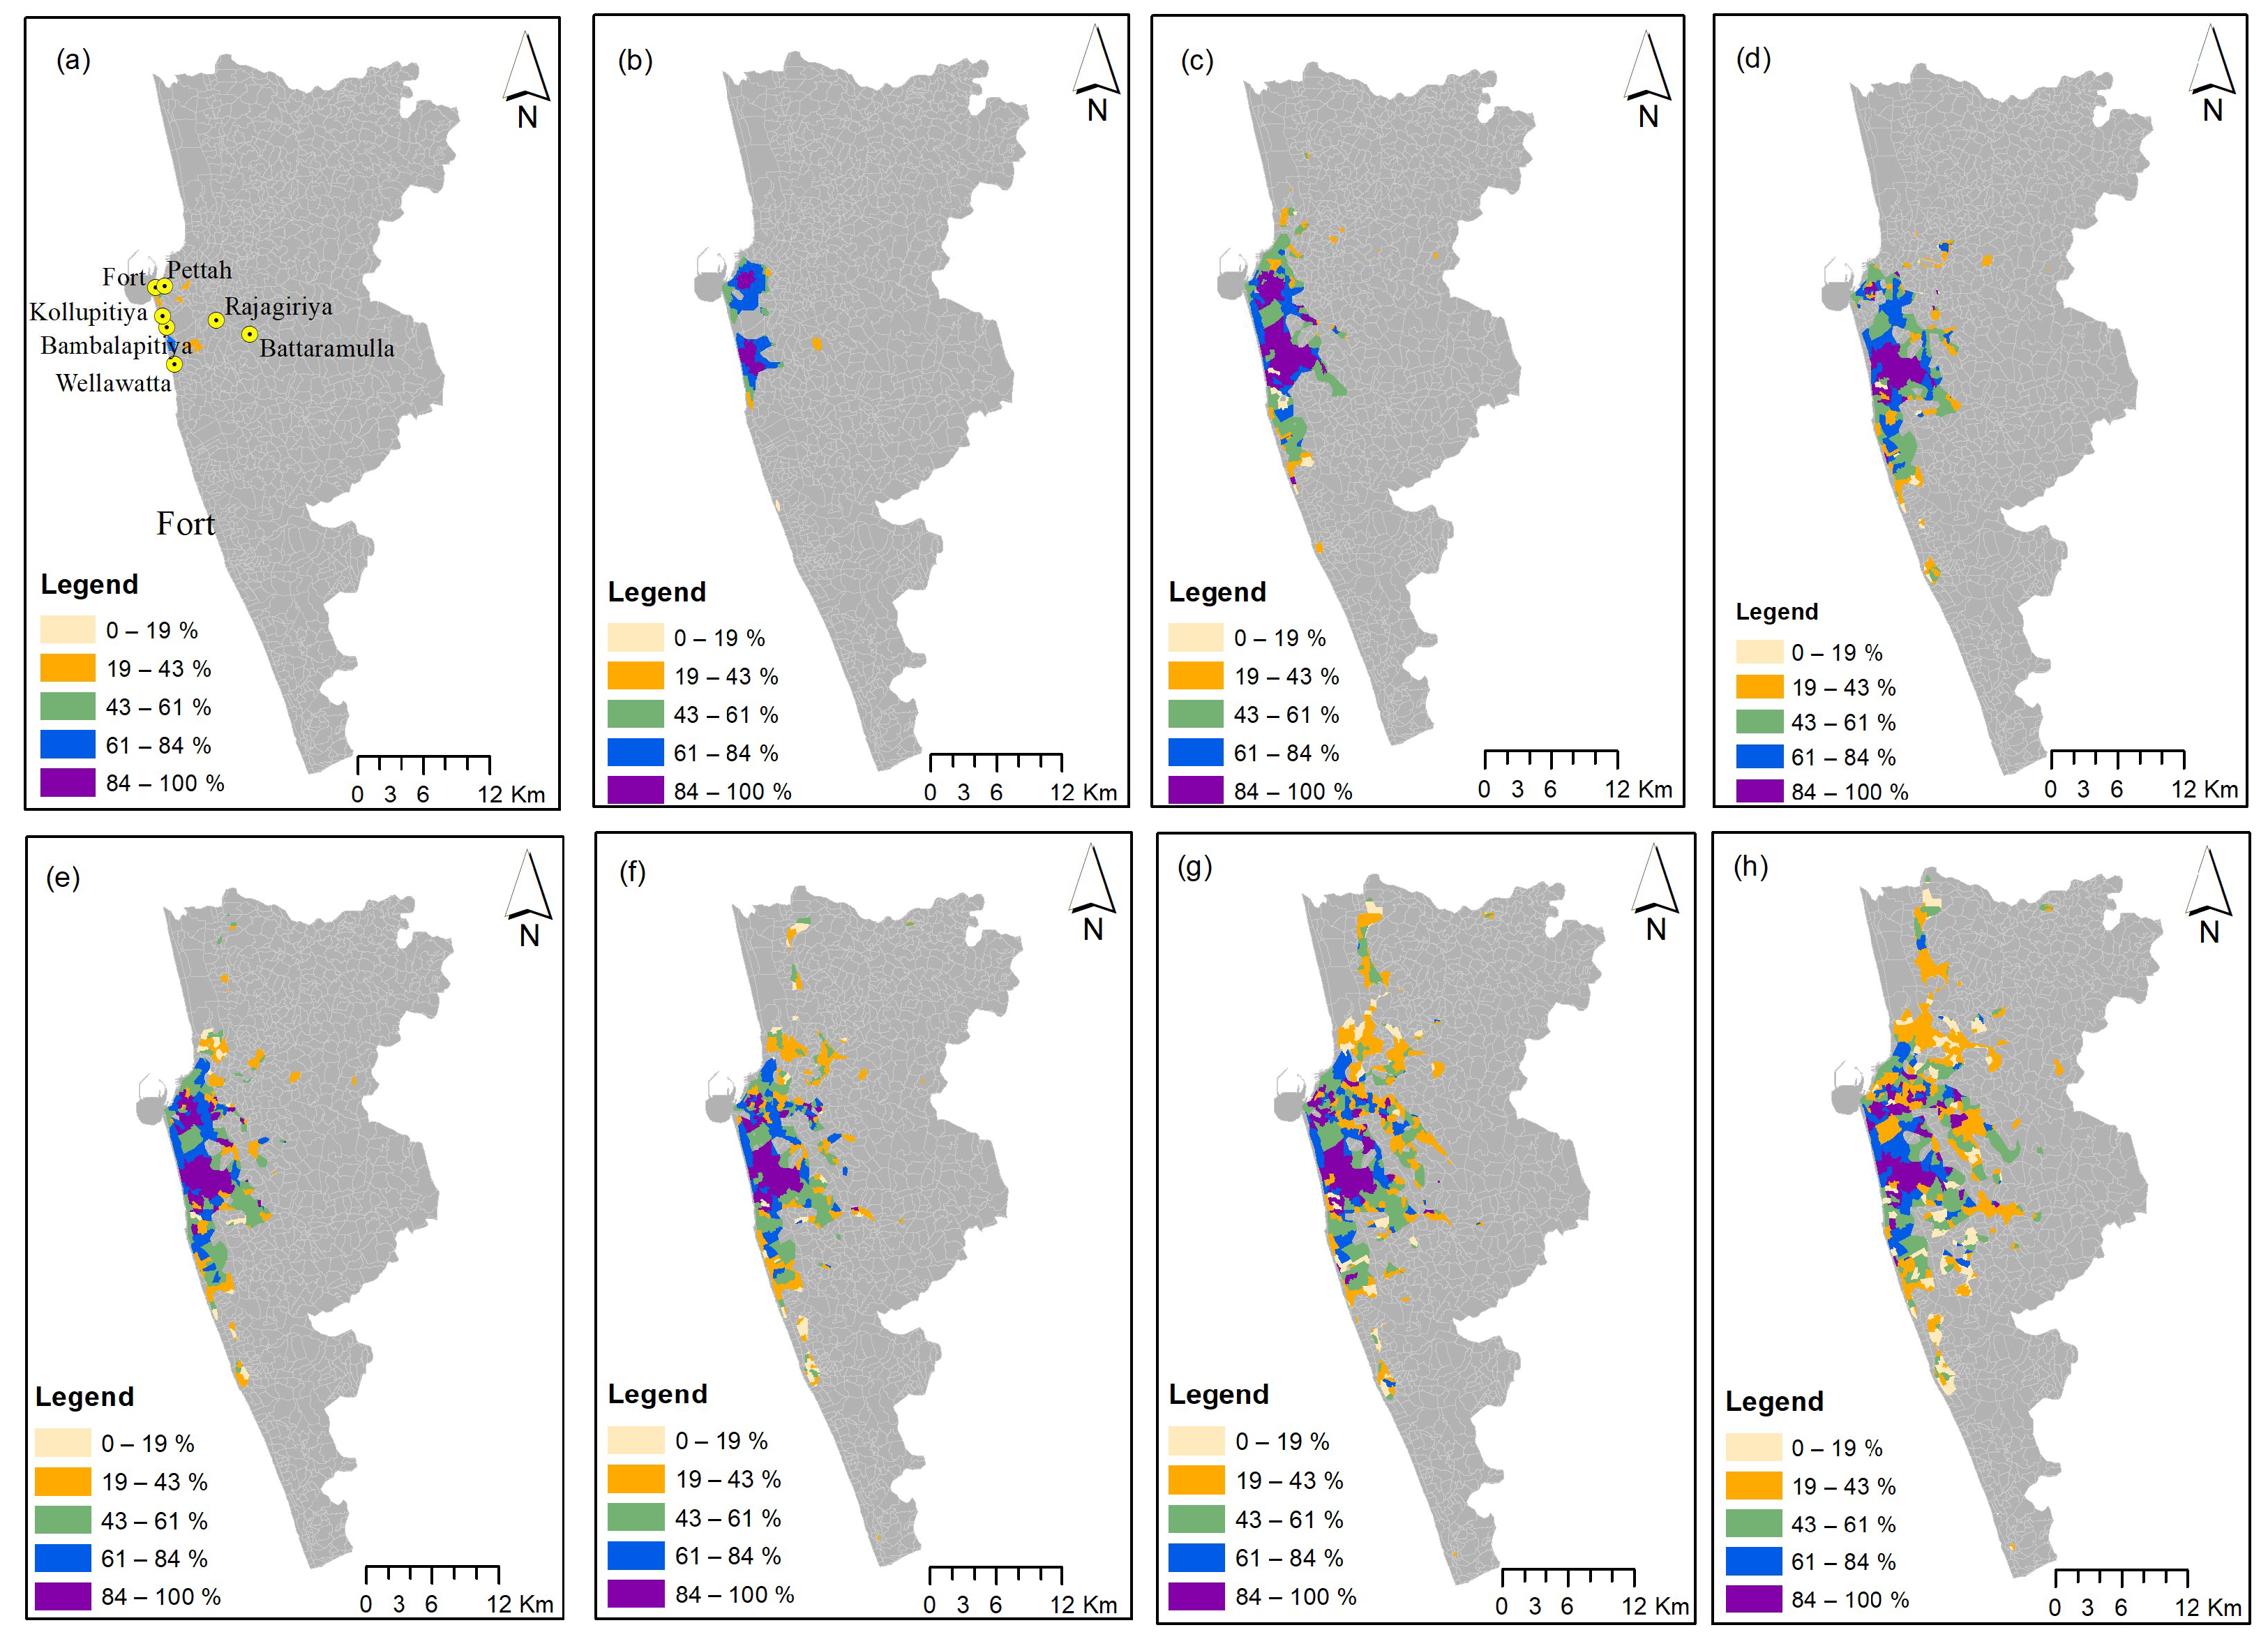
3.4. Functional Polycentric Areas
The differentiation between polynuclearity and polycentricity is primarily based on functional linkages. Polynuclearity mainly focuses on the number of high-density areas without considering functional connections. On the other hand, polycentricity evaluates the number of centers, which are defined as high-density areas that have functional connections with their surroundings. Therefore, the presence of functional linkages plays a crucial role in differentiating between polynuclearity and polycentricity.
The functional polycentric areas were identified by considering the road network and the results given in Figure 7. Due to the lack of relevant data on commuter flows, the road network is used to identify potential functional urban areas. In Figure 7, the functional urban centers are densely scattered and cannot be identified due to the exchange of significant flows that intertwined with congested transportation networks. After identifying the morphological polycentric areas, the density values were converted into percentages for clearer representation and then classified into five classes. The density values were divided equally among the five classes, each of which assigned a value from 1 to 5. This classification aims to differentiate varying levels of polycentricity based on the intensity of development.
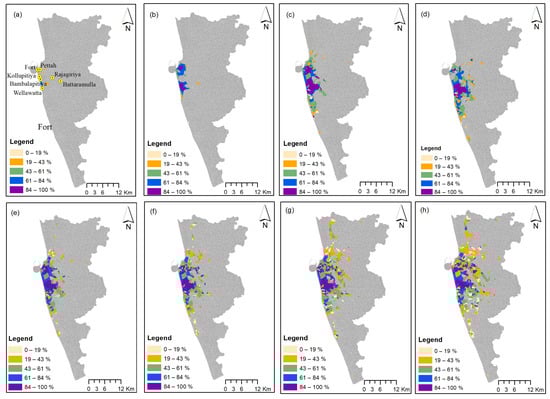
Figure 7.
Functional urban areas of Colombo Metropolitan: (a) 1988 (b) 1992 (c) 1997 (d) 2002 (e) 2007 (f) 2012 (g) (2017) and (h) 2022.
Fort and Pettah are well-known commercial districts within Colombo. However, Figure 7, shows that other than those two areas, Bambalapitiya, Kollupitiya, and Wellawatta exhibit a high level of functionality. These adjacent neighborhoods situated along Galle Road collectively form a significant commercial and residential hub. Another noteworthy center emerges around Rajagiriya and Battaramulla (Figure 1). These centers play a crucial role in contributing to the polynuclearity of Colombo, adding to its diverse urban landscape.
In addition, the findings reveal a dispersion of both morphological and functional polycentric areas, indicating an unequal distribution of urban structures within the city. Historically, urban areas have revolved around central business districts, serving as the primary economic and commercial hub. However, Figure 7 illustrates that the CMA is no longer characterized by a single dominant center, but rather a network of interconnected centers. As the CMA undergoes such urban expansion, it becomes imperative for the government to promote urban justice throughout the process of urban development. This need arises from the emerging trend of polynuclearity in urbanization, which aim to alleviate congestion and ensure a more balanced distribution of resources and opportunities.
The issue of polynuclearity within the CMA must be addressed in order to mitigate the adverse implications for transportation efficiency and environmental sustainability, as well as disparities in infrastructure quality. Additionally, the fragmented nature of services leads to social and economic disparities, which can be alleviated through proper allocation. By balancing the distribution of services, enhancing connectivity between centers, and fostering collaboration among cities, a number of challenges can be addressed.
4. Discussion
The results of the study examining urban growth in the study area reveal notable changes and trends over several decades. This expansion is not isolated, but influenced by many factors, including social, political, and economic events. Due to the concentration of urban development activities in the CMA and the current polarization of urbanization, the study area has become a focal point for economic development [26]. This study mainly proposes a methodology to identify morphological and functional dimensions by using the geographical distribution and interaction of urban pixels. Other studies have employed attribute data, including population, land use, gross domestic product, and employment [50,57,58] in morphological dimension identification.
In terms of functional dimensions, traditional research has concentrated on basic city functions, including housing, offices, transportation, commerce, and leisure [33,50,59]. Recently, research has broadened to examine aspects such as the movement of people, logistics, traffic patterns, and other functional centers [50,60]. Some studies connect morphological and functional dimensions to evaluate dual-dimension polycentric centers [1,20]. In such instances, separate perspectives are often employed for comparison and analysis, leaving a gap in the comprehensive examination of overall urban dual-dimensional systems.
In the Colombo Metropolitan Area (CMA), morphological and functional centers are not scattered, but interconnected due to urban sprawl. Yue et al. 2019 [20], observed continuous patterns in morphology, while Burgers (2012) [61] identified increased polycentricity in functionality. Similarly, Yu et al (2022) [50] found scattered multiple agglomerations in functionality compared to morphology. For the CMA, despite imbalances in development, both functional and morphological centers display similar characteristics, confirming a trend towards polynuclearity. Previous research on functional approaches varies, often using different data sources. This study, constrained by limited data on commuter flows and other factors, relies primarily on transportation network data. The primary difference between polycentricity and polynuclearity is their functional characteristics. Polycentricity emphasizes the functional links between local centers and their surrounding areas, whereas polynuclearity is centered on high building density within the urban core, without necessarily reflecting functional connections.
In this study, the spatial arrangement of the CMA was analyzed using UNA (Urban Network Analysis), Point of Interest, and hotspot analysis tools. The focus was on identifying two-dimensional functional and morphological centers. Although the results reliably identify morphological and functional centers consistent with the current spatial structure of the CMA, the emphasis is on understanding spatial distribution. The urban environment was characterized using spatial statistics and range identification based on Grama Niladhari divisions. The boundaries between urban centers were not clearly defined, as they extend beyond administrative boundaries and are more interconnected. This interconnection between centers is referred to as polycentricity. Cities experiencing urban sprawl often display polynuclearity due to their development patterns. In this study, spatial distribution serves as a “pattern”, whereas interaction is viewed as a “process”. Therefore, the key contribution of this study lies in how patterns affect processes and processes, in turn, reshape patterns. This leads to a comprehensive assessment of both morphological and functional polycentric spatial structures. Future research could further explore patterns of mobility and human behavior to evaluate polycentric structures in other megacities, potentially enhancing our understanding of urban dynamics and informing more effective urban planning strategies.
Identifying cities with polynuclearity is crucial because these cities can be transformed into sustainable cities by converting them into polycentric cities. In this approach, fragmented, independently developed centers with varying densities become more balanced, and isolated cities with functional roles can be interconnected. This transformation ultimately reduces urban sprawl, which is a significant issue in the current urban expansion of Colombo. Measuring polycentricity requires considerable attention and time, but the results can be valuable for introducing spatial policies aimed at managing urban sprawl. By identifying cities experiencing rapid urban development, local authorities can invest in these areas to enhance functionality. When core cities and their levels of morphology and functionality are identified, relevant authorities can develop strategies and plans to link these cities with others. Such an approach can balance urban development and promote unified growth. By creating well-integrated cities and metropolitan areas, it is possible to achieve sustainable urban development on both national and international scales.
This study is restricted by the resolution of the available spatial data for the CMA, which limit the broader applicability of the study’s methods. However, novel algorithms incorporating optical, SAR, and LiDAR data, as well as hyperspectral images, are now being developed by various scholars, which enhance the accuracy and provide better representation of urban dynamics [62,63]. Additionally, the analysis of urban sprawl was constrained by the availability of up-to-date attribute data, potentially impacting the accuracy of our assessments. Future research should consider expanding the analysis to include other rapidly urbanizing cities in Sri Lanka and South Asia to validate and refine these findings. Additionally, incorporating socio-economic factors into the analysis could provide a more comprehensive understanding of urban sprawl dynamics and inform more effective planning strategies.
5. Conclusions
This paper presents a new perspective for studying the scaling structure of urban spaces using satellite images and novel spatial units, such as natural cities and morphological and functional urban areas. By using this intra-urban approach, a more comprehensive understanding of the underlying structure of urban spaces can be achieved. In contrast to the traditional spatial units established by local governments, the current study employed a spatial clustering approach to identify concentrated areas that were objectively delineated as morphological and functional urban areas. This may be considered as a direction for prospective future research.
Measuring the level of urban sprawl can be a time-consuming task. However, it enables policymakers to design and implement spatial policies aimed at reducing its impact. Addressing the impacts of urban sprawl requires implementing smart growth strategies, such as compact development, mixed land use, efficient transportation systems, and the preservation of green spaces. These approaches can promote sustainable, livable, and resilient cities while mitigating the negative effects of urban sprawl. By identifying emerging cores in urban areas, government officials can direct investment to these areas, thus activating functional connections with surrounding areas and other cores.
The presented method, like all innovative concepts, has its limitations. The accuracy of the results highly depends on the quality and availability of data. The data available from local authorities have several problems, leading to outdated data layers. In this study, freely available images were utilized, and resolution and spatial scale influence the identification of morphological and functional centers. The CMA, being the only metropolitan area, has dynamic urban expansion, and static data should be updated frequently, as needed. Finally, Grama Niladhari divisions do not align with actual functional areas, which may lead to misidentification. Moreover, this study has the potential to improve our understanding of the interaction between different centers in relation to their morphological and functional dimensions. However, the methods could be further enhanced by incorporating new variables that model functionality while considering various socioeconomic factors [23,24,64]. In this regard, it is crucial for the GIS and remote sensing communities to play a pivotal role in urban studies to address these limitations.
In conclusion, understanding and learning about morphological and functional polycentric areas in metropolitan regions is crucial for effective urban planning, sustainable development, and the enhancement of economic, social, and environmental aspects of metropolitan areas. By gaining insights into resource allocation, transportation planning, economic development, urban resilience, and social integration, policymakers and urban planners can work towards creating well-connected, sustainable, and livable metropolitan regions that offer equitable opportunities and high quality of life for their residents.
Author Contributions
Conceptualization, H.P.U.F. and H.Z.; methodology, H.P.U.F.; formal analysis, H.P.U.F. and H.Z.; investigation, H.Z.; writing—original draft preparation, H.P.U.F.; writing-review and editing, H.Z.; supervision, H.Z.; project administration, H.M.R.P. and S.P.C. All authors have read and agreed to the published version of the manuscript.
Funding
This study was jointly supported by the Research Grants Council (RGC) of Hong Kong, China (HKU17613022), the National Natural Science Foundation of China, China (42071390), and the Shenzhen Science and Technology Program, China (JCYJ20210324124013037).
Data Availability Statement
Data are contained within the article.
Acknowledgments
The authors are grateful for the comments from the anonymous reviewers and the editors.
Conflicts of Interest
The authors declare no conflicts of interest.
References
- Chen, W.; Golubchikov, O.; Liu, Z. Measuring Polycentric Structures of Megaregions in China: Linking Morphological and Functional Dimensions. Environ. Plan. B Urban Anal. City Sci. 2020, 48, 239980832097468. [Google Scholar] [CrossRef]
- United Nations Department of Economic and Social Affairs (UNDESA). The World Urbanization Prospects: The 2018 Revisions; UNDESA: New York, NY, USA, 2019. [Google Scholar]
- Manesha, E.P.P.; Jayasinghe, A.; Kalpana, H.N. Measuring Urban Sprawl of Small and Medium Towns Using GIS and Remote Sensing Techniques: A Case Study of Sri Lanka. Egypt. J. Remote Sens. Space Sci. 2021, 24, 1051–1060. [Google Scholar] [CrossRef]
- Dadashpoor, H.; Azizi, P.; Moghadasi, M. Land Use Change, Urbanization, and Change in Landscape Pattern in a Metropolitan Area. Sci. Total Environ. 2019, 655, 707–719. [Google Scholar] [CrossRef] [PubMed]
- Abozeid, A.S.M.; AboElatta, T.A. Polycentric vs Monocentric Urban Structure Contribution to National Development. J. Eng. Appl. Sci. 2021, 68, 11. [Google Scholar] [CrossRef]
- Ding, Y.; Luo, Q. Polycentric Spatial Structure, Digital Economy and Urban Green Sustainable Development. J. Clean. Prod. 2024, 468, 143080. [Google Scholar] [CrossRef]
- Zhang, J.; Zhang, R.; Zhang, X.; Yuan, X. Polycentric Spatial Structure Evolution and Influencing Factors of the Kunming–Yuxi Urban Agglomeration: Based on Multisource Big Data Fusion. Land 2023, 12, 1340. [Google Scholar] [CrossRef]
- Chen, W.; Liu, W.; Ke, W.; Wang, N. Understanding Spatial Structures and Organizational Patterns of City Networks in China: A Highway Passenger Flow Perspective. J. Geogr. Sci. 2018, 28, 477–494. [Google Scholar] [CrossRef]
- Ma, M.; Lang, Q.; Yang, H.; Shi, K.; Ge, W. Identification of Polycentric Cities in China Based on NPP-VIIRS Nighttime Light Data. Remote Sens. 2020, 12, 3248. [Google Scholar] [CrossRef]
- Harris, C.D.; Ullman, E.L. The Nature of Cities. Ann. Am. Acad. Political Soc. Sci. 1945, 242, 7–17. [Google Scholar] [CrossRef]
- Yue, W.; Liu, Y.; Fan, P. Polycentric Urban Development: The Case of Hangzhou. Environ. Plan. A Econ. Space 2010, 42, 563–577. [Google Scholar] [CrossRef]
- Davoudi, S. Polycentricity in European Spatial Planning: From an Analytical Tool to a Normative Agenda. Eur. Plan. Stud. 2003, 11, 979–999. [Google Scholar] [CrossRef]
- Fujita, M.; Krugman, P.; Venables, A.J. The Spatial Economy: Cities, Regions, and International Trade; MIT Press: Cambridge, MA, USA, 1999. [Google Scholar] [CrossRef]
- Anas, A.; Kim, I. General Equilibrium Models of Polycentric Urban Land Use with Endogenous Congestion and Job Agglomeration. J. Urban Econ. 1996, 40, 232–256. [Google Scholar] [CrossRef]
- Anas, A.; Arnott, R.; Small, K.A. Urban Spatial Structure. J. Econ. Lit. 1998, 36, 1426–1464. [Google Scholar]
- Bartosiewicz, B.; Marcińczak, S. Investigating Polycentric Urban Regions: Different Measures—Different Results. Cities 2020, 105, 102855. [Google Scholar] [CrossRef]
- Alqhatani, M.; Setunge, S.; Mirodpour, S. Can a Polycentric Structure Affect Travel Behaviour? A Comparison of Melbourne, Australia and Riyadh, Saudi Arabia. J. Mod. Transp. 2014, 22, 156–166. [Google Scholar] [CrossRef]
- Siedentop, S.; Fina, S.; Krehl, A. Greenbelts in Germany's Regional Plans—An Effective Growth Management Policy? Landsc. Urban Plan. 2016, 145, 71–82. [Google Scholar] [CrossRef]
- Burger, M.J.; Van Der Knaap, B.; Wall, R.S. Polycentricity and the Multiplexity of Urban Networks. Eur. Plan. Stud. 2014, 22, 816–840. [Google Scholar] [CrossRef]
- Yue, W.; Wang, T.; Liu, Y.; Zhang, Q.; Ye, X. Mismatch of Morphological and Functional Polycentricity in Chinese Cities: An Evidence from Land Development and Functional Linkage. Land Use Policy 2019, 88, 104176. [Google Scholar] [CrossRef]
- Vaidyanathan, V.; King, R.A.; De Jong, M. Understanding Urban Transportation in India as Polycentric System. Policy Soc. 2013, 32, 175–185. [Google Scholar] [CrossRef]
- Alam, I.; Nahar, K.; Morshed, M.M. Measuring Urban Expansion Pattern Using Spatial Matrices in Khulna City, Bangladesh. Heliyon 2023, 9, e13193. [Google Scholar] [CrossRef]
- Pokhrel, K.P.; Ale, G.; Raut, A. Polycentric Settlement as A Sustainable Development Strategy: A Case of Baglung District, Nepal. Geogr. J. Nepal 2018, 11, 137–155. [Google Scholar] [CrossRef]
- He, X.; Cao, Y.; Zhou, C. Evaluation of Polycentric Spatial Structure in the Urban Agglomeration of the Pearl River Delta (PRD) Based on Multi-Source Big Data Fusion. Remote Sens. 2021, 13, 3639. [Google Scholar] [CrossRef]
- Xie, Z.; Ye, X.; Zheng, Z.; Li, D.; Sun, L.; Li, R.; Benya, S. Modeling Polycentric Urbanization Using Multisource Big Geospatial Data. Remote Sens. 2019, 11, 310. [Google Scholar] [CrossRef]
- Subasinghe, S.; Wang, R.; Simwanda, M.; Murayama, Y.; Vitanova, L.L. Neighborhood Dynamics of Urban Expansion Based on Morphological Spatial Pattern Analysis and Geospatial Techniques: A Case Study of the Colombo Metropolitan Area, Sri Lanka. Asian Geogr. 2022, 39, 155–175. [Google Scholar] [CrossRef]
- UN Habitat. State of Sri Lankan Cities Report; UN Habitat: Colombo, Sri Lanka, 2018; Available online: https://unhabitat.lk/wp-content/uploads/2018/12/SoSLC_Report_Final_Low-r.pdf (accessed on 12 June 2023).
- Weeraratne, B. Re-Defining Urban Areas in Sri Lanka; Institute of Policy Studies of Sri Lanka: Colombo, Sri Lanka, 2016. [Google Scholar]
- Subasinghe, S.; Estoque, R.; Murayama, Y. Spatiotemporal Analysis of Urban Growth Using GIS and Remote Sensing: A Case Study of the Colombo Metropolitan Area, Sri Lanka. ISPRS Int. J. Geo-Inf. 2016, 5, 197. [Google Scholar] [CrossRef]
- Munasinghe, J. Policies and Issues in Urban Development in Sri Lanka: An Examination of the Inter-Domain Gaps. Sri Lanka J. Soc. Sci. 2014, 35, 9. [Google Scholar] [CrossRef]
- Sri Lanka Central Bank. Economic and Social Statistics 2023; Sri Lanka Central Bank: Colombo, Sri Lanka, 2023. Available online: https://www.cbsl.gov.lk/en/publications/other-publications/statistical-publications/economic-and-social-statistics-of-sri-lanka/ess-2023 (accessed on 12 June 2023).
- Wickramaarachchi, N.C.; Rathnamalala, T. Consequences of the State Land Alienation Programme in Sri Lanka. J. Soc. Sci. Humanit. Rev. 2022, 7, 248–270. [Google Scholar] [CrossRef]
- Lv, Y.; Zhou, L.; Yao, G.; Zheng, X. Detecting the True Urban Polycentric Pattern of Chinese Cities in Morphological Dimensions: A Multiscale Analysis Based on Geospatial Big Data. Cities 2021, 116, 103298. [Google Scholar] [CrossRef]
- Yang, Z.; Chen, Y.; Zheng, Z.; Wu, Z. Identifying China’s Polycentric Cities and Evaluating the Urban Centre Development Level Using Luojia-1A Night-Time Light Data. Ann. GIS 2022, 28, 185–195. [Google Scholar] [CrossRef]
- Hogg, C. Sri Lanka: Prospects for Reform and Reconciliation; Asia Programme Paper; Chatham House: London, UK, 2010; Available online: https://www.chathamhouse.org/sites/default/files/1011pp_srilanka_0.pdf (accessed on 12 June 2023).
- Phan, T.N.; Kuch, V.; Lehnert, L.W. Land Cover Classification Using Google Earth Engine and Random Forest Classifier—The Role of Image Composition. Remote Sens. 2020, 12, 2411. [Google Scholar] [CrossRef]
- Liu, X.; Li, X.; Chen, Y.; Tan, Z.; Li, S.; Ai, B. A New Landscape Index for Quantifying Urban Expansion Using Multi-Temporal Remotely Sensed Data. Landsc. Ecol. 2010, 25, 671–682. [Google Scholar] [CrossRef]
- Yang, C.; Li, Q.; Hu, Z.; Chen, J.; Shi, T.; Ding, K.; Wu, G. Spatiotemporal Evolution of Urban Agglomerations in Four Major Bay Areas of the US, China, and Japan from 1987 to 2017: Evidence from Remote Sensing Images. Sci. Total Environ. 2019, 671, 232–247. [Google Scholar] [CrossRef] [PubMed]
- Liao, K.; Huang, W.; Wang, C.; Wu, R.; Hu, Y. Spatio-Temporal Evolution Features and Impact Factors of Urban Expansion in Underdeveloped Cities: A Case Study of Nanchang, China. Land 2022, 11, 1799. [Google Scholar] [CrossRef]
- Yang, Y.; Liu, Y.; Li, Y.; Du, G. Quantifying Spatio-Temporal Patterns of Urban Expansion in Beijing During 1985–2013 with Rural-Urban Development Transformation. Land Use Policy 2018, 74, 220–230. [Google Scholar] [CrossRef]
- Fei, W.; Zhao, S. Urban Land Expansion in China's Six Megacities from 1978 to 2015. Sci. Total Environ. 2019, 664, 60–71. [Google Scholar] [CrossRef]
- Zhao, S.; Zhou, D.; Zhu, C.; Qu, W.; Zhao, J.; Sun, Y.; Huang, D.; Wu, W.; Liu, S. Rates and Patterns of Urban Expansion in China’s 32 Major Cities Over the Past Three Decades. Landsc. Ecol. 2015, 30, 1541–1559. [Google Scholar] [CrossRef]
- Tobler, W. A Computer Movie Simulating Urban Growth in the Detroit Region. Econ. Geogr. 1970, 46, 234–240. [Google Scholar] [CrossRef]
- Tobler, W. Three Presentations on Geographical Analysis and Modeling; Technical Report 1993; National Center for Geographic Information and Analysis: Santa Barbara, CA, USA, 1993. [Google Scholar]
- Wilson, A.G. A Statistical Theory of Spatial Distribution Models. Transp. Res. 1967, 1, 253–269. [Google Scholar] [CrossRef]
- Yang, Z.; Chen, Y.; Guo, G.; Zheng, Z.; Wu, Z. Using Nighttime Light Data to Identify the Structure of Polycentric Cities and Evaluate Urban Centers. Sci. Total Environ. 2021, 780, 146586. [Google Scholar] [CrossRef]
- Cai, J.; Huang, B.; Song, Y. Using Multi-Source Geospatial Big Data to Identify the Structure of Polycentric Cities. Remote Sens. Environ. 2017, 202, 210–221. [Google Scholar] [CrossRef]
- Chen, Z.; Yu, B.; Song, W.; Liu, H.; Wu, Q.; Shi, K.; Wu, J. A New Approach for Detecting Urban Centers and Their Spatial Structure with Nighttime Light Remote Sensing. IEEE Trans. Geosci. Remote Sens. 2017, 55, 6305–6319. [Google Scholar] [CrossRef]
- Li, H.; Liu, Y.; Zhang, H.; Xue, B.; Li, W. Urban Morphology in China: Dataset Development and Spatial Pattern Characterization. Sustain. Cities Soc. 2021, 71, 102981. [Google Scholar] [CrossRef]
- Yu, H.; Yang, J.; Li, T.; Jin, Y.; Sun, D. Morphological and Functional Polycentric Structure Assessment of Megacity: An Integrated Approach with Spatial Distribution and Interaction. Sustain. Cities Soc. 2022, 80, 103800. [Google Scholar] [CrossRef]
- Sevtsuk, A.; Mekonnen, M. Urban Network Analysis. A New Toolbox ArcGIS. Int. J. Geomat. Spat. Anal. 2012, 22, 287–305. [Google Scholar] [CrossRef]
- Amarawickrama, S.; Singhapathirana, P.; Rajapaksha, N. Defining Urban Sprawl in the Sri Lankan Context: With Special Reference to the Colombo Metropolitan Region. J. Asian Afr. Stud. 2015, 50, 590–614. [Google Scholar] [CrossRef]
- JICA. CoMTrans Urban Transport Master Plan; JICA: Tokyo, Japan, 2014; Available online: https://openjicareport.jica.go.jp/pdf/12176665.pdf (accessed on 24 April 2023).
- Ellis, P.; Roberts, M. Leveraging Urbanization in South Asia: Managing Spatial Transformation for Prosperity and Livability; World Bank: Washington, DC, USA, 2015; Available online: http://hdl.handle.net/10986/22549 (accessed on 12 June 2023).
- Kelegama, S.; Corea, G. Economic Policy in Sri Lanka: Issues and Debates; Sage Publications: New Delhi, India; Thousand Oaks, CA, USA; London, UK, 2004; ISBN 0-7619-3278-X (Hb). [Google Scholar]
- Lityński, P.; Serafin, P. Polynuclearity as a Spatial Measure of Urban Sprawl: Testing the Percentiles Approach. Land 2021, 10, 732. [Google Scholar] [CrossRef]
- García-López, M.-À.; Muñiz, I. Employment Decentralisation: Polycentricity or Scatteration? The Case of Barcelona. Urban Stud. 2010, 47, 3035–3056. [Google Scholar] [CrossRef]
- Sun, T.; Han, Z.-F.; Wang, L.; Li, G. Suburbanization and Sub-Centering of Population in the Beijing Metropolitan Area: A Nonparametric Analysis. Chin. Geogr. Sci. 2012, 22, 472–482. [Google Scholar] [CrossRef]
- Hao, F.; Lu, M.; Yu, T.; Wang, S. Identification and Characterization of Urban Polycentric Structure Based on Points of Interest in Shenyang, China. Growth Chang A J. Urban Reg. Policy 2024, 55, e12697. [Google Scholar] [CrossRef]
- Xiao, Y.; Wang, Y.; Miao, S.; Niu, X. Assessing Polycentric Urban Development in Shanghai, China, with Detailed Passive Mobile Phone Data. Environ. Plan. B Urban Anal. City Sci. 2021, 49, 239980832098230. [Google Scholar] [CrossRef]
- Burger, M.; Meijers, E. Form follows function? Linking morphological and functional polycentricity. Urban Studies 2012, 49, 1127–1149. [Google Scholar] [CrossRef]
- Lin, Y.; Zhang, H.; Li, G.; Wang, T.; Wan, L.; Lin, H. Improving impervious surface extraction with shadow-based sparse representation from optical, SAR, and LiDAR data. IEEE J. Sel. Top. Appl. Earth Obs. Remote Sens. 2019, 12, 2417–2428. [Google Scholar] [CrossRef]
- Wang, T.; Zhang, H.; Lin, H.; Jia, X. A sparse representation method for a priori target signature optimization in hyperspectral target detection. IEEE Access 2017, 6, 3408–3424. Available online: https://ieeexplore.ieee.org/document/8110614 (accessed on 2 September 2024). [CrossRef]
- Wang, Y.; Niu, X. Polycentricity Measurement of China’s Urban Agglomerations Considering Internal and External Connections. Front. Urban Rural Plan. 2023, 1, 19. [Google Scholar] [CrossRef]
Disclaimer/Publisher’s Note: The statements, opinions and data contained in all publications are solely those of the individual author(s) and contributor(s) and not of MDPI and/or the editor(s). MDPI and/or the editor(s) disclaim responsibility for any injury to people or property resulting from any ideas, methods, instructions or products referred to in the content. |
© 2024 by the authors. Licensee MDPI, Basel, Switzerland. This article is an open access article distributed under the terms and conditions of the Creative Commons Attribution (CC BY) license (https://creativecommons.org/licenses/by/4.0/).