Article

Labile Fraction of Organic Carbon in Soils from Natural and Plantation Forests of Tropical China

1
College of Geography and Environmental Science, Hainan Normal University, Haikou 571158, China
2
Queensland Alliance for Environmental Health Sciences (QAEHS), The University of Queensland, Brisbane, QLD 4102, Australia
3
College of Life Sciences, Hainan Normal University, Haikou 571158, China
4
Center for Catalysis and Clean Energy, School of Environment and Science, Griffith University, Gold Coast, QLD 4222, Australia
*
Author to whom correspondence should be addressed.
Sustainability 2024, 16(17), 7836; https://doi.org/10.3390/su16177836
Submission received: 5 August 2024 / Revised: 24 August 2024 / Accepted: 4 September 2024 / Published: 9 September 2024
(This article belongs to the Section Soil Conservation and Sustainability)

Abstract

:
Labile organic carbon (LOC) is a key driver of forest ecosystem function and may mitigate global climate change through carbon sequestration. To explore the accumulation of LOC in tropical forest soils, we sampled from both planted and natural forests in Hainan Province, the southernmost province of China. We analyzed the concentrations of total organic carbon (TOC) and LOC and characterized various physicochemical properties such as pH and soil texture to understand their inter-relationships in tropical natural and plantation forests. Although the TOC concentration was higher in plantation forests (88.61 g/kg) than in natural forests (68.73 g/kg), the LOC concentration was higher in natural forests (5.12 mg/g) than in plantation forests (4.07 mg/g). Over a depth range of 0–50 cm from the surface, both forest types showed decreasing TOC and LOC concentrations with increasing soil depth, indicating surface aggregation. The soil is slightly acidic and primarily composed of sand particles. Correlation analysis showed a highly significant negative correlation between LOC concentration and soil pH in both forest types (p < 0.01). Soil LOC was positively correlated with soil clay and silt particles and negatively correlated with sand particles. This study provides valuable insights into soil carbon sequestration in tropical rainforest ecosystems in both plantation and natural tropical forests.

1. Introduction

Soil is the largest carbon pool in the terrestrial ecosystem [1,2], storing approximately 1500–2400 Pg of carbon globally, which exceeds twice the atmospheric carbon pool [3] and 2–3 times the carbon pool of terrestrial vegetation [4]. Soil carbon storage significantly impacts global climate dynamics [5], acting as an enormous carbon sink with the potential to sequester 0.4–1.2 PgC/yr globally [6]. Through appropriate ecosystem management measures, approximately 5–15% of CO2 emissions from fossil fuels can be offset annually [4]. However, if soil carbon storage is not properly managed, the soil may become a substantial source of CO2 emissions [7]. Therefore, effective management of soil organic carbon pools is important for increasing soil carbon sinks, reducing atmospheric CO2, and mitigating global climate change [8].
The concentration of organic carbon is a marker of soil quality, directly reflecting physical, chemical and biological processes underway in the soil and serving as an indicator of soil fertility and land productivity [9]. Soil organic carbon mainly originates from animal and plant residues, microorganisms and humus [10]. The structural composition of the soil carbon pool is complex and highly variable due to its large reserves [11]. Research on forest soil organic carbon and its components is beneficial for understanding soil carbon sequestration mechanisms, providing reasonable forest management measures and achieving the goal of reducing carbon emissions [12]. Soil carbon can be divided into labile organic carbon (LOC) and inert organic carbon pools [13]. The LOC is a heterogeneous mixture of organic matter subject to rapid turnover in the organic carbon pool [14,15]. It is easily decomposed and utilized by soil microorganisms and can directly supply plant nutrients [16]. Although LOC accounts for only a small portion of total organic carbon (TOC), it is one of the most important energy sources in soil [17]. Compared to TOC, LOC is highly sensitive and can reflect small changes in soil quality in a short time [18]. Therefore, research on LOC dynamics aids in understanding soil organic carbon turnover, nutrient cycling and microbial activity.
The accumulation and distribution of the TOC and LOC are affected by various biophysical factors [19,20,21,22,23]. Soil pH and soil particle size are pivotal in determining soil quality and LOC through influencing nutrient availability, microbial activity, organic matter decomposition and soil structure [19,24,25]. Factors such as vegetation diversity and human management interventions can result in different soil pH and soil particle sizes [19]. However, research on the effects and correlation of soil pH and soil particle size on the composition and accumulation of TOC and LOC across different forest types is limited. Soil microbial activities are different under various acid–base conditions, which could further affect the LOC accumulation and transformation [26]. Organic carbon can be influenced by soil particle size and mineral content, which affect soil aggregation, surface area and soil water holding capacity [27].
Carbon cycling in tropical rainforests greatly impacts the ecosystem stability, environment preservation, global carbon cycle and sustainable development [28]. The soil carbon pools in tropical regions are extremely sensitive to changes in temperature and atmospheric CO2 concentration [29]. Given global climate change, understanding soil organic carbon in tropical rainforests is important for guiding rational resource development and utilization and sustainable development [30]. Similarly, research on soil organic carbon accumulation patterns in tropical rainforests can provide a decision-making basis for establishing a carbon market in the region.
Yang et al. [31] reported a 44–264 t/hm2 range of soil carbon storage (average 107.8 t/hm2) across various forest types in China, with averages of 109.1 t/hm2 in natural forests and 107.1 t/hm2 in plantation forests. Wang et al. [32] studied soil carbon storage and soil organic carbon stability in subtropical mixed and pure forests and found that mixed forests have a greater capacity for soil carbon sequestration due to increased biomass carbon. In the global forest ecosystem, the carbon stock of tropical forests is about 471 Pg, comprising 55% of the global forest stock, 32% of which is stored in soil [33]. Tropical forests are mainly distributed near the equator, extending to the Tropics of Capricorn and Cancer and including regions such as the Amazon Basin in South America, the Congo Basin, the Gulf of Guinea, the eastern portion of Madagascar in Africa, India and the Malay Archipelago in Asia [34]. Tropical forests in China are mainly distributed in Hainan Province and Xishuangbanna, Yunnan Province.
Hainan Province hosts the largest rainforest in China and has both typical and unique rainforest types [26,35]. Tropical rainforests in southeastern Hainan are mainly composed of plantation and natural forests. Limited studies have reported differences in LOC accumulation between these types of forest. Therefore, this study aimed to (1) characterize the concentrations of TOC and LOC in tropical rainforests of Hainan Island; (2) compare the distributions of TOC and LOC in each forest type; and (3) investigate the effect of soil pH and soil particle size on TOC and LOC. The results reveal the forest types affecting the spatial distribution of soil organic carbon and provide a scientific basis for maintaining the carbon balance of tropical rainforests.

2. Materials and Methods

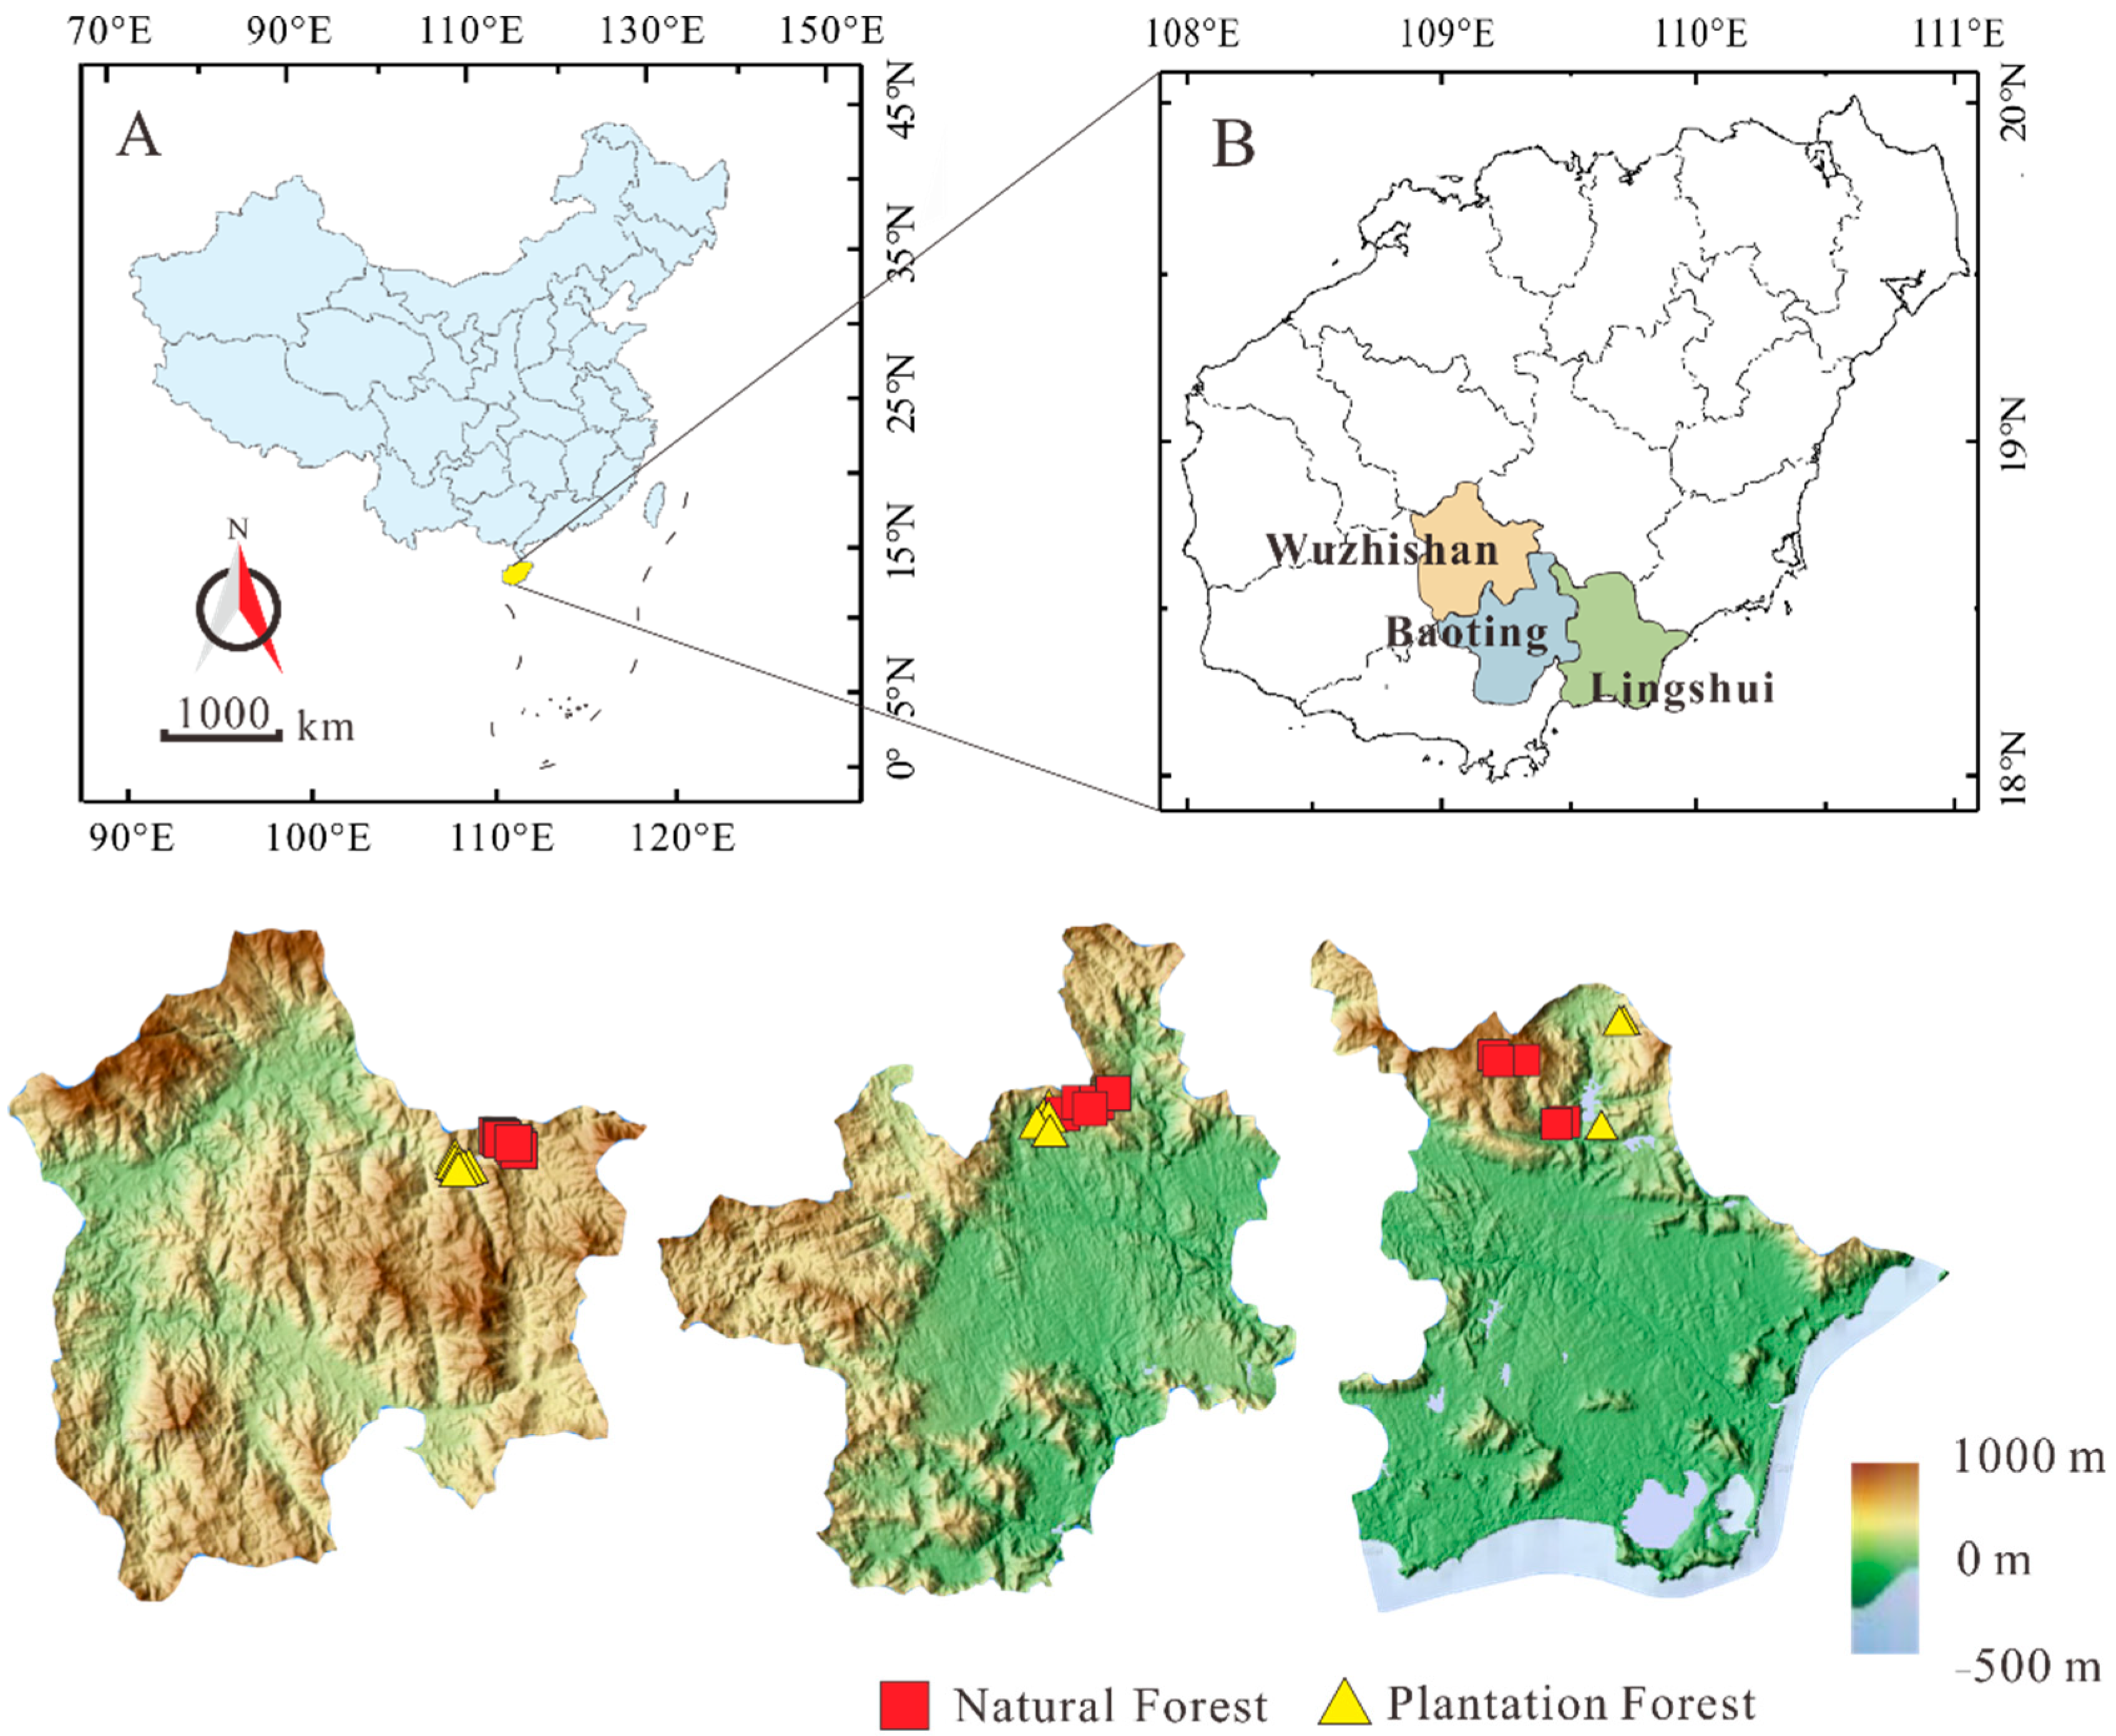
2.1. Experimental Site

Samples were collected in Wuzhishan City, Baoting County and Lingshui County (Figure 1) in southeast Hainan Island (18°22′–19°02′ N, 109°19′–110°08′ E). The average temperature in the study area is 23 °C and annual rainfall ranges between 1900 and 2400 mm. Although rainfall is abundant, its spatial and temporal distribution is irregular, with clear dry and wet seasons and frequent tropical storms and typhoons [36]. The terrain is primarily mountainous, and the soil type include latosol, lateritic red soil and yellow soil. The soil parent consists of basalt, granite and shallow sea sediment.
The Wuzhishan National Nature Reserve (WZS) (main peak altitude 1868 m), Diaoluoshan National Nature Reserve (DLS) (main peak altitude 1499 m) and Qixianling Hot Spring National Forest Park (QXL) (main peak altitude 1126 m) are located in the study area, where the original forests are widely distributed and well preserved (Table S1). The main vegetation type of WZS is mountainous laurel forest, dominated by tropical and subtropical plants such as Betula, Lauraceae and Hamamelidaceae. There are also small amounts of temperate species, such as Carpinus turczaninovii, Acer laurinum, Cephalotaxus sinensis and Rhododendron L. [37]. The predominant communities include Dacrydium pierrei Hickel and Quercus pannosa communities, which are generally predominant in Hainan. The DLS forest vegetation type is tropical secondary forest, monsoon forest and laurel forest, with a 96.26% forest cover rate. The main vegetation types include Vatica mangachapoi Blanco, Diospyros hainanensis Merr., Dacrydium pierrei Hickel, Syzygiumbaviense, Alseodaphne hainanensis, Cyclobalanopsis championii, Ternstroemia and Rapanea neriifolia [38]. The tree species in QXL include Vatica mangachapoi Blanco, Radermachera hainanensis, Streblus ilicifolius, Gonocaryum lobbianum, Sterculia hainanensis and Mallotus anomalus [37].

2.2. Sample Sources and Pre-Treatment

The study area features diverse soil types, climate conditions and vegetation types. Therefore, we selected a total of 30 representative rainforests in WZS, QXL and DLS, including 17 natural and 13 plantation forests after we conducted data statistics and field surveys on forest origins and soil types in Hainan Province (Figure 1). A composite sample was obtained at each sampling site by collecting five subsamples from a 5 m × 5 m area using the diagonal five-point mixing sampling method. Soil profiles ranging from 0 to 50 cm were collected at different depths, divided into 0–10 cm (surface), 10–30 cm (middle) and 30–50 cm (bottom). We collected 1 kg of soil for each profile for 90 soil samples. All samples were stored in sealed polyethylene bags and shipped back to the laboratory for analysis.
Plant roots and residues in soil samples were removed before the samples were crushed and air-dried at 25 °C. After air drying, the soil samples were ground, crushed in a mortar, and divided into two aliquots. One aliquot was sieved through a 2 mm mesh to determine its physical and chemical properties, while the other was sieved through a 0.25 mm mesh for the quantitation of TOC and LOC.

2.3. Analytical Methods

Soil samples were dried to a constant weight, weighted (0.5 g) and placed in a small beaker. To eliminate the influence of inorganic carbon on the TOC measurements, each soil sample was acidified with HCl before analysis. Specifically, 5 mL of 1 mol/L HCl was added to remove carbonate from the soil. The solution was mixed with a magnetic stirrer until the carbonate had reacted completely and no bubbles were generated. After standing for 24 h, the samples were rinsed with distilled water and centrifuged 3–4 times. The supernatant was removed and tested with pH indicator strips. The rinses were repeated until the solution reached neutral pH. The sample was then dried in an oven for 24 h, cooled and ground to a powder. Finally, the samples were wrapped in aluminium foil and the TOC concentration was determined with a TOC analyser (Elemental Vario Macro Cube, Elementar Analysensysteme GmbH, Langenselbold, Germany).
The LOC was measured using potassium permanganate oxidative treatment [39]. Potassium permanganate standards were prepared, and absorbance was measured at 565 nm to generate a standard curve. A sample of air-dried soil (15 mg) was weighed and 25 mL of 333 mmol/L KMnO4 solution was added and incubated with shaking for 1 h, then centrifuged for 5 min (4000 r/min). The supernatant was removed, diluted 1:250 with deionised water. Then absorbance was measured at 565 nm. The difference in absorbance between the sample and a blank was calculated. Then KMnO4 consumption by the oxidising volatile component was calculated. Since oxidation of 0.75 mM or 9 mg carbon consumes 1 mmol/L KMnO4, the LOC concentration can be calculated based on KMnO4 consumption.
Along with the measurements of TOC and LOC, key soil characteristics including soil pH and soil particle size were also analysed. The analysis methods have been described in our previous study [26].
All statistical analysis and plots were performed using SPSS 22.0, CorelDRAW X4, GraphPad Prism 9 and Origin 2017. Differences in LOC concentrations between soil layers or forest types were tested by one-way analysis of variance (ANOVA). The least significant difference (LSD) test was performed to determine significant differences among sampling sites. Correlations among TOC, LOC and key soil characteristics (pH level and soil particle size) were determined using Pearson’s correlation.

3. Results and Discussion

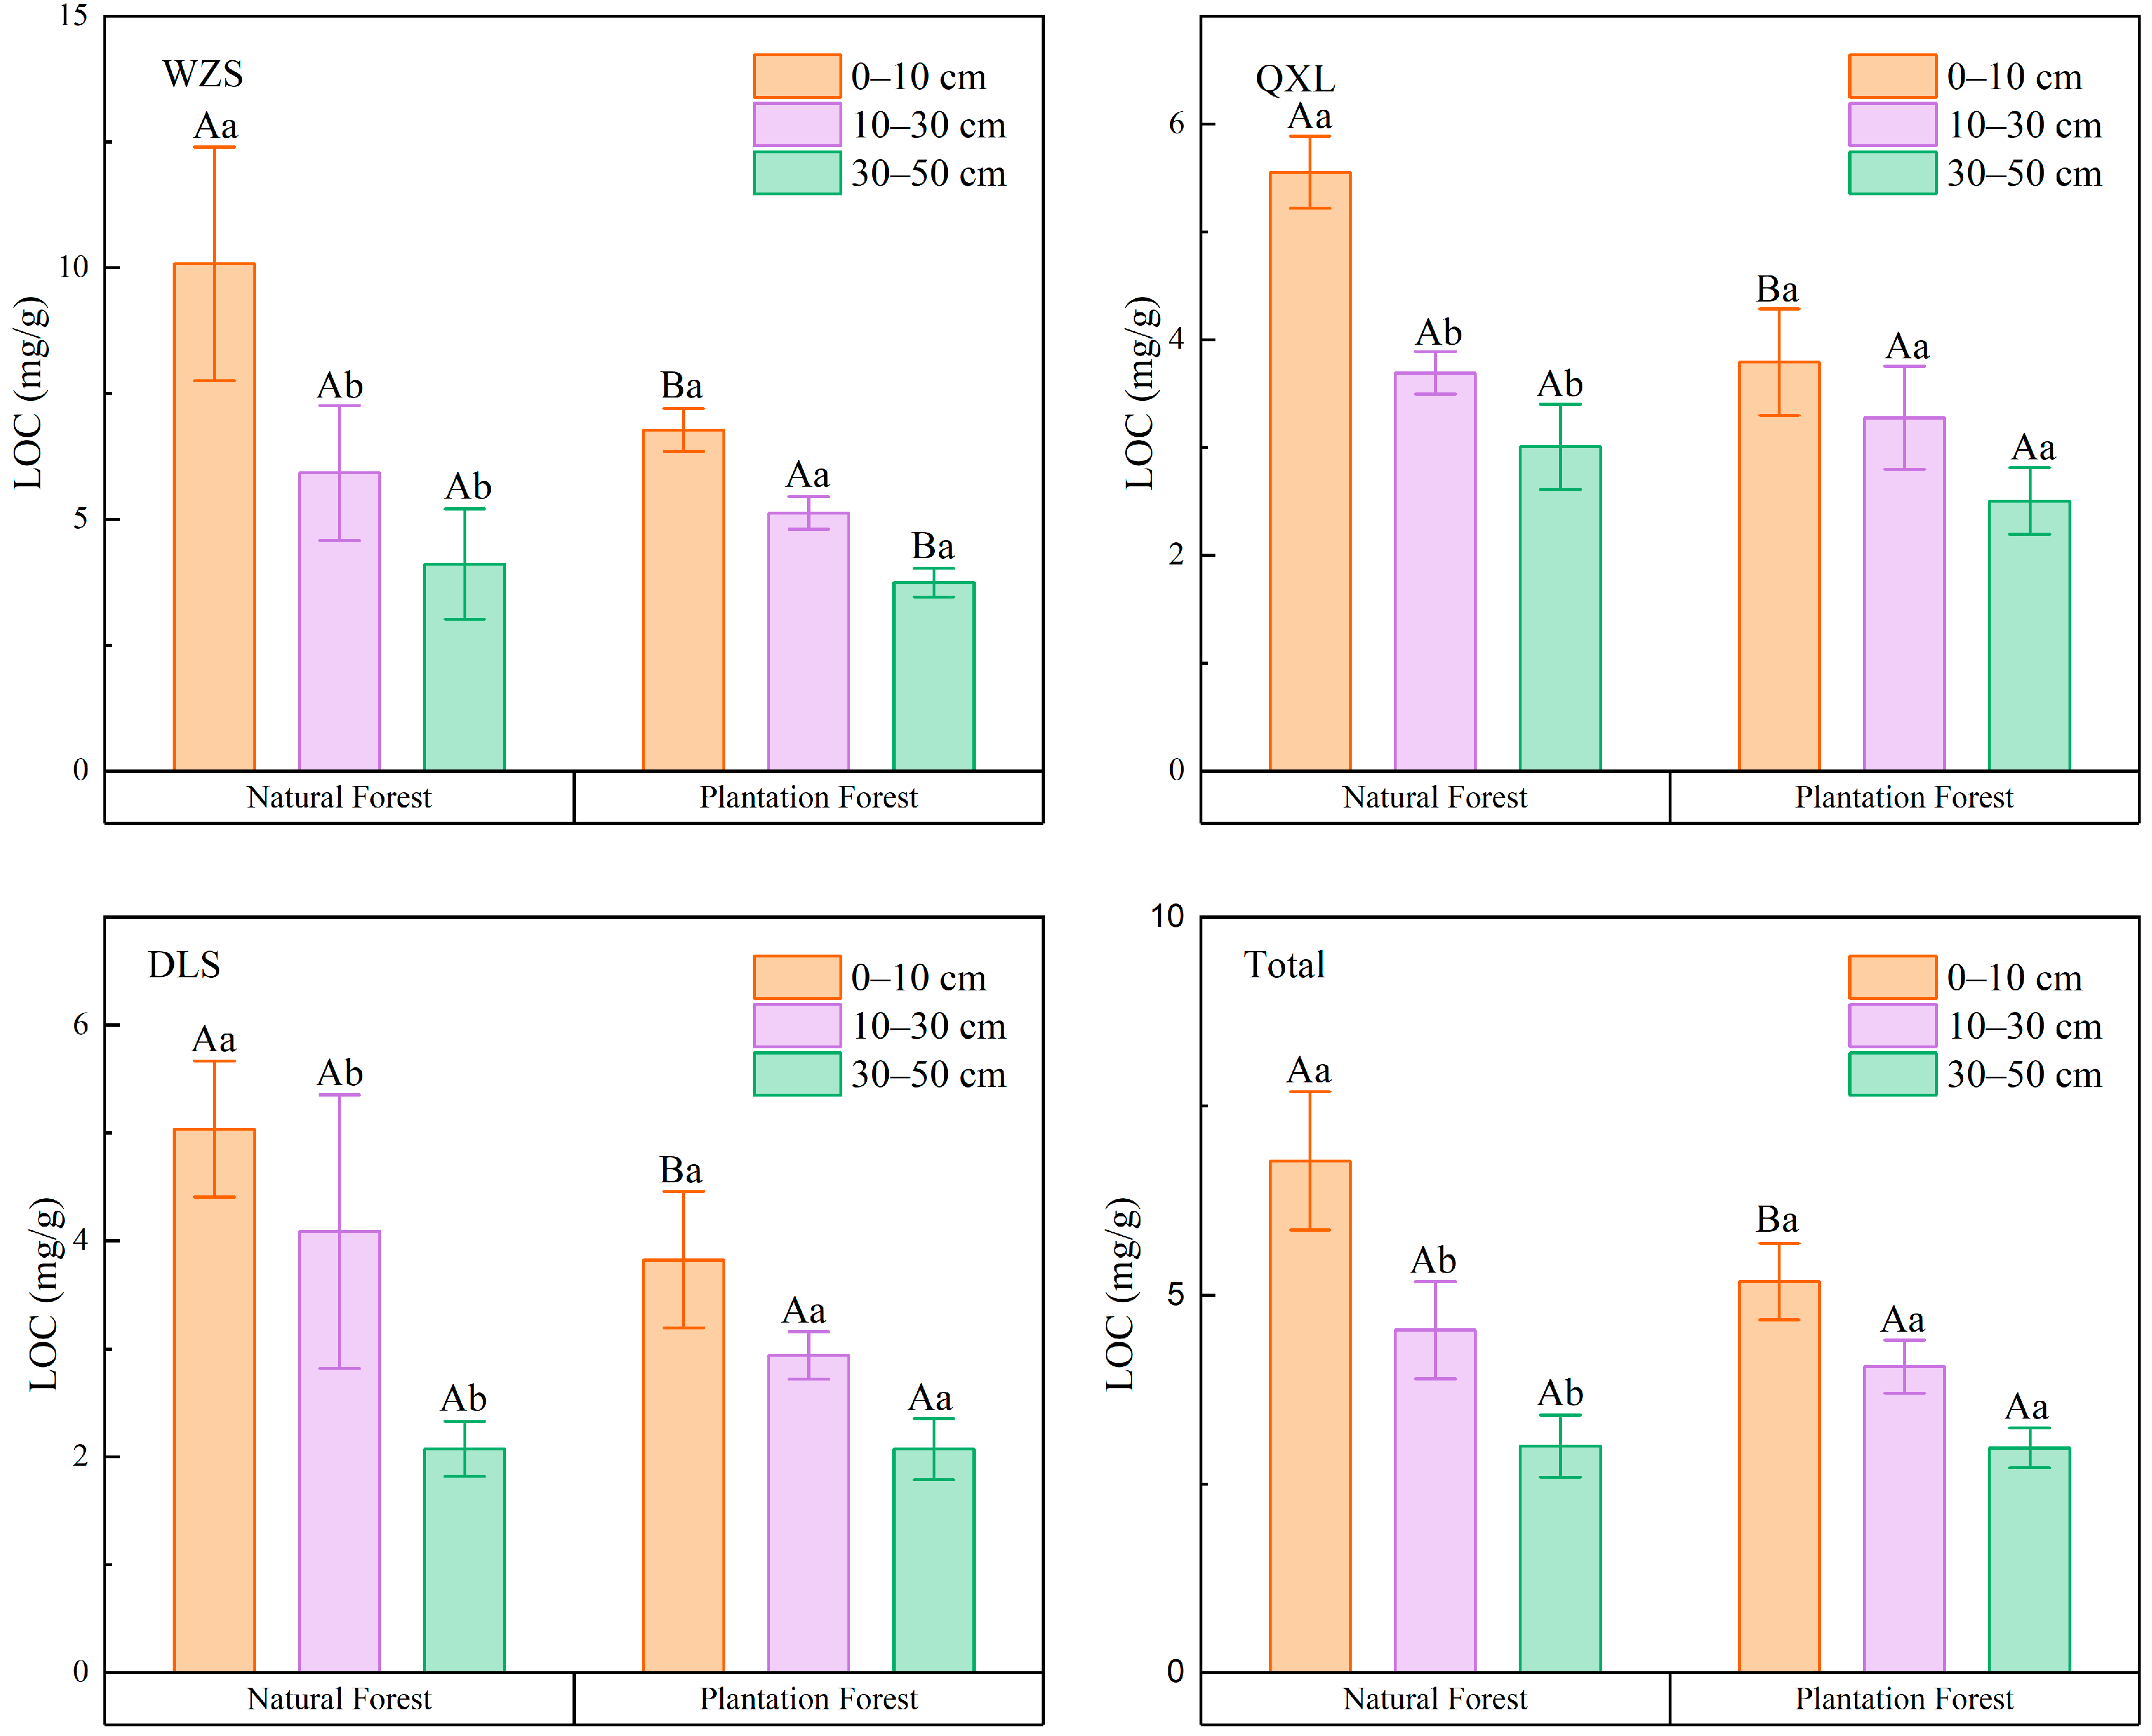
3.1. Spatial Trend of LOC in Two Different Forest Types

The TOC and LOC concentrations varied by forest type in the three sampling areas [2,40]. Specifically, the TOC concentrations were 88.61 g/kg in tropical rainforest plantations and 68.73 g/kg in natural forests, which aligns with our previous findings [2]. As a sensitive indicator of soil carbon pool [18], LOC is easily decomposed and utilised by soil microorganisms [35] and can be directly supplied to plants. Therefore, this study explored the LOC in natural and plantation forests.
Similar to TOC (Figure S1), the LOC concentration of natural and plantation forests was highest in WZS (p < 0.05), followed by QXL and DLS (Table 1), indicating that WZS has higher soil carbon activity and faster transformation rates. The LOC concentration significantly differed between forest types (p < 0.05). The LOC concentrations were higher in natural forests in WZS, QXL and DLS (7.64, 4.08 and 3.73 mg/g, respectively) than in plantation forests (5.22, 3.19 and 2.95 mg/g, respectively), indicating greater soil carbon activity and faster transformation rates in natural forests. Additionally, the natural forests displayed a higher coefficient of variation for LOC in comparison to the plantation forests.
Although the LOC proportion in TOC is relatively small, LOC can significantly impact soil nutrient cycling, carbon turnover and microbial activity [17]. Soil LOC is more responsive to environmental changes and is influenced by factors such as vegetation type, successional stages of forest communities, seasonal changes and soil physicochemical properties [31,41]. The LOC in the soil is mainly decomposed from relatively new plant litter; therefore, better hydrothermal conditions increase the decomposition rate and yield higher LOC concentrations. Compared with QXL and DLS, WZS has better hydrothermal conditions, resulting in higher TOC and LOC concentrations.
Consistent with previous studies, we observed significantly higher proportions of LOC in natural forests than in plantation forests. Yuan et al. [42] found that soil microbial biomass carbon, particulate organic carbon and readily oxidised organic carbon were significantly higher in secondary natural forests than in planted forests with same planting years in a subtropical region. Sheng et al. [43] found that LOC storage decreases in transforming natural forests into plantation forests, with the loss of particulate organic carbon mainly occurring on the soil surface, while dissolved organic carbon significantly decreased in the deep soil layers. On the one hand, the short planting period of plantation forests, single forest structure and limited sources of soil organic carbon contribute to the low LOC concentration of plantation forests. On the other hand, in tropical regions, plant litter is difficult to sequester on the soil surface and decomposes rapidly under high temperatures and humid climate conditions. Therefore, the LOC concentration was higher in natural forests than in planted forests.

3.2. Vertical Distribution Trend of LOC

The average soil LOC concentration in the sampling soil layer (0–50 cm) was 4.65 mg/g, with the highest concentration in the surface layer at 6.06 mg/g and the lowest in the bottom layer at 3.61 mg/g. The concentration of LOC was significantly higher in the surface soil compared to the other layers (p < 0.05), and the difference between the 10–30 and 30–50 layers was not significant. The bottom soil layer had the highest coefficient of variation of LOC concentration, indicating that the distribution of LOC in the deep soil layer is uneven. This unevenness may be due to differences in organic carbon sources and accumulation rates across various soil depths, which can potentially impact the long-term stability and productivity of the soil [44,45].
Average TOC concentrations from surface to bottom layers of tropical plantation forests on Hainan Island were 125.58, 82.71 and 57.56 g/kg, respectively, and in natural forests were 109.99, 51.07 and 46.52 g/kg (Table S2). The LOC concentrations in plantation forests were 5.18, 4.05 and 2.98 mg/g from surface to bottom soil layers, versus 6.77, 4.54 and 4.10 mg/g in the layers of natural forest soil (Figure 2). The lower TOC amount in natural forests may be due to the slower growth of tree species, the longer and more complex process of organic carbon accumulation, and the minimal soil disturbance, which leads to a more balanced accumulation and stabilization of organic carbon [46]. In contrast, plantation forests, with fast-growing tree species and management practices, promote higher organic carbon storage [47]. In natural forests, higher levels of LOC may be attributed to factors such as plant diversity, complex ecosystems, biological diversity, favorable soil conditions and higher microbial activity. Additionally, natural forests experience less anthropogenic disturbance compared to plantation forests, which contributes to the accumulation of LOC in the soil. In contrast, plantation forests, due to differences in management practices and growth conditions, may lead to easier decomposition and mineralization of organic carbon, resulting in lower levels of LOC [48].
The LOC concentrations of tropical planted forests and natural forests in eastern Hainan Island were surface layer > middle layer > bottom layer. The LOC concentration in surface layer of natural forest was significantly higher than in other layers (p < 0.05). The LOC concentrations of the surface layer were significantly higher in natural forests in WZS and QXL than in the middle and bottom layers (p < 0.05), while the LOC concentration of the surface and middle layers in the natural forests of DLS were significantly higher than that of the bottom layer (p < 0.05). The LOC concentration did not significantly differ between the soil layers of the three sampled plantation forests (p < 0.05). For different forest types, the LOC concentration in the topsoil was significantly higher in natural forests than in plantation forests (p < 0.05). Besides the bottom layer in DLS, where the LOC concentration in the natural forest was slightly lower than that of the plantation forest, the LOC concentration in the middle and bottom layers of natural forests in other sampling sites was higher, but the differences were not significant.
Soil LOC largely depends on the TOC. This study found that the distributions of TOC and LOC in the vertical profile of soil were similar, with significantly higher concentrations in the 0–10 cm layer than in the 10–30 and 30–50 cm layers, a phenomenon known as surface aggregation that may be due to the lower levels of soil organic matter in deep soil layer. Humus decomposed by microbial activity and the number of plant roots decreases with an increase in soil depth. In addition, the deep soil layer has a large bulk density, is compact soil and has weak microbial activity. Thus, both TOC and LOC exhibited a decrease with the increase in soil depth throughout the study area.

3.3. Comparison of LOC/TOC Ratio

The LOC/TOC ratio can reflect the impact of different forest types on soil carbon behaviour. The LOC/TOC ratio ranged from 2.24% to 28.92% in the study area and was higher in natural forests (9.29%) than in planted forests (5.19%) (Figure 3). The LOC/TOC ratios were significantly higher in the middle and bottom layers of natural forests than in plantation forests (p < 0.05), and the surface layer also had a higher LOC/TOC ratio, but the difference between natural and planted forests was not significant. The LOC/TOC ratio in plantation forests increased with increasing soil depth, but the differences between the surface, middle and bottom layers were not significant. In contrast, the LOC/TOC ratio in natural forests was significantly higher in the middle and bottom layers than in the surface soil (p < 0.05).
The LOC/TOC ratio was higher throughout the sampled 50 cm depth of tropical natural forest soil than the plantation forests, consistent with other studies. Yang [31] studied the effects of conversion from natural to plantation forest on labile fractions of organic carbon and found a higher proportion of light fraction organic carbon, particulate organic carbon and microbial biomass carbon in the TOC from natural forests than in the plantation forests (particulate organic carbon > light fraction organic carbon > microbial biomass carbon). However, we observed a different trend in the vertical profile, perhaps due to differences in understory litter and vegetation growth.

3.4. Correlation between LOC Concentration and Selected Soil Properties

The physical and chemical properties of natural and plantation forest soils differed (Table 2). Soil pH varied from 3.75 to 6.86 over 50 cm depth from the surface and was lower in the natural forests in WZS, QXL and DLS than in the plantation forest. The soil was mainly composed of sand (80.61% ± 0.06%; >50 μm), followed by silt (18.91% ± 0.06%; 2–50 μm) and clay (0.93% ± 0.01%; <2 μm). In comparison, natural forest soils at WZS and DLS exhibited lower proportions of sand and higher proportions of clay and silt compared to forest plantation soils (Figures S2 and S3). While in QXL, the proportions of sand and clay were higher in the natural forest, and the proportion of silt was higher in the plantation forest.
The Pearson correlation analysis among LOC, TOC and soil physicochemical properties is shown in Figure 4. Overall, there was a significant positive correlation (p < 0.01) between TOC and LOC in natural and plantation forests, with correlation coefficients of 0.88 and 0.84, respectively. Soil pH was negatively correlated with TOC and LOC, and the correlation with LOC was highly significant (p < 0.01). There were differences in the correlation between soil particle size, TOC and LOC in each forest type. The TOC and LOC were positively correlated with clay and silt particles; LOC in natural forests was significantly positively correlated with clay particles (p < 0.05) and negatively correlated with sand particles.
Both natural and plantation forests showed a highly significant positive correlation between LOC and TOC, consistent with Bongiorno et al. [49], indicating that TOC is the determining factor in soil [50,51]. The dynamics of LOC in the soil of different forest types can thus be used as an indicator of TOC.
Both natural and plantation forests in the study area have acidic soils, and the TOC and LOC concentrations increased with increasing acidification. Microorganisms are the main drivers of the decomposition and turnover of soil organic matter, so factors that affect microbial physiology will impact the decomposition and transformation of organic matter [52]. Various soil microorganisms have an optimal pH range so that low-pH soils may inhibit microbial activity. Inhibition of microbial activity slows organic carbon decomposition, thereby increasing the concentrations of TOC and LOC in the soil. Compared with plantation forests, natural forests have abundant plant species and complex community structures, and soil organic carbon accumulates easily. Moreover, natural forests have lower soil pH, and weak microbial activity limits the decomposition of TOC and LOC. Therefore, a significant negative correlation exists between LOC in natural forests and soil pH.
Silt and clay particles have relatively large specific surface areas. Iron, aluminium oxides and alkaline elements in the soil are easily adsorbed by soil organic carbon and form an organic–inorganic complex, which plays a role in the physical and chemical organic carbon sequestration and enhances biodegradability [53,54]. Therefore, silt and clay particles greatly increase the sequestration and protection of soil organic carbon.

4. Conclusions

Forest type critically influences TOC and LOC concentrations in surface soil (0–50 cm). Although the TOC concentration was higher in planted forests than in natural forests, the LOC/TOC ratio was relatively high in natural forests. Vegetation types and human interference are the primary influencers of soil LOC in natural and plantation forests. Compared with plantation forests, natural forests have greater amounts of plant litter in the soil and less human interference, and both support increased LOC storage, indicating their role in maintaining soil health. Natural forests exhibit lower soil pH levels compared to plantation forests, so LOC decomposition and transformation by soil microorganisms are inhibited, improving the sequestration of soil LOC. In addition, natural forests are subject to less human interference. Hence, the proportion of clay and silt particles in the soil is relatively high, making it easier to adsorb soil LOC. Therefore, appropriate plantation forest management measures should be employed to improve the accumulation and sequestration of soil organic carbon.

Supplementary Materials

The following supporting information can be downloaded at: https://www.mdpi.com/article/10.3390/su16177836/s1, Table S1: Information for sampling area; Table S2: Distribution of TOC at different soil depths; Figure S1: Characteristic of TOC concentration in plantation and natural forests; Figure S2: Soil particle composition in plantation forests; Figure S3: Soil particle composition in natural forests.

Author Contributions

Conceptualization, Z.Z. (Zhizhong Zhao); Methodology, P.D.; Software, Z.Z. (Zeyang Zhao) and B.F.; Formal analysis, P.D.; Data curation, Z.Z. (Zeyang Zhao); Writing—original draft, Z.Z. (Zeyang Zhao); Writing—review & editing, B.F., D.W. and Z.Z. (Zhizhong Zhao); Supervision, Z.Z. (Zhizhong Zhao). All authors have read and agreed to the published version of the manuscript.

Funding

This study was supported by the Natural Science Foundation of Hainan Province (CN) (421QN235) and the Academician Innovation Platform Project of Hainan Province (CN) (YSPTZX202024).

Institutional Review Board Statement

Not applicable.

Informed Consent Statement

Not applicable.

Data Availability Statement

Data are contained within the article and Supplementary Materials.

Conflicts of Interest

The authors declare no conflict of interest.

References

  1. Prietzel, J.; Christophel, D. Organic carbon stocks in forest soils of the German Alps. Geoderma 2014, 221–222, 28–39. [Google Scholar] [CrossRef]
  2. Zhao, Z.; Dong, P.; Fu, B.; Wu, D.; Zhao, Z. Soil organic carbon distribution and factors affecting carbon accumulation in natural and plantation forests in tropical China. Ecol. Indic. 2023, 148, 110127. [Google Scholar] [CrossRef]
  3. Bradford, M.A.; Wieder, W.R.; Bonan, G.B.; Fierer, N.; Raymond, P.A.; Crowther, T.W. Managing uncertainty in soil carbon feedbacks to climate change. Nat. Clim. Chang. 2016, 6, 751–758. [Google Scholar] [CrossRef]
  4. Lal, R. Carbon sequestration. Philos. Trans. R. Soc. Lond. B Biol. Sci. 2008, 363, 815–830. [Google Scholar] [CrossRef] [PubMed]
  5. Friedlingstein, P.; Meinshausen, M.; Arora, V.K.; Jones, C.D.; Anav, A.; Liddicoat, S.K.; Knutti, R. Uncertainties in CMIP5 climate projections due to carbon cycle feedbacks. J. Clim. 2014, 27, 511–526. [Google Scholar] [CrossRef]
  6. Pacala, S.; Socolow, R. Stabilization Wedges: Solving the Climate Problem for the Next 50 Years with Current Technologies. Science 2004, 305, 968–972. [Google Scholar] [CrossRef]
  7. Smith, P. Soils and climate change. Curr. Opin. Environ. Sustain. 2012, 4, 539–544. [Google Scholar] [CrossRef]
  8. Stockmann, U.; Adams, M.A.; Crawford, J.W.; Field, D.J.; Henakaarchchi, N.; Jenkins, M.; Minasny, B.; McBratney, A.B.; Courcelles, V.d.R.d.; Singh, K.; et al. The knowns, known unknowns and unknowns of sequestration of soil organic carbon. Agric. Ecosyst. Environ. 2013, 164, 80–99. [Google Scholar] [CrossRef]
  9. Abdalla, M.; Hastings, A.; Chadwick, D.; Jones, D.L.; Evans, C.; Jones, M.B.; Rees, R.; Smith, P. Critical review of the impacts of grazing intensity on soil organic carbon storage and other soil quality indicators in extensively managed grasslands. Agric. Ecosyst. Environ. 2018, 253, 62–81. [Google Scholar] [CrossRef]
  10. Esmaeilzadeh, J.; Ahangar, A.G. Influence of soil organic matter content on soil physical, chemical and biological properties. Int. J. Plant. Sci. 2014, 4, 244–252. [Google Scholar]
  11. Khatoon, H.; Solanki, P.; Narayan, M.; Tewari, L.; Rai, J.; Hina Khatoon, C. Role of microbes in organic carbon decomposition and maintenance of soil ecosystem. Int. J. Chem. Eng. 2017, 5, 1648–1656. [Google Scholar]
  12. Cai, Y.; Chang, S.X. Disturbance effects on soil carbon and greenhouse gas emissions in forest ecosystems. Forests 2020, 11, 297. [Google Scholar] [CrossRef]
  13. Grasset, C.; Rodriguez, C.; Delolme, C.; Marmonier, P.; Bornette, G. Can soil organic carbon fractions be used as functional indicators of wetlands? Wetlands 2017, 37, 1195–1205. [Google Scholar] [CrossRef]
  14. Jinbo, Z.; Changchun, S.; Wenyan, Y. Land use effects on the distribution of labile organic carbon fractions through soil profiles. Soil. Sci. Soc. Am. J. 2006, 70, 660–667. [Google Scholar] [CrossRef]
  15. Zhang, Z.; Yan, J.; Han, X.; Zou, W.; Chen, X.; Lu, X.; Feng, Y. Labile organic carbon fractions drive soil microbial communities after long-term fertilization. Glob. Ecol. Conserv. 2021, 32, e01867. [Google Scholar] [CrossRef]
  16. Zhang, L.; Chen, X.; Xu, Y.; Jin, M.; Ye, X.; Gao, H.; Chu, W.; Mao, J.; Thompson, M.L. Soil labile organic carbon fractions and soil enzyme activities after 10 years of continuous fertilization and wheat residue incorporation. Sci. Rep. 2020, 10, 11318. [Google Scholar] [CrossRef]
  17. Xiao, Y.; Huang, Z.; Lu, X. Changes of soil labile organic carbon fractions and their relation to soil microbial characteristics in four typical wetlands of Sanjiang Plain, Northeast China. Ecol. Eng. 2015, 82, 381–389. [Google Scholar] [CrossRef]
  18. Blair, G.J.; Lefroy, R.D.; Lisle, L. Soil carbon fractions based on their degree of oxidation, and the development of a carbon management index for agricultural systems. Aust. J. Agric. Res. 1995, 46, 1459–1466. [Google Scholar] [CrossRef]
  19. Gao, Y.; Zhou, J.; Wang, L.; Guo, J.; Feng, J.; Wu, H.; Lin, G. Distribution patterns and controlling factors for the soil organic carbon in four mangrove forests of China. Glob. Ecol. Conserv. 2019, 17, e00575. [Google Scholar] [CrossRef]
  20. Tipping, E.; Woof, C. Humic substances in acid organic soils: Modelling their release to the soil solution in terms of humic charge. J. Soil Sci. 1990, 41, 573–586. [Google Scholar] [CrossRef]
  21. Akpa, S.I.C.; Odeh, I.O.A.; Bishop, T.F.A.; Hartemink, A.E.; Amapu, I.Y. Total soil organic carbon and carbon sequestration potential in Nigeria. Geoderma 2016, 271, 202–215. [Google Scholar] [CrossRef]
  22. Davidson, E.A.; Janssens, I.A. Temperature sensitivity of soil carbon decomposition and feedbacks to climate change. Nature 2006, 440, 165–173. [Google Scholar] [CrossRef] [PubMed]
  23. Hobley, E.; Wilson, B.; Wilkie, A.; Gray, J.; Koen, T. Drivers of soil organic carbon storage and vertical distribution in Eastern Australia. Plant Soil 2015, 390, 111–127. [Google Scholar] [CrossRef]
  24. Clarholm, M.; Skyllberg, U. Translocation of metals by trees and fungi regulates pH, soil organic matter turnover and nitrogen availability in acidic forest soils. Soil Biol. Biochem. 2013, 63, 142–153. [Google Scholar] [CrossRef]
  25. Yang, S.; Jansen, B.; Kalbitz, K.; Chunga Castro, F.O.; van Hall, R.L.; Cammeraat, E.L.H. Lithology controlled soil organic carbon stabilization in an alpine grassland of the Peruvian Andes. Environ. Earth Sci. 2020, 79, 66. [Google Scholar] [CrossRef]
  26. Zhao, Z.; Zhao, Z.; Fu, B.; Wang, J.; Tang, W. Characteristics of soil organic carbon fractions under different land use patterns in a tropical area. J. Soils Sediments 2021, 21, 689–697. [Google Scholar] [CrossRef]
  27. Carter, M.; Angers, D.; Gregorich, E.; Bolinder, M. Characterizing organic matter retention for surface soils in eastern Canada using density and particle size fractions. Can. J. Soil Sci. 2003, 83, 11–23. [Google Scholar] [CrossRef]
  28. Mitchard, E.T. The tropical forest carbon cycle and climate change. Nature 2018, 559, 527–534. [Google Scholar] [CrossRef]
  29. Nottingham, A.T.; Gloor, E.; Bååth, E.; Meir, P. Soil carbon and microbes in the warming tropics. Funct. Ecol. 2022, 36, 1338–1354. [Google Scholar] [CrossRef]
  30. Cox, P.M.; Pearson, D.; Booth, B.B.; Friedlingstein, P.; Huntingford, C.; Jones, C.D.; Luke, C.M. Sensitivity of tropical carbon to climate change constrained by carbon dioxide variability. Nature 2013, 494, 341–344. [Google Scholar] [CrossRef]
  31. Yang, Y.; Guo, J.; Chen, G.; Yin, Y.; Gao, R.; Lin, C. Effects of forest conversion on soil labile organic carbon fractions and aggregate stability in subtropical China. Plant Soil 2009, 323, 153–162. [Google Scholar] [CrossRef]
  32. Wang, Q.-K.; Wang, S.-L.; Zhong, M.-C. Ecosystem carbon storage and soil organic carbon stability in pure and mixed stands of Cunninghamia lanceolata and Michelia macclurei. Plant Soil 2013, 370, 295–304. [Google Scholar] [CrossRef]
  33. Pan, Y.; Birdsey, R.A.; Fang, J.; Houghton, R.; Kauppi, P.E.; Kurz, W.A.; Phillips, O.L.; Shvidenko, A.; Lewis, S.L.; Canadell, J.G.; et al. A Large and Persistent Carbon Sink in the World’s Forests. Science 2011, 333, 988–993. [Google Scholar] [CrossRef]
  34. Slik, J.W.F.; Franklin, J.; Arroyo-Rodríguez, V.; Field, R.; Aguilar, S.; Aguirre, N.; Ahumada, J.; Aiba, S.-I.; Alves, L.F.; Anitha, K.; et al. Phylogenetic classification of the world’s tropical forests. Proc. Natl. Acad. Sci. India Sect. B Biol. Sci. 2018, 115, 1837–1842. [Google Scholar] [CrossRef] [PubMed]
  35. Zhang, M.; Fellowes, J.R.; Jiang, X.; Wang, W.; Chan, B.P.L.; Ren, G.; Zhu, J. Degradation of tropical forest in Hainan, China, 1991–2008: Conservation implications for Hainan Gibbon (Nomascus hainanus). Biol. Conserv. 2010, 143, 1397–1404. [Google Scholar] [CrossRef]
  36. Fu, B.; Liu, Y.; Zhao, Z.; Zhang, L.; Wu, D.; Liu, H. Dissolved palladium in heavy traffic location runoff: Dynamic variation and influencing factors. Urban Water J. 2018, 15, 880–887. [Google Scholar] [CrossRef]
  37. Tang, L.; Mao, L.; Shu, J.; Li, C.; Shen, C. Overview of Modern and Quaternary Vegetation in China. In Atlas of Quaternary Pollen and Spores in China; Science Press: Beijing, China, 2020; pp. 1–87. [Google Scholar]
  38. Shi-Yong, D.; Zhen-Chuan, C.; Xian-Chun, Z. Biodiversity and conservation of pteridophytes from Diaoluo Mountain, Hainan Island. Biodivers. Sci. 2003, 11, 422. [Google Scholar] [CrossRef]
  39. Tirol-Padre, A.; Ladha, J. Assessing the reliability of permanganate-oxidizable carbon as an index of soil labile carbon. Soil. Sci. Soc. Am. J. 2004, 68, 969–978. [Google Scholar]
  40. Rossi, J.; Govaerts, A.; De Vos, B.; Verbist, B.; Vervoort, A.; Poesen, J.; Muys, B.; Deckers, J. Spatial structures of soil organic carbon in tropical forests—A case study of Southeastern Tanzania. Catena 2009, 77, 19–27. [Google Scholar] [CrossRef]
  41. Qi, R.; Li, J.; Lin, Z.; Li, Z.; Li, Y.; Yang, X.; Zhang, J.; Zhao, B. Temperature effects on soil organic carbon, soil labile organic carbon fractions, and soil enzyme activities under long-term fertilization regimes. Appl. Soil Ecol. 2016, 102, 36–45. [Google Scholar] [CrossRef]
  42. Yuan, Z.; Jin, X.; Xiao, W.; Wang, L.; Sun, Y.; Guan, Q.; Meshack, A.O. Comparing soil organic carbon stock and fractions under natural secondary forest and Pinus massoniana plantation in subtropical China. Catena 2022, 212, 106092. [Google Scholar] [CrossRef]
  43. Sheng, H.; Zhou, P.; Zhang, Y.; Kuzyakov, Y.; Zhou, Q.; Ge, T.; Wang, C. Loss of labile organic carbon from subsoil due to land-use changes in subtropical China. Soil. Biol. Biochem. 2015, 88, 148–157. [Google Scholar] [CrossRef]
  44. Rovira, P.; Vallejo, V.R. Labile and recalcitrant pools of carbon and nitrogen in organic matter decomposing at different depths in soil: An acid hydrolysis approach. Geoderma 2002, 107, 109–141. [Google Scholar] [CrossRef]
  45. Lyu, M.; Noormets, A.; Ukonmaanaho, L.; Li, Y.; Yang, Y.; Xie, J. Stability of soil organic carbon during forest conversion is more sensitive in deep soil than in topsoil in subtropical forests. Pedobiologia 2021, 84, 150706. [Google Scholar] [CrossRef]
  46. Yang, J.; Li, A.; Yang, Y.; Li, G.; Zhang, F. Soil organic carbon stability under natural and anthropogenic-induced perturbations. Earth Sci. Rev. 2020, 205, 103199. [Google Scholar] [CrossRef]
  47. Diao, J.; Liu, J.; Zhu, Z.; Wei, X.; Li, M. Active forest management accelerates carbon storage in plantation forests in Lishui, southern China. For. Ecosyst. 2022, 9, 100004. [Google Scholar] [CrossRef]
  48. Zhang, Q.; Jia, X.; Wei, X.; Shao, M.; Li, T.; Yu, Q. Total soil organic carbon increases but becomes more labile after afforestation in China’s Loess Plateau. For. Ecol. Manag. 2020, 461, 117911. [Google Scholar] [CrossRef]
  49. Bongiorno, G.; Bünemann, E.K.; Oguejiofor, C.U.; Meier, J.; Gort, G.; Comans, R.; Mäder, P.; Brussaard, L.; de Goede, R. Sensitivity of labile carbon fractions to tillage and organic matter management and their potential as comprehensive soil quality indicators across pedoclimatic conditions in Europe. Ecol. Indic. 2019, 99, 38–50. [Google Scholar] [CrossRef]
  50. Geraei, D.S.; Hojati, S.; Landi, A.; Cano, A.F. Total and labile forms of soil organic carbon as affected by land use change in southwestern Iran. Geoderma Reg. 2016, 7, 29–37. [Google Scholar] [CrossRef]
  51. Yu, P.; Han, K.; Li, Q.; Zhou, D. Soil organic carbon fractions are affected by different land uses in an agro-pastoral transitional zone in Northeastern China. Ecol. Indic. 2017, 73, 331–337. [Google Scholar] [CrossRef]
  52. Zhang, Y.; Li, X.; Xiao, M.; Feng, Z.; Yu, Y.; Yao, H. Effects of microplastics on soil carbon dioxide emissions and the microbial functional genes involved in organic carbon decomposition in agricultural soil. Sci. Total Environ. 2022, 806, 150714. [Google Scholar] [CrossRef] [PubMed]
  53. Bashir, O.; Ali, T.; Baba, Z.A.; Rather, G.; Bangroo, S.; Mukhtar, S.D.; Naik, N.; Mohiuddin, R.; Bharati, V.; Bhat, R.A. Soil organic matter and its impact on soil properties and nutrient status. In Microbiota and Biofertilizers; Volume 2—Ecofriendly Tools for Reclamation of Degraded Soil Environs; Springer: Cham, Switzerland, 2021; pp. 129–159. [Google Scholar]
  54. Li, Q.; Wang, L.; Fu, Y.; Lin, D.; Hou, M.; Li, X.; Hu, D.; Wang, Z. Transformation of soil organic matter subjected to environmental disturbance and preservation of organic matter bound to soil minerals: A review. J. Soils Sediments 2023, 23, 1485–1500. [Google Scholar] [CrossRef]
Figure 1. Geographical coordinates and the layout of the experimental sites.
Sustainability 16 07836 g001
Figure 2. Vertical trends of LOC in soils of natural and plantation forests. Mean ± SE is shown. Capital letters show significant differences between forest types (p < 0.05). Lowercase letters show significant differences between soil depths (p < 0.05).
Sustainability 16 07836 g002
Figure 3. LOC/TOC ratio of tropical natural and plantation forests. The box represents the interquartile range of the data set; upper and lower limits indicate the first and third quartiles. The median value is indicated with a horizontal line. Whiskers represent standard error.
Sustainability 16 07836 g003
Figure 4. Pearson correlation among TOC stability indicators and soil physicochemical properties in natural and plantation forests. Colours represent the direction of the correlation (red: positive; blue: negative). Colour intensity and the size of the circles are proportional to the correlation coefficients. Significance is marked in circles (* p ≤ 0.05, ** p ≤ 0.01). The correlation coefficient of the p-value in natural forest is shown in the lower-left panel. The correlation coefficient of the p-value in plantation forests is displayed in the upper-right panel. TOC: total organic carbon; LOC: labile organic carbon.
Sustainability 16 07836 g004
Table 1. Concentration of LOC in different forest types.
Sampling SiteForest TypeMean ± SE(m) 1
(mg/g)
Minimum
(mg/g)
Maximum
(mg/g)
Coefficient of Variation
(%)
WZSPlantation forest5.22 ± 0.36 Ab 2,32.768.1428.93
Natural forest7.64 ± 1.40 Aa2.2521.6773.30
QXLPlantation forest3.19 ± 0.28 Bb1.795.2730.09
Natural forest4.08 ± 0.33 Ba1.936.7031.86
DLSPlantation forest2.95 ± 0.33 Bb1.784.8333.22
Natural forest3.73 ± 0.54 Ba1.3810.2661.39
TotalPlantation forest4.07 ± 0.26 b1.788.1438.21
Natural forest5.12 ± 0.99 a1.3821.6776.37
1 SE(m) stands for standard error of mean. 2 Different capital letters among sampling sites meant significant difference (LSD, p < 0.05). 3 Different lowercase letters between forest types meant significant difference (LSD, p < 0.05).
Table 2. Soil physicochemical properties in different forest types.
SiteForest TypepHClay (%)Silt (%)Sand (%)TOC (g/kg)
WZSPlantation forest5.07 ± 0.02 Ca 1,20.94 ± 0.0318.85 ± 0.2680.59 ± 0.32119.13 ± 2.65 Aa
Natural forest4.53 ± 0.02 Cb1.36 ± 0.0421.79 ± 0.3777.28 ± 0.37100.71 ± 1.51 Aa
QXLPlantation forest5.93 ± 0.03 Aa0.77 ± 0.0619.09 ± 0.4080.84 ± 0.4062.94 ± 0.77 Ba
Natural forest5.87 ± 0.04 Aa0.79 ± 0.0317.85 ± 0.3081.80 ± 0.3259.33 ± 0.55 Aa
DLSPlantation forest5.60 ± 0.04 Ba0.75 ± 0.0417.50 ± 0.5882.08 ± 0.6261.82 ± 1.17 Ba
Natural forest5.38 ± 0.03 Ba0.90 ± 0.0318.13 ± 0.3081.45 ± 0.3248.14 ± 0.54 Ba
TotalPlantation forest5.45 ± 0.01 a0.85 ± 0.0118.77 ± 0.1180.88 ± 0.1288.61 ± 0.15 a
Natural forest5.22 ± 0.01 a1.00 ± 0.0119.17 ± 0.0980.28 ± 0.1068.73 ± 0.55 a
1 Different capital letters within individual sampling sites meant significantly different, while those with similar letters are nonsignificant (LSD, p < 0.05). 2 Different lowercase letters within individual forest types meant significantly different, while those with similar letters are nonsignificant (LSD, p < 0.05).
Disclaimer/Publisher’s Note: The statements, opinions and data contained in all publications are solely those of the individual author(s) and contributor(s) and not of MDPI and/or the editor(s). MDPI and/or the editor(s) disclaim responsibility for any injury to people or property resulting from any ideas, methods, instructions or products referred to in the content.

