Article

Influence of Printing Interval on the Imbibition Behavior of 3D-Printed Foam Concrete for Sustainable and Green Building Applications

1
School of Safety Science and Engineering, Nanjing University of Science & Technology, Nanjing 210094, China
2
National-Local Joint Engineering Research Center for Biomass Materials of Electromechanical Product Packaging, Nanjing Forestry University, Nanjing 210037, China
3
Nanjing Hydraulic Research Institute, Nanjing 210029, China
4
Nanjing Geological Engineering Investigation Institute of Jiangsu Province, Nanjing 210029, China
*
Authors to whom correspondence should be addressed.
Sustainability 2024, 16(17), 7841; https://doi.org/10.3390/su16177841
Submission received: 16 July 2024 / Revised: 30 August 2024 / Accepted: 6 September 2024 / Published: 9 September 2024
(This article belongs to the Special Issue Advancements in Green Building Materials, Structures, and Techniques)

Abstract

:
Foam concrete is highly valued as a sustainable cement-based material, but the development of 3D-printed foam concrete (3DPFC) has remained constrained. This study investigated the influence of printing interval on the microstructure and imbibition behavior of 3DPFC. The results revealed that horizontal interlayers are broader compared to vertical interlayers, leading to more significant imbibition. For X-oriented 3DPFC, the vertical interlayer was rapidly occupied by water after imbibition, forming an elliptical moisture profile. For Y-oriented 3DPFC, the moisture profile appeared more convoluted, mainly surrounding the horizontal interlayers but shifting at intersections with the vertical interlayers. In Z-oriented 3DPFC, where only tight horizontal interlayers were present, interlayer imbibition was almost negligible. Additionally, when the printing interval was less than 15 min, imbibition was primarily restricted to the top filament since the bottom filament was compacted by the filament above. Conversely, with a printing interval longer than 15 min, the bottom filament hardened before the setting of the top filament. This allowed the surface of the bottom filament to be compacted by the top filament, resulting in a dense interlayer that offers better resistance against imbibition compared to the matrix of 3DPFC. This work contributes to the advancement of green building technologies by providing insights into optimizing the 3D printing process for foam concrete, thereby enhancing its structural performance without compromising the designated air content and consistency of the foam concrete, facilitating a more efficient utilization of materials and a reduction in overall material consumption.

1. Introduction

Concrete 3D printing technology marks a significant departure from traditional cast-in-place methods, offering advantages such as increased automation, enhanced construction efficiency, and the capability to fabricate complex structures. Despite its promising benefits, including reduced labor needs and lower construction costs due to the elimination of templates, the development of this technology remains in its early stages. Critical challenges persist, such as the complexity of incorporating reinforcing steel and suboptimal internal structures characterized by multi-directional voids and weak bonding between adjacent filaments due to inconsistent hydration and humidity levels [1,2].
Historically, the assessment of the internal looseness and porosity in materials like 3D printed concrete (3DPC) has been conducted via imbibition tests and simple weighing experiments to measure weight changes over time. This method has previously been employed to analyze the microstructures of rocks [3], wood [4], sponges [5], and concrete [6,7,8]. While effective in providing an overall view of imbibition, these methods fall short of revealing the moisture distribution within heterogeneous structures [9,10]. Recent explorations have leveraged non-destructive techniques like X-ray [11,12] and nuclear magnetic resonance (NMR) imaging [13,14], despite their reliance on heavy metal tracers for optimal moisture tracking [15,16,17].
Our previous work established a foundation for tracer analysis using contrast solutions by comparing the adsorption effects of CsCl solution, KI solution, and water [18]. The groundwork laid in this study supports further investigations into the moisture transport behavior within 3DPC by utilizing advanced imaging technologies. However, research in this specific area remains sparse. Zhang et al. [19] investigated the relationship between water transport behavior and different interlayers in 3DPC and revealed that continuous pores at the interlayer interface facilitated preferential water transport, resulting in a distinct anisotropy in the imbibition of 3DPC. Van Der Putten et al. [20] used neutron imaging technology to study the effects of different printing speeds and layer counts on the imbibition rate of continuously printed specimens. The results indicated that an increase in printing speed led to moisture entering preferentially from the sides of the specimens, although the overall imbibition decreased. Moreover, Schröfl et al. [21] used neutron imaging technology to investigate the moisture transport behavior in 3DPC under different printing intervals. That study showed that shorter printing intervals resulted in tighter interlayer bonding. As the printing interval time increased, 3DPC exhibited more rapid imbibition.
In general, notable studies have identified continuous pores at interlayer interfaces as facilitators of preferential water transport and highlighted the complex pore connectivity in 3DPC compared to conventional concrete. Furthermore, variations in printing speeds and layer counts have been shown to significantly influence imbibition rates and patterns. Addressing the gap in research on imbibition behavior in 3DPFC, our study employed a combination of X-ray imaging, computed tomography (CT), and gravimetric methods to analyze the effects of interlayer characteristics on imbibition. Additionally, we explored the dynamics of water movement in 3DPFC under various printing intervals. Our findings contribute to a deeper understanding of the imbibition phenomenon in 3DPC, laying the groundwork for future advancements in concrete 3D printing applications.

2. Experimental

2.1. Materials and Mix Design

Table 1 summarizes the mix proportions used in this experiment, with a water-to-binder ratio (w/b) of 0.35. Cement and fly ash were utilized as the binder materials, with the cement being ordinary P·II 52.5 (in accordance with the CEM I Portland cement (OPC) EN 197-1 standard [22] produced by Onoda Cement Factory in Nanjing, Jiangsu Province, China. The fly ash (FA) used was Type F, manufactured by Minghui Factory in Zhuhai, Guangdong Province, China. The detailed chemical compositions of the OPC and FA are presented in Table 2. To ensure sufficient imbibition, foam concrete was employed in this study. The foaming agent in the form of a solid powder was foamed using an electric mixer. In addition, a modified silicone resin polyether emulsion with a polyether content of 55% was utilized as a stabilizing foaming agent and a polycarboxylate superplasticizer (PBSP) with a water-reducing rate of 30% was applied to enhance the printability of 3DPC. Tap water was used for specimen preparation and the subsequent imbibition test throughout the entire experimental process.

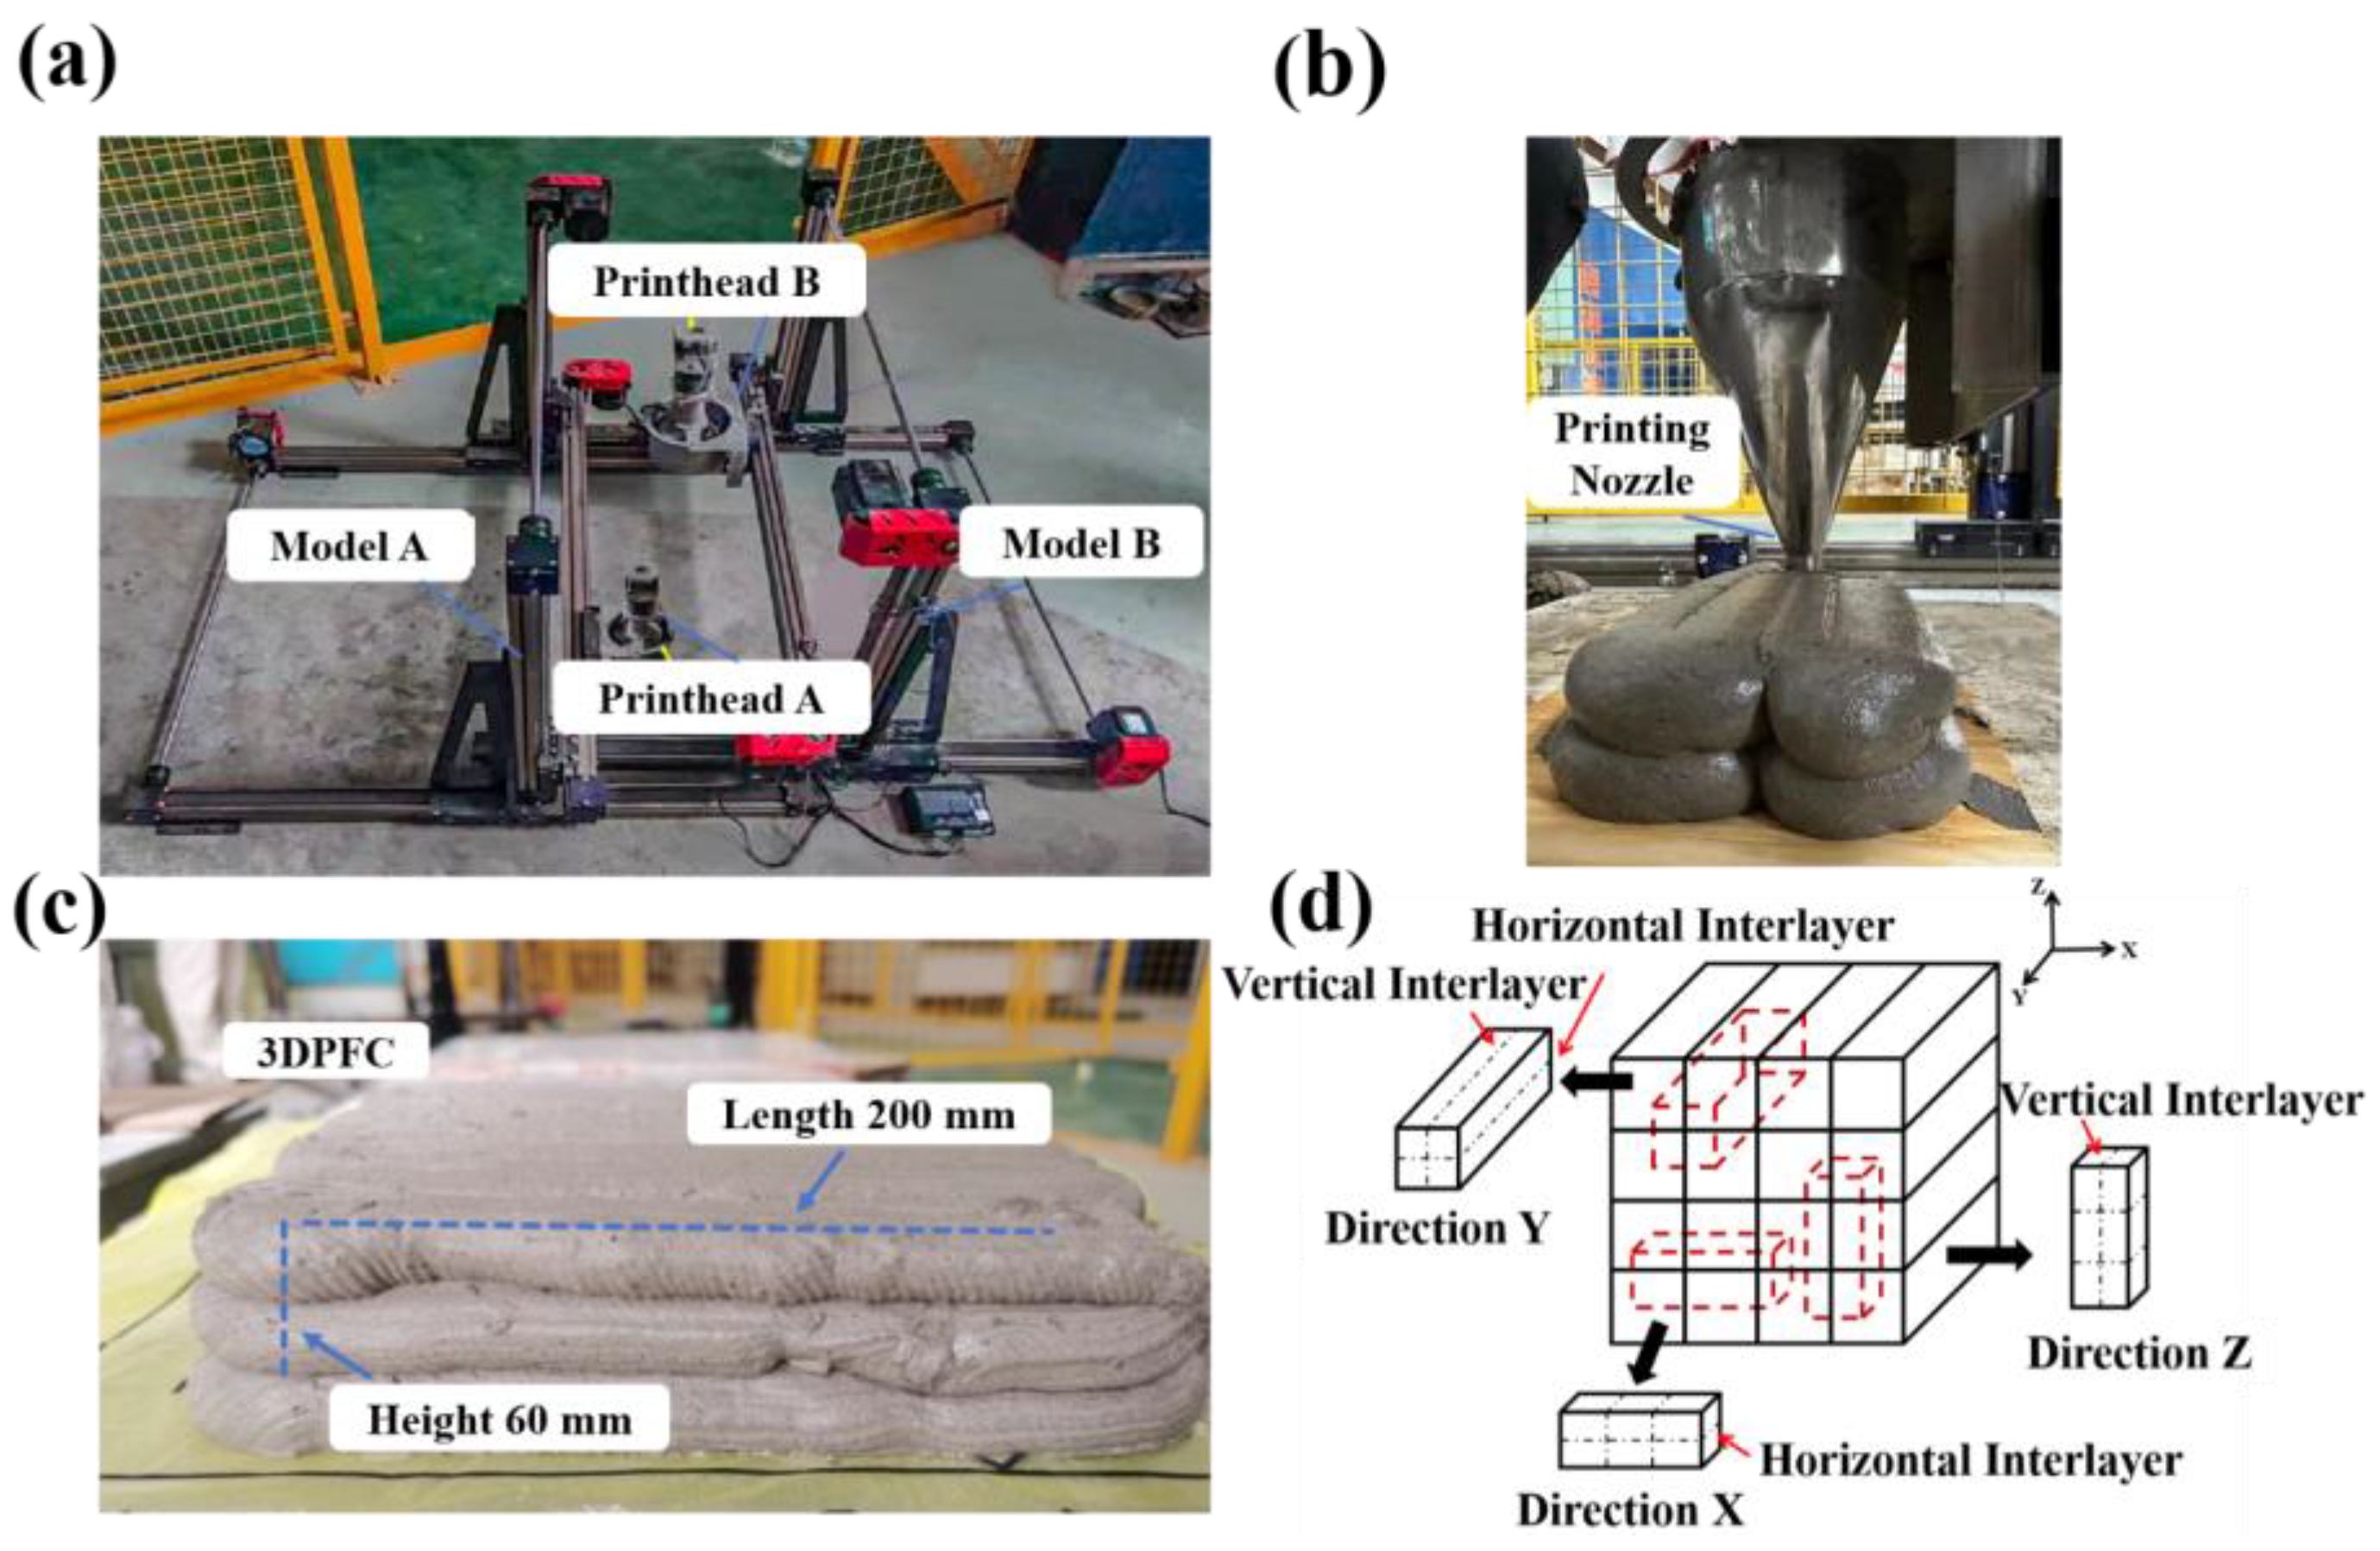
2.2. Sample Fabrication

The 3D printer used in this study was a self-developed desktop-level 3D printing device as depicted in Figure 1a, with the printing nozzle shown in Figure 1b. The nozzle diameter was 20 mm, and the movement speed along the X direction was 14 mm/s. The prepared foam slurry was continuously fed into the nozzle to support continuous printing. Upon completion of each layer, the printing head was elevated for printing the subsequent layer. Considering the material’s solidification time, a total of 6 sets of specimens were printed, with time intervals set at 3 min, 6 min, 9 min, 15 min, 21 min, and 30 min, respectively. Each set of specimens consisted of three layers and eight columns, with a printing height and length of 60 mm and 200 mm respectively, as illustrated in Figure 1c.
After printing, the specimens were transferred to a standard curing room, maintained at a temperature of 20 °C and a relative humidity exceeding 95%, for a period of 28 days. Following the end of the curing period, the 3DPFC was cut into rectangles with dimensions of 20 × 20 × 60 mm3 along the X, Y, and Z directions, as shown in Figure 2. It should be noted that the cut specimens contained interlayers in both horizontal and vertical directions, as illustrated in Figure 1d. To ensure consistency in the interlayers, the specimens in the X and Y directions were taken from the bottom two layers. Subsequently, the specimens were dried in a vacuum oven at 80 °C for 12 h until their mass remained constant. Epoxy resin was used to seal five sides of the specimens, leaving one surface (20 × 20 mm2) unsealed for imbibition.

2.3. Imbibition Test

A circular plastic container was prepared with two plastic support strips of ϕ 2 mm diameter fixed at the bottom. The sealed foam sample was placed on the support strips and secured, as shown in Figure 3. The contrast agent for the experiment was prepared using CsCl powder (purity > 99.5%) from Zeye Biotechnology Company in Shanghai, China, at a concentration of 3% [23,24]. Precisely weighed CsCl powder was mixed with 100 g distilled water in a beaker and stirred evenly. The resulting solution was then transferred into a glass bottle using a pipette and stored at room temperature.
The container was placed inside the CT chamber to facilitate periodic CT scans. An initial scan of the dry specimen was conducted before adding water. Subsequently, the contrast agent solution was introduced into the dish using a burette. Each specimen was immersed in the contrast agent to a depth of 2 mm to ensure effective imbibition. Timing commenced from the moment the specimen’s bottom surface contacted the contrast agent, with scans performed at intervals of 1 h, 3 h, 6 h, 10 h, and 24 h.

2.4. Methods

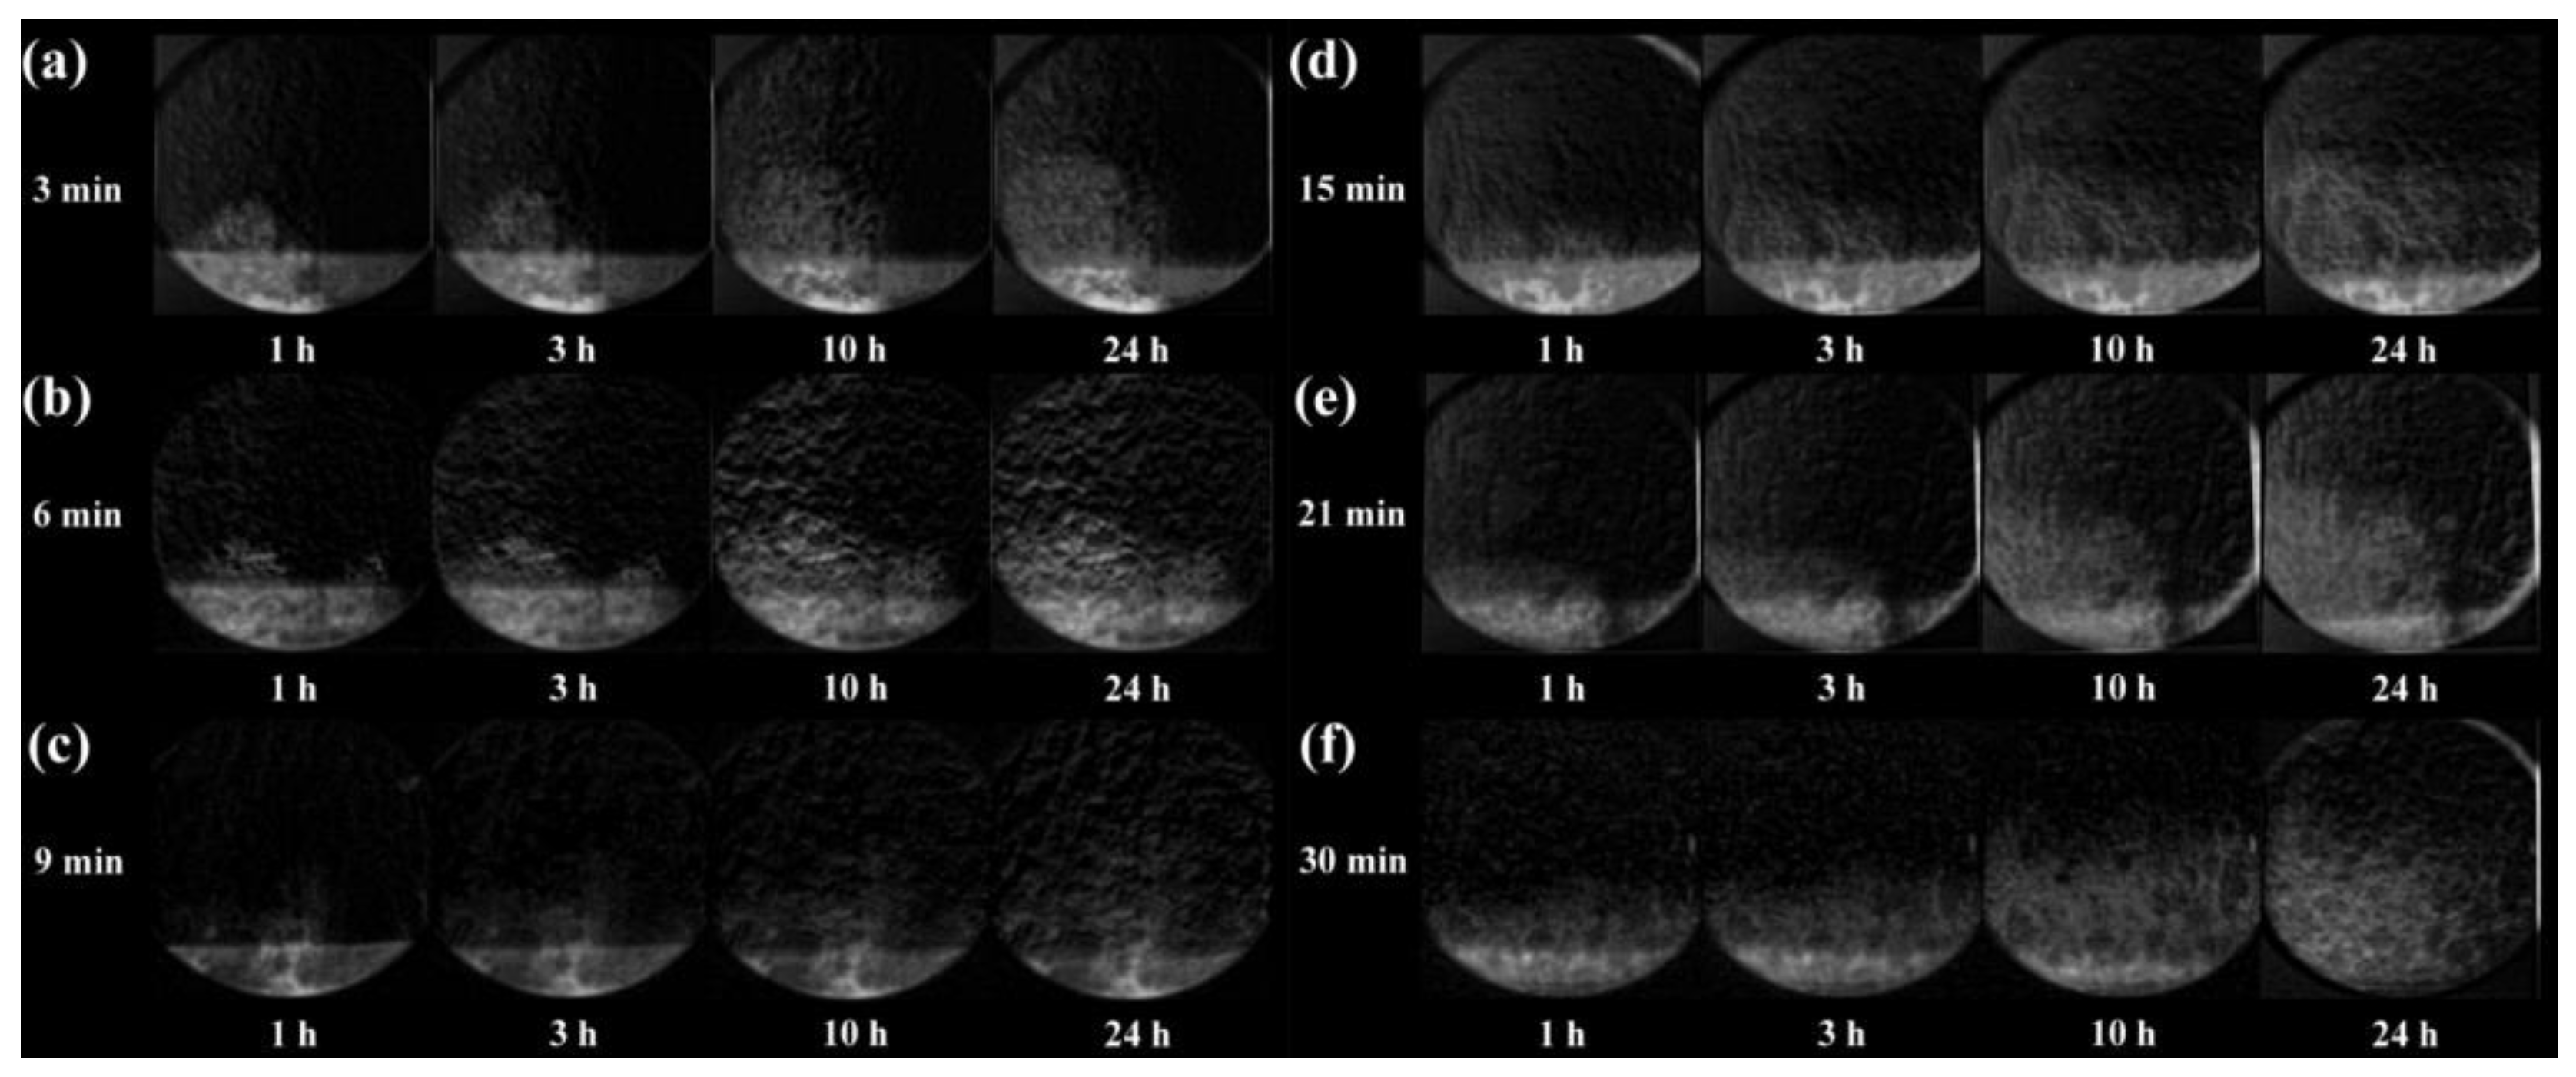
2.4.1. X-ray Scenography

X-ray imaging involves the transmission of an X-ray beam through an object and projection of the result onto a detector. Therefore, the technique is capable of quantifying the density of the scanned object, where an object with higher density absorbs more X-rays, resulting in darker images.
This study utilized X-ray imaging to analyze the moisture distribution in concrete and to observe the imbibition front of 3DPFC. The equipment used was manufactured by Aoshi Factory in Dongguan City, Guangdong Province, China, and the working voltage and current were set as 100 kV and 0.3 mA, respectively. To enhance the image quality, a 0.5 mm copper plate was employed as a filter. Six projection images were captured at each scanning interval, with an exposure time of 500 ms per projection, and all six projections were averaged to improve the imaging quality. Note again that a CsCl solution with a concentration of 3% was used as a substitute for water in the present study to enhance the imaging quality.

2.4.2. X-ray Computed Tomography (X-CT)

This study also utilized X-ray computed tomography (X-CT) to analyze the early-age water imbibition behavior of 3DPFC, as shown in Figure 4. CT is a widely adopted technique in non-destructive testing, which involves irradiating a rotating object with X-ray and reconstructing the object through a computer algorithm. The CT machine used in this study was manufactured by YXLON Company in Germany. It was operated at a voltage of 110 kV and a current of 0.3 mA, with an effective resolution of 30 μm/pixel. To approximate the results of instantaneous imbibition, the scanning time was reduced to 9 min.

2.4.3. X-ray Attenuation Method (XRAM)

The X-ray attenuation method (XRAM) is a technique that quantifies the migrated water content in a scanned object based on altered attenuation coefficients during multiple scans. XRAM has been effectively employed in this study to measure the local water content [25], porosity [26], and formed carbonation product [25] of the tested specimens; consequently, this technique was adapted to quantify the imbibed water in 3DPFC. The local water content of 3DPFC can be deduced through Equation (1):
c = G a f t e r G b e f o r e G w G a i r × ρ H 2 O
where c is the local water content; G a f t e r and G b e f o r e represent the gray-scale values of the same local area as designed and at the beginning of the imbibition, respectively; G w and G a i r indicate the gray-scale value of water and air, respectively; and ρ H 2 O expresses the mass density of water.
An image registration technique was introduced to ensure that the corresponding units of the two images were spatially aligned, thus facilitating the visualization of the 2D moisture transport process. Therefore, leveraging image registration techniques, X-ray subtraction images of the top and bottom layer 3DPFC specimens at different printing intervals were derived by using the X-ray image at 0 h as the minuend and the X-ray images at various imbibition times as the subtrahends. Figure 5 shows the X-ray subtraction image of a specimen with a print interval of 21 min at 24 h.
X-ray imaging is a 2D method, so the image was the averaged result of the attenuation coefficient along the transmission path. Since the microstructure along the path presented high randomness, the images here would inevitably be vaguer.

2.4.4. Mass Weighing

Throughout the imbibition process, changes in the weight of the 3DPFC were recorded. By measuring the change in mass of the 3DPFC during imbibition, the imbibition depth can be inferred. In this study, the dimensions of all specimens were 20 × 20 × 60 mm3, and the 20 × 20 mm2 surface, which was not sealed with epoxy resin, was exposed to the solution. The gravimetric method was used to calculate the imbibition depth of the specimen, as shown in Equation (2):
D ( t ) = m 1 m 0 A ρ
where D is the depth of water imbibition; t is the imbibition age; A is the cross-sectional area of the 3DPFC; ρ is the density of the staining solution; and m 1 and m 0 are the mass of the specimen after and before imbibition, respectively.

2.4.5. Interlayer Splitting Test

The splitting tensile strength of the specimens was tested in accordance with Standard GB/T 50081-2019 [27]. The printed specimens containing an interlayer were cut into 20 × 20 × 60 mm3 pieces and were placed on the plate of the testing apparatus, with the axis of the specimen, which is the center of the interface between the two types of mortar, aligned with the center of the pressure machine plate. A steel shim specifically designed for splitting tests (75 mm in length and 4 mm in diameter) was set at the midpoint of the specimen’s upper and lower surfaces. The loading rate was maintained at 0.05 kN/s. The load was transmitted to the interface between the upper and lower surfaces of the specimen through the steel shims, generating a splitting effect. The splitting tensile strength for each group of specimens was calculated by averaging the results obtained from three consecutive tests. The calculation formula for concrete splitting tensile strength is presented in Equation (3):
f t s = 2 P A π = 0.637 P A
where f t s represents the concrete splitting tensile strength (MPa), P denotes the failure load (N), and A stands for the area of the specimen’s splitting surface (mm2).

3. Results

3.1. Raw CT Data Analysis

Figure 6 presents the cross-sections of 3DPFC containing interlayers, as observed from the X-oriented, Y-oriented, and Z-oriented directions (refer to the schematic in Figure 1d). In this instance, a printing interval of 9 min was maintained between adjacent layers. For clarity, the interface between successive layers is designated as the “horizontal interlayer”, while the interface between adjacent columns is referred to as the “vertical interlayer”.
The X-oriented cross-section exclusively illustrates the horizontal interlayer, whereas the Z-oriented cross-section displays only the vertical interlayer. Uniquely, the Y-oriented cross-section reveals both types of interlayers. According to Figure 6, the horizontal interlayers were notably broader than the vertical interlayers, a reasonable observation when considering the printing process. Vertical interlayers could bond more tightly due to the lateral deformation experienced by the adjacent fresh filaments, resulting in immediate compaction [28]; conversely, horizontal interlayers did not experience compaction until 9 min later, when the new filament was printed above. By this time, the filament had partially hardened, leading to a lesser degree of compaction [29,30].

3.2. Imbibition Behavior within the Saturation Verge of 3DPFC

Building upon methodologies established in previous work by the same authors [16], the imbibed area in foam concrete can be categorically divided into two sections: the “saturated verge”, which achieves saturation immediately post-imbibition, and the “unsaturated transmission zone”, where water continues to migrate upward due to capillary action. Employing this classification, we analyzed the imbibition properties of 3DPFC. Echoing prior findings, comparative imaging—before and after imbibition—revealed the distribution of the absorbed water.
Figure 7 demonstrates the typical two-dimensional distribution of the water at varying heights within an X-oriented 3DPFC sample. Images were captured at heights of 0.39 mm, 0.94 mm, 1.50 mm, and 2.06 mm. The distribution of water below 0.94 mm appeared consistent throughout the duration of the imbibition test, evidencing the region known as the “saturation verge”. Notably, for heights beyond 0.94 mm, water instantaneously filled the interlayers upon imbibition, with the water content remaining stable thereafter. This indicates that these interlayers should also be considered part of the “saturation verge”. Our results suggest that the interlayer development mirrors the behavior of surface cracks in carbonated concrete, which leads to a non-uniform carbonation front [31].
Figure 8 exhibits a similar pattern of water distribution at various heights in a Y-oriented 3DPFC specimen. Despite the resemblance to Figure 7’s imbibition pattern, the complexity of interlayer types in Figure 8 (comprising both horizontal and vertical interlayers) resulted in divergent absorption behaviors. Specifically, the horizontal interlayers displayed increased brightness compared to the less pronounced vertical interlayers, a finding consistent with the broader horizontal interlayers presented in Figure 6. Furthermore, the top intersections in Figure 8 contained noticeably higher water content, corroborating Van Der Putten et al.’s observations of the bottom layer experiencing greater compression from the overlaying layer [20], leading to more compact horizontal interlayers that “resisted” further imbibition.
Figure 9 depicts the typical two-dimensional water distribution at different heights in a Z-oriented 3DPFC. While the saturation verge was present—with a width comparable to those obtained from the other orientations—the transverse movement of water through the interlayers was nearly nonexistent. This result underscores the effectiveness of the horizontal interlayer structure in resisting imbibition.

3.3. Imbibition Behavior in the Unsaturated Transport Region of 3DPFC

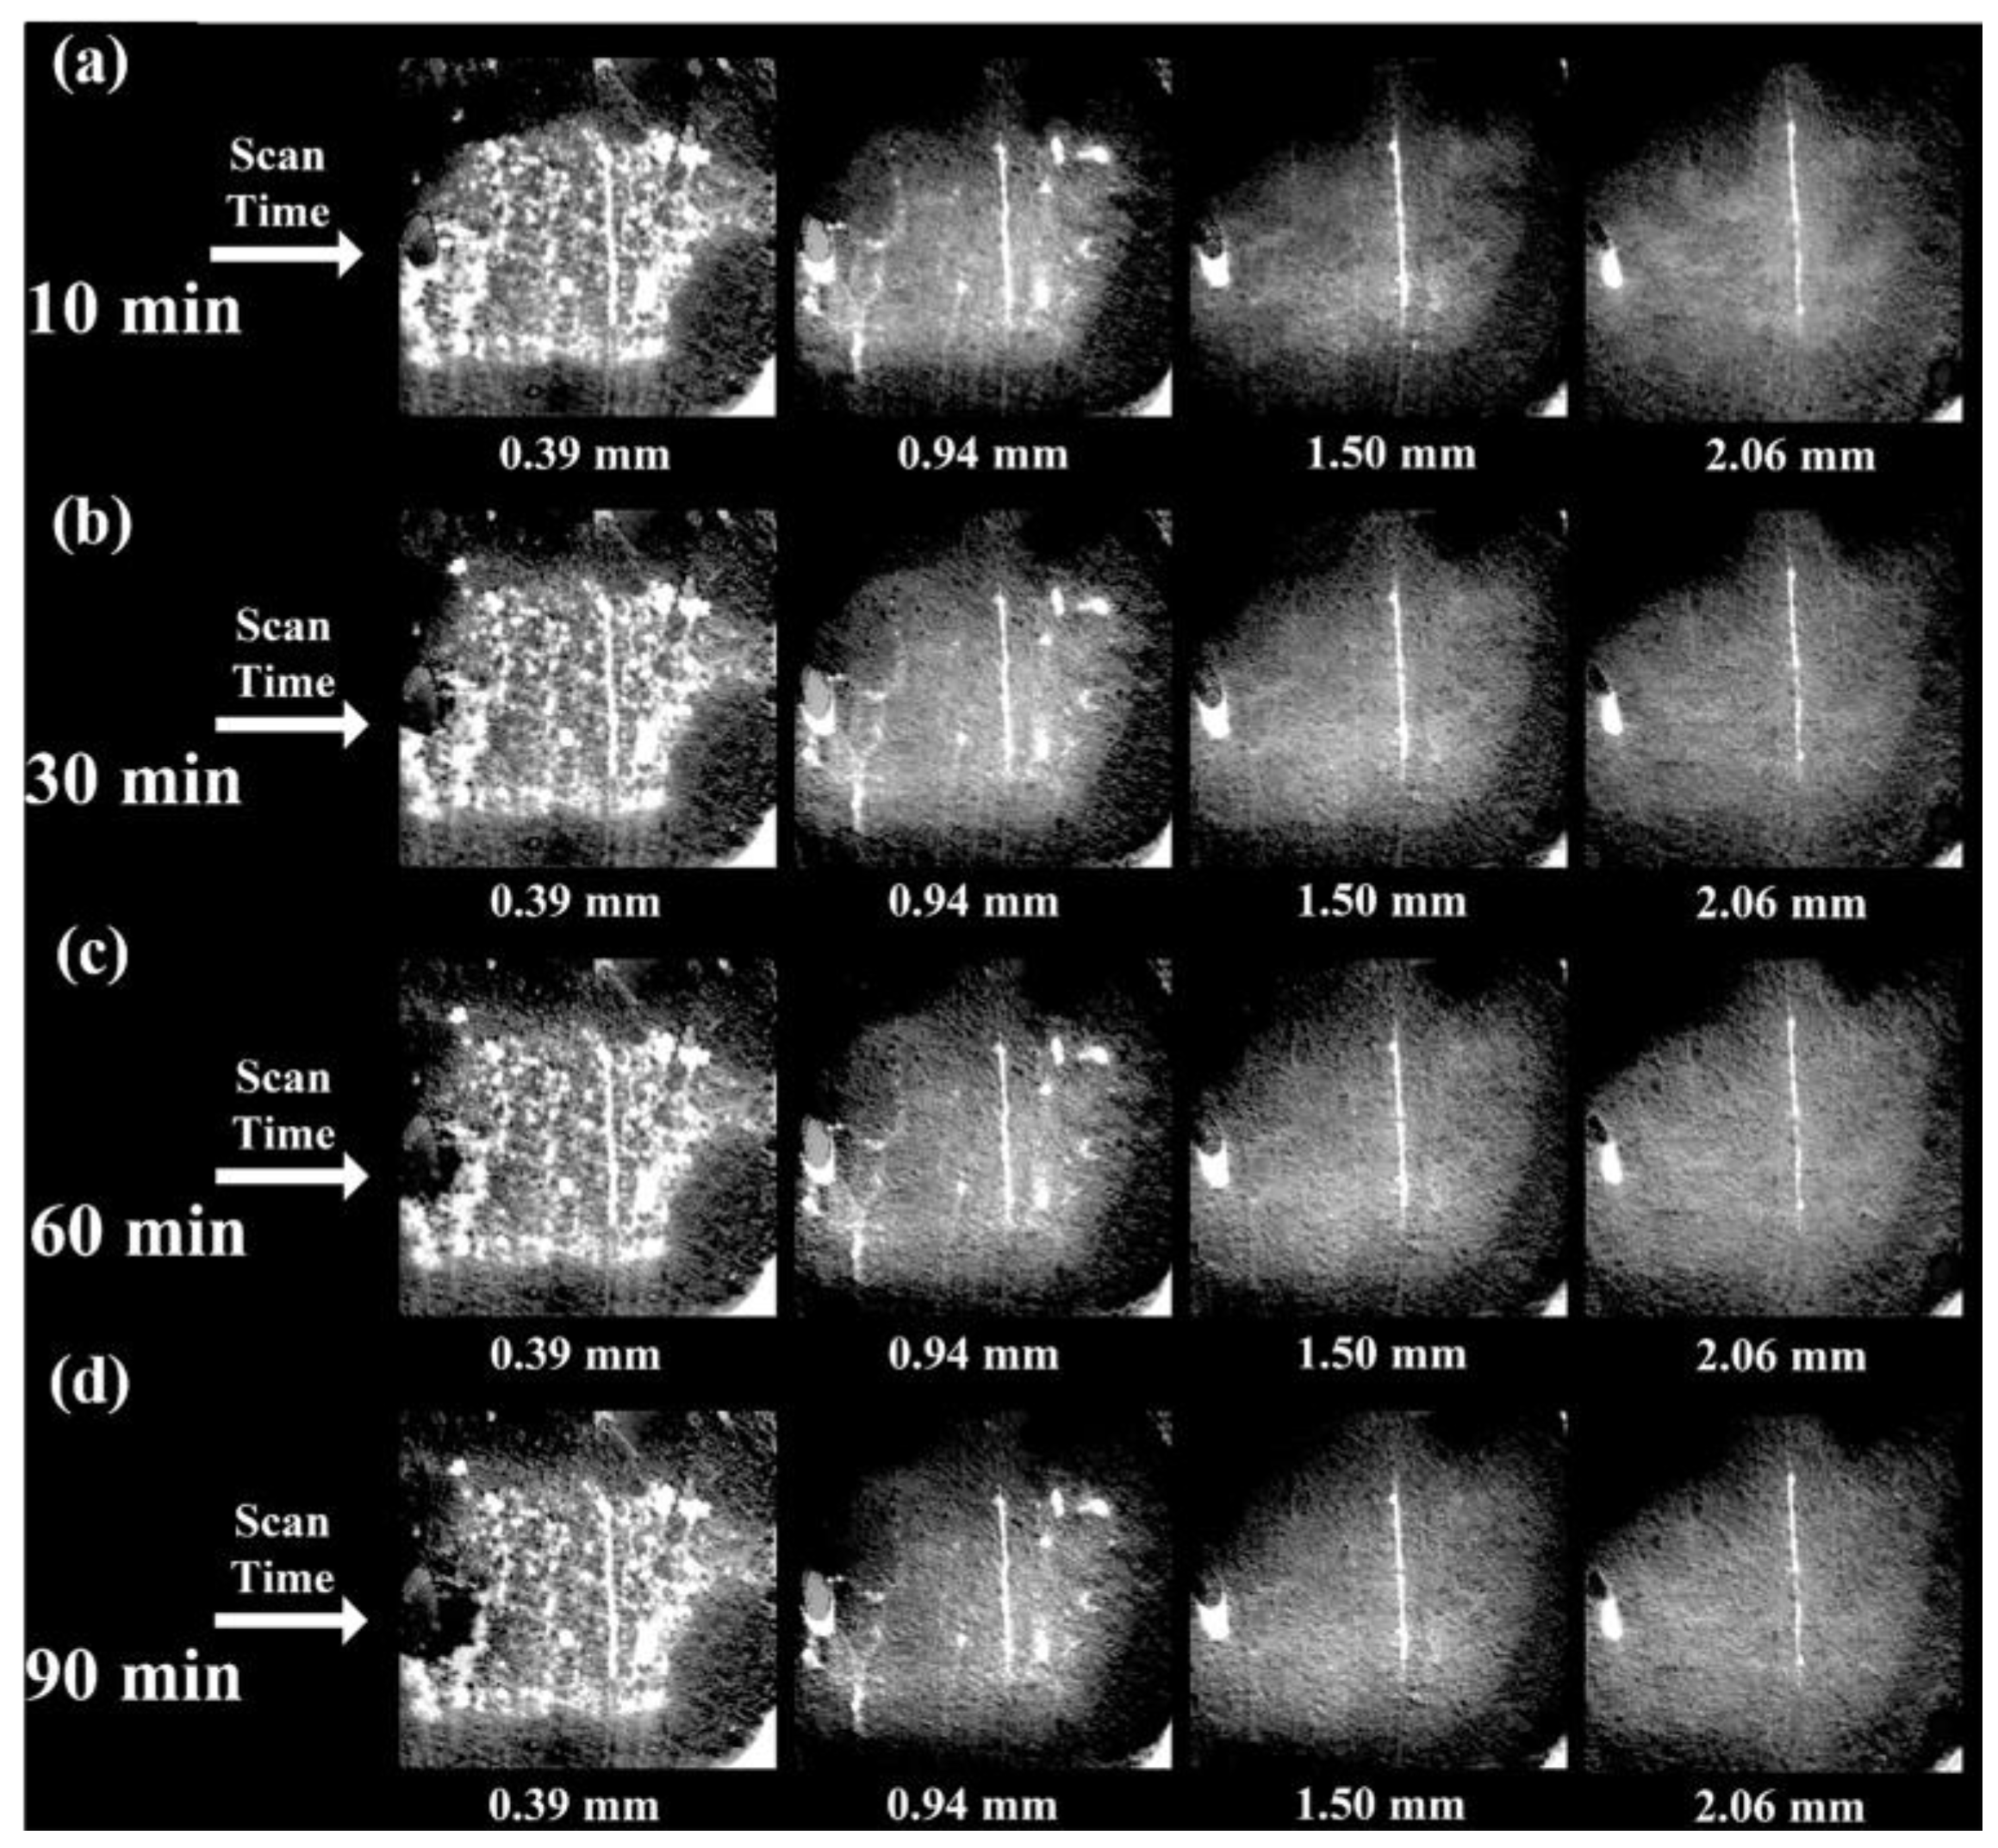
3.3.1. X-Oriented 3DPFC

The imbibition process within the unsaturated transport region of the 3DPFC exhibited dynamic behavior distinct from that observed in the saturated verge. Figure 10 displays sequential two-dimensional water distribution images of an X-oriented 3DPFC specimen during the imbibition process. Within the initial 30 min, the water was observed to ascend to a height of approximately 15.67 mm along the vertical interlayers. By comparison, moisture propagation through the matrix without interlayers was limited, achieving a maximum elevation of just 2.89 mm. This discrepancy underscores the effectiveness of vertical interlayers in directing moisture movement. Furthermore, there was a discernible decline in the volume of absorbed water at specific heights over time, indicating that existing moisture within the interlayers—rather than additional uptake from below—predominantly supported ongoing imbibition.

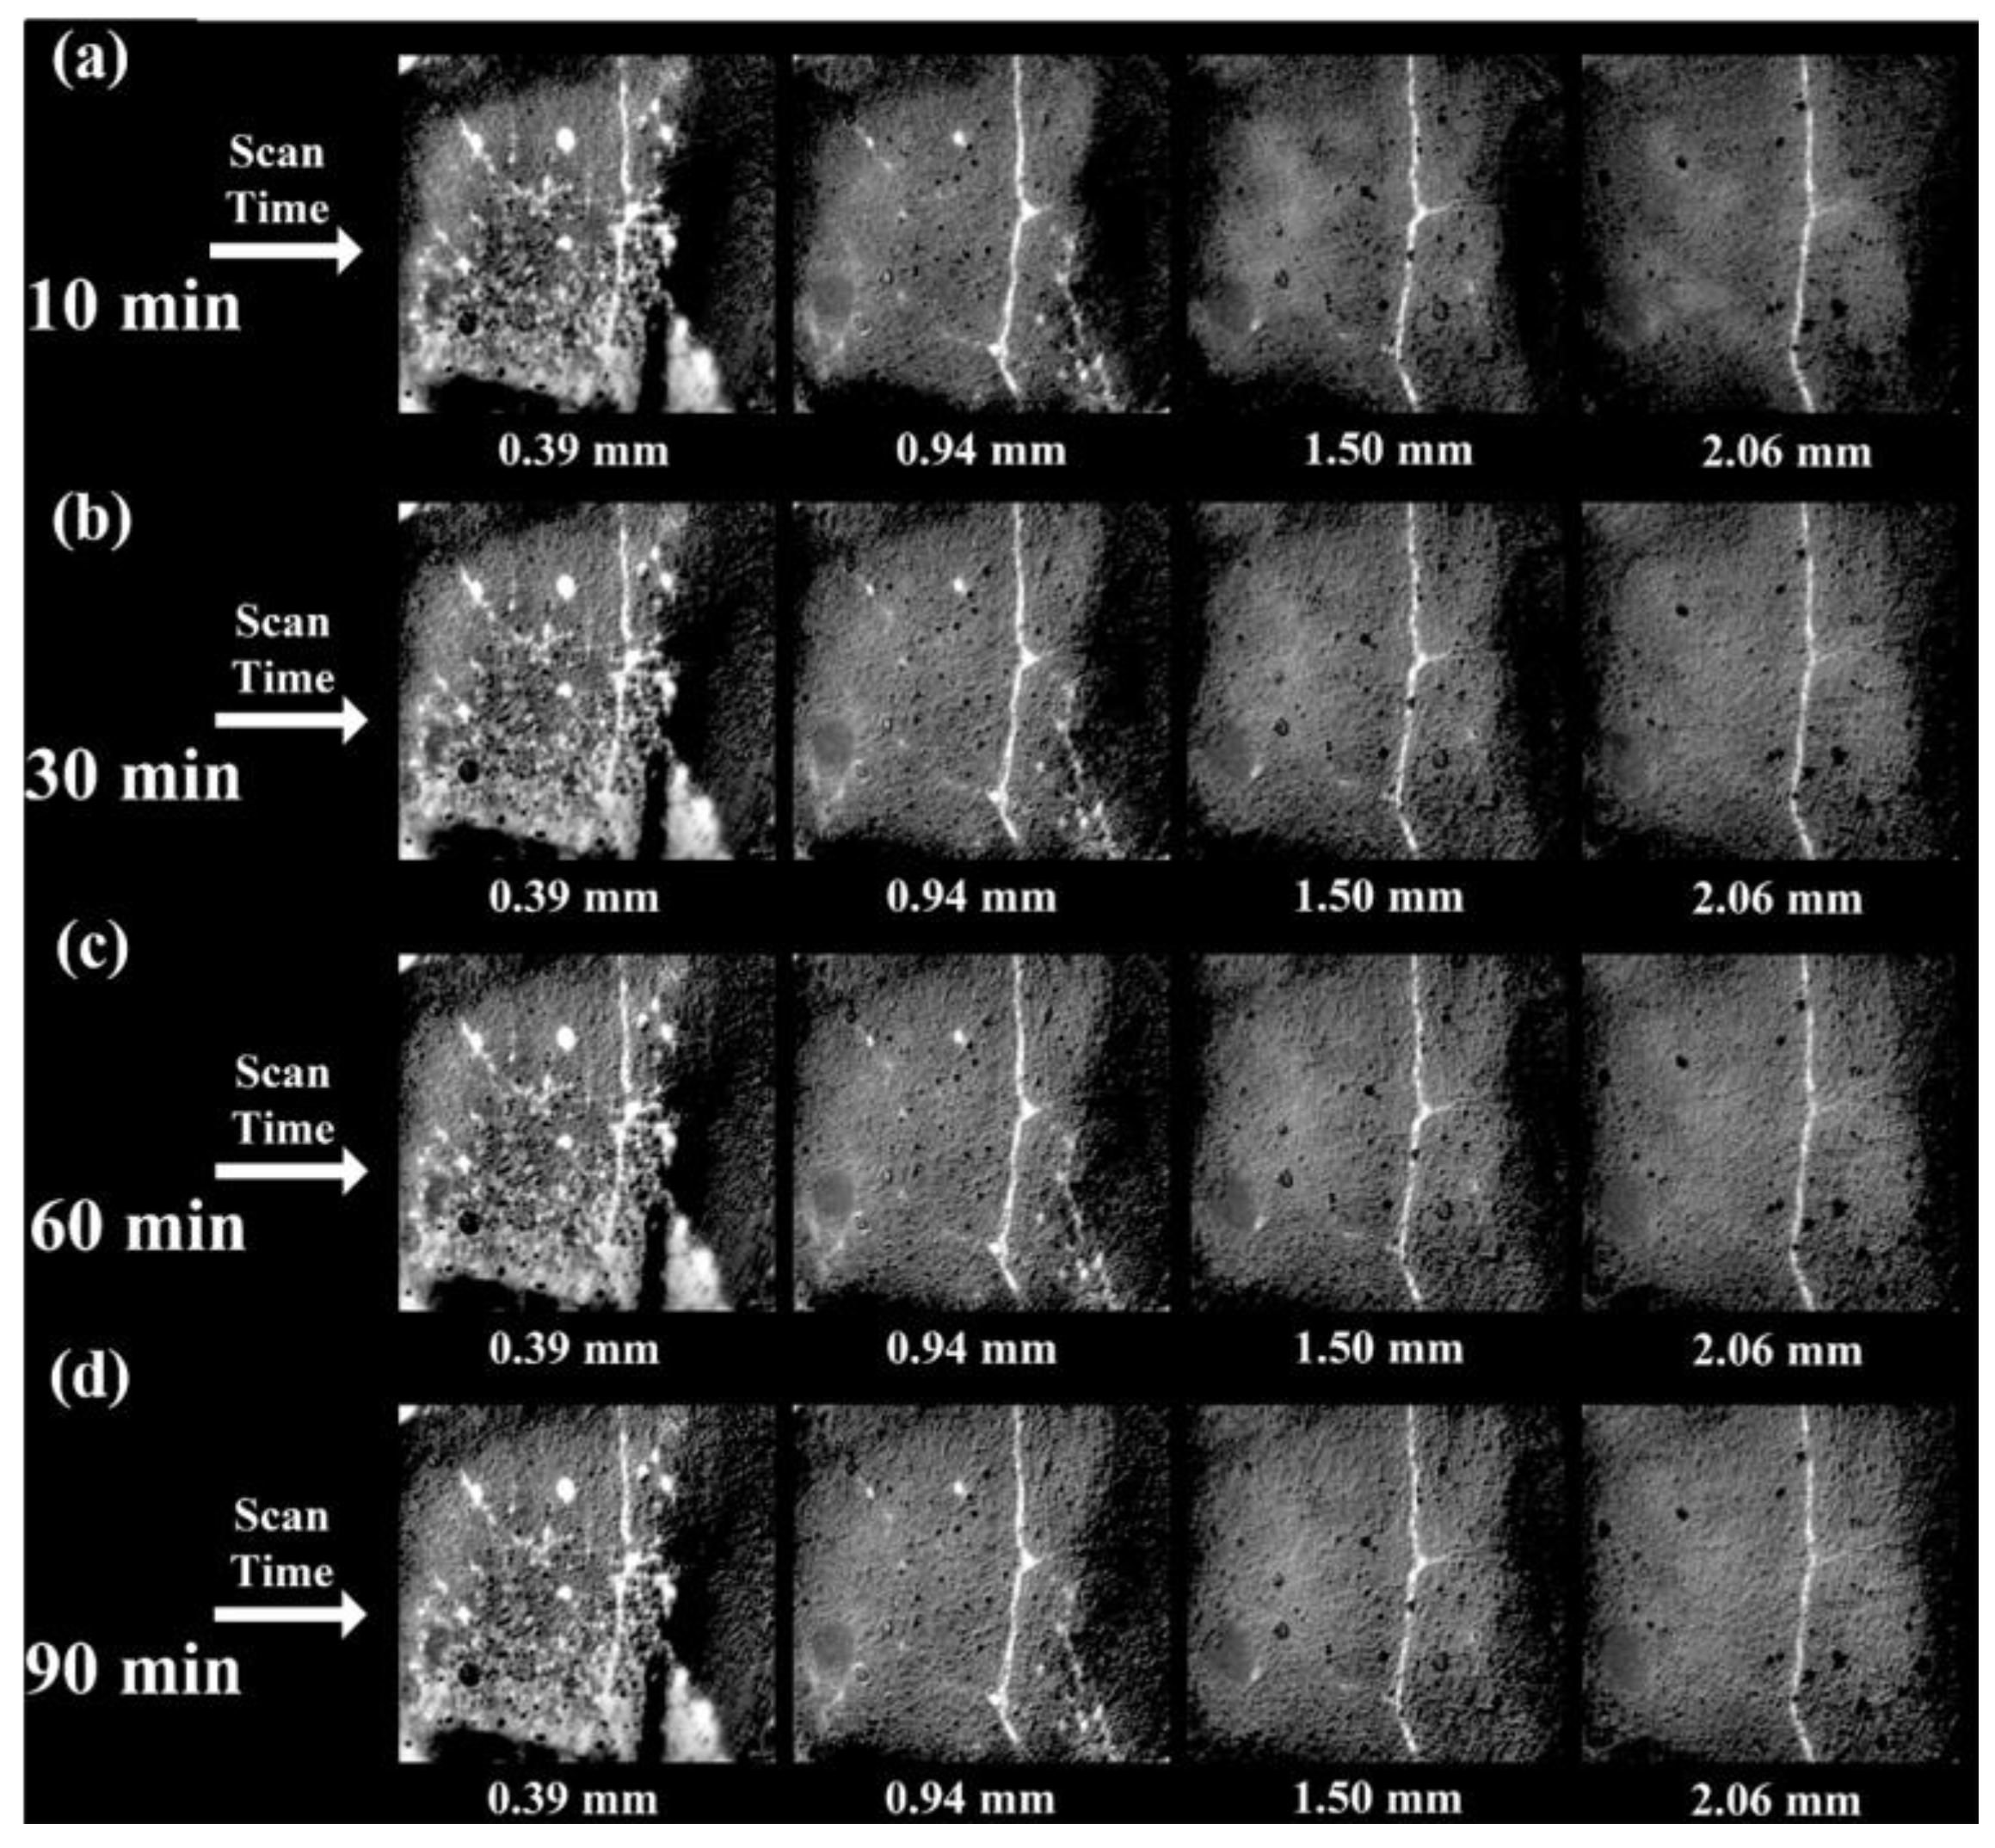
3.3.2. Y-Oriented 3DPFC

Imbibition characteristics within the Y-oriented 3DPFC specimens paralleled those of the X-oriented configuration, as evidenced by the decreasing imbibition quantity presented in Figure 11a–c. However, the moisture front depicted in these figures adopted an irregular form, thus highlighting the influential role of horizontal interlayers on water absorption patterns.
The findings of this study articulate a phased imbibition model for 3DPFC: initially, moisture advances upward from the saturated verge at the base; subsequently, the saturated interlayers become secondary reservoirs, expediting further moisture migration. The distribution profiles are markedly impacted by the orientation of the interlayers. For X-oriented specimens containing only horizontal interlayers, the profile assumes an elliptical shape. In contrast, the Y-oriented specimens, integrating both horizontal and vertical interlayers, manifest a more complex pattern; here, the transport predominantly encircles the horizontal interlayers but becomes disrupted and redirected at the junctures with vertical interlayers. Peaks in imbibition align with these intersections, signifying enhanced moisture transport rates in these areas relative to the surrounding matrix.

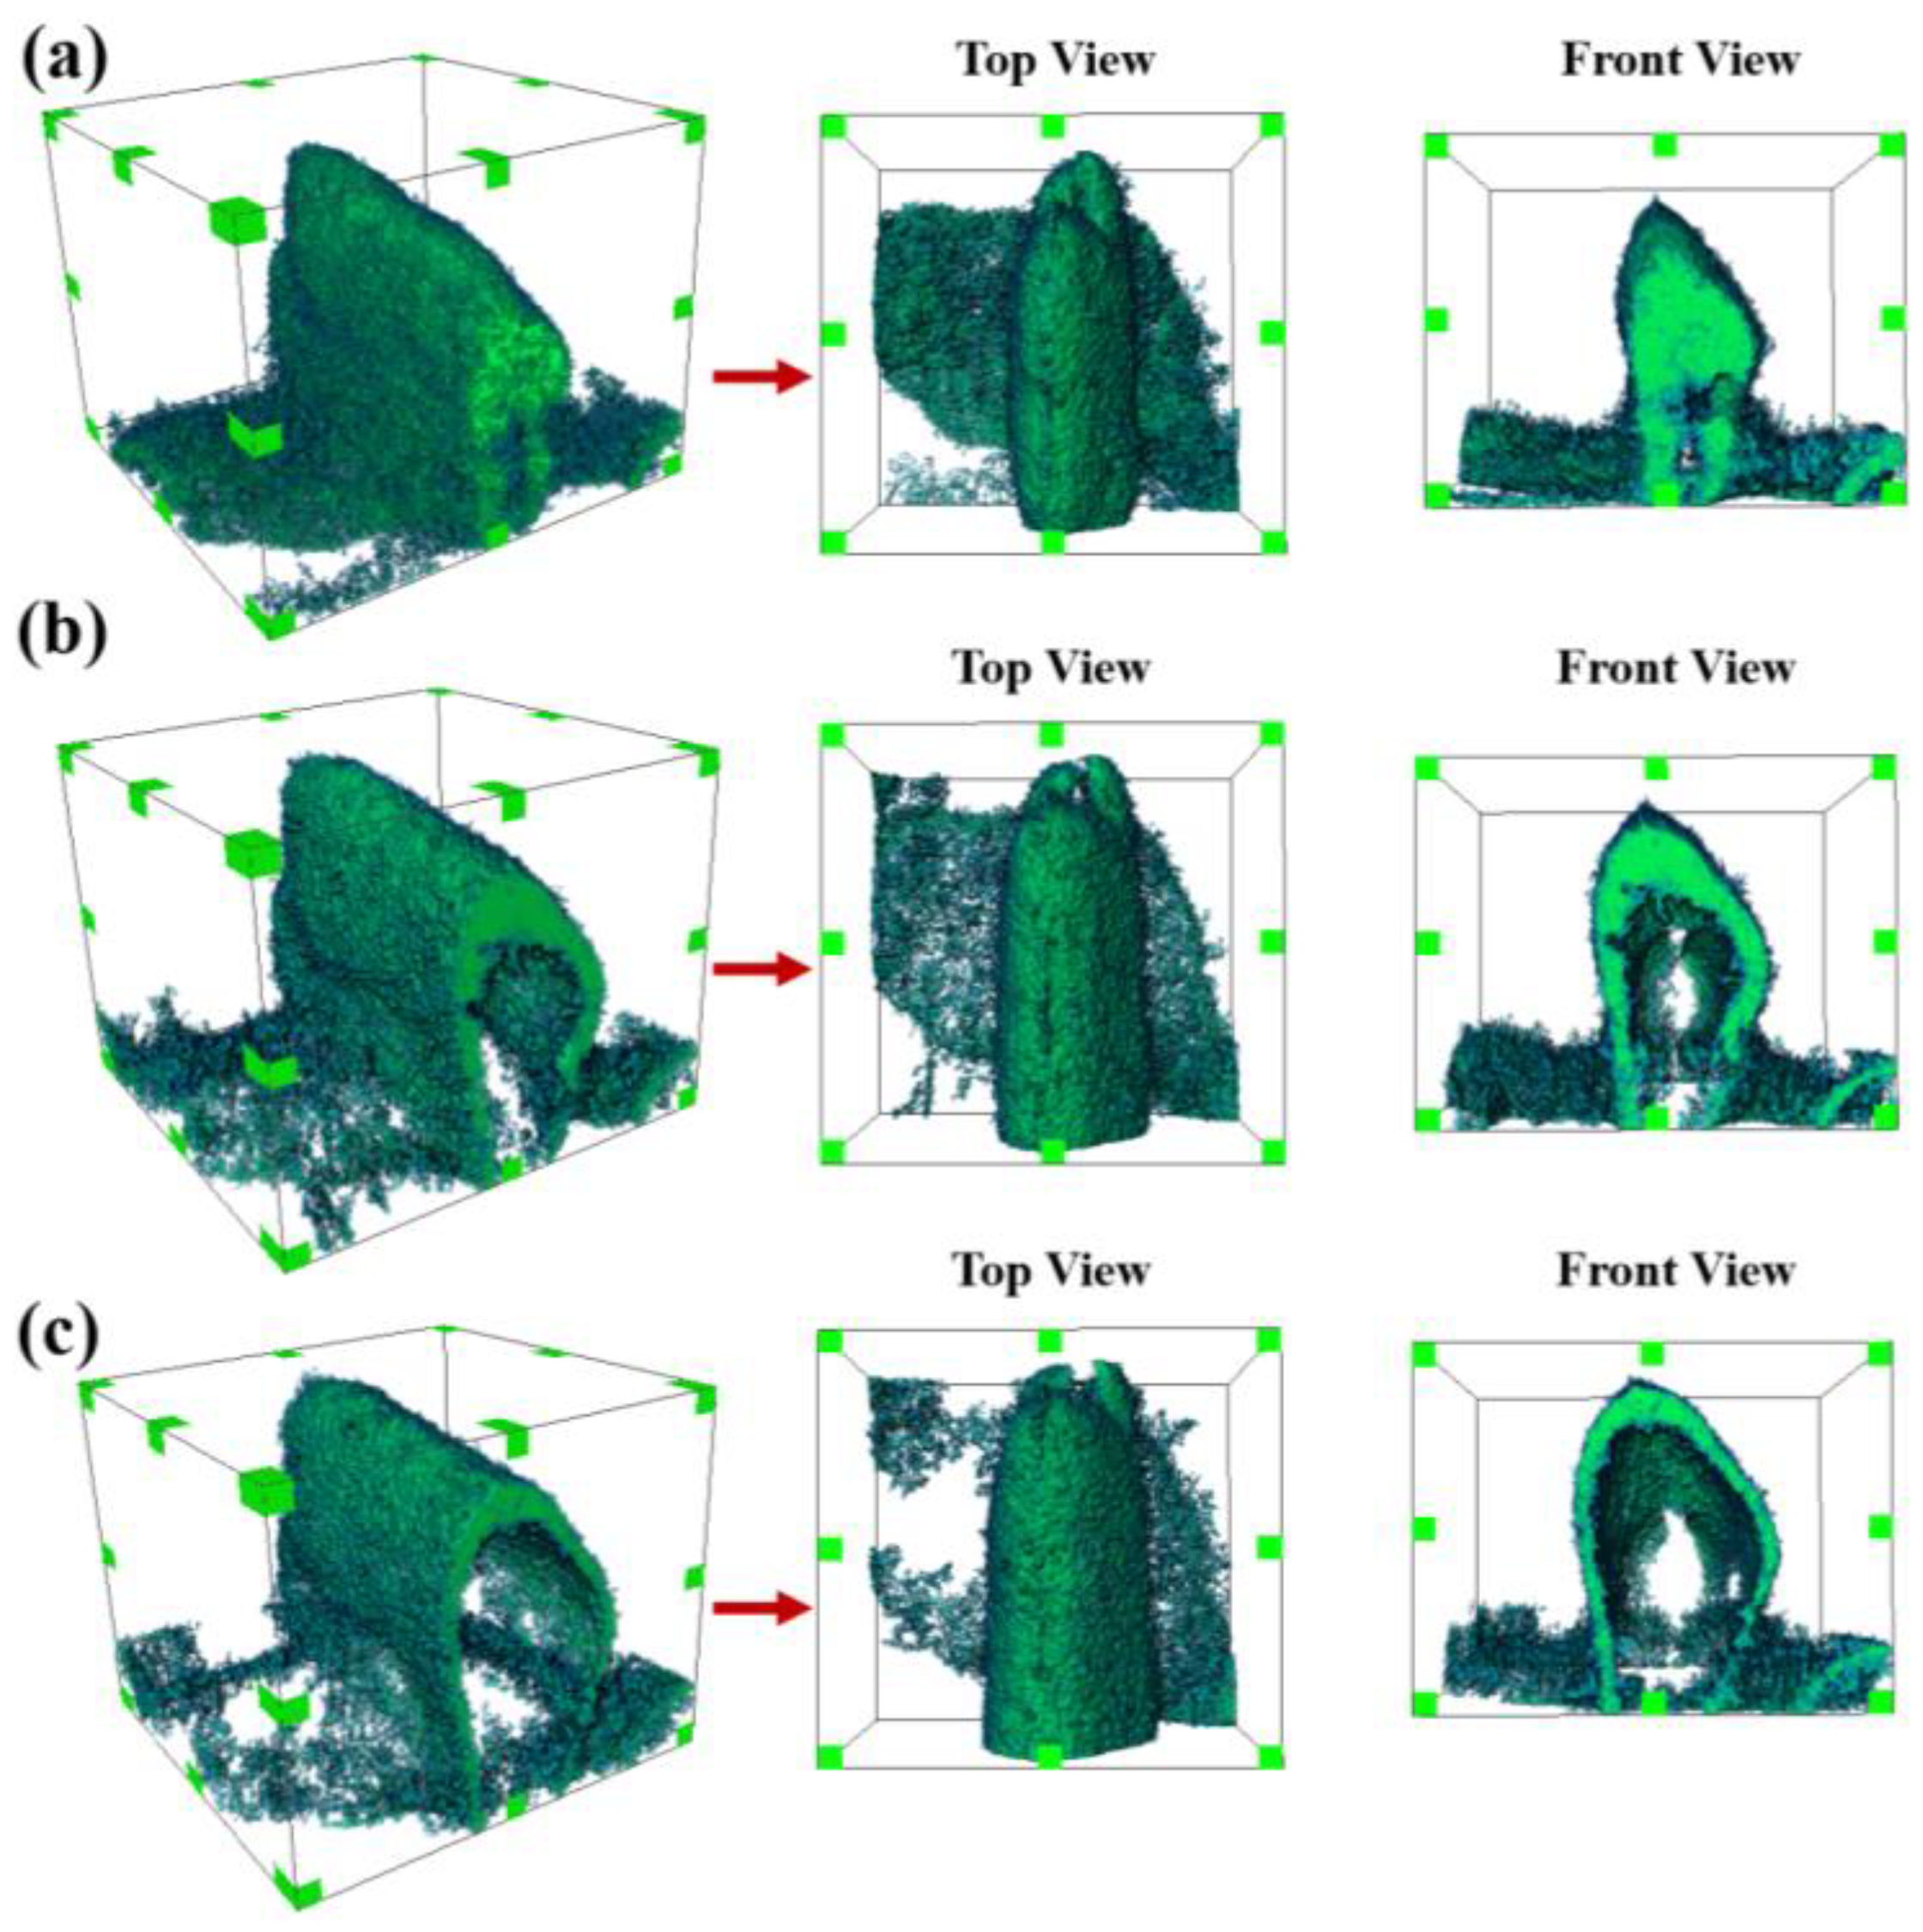
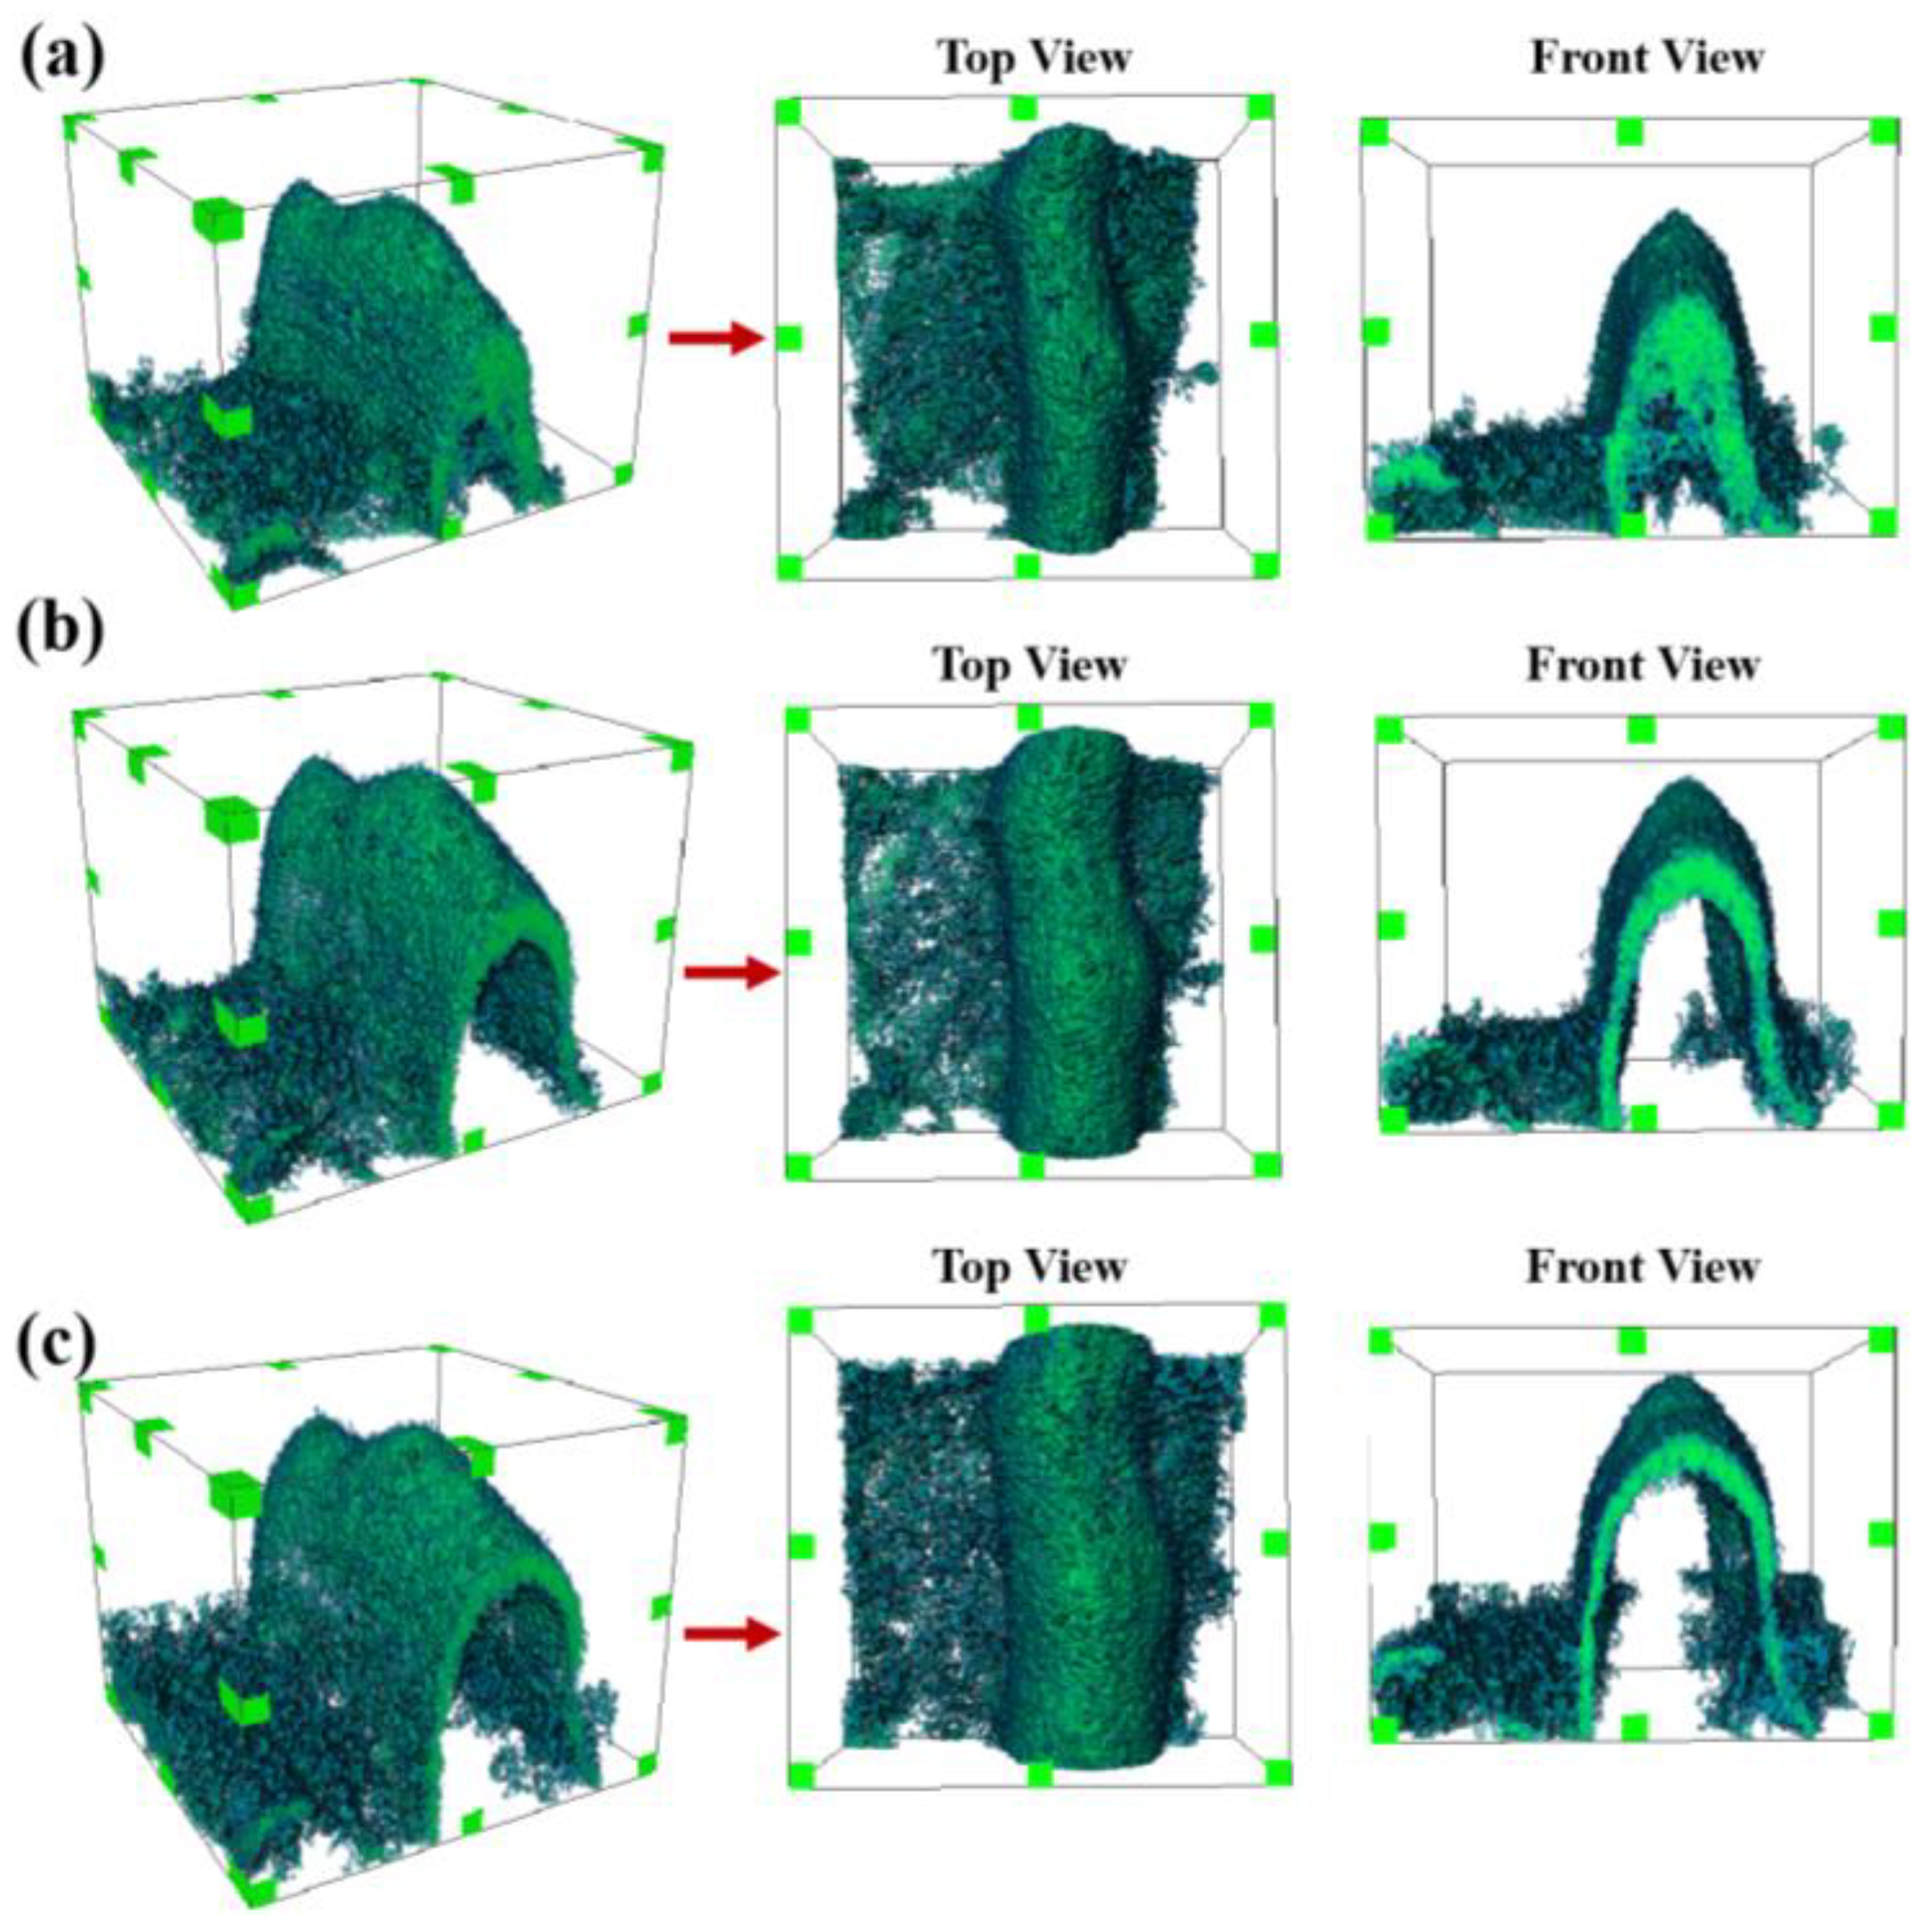
3.4. Three-Dimensional Visualization of Imbibition Front in 3DPFC

For an intuitive comprehension of the imbibition dynamics, three-dimensional renderings of the moisture fronts for both X-oriented and Y-oriented 3DPFC were constructed in Figure 12 and Figure 13, respectively. As inferred from the two-dimensional analyses, the trends in moisture penetration for both orientations were largely analogous, with interlayer travel demonstrating greater rapidity. Nonetheless, the overall imbibition shape in Figure 12 lacked symmetry, echoing the complex interactions at the confluence of the vertical and horizontal interlayers. Correspondingly, Figure 13 reveals asymmetry indicative of the presence and influence of horizontal interlayers, which, despite facilitating slower imbibition than the vertical counterparts, significantly affect the overall movement of moisture. Additionally, the convolutions noticeable in the top view of Figure 13 coalesce with the positions of vertical interlayers documented in the two-dimensional observations.

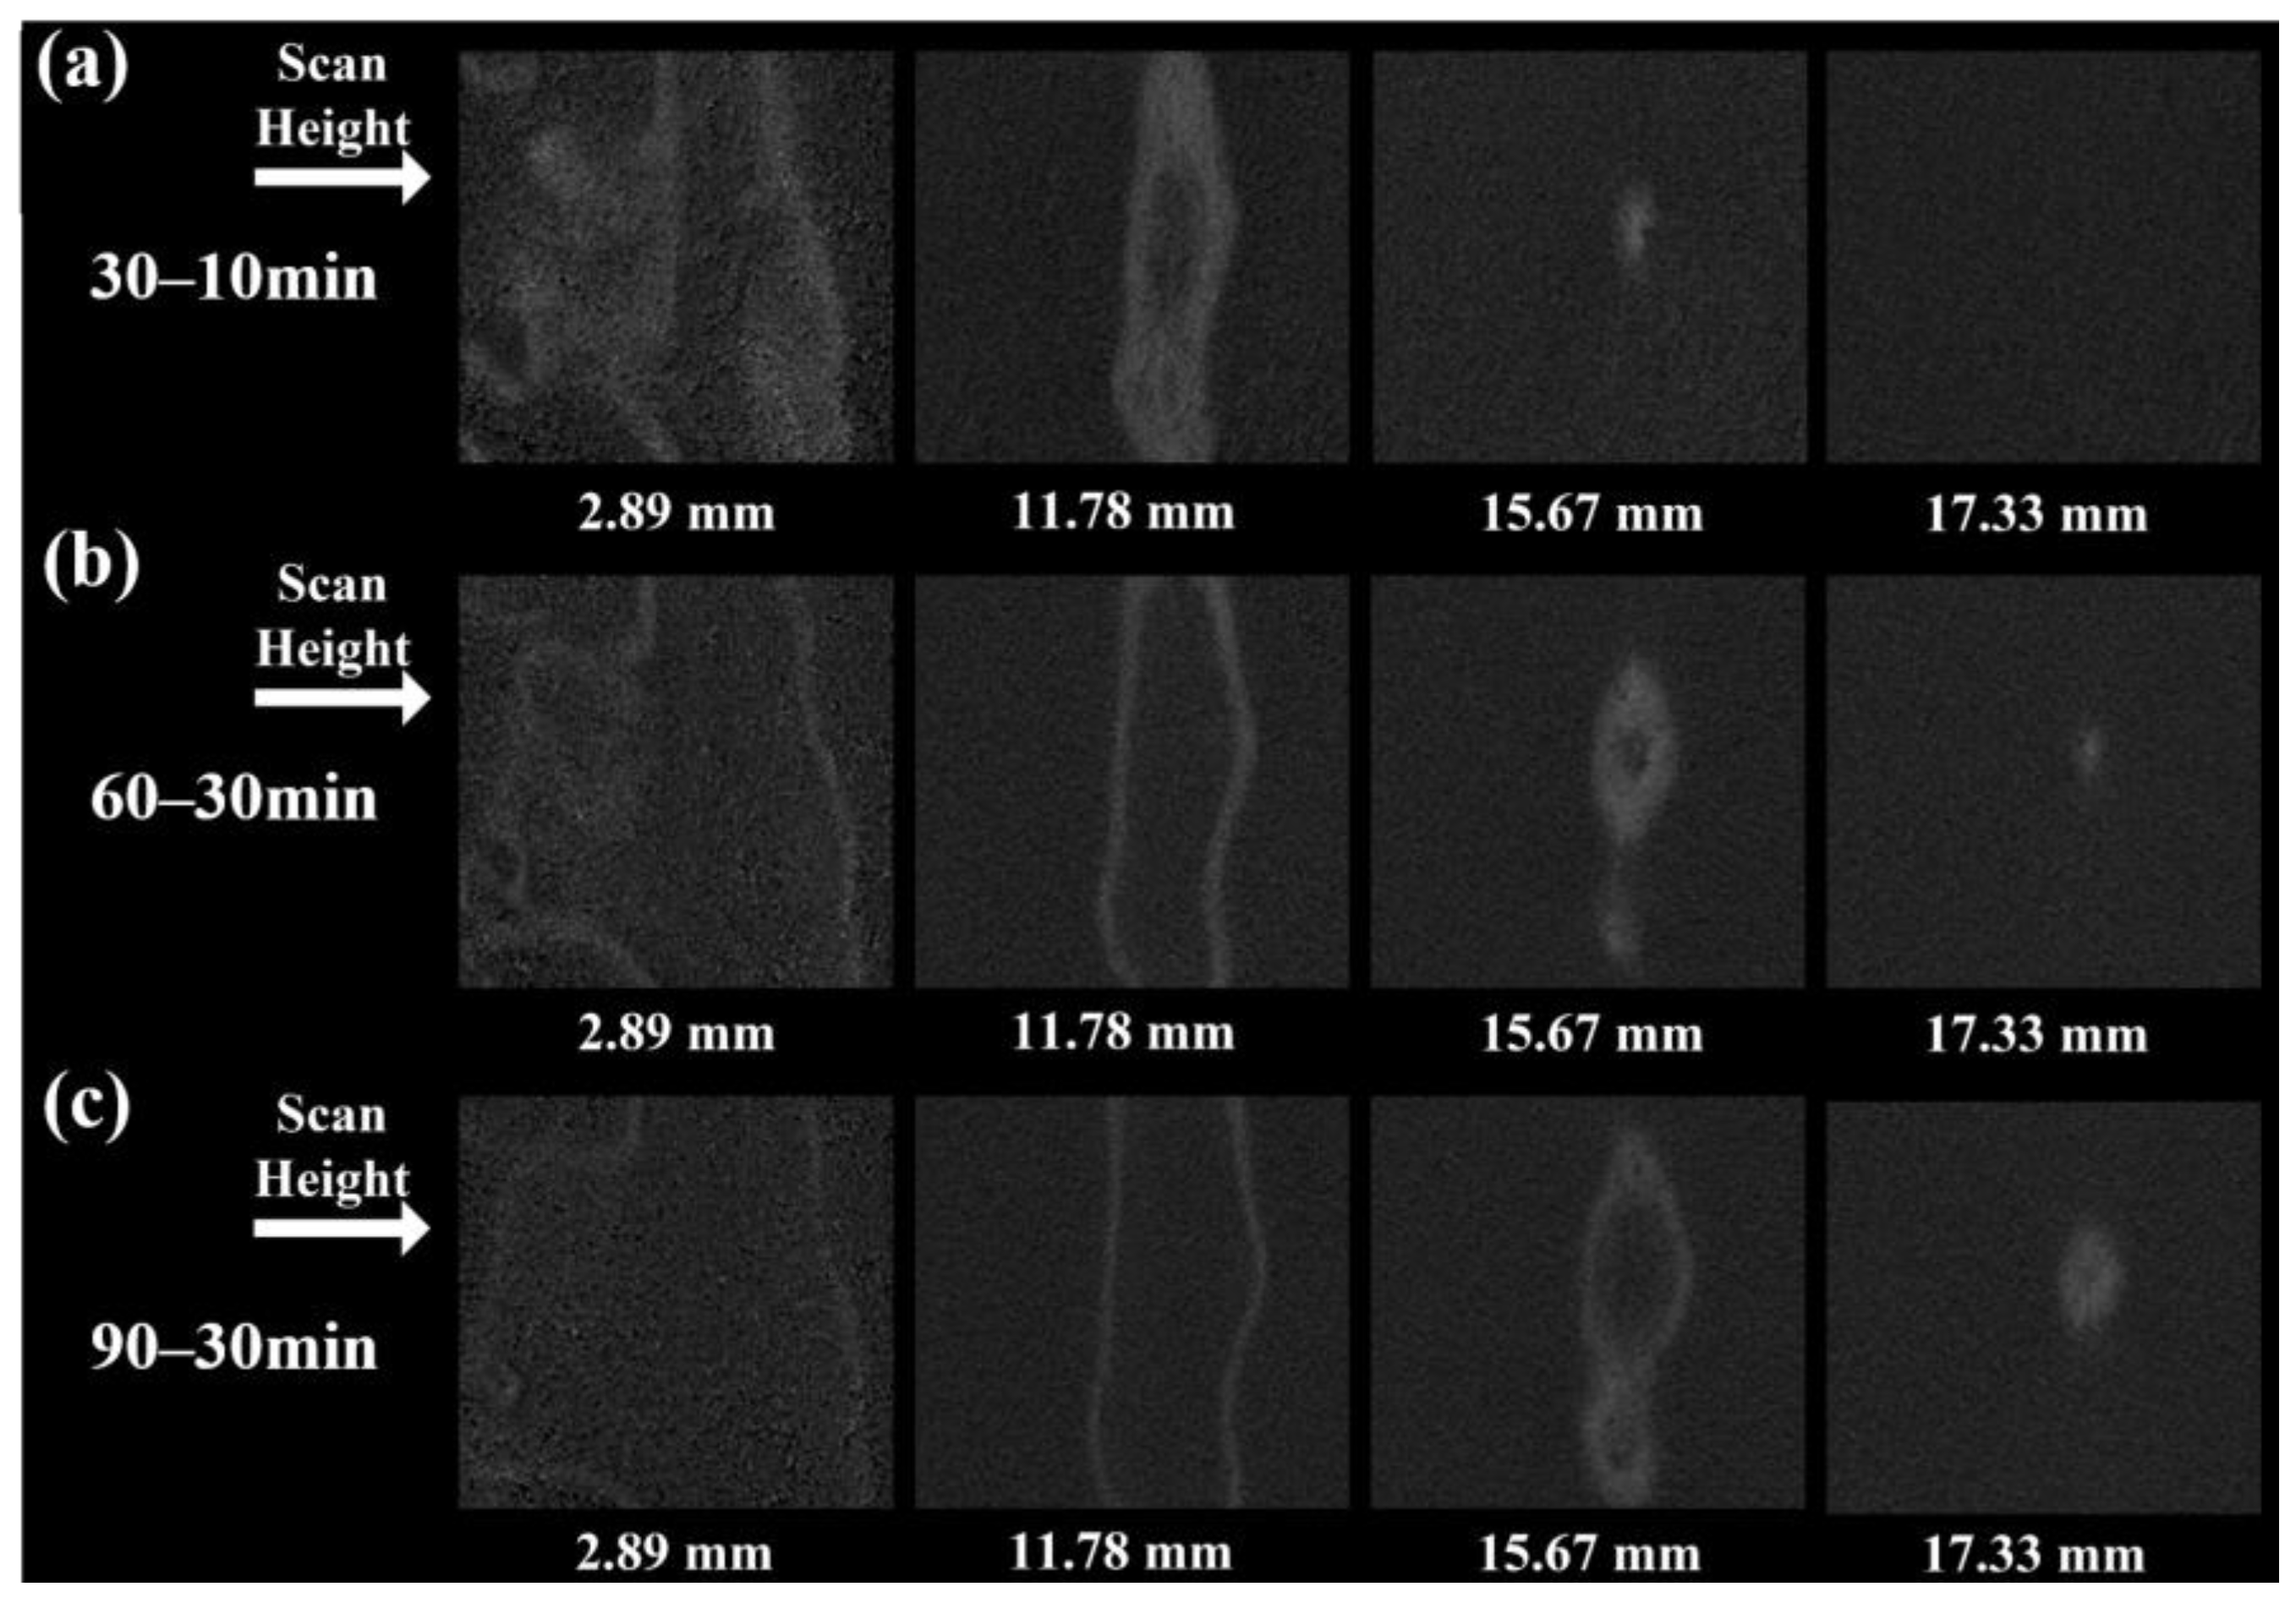
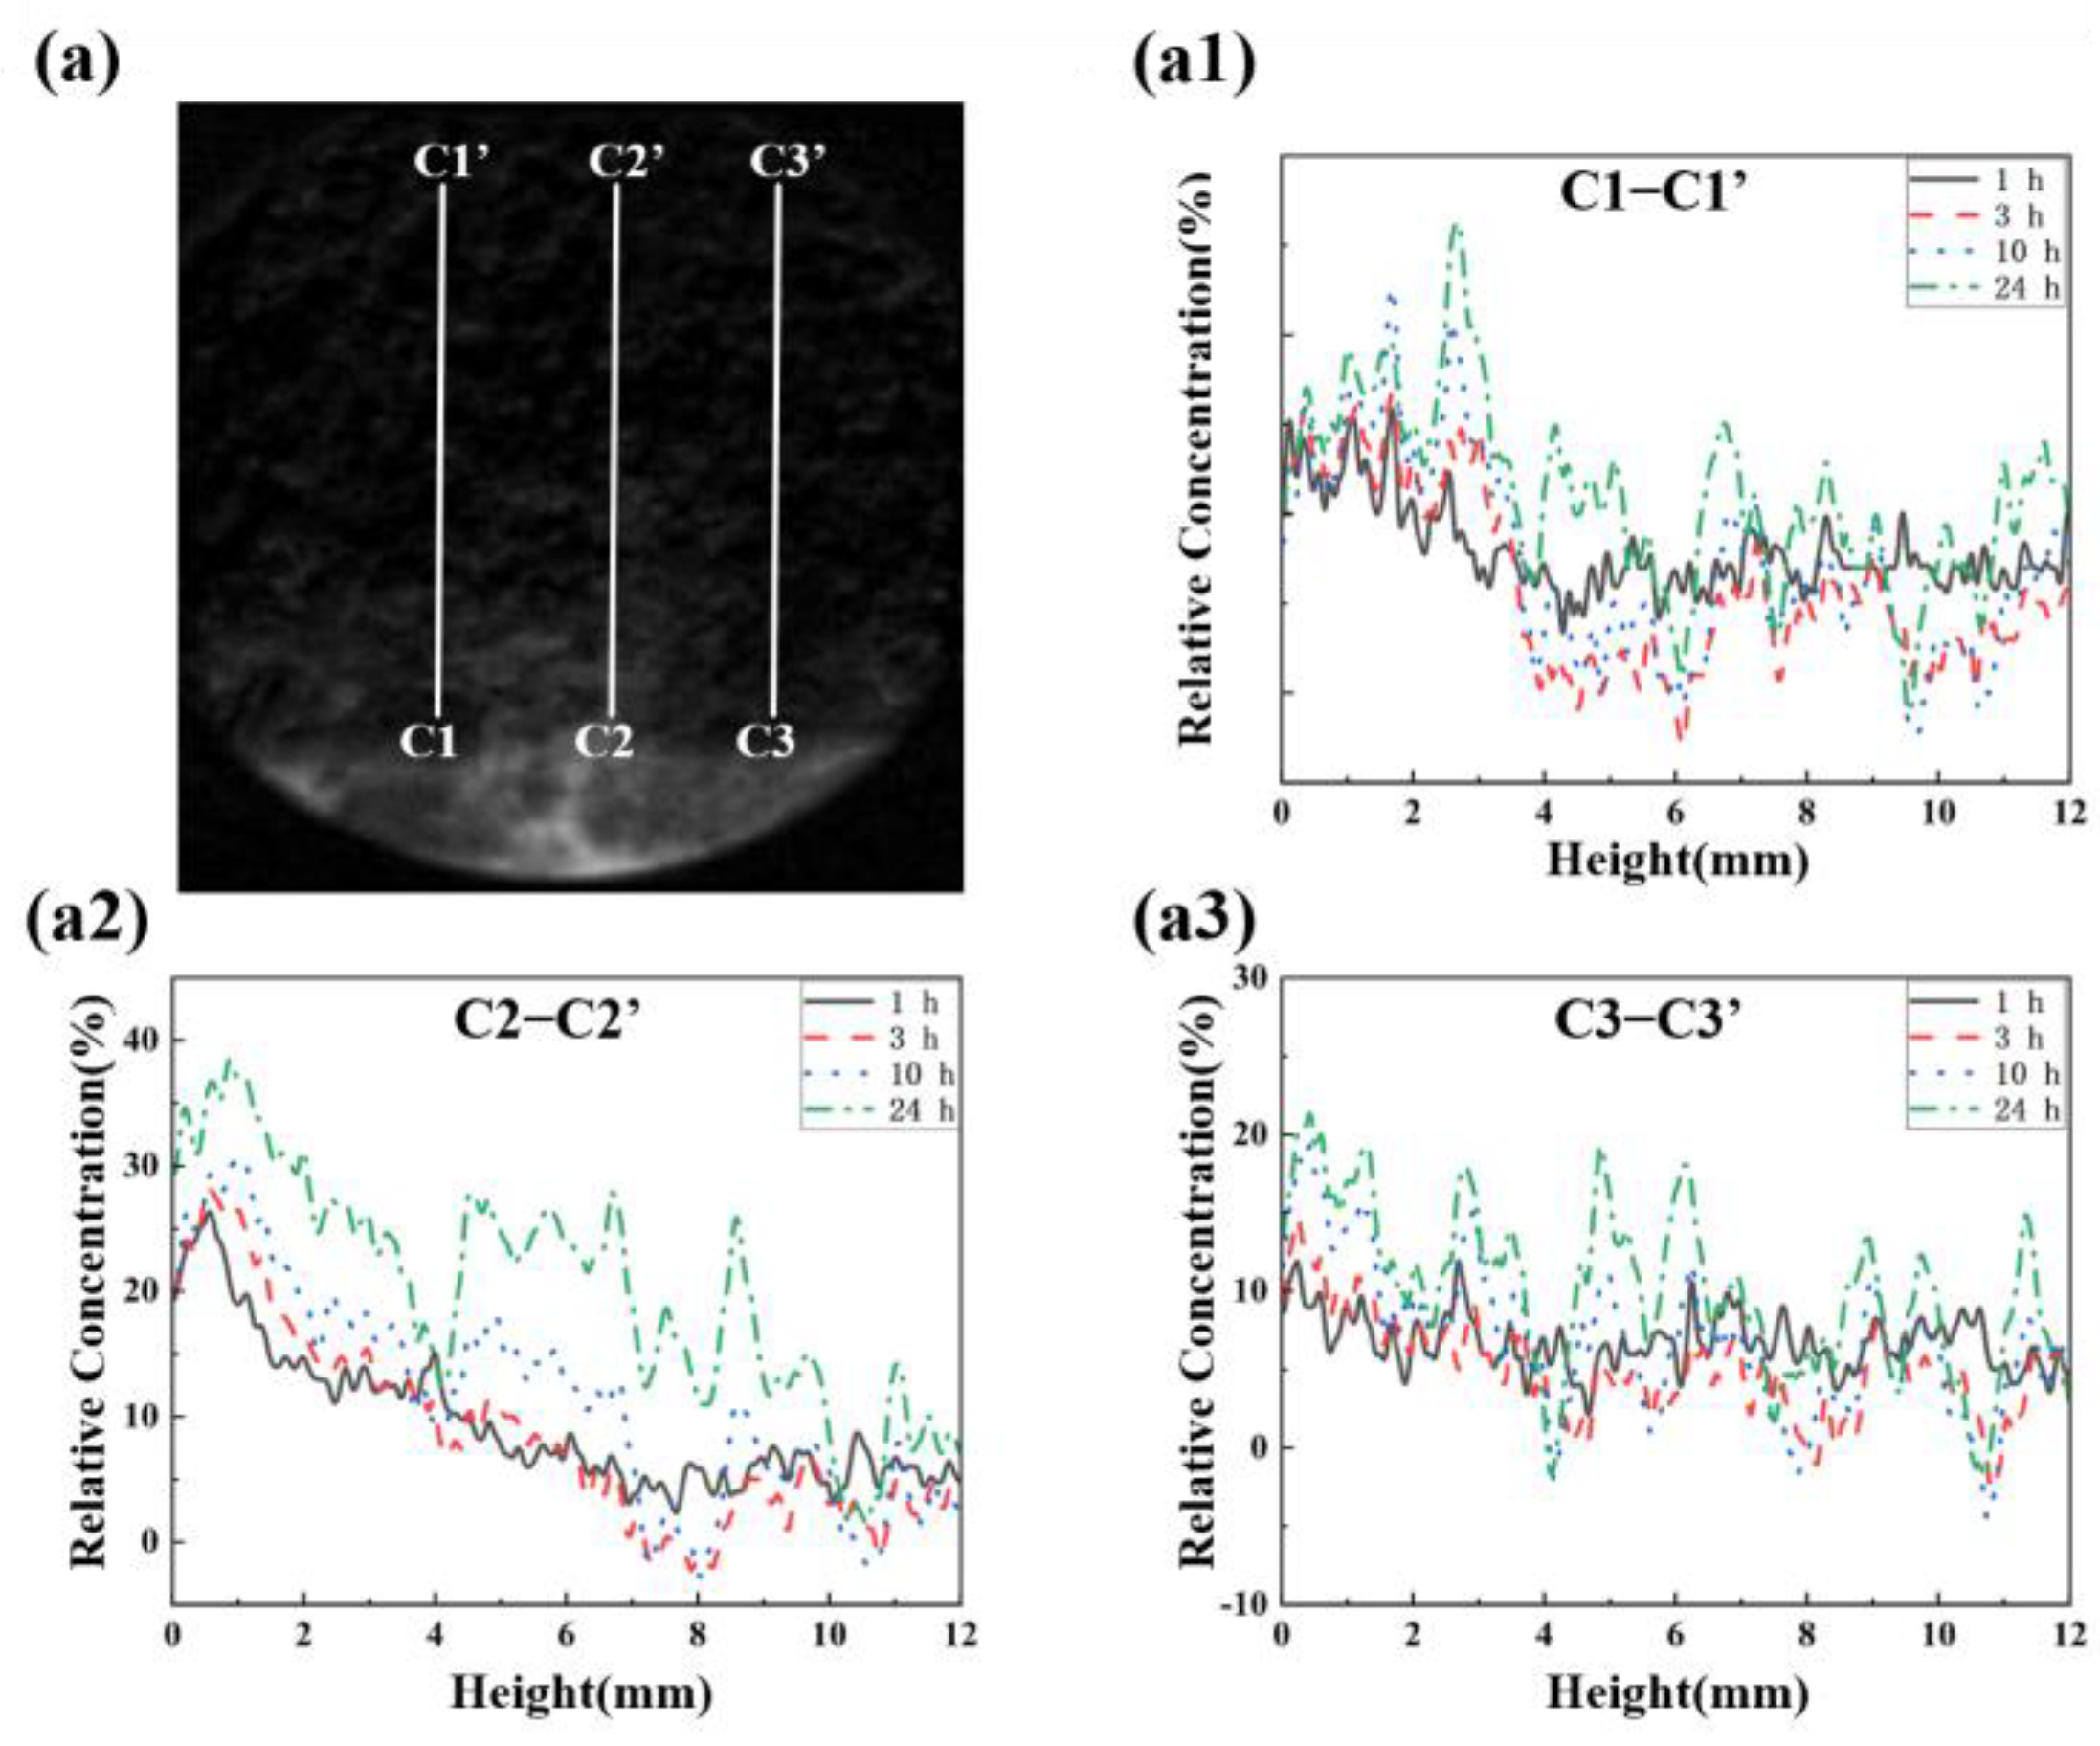
3.5. Two-Dimensional Imbibition Profiles for 3DPFC with Variant Intervals

As previously indicated, imbibition behavior in 3DPFC is primarily influenced by the printing interval [32,33]. Longer intervals led to weaker interlayers, which in turn resulted in a faster imbibition rate along these interlayers (Figure A1 and Figure A2). Therefore, 3DPFCs with various printing intervals were prepared, and the imbibition along the interlayers was studied.
Figure 14 presents the two-dimensional distribution of water obtained through X-ray radiography. Significant differences in imbibition between the top and bottom filaments are evident. For instance, in Figure 14a, imbibition was predominantly restricted to the top filament (the left part). This result is mainly attributed to the compaction effect: the bottom filament was compacted by the filament above, resulting in a denser filament with better resistance against imbibition [34,35,36,37]. However, this compacting effect was limited to the early age; in other printing intervals, the bottom filament hardened before the new filament set, making the compaction effect less significant.
Comparing different groups, it is interesting to note that imbibition along the interface appeared to accelerate when the printing intervals were shorter than 9 min. Conversely, with longer intervals, the imbibition effect seemed slower along the interlayer. The slower imbibition suggested a denser interlayer, likely due to compaction. Even though the bottom filament hardened before the setting of the top filament, the surface of the bottom filament was compacted by the top filament, resulting in a relatively denser interlayer.
Beyond a printing interval exceeding 15 min, the imbibition characteristics of the 3DPFC showed minimal variation overall. As depicted in Figure 14d,e, the initial 10 h witnessed a rapid rate of imbibition by the 3DPFC, whereas in the subsequent 14 h, the advancement of the moisture front ceased almost entirely. Notably, there was no evidence of imbibition in the interlayer during the early stage of imbibition. This observation supports the previous analysis: with prolonged printing intervals, the new filament from above filled the surface of the bottom filament, resulting in a denser interface that moderately inhibited moisture transfer.

3.6. Spatial Imbibition Profiles for 3DPFC with Variant Intervals

Based on XRAM, one-dimensional relative moisture content curves of the 3DPFC were plotted under different printing intervals, as shown in Figure 15. To comprehensively elucidate the moisture transport process, three relative moisture content plots were generated for each specimen, corresponding to the top filament, interlayer, and bottom filament regions.
Comparing among Figure 15(a1–a3), after 24 h of imbibition, the moisture content in the top filament region reached up to 30%, with 12% in the interlayer region and only 7% in the bottom filament, consistent with the two-dimensional imbibition results. Simultaneously, the moisture content curves in different regions exhibited varying changes. The moisture content curves at positions A1−A1’ and A3−A3’ showed a similar upward trend with absorption time, whereas the moisture content curve at A2−A2’ remained constant at the 10 h mark, indicating almost no further imbibition in the interlayer region during the subsequent 14 h. The possible reason for this stagnant absorption is that the interlayer was relatively dense, thereby inhibiting moisture transport.
For specimens with a printing interval of 6 min (see Figure 16), the imbibition height of the top filament after 24 h was only 5 mm, and the imbibition height in the interlayer and bottom filament did not exceed 4 mm. This result confirms that due to the compression and filling effects of the top filament material, the water transfer speed in the interlayer and bottom filament was relatively slower. Additionally, compared with the 3 min group, the imbibition front of the 6 min group was steeper. This phenomenon occurred because the deformation on both sides of the 6 min group was more consistent, and there were no lateral tears caused by the deformation of the bottom filament.
For specimens with a printing interval of 9 min (see Figure 17), the moisture content curve in the interlayer region showed the most significant variation. This phenomenon was due to the moderate printing interval, which resulted in the bottom filament material not being compressed as densely in the interlayer area. Furthermore, since the degree of hardening of the bottom filament material was small, the filling phenomenon of the top filament material was not significant, thereby forming a weak interlayer transition zone. Within this transition zone, the structure was relatively porous, resulting in faster water transfer along the interlayer.
As the time interval increased, one could gradually observe the densification effect resulting from the infusion of fresh material into the interlayer by the top filament material. For the specimen with a 21 min printing interval (see Figure 18), there was a noticeable gap in the imbibition front. The relative moisture content in the bottom filament was approximately 30%, exceeding the 10–20% observed in specimens with shorter printing intervals. This indicates that for 3DPFC with longer printing intervals, the deformation in the bottom filament due to the compression of the top filament was reduced, resulting in a looser structure that could absorb more moisture. Similarly, in the 21 min interval specimen, the imbibition height near the interlayer was lower than that in the upper matrix. This further demonstrates that the compaction effect of the upper material on the bottom filament’s surface inhibited moisture transport in the interlayer gap region. Additionally, unlike the previous specimens, Figure 18 shows a significant increase in moisture content between 3–10 h, corresponding to moisture travelling into a denser region. Therefore, this result suggested that for specimens with longer printing intervals, the inherent heterogeneity of the 3DPFC and the uneven filling of the upper material could create localized dense structures within the specimen, necessitating longer periods for moisture penetration into these areas [38].

3.7. Validation

Considering the significant irregularity of the imbibition front in the X-ray images, the gravimetric method was used as a validation to calculate the imbibition height of the specimens. Figure 19a shows the change in imbibition height over time for the top filament of 3DPFC at different printing intervals. Clearly, the longer the printing interval, the greater the imbibition height, indicating that specimens with longer printing intervals absorbed more water in the same period, corroborating the X-ray image results. The imbibition height based on the gravimetric method was much lower than the actual results obtained from the X-ray attenuation method, which arose because the gravimetric method assumed that all pores were fully saturated, neglecting the existence of unsaturated pores. In reality, the presence of a significant amount of unsaturated transport in foam concrete [39] led to an underestimation of water transport results by the gravimetric method. Linear fitting of the water transport height at different absorption ages provided the 1D imbibition rate for 3DPFC, as shown in Figure 19b,c. The figures indicate that the imbibition rate increased with longer printing intervals. The specimen with a 3 min printing interval had the lowest absorption rate of 0.07874 mm/min1/2, while the specimen with a 30 min printing interval had the highest absorption rate of 0.13657 mm/min1/2. This supported the previous conclusion that longer printing intervals result in greater shrinkage and cracking, creating a looser surface structure and faster imbibition rates.

3.8. Splitting Tensile Test

Table 3 summarizes the splitting tensile strength of specimens under varying printing interval times, revealing that the maximum splitting tensile strength was achieved at moderate printing intervals (6 to 15 min), while specimens with short and long printing intervals exhibited lower bonding strength. This result is consistent with the aforementioned imbibition test results, indicating that the interface of specimens printed at a 15 min printing interval time is more compact.

4. Discussion

In recent years, the construction industry has been increasingly recognized as a significant contributor to global greenhouse gas emissions and resource depletion. Consequently, there has been a growing emphasis on developing and adopting green building technologies that can mitigate these impacts. Among these technologies, 3D printing in construction, particularly for the production of foam concrete, has shown immense potential in terms of material efficiency, waste reduction, and design flexibility. However, for these technologies to truly contribute to sustainability goals, it is crucial to understand their broader implications and optimize their performance within the context of sustainable construction practices.
This study presents an important contribution to this field by investigating the effect of printing interval on the imbibition behavior of 3D-printed foam concrete. Imbibition, the process of water absorption, is a critical factor influencing the durability and performance of concrete structures. By optimizing the printing interval, this study aimed to improve the material’s resistance to moisture-related degradation, thereby enhancing its long-term sustainability.
This paper endeavored to bridge this gap by situating the research within the broader context of sustainable construction practices, emphasizing the significance of optimizing material efficiency, reducing the environmental impact, and enhancing the overall sustainability of the built environment. Specifically, it highlights the potential for optimizing the printing process to reduce water absorption, which can lead to improved durability and reduced maintenance costs over the structure’s lifecycle. Furthermore, it emphasizes the importance of considering the environmental impacts of the printing process and material sourcing, as well as the potential for waste reduction through precise material deposition.
By highlighting this study’s contributions to optimizing material properties and reducing environmental impacts, this paper has demonstrated the potential for 3D-printed foam concrete to contribute to broader sustainability goals. However, it also acknowledges the need for further research to fully understand the environmental, economic, and social implications of this technology and to ensure its successful integration into sustainable building practices.
Foam concrete is highly valued in protective and blast-resistant engineering applications due to its exceptional wave absorption capabilities [40,41,42]. However, the production process of foam concrete, which involves foaming steps, is relatively complex, making it challenging to maintain a consistent microstructure when employing 3D printing techniques [43,44]. As a result, limited progress has been made in the development of 3DPFC. Similarly, like conventional 3DPC, the interfacial regions of 3DPFC are comparatively fragile, leading to suboptimal interface performance [45].
This paper systematically investigated the effect of printing intervals on the imbibition properties of 3DPFC and evaluated the interfacial performance based on those properties. Preliminary results indicate that, similar to standard 3DPC, the interface between adjacent printing filaments is fragile due to inconsistencies in hydration levels and moisture content. This study shows that a shorter printing interval (less than 15 min) could improve the interface quality to some extent, corroborating earlier findings [46,47]. However, excessively reducing the printing interval (less than 3 min) compromised the structural integrity of the bottom filaments before they solidified, causing significant deformation and loss of the foam structure. This deviation from the intended air content and structural inconsistency negatively impacted the performance of the foam concrete. Consequently, in the realm of 3D printing of foam concrete, shorter interval times do not necessarily equate to better material performance, and it is thus necessary to explore alternative methods to improve the interface without affecting the air content and uniformity of the foam concrete, which poses a current research challenge.
This study provides fresh perspectives on this complex issue. As shown in Figure 20, it was observed that if the printing interval was too long (exceeding 15 min), the interface performance diverged from expectations and displayed an unforeseen re-densification phenomenon. This phenomenon occurred because the bottom filament of the foam concrete had solidified and developed a loose, porous structure. When a fresh filament from above was applied, the new cement paste could infiltrate the upper surface of the bottom filament, creating a densified effect at the interface. Thus, it is hypothesized that there exists an optimal printing interval where the positive effect of infilling precisely counterbalances the negative effect at the interface, thereby enhancing its performance without compromising the designated air content and consistency of the foam concrete. Such work deserves further investigation.

5. Conclusions and Future Work

5.1. Conclusions

Foam concrete is highly valued in protective and blast-resistant engineering applications due to its exceptional wave absorption capabilities. However, there has been limited progress in the development of 3D-printed foam concrete. This paper utilized X-ray imaging, X-ray computed tomography (CT), and a gravimetric method to investigate the imbibition behavior of foam concrete. Furthermore, through altering the printing interval from 3 min to 30 min, the influence of the printing parameter on the 3DPFC was systematically analyzed as well. The present study yielded several conclusions:
  • The horizontal interlayer, due to its longer printing interval, is broader compared to the vertical interlayer, thus causing more significant imbibition.
  • For the X-oriented 3DPFC, the vertical interlayer is occupied instantly by water right after imbibition. This process results in the formation of an elliptical moisture distribution and significantly extends the boundary of the saturation zone.
  • For the Y-oriented 3DPFC, which contains both horizontal and vertical interlayers, the moisture profile appears more convoluted. The moisture transport profile mainly surrounds the horizontal interlayers but shifts at the intersections with the vertical interlayers.
  • For the Z-oriented 3DPFC, the increased compactness of the horizontal interlayers effectively inhibits water migration through these layers.
  • Imbibition is primarily restricted to the top filament, primarily due to the compaction effect: the bottom filament becomes compacted by the filament above, resulting in increased density and enhanced resistance to imbibition.
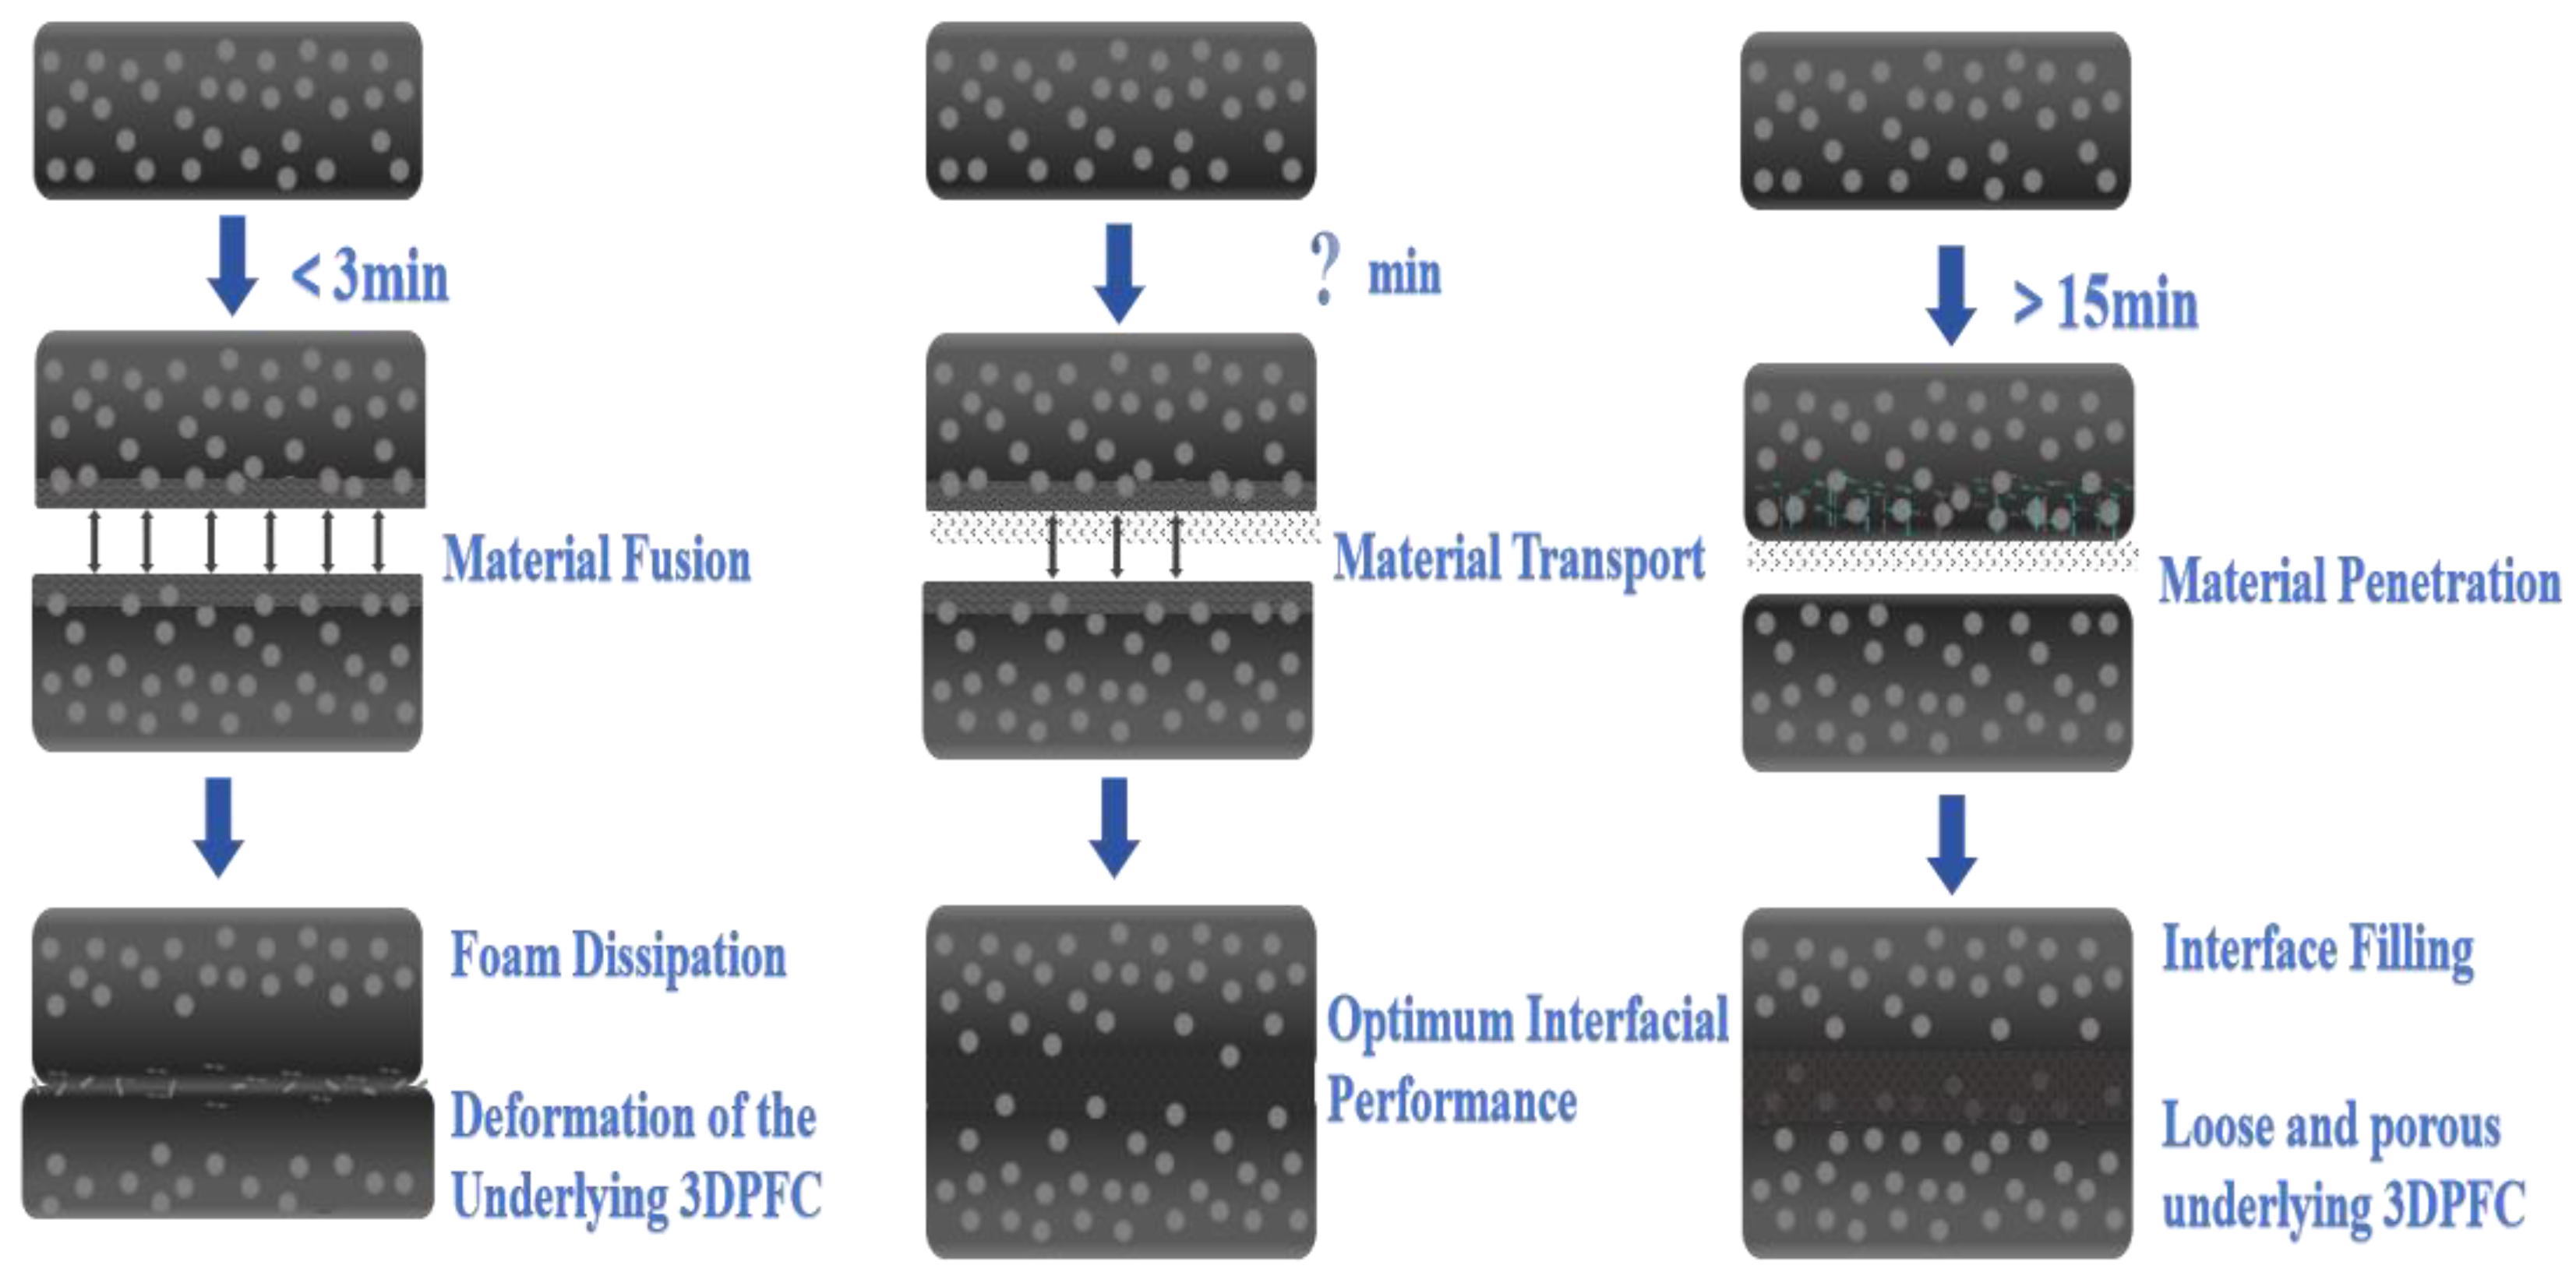
  • When the printing interval exceeds 15 min, the bottom filament solidifies prior to the deposition of the top filament. Consequently, the surface of the bottom filament undergoes compaction by the top filament, leading to the formation of a relatively denser interlayer.

5.2. Future Work

An imbibition test of 3DPFC was conducted to investigate the influence of printing interval time on moisture transport behavior. Other factors, such as ambient temperature/humidity and nozzle diameter, were not considered in this study. Future research will address these variables to develop higher-performance 3DPFC. Based on the current findings, further optimization of the 3D printing process for foam concrete is planned. The goal is to identify an optimal printing interval time that enhances interfacial performance without compromising the designated air content and consistency of the foam concrete. Additionally, this study exclusively examined foam concrete, resulting in a limited range of materials tested. Consequently, the general applicability of the results requires further validation. Future research should explore better alternative materials to meet sustainability objectives. All of the aforementioned work will be continued.

Author Contributions

Conceptualization and methodology, X.L., S.L. and H.C.; data analysis, X.L., J.D. and H.C.; data collection, J.D. and Z.D.; writing—original draft, X.L., J.D., Y.D., X.Z. and H.C.; supervision, H.C. and J.D. All authors have read and agreed to the published version of the manuscript.

Funding

The funding for this study comes from the Natural Science Foundation of China (52008210, 52078252, 52378242), Postgraduate Research & Practice Innovation Program of Jiangsu Province (KYCX23_0136).

Institutional Review Board Statement

No applicable.

Informed Consent Statement

No applicable.

Data Availability Statement

Data are contained within the article.

Acknowledgments

Thanks are also given to Guan-Tong Han and Yi-Dong Shen for their useful discussion.

Conflicts of Interest

The authors declare no conflicts of interest.

Appendix A. Raw Data of X-ray Scenography

Figure A1. Raw imaging results of the top layer specimen at different printing interval times: (a) 3 min, (b) 6 min, (c) 9 min, (d) 15 min, (e) 21 min, and (f) 30 min.
Sustainability 16 07841 g0a1aSustainability 16 07841 g0a1b
As can be seen from Figure A1 and Figure A2, even though the phenomenon was not obvious, the local image still appeared darker due to the upward transmission of moisture.
Figure A2. 1D grayscale curves of the top 3DPFC at different printing interval times: (a) 3 min, (b) 6 min, (c) 9 min, (d) 15 min, (e) 21 min, and (f) 33 min (The curve on the right figure is the grey value of the white line on the left figure).
Sustainability 16 07841 g0a2

References

  1. Liu, C.; Wang, Z.; Wu, Y.; Liu, H.; Zhang, T.; Wang, X.; Zhang, W. 3D printing concrete with recycled sand: The influence mechanism of extruded pore defects on constitutive relationship. Constr. Build. Mater. 2023, 68, 106169. [Google Scholar] [CrossRef]
  2. Liu, H.; Liu, C.; Bai, G.; Wu, Y.; He, C.; Zhang, R.; Wang, Y. Influence of pore defects on the hardened properties of 3D printed concrete with coarse aggregate. Addit. Manuf. 2022, 55, 102843. [Google Scholar] [CrossRef]
  3. Çelik, M.Y.; Kaçmaz, A.U. The investigation of static and dynamic capillary by water absorption in porous building stones under normal and salty water conditions. Environ. Earth Sci. 2016, 75, 307. [Google Scholar] [CrossRef]
  4. Saxena, M.; Gupta, M.K. Mechanical, thermal, and water absorption properties of hybrid wood composites. Proc. Inst. Mech. Eng. Part L J. Mater. Des. Appl. 2019, 233, 1914–1922. [Google Scholar] [CrossRef]
  5. Chen, Y.; Su, N.; Zhang, K.; Zhu, S.; Zhu, Z.; Qin, W.; Yang, Y.; Shi, Y.; Fan, S.; Wang, Z.; et al. Effect of fiber surface treatment on structure, moisture absorption and mechanical properties of luffa sponge fiber bundles. Ind. Crop. Prod. 2018, 123, 341–352. [Google Scholar] [CrossRef]
  6. Zhuang, S.; Wang, Q.; Zhang, M. Water absorption behaviour of concrete: Novel experimental findings and model characterization. J. Build. Eng. 2022, 53, 104602. [Google Scholar] [CrossRef]
  7. Golewski, G.L. Assessing of water absorption on concrete composites containing fly ash up to 30% in regards to structures completely immersed in water. Case Stud. Constr. Mater. 2023, 19, e02337. [Google Scholar] [CrossRef]
  8. De Brabandere, L.; Alderete, N.M.; De Belie, N. Capillary imbibition in cementitious materials: Effect of salts and exposure condition. Materials 2022, 15, 1569. [Google Scholar] [CrossRef]
  9. Fabbri, A.; Soudani, L.; McGregor, F.; Morel, J.C. Analysis of the water absorption test to assess the intrinsic permeability of earthen materials. Constr. Build. Mater. 2019, 199, 154–162. [Google Scholar] [CrossRef]
  10. Hall, M.; Djerbib, Y. Moisture ingress in rammed earth: Part 1—The effect of soil particle-size distribution on the rate of capillary suction. Constr. Build. Mater. 2004, 18, 269–280. [Google Scholar] [CrossRef]
  11. Lu, L.; Yang, Z.; Lin, Y.; Dong, S. Partial replacement of manufactured sand with homologous granite powder in mortar: The effect on porosity and capillary water absorption. Constr. Build. Mater. 2023, 376, 131031. [Google Scholar] [CrossRef]
  12. Zhang, Y.; Zhang, Y.; Yang, L.; Liu, G.; Du, H. Influence of the pore feature on the water uptake in 3D printed concrete. Mater. Lett. 2023, 333, 133642. [Google Scholar] [CrossRef]
  13. Zhao, H.; Wu, X.; Huang, Y.; Zhang, P.; Tian, Q.; Liu, J. Investigation of moisture transport in cement-based materials using low-field nuclear magnetic resonance imaging. J. Build. Eng. 2021, 73, 252–270. [Google Scholar] [CrossRef]
  14. Zhao, H.; Ding, J.; Huang, Y.; Xu, G.; Li, W.; Zhang, S.; Wang, P. Investigation on sorptivity and capillarity coefficient of mortar and their relationship based on microstructure. Constr. Build. Mater. 2020, 265, 120332. [Google Scholar] [CrossRef]
  15. Yang, L.; Zhang, Y.; Liu, Z.; Zhao, P.; Liu, C. In-situ tracking of water transport in cement paste using X-ray computed tomography combined with CsCl enhancing. Mater. Lett. 2015, 160, 381–383. [Google Scholar] [CrossRef]
  16. Zeng, Q.; Wang, X.; Yang, R.; Jike, N.; Peng, Y.; Wang, J.; Tian, Y.; Zhou, C.; Ruan, S.; Yan, D. Transmission micro-focus X-ray radiographic measurements towards in-situ tracing capillary imbibition fronts and paths in ultra-thin concrete slices. Measurement 2021, 175, 109141. [Google Scholar] [CrossRef]
  17. Zheng, F.; Hong, S.; Hou, D.; Dong, B.; Kong, Z.; Jiang, R. Rapid visualization and quantification of water penetration into cement paste through cracks with X-ray imaging. Cem. Concr. Compos. 2022, 125, 104293. [Google Scholar] [CrossRef]
  18. Han, G.; Yang, X.; Shen, L.; Li, L.; Liu, X.; Zhang, C.; Wang, M.; Dong, J.; Zuo, X.; Cui, D. Tomography-based investigation on the early-time capillary imbibition in stained foam concrete. Constr. Build. Mater. 2023, 79, 107884. [Google Scholar] [CrossRef]
  19. Zhang, Y.; Qiao, H.; Qian, R.; Xue, C.; Feng, Q.; Su, L.; Zhang, Y.; Liu, G.; Du, H. Relationship between water transport behaviour and interlayer voids of 3D printed concrete. Constr. Build. Mater. 2022, 326, 126731. [Google Scholar] [CrossRef]
  20. Van Der Putten, J.; Azima, M.; Van den Heede, P.; Van Mullem, T.; Snoeck, D.; Carminati, C.; Hovind, J.; Trtik, P.; De Schutter, G.; Van Tittelboom, K. Neutron radiography to study the water ingress via the interlayer of 3D printed cementitious materials for continuous layering. Constr. Build. Mater. 2020, 258, 119587. [Google Scholar] [CrossRef]
  21. Schröfl, C.; Nerella, V.N.; Mechtcherine, V. Capillary water intake by 3D-printed concrete visualised and quantified by neutron radiography. In First RILEM International Conference on Concrete and Digital Fabrication–Digital Concrete 2018; Springer International Publishing: Berlin/Heidelberg, Germany, 2019; pp. 217–224. [Google Scholar]
  22. EN 197-1; EN 197-1 Cement Part 1: Composition, Specifications and Conformity Criteria for Common Cements. British Standard Institution: London, UK, 2012.
  23. Zhang, Y.; Zhang, Y.; Yang, L.; Liu, G.; Du, H. Evaluation of aggregates, fibers and voids distribution in 3D printed concrete. J. Sustain. Cem. Mater. 2023, 12, 775–788. [Google Scholar] [CrossRef]
  24. Yang, L.; Gao, D.; Zhang, Y.; Tang, J.; Li, Y. Relationship between sorptivity and capillary coefficient for water absorption of cement-based materials: Theory analysis and experiment. R. Soc. Open Sci. 2019, 6, 190112. [Google Scholar] [CrossRef] [PubMed]
  25. Dong, D.; Sun, W.; Banthia, N. Use of tomography to understand the influence of preconditioning on carbonation tests in cement-based materials. Cem. Concr. Compos. 2018, 88, 52–63. [Google Scholar]
  26. Cui, D.; Banthia, N.; Wang, Q.; Sun, W. Investigation on porosity of partly carbonated paste specimens blended with fly ash through dual CT scans. Constr. Build. Mater. 2019, 196, 692–702. [Google Scholar] [CrossRef]
  27. GB/T 50081-2019; Chinese Standard, Standard for Test Methods of Concrete Physical and Mechanical Properties. Ministry of Housing and Urban-Rural Development of the People’s Republic of China: Beijing, China, 2019.
  28. Zhang, Y.; Yang, L.; Qian, R.; Liu, G.; Zhang, Y.; Du, H. Interlayer adhesion of 3D printed concrete: Influence of layer stacked vertically. Constr. Build. Mater. 2023, 399, 132424. [Google Scholar] [CrossRef]
  29. Moelich, G.M.; Kruger, P.J.; Combrinck, R. The effect of restrained early age shrinkage on the interlayer bond and durability of 3D printed concrete. Constr. Build. Mater. 2021, 43, 102857. [Google Scholar] [CrossRef]
  30. Han, X.; Yan, J.; Chen, T.; Tang, B.; Lin, Y. Plastic shrinkage of 3D printed concrete under different self-weight of upper layers. Constr. Build. Mater. 2023, 399, 132564. [Google Scholar] [CrossRef]
  31. Georget, F.; Soja, W.; Scrivener, K.L. Characteristic lengths of the carbonation front in naturally carbonated cement pastes: Implications for reactive transport models. Cem. Concr. Res. 2020, 134, 106080. [Google Scholar] [CrossRef]
  32. Wolfs, R.J.M.; Bos, F.P.; Salet, T.A.M. Hardened properties of 3D printed concrete: The influence of process parameters on interlayer adhesion. Cem. Concr. Res. 2019, 119, 132–140. [Google Scholar] [CrossRef]
  33. Pan, T.; Jiang, Y.; He, H.; Wang, Y.; Yin, K. Effect of structural build-up on interlayer bond strength of 3D printed cement mortars. Materials 2021, 14, 236. [Google Scholar] [CrossRef]
  34. Xu, Y.; Yuan, Q.; Li, Z.; Shi, C.; Wu, Q.; Huang, Y. Correlation of interlayer properties and rheological behaviors of 3DPC with various printing time intervals. Addit. Manuf. 2021, 47, 102327. [Google Scholar] [CrossRef]
  35. Nerella, V.N.; Hempel, S.; Mechtcherine, V. Effects of layer-interface properties on mechanical performance of concrete elements produced by extrusion-based 3D-printing. Constr. Build. Mater. 2019, 205, 586–601. [Google Scholar] [CrossRef]
  36. Lyu, Z.; Guo, Y.; Chen, Z.; Shen, A.; Qin, X.; Yang, J.; Zhao, M.; Wang, Z. Research on shrinkage development and fracture properties of internal curing pavement concrete based on humidity compensation. Constr. Build. Mater. 2019, 203, 417–431. [Google Scholar] [CrossRef]
  37. Al Saffar, D.M.; Al Saad, A.J.; Tayeh, B.A. Effect of internal curing on behavior of high performance concrete: An overview. Case Stud. Constr. Mater. 2019, 10, e00229. [Google Scholar] [CrossRef]
  38. Shi, Y.; Jia, L.; Jia, Z.; Ma, L.; Zhang, Z.; Xia, K.; Chen, Y.; Zhang, Y. Early-age inhomogeneous deformation of 3D printed concrete: Characteristics and influences of superplasticizer and water-binder ratio. J. Build. Eng. 2024, 86, 108956. [Google Scholar] [CrossRef]
  39. Yang, L.; Liu, G.; Gao, D.; Zhang, C. Experimental study on water absorption of unsaturated concrete: w/c ratio, coarse aggregate and saturation degree. Constr. Build. Mater. 2021, 272, 121945. [Google Scholar] [CrossRef]
  40. Bian, P.; Zhan, B.; Gao, P.; Yu, Q.; Yang, Y.; Hong, L.; Zhang, W. Investigation on the electromagnetic wave absorption properties of foamed cement-based materials. Constr. Build. Mater. 2023, 364, 129903. [Google Scholar] [CrossRef]
  41. Bai, Y.H.; Xie, B.; Li, H.; Tian, R.; Zhang, Q.H. Mechanical properties and electromagnetic absorption characteristics of foam Cement-based absorbing materials. Constr. Build. Mater. 2022, 330, 127221. [Google Scholar] [CrossRef]
  42. Yang, Y.; Shi, X.; Zhou, Q.; Deng, G.; Li, W.; Li, C.; Yang, T.; Yin, L. Structural design and electromagnetic wave absorbing performance optimization of lightweight foam cement-based metamaterials. Constr. Build. Mater. 2024, 438, 137191. [Google Scholar] [CrossRef]
  43. Boddepalli, U.; Gandhi, I.S.R.; Panda, B. Synergistic effect of fly ash and polyvinyl alcohol fibers in improving stability, rheology, and mechanical properties of 3D printable foam concrete. Constr. Build. Mater. 2024, 429, 136464. [Google Scholar] [CrossRef]
  44. Cho, S.; Van Rooyen, A.; Kearsley, E.; Van Zijl, G. Foam stability of 3D printable foamed concrete. J. Build. Eng. 2022, 47, 103884. [Google Scholar] [CrossRef]
  45. Pasupathy, K.; Ramakrishnan, S.; Sanjayan, J. Enhancing the properties of foam concrete 3D printing using porous aggregates. Cem. Concr. Compos. 2022, 133, 104687. [Google Scholar] [CrossRef]
  46. Van Der Putten, J.; De Volder, M.; Van den Heede, P.; Deprez, M.; Cnudde, V.; De Schutter, G.; Van Tittelboom, K. Transport properties of 3D printed cementitious materials with prolonged time gap between successive layers. Cem. Concr. Res. 2022, 155, 106777. [Google Scholar] [CrossRef]
  47. Huang, X.; Yang, W.; Song, F.; Zou, J. Study on the mechanical properties of 3D printing concrete layers and the mechanism of influence of printing parameters. Constr. Build. Mater. 2022, 335, 127496. [Google Scholar] [CrossRef]
Figure 1. (a) Desktop-level 3D printing machine; (b) Printing nozzle; (c) 3DPFC specimen; (d) Cutting schematic.
Sustainability 16 07841 g001
Figure 2. (a) X-oriented; (b) Y-oriented; (c) Z-oriented specimen (9 min).
Sustainability 16 07841 g002
Figure 3. Imbibition test sample placement scheme.
Sustainability 16 07841 g003
Figure 4. Schematic diagram of X-ray imaging: (a) X-ray imaging device in the CT cavity; (b) X-ray imaging results.
Sustainability 16 07841 g004
Figure 5. X-ray subtraction image of 3DPFC specimen (21 min): (a) The X-ray image at 0 h; (b) The X-ray image at 24 h; (c) The X-ray subtraction image.
Sustainability 16 07841 g005
Figure 6. Schematic of the X-oriented, Y-oriented, and Z-oriented 3DPFCs highlighting horizontal and vertical interlayers: (a) The X-oriented 3DPFC; (b) The Y-oriented 3DPFC; (c) The Z-oriented 3DPFC.
Sustainability 16 07841 g006
Figure 7. 2D water distribution within the saturation verge of X-oriented 3DPFC, observed at (a) 10 min; (b) 30 min; (c) 60 min; and (d) 90 min post-imbibition.
Sustainability 16 07841 g007
Figure 8. 2D water distribution within the saturation verge of Y-oriented 3DPFC, captured at (a) 10 min; (b) 30 min; (c) 60 min; and (d) 90 min post-imbibition.
Sustainability 16 07841 g008
Figure 9. 2D water distribution within the saturation verge of Z-oriented 3DPFC, observed at (a) 10 min; (b) 30 min; (c) 60 min; and (d) 90 min post-imbibition.
Sustainability 16 07841 g009
Figure 10. Sequential 2D representations of moisture progression in the unsaturated transport zone of X-oriented 3DPFC, captured at intervals between (a) 30–10 min; (b) 60–30 min; and (c) 90–30 min post-imbibition.
Sustainability 16 07841 g010
Figure 11. Progressive 2D visualizations of moisture movements in the unsaturated transport domain for Y-oriented 3DPFC, recorded at intervals between (a) 30–10 min; (b) 60–30 min; and (c) 90–30 min after the commencement of imbibition.
Sustainability 16 07841 g011
Figure 12. 3D renderings of the imbibition front in X-oriented 3DPFC, recorded at intervals between (a) 30–10 min; (b) 60–30 min; and (c) 90–30 min after the commencement of imbibition.
Sustainability 16 07841 g012
Figure 13. 3D renderings of the imbibition front in Y-oriented 3DPFC, recorded at intervals between (a) 30–10 min; (b) 60–30 min; and (c) 90–30 min after the commencement of imbibition.
Sustainability 16 07841 g013
Figure 14. Absorption and subtraction images of top layer specimens at different printing intervals: (a) 3 min, (b) 6 min, (c) 9 min, (d) 15 min, (e) 21 min, and (f) 30 min.
Sustainability 16 07841 g014
Figure 15. Water content curves of the top specimen at 3 min printing intervals: (a) Absorption and subtraction image of top layer specimens; (a1) Water content curve of A1−A1’; (a2) Water content curve of A2−A2’; (a3) Water content curve of A3−A3’.
Sustainability 16 07841 g015
Figure 16. Water content curves of the top specimen at 6 min printing intervals: (a) Absorption and subtraction image of top layer specimens; (a1) Water content curve of B1−B1’; (a2) Water content curve of B2−B2’; (a3) Water content curve of B3−B3’.
Sustainability 16 07841 g016
Figure 17. Water content curves of the top specimen at 9 min printing intervals: (a) Absorption and subtraction image of top layer specimens; (a1) Water content curve of C1−C1’; (a2) Water content curve of C2−C2’; (a3) Water content curve of C3−C3’.
Sustainability 16 07841 g017
Figure 18. Water content curves of the top specimen at 21 min printing intervals: (a) Absorption and subtraction image of top layer specimens; (a1) Water content curve of D1−D1’; (a2) Water content curve of D2−D2’; (a3) Water content curve of D3−D3’.
Sustainability 16 07841 g018
Figure 19. (a) Plot of top 3DPFC imbibition height vs. time for different printing interval times. (b) Linear fit of top 3DPFC imbibition height versus time. (c) 1D imbibition of top 3DPFC.
Sustainability 16 07841 g019
Figure 20. Schematic representation of the effect of printing interval on 3DPFC.
Sustainability 16 07841 g020
Table 1. Mixing ratio design of 3DPFC.
W/CConstituent/kg.m−3 Design Density/kg/m3
OPCFAW PBSP
0.334881122000.65800
Table 2. Chemical composition of OPC and FA (wt%).
MaterialsCaOSiO2Al2O3Fe2O3MgOSO3K2ONa2OTiO2
OPC63.2619.454.402.731.282.960.590.130.26
FA7.6248.328.77.201.290.951.470.861.46
Table 3. Split tensile strength statistics of specimens with different printing interval times.
Printing interval times/min369152130
Splitting tensile strength/MPa0.861.251.131.470.730.56
Disclaimer/Publisher’s Note: The statements, opinions and data contained in all publications are solely those of the individual author(s) and contributor(s) and not of MDPI and/or the editor(s). MDPI and/or the editor(s) disclaim responsibility for any injury to people or property resulting from any ideas, methods, instructions or products referred to in the content.

