Article

Optimal Hybrid Renewable Energy System to Accelerate a Sustainable Energy Transition in Johor, Malaysia

by
Pei Juan Yew
1,
Deepak Chaulagain
2,
Noel Ngando Same
2,
Jaebum Park
2,
Jeong-Ok Lim
3 and
Jeung-Soo Huh
1,2,*
1
Department of Energy Convergence and Climate Change, Kyungpook National University, Buk-gu, Daegu 41566, Republic of Korea
2
Department of Convergence and Fusion System Engineering, Kyungpook National University, Sangju 37224, Republic of Korea
3
Regional Leading Research Center for Net-Zero Carbon Smart Energy System, Kyungpook National University, Sangju 37224, Republic of Korea
*
Author to whom correspondence should be addressed.
Sustainability 2024, 16(17), 7856; https://doi.org/10.3390/su16177856
Submission received: 2 August 2024 / Revised: 29 August 2024 / Accepted: 7 September 2024 / Published: 9 September 2024

Abstract

:
As the world’s second-largest palm oil producer, Malaysia heavily depends on its extensive oil palm cultivation, which accounts for nearly 90% of the country’s lignocellulosic biomass waste. Approximately 20–22 tonnes of empty fruit bunches (EFBs) can be derived from an initial yield of 100 tonnes of fresh fruit bunches (FFBs) from oil palm trees. The average annual amount of EFBs produced in Johor is 3233 tonnes per day. Recognising that urban areas contribute significantly to anthropogenic greenhouse gas emissions, and to support Malaysia’s transition from fossil fuel-based energy to a low-carbon energy system, this research employed HOMER Pro software 3.18.3 to develop an optimal hybrid renewable energy system integrating solar and biomass (EFB) energy sources in Johor, Malaysia. The most cost-effective system (solar–biomass) consists of 4075 kW solar photovoltaics, a 2100 kW biomass gasifier, 9363 battery units and 1939 kW converters. This configuration results in a total net present cost (NPC) of USD 44,596,990 and a levelised cost of energy (LCOE) of USD 0.2364/kWh. This system satisfies the residential load demand via 6,020,427 kWh (64.7%) of solar-based and 3,286,257 kWh (35.3%) of biomass-based electricity production, with an annual surplus of 2,613,329 kWh (28.1%). The minimal percentages of unmet electric load and capacity shortage, both <0.1%, indicate that all systems can meet the power demand. In conclusion, this research provides valuable insights into the economic viability and technical feasibility of powering the Kulai district with a solar–biomass system.

1. Introduction

The transition towards renewable energy sources represents a pivotal element in global efforts to achieve sustainable energy systems. This shift is crucial for countries such as Malaysia, which face the dual challenge of ensuring continuous energy supply and mitigating the environmental impacts associated with traditional fossil fuels. The country’s rich endowment in solar, biomass, hydro and other renewable sources provides a robust foundation for diversifying its energy mix, reducing greenhouse gas (GHG) emissions and securing long-term energy supply. The necessity for Malaysia to transition towards renewable energy sources is emphasised by various factors. Rapid industrial growth, demographic changes and increased energy consumption have exerted considerable pressure on Malaysia’s traditional energy sources [1].
Amidst rapid industrialisation and escalating environmental concerns, Malaysia’s strategic pivot from traditional fossil fuels to renewable energy sources heralds a new era of energy policy and business model innovation. Notable strategies include the introduction of the Fifth Fuel Policy (5FP2000) in 2000, which recognised renewable energy as the fifth element within the framework of the Eighth Malaysia Plan, placing greater focus on sustainability and efficiency in the development of energy resources [2]. Additionally, the initiation of the Small Renewable Energy Power (SREP) programme in May 2001 sought to promote the production of renewable energy through small power generation units, facilitating the sale of this energy to utility companies [1,3]. Furthermore, the launch of the Malaysia Building Integrated Photovoltaics (MBIPV) programme in 2005 served as a significant impetus for the expansion of the solar photovoltaic (PV) industry within the nation [4]. Moreover, the passage of the Renewable Energy Act 2011 was a pivotal measure aimed at bolstering renewable energy generation through the establishment of a specialised tariff system [5]. This transition is not merely an environmental imperative but a socio-economic strategy to enhance energy security, foster economic resilience and mitigate climate change impacts.
In 2019, Malaysia’s cumulative capacity for power production reached 36.2 GW, primarily fuelled by coal and natural gas, with renewable sources contributing to 22% of the overall capacity [6]. This combination emphasises Malaysia’s dependence on conventional energy sources and indicates a significant transition towards more environmentally friendly alternatives. By 2021, Malaysia had achieved approximately 8.9 GW of renewable energy capacity, with on-grid hydropower at 6211 MW constituting 68%, solar PV at 1780 MW, solid biofuels at 774 MW and biogas systems at 120 MW [6]. This multifaceted strategy towards renewable energy highlights Malaysia’s dedication to decreasing its dependency on fossil fuels and adopting more environmentally sustainable energy alternatives. In pursuit of a greener future, Malaysia is actively working towards enhancing its renewable energy quota within the national power capacity mix. The country has set ambitious targets, aiming for an augmentation of 31% by 2025 and further increasing this share to 40% by 2035 [2]. These goals reflect Malaysia’s proactive stance in transitioning to a more sustainable energy landscape. Additionally, the National Energy Transition Roadmap (NETR) sets ambitious targets to reduce GHG emissions by 32% by 2050, compared to the 2019 baseline. Moreover, the roadmap sets a bold vision for achieving net-zero emissions by as early as 2050, a remarkable ambition given Malaysia’s relatively small contribution of only 0.8% to global GHG emissions [7]. This forward-thinking approach not only positions Malaysia as a leader in the regional energy transition but also as a responsible member of the global community committed to addressing the challenges of climate change.
Urban areas significantly contribute to anthropogenic GHG emissions, with current estimates indicating that cities account for 60–70% of these emissions [8]. These data highlight the dual function of urban areas: While they are a significant cause of exacerbating climate change through substantial GHG emissions, they are also exceptionally susceptible to climate change impacts and severe weather conditions. Considering this, adjusting the mix of energy use to favour renewables is a crucial approach to curbing city carbon outputs [9]. Notably, one of the primary tactics for evolving into a low-carbon city is to concentrate on integrating renewable energy within cities. This strategy is characterised by using locally produced, distributed energy from non-fossil sources, highlighting the potential for urban areas to significantly mitigate their environmental impact [8]. Furthermore, the establishment of Iskandar Malaysia in 2006 is a pioneering example of how economic areas within urban regions can play a crucial role in the transition to sustainability. Located within Johor, Iskandar Malaysia was envisioned to drive the Malaysian economy’s expansion as a key development corridor [10]. Its significance extends beyond economic growth, as Iskandar Malaysia holds promise in aiding Johor City to address multiple sustainability challenges. This initiative illustrates the potential for urban regions to realise a low-carbon society, offering a blueprint for other cities to follow in the pursuit of sustainable development and climate change mitigation.
In the context of contemporary environmental challenges, leveraging renewable and alternative energy sources, such as biomass, has emerged as an effective approach to reducing GHG emissions. As the world’s second-leading palm oil producer, Malaysia relies on its extensive oil palm cultivation, which covers approximately 5.4 million hectares and generates nearly 90% of the country’s lignocellulosic biomass waste [11]. This significant advancement in utilising biomass waste highlights the promising prospects for generating energy from such resources. Notably, various by-products can be derived from an initial quantity of 100 tonnes of fresh fruit bunches (FFBs) produced by oil palm plants. These by-products include approximately five tonnes of shell, 20–22 tonnes of empty fruit bunches (EFBs) and about 14 tonnes of oil-enriched fibres, with the remainder being palm oil mill effluent (POME) [11,12,13]. This distribution of by-products highlights the richness of the resource base for biomass energy production in Malaysia. Palm biomass has substantial potential to generate renewable energy, with the capability to produce an estimated 5000 MW of electricity at an operational efficiency of 40%, thereby fulfilling approximately 34% of the country’s electricity requirements and potentially reducing the global warming potential (GWP) by as much as 23 million tonnes of CO2 equivalent [14,15]. Furthermore, according to a study by the International Renewable Energy Agency (IRENA), it is theoretically possible for Malaysia to annually derive 17 million tonnes of biomethane, equivalent to 424 million tonnes of CO2 emissions, from palm biomass [16]. The implications of such findings are profound, not only for Malaysia’s energy strategy but also for global efforts to combat climate change through sustainable energy sources. This convergence of economic opportunity and environmental stewardship exemplifies the critical role that biomass-derived renewable energy can play in shaping a sustainable future.
Although the palm sector is subject to scrutiny for its ecological repercussions, including forest depletion, wastewater contamination, waste generation and biodiversity loss, its environmental implications are acknowledged [15,17]. Initiatives such as the Roundtable for Sustainable Palm Oil (RSPO) are undertaken to endorse sustainable methods that seek to minimise environmental degradation, conserve biodiversity and foster community development, while the Malaysian Sustainable Palm Oil (MSPO) certification scheme advocates for and acknowledges sustainable cultivation practices within the palm oil industry [5,17,18]. In addition, the valorisation of biomass waste and residues as primary materials in biomass gasification promotes the principles of circular economy [3]. In Malaysia, palm biomass is a significant resource that remains largely untapped. The circular economy concept emphasises the sustainable management of resources by minimising waste and maximising resource efficiency. By examining technological and economic viability, Malaysia can effectively utilise its biomass resources to promote the growth of circular economies, thereby contributing to sustainable progress and environmental conservation.

Literature Review

Hybrid optimisation of multiple energy resources (HOMER) is predominantly employed in the assessment, design, sizing and simulation of hybrid renewable energy systems (HRESs), primarily for rural electrification. Despite the extensive application of HOMER in HRES modelling, the integration of biomass gasification, and particularly, the utilisation of palm waste resources as a viable technology within these systems, remains significantly underexplored. Building on this, Malik et al. [19] investigated the synergistic incorporation of biomass energy frameworks alongside renewable and conventional energy sources, such as solar, wind, fuel cells, micro-hydro, geothermal and diesel generators. They demonstrated that hybrid setups offer a viable, sustainable and economically efficient method for energy provision, particularly in rural areas lacking grid connectivity. The researchers determined that the combination of solar PV and biomass in the system configuration resulted in the most cost-effective mean energy cost compared to other HRESs incorporating biomass. Further expanding upon this, Ullah et al. [20] employed the HOMER software to devise an optimal strategy for integrating hybrid solar, wind, hydro and biomass energy derived from animal faeces to provide a clean electricity supply for a rural community in Pakistan. Findings from the study indicated that a combination of solar, hydro and biomass energy sources, complemented by battery storage, emerged as the most efficient off-grid system, boasting a life cycle cost of USD 10.9 million. Complementing this, in the study by Chambon et al. [21], a detailed examination of biomass gasification-powered mini-grids for rural Indian energy solutions revealed that integrating solar PV with either biomass gasification or diesel resulted in the most reliable and cost-efficient off-grid electricity. The analysis indicated that hybrid systems combining solar PV and biomass gasification enhanced operational reliability and ensured a consistent electricity supply at the most economical levelised cost of electricity (LCOE), estimated at USD 0.17 per kWh.
To further illustrate HRES versatility, Lozano et al. [22] conducted a comprehensive techno-economic assessment using the HOMER software. They evaluated two power generation configurations: a solar–diesel hybrid and a standalone solar system for the off-grid Gilutongan Island in the Philippines. Their findings indicated that the hybrid system, capable of fulfilling the island’s entire electricity requirement while leveraging an existing diesel generator, emerged as the most viable option, potentially lowering energy costs by approximately 70% to USD 0.3556 per kWh. Additionally, Li et al. [23] explored the economic feasibility of a decentralised hybrid renewable energy solution for sustainable electrification in a remote rural village in Western China, where maize straw was used as a biomass energy source. The results indicated that a hybrid system combining PV, wind, biogas-fuelled diesel generator and battery storage emerged as the optimal approach, with a cost of energy (COE) calculated at USD 0.201 per kWh. Lastly, Ribó-Pérez et al. [24] offered a robust methodology for integrating biomass gasifiers into HOMER software, detailing essential parameters and data sources for this process, and highlighted crucial factors for gasifier modelling in rural settings.
In addition, HOMER has been utilised not only for rural electrification but also for HRESs in urban electrification efforts. This broader utility is exemplified by the research conducted by Baek et al. [25], which extensively examined the most effective arrangement for generating renewable energy in Busan, South Korea. The study delineated an infrastructure composed of PV panels, wind power installations, converters and storage batteries that achieved a COE of USD 0.399 per kWh and ensured that the energy supply was entirely derived from renewable sources, tailored for a model of Busan Metropolitan City at a 1/500 scale. Further emphasising HRES versatility in urban contexts, Guelleh et al. [26] assessed the economic impact of integrating an HRES within an urban household in Djibouti. Their findings indicated that a combination of solar PV and wind energy could fulfil up to 77% of the home’s energy requirements, significantly reducing dependence on costly grid-supplied electricity and showing potential savings of 51% over exclusive grid electricity consumption, with a COE at USD 0.002 per kWh. However, the research was confined to analysing a solitary urban household, leaving the adaptability of such setups across broader communities or diverse urban topographies unexamined. Bagheri et al. [27] emphasised the critical role that economies of scale play in enhancing both the financial viability and environmental sustainability of HRES. The preferred system was identified as the medium-scale (1/250) configuration, featuring a 6.3 MW solar PV array and a 3 MW biomass gasification unit capable of processing approximately 117 tonnes of biomass waste daily, with a net present cost (NPC) of USD 116 million and COE of USD 0.300 per kWh. However, the approach applied in incorporating the characteristics of biomass gasification, including the gasification ratio and lower heating value (LHV), into the software is broadly generic, suggesting room for further refinement.
In Malaysia, the use of HOMER software has primarily focused on solar energy within renewable energy evaluations. See et al. [28] explored the techno-economic aspects of deploying a standalone hybrid energy system on Malawali Island, Malaysia. They concluded that an integrated hybrid system, combining PV panels, wind turbines, diesel generators and batteries, presented a cost-effective solution for reliable power supply at USD 0.198 per kWh, with lower emissions and justifiable initial expenses due to significant long-term operational savings. In their investigation, Lau et al. [29] utilised the HOMER simulation to analyse residential rooftop PV systems in Malaysia, discovering that a 12 kW PV system is optimal across a spectrum of electrical demands owing to its minimal NPC compared to conventional grid systems. Nevertheless, they noted that the financial return period could exceed 20 years for lower-demand scenarios, highlighting potential economic viability concerns under specific circumstances. Similarly, Laajimi and Go [30] evaluated the feasibility of combining energy storage systems (ESS) with extensive solar PV installations in Malaysia. They revealed that the most suitable battery technologies were the 1 MWh zinc bromide and lithium-ion batteries of 1 kWh and 100 kWh capacities.
Recent investigations into the techno-economic aspects of utilising palm waste in Malaysia have primarily focused on POME or palm oil sludge, with studies exploring its conversion into biochar, bioenergy, biodiesel, etc. Su et al. [31] assessed the impact of GHG emissions stemming from power and heat generation in Malaysia. They evaluated the utilisation of various palm waste components for the simultaneous production of biochar and electricity. Wee et al. [32] analysed the design process and financial viability of hydrogen production through steam methane reforming of POME in Malaysia, revealing that this approach was economically sound. The findings showed a projected payback period of 8.5 years and a return on investment of 18.48% by the 20th year. In addition, Salehmin et al. [33] conducted a thorough examination of bioenergy generation from POME, scrutinising different technologies for efficient biogas creation and enhancement and evaluating the techno-economic and environmental repercussions of generating biogas from POME. This research focused on POME because it is the most substantial waste by-product of FFB processing in the palm oil sector, noted for its significant organic content conducive to biogas production. Mahmod et al. [34] focused on the commercial prospects of a dual-phase anaerobic system for generating biohydrogen and biomethane from POME. Their findings highlighted its financial sustainability, evidenced by an 8.01-year dynamic payback period, 19.87% return on investment, 21.48% internal rate of return and net present value of approximately USD 4.6 million. Lastly, Hor et al. [35] concentrated on formulating alternative fuels to mitigate the issues stemming from diesel emissions and the dwindling supply of fossil fuels, specifically through transforming sludge palm oil (SPO) into hydrotreated vegetable oil (HVO). Through an extensive techno-economic assessment using simulation tools, it was established that the foundational scenario for converting SPO into HVO offers an attractive return on investment and a favourable payback timeframe, highlighting the financial appeal of this approach.
Drawing upon the preceding scholarly discussions, the HOMER software has been extensively employed in conceptualising HRESs for both rural and urban electrification initiatives. Nonetheless, the application of HOMER for investigating HRESs within the Malaysian context appears to be minimal. Moreover, to our knowledge, the Malaysian research landscape lacks investigations that have integrated HOMER for the techno-economic analysis of HRESs utilising palm waste as a biomass resource. This study proposes using the HOMER tool to design an ideal HRES concentrating mainly on solar and biomass energy sources in Johor, Malaysia. The primary aim is to accelerate Malaysia’s transition from fossil fuel-dependent energy sources to a low-carbon energy system by deploying HRESs. The objectives of this research are outlined as follows:
  • To provide valuable insights into the economic feasibility and technical compatibility of powering the Kulai residential district from renewable energy systems.
  • To valorise palm biomass for energy generation, thereby promoting the circular economy of the palm oil industry.
  • To demonstrate the utilisation of the HOMER tool for modelling biomass gasifiers as a potential technology in HRESs.

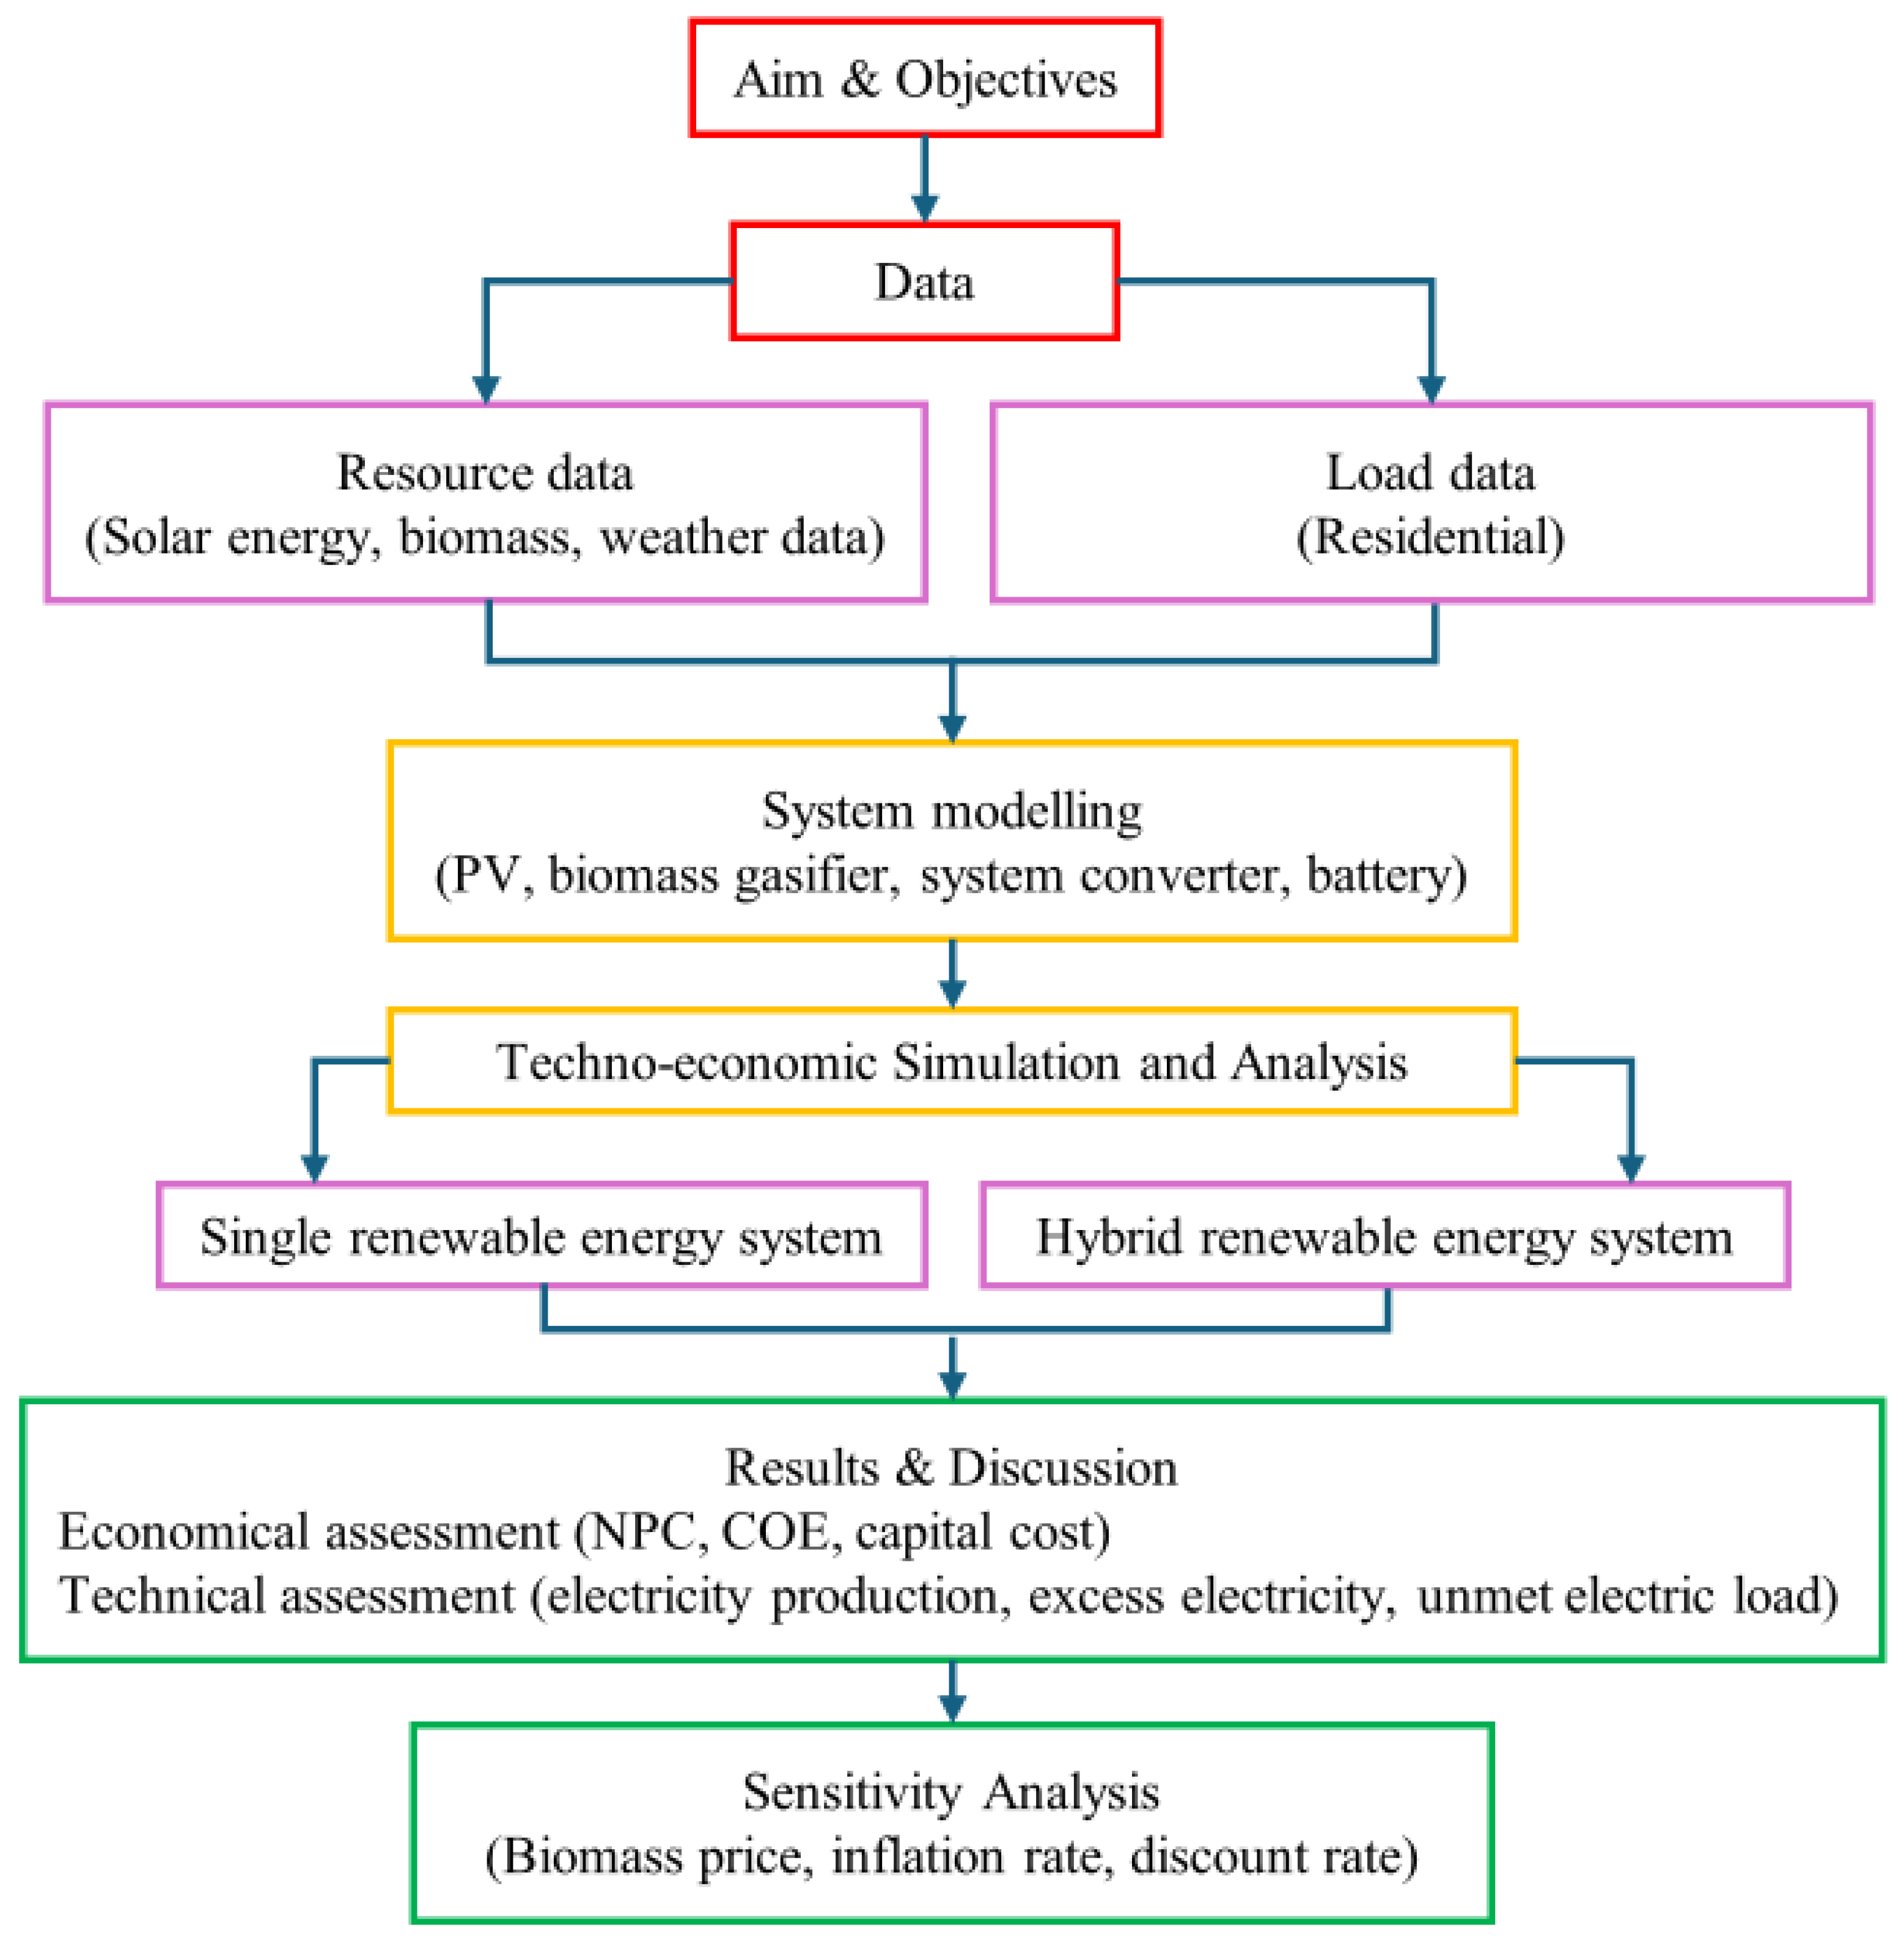
2. Materials and Methods

The general research concept of this thesis is illustrated in Figure 1. Firstly, the research aim and objectives were identified. Subsequently, pertinent resource information, including global horizontal irradiance (GHI), ambient temperatures, biomass quantity and other relevant data, were collected. Meanwhile, the residential load data were estimated based on a typical household in Kulai. The process was followed by HRES modelling. The HOMER algorithm was employed to model and optimise the performance of the hybrid energy system. Next, techno-economic analysis was performed and assessments of technical and economic aspects were conducted to compare the feasibility of the renewable energy systems. Finally, a sensitivity analysis was performed to gauge the system’s financial sensitivity against parameters that are uncertain or fluctuate over time, such as biomass prices and inflation rates.

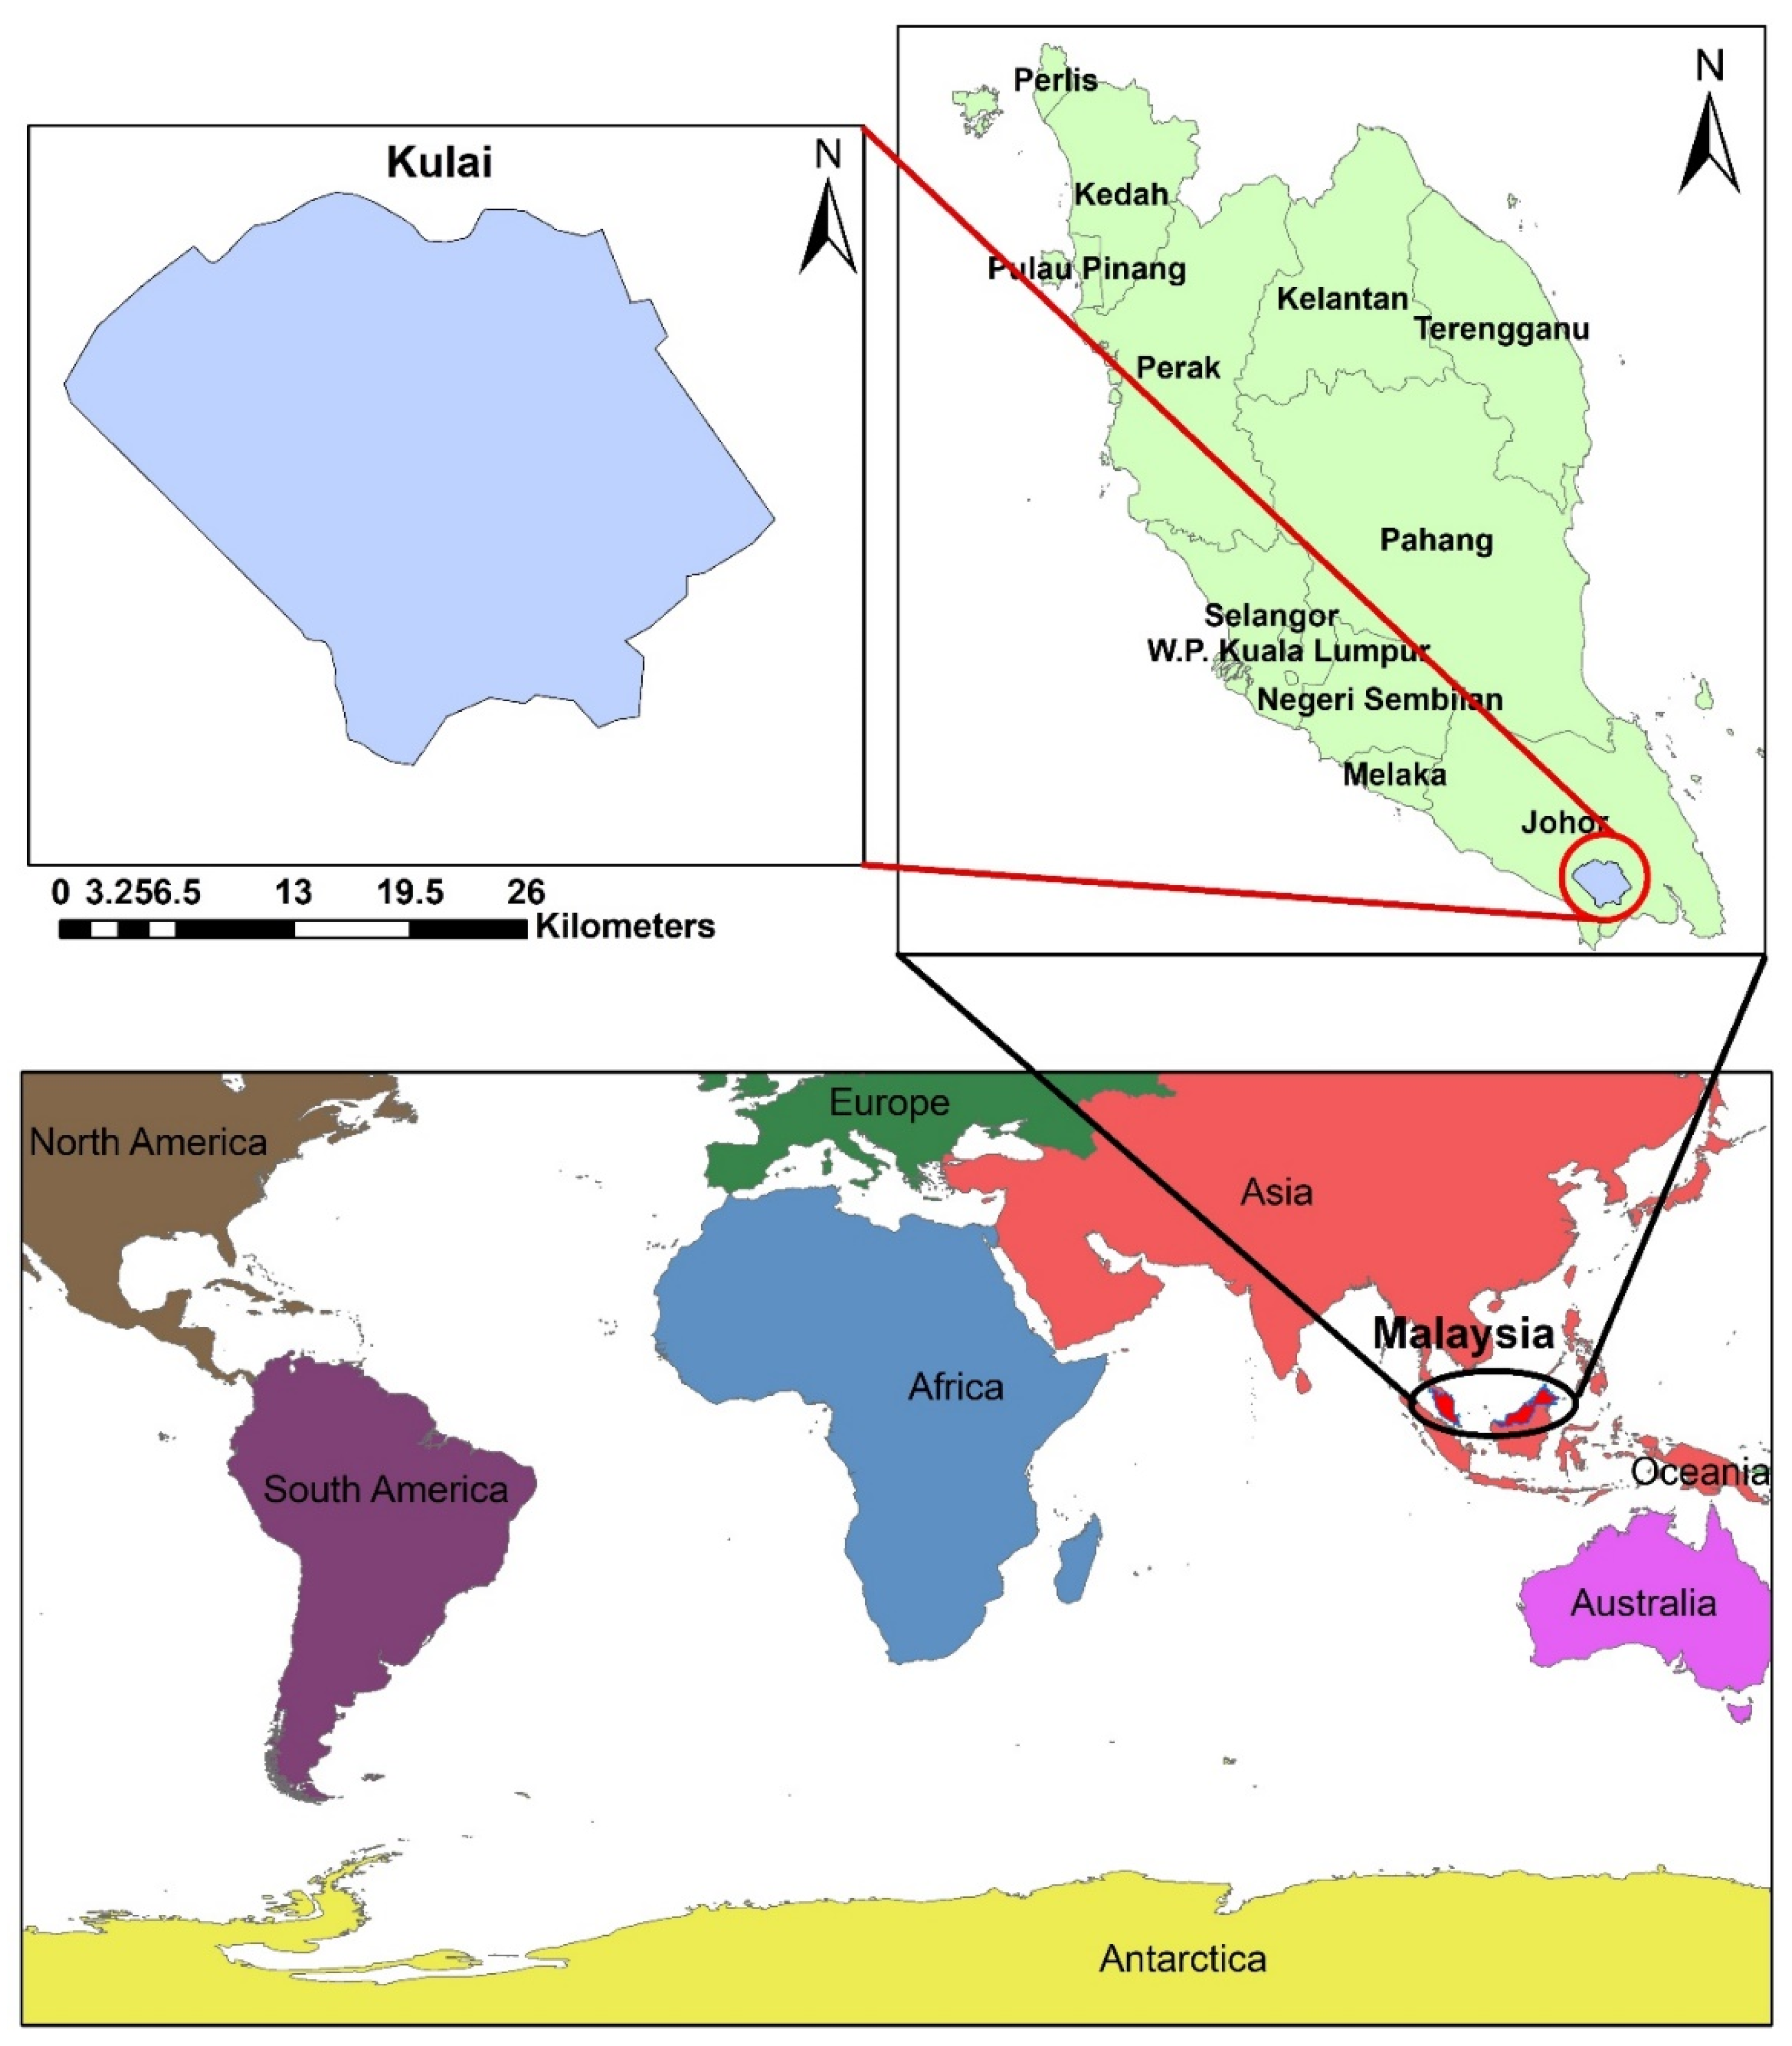
2.1. Site Description

Johor is one of the top five states in Malaysia with the most palm oil mills and a high yield of FFB. From 2020 to 2022, FFBs received by mills amounted to approximately 15 million tonnes per year [36,37]. Kulai, situated in the southern region of Peninsular Malaysia at 1°40.1′ N, 103°32.0′ E (Figure 2), is one of the five districts in Iskandar Malaysia. Based on the latest data from the Department of Statistics Malaysia in October 2023, Kulai has an estimated population of 339,600 people in 85,700 households, with an average household size of four people [38].

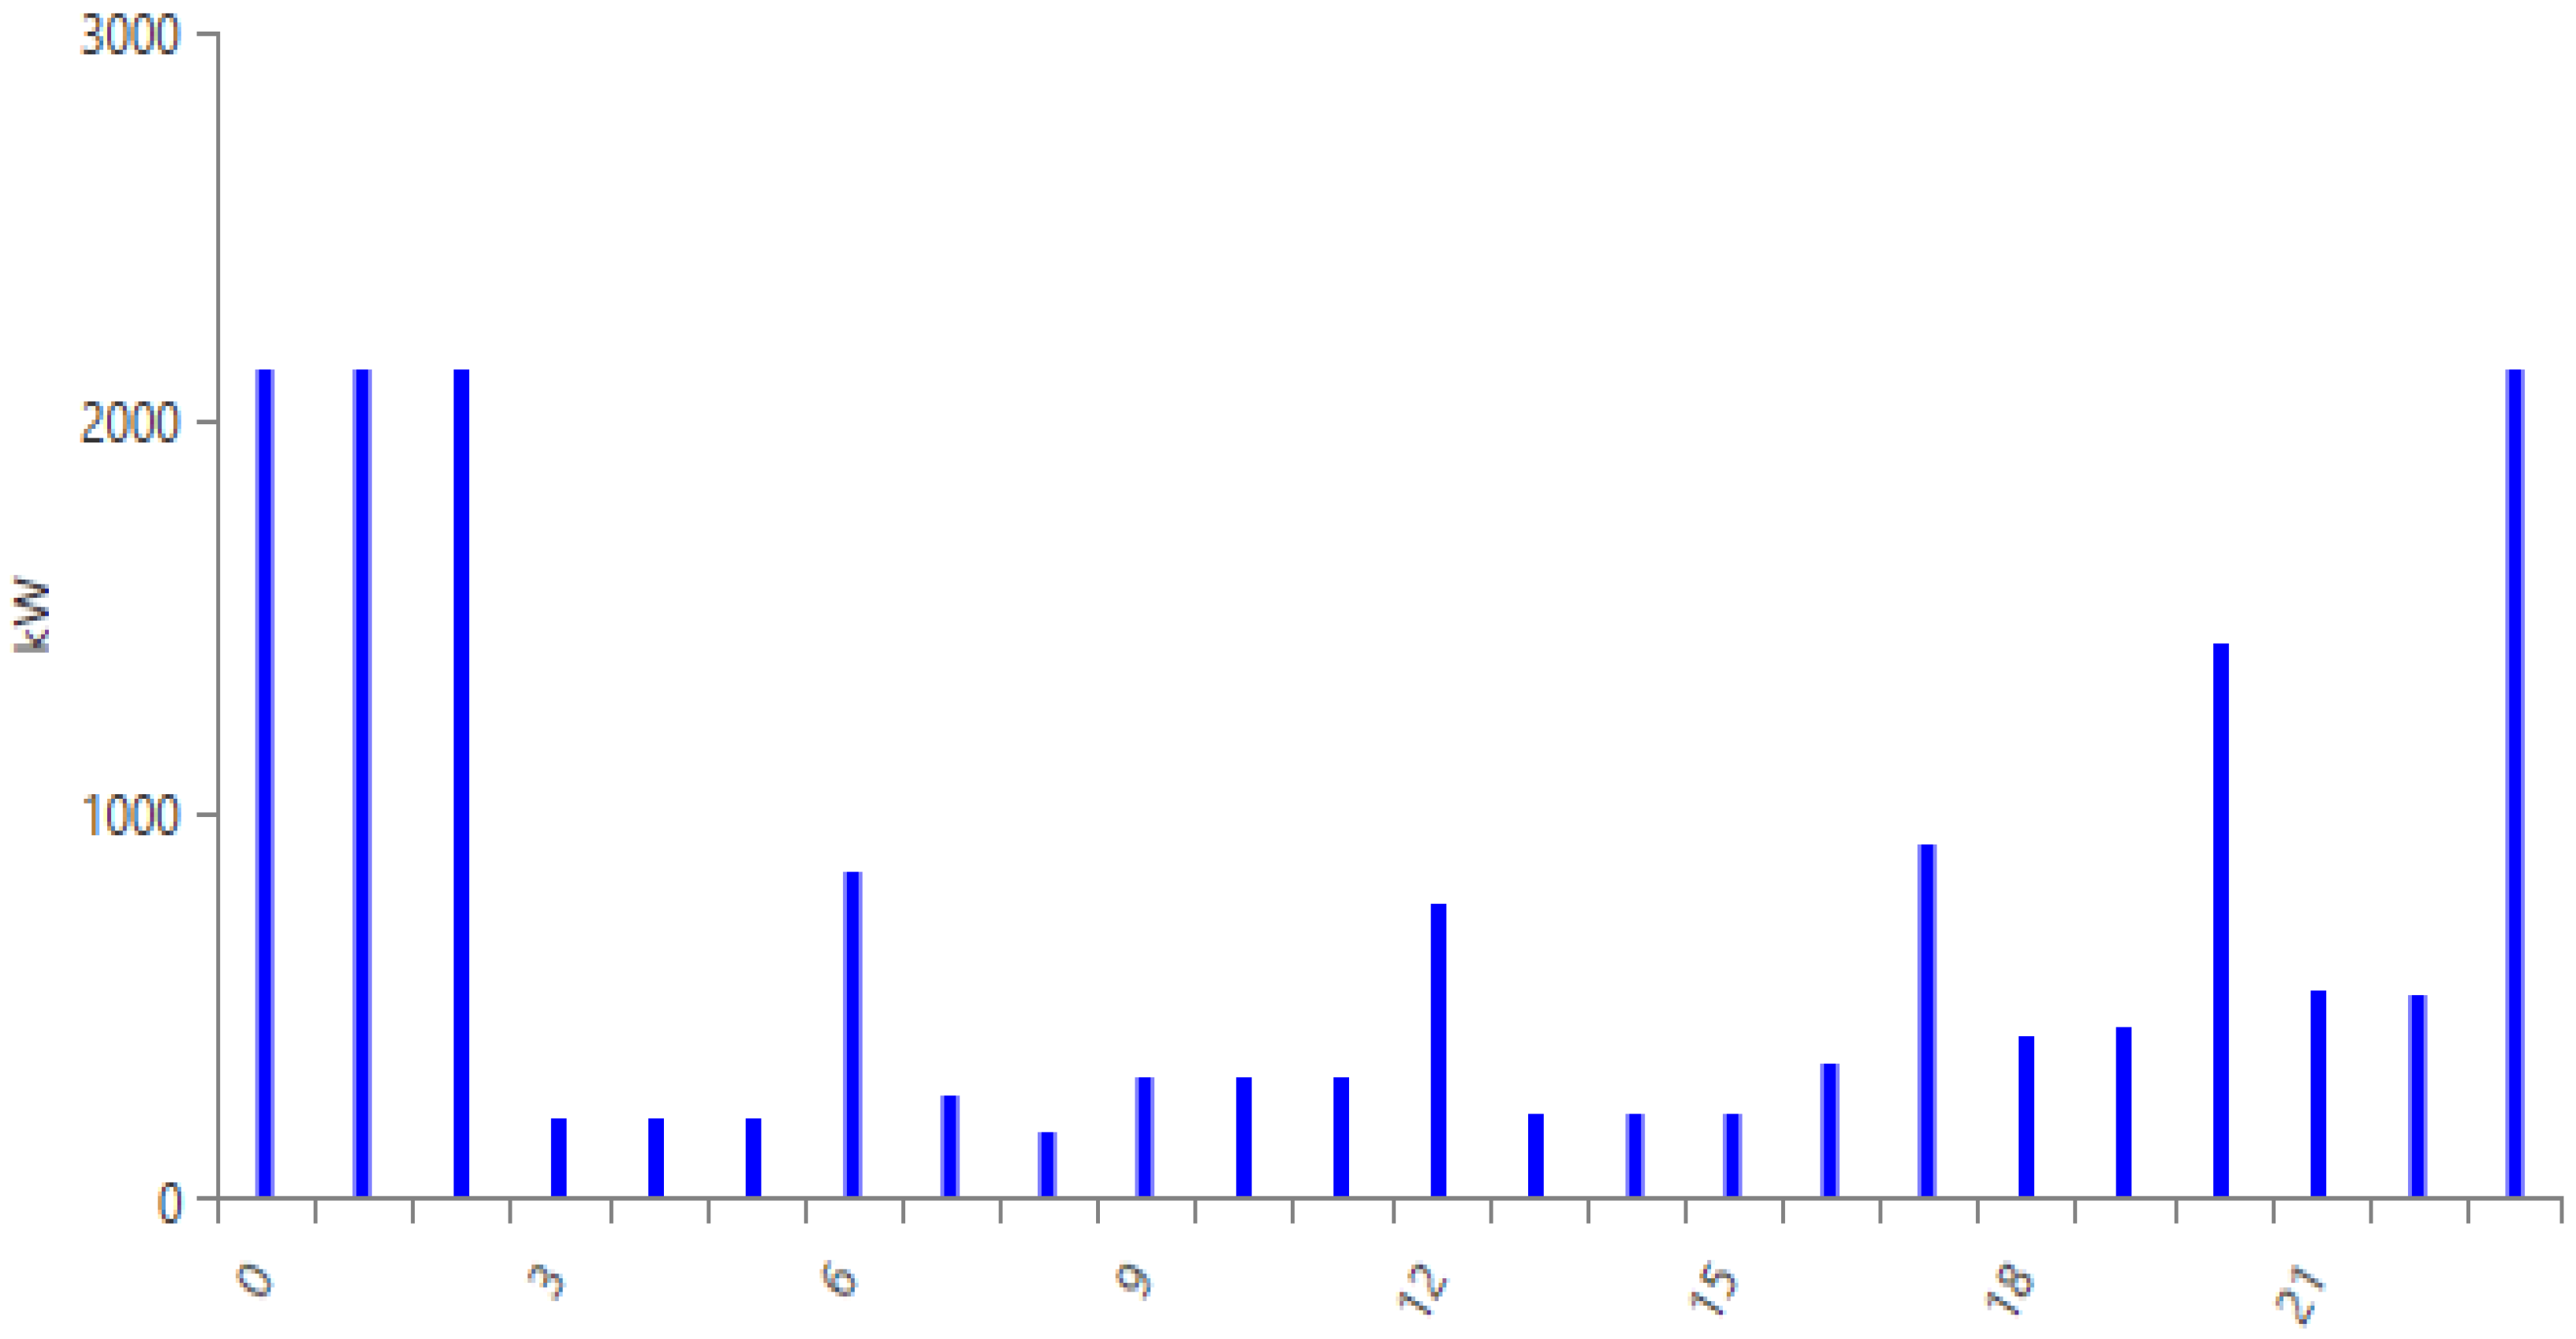
2.2. Load Profile and Resource Data

Malaysia experiences uniform temperatures, high humidity and abundant precipitation. Consequently, the residential electrical load does not fluctuate significantly due to the minimal temperature variation. Table 1 provides an approximation of the electricity usage for a typical middle-class residence in Kulai. It is assumed that a family consisting of four individuals typically includes a father who is employed, a mother who is a homemaker and two school-aged children. The estimated average daily load demand and peak power for a typical middle-class residential home are 20.35 kWh/day and 2.49 kW, respectively. With a daily load profile of approximately 20 kWh/day, it falls under the scenario of a household with medium electricity consumption [29]. As illustrated in Figure 3, four distinct time spans align with the highest electricity usage levels. The first peak at 6 a.m. indicates the start of the day for the family when they get ready for school or work. The second peak at noon may be due to the preparation of lunch meals, which require high-power appliances. The third peak observed between 5 p.m. and 9 p.m. may be attributed to household activities, such as evening washing and cooking, as well as the time when family members typically convene at home. In a hot country such as Malaysia, air conditioning is the most energy-intensive appliance. The highest demand occurs at night, from 11 p.m. to 3 a.m., for cooling purposes.
Developing a renewable energy system that can provide the entire electrical demand of a city, excluding hydropower, is not currently achievable due to the power capacity limitations of existing solar, wind and biomass technologies that are already in use commercially [27]. Alternatively, using 100% renewable energy at the neighbourhood level to provide a fraction of the city’s electrical load is a more practical option for cities. For this study, the simulation was run at a neighbourhood scale of 1/100 of the city’s electrical load, in which the scaled annual average electric load and peak power are 17,441.72 kWh/day and 2133.93 kW, respectively, with a load factor of 0.34.
The HOMER software was used to collect the meteorological data for this project. By entering the target location’s latitude and longitude, HOMER users can access integrated climatic data from NASA or the National Renewable Energy Laboratory (NREL). This dataset provides the mean monthly sun irradiance and the mean monthly ambient temperature, the two most crucial factors for solar energy. The National Solar Radiation Database from the NREL was downloaded to obtain the solar radiation for the case study location. For the site, the scaled annual average daily solar radiation produced by HOMER is 5.00 kWh/m2/day, the maximum solar radiation is 5.476 kWh/m2/day in March, and the minimum solar radiation is 4.646 kWh/m2/day in November, as displayed in Figure 4. The HOMER solar radiation measurements, obtained from satellite estimates, are realistic and fairly aligned with the 3.7–5.56 kWh/m2/day annual average solar radiation for Malaysia [4,29]. The scaled annual average temperature is 26.52 °C. Monthly mean temperature data were obtained from the NASA Prediction of Worldwide Energy Resource (POWER) database, encompassing the average monthly air temperature recorded over 30 years from January 1984 to December 2013. Based on the resource potential analysis, the average wind speed in the study area is below 3 m/s, indicating that it is unsuitable for wind energy systems. Specifically, wind speeds in this location range from 1.5 m/s to 2.5 m/s, which falls significantly short of the optimal levels required for efficient wind power generation. As a result, wind energy is not considered a viable option for this study. Table 2 shows the monthly average solar GHI, clearness index and ambient temperature in Kulai.
The availability and attributes of biomass vary depending on geographical location. A reliable, long-term supply of inexpensive and sustainably sourced feedstock is essential to the financial viability of bioelectric power plants [27]. Table 3 shows the FFBs received by mills in Johor from 2020 to 2022 [36,37]. The annual average of EFBs generated is 3233.25 tonnes per day, ranging from 2354 to 3683 tonnes per day. EFB availability was calculated based on the standard biomass to FFB extraction rate, as shown in Equations (1) and (2) [13]. After extracting fruitlets from the FFB, the remaining material, referred to as the EFB (wet basis), constitutes 22% of the FFB. Subsequently, by eliminating the water and oil content from the EFB (wet basis), a dry-weight EFB is derived, representing 35% of the EFB (wet basis) [39]. The quantity of EFBs (dry, per day) was calculated by dividing the EFBs (dry weight) by the number of days in each month.
E F B   w e t   b a s i s = F F B   a v e r a g e   2020 2022 × 22 %
E F B   d r y   w e i g h t = E F B   w e t   b a s i s × 35 %
The expenses associated with utilising biomass for electricity production generally range from USD 44 to USD 94 per tonne [24]. Salleh et al. reported that EFB pellets can be acquired from mills for an average price of RM 295.64 (approximately USD 62.5) per tonne [40]. This price encompasses expenses related to both the feedstock and logistics, such as transportation of the pellets from the mills to the studied power plant, focusing on palm oil mills within a 100 km radius of the power plant. Since the price of unprocessed EFBs is unavailable, the EFB pellet cost of USD 62.5 was assumed in this simulation.

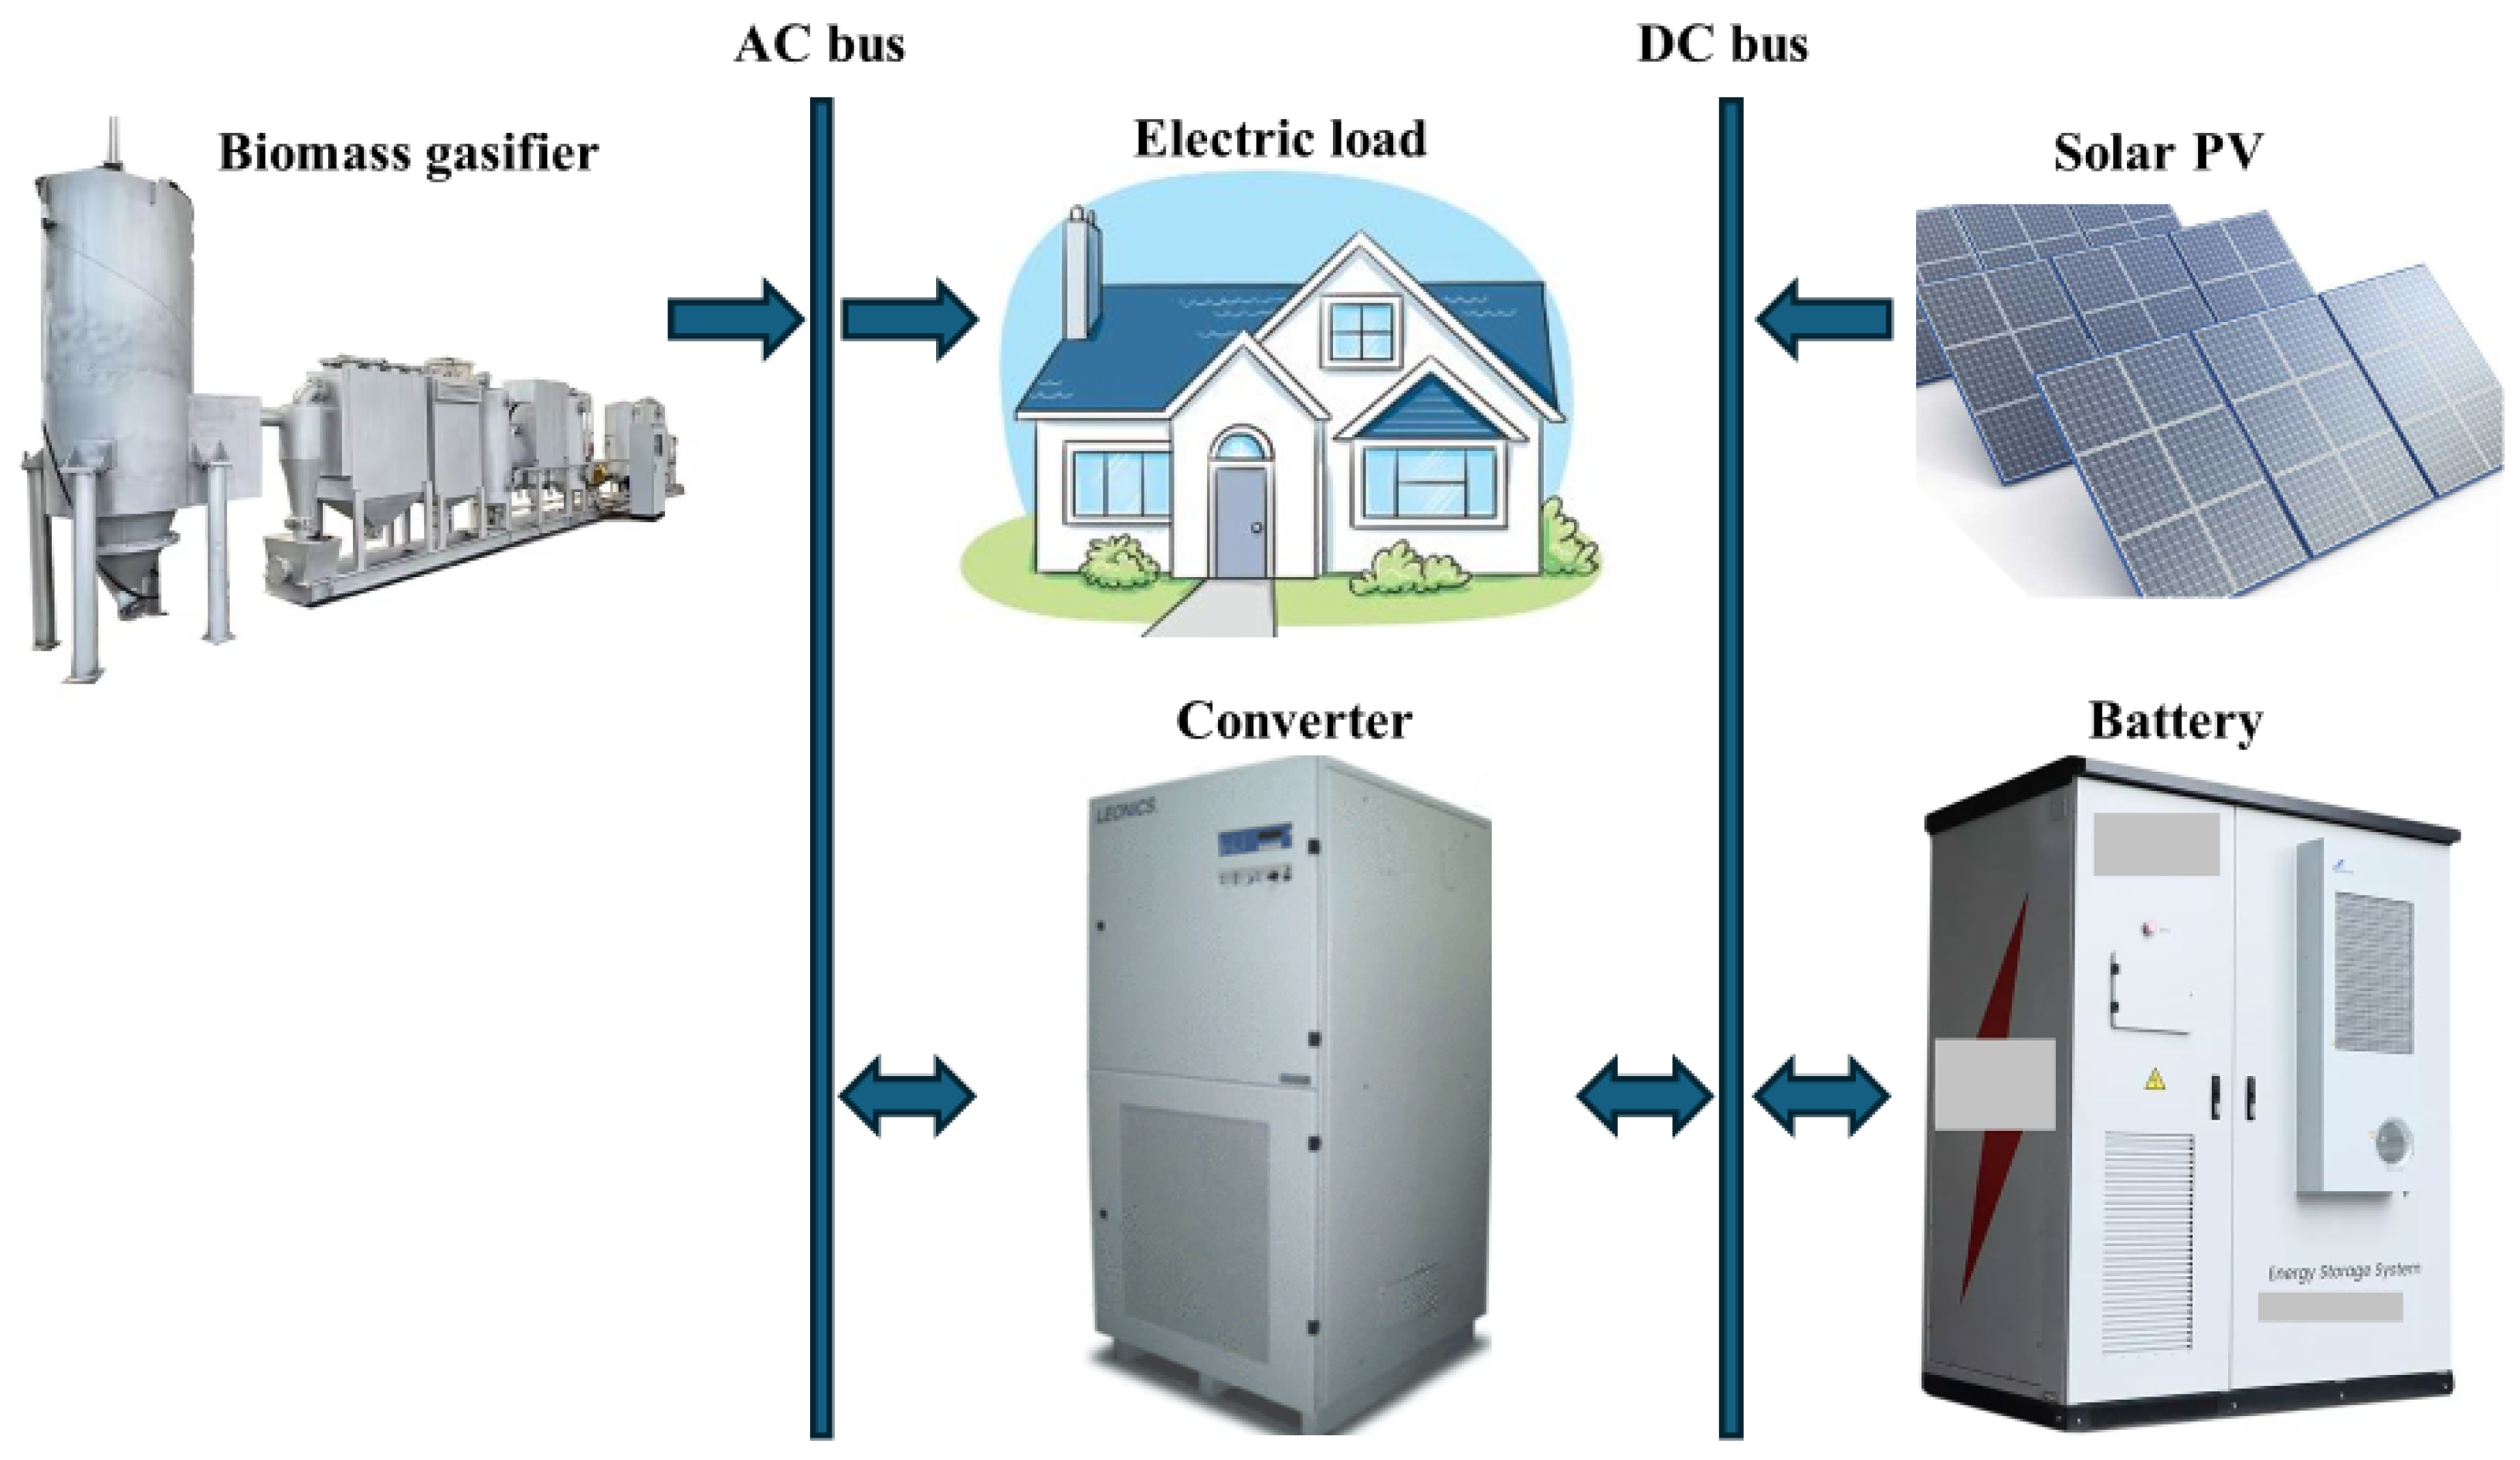
2.3. Modelling HRES Components

The HRES presented in this study comprises four major components: PV panels, a biomass gasifier, a power converter and a battery. Figure 5 shows a schematic of the elements in the hybrid system. The HOMER software was employed to conduct a simulation over 8760 h in a year, with each time step lasting 60 min. This simulation considers elements, such as resource allocation, load profiles and techno-economic variables of the model. By examining various configurations of the solar power system, biomass power system, battery storage system and converter, a viable HRES configuration scheme that satisfies the restrictions of device capacity and load deficiency rate was developed.

2.3.1. Solar Photovoltaic

PV panels generate DC electricity by converting solar radiation into electrical energy. In this study, the PV panel selected was the HIT+ VBHN340SA17 manufactured by Panasonic (Kadoma, Japan) [41]. This model was selected due to its availability in Malaysia. These panels are flat PV and are assumed to be fixed without a tracking system. The capital cost of PV panels is USD 1100 per kW, the replacement cost is USD 1100 per kW and the operation and maintenance (O&M) cost is USD 10 per kW per year [28]. This PV model has a rated capacity of 340 W, and the dimensions of the panel are 62.6 in × 41.5 in × 1.6 in. (1590 mm × 1053 mm × 40 mm). The panels are assumed to have a lifespan of 25 years, with an 85% derating factor [28]. The derating factor is a correction factor that accounts for actual working conditions, such as dust and inefficient wiring [30]. This PV model outperforms other models because of its high efficiency of 20.3%, temperature coefficient of −0.258%/°C and guaranteed power output of 90.76% after 25 years [41]. The nominal operating cell temperature is set at 47 °C [30]. The power output of the PV array is expressed by Equation (3) [9,28,42].
P P V = Y P V × f P V × R T R T , S T C × 1 + a p T C T C , S T C
where YPV represents the rated capacity of the PV array or its power output under standard test conditions, measured in kW; fPV denotes the PV derating factor, expressed as %; RT indicates the solar radiation received by the PV array during current operational conditions, measured in kW/m2; RT,STC signifies the incident radiation at standard test conditions, measured in kW/m2; aP denotes the temperature coefficient of power, measured in %/°C; TC represents the PV cell temperature during current operational conditions, measured in °C; and TC,STC indicates the PV cell temperature under standard test conditions, which is set at 25 °C [42].

2.3.2. Biomass Gasifier

Biomass can serve as a viable alternative to traditional fuels, in addition to being a carbon-neutral, sustainable and eco-friendly energy source [27]. A biomass gasifier converts carbonaceous materials, such as biomass, into syngas, primarily composed of carbon monoxide (CO) and hydrogen (H2), through a process known as gasification. This occurs at high temperatures, typically around 950 °C, in an oxygen-limited environment [14]. The resulting syngas can be used for electricity generation or as a fuel source for other applications. Various types of biomass gasifiers exist, including fixed-bed, fluidized-bed and entrained-flow gasifiers. In this study, the biomass system was modelled as a fixed-bed downdraft gasifier. Downdraft technology was selected because it is a proven technology, which is less expensive and simpler to use than other syngas generation technologies [24,43]. Furthermore, the tar content ratio is <1 g/Nm3, representing a reduction of approximately 100-fold compared to updraft gasification techniques and consequently necessitating minimal post-processing for clean-up purposes. This type of gasifier is suitable for a wide range of feedstock and power output of less than 10 MW. For every kilogram of biomass, 2–3 Nm3 of syngas is typically produced during gasification [24]. Gasification of pelletised EFB resulted in syngas production rates ranging from 1.8 to 2.5 Nm3/kg in a downdraft gasifier [44]. The overall efficiency of a biomass gasifier system depends on several factors, including feedstock type and gasifier design and manufacturer. Considering the syngas density, which ranges from 0.9 to 1.1 kg/Nm3, the gasification ratio was computed as 2.19 kg/kg [24]. Additionally, the LHV of biogas generated in a fixed-bed downdraft gasifier could range between 4 and 5 MJ/Nm3 [43]. In this study, the biogas LHV was calculated as 4.55 MJ/kg. The biomass gasifier is assumed to have a capital cost of USD 3000 per kW, replacement cost of USD 1250 per kW and O&M cost of USD 0.1 per hour for each kW [27]. The system’s lifetime is 20,000 h, and the system size is set between 0 and 8000 kW, in steps of 100 kW. The electrical efficiency is calculated using Equation (4) [9,27].
η e l c = P n e t ( I n p u t   B i o m a s s ) L H V = P o u t P a u x ( I n p u t   B i o m a s s ) L H V
where Pnet is the final electrical power a biomass system can produce; Pout is the electrical power output; Paux is the power required by some components of the system, such as compressors, pumps and blowers; and (Input Biomass)LHV represents the lower heating value of the input biomass.

2.3.3. Power Converter

The DC bus comprises a solar PV and battery system, whereas the AC bus consists of a biomass gasifier. A bi-directional converter is utilised in hybrid systems that generates both AC and DC power from distinct energy sources to transit between the two forms. A power converter functions as an inverter when transforming DC to AC, and as a rectifier when transforming AC to DC. In both the inverting and rectifying modes, converters typically have high-efficiency levels between 95% and 99%, require little maintenance, and have a long lifespan [45]. The Leonics MTP-413F 25 kW (Leonics: Bangkok, Thailand), with capital and replacement costs of USD 200 per kW and zero O&M cost, was selected for this study [28]. The inverter’s lifetime and efficiency are estimated to be 20 years and 96%, respectively, while the rectifier’s relative capacity and efficiency are set at 100% and 96%, respectively [28]. The power capacity of the converter is expressed by Equation (5) [46], with Li denoting the inductive load and Lr indicating the resistive load.
C = 3 × L i + L r

2.3.4. Battery

Since renewable resources are intermittent, an ESS is necessary to boost the resilience and reliability of the proposed renewable energy system. In this study, a 1 kWh lithium-ion battery with a nominal voltage of 6 V and a nominal capacity of 167 Ah was selected as the ESS. The battery stores excess electricity and releases it when a sudden spike in demand exceeds the supply. The initial investment amounts to USD 600, with a corresponding replacement cost of USD 600. Additionally, there is an annual O&M cost of USD 10 per unit of battery, which is projected to have a lifespan of 15 years [27]. Typically, the lower threshold for the state of charge (SOC) is set within 30–50% to mitigate the risk of over-discharge, which may have detrimental effects on the storage bank [42]. In this simulation, the minimum SOC of the batteries was set at 30%. The maximum amount of power that the battery can discharge over a certain period was determined using Equation (6) [42].
P b a t t , d m a x , k b m = k c Q m a x + k Q 1 e k t + Q k c 1 e k t 1 e k t + c k t 1 + e k t
where Q1 represents the initial energy level in the battery at the beginning of a specific time interval, measured in kWh; Q denotes the overall energy content within the battery at the commencement of the time step, also quantified in kWh; Qmax signifies the maximum storage capacity of the battery, expressed in kWh; c denotes the storage capacity ratio, which is a dimensionless parameter; k is the storage rate constant, measured in h−1; and Δt represents the duration of the time step, measured in h.
A summary of the costs and lifetime associated with the four major components is shown in Table 4.

2.4. Economic of Optimisation

In assessing the efficiency of different HRESs, NPC and COE are two commonly employed economic evaluation metrics. All system configurations in the optimised results in the HOMER simulation were ranked based on the total NPC. Employing the NPC is more advantageous because it accounts for all costs and revenues that arise throughout a project into a single lump payment in current currency, while future cash flows are discounted using the discount rate to reflect their present values [27,42]. The costs include fuel, pollution penalties, O&M, replacement, capital costs and grid power purchases, while salvage value and grid sales revenue are examples of the revenues. The total NPC is shown in Equation (7) [42].
N P C = C a n n , t o t C R F i , n
where Cann,tot represents the total annualised cost, in USD/yr; n denotes the project lifetime, in yr; i signifies the real discount rate, in %; and CRF( ) denotes the function returning the capital recovery factor. The capital recovery factor is a ratio used to determine the present value of an annuity, a series of equal annual cash flows, expressed by Equation (8) [42].
C R F i , n = i 1 + i n 1 + i n 1
The real discount rate is the percentage employed for converting single expenses into annualised expenditures, as shown in Equation (9) [42].
i = i f 1 + f
where i’ represents the nominal discount rate, denoting the rate at which individuals can borrow funds from a financial institution, expressed as %, while f signifies the anticipated inflation rate, also expressed as %.
The LCOE represents the average cost per kWh of useful electricity generated by the system, calculated by dividing the yearly cost of electricity generation by the total amount of useful electricity generated. The COE is computed using Equation (10) [9,42].
C O E = C a n n , t o t E s e r v e d = N P C × C R F i , n E p r i m + E d e f + E g r i d , s a l e s
where Eserved indicates the aggregate electrical load supplied, encompassing the total energy consumption required to fulfil both the primary and deferrable loads throughout the year, along with the energy sold to the grid, measured in kWh/yr.

2.5. Constraints

A few limitations were imposed to deliver a credible feasibility and economic report. These include setting the annual capacity shortage to 0%, indicating that all viable solutions generated by HOMER must consistently satisfy the demand. Additionally, the project lifetime is set at 25 years. The discount rate is 2.09%, based on the average rate in 2022 established by Bank Negara Malaysia [47]. The inflation rate, defined as the increase in the price of a particular set of products or services over a given period, usually a year, is 3.4%, according to data reported by the World Bank in 2022 [48].

3. Results and Discussions

Five feasible configurations, comprising combinations of solar PV and a biomass gasifier (BG), battery and converter, were evaluated in terms of economic and technical aspects. The results were ranked based on the total NPC and LCOE. Sensitivity analysis was performed on the best HRES by varying three parameters.

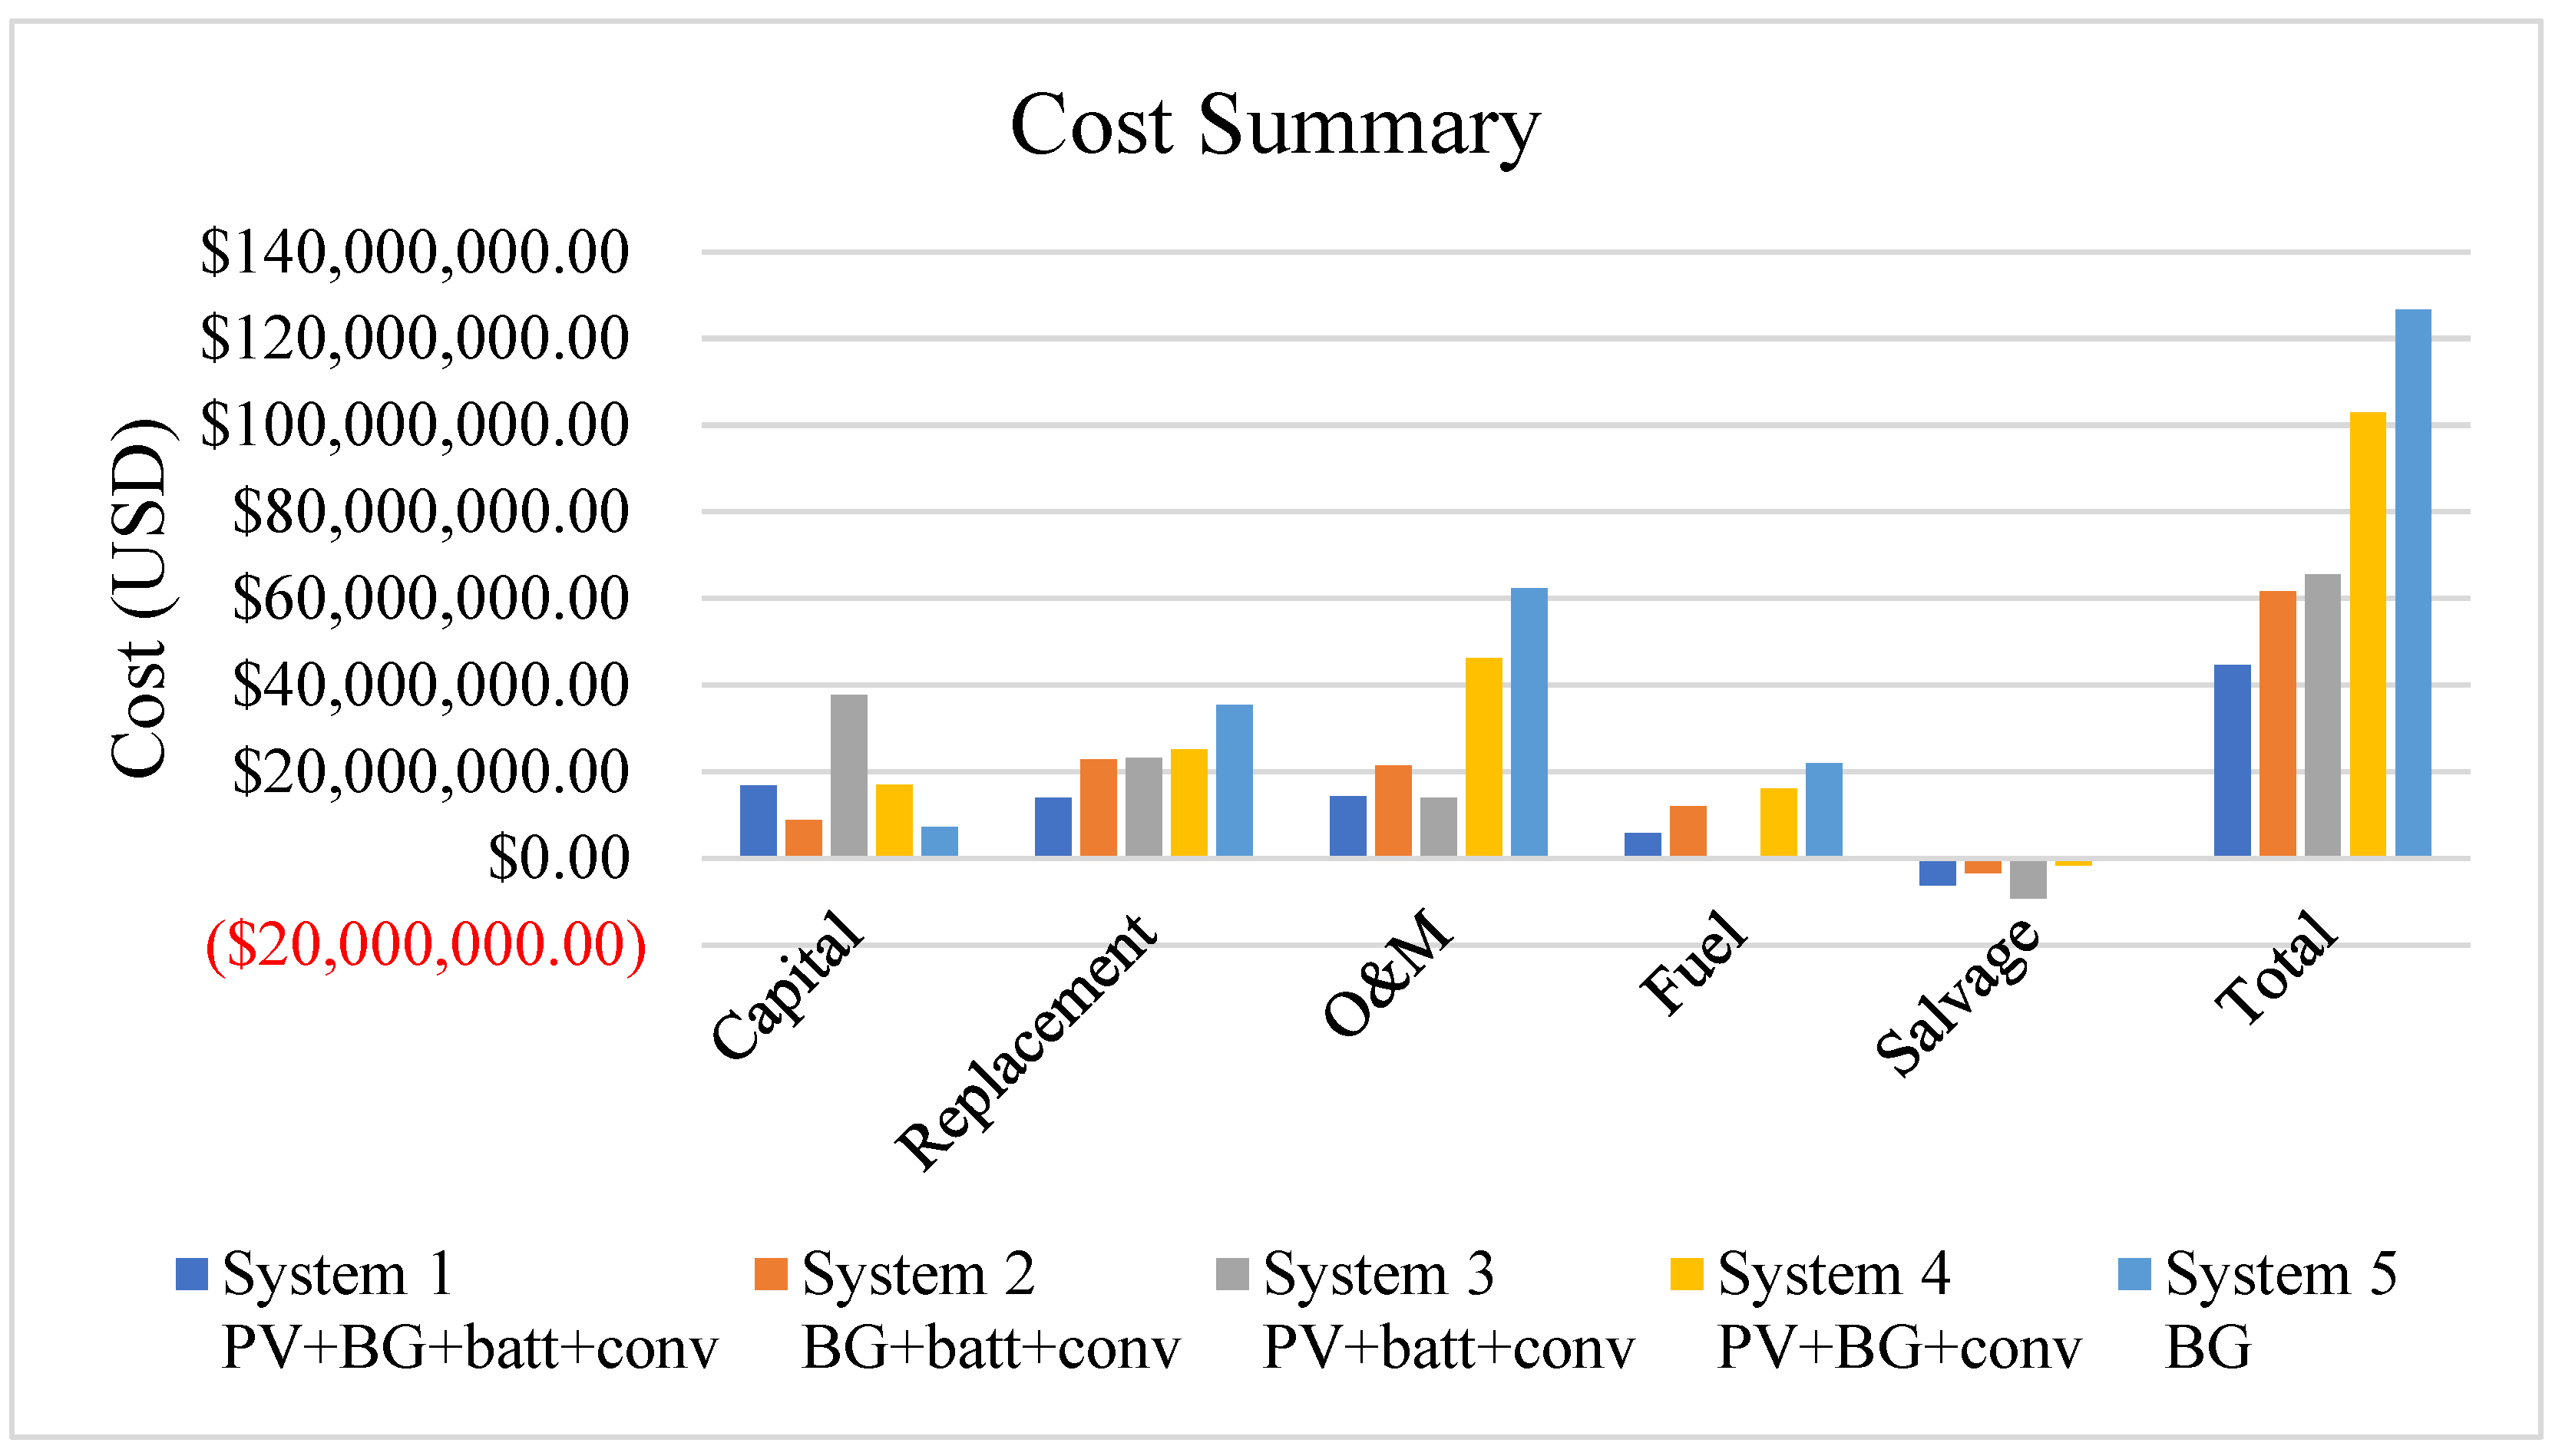
3.1. Economic Performance

The economic performance covering the aspects of the total NPC, LCOE, initial capital cost and operating cost of five feasible configurations optimised from HOMER simulation is summarised in Table 5. Table 6 shows the optimisation results of the system configurations.
System 1 symbolises an HRES with energy storage, while System 4 represents an HRES without energy storage. System 2 denotes a single renewable energy system with a biomass gasifier and battery. System 3 denotes a single renewable energy system with solar PV and battery. System 5 represents a single renewable energy system consisting of a biomass gasifier without energy storage. System 5 also serves as the base system, with the lowest initial capital cost.
The top economic system comprises 4075 kW solar PV, a 2100 kW biomass gasifier, 9363 battery units and 1939 kW converters, resulting in a total NPC of USD 44,596,990 and LCOE of USD 0.2364/kWh. Eliminating the biomass source in System 3 resulted in a significant increase of USD 20,940,629 in the initial capital cost. This is because 16,988 kW solar PV and 30,103 units of 1 kWh lithium-ion battery are required due to the intermittent and non-dispatchable characteristics of solar energy. System 2 showed a 47.2% decrease in the initial capital cost. At the same time, it showed a 90.1% increase in the operating cost, with a 38.4% higher LCOE and total NPC compared to System 1, due to its reliance on the biomass system. From the results, the hybrid system’s NPC and COE are lower than those of the single energy infrastructure. This is because employing multiple generating devices compensates for the drawbacks of a single generator by smoothing out power fluctuations, consequently enhancing electricity quality and lowering the capacity of the devices, leading to a reduction in investment cost [9].
Furthermore, System 4, which consists of 8721 kW solar PV, a 2400 kW biomass gasifier and a 934 kW converter, incurred an initial capital of USD 16,979,825 and an operating cost of USD 2,901,074. This resulted in a total NPC of USD 102,944,100 and COE of USD 0.5457/kWh. There is only a slight 1% increase in initial capital, but with a whopping threefold higher operating cost and twofold higher NPC and COE compared to System 1. In the absence of an ESS, the quantity of solar PV components would need to be increased, resulting in elevated costs. This result underscores the advantage of ESS, which can manage load variations and offset the shortfall in power demand shortly after the cessation of PV energy generation. This enables the use of components with smaller capacities, thus reducing the total costs [9,49,50]. Ramesh and Saini discovered that using lithium-ion batteries led to a notable decrease in both the COE and the NPC. More precisely, the COE was reduced by 25–37%, while the NPC was decreased by 34–35% across various dispatch strategies, demonstrating considerable cost benefits [49].
Among the five feasible systems, System 5 is the least economical option. System 5, an autonomous system containing a 2400 kW biomass gasifier, records the lowest initial capital at USD 7.2 million but the highest operating cost at USD 4,030,364, with a total NPC of USD 126,627,300 and an LCOE of USD 0.6713/kWh. This result is consistent with the study by Bagheri et al. [27], which found standalone reliance on an 8.5 MW biomass gasifier required an almost 47% lower initial capital cost but incurred a 25% higher operating cost and a 5% greater total NPC and LCOE. The increased operating expenses can be attributed to elevated fuel expenditure [50].
As shown in Table 7, the COE in Malaysia ranges from USD 0.046 to USD 0.120 per kWh for residential consumers [51]. Indeed, the COE in Malaysia is one of the lowest in the world. Malaysia ranked second for the lowest cost of electricity, which can be attributed to government subsidies provided to both producers and consumers [52]. Although the best economic configuration (System 1) costs USD 0.2364 per kWh, which is relatively pricier than the existing electricity charge, this electricity generation from HRES could become more competitive if supported by subsidies and policies.
Figure 6 shows a breakdown of the capital, replacement, O&M, fuel and salvage costs for the five system configurations.

3.2. Technical Performance

The technical performance was evaluated based on a few factors, including electricity production and excess electricity. The results are shown in Table 8.
System 1, the most economically feasible option, satisfies the residential area’s load demand with 64.7% solar-based and 35.3% biomass-based electricity production, generating 28.1% excess electricity annually. This high percentage of excess electricity results from the input setting of 0% annual capacity shortage, ensuring a consistent electricity supply to the area. To effectively manage this surplus electricity, two potential strategies were considered. First, the excess energy can be sold back to the grid, providing additional revenue and contributing to the overall energy infrastructure, which aligns with Malaysia’s renewable energy goals by integrating clean energy into the grid. Second, although not currently implemented in System 1, incorporating energy storage systems (ESS) offers a viable option for future enhancements. By storing surplus energy in batteries, the system could use this stored energy during periods of high demand or reduced renewable generation, thereby improving system efficiency and reducing reliance on the grid.
Due to the deterministic characteristics of the load, surplus electricity increases as electricity production rises. Compared to solar-based systems, biomass-based systems tend to produce less total and surplus electricity, which can be attributed to the relatively steady supply of biomass feedstock and uniform gasifier output [9]. Notably, the solar-based system demonstrates a more substantial contribution to electricity production and surplus electricity, as shown in Figure 7a,d and Table 8, respectively.
This outcome aligns with the research conducted by Kumar et al. [53], indicating that the size of solar PV systems significantly impacts the surplus energy generated. In their research, the configuration without PV exhibited no surplus energy, whereas the configuration with the greatest PV capacity yielded the highest surplus energy. In this study, System 2, which comprises a biomass gasifier and battery, generates 6,737,377 kWh of electricity annually, with zero excess electricity. In contrast, System 3, comprising PV and battery, generates 25,100,133 kWh of electricity yearly, accompanied by 17,932,330 kWh or 71.4% excess electricity. Similarly, in System 4, 59.4% and 40.6% of electricity are generated from solar and biomass, respectively, with 70.5% surplus electricity. In addition, the biomass-based system with a battery device generates less surplus electricity than the system without a battery. This can be observed in Systems 2 and 5, which generate 0% and 46.8% excess electricity, respectively.
The unmet electric load ranges from 0% to 0.0805%. Systems 2, 4 and 5 have zero unmet load, System 1 has 0.0019% and System 3 has 0.0805%. Additionally, the capacity shortage ranges from 0% to 0.0996%. Systems 2, 4 and 5 have zero capacity shortage, System 1 has 0.0996% and System 3 has 0.0994%. The low percentages of unmet electric load and capacity shortage, which are <0.1%, indicate that all systems can meet the power demand. It is worth mentioning that System 2 is the only system with zero excess electricity, unmet load and capacity shortage among the five feasible systems, which further suggests the stability of biomass power source.
Furthermore, System 2 has the shortest hours of autonomy, lasting only 2.25 h. The excess electricity generated in Systems 4 and 5 is discarded due to the lack of an ESS. Battery autonomy signifies the longest duration during which the batteries can run a load [28]. Moreover, the average biomass feedstock consumed ranges from 3160 to 11,881 tonnes per year. System 5, which is a standalone biomass system, consumes the highest quantity of feedstock. Although System 5 can produce sufficient power to sustain the area, running the system for 8760 h throughout the year is not feasible, as this would shorten the gasifier’s lifetime and increase costs.

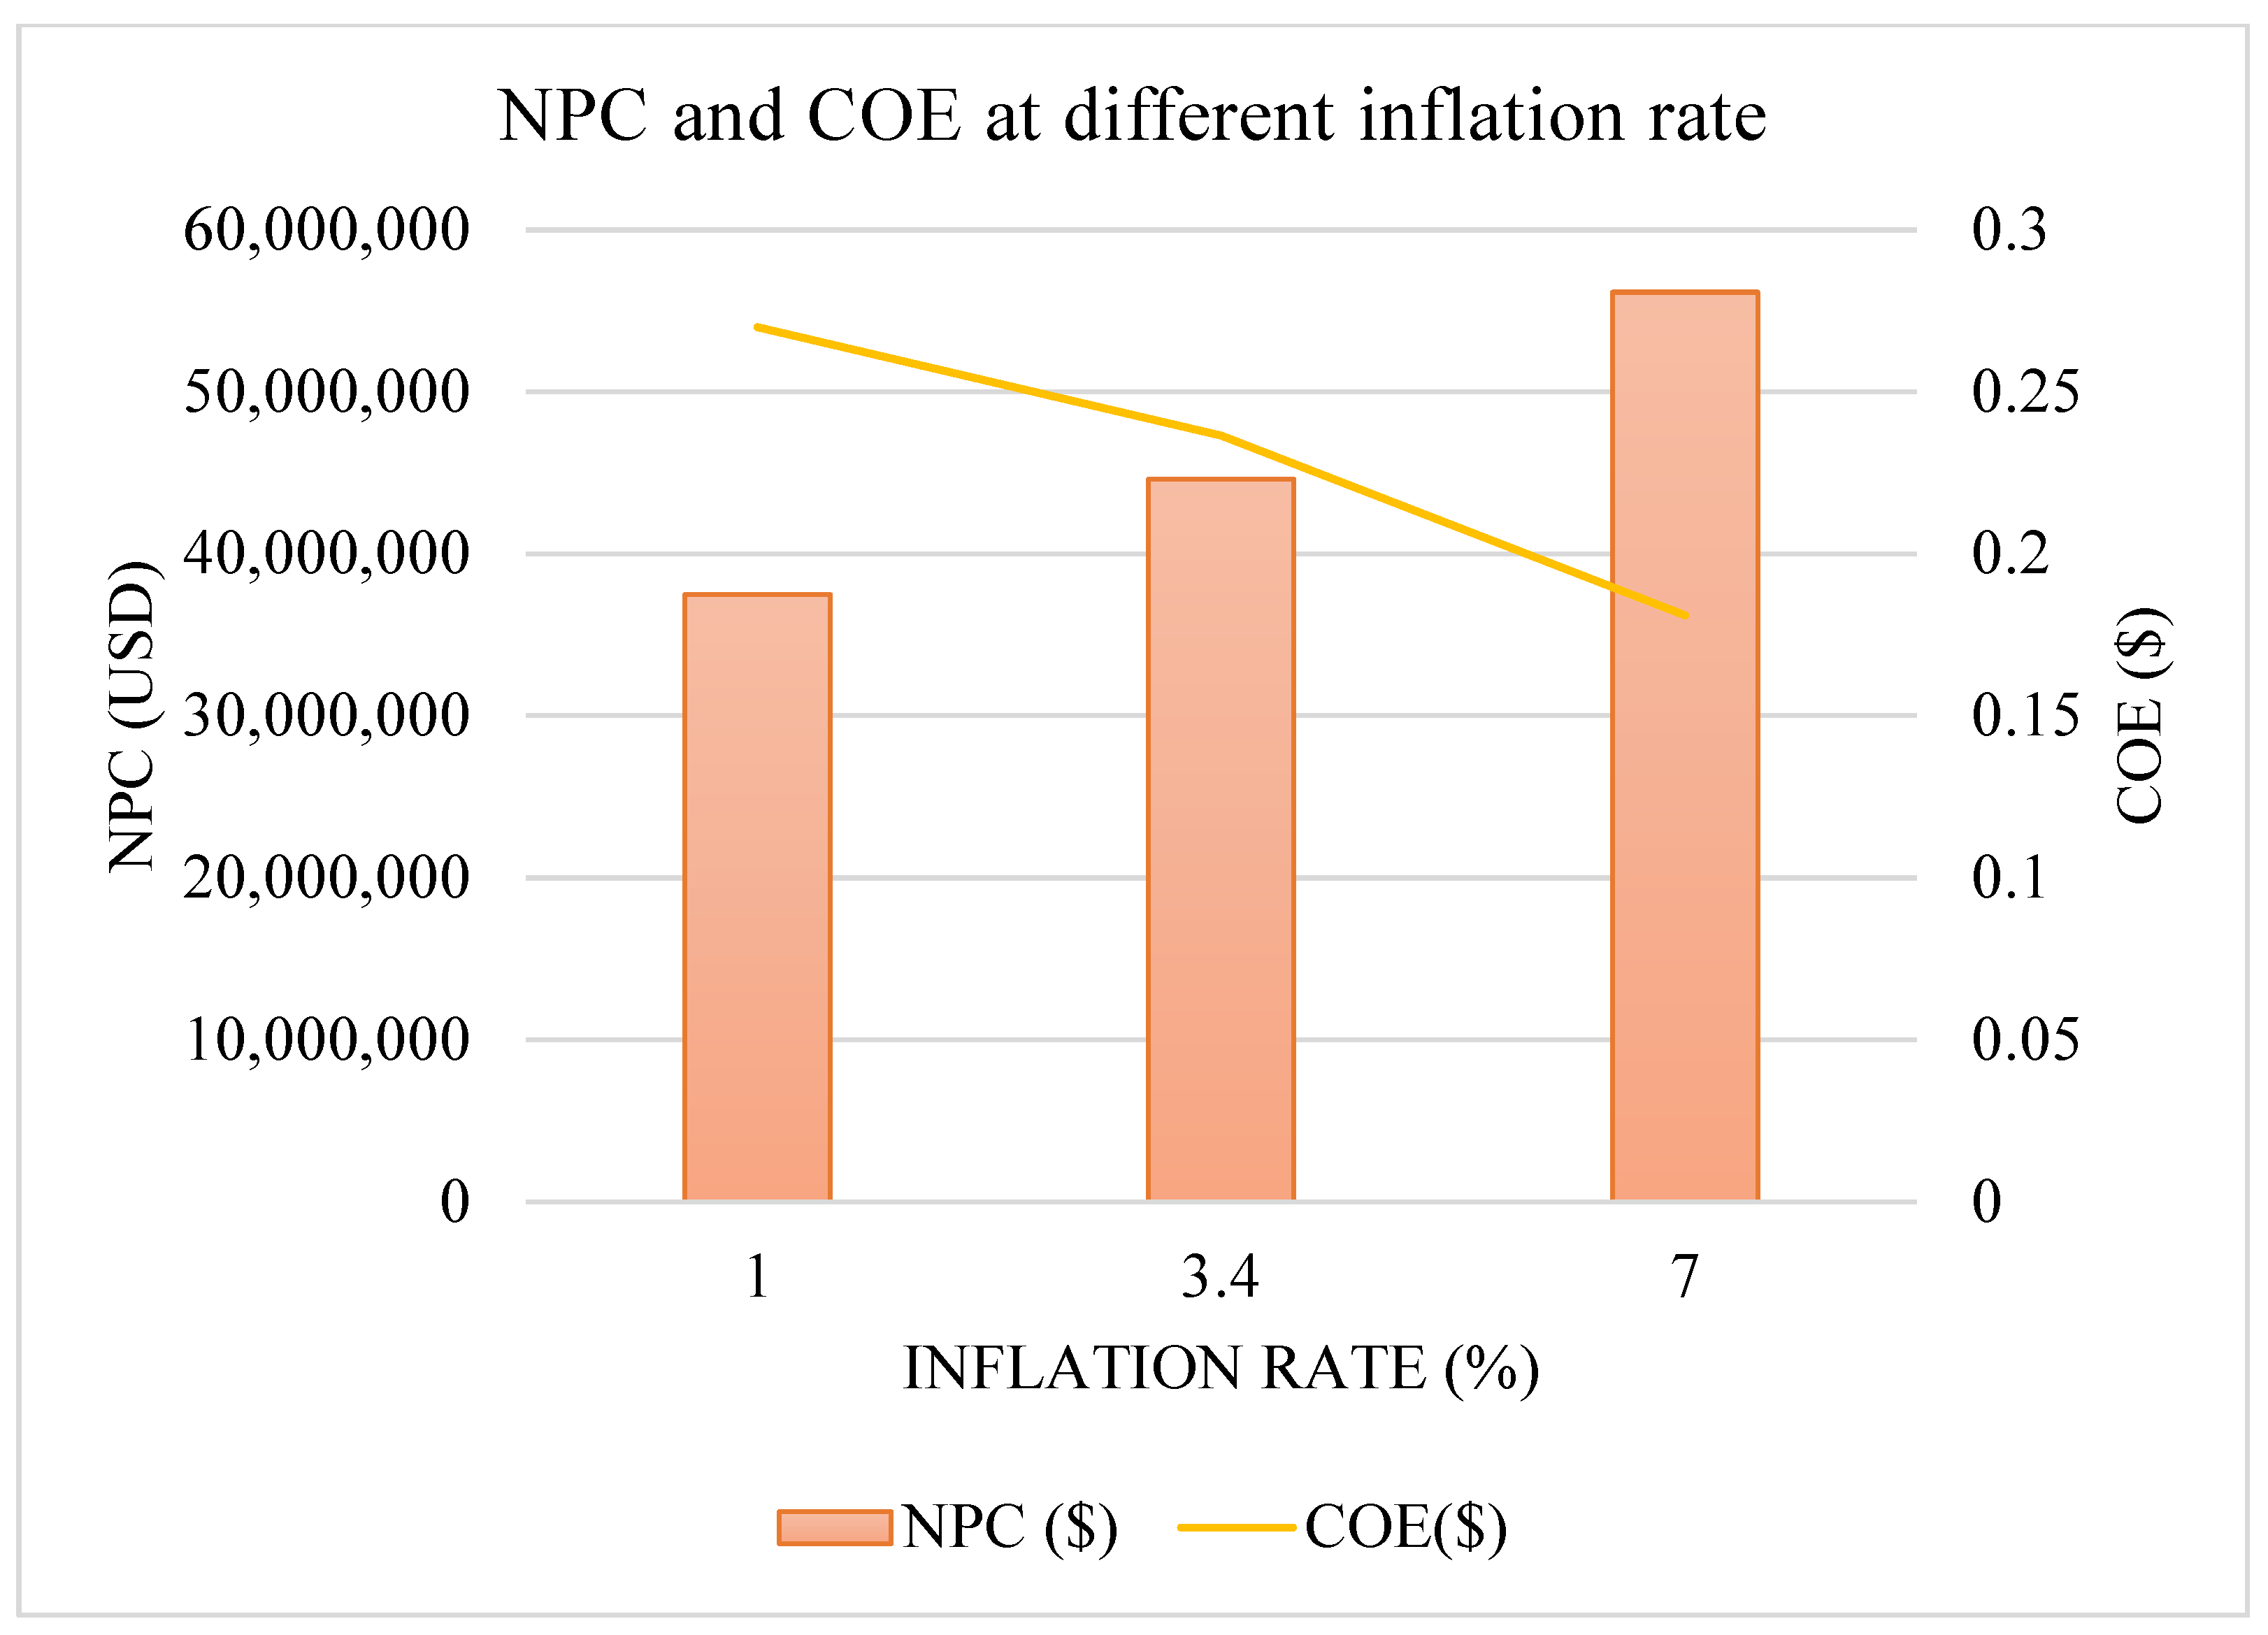
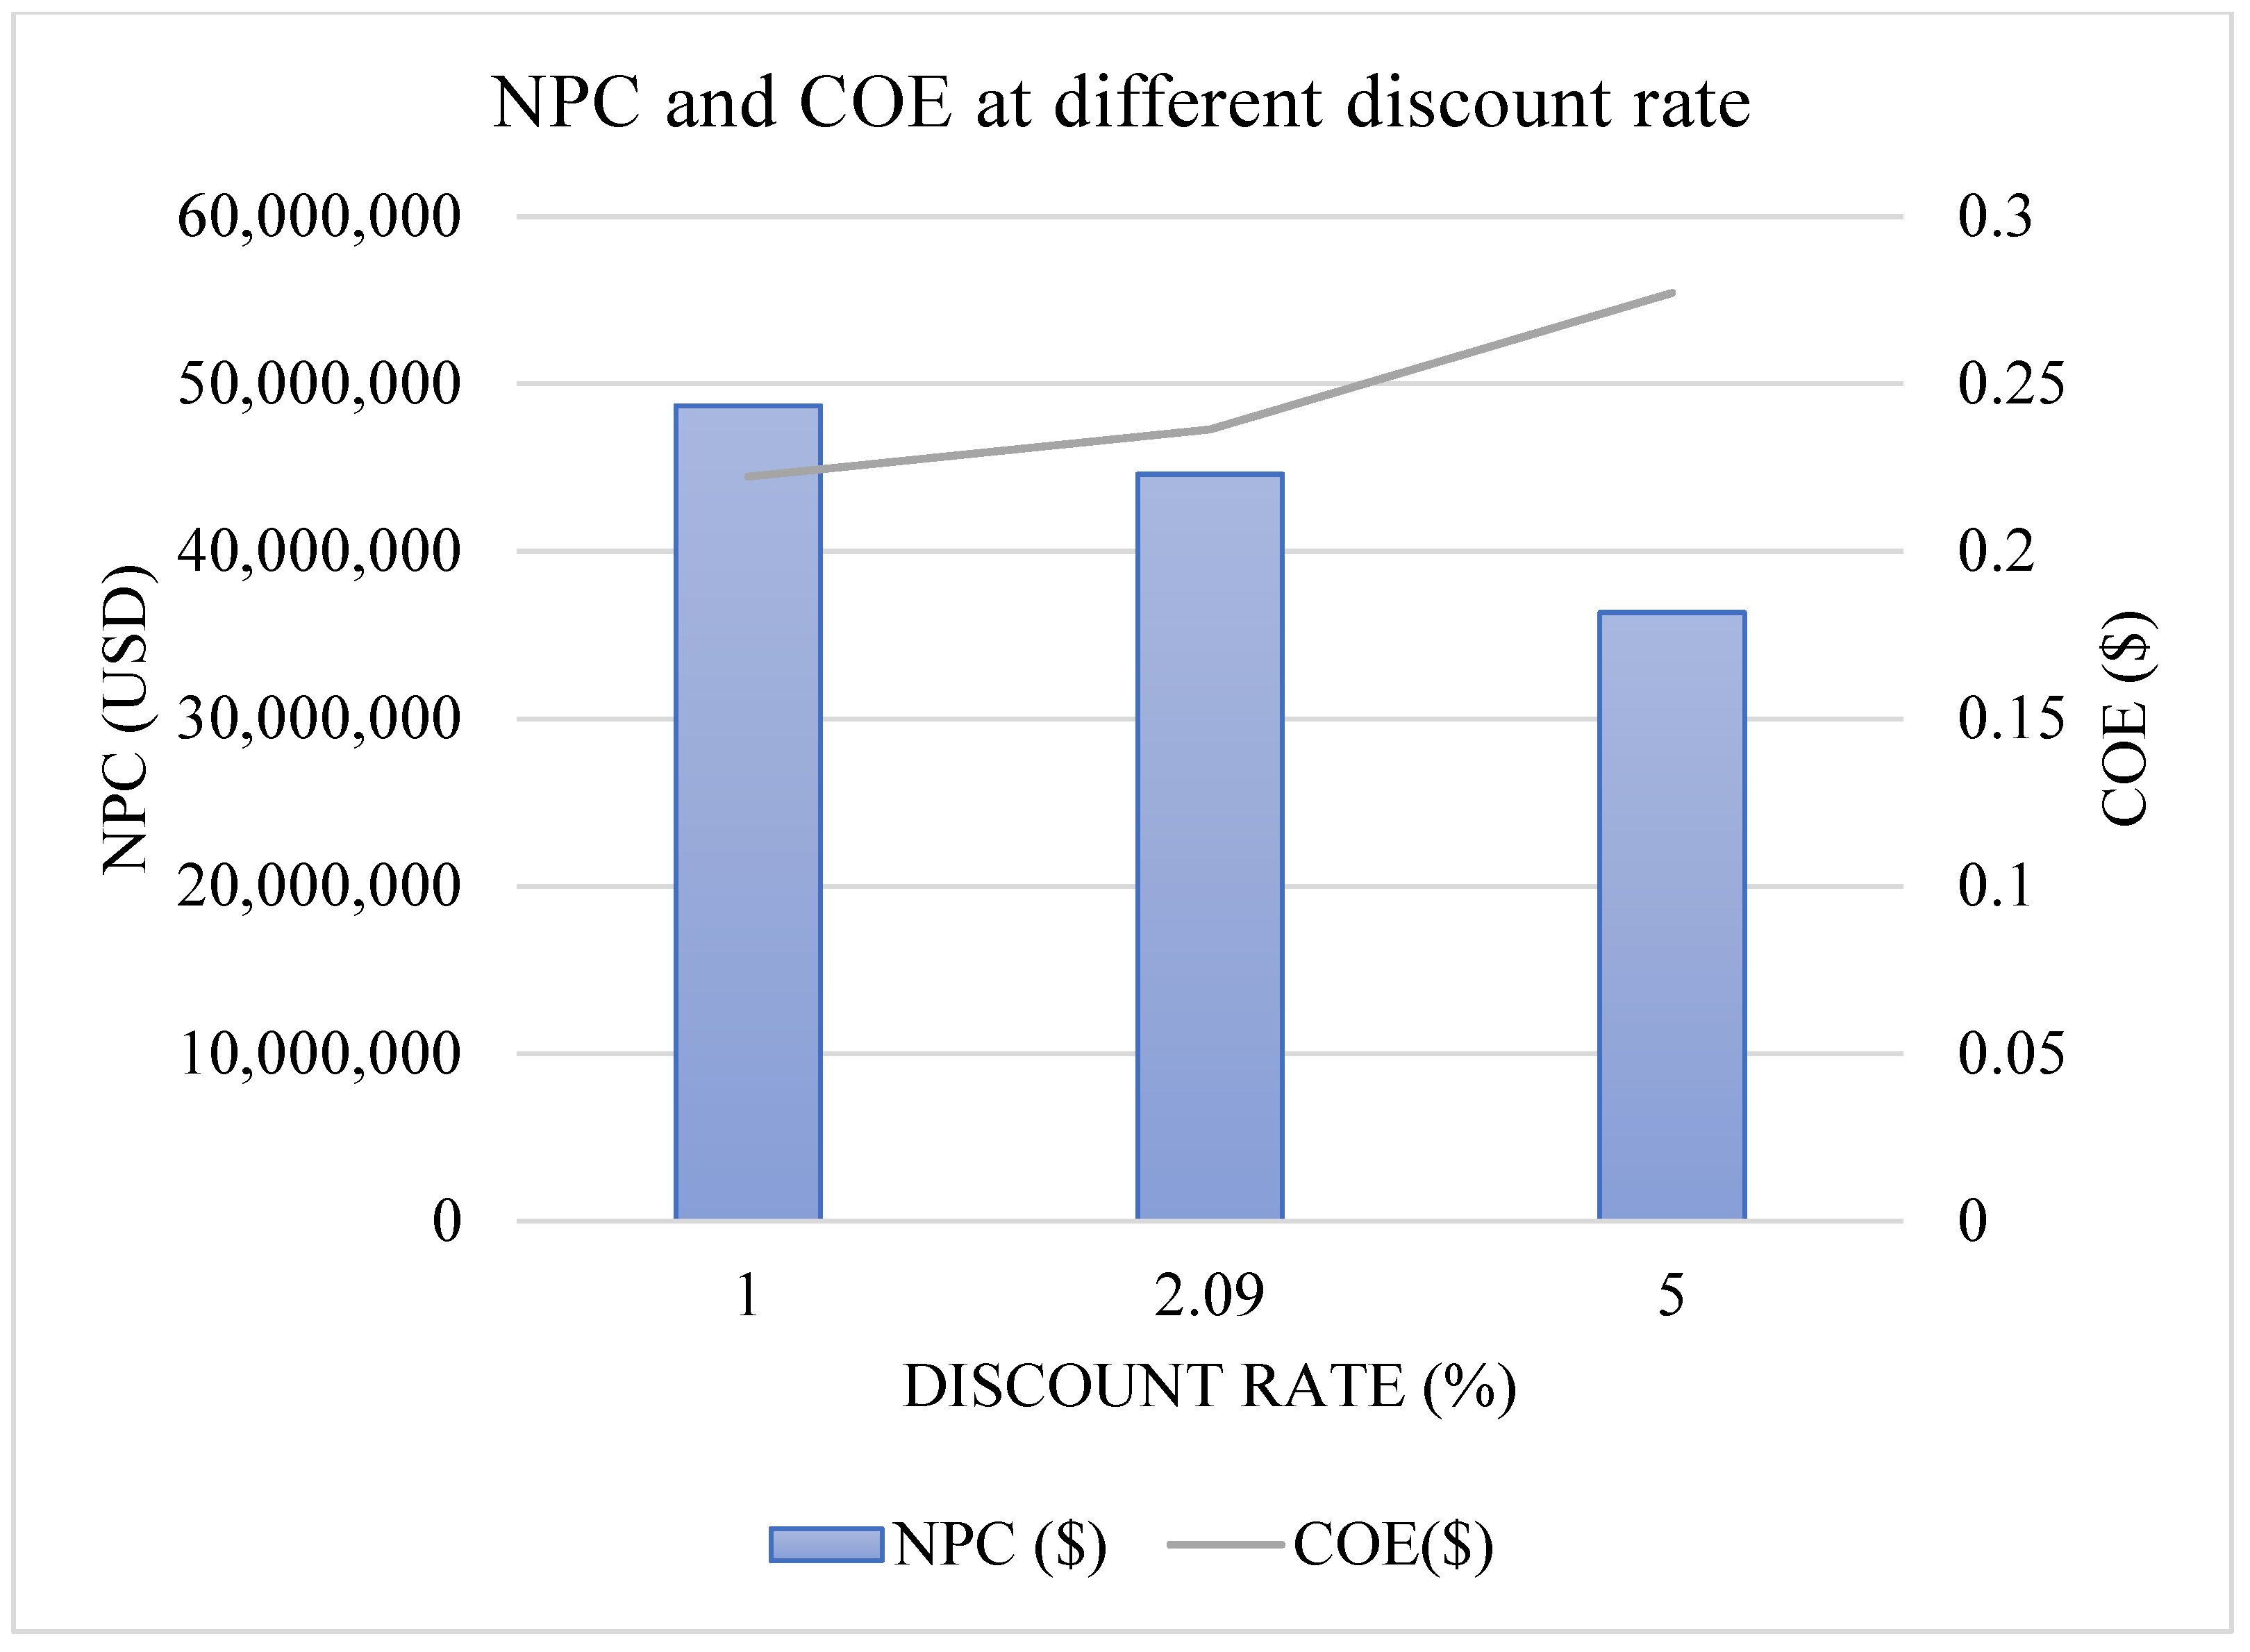
3.3. Sensitivity Analysis

Sensitivity analysis was performed to evaluate the impact of changing several parameters on the NPC and COE within the proposed HRES model. Five dynamic sensitivity parameters were selected for examination: biomass price, inflation rate, nominal discount rate, capital cost of PV and capital cost of battery, as these factors are subject to variation throughout the system’s operational lifespan. Table 9 shows the initial values and variables for the sensitivity parameters.
The initial value for the biomass price is USD 62.5 per tonne. The nominated costs of biomass are USD 10 and USD 52.9 per tonne. The selection of the USD 10 price point is based on a study that indicates that the typical expense of feedstock can vary from USD 10 per tonne for inexpensive waste materials to USD 160 per tonne for globally traded pellets [27]. The price point of USD 52.9 [40] is determined by factoring out the logistic cost and focusing solely on the feedstock cost. Figure 8 illustrates how the cost of biomass influences the NPC and COE. As the price of biomass increases, both the NPC and COE exhibit a corresponding increase. This outcome aligns with the finding reported by Kaur et al. [54] and Islam et al. [55], which indicated that the system’s NPC and COE rise in conjunction with an increase in biomass cost. This result is also consistent with the assessment conducted by Chambon et al. [21], which revealed that in a biomass system, the COE is highly responsive to biomass pricing.
Furthermore, the inflation and discount rates were initially set at 3.4% and 2.09%, respectively. We selected variables of 1% and 7% based on historical data and future forecasts of the average inflation rate in Malaysia from 1987 to 2022, with projections extending to 2028. Historical data indicate that the peak inflation rate was 5.43% in 2008, while the projected rate for 2028 stands at 1.86% [56]. The discount rate of 1% was chosen based on an analysis of interest rates from 2015 to 2023, with the lowest observed value being 1.69% [47]. The selection of the 5% variable accounts for a potential scenario of future interest rate escalation. Figure 9 and Figure 10 depict the relationship between inflation and discount rates on the NPC and COE. The analysis showed that an increase in inflation leads to a decrease in the COE, while the NPC continues to rise. Conversely, an increase in the discount rate results in an increase in the COE and a decrease in the NPC. These patterns are consistent with findings reported by Bagheri et al. [27], See et al. [28], Kumar and Channi [50], Kaur et al. [54] and Islam et al. [55]. The rise in the NPC with escalating inflation rates can be attributed to a heightened reliance on solar energy compared to biomass. For instance, at an inflation rate of 3.4%, solar energy accounted for 64.8% of the total energy contribution, whereas at an inflation rate of 7%, this percentage increased to 94.7%. The expansion of the solar energy system necessitates the use of additional batteries, consequently leading to an increase in capital expenditure.
Figure 11 shows the sensitivity analysis of the NPC and LCOE in response to variations in PV costs, initially set at USD 1100/kW with a ±10% adjustment (USD 990/kW and USD 1210/kW). As PV costs increase, both the NPC and COE rise, with the NPC ranging from USD 44.2 million to USD 44.8 million and the COE increasing from USD 0.233/kWh to USD 0.238/kWh. This analysis highlights the direct relationship between the PV capital cost and the overall economic performance of the system, where even a 10% increase in the PV cost significantly impacts both the NPC and COE.
This analysis shows that increasing the PV cost directly impacts both the NPC and the COE, making the system more expensive. As PV costs rise by 10%, the NPC increases by approximately USD 600,000, and the COE increases by about USD 0.005/kWh. This sensitivity analysis highlights how even modest changes in PV costs can affect the overall economic performance of the system.

4. Conclusions

This research demonstrated the application of HOMER software in designing an optimal HRES that integrates solar and biomass energy sources in the Johor region of Malaysia. The simulation was run at a neighbourhood scale of 1/100 of the city’s electrical load, in which the scaled annual average electric load and peak power are 17,441.72 kWh/day and 2133.93 kW, respectively. The most cost-effective system, System 1, consists of 4075 kW solar PV, a 2100 kW biomass gasifier, 9363 battery units and 1939 kW converters. This configuration resulted in a total NPC of USD 44,596,990 and a LCOE of USD 0.2364/kWh. System 1 highlights the benefits of a hybrid system over a single energy system and justifies the advantages of ESS. System 1 can satisfy the load demand of the residential area via 6,020,427 kWh (64.7%) of solar-based and 3,286,257 kWh (35.3%) of biomass-based electricity production, with an annual surplus of 2,613,329 kWh (28.1%). In comparison, biomass-based systems tend to produce less total and surplus electricity than solar-based systems. This surplus generated will be sold to the grid to increase the overall profitability of the system. The minimal percentages of unmet electric load and capacity shortage, both <0.1%, indicate that all systems can meet the power demand. The average biomass feedstock consumed ranges from 3160 to 11,881 tonnes per year. In summary, this research provides valuable insights into the economic viability and technical feasibility of powering the Kulai district with a solar–biomass system, thus facilitating Malaysia’s transition from fossil fuel-based energy to a low-carbon energy system through HRES adoption.
However, several practical challenges must be addressed for successful implementation. The logistical costs of transporting biomass to the gasification plant must be carefully managed to prevent increases in operational costs. Furthermore, regulatory frameworks and government policies play a crucial role in supporting the deployment of renewable energy technologies. Changes in subsidies, feed-in tariffs and environmental policies could impact the economic sustainability of the system. Therefore, future developments in policy support will be critical in scaling up such systems and mitigating these practical challenges.
While this study demonstrates the economic and technical feasibility of integrating solar and biomass energy sources within a hybrid renewable energy system (HRES), it is important to acknowledge the environmental implications associated with biomass feedstock consumption and greenhouse gas (GHG) emissions. Although biomass is considered a renewable energy source, its use involves potential environmental impacts, including GHG emissions from combustion and the ecological consequences of biomass harvesting, such as impacts on soil health, water resources and biodiversity. A comprehensive environmental impact analysis, including a life cycle assessment (LCA), would provide a more detailed understanding of these factors and help assess the true sustainability of the proposed system. Future work should incorporate such assessments to ensure that the environmental benefits of the HRES outweigh any potential negative impacts, ultimately supporting Malaysia’s transition to a low-carbon energy system.

5. Future Work

One significant limitation of this study is the lack of an environmental assessment. While the research effectively demonstrates the economic viability and technical feasibility of integrating solar and biomass energy sources using HOMER software, it does not evaluate the environmental impacts of the proposed HRES. Specifically, this study does not account for the potential effects of biomass feedstock consumption on local ecosystems, GHG emissions from biomass combustion or the environmental footprint of solar panel production and disposal. Future research should incorporate an environmental assessment to provide a more holistic evaluation of the proposed HRES. This could include conducting a life cycle assessment to quantify environmental impacts, evaluating GHG emissions associated with solar PV and biomass gasifier components, investigating the ecological impacts of biomass feedstock harvesting on local ecosystems and exploring the implications of local and international environmental policies on the deployment and operation of HRESs.

Author Contributions

P.J.Y., conceptualization, methodology, analysis, investigation, data curation, writing—original draft preparation; N.N.S., writing—review and editing; J.P., writing—review and editing; D.C., visualization; J.-O.L., supervision; J.-S.H., supervision, funding acquisition. All authors have read and agreed to the published version of the manuscript.

Funding

This work was supported by the National Research Foundation of Korea (NRF), a grant funded by the Korean government Ministry of Science and ICT (MSIT) (No. NRF-2021R1A5A8033165); the Korea Institute of Energy Technology Evaluation and Planning (KETEP) and the Ministry of Trade, Industry & Energy (MOTIE) of the Republic of Korea (No. 20224000000150).

Institutional Review Board Statement

Not applicable.

Informed Consent Statement

Not applicable.

Data Availability Statement

Data will be made available upon request.

Conflicts of Interest

The authors declare no conflicts of interest.

References

  1. Petinrin, J.; Shaaban, M. Renewable energy for continuous energy sustainability in Malaysia. Renew. Sustain. Energy Rev. 2015, 50, 967–981. [Google Scholar] [CrossRef]
  2. SEDA. Malaysia Renewable Energy Roadmap: Pathway towards Low Carbon Energy System. Sustainable Energy Development Authority (SEDA) Malaysia. 2021. Available online: https://www.seda.gov.my (accessed on 1 August 2024).
  3. Kamaruzaman, N.; Manaf, N.A.; Milani, D.; Abbas, A. Assessing the current state of biomass gasification technology in advancing circular economies: A holistic analysis from techno-economic-policy perspective in Malaysia and beyond. Chem. Eng. Res. Des. 2023, 199, 593–619. [Google Scholar] [CrossRef]
  4. Koerner, S.A.; Siew, W.S.; Salema, A.A.; Balan, P.; Mekhilef, S.; Thavamoney, N. Energy policies shaping the solar photovoltaics business models in Malaysia with some insights on COVID-19 pandemic effect. Energy Policy 2022, 164, 112918. [Google Scholar] [CrossRef]
  5. Tang, K.H.D. Climate change in Malaysia: Trends, contributors, impacts, mitigation and adaptations. Sci. Total. Environ. 2019, 650, 1858–1871. [Google Scholar] [CrossRef]
  6. IRENA. Malaysia Energy Transition Outlook. International Renewable Energy Agency, Abu Dhabi. 2023. Available online: https://www.irena.org (accessed on 1 August 2024).
  7. Ministry of Economy. National Energy Transition Roadmap: Energising the Nation, Powering Our Future. 2023. Available online: https://ekonomi.gov.my (accessed on 20 January 2024).
  8. Kammen, D.M.; Sunter, D.A. City-integrated renewable energy for urban sustainability. Science 2016, 352, 922–928. [Google Scholar] [CrossRef]
  9. Xu, X.; Zhang, Z.; Yuan, J.; Shao, J. Design and multi-objective comprehensive evaluation analysis of PV-WT-BG-Battery hybrid renewable energy systems in urban communities. Energy Convers. Manag. X 2023, 18, 100357. [Google Scholar] [CrossRef]
  10. Low Carbon Society Blueprint for Iskandar Malaysia 2025—Summary for Policymakers, Secon; UTM-Low Carbon Asia Research Center: Johor, Malaysia, 2023.
  11. Umar, H.; Sulaiman, S.; Said, M.M.; Gungor, A.; Shahbaz, M.; Inayat, M.; Ahmad, R. Assessing the implementation levels of oil palm waste conversion methods in Malaysia and the challenges of commercialisation: Towards sustainable energy production. Biomass-Bioenergy 2021, 151, 106179. [Google Scholar] [CrossRef]
  12. Hosseini, S.E.; Wahid, M.A. Utilization of palm solid residue as a source of renewable and sustainable energy in Malaysia. Renew. Sustain. Energy Rev. 2014, 40, 621–632. [Google Scholar] [CrossRef]
  13. Loh, S.K.; Nasrin, A.B.; Sukiran, M.A.; Bukhari, N.A.; Subramaniam, V. Oil palm biomass value chain for biofuel development in Malaysia: Part II. In Value-Chain of Biofuels: Fundamentals, Technology, and Standardization; Elsevier: Amsterdam, The Netherlands, 2021; pp. 505–534. [Google Scholar] [CrossRef]
  14. Sadhukhan, J.; Martinez-Hernandez, E.; Murphy, R.J.; Ng, D.K.; Hassim, M.H.; Ng, K.S.; Kin, W.Y.; Jaye, I.F.M.; Hang, M.Y.L.P.; Andiappan, V. Role of bioenergy, biorefinery and bioeconomy in sustainable development: Strategic pathways for Malaysia. Renew. Sustain. Energy Rev. 2018, 81, 1966–1987. [Google Scholar] [CrossRef]
  15. Zamri, M.F.M.A.; Milano, J.; Shamsuddin, A.H.; Roslan, M.E.M.; Salleh, S.F.; Rahman, A.A.; Bahru, R.; Fattah, I.M.R.; Mahlia, T.M.I. An overview of palm oil biomass for power generation sector decarbonization in Malaysia: Progress, challenges, and prospects. WIREs Energy Environ. 2022, 11, e437. [Google Scholar] [CrossRef]
  16. IRENA. Scaling up Biomass for the Energy Transition: Untapped Opportunities in Southeast Asia. International Renewable Energy Agency, Abu Dhabi. 2022. Available online: https://www.irena.org (accessed on 1 August 2024).
  17. Cheah, W.Y.; Siti-Dina, R.P.; Leng, S.T.K.; Er, A.; Show, P.L. Circular bioeconomy in palm oil industry: Current practices and future perspectives. Environ. Technol. Innov. 2023, 30, 103050. [Google Scholar] [CrossRef]
  18. Abdullah, N.; Sulaiman, F. The Oil Palm Wastes in Malaysia. In Biomass Now-Sustainable Growth and Use; InTech: Rijeka, Croatia, 2013; Volume 1, pp. 75–93. [Google Scholar] [CrossRef]
  19. Malik, P.; Awasthi, M.; Sinha, S. Biomass-based gaseous fuel for hybrid renewable energy systems: An overview and future research opportunities. Int. J. Energy Res. 2021, 45, 3464–3494. [Google Scholar] [CrossRef]
  20. Ullah, Z.; Elkadeem, M.; Kotb, K.M.; Taha, I.B.; Wang, S. Multi-criteria decision-making model for optimal planning of on/off grid hybrid solar, wind, hydro, biomass clean electricity supply. Renew. Energy 2021, 179, 885–910. [Google Scholar] [CrossRef]
  21. Chambon, C.L.; Karia, T.; Sandwell, P.; Hallett, J.P. Techno-economic assessment of biomass gasification-based mini-grids for productive energy applications: The case of rural India. Renew. Energy 2020, 154, 432–444. [Google Scholar] [CrossRef]
  22. Lozano, L.; Querikiol, E.M.; Abundo, M.L.S.; Bellotindos, L.M. Techno-economic analysis of a cost-effective power generation system for off-grid island communities: A case study of Gilutongan Island, Cordova, Cebu, Philippines. Renew. Energy 2019, 140, 905–911. [Google Scholar] [CrossRef]
  23. Li, J.; Liu, P.; Li, Z. Optimal design and techno-economic analysis of a solar-wind-biomass off-grid hybrid power system for remote rural electrification: A case study of west China. Energy 2020, 208, 118387. [Google Scholar] [CrossRef]
  24. Ribó-Pérez, D.; Herraiz-Cañete, A.; Alfonso-Solar, D.; Vargas-Salgado, C.; Gómez-Navarro, T. Modelling biomass gasifiers in hybrid renewable energy microgrids; a complete procedure for enabling gasifiers simulation in HOMER. Renew. Energy 2021, 174, 501–512. [Google Scholar] [CrossRef]
  25. Baek, S.; Park, E.; Kim, M.-G.; Kwon, S.J.; Kim, K.J.; Ohm, J.Y.; del Pobil, A.P. Optimal renewable power generation systems for Busan metropolitan city in South Korea. Renew. Energy 2016, 88, 517–525. [Google Scholar] [CrossRef]
  26. Guelleh, H.; Patel, R.; Kara-Zaitri, C.; Mujtaba, I. Grid connected hybrid renewable energy systems for urban households in Djibouti: An economic evaluation. S. Afr. J. Chem. Eng. 2023, 43, 215–231. [Google Scholar] [CrossRef]
  27. Bagheri, M.; Shirzadi, N.; Bazdar, E.; Kennedy, C.A. Optimal planning of hybrid renewable energy infrastructure for urban sustainability: Green Vancouver. Renew. Sustain. Energy Rev. 2018, 95, 254–264. [Google Scholar] [CrossRef]
  28. See, A.M.K.; Mehranzamir, K.; Rezania, S.; Rahimi, N.; Afrouzi, H.N.; Hassan, A. Techno-economic analysis of an off-grid hybrid system for a remote island in Malaysia: Malawali island, Sabah. Renew. Sustain. Energy Transit. 2022, 2, 100040. [Google Scholar] [CrossRef]
  29. Lau, K.; Tan, C.; Ching, K. The implementation of grid-connected, residential rooftop photovoltaic systems under different load scenarios in Malaysia. J. Clean. Prod. 2021, 316, 128389. [Google Scholar] [CrossRef]
  30. Laajimi, M.; Go, Y.I. Energy storage system design for large-scale solar PV in Malaysia: Technical and environmental assessments. J. Energy Storage 2019, 26, 100984. [Google Scholar] [CrossRef]
  31. Su, G.; Jiang, P.; Ong, H.C.; Zhu, J.; Amin, N.A.S.; Zulkifli, N.W.M.; Ibrahim, S. Co-production of biochar and electricity from oil palm wastes for carbon dioxide mitigation in Malaysia. J. Clean. Prod. 2023, 423, 138749. [Google Scholar] [CrossRef]
  32. Wee, A.N.C.H.; Erison, A.E.; Anyek, E.H.E.; Pakpahan, G.R.; Lim, J.R.; Tiong, A.N.T. Techno-economic assessment of hydrogen production via steam reforming of palm oil mill effluent. Sustain. Energy Technol. Assess. 2022, 53, 102575. [Google Scholar] [CrossRef]
  33. Salehmin, M.N.I.; Tiong, S.K.; Mohamed, H.; Zainal, B.S.; Lim, S.S.; Yasin, N.H.M.; Zakaria, Z. Sustainable Bioenergy from Palm Oil Mill Effluent: Advancements in Upstream and Downstream Engineering with Techno-Economic and Environmental Assessment; Korean Society of Industrial Engineering Chemistry: Busan, Republic of Korea, 2023. [Google Scholar] [CrossRef]
  34. Mahmod, S.S.; Jahim, J.M.; Abdul, P.M.; Luthfi, A.A.I.; Takriff, M.S. Techno-economic analysis of two-stage anaerobic system for biohydrogen and biomethane production from palm oil mill effluent. J. Environ. Chem. Eng. 2021, 9, 105679. [Google Scholar] [CrossRef]
  35. Hor, C.J.; Tan, Y.H.; Mubarak, N.M.; Tan, I.S.; Ibrahim, M.L.; Yek, P.; Karri, R.R.; Khalid, M. Techno-economic assessment of hydrotreated vegetable oil as a renewable fuel from waste sludge palm oil. Environ. Res. 2023, 220, 115169. [Google Scholar] [CrossRef]
  36. FFB Received by Mill 2021. Available online: https://bepi.mpob.gov.my/index.php/sectoral-status/274-sectoral-status-2021/1049-ffb-received-by-mill-2021 (accessed on 22 January 2024).
  37. FFB Received by Mill 2022. Available online: https://bepi.mpob.gov.my/index.php/sectoral-status/288-sectoral-status-2022/1101-ffb-received-by-mill-2022 (accessed on 22 January 2024).
  38. Department of Statistics Malaysia. Current Population Estimates, Administrative DistricT. 2023. Available online: https://www.dosm.gov.my (accessed on 1 August 2024).
  39. Liew, W.L.; Kassim, M.A.; Muda, K.; Loh, S.K.; Affam, A.C. Conventional methods and emerging wastewater polishing technologies for palm oil mill effluent treatment: A review. J. Environ. Manag. 2015, 149, 222–235. [Google Scholar] [CrossRef]
  40. Salleh, S.F.; Rahman, A.A.; Abdullah, T.A.R.T. Potential of Deploying Empty Fruit Bunch (EFB) for Biomass Cofiring in Malaysia’s Largest Coal Power Plant. In Proceedings of the 2018 IEEE 7th International Conference on Power and Energy (PECon), Kuala Lumpur, Malaysia, 3–4 December 2018; pp. 429–433. [Google Scholar]
  41. Panasonic HIT+ VBHN340SA17|EnergySage. Available online: https://www.energysage.com/solar-panels/panasonic/1410/vbhn340sa17/ (accessed on 23 January 2024).
  42. HOMER Pro Version 3.7 User Manual. Available online: https://homerenergy.com/pdf/HOMERHelpManual.pdf (accessed on 20 December 2023).
  43. Samiran, N.A.; Jaafar, M.N.M.; Ng, J.-H.; Lam, S.S.; Chong, C.T. Progress in biomass gasification technique—With focus on Malaysian palm biomass for syngas production. Renew. Sustain. Energy Rev. 2016, 62, 1047–1062. [Google Scholar] [CrossRef]
  44. Valdés, C.F.; Montoya, J.I.; Gómez, C.A.; Chaquea, H.; Pecha, M.B.; Chejne, F. Influence of Pelletization and Moisture Content of Oil Palm Empty Fruit Bunches (EFBs) on Dynamic Gasification Performance. Energy Fuels 2021, 35, 8807–8818. [Google Scholar] [CrossRef]
  45. Yakub, A.O.; Same, N.N.; Owolabi, A.B.; Nsafon, B.E.K.; Suh, D.; Huh, J.-S. Optimizing the performance of hybrid renewable energy systems to accelerate a sustainable energy transition in Nigeria: A case study of a rural healthcare centre in Kano. Energy Strat. Rev. 2022, 43, 100906. [Google Scholar] [CrossRef]
  46. Same, N.N.; Yakub, A.O.; Nsafon, B.E.K.; Owolabi, A.B.; Mih, T.A.; Suh, D.; Huh, J.-S. Performance evaluation of renewable-based sustainable micro-grid under predictive management control strategy: A case study of Gado refugee camp in Cameroon. Front. Energy Res. 2022, 10, 987495. [Google Scholar] [CrossRef]
  47. Interest Rates & Volumes—Bank Negara Malaysia. Available online: https://www.bnm.gov.my/interest-rates-volumes (accessed on 22 January 2024).
  48. Inflation, Consumer Prices (Annual %)—Malaysia|Data. Available online: https://data.worldbank.org/indicator/FP.CPI.TOTL.ZG?end=2022&locations=MY&start=2022&view=chart (accessed on 22 January 2024).
  49. Ramesh, M.; Saini, R.P. Dispatch strategies based performance analysis of a hybrid renewable energy system for a remote rural area in India. J. Clean. Prod. 2020, 259, 120697. [Google Scholar] [CrossRef]
  50. Kumar, R.; Channi, H.K. A PV-Biomass off-grid hybrid renewable energy system (HRES) for rural electrification: Design, optimization and techno-economic-environmental analysis. J. Clean. Prod. 2022, 349, 131347. [Google Scholar] [CrossRef]
  51. Welcome to myTNB Portal—Pricing & Tariff. Available online: https://www.mytnb.com.my/residential/understand-your-bill/pricing-tariff (accessed on 4 March 2024).
  52. Malaysia Ranked Fourth Most Affordable Country—MIDA|Malaysian Investment Development Authority. Available online: https://www.mida.gov.my/mida-news/malaysia-ranked-fourth-most-affordable-country/ (accessed on 10 March 2024).
  53. Kumar, P.; Pal, N.; Sharma, H. Optimization and techno-economic analysis of a solar photo-voltaic/biomass/diesel/battery hybrid off-grid power generation system for rural remote electrification in eastern India. Energy 2022, 247, 123560. [Google Scholar] [CrossRef]
  54. Kaur, M.; Dhundhara, S.; Verma, Y.P.; Chauhan, S. Techno-economic analysis of photovoltaic-biomass-based microgrid system for reliable rural electrification. Int. Trans. Electr. Energy Syst. 2020, 30, 12347. [Google Scholar] [CrossRef]
  55. Islam, M.S.; Akhter, R.; Rahman, M.A. A thorough investigation on hybrid application of biomass gasifier and PV resources to meet energy needs for a northern rural off-grid region of Bangladesh: A potential solution to replicate in rural off-grid areas or not? Energy 2018, 145, 338–355. [Google Scholar] [CrossRef]
  56. Malaysia—Inflation Rate 2028|Statista. Available online: https://www.statista.com/statistics/319033/inflation-rate-in-malaysia/ (accessed on 7 February 2024).
Figure 1. Overall analysis workflow.
Sustainability 16 07856 g001
Figure 2. Location of the study area.
Sustainability 16 07856 g002
Figure 3. Hourly load profile data for residential homes in Kulai on a daily basis.
Sustainability 16 07856 g003
Figure 4. Monthly average Global Horizontal Irradiance (GHI) and temperature.
Sustainability 16 07856 g004
Figure 5. Schematic diagram of the hybrid renewable energy system.
Sustainability 16 07856 g005
Figure 6. Cost summary of the different configurations.
Sustainability 16 07856 g006
Figure 7. Monthly electric production for all configurations: (a) system 1; (b) system 2; (c) system 3; (d) system 4; (e) system 5.
Sustainability 16 07856 g007
Figure 8. NPC and COE at different biomass prices.
Sustainability 16 07856 g008
Figure 9. NPC and COE at different inflation rates.
Sustainability 16 07856 g009
Figure 10. NPC and COE at different discount rates.
Sustainability 16 07856 g010
Figure 11. NPC and COE at different PV cost.
Sustainability 16 07856 g011
Table 1. Typical electrical loads of a household.
Appliance TypeNo. of
Appliance
Rating (W)Hourly
Consumption (W)
Total
kWh/day
Compact fluorescent lamp7402801.640
Ceiling fan155550.770
Air conditioner375022509.000
Phone charger418720.072
Laptop150500.100
Television11201201.320
Refrigerator12002004.800
Kettle1100010001.500
Rice cooker16506500.650
Washing machine15005000.500
Total 517720.352
Table 2. Monthly average clearness index, radiation and ambient temperature in Kulai.
MonthClearness IndexAverage Solar GHI
(kWh/m2/day)
Average Ambient
Temperature (°C)
January0.4944.88125.47
February0.5315.46025.79
March0.5225.47626.55
April0.5125.25527.34
May0.4974.86827.45
June0.5094.82427.06
July0.4914.71526.59
August0.4894.90526.52
September0.4925.09226.60
October0.5095.22326.76
November0.4684.64626.39
December0.4814.67425.76
Table 3. FFBs received by mills in Johor between 2020 and 2022.
FFB
2020
FFB
2021
FFB
2022
FFB Average 2020–2022EFB
(wet)
EFB
(dry)
EFB (dry/
day)
January940,263927,361 975,030 947,551 208,461 72,961 2354
February1,141,258 906,399 988,675 1,012,111 222,664 77,933 2783
March1,182,731 1,203,375 1,219,022 1,201,709 264,376 92,532 2985
April1,407,185 1,263,728 1,228,701 1,299,871 285,972 100,090 3336
May1,361,246 1,241,030 1,247,160 1,283,145 282,292 98,802 3187
June1,685,240 1,278,675 1,341,022 1,434,979 315,695 110,493 3683
July1,570,828 1,323,265 1,353,206 1,415,766 311,469 109,014 3517
August1,552,713 1,384,916 1,409,494 1,449,041 318,789 111,576 3599
September1,553,053 1,315,201 1,431,185 1,433,146 315,292 110,352 3678
October1,358,064 1,329,658 1,441,709 1,376,477 302,825 105,989 3419
November1,248,860 1,259,877 1,347,453 1,285,397 282,787 98,976 3299
December1,110,630 1,125,419 1,337,570 1,191,206 262,065 91,723 2959
TOTAL16,112,071 14,558,904 15,320,227 15,330,401 3,372,688 1,180,441 38,800
Unit: tonnes. Source: Data adapted from Malaysian Palm Oil Board [36,37].
Table 4. Costs and lifetime associated with different components.
ComponentModelCost (USD)Replacement Cost (USD)O&M Cost (USD)Lifetime (years)
PVPanasonic
VBHN340SA17
1100/kW1100/kW10/kW/yr25
Biomass gasifierBiogas
downdraft
3000/kW1250/kW0.1/kW/h20,000 h
Battery1 kWh Li-ion600/unit600/unit10/yr15
ConverterLeonics
MTP-413F 25 kW
200/kW200/kW020
Table 5. Economic performance of different configurations.
Feasible OptionsSystem ConfigurationsEconomic Performance
PVBGBatteryConverterTotal NPC (USD)LCOE (USD/kWh)Initial Capital (USD/yr)Operating Cost (USD/yr)
144,596,9900.236416,787,825938,488
2 61,726,3900.32728,868,3501,783,822
3 65,523,8900.347637,728,454938,024
4 102,944,1000.545716,979,8252,901,074
5 126,627,3000.67137,200,0004,030,364
Table 6. Optimised system configurations.
DescriptionUnitsSystem 1System 2System 3System 4System 5
PV + BG
+ batt + conv
BG
+ batt + conv
PV
+ batt + conv
PV + BG
+ conv
BG
Solar PVkW4075-16,9888721-
Biomass
gasifier
kW21002400-24002400
Battery
1 kWh Li
unit9363233630,103--
ConverterkW193913344898934-
Table 7. Domestic electricity tariff in Malaysia.
Tariff—DomesticRate (USD/kWh)
1–200 kWh0.046
201–300 kWh0.071
301–600 kWh0.110
601–900 kWh0.120
901 kWh~0.120
Source: Tenaga Nasional Berhad Malaysia [51].
Table 8. Technical performance of different configurations.
DescriptionUnitsSystem 1System 2System 3System 4System 5
PV + BG
+ batt + conv
BG
+ batt + conv
PV
+ batt + conv
PV + BG
+ conv
BG
PV
electricity production
kWh/yr6,020,427-25,100,13312,885,354-
BG
electricity production
kWh/yr3,286,2576,737,377-8,811,96011,958,360
Total
feedstock consumed
tonnes31606473-872011,881
BG
operation hours
hrs/yr16592920-61388760
Battery
autonomy
hr9.022.2529.0--
Excess
electricity
kWh/yr2,613,329017,932,33015,297,4675,592,132
Unmet
electric load
kWh/yr1210512800
Capacity shortagekWh/yr63410632900
Table 9. Parameters for sensitivity analysis.
No.ParameterUnitVariables
1Biomass priceUSD/tonne62.51052.9
2Expected inflation rate%3.417
3Nominal discount rate%2.0915
4PV capital costUSD/kW11009901210
Disclaimer/Publisher’s Note: The statements, opinions and data contained in all publications are solely those of the individual author(s) and contributor(s) and not of MDPI and/or the editor(s). MDPI and/or the editor(s) disclaim responsibility for any injury to people or property resulting from any ideas, methods, instructions or products referred to in the content.

