
Impact of Farm Management on Soil Fertility in Agroforestry Systems in Bali, Indonesia

 , ,
, ,
Abstract
:1. Introduction
2. Materials and Methods
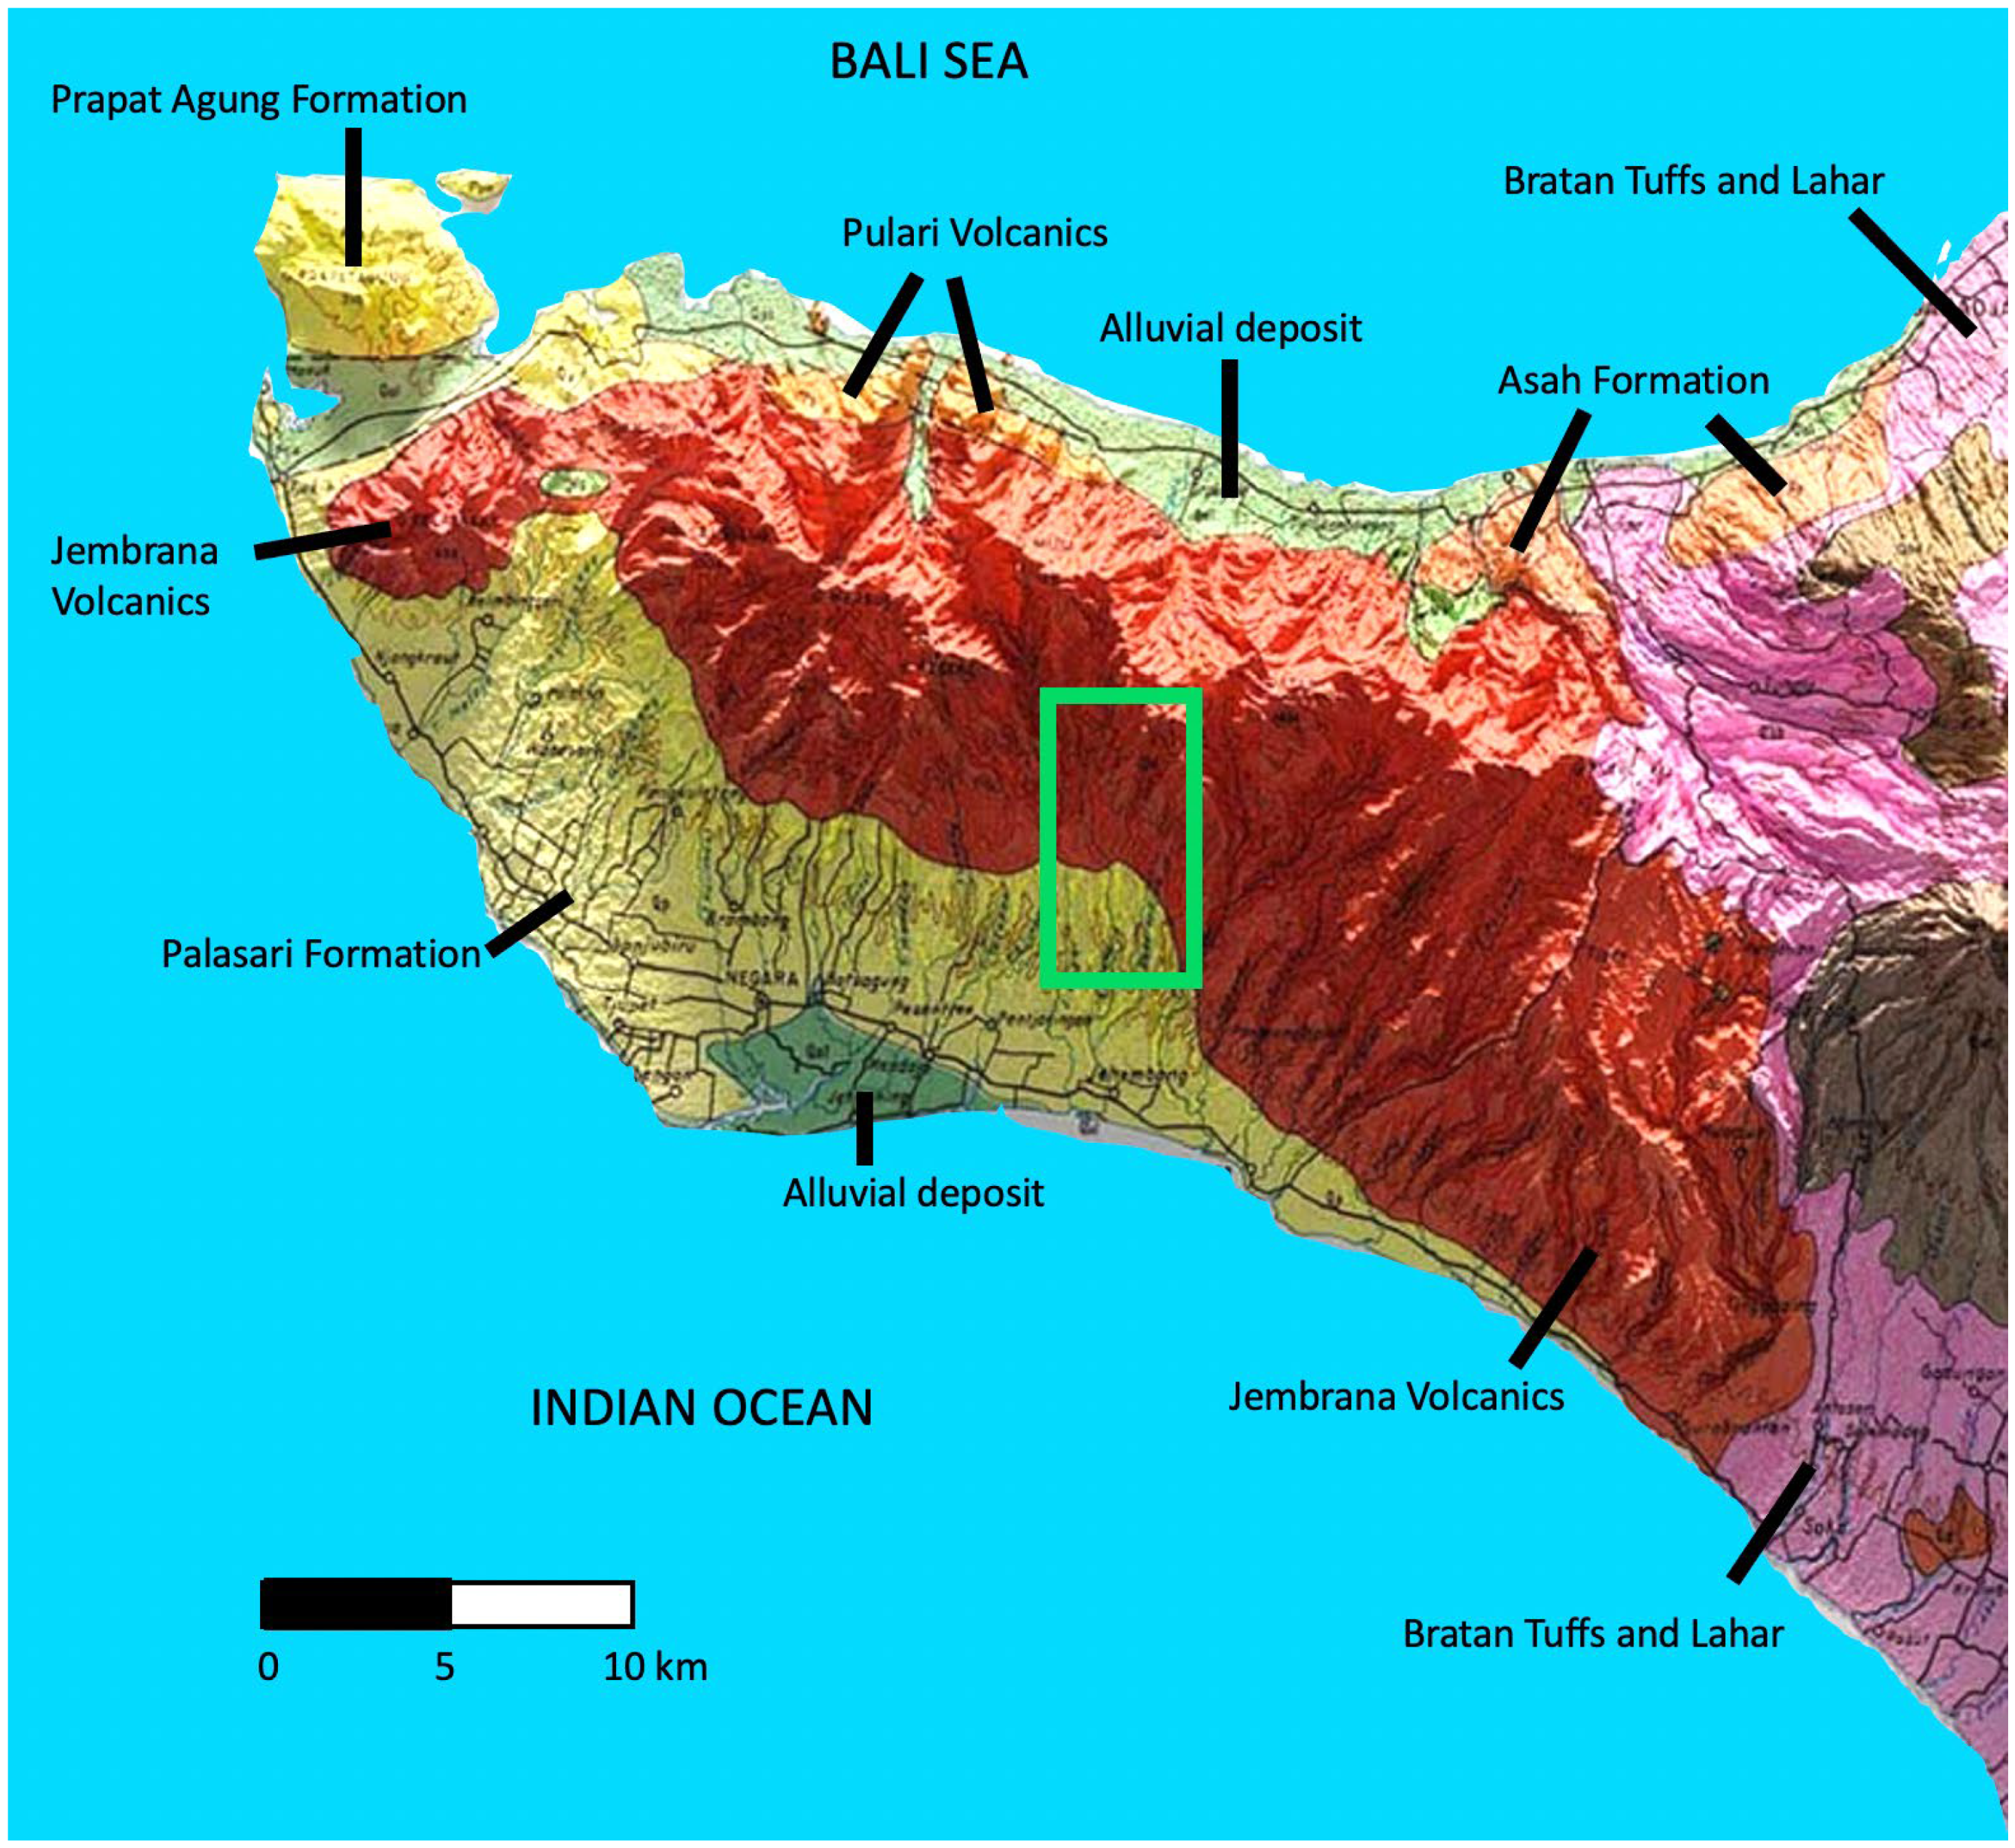
2.1. Geology and Soils of the Study Region
2.2. Hydrology and Rainfall
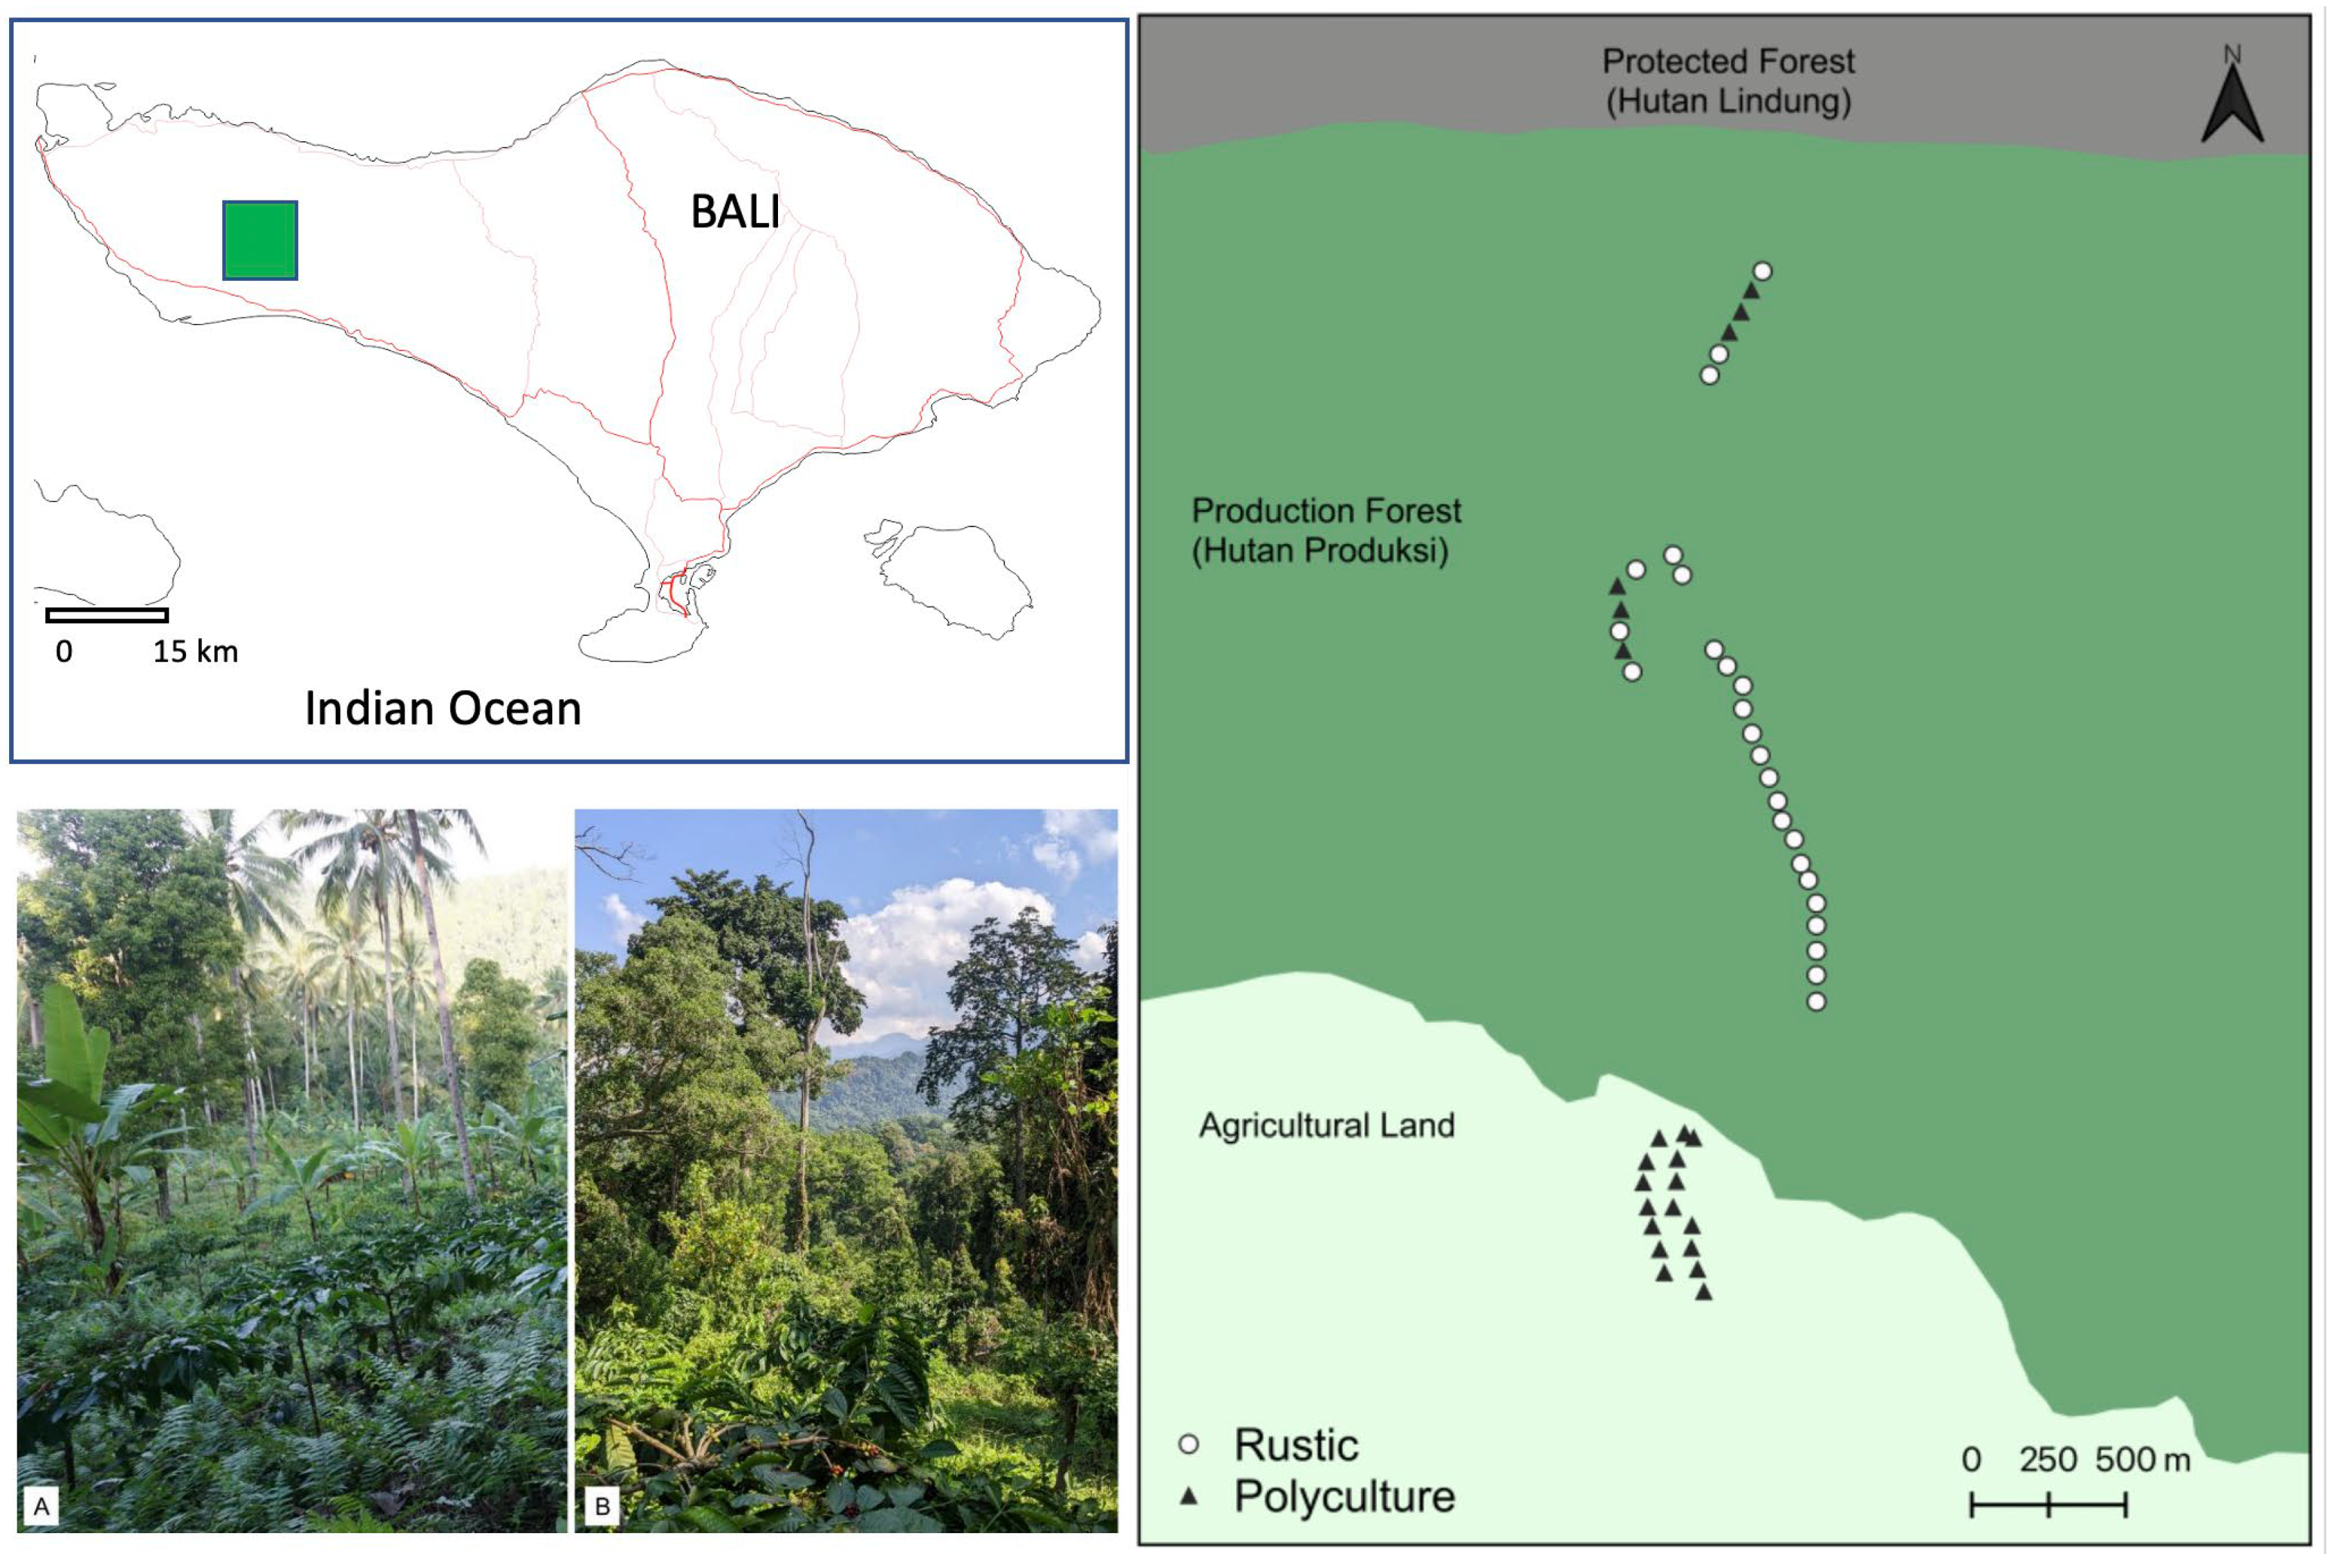
2.3. Data Collection
2.4. Soil Sample Collection and Analysis
2.5. Ethics and Permissions
2.6. Data Analysis
3. Results
4. Discussion
4.1. Effect of Agricultural Practices on Soils
4.2. Study Limitations, Caveats and Suggestions for Further Research
5. Conclusions
Author Contributions
Funding
Institutional Review Board Statement
Informed Consent Statement
Data Availability Statement
Acknowledgments
Conflicts of Interest
Appendix A
References
- Winoto, J.; Siregar, H. Agricultural development in Indonesia: Current problems, issues, and policies. Anal. Kebijak. Pertan. 2008, 6, 11–36. [Google Scholar]
- Abe, S.S.; Ashida, K.; Kamil, M.I.; Tobisaka, K.; Kamarudin, K.N.; Umami, I.M. Land use and management effects on volcanic soils in West Sumatra, Indonesia. Geoderma Reg. 2020, 22, e00308. [Google Scholar] [CrossRef]
- Rigby, D.; Cáceres, D. Organic farming and the sustainability of agricultural systems. Agric. Syst. 2001, 68, 21–40. [Google Scholar] [CrossRef]
- Moeskops, B.; Buchan, D.; Sleutel, S.; Herawaty, L.; Husen, E.; Saraswati, R.; Setyorini, D.; de Neve, S. Soil microbial communities and activities under intensive organic and conventional vegetable farming in West Java, Indonesia. Appl. Soil Ecol. 2010, 45, 112–120. [Google Scholar] [CrossRef]
- Lal, R. Soil carbon sequestration impacts on global climate change and food security. Science 2004, 304, 1623–1627. [Google Scholar] [CrossRef] [PubMed]
- Foley, J.A.; Ramankutty, N.; Brauman, K.A.; Cassidy, E.S.; Gerber, J.S.; Johnston, M.; Mueller, N.D.; O’Connell, C.; Ray, D.K.; West, P.C.; et al. Solutions for a cultivated planet. Nature 2011, 478, 337–342. [Google Scholar] [CrossRef]
- Bardgett, R.D.; van der Putten, W.H. Soil biodiversity and ecosystem functioning. Nature 2014, 515, 505–511. [Google Scholar] [CrossRef]
- Kim, D.Y.; Jackson, R.B. The effects of phosphorus on plant diversity and abundance. Ecol. Lett. 2019, 22, 1278–1288. [Google Scholar]
- Smith, J.A.; Brown, K.L. The impact of phosphorus on soil biodiversity: A review. J. Soil Sci. Environ. Manag. 2020, 11, 123–129. [Google Scholar]
- Gupta, V.; Roper, M.M. Influence of phosphorus availability on the biodiversity of microbial communities in soil. Soil Biol. Biochem. 2022, 154, 108111. [Google Scholar]
- Adams, F.G.; Moore, B. The role of potassium in plant stress response and ecological adaptation. Agric. Environ. Lett. 2020, 5, 12003. [Google Scholar]
- Clarke, J.D.; Baldwin, I.T. Potassium’s influence on plant-herbivore interactions: A synthesis. Plant Cell Environ. 2018, 41, 285–295. [Google Scholar]
- Lee, J.H.; Roberts, M.R. Potassium’s dual role in controlling plant stress responses and microbial activity. Soil Biol. Biochem. 2020, 141, 107682. [Google Scholar]
- Dalton, F.N. The role of electrical conductivity in soil-plant interactions. Plant Cell Environ. 2019, 12, 339–348. [Google Scholar]
- Rengasamy, P. Soil salinity and sodicity. Adv. Agron. 2018, 96, 353–384. [Google Scholar]
- Jose, S. Agroforestry for ecosystem services and environmental benefits: An overview. Agrofor. Syst. 2009, 76, 1–10. [Google Scholar] [CrossRef]
- Schoeneberger, M.M. Agroforestry: Working trees for sequestering carbon on agricultural lands. Agrofor. Syst. 2009, 75, 27–37. [Google Scholar] [CrossRef]
- Nair, P.K.R.; Saha, S.K.; Nair, V.D.; Haile, S.G. Potential for greenhouse gas emissions from soil carbon stock following biofuel cultivation on degraded lands. Land Degrad. Dev. 2011, 22, 395–409. [Google Scholar] [CrossRef]
- Lin, B.B. Agroforestry management as an adaptive strategy against potential microclimate extremes in coffee agriculture. Agric. For. Meteorol. 2007, 144, 85–94. [Google Scholar] [CrossRef]
- Garrity, D.P. Agroforestry and the achievement of the Millennium Development Goals. Agrofor. Syst. 2004, 61, 5–17. [Google Scholar]
- Nortcliff, S.; Hulpke, H.; Bannick, C.G.; Terytze, K.; Knoop, G.; Bredemeier, M.; Schulte-Bisping, H. Soil, 1. Definition, function, and utilization of soil. In Ullmann’s Encyclopedia of Industrial Chemistry; Wiley: Hoboken, NJ, USA, 2012. [Google Scholar]
- Hillel, D.; Hatfield, J.L. Encyclopedia of Soils in the Environment, 2nd ed.; Elsevier: Amsterdam, The Netherlands, 2023. [Google Scholar]
- Karlen, D.L.; Mausbach, M.J.; Doran, J.W.; Cline, R.G.; Harris, R.F.; Schuman, G.E. Soil quality: A concept, definition, and framework for evaluation. Soil Sci. Soc. Am. J. 1997, 61, 4–10. [Google Scholar] [CrossRef]
- Garrigues, E.; Corson, M.S.; Angers, D.A.; van der Werf, H.M.; Walter, C. Soil quality in Life Cycle Assessment: Towards development of an indicator. Ecol. Indic. 2012, 18, 434–442. [Google Scholar] [CrossRef]
- Kaplan, P. Sustainable Agriculture in Bali—Environmental Justice and Social Equality; Sage Publications: New York, NY, USA, 2020. [Google Scholar]
- Antara, M.; Sumarniasih, M.S. Role of tourism in economy of Bali and Indonesia. J. Tour. Hosp. Manag. 2017, 5, 34–44. [Google Scholar] [CrossRef]
- McTaggart, W. Forestry policy in Bali, Indonesia. Singapore J. Trop. Geogr. 1983, 4, 147–161. [Google Scholar] [CrossRef]
- Purbo-Hadiwidjojo, M. Geological Map of Bali 1: 250,000; Geological Survey of Indonesia: Jakarta, Indonesia, 1971. [Google Scholar]
- Macklin, P.A. Hydrological Drivers of Carbon Dioxide Cycling from Headwaters to the Coastal Ocean on a Tropical Island. Ph.D. Thesis, Southern Cross University, Lismore, Australia, 2019. [Google Scholar]
- Junqueira, A.B.; Stomph, T.J.; Clement, C.R.; Struik, P.C. Variation in soil fertility influences cycle dynamics and crop diversity in shifting cultivation systems. Agric. Ecosyst. Environ. 2016, 215, 122–132. [Google Scholar] [CrossRef]
- Lamidi, W.A.; Nwoke, O.C.; Shittu, K.A. Assessment of soil characteristics under four cropping and land management systems in south west Nigeria. Afr. J. Agric. Res. 2018, 13, 1400–1406. [Google Scholar]
- Dwiyani, R. The Soil of Bali Island and potentials for Farming; National Coordinating Agency for Survey and Mapping: Jakarta, Indonesia, 2007. [Google Scholar]
- Campera, M.; Chavez, J.; Humber, C.; Jain, V.; Cioci, H.; Aulia, F.; Alua, K.A.; Prawerti, D.A.D.; Ali, S.R.R.; Swastika, I.W. Impact of cropland management on invertebrate richness and abundance in agroforestry systems in Bali, Indonesia. Land 2024, 13, 493. [Google Scholar] [CrossRef]
- Whitten, T.; Soeriaatmadja, R.E.; Afiff, S.A. Ecology of Java and Bali; Oxford University Press: Oxford, UK, 1996. [Google Scholar]
- García, G.V.; Campos, M.E.; Wyngaard, N.; Reussi-Calvo, N.I.; San Martino, S.; Covacevich, F.; Studdert, G.A. Anaerobically mineralized nitrogen within macroaggregates as a soil health indicator. Catena 2021, 198, 105034. [Google Scholar] [CrossRef]
- BPS Nama-Nama Sungai dan Panjangnya Menurut Kabupaten/kota di Provinsi Bali. Badan Pusat Statistik Kabupaten Jembrana. 2023. Available online: https://jembranakab.bps.go.id/statictable/2023/03/31/136/-nama-nama-sungai-dan-panjangnya-menurut-kabupaten-kota-di-provinsi-bali.html (accessed on 5 May 2024).
- Alongi, D.M.; Bouillon, S.; Duarte, C.; Ramanathan, A.; Robertson, A.I. Carbon and nutrient fluxes across tropical river-coastal boundaries. In Biogeochemical Dynamics at Major River-Coastal Interfaces: Linkages with Global Change; Cambridge University Press: Cambridge, UK, 2013; pp. 373–394. [Google Scholar]
- Adyasari, D.; Oehler, T.; Afiati, N.; Moosdorf, N. Groundwater nutrient inputs into an urbanized tropical estuary system in Indonesia. Sci. Total Environ. 2018, 627, 1066–1079. [Google Scholar] [CrossRef]
- Chavez, J.; Nijman, V. Conservation, trade and (lack of) management of Sunda pangolins in Bali and Lombok. Pac. Conserv. Biol. 2024, 30, PC24017. [Google Scholar] [CrossRef]
- Patrignani, A.; Ochsner, T.E. Canopeo: A powerful new tool for measuring fractional green canopy cover. Agron. J. 2015, 107, 2312–2320. [Google Scholar] [CrossRef]
- Campera, M.; Balestri, M.; Manson, S.; Hedger, K.; Ahmad, N.; Adinda, E.; Nijman, V.; Budiadi, B.; Imron, M.A.; Nekaris, K.A.I. Shade trees and agrochemical use affect butterfly assemblages in coffee home gardens. Agric. Ecosyst. Environ. 2021, 319, 107547. [Google Scholar] [CrossRef]
- Bhardwaj, K.K.; Yadav, R.; Goyal, V.; Sharma, M.K.; Ahlawat, K.S. Role of agroforestry systems in enrichment of soil organic carbon and nutrients: A review. Environ. Conserv. J. 2024, 25, 289–296. [Google Scholar]
- Tornquist, C.G.; Hons, F.M.; Feagley, S.E.; Haggar, J. Agroforestry system effects on soil characteristics of the Sarapiquı region of Costa Rica. Agric. Ecosyst. Environ. 1999, 73, 19–28. [Google Scholar] [CrossRef]
- Manson, S.; Nekaris, K.A.I.; Rendell, A.; Budiadi, B.; Imron, M.A.; Campera, M. Agrochemicals and shade complexity affect soil quality in coffee home gardens. Earth 2022, 3, 853–865. [Google Scholar] [CrossRef]
- Sparks, D.L.; Page, A.L.; Helmke, P.A.; Loeppert, R.H.; Soltanpour, P.N.; Tabatabai, M.A.; Johnston, C.T.; Sumner, M.E. Methods of Soil Analysis, Part 3–Chemical Methods; Soil Science Society of America Inc.: Madison, WI, USA, 1996. [Google Scholar]
- Jones, J.; Savin, M.C.; Rom, C.R.; Gbur, E. Soil microbial and nutrient responses over seven years of organic apple orchard maturation. Nutr. Cycl. Agroecosyst. 2020, 118, 23–38. [Google Scholar] [CrossRef]
- Johnson, M.A.; Ruiz-Diaz, C.P.; Manoukis, N.C.; Rodrigues, J.C.V. Coffee berry borer (Hypothenemus hampei), a global pest of coffee: Perspectives from historical and recent invasions, and future priorities. Insects 2020, 11, 882. [Google Scholar] [CrossRef] [PubMed]
- Qu, J.; Li, Y.; Bi, F.; Liu, X.; Dong, Z.; Fan, H.; Yin, M.; Fu, L.; Cao, W.; Zhang, Y. Smooth vetch (Vicia villosa var.) coupled with ball-milled composite mineral derived from shell powder and Phosphate rock for remediation of Cadmium-polluted farmland: Insights into synergetic mechanisms. ACS EST Eng. 2024, 4, 2054–2067. [Google Scholar] [CrossRef]
- Qu, J.; Li, Z.; Wang, S.; Lin, Q.; Zhang, Z.; Wu, Z.; Hu, Q.; Jiang, Z.; Tao, Y.; Zhang, Y. Enhanced degradation of atrazine from soil with recyclable magnetic carbon-based bacterial pellets: Performance and mechanism. Chem. Eng. J. 2024, 490, 151662. [Google Scholar] [CrossRef]
- Banerjee, S.; Helgason, B.; Wang, L.; Winsley, T.; Ferrari, B.C.; Siciliano, S.D. Legacy effects of soil moisture on microbial community structure and N2O emissions. Soil Biol. Biochem. 2016, 95, 40–50. [Google Scholar] [CrossRef]
- Xu, X.; Thornton, P.E.; Post, W.M. A global analysis of soil microbial biomass carbon, nitrogen and phosphorus in terrestrial ecosystems. Glob. Ecol. Biogeogr. 2013, 22, 737–749. [Google Scholar] [CrossRef]
- Lange, M.; Eisenhauer, N.; Sierra, C.A.; Bessler, H.; Engels, C.; Griffiths, R.I.; Mellado-Vázquez, P.G.; Malik, A.A.; Roy, J.; Scheu, S.; et al. Plant diversity increases soil microbial activity and soil carbon storage. Nat. Commun. 2015, 6, 6707. [Google Scholar] [CrossRef] [PubMed]
- Cardinale, B.J.; Duffy, J.E.; Gonzalez, A.; Hooper, D.U.; Perrings, C.; Venail, P.; Narwani, A.; Mace, G.M.; Tilman, D.; Wardle, D.A.; et al. Biodiversity loss and its impact on humanity. Nature 2012, 486, 59–67. [Google Scholar] [CrossRef] [PubMed]
- Mäder, P.; Fliessbach, A.; Dubois, D.; Gunst, L.; Fried, P.; Niggli, U. Soil fertility and biodiversity in organic farming. Science 2002, 296, 1694–1697. [Google Scholar] [CrossRef]
- Giller, K.E.; Witter, E.; McGrath, S.P. Heavy metals and soil microbes. Soil Biol Biochem. 2009, 41, 2031–2037. [Google Scholar] [CrossRef]
- Bengtsson, J.; Ahnström, J.; Weibull, A.C. The effects of organic agriculture on biodiversity and abundance: A meta-analysis. J. Appl. Ecol. 2005, 42, 261–269. [Google Scholar] [CrossRef]
- Roberts, D.P.; Mattoo, A.K. Sustainable agriculture—Enhancing environmental benefits, food nutritional quality and building crop resilience to abiotic and biotic stresses. Agriculture 2018, 8, 8. [Google Scholar] [CrossRef]
- Simoni, S.; Caruso, G.; Vignozzi, N.; Gucci, R.; Valboa, G.; Pellegrini, S.; Palai, G.; Goggioli, D.; Gagnarli, E. Effect of long-term soil management practices on tree growth, yield and soil biodiversity in a high-density olive agro-ecosystem. Agronomy 2021, 11, 1036. [Google Scholar] [CrossRef]
- Gomez, F.; Carcedo, A.; Mean, C.M.; Reyes, M.; Hok, L.; Tivet, F.; Seng, V.; Vara Prasad, P.V.; Ciampitti, I. A dataset for soil organic carbon in agricultural systems for the Southeast Asia region. Sci. Data 2024, 11, 374. [Google Scholar] [CrossRef]
- Ishizuka, S.; Iswandi, A.; Nakajima, Y.; Yonemura, S.; Sudo, S.; Tsuruta, H.; Murdiyarso, D. The variation of greenhouse gas emissions from soils of various land-use/cover types in Jambi province, Indonesia. Nutr. Cycl. Agroecosyst. 2005, 71, 17–32. [Google Scholar] [CrossRef]
- Abou Rajab, Y.; Leuschner, C.; Barus, H.; Tjoa, A.; Hertel, D. Cacao cultivation under diverse shade tree cover allows high carbon storage and sequestration without yield losses. PLoS ONE 2016, 11, 0149949. [Google Scholar] [CrossRef] [PubMed]
- Fujii, K.; Ichinose, Y.; Arai, K.; Komatsu, K.; Hayakawa, C.; de Guzman Alvindia, D.; Watanabe, K.; Hartono, A. Effects of soil types and fertility management practices on soil silicon availability and banana silicon uptake. Soil Sci. Plant Nutr. 2023, 69, 183–189. [Google Scholar] [CrossRef]
- Gusli, S.; Sumeni, S.; Sabodin, R.; Muqfi, I.H.; Nur, M.; Hairiah, K.; Useng, D.; Van Noordwijk, M. Soil organic matter, mitigation of and adaptation to climate change in cocoa–based agroforestry systems. Land 2020, 9, 323. [Google Scholar] [CrossRef]
- Muktamar, Z.; Nurliana, S.; Aningtias, H.; Anugrah, P.M. Soil organic carbon in forest and other land use types at Bengkulu City, Indonesia. J. Manaj. Hutan Trop. 2021, 27, 184. [Google Scholar]
- Hairiah, K.; Sulistyani, H.; Suprayogo, D.; Purnomosidhi, P.; Widodo, R.H.; Van Noordwijk, M. Litter layer residence time in forest and coffee agroforestry systems in Sumberjaya, West Lampung. For. Ecol. Manag. 2006, 224, 45–57. [Google Scholar] [CrossRef]
- Handayani, I.P.; Prawiton, P.; Ihsan, M. Soil changes associated with Imperata cylindrica grassland conversion in Indonesia. Int. J. Soil Sci. 2012, 7, 61. [Google Scholar] [CrossRef]
- Hertel, D.; Harteveld, M.A.; Leuschner, C. Conversion of a tropical forest into agroforest alters the fine root-related carbon flux to the soil. Soil Biol. Biochem. 2009, 41, 481–490. [Google Scholar] [CrossRef]
- Silvianingsih, Y.A.; Hairiah, K.; Suprayogo, D.; van Noordwijk, M. Kaleka agroforest in Central Kalimantan (Indonesia): Soil quality, hydrological protection of adjacent peatlands, and sustainability. Land 2021, 10, 856. [Google Scholar] [CrossRef]
- Duffy, C.; Toth, G.G.; Hagan, R.P.; McKeown, P.C.; Rahman, S.A.; Widyaningsih, Y.; Sunderland, T.C.; Spillane, C. Agroforestry contributions to smallholder farmer food security in Indonesia. Agrofor. Syst. 2021, 95, 1109–1124. [Google Scholar] [CrossRef]
- Schloter, M.; Nannipieri, P.; Sørensen, S.J.; van Elsas, J.D. Microbial indicators for soil quality. Biol. Fertil. Soils 2018, 54, 1–10. [Google Scholar] [CrossRef]
- Birhane, E.; Ahmed, S.; Hailemariam, M.; Negash, M.; Rannestad, M.M.; Norgrove, L. Carbon stock and woody species diversity in homegarden agroforestry along an elevation gradient in southern Ethiopia. Agrofor. Syst. 2020, 94, 1099–1110. [Google Scholar] [CrossRef]
- Verbist, B.; Poesen, J.; van Noordwijk, M.; Suprayogo, D.; Agus, F.; Deckers, J. Factors affecting soil loss at plot scale and sediment yield at catchment scale in a tropical volcanic agroforestry landscape. Catena 2010, 80, 34–46. [Google Scholar] [CrossRef]
- Sardiana, I.K.; Susila, D.; Supadma, A.A.; Saifulloh, M. Soil fertility evaluation and land management of dryland farming at Tagallalang sub-district, Gianyar regency, Bali, Indonesia. IOP Conf. Ser. Earth Environ. Sci. 2017, 98, 012043. [Google Scholar] [CrossRef]
- Maurya, S.; Abraham, J.S.; Somasundaram, S.; Toteja, R.; Gupta, R.; Makhija, S. Indicators for assessment of soil quality: A mini-review. Environ. Monit. Assess. 2020, 192, 604. [Google Scholar] [CrossRef]
- Estrada-Herrera, I.R.; Hidalgo-Moreno, C.; Guzmán-Plazola, R.; Almaraz Suárez, J.J.; Navarro-Garza, H.; Etchevers-Barra, J.D. Soil quality indicators to evaluate soil fertility. Agrociencia 2017, 51, 813–831. [Google Scholar]

| Parameter | Extraction | Measurement |
|---|---|---|
| Available P (ppm) | Bray-1 method | Spectrophometry UV-VIS |
| Available K (ppm) | Bray-1 method | Atomic Absorption Spectrophotometer |
| pH soil | H2O | pH meter |
| Total N (%) | Kjeldhall method | Titration |
| Organic Carbon (%) Conductivity (mS/cm) Total microbes | Walkley and Black method See text | Spectrophometry UV-VIS EC meter |
| Rustic | Polyculture | |||
|---|---|---|---|---|
| Variables | Topsoil 0 to 5 cm | Subsoil 10 to 15 cm | Topsoil 0 to 5 cm | Subsoil 10 to 15 cm |
| pH | 6.56 ± 0.11 | 6.59 ± 0.12 | 6.59 ± 0.15 | 6.51 ± 0.19 |
| Conductivity (mS/cm) | 0.61 ± 0.033 | 0.44 ± 0.19 | 0.77 ± 1.43 | 0.36 ± 0.18 |
| Organic C (%) | 3.17 ± 0.81 | 2.59 ± 0.57 | 2.46 ± 1.08 | 1.97 ± 0.71 |
| Total N (%) | 0.17 ± 0.08 | 0.17 ± 0.05 | 0.19 ± 0.06 | 0.15 ± 0.04 |
| C:N ratio | 32.34 ± 39.08 | 17.17 ± 7.62 | 13.66 ± 6.05 | 13.52 ± 6.17 |
| Available P (ppm) | 2.53 ± 2.84 | 2.61 ± 2.33 | 12.46 ± 13.36 | 14.83 ± 13.83 |
| Available K (ppm) | 174.04 ± 73.53 | 173.93 ± 71.17 | 244.76 ± 70.68 | 238.37 ± 73.58 |
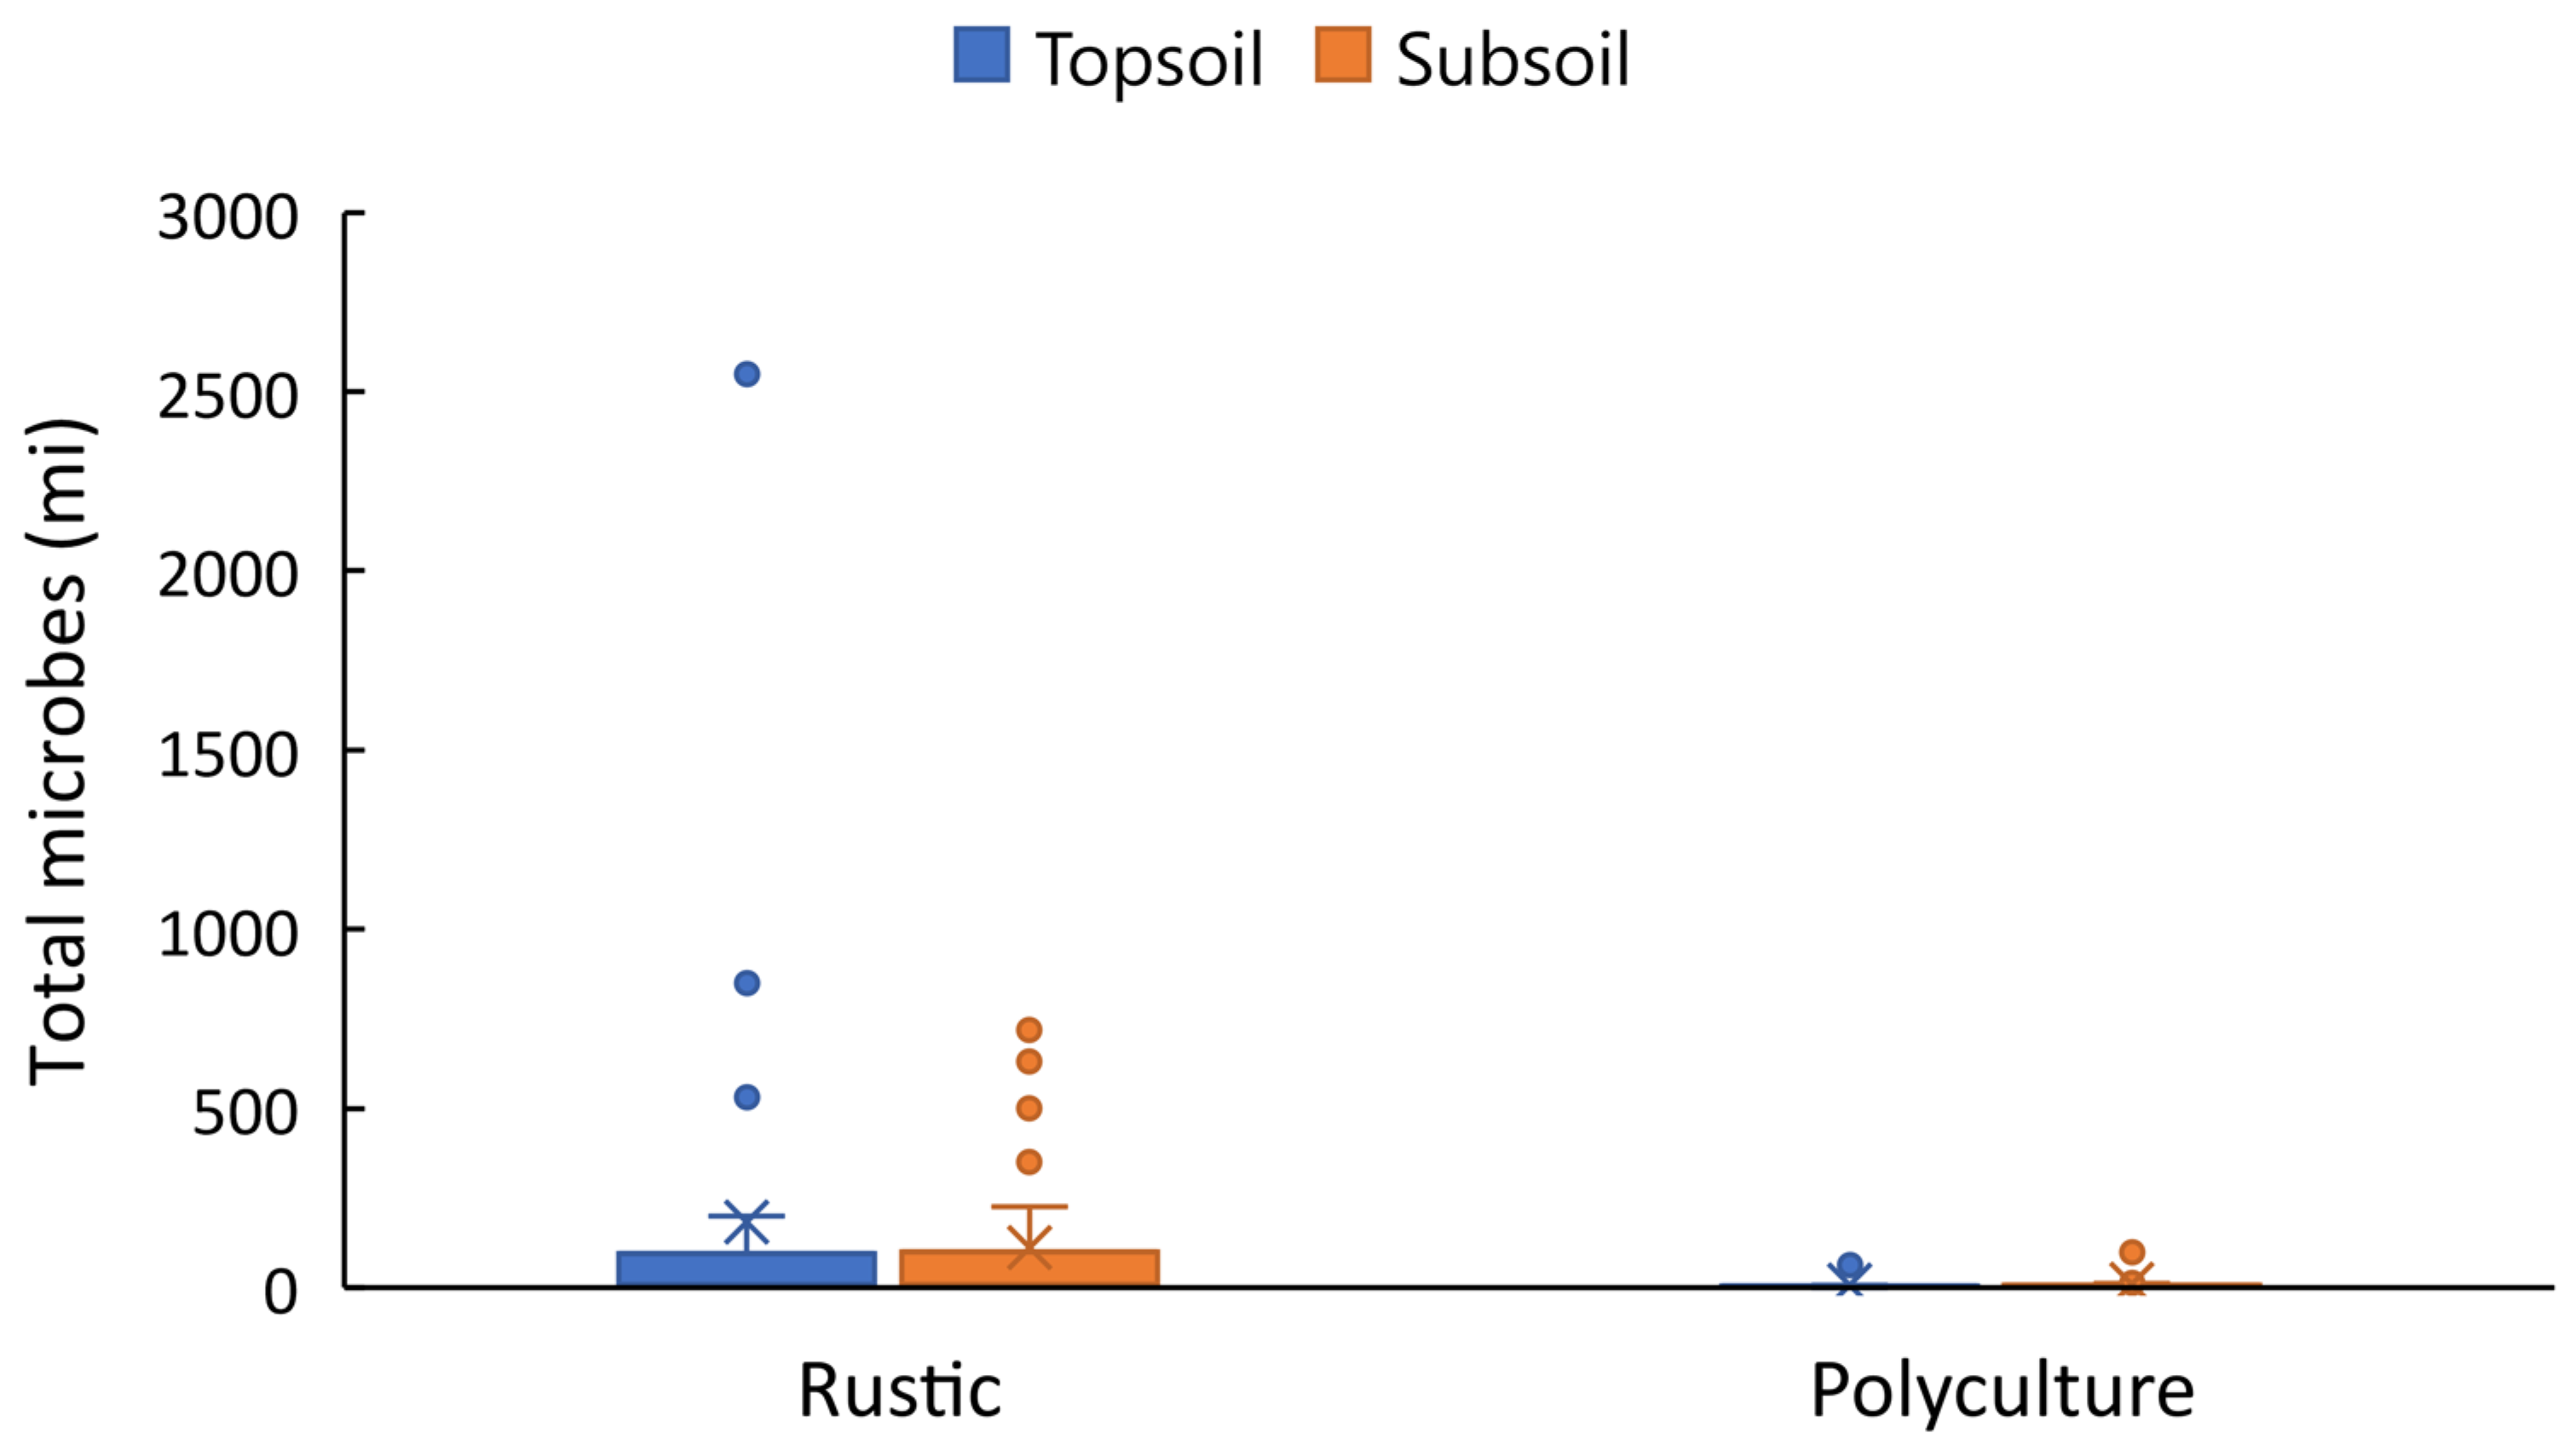
| Total microbes (x million) | 88.50 ± 194.07 | 110.35 ± 204.92 | 5.79 ± 13.00 | 9.52 ± 20.44 |
| Factor | Mean | Std | Minimum | Maximum |
|---|---|---|---|---|
| Canopy cover (%) | 29.2 | 19.0 | 0.5 | 71.9 |
| Crop richness (n) | 4.7 | 1.5 | 2.0 | 9.0 |
| Tree richness (n) | 2.1 | 2.2 | 0.0 | 7.0 |
| Yields (USD/plot) | 300.9 | 324.7 | 14.7 | 1844.3 |
| Response | Factor | Beta | Std Error | Z Value | p Value |
|---|---|---|---|---|---|
| Topsoil (0–5 cm) | |||||
| C:N ratio | Agroforestry system a | 18.68 | 8.44 | 2.12 | 0.027 |
| Conductivity | Crop richness | 0.14 | 0.05 | 2.67 | 0.008 |
| Tree richness | 0.51 | 0.07 | 7.03 | <0.001 | |
| K | Tree richness | −19.03 | 4.39 | −4.34 | <0.001 |
| Organic C | Agroforestry system a | 0.70 | 0.27 | 2.62 | 0.009 |
| P | Agroforestry system a | −0.13 | 0.04 | −3.36 | <0.001 |
| Yields | −1.57 × 10⁻⁴ | 0.318 × 10⁻⁴ | −5.03 | <0.001 | |
| Total microbes | Canopy cover | 0.04 | 0.01 | 3.43 | <0.001 |
| Tree richness | 0.45 | 0.12 | 3.63 | <0.001 | |
| Yields | −2.0 × 10⁻³ | 0.3 × 10⁻³ | −6.24 | <0.001 | |
| Subsoil (10–15 cm) | |||||
| C:N ratio | Crop richness | −1.70 | 0.66 | −2.58 | 0.010 |
| Conductivity | Agroforestry system a | 0.28 | 0.10 | 2.81 | 0.005 |
| Yields | −1.86 × 10⁻⁴ | 0.80 × 10⁻⁴ | −2.33 | 0.020 | |
| K | Canopy cover | −1.10 | 0.55 | −1.99 | 0.047 |
| Tree richness | −11.54 | 4.70 | −2.45 | 0.014 | |
| N | Crop richness | 1.01 × 10⁻² | 0.44 × 10⁻² | 2.31 | 0.021 |
| Tree richness | 7.68 × 10⁻³ | 2.99 × 10⁻³ | 2.56 | 0.010 | |
| Organic C | Agroforestry system a | 0.62 | 0.18 | 3.42 | <0.001 |
| P | Canopy cover | 2.05 × 10⁻³ | 0.94 × 10⁻³ | 2.17 | 0.030 |
| Crop richness | −1.80 × 10⁻² | 0.72 × 10⁻² | −2.50 | 0.013 | |
| Tree richness | 3.38 × 10⁻² | 1.64 × 10⁻² | 2.07 | 0.039 | |
| Yields | −4.81 × 10⁻⁵ | 2.35 × 10⁻⁵ | −2.05 | 0.040 | |
| pH | Tree richness | 0.02 | 0.01 | 2.11 | 0.035 |
| Total microbes | Crop richness | 0.37 | 0.14 | 2.60 | 0.009 |
| Agroforestry system a | 2.99 | 0.42 | 7.06 | 0.001 | |
| Management Regime, Island | Depth (cm) | Soil Organic Carbon (Mean, g/kg) | Soil Organic Carbon (Mean, %) | pH Soil (Mean) | References |
|---|---|---|---|---|---|
| Agroforestry, Sumatra | 0–5 | 44.20 | 6.10 | [60] | |
| Agroforestry, Sulawesi | 0–10 | 20.95 | 5.67 | [61] | |
| Agroforestry, Java | 0–10 | 78.77 | 6.07 | [62] | |
| Agroforestry, Sulawesi | 0–10 | 15.13 | 4.18 | [63] | |
| Agroforestry, Sumatra | 0–10 | 21.34 | 2.06 | 4.98 | [64] |
| Agroforestry, Sumatra | 0–15 | 1.57 | 5.13 | [65] | |
| Agroforestry, Sumatra | 0–20 | 37.23 | 4.20 | [66] | |
| Agroforestry, Sulawesi | 0–20 | 1.60 | 3.95 | [67] | |
| Agroforestry, Borneo | 0–30 | 3.64 | 3.66 | [68] | |
| Agroforestry, Bali | 0–5 | 2.85 | 6.57 | This study | |
| Agroforestry, Bali | 10–15 | 2.31 | 6.55 | This study | |
| Agroforestry, Java | 0–30 | 3.45 | 5.34 | [41] |
Disclaimer/Publisher’s Note: The statements, opinions and data contained in all publications are solely those of the individual author(s) and contributor(s) and not of MDPI and/or the editor(s). MDPI and/or the editor(s) disclaim responsibility for any injury to people or property resulting from any ideas, methods, instructions or products referred to in the content. |
© 2024 by the authors. Licensee MDPI, Basel, Switzerland. This article is an open access article distributed under the terms and conditions of the Creative Commons Attribution (CC BY) license (https://creativecommons.org/licenses/by/4.0/).
Share and Cite
Chavez, J.; Nijman, V.; Sukmadewi, D.K.T.; Sadnyana, M.D.; Manson, S.; Campera, M. Impact of Farm Management on Soil Fertility in Agroforestry Systems in Bali, Indonesia. Sustainability 2024, 16, 7874. https://doi.org/10.3390/su16187874
Chavez J, Nijman V, Sukmadewi DKT, Sadnyana MD, Manson S, Campera M. Impact of Farm Management on Soil Fertility in Agroforestry Systems in Bali, Indonesia. Sustainability. 2024; 16(18):7874. https://doi.org/10.3390/su16187874
Chicago/Turabian StyleChavez, Jessica, Vincent Nijman, Desak Ketut Tristiana Sukmadewi, Made Dwi Sadnyana, Sophie Manson, and Marco Campera. 2024. "Impact of Farm Management on Soil Fertility in Agroforestry Systems in Bali, Indonesia" Sustainability 16, no. 18: 7874. https://doi.org/10.3390/su16187874