
Environmental Sustainability of the Removal of Alpaca Fiber Dye Using a Thermally Modified Sludge from a Drinking Water Treatment Facility

 , ,
, , 
Abstract
:1. Introduction
2. Materials and Methods
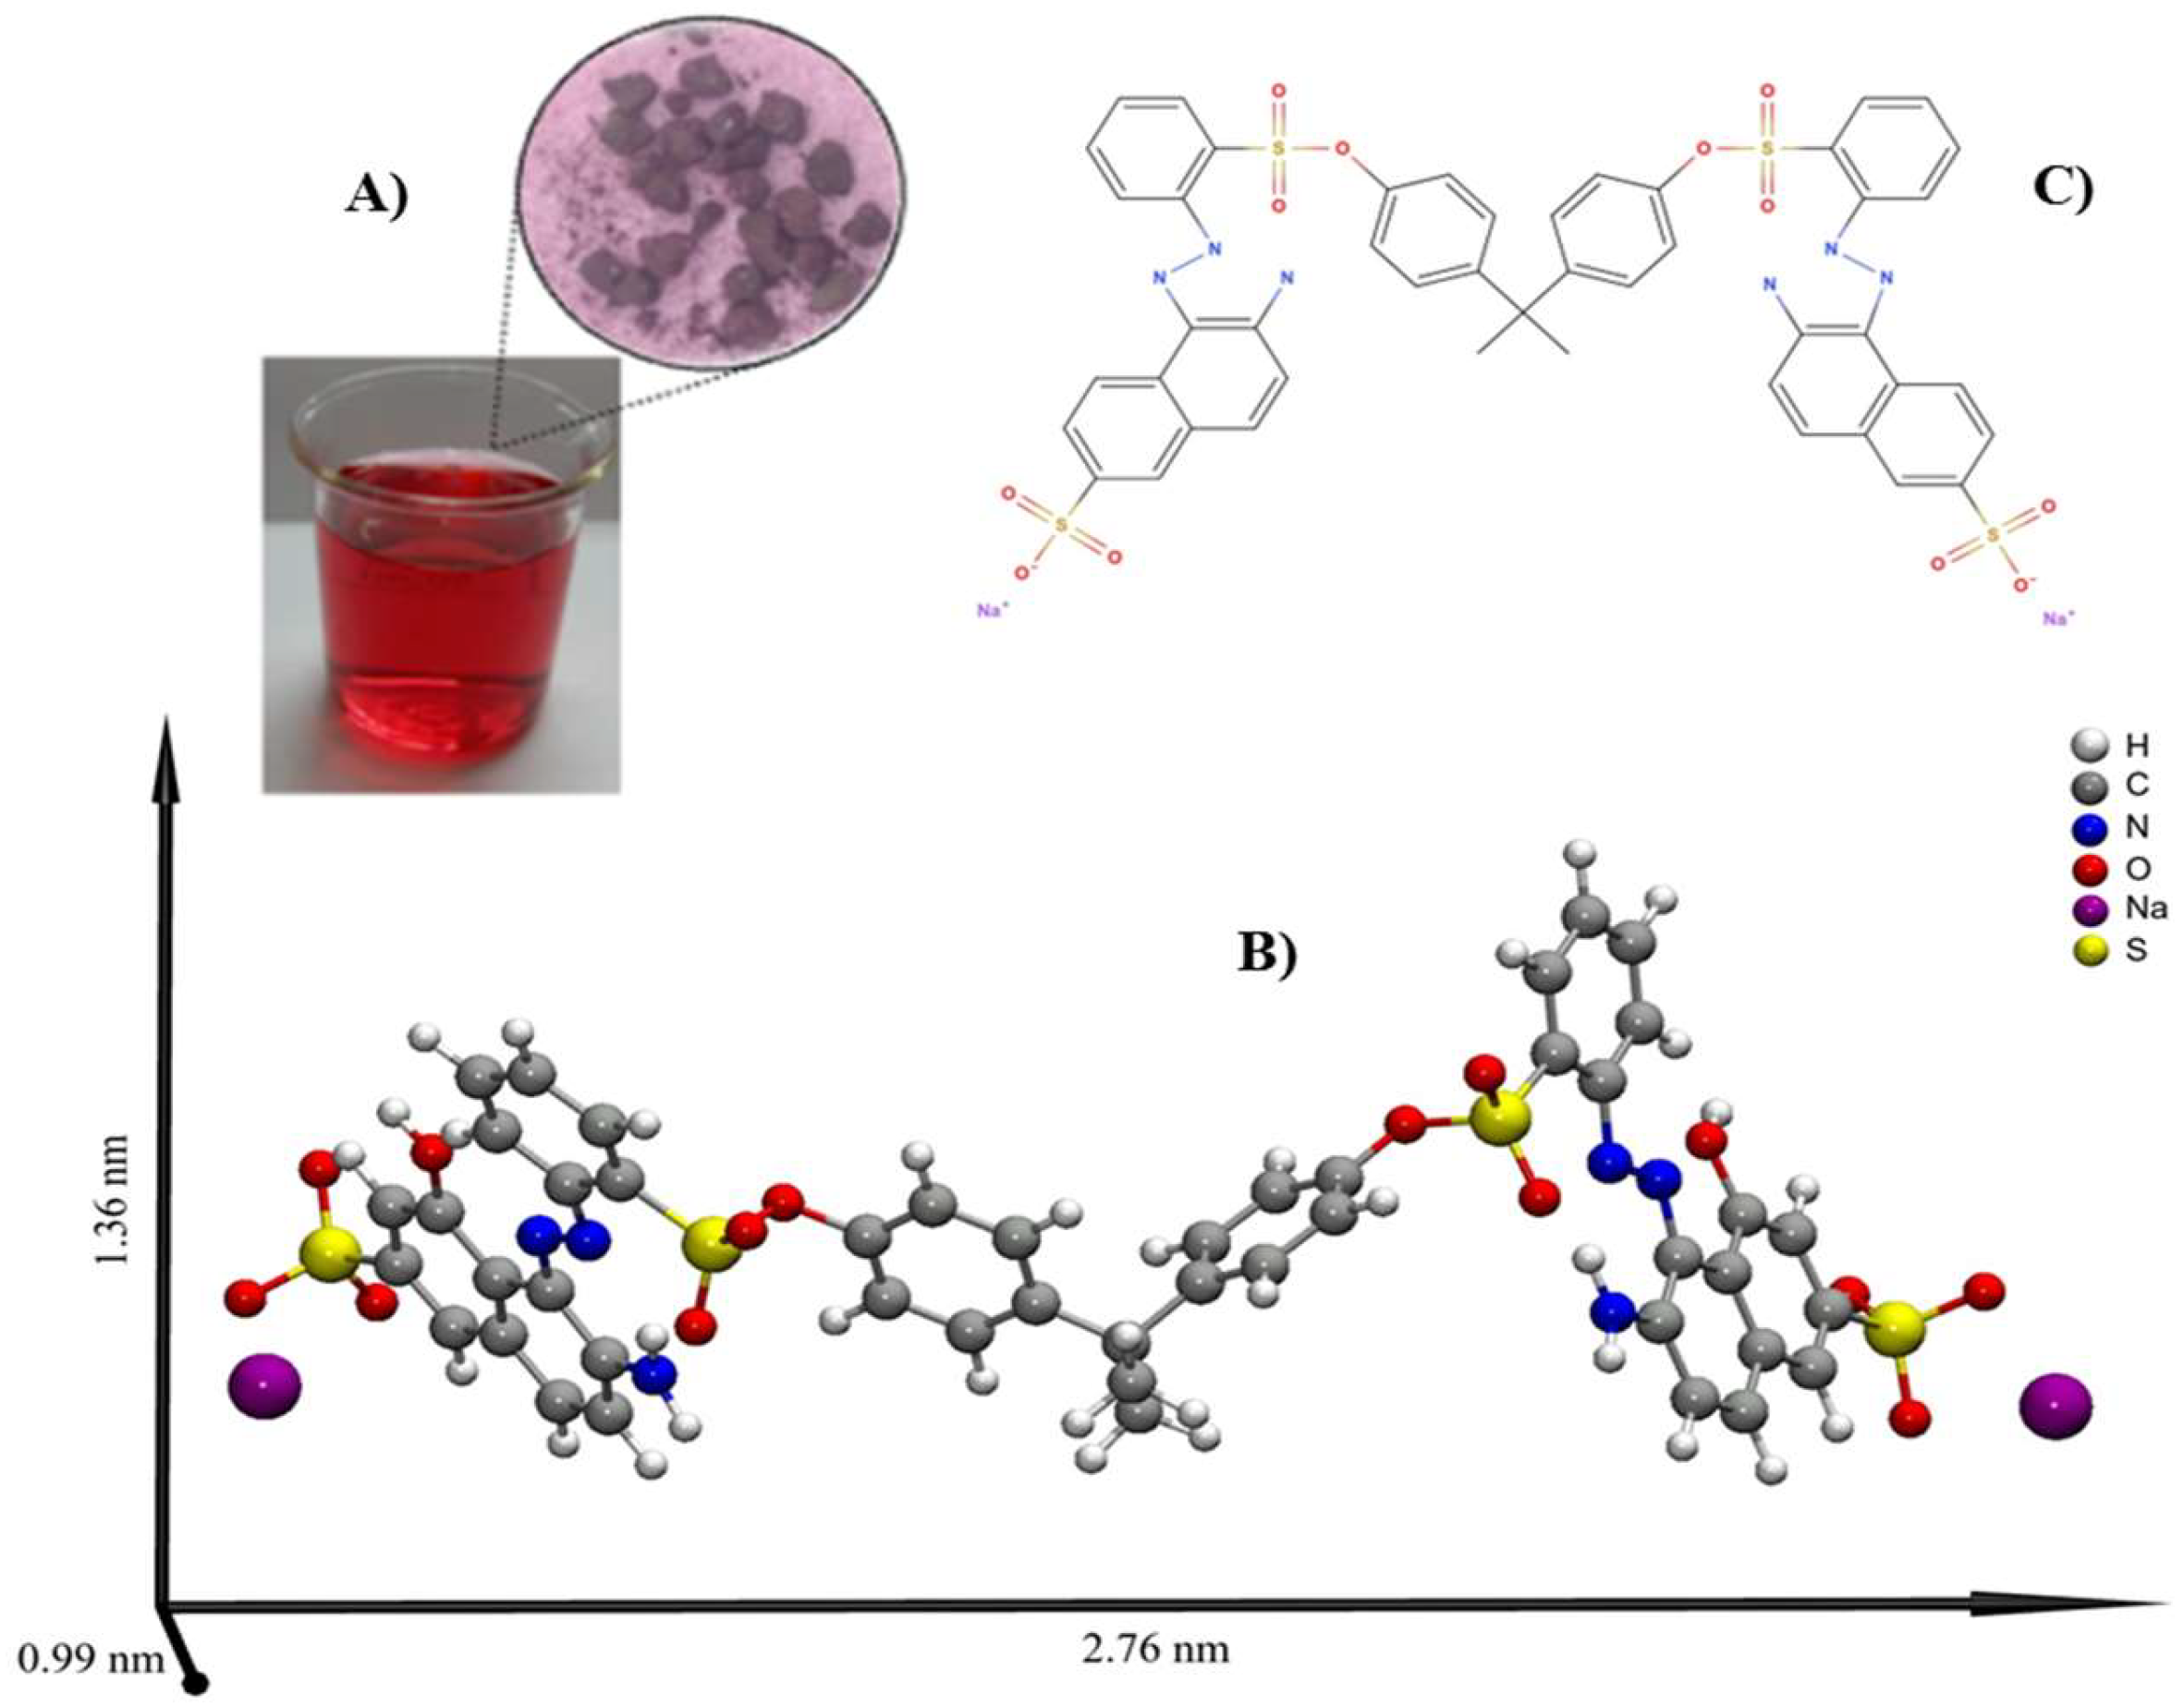
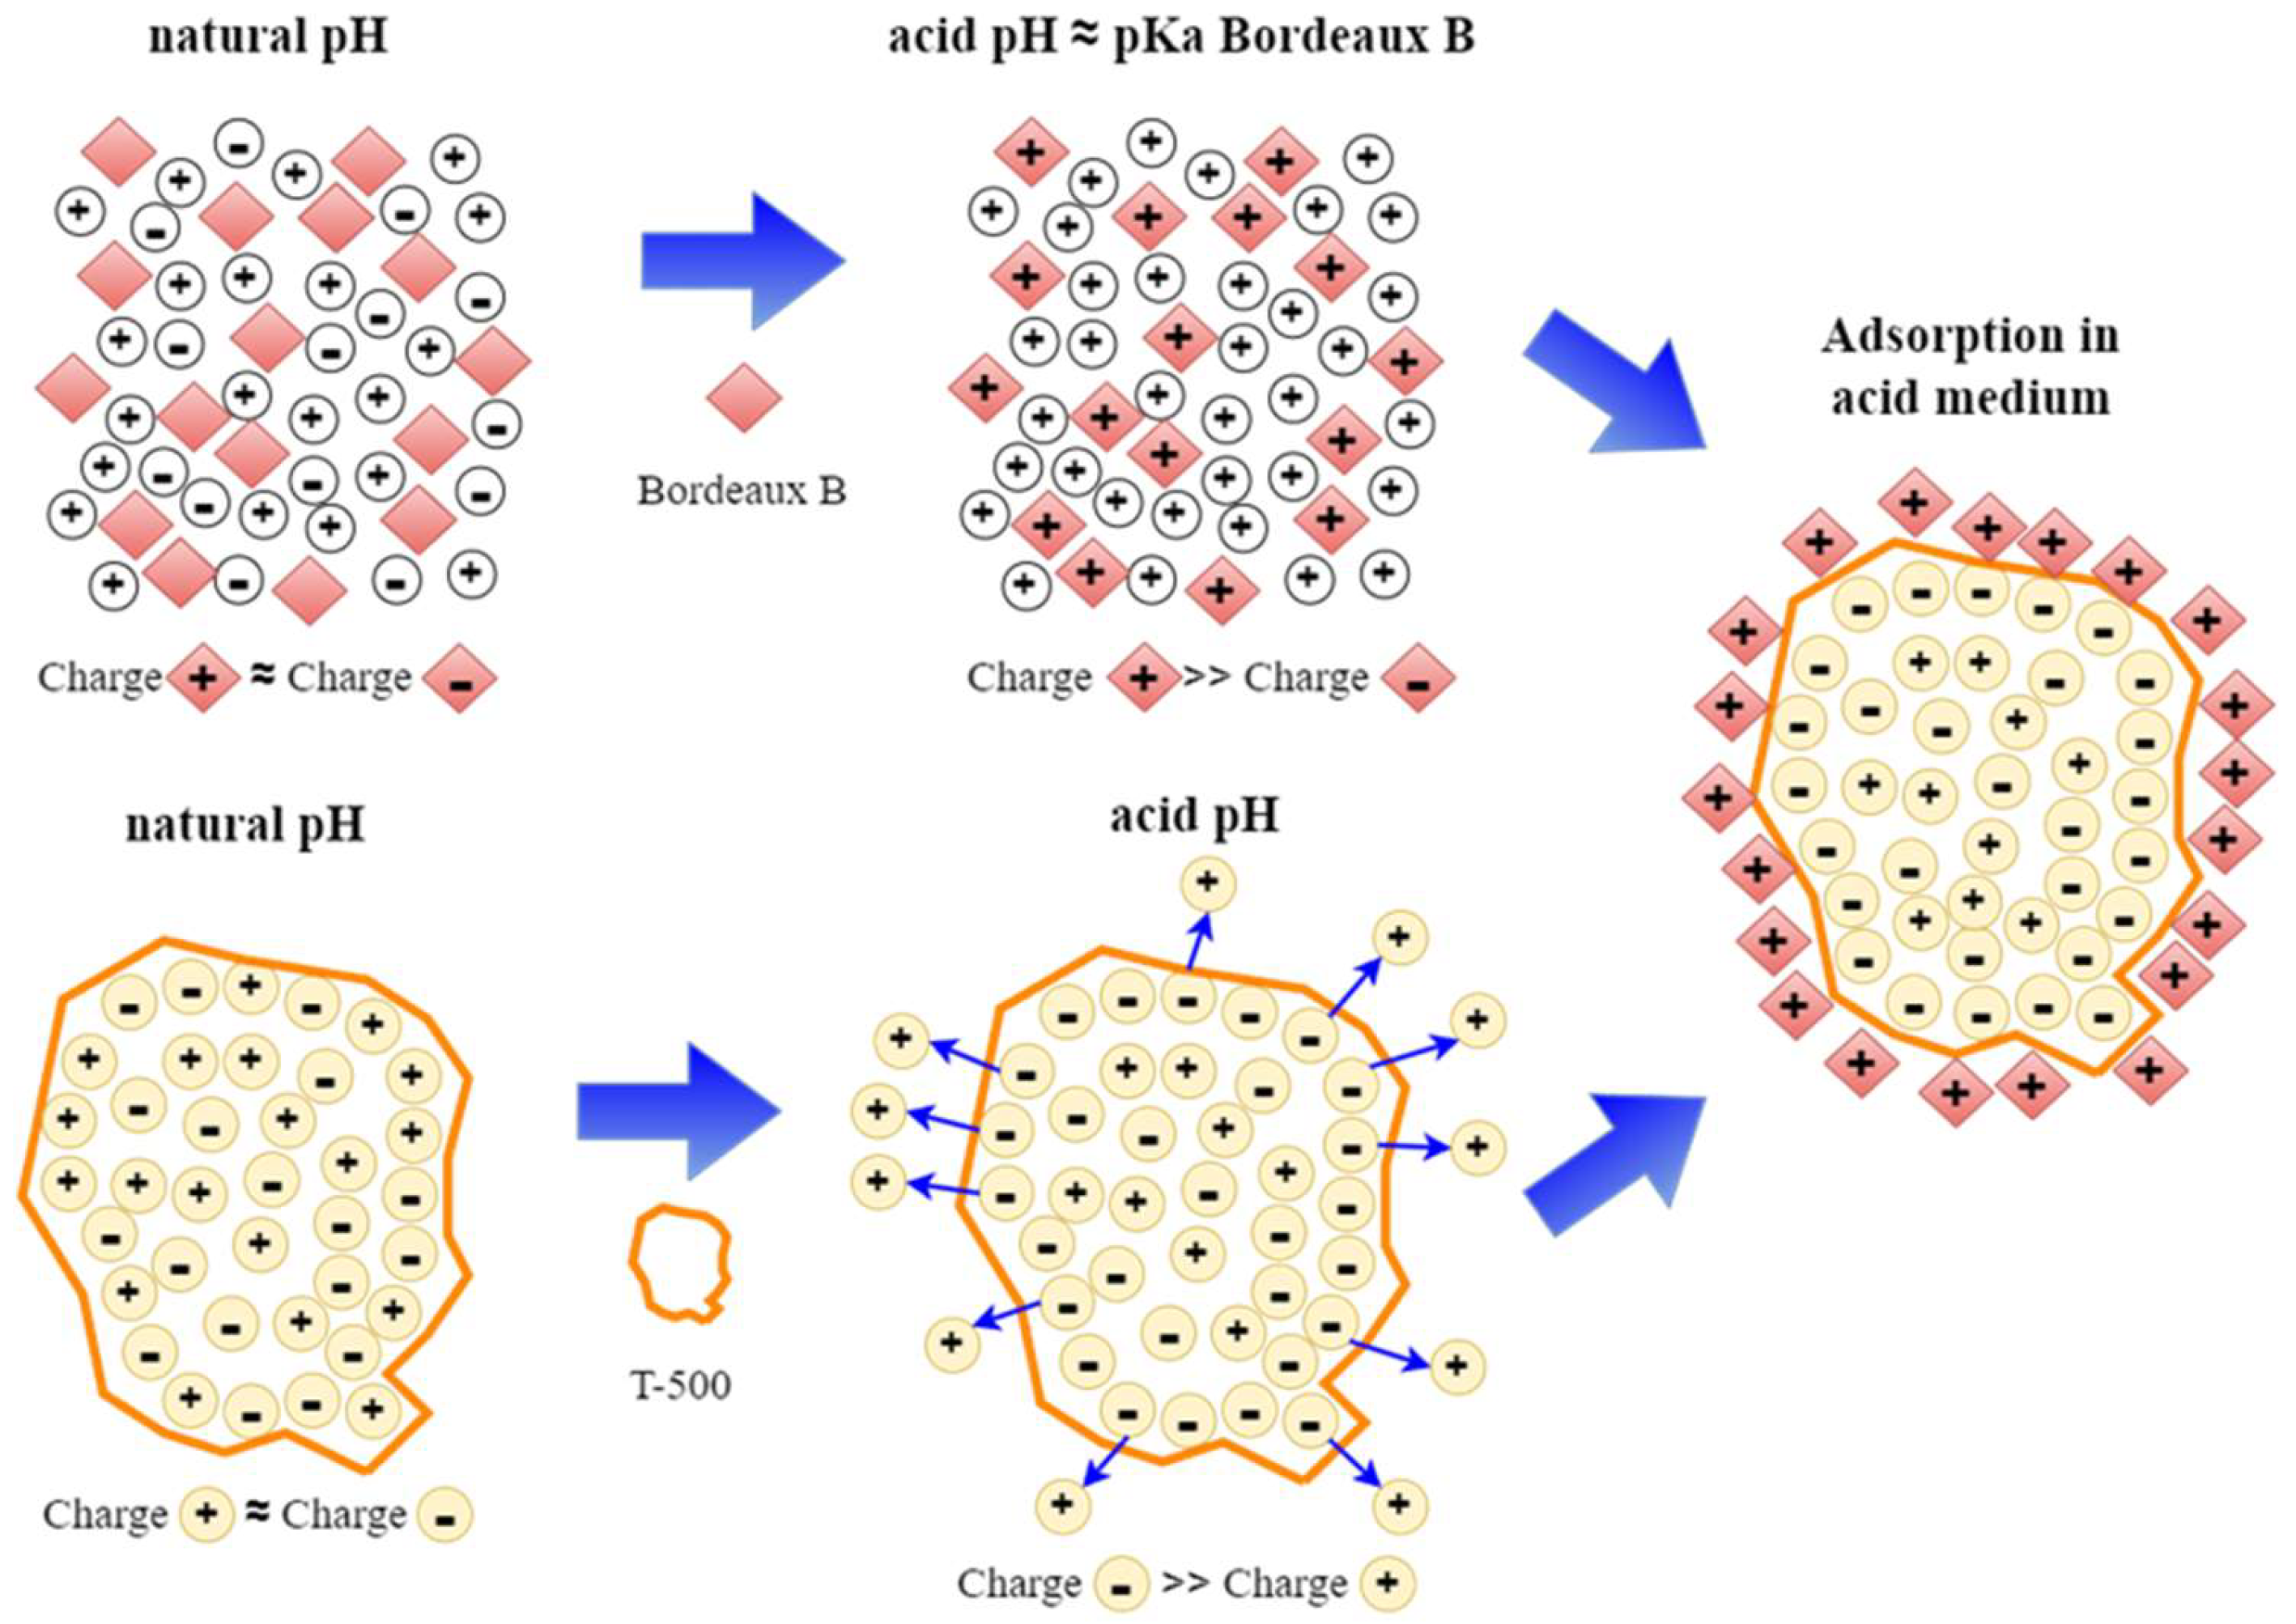
2.1. Molecular Structure of Bordeaux
2.2. Bordeaux B Dye Analysis
2.3. Adsorbent: Drinking Water Treatment Sludge (DWTS)
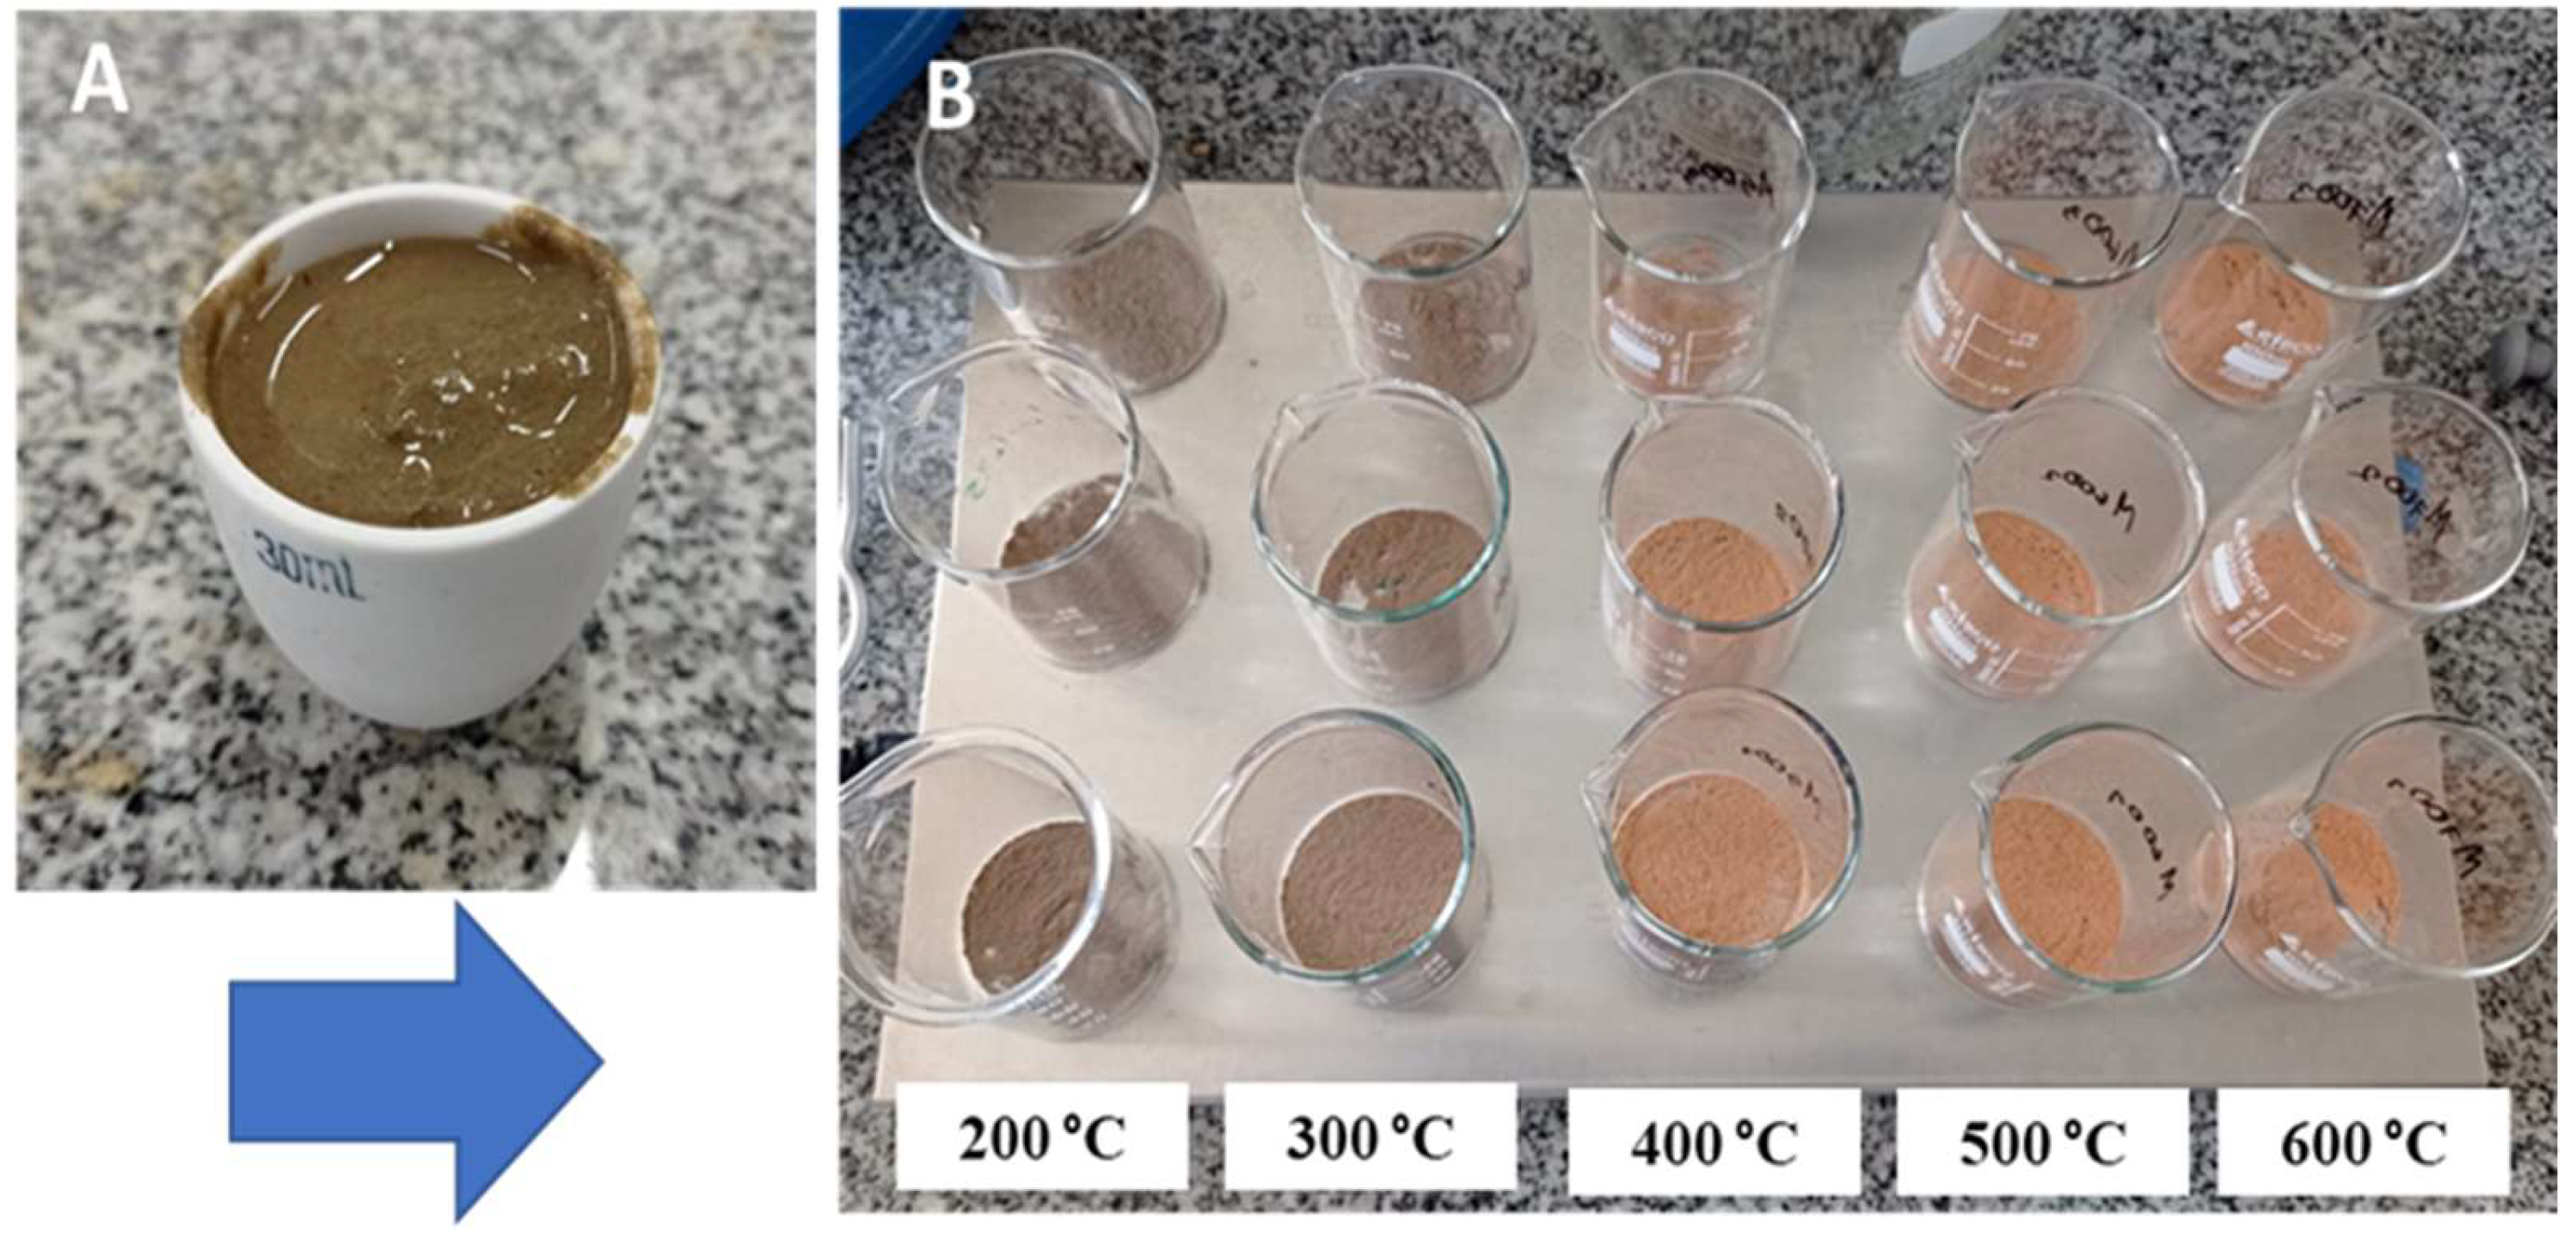
2.4. Thermal Modification
2.5. DWTS Characterization
2.6. Batch Adsorptions Test: Operation Variables
3. Results
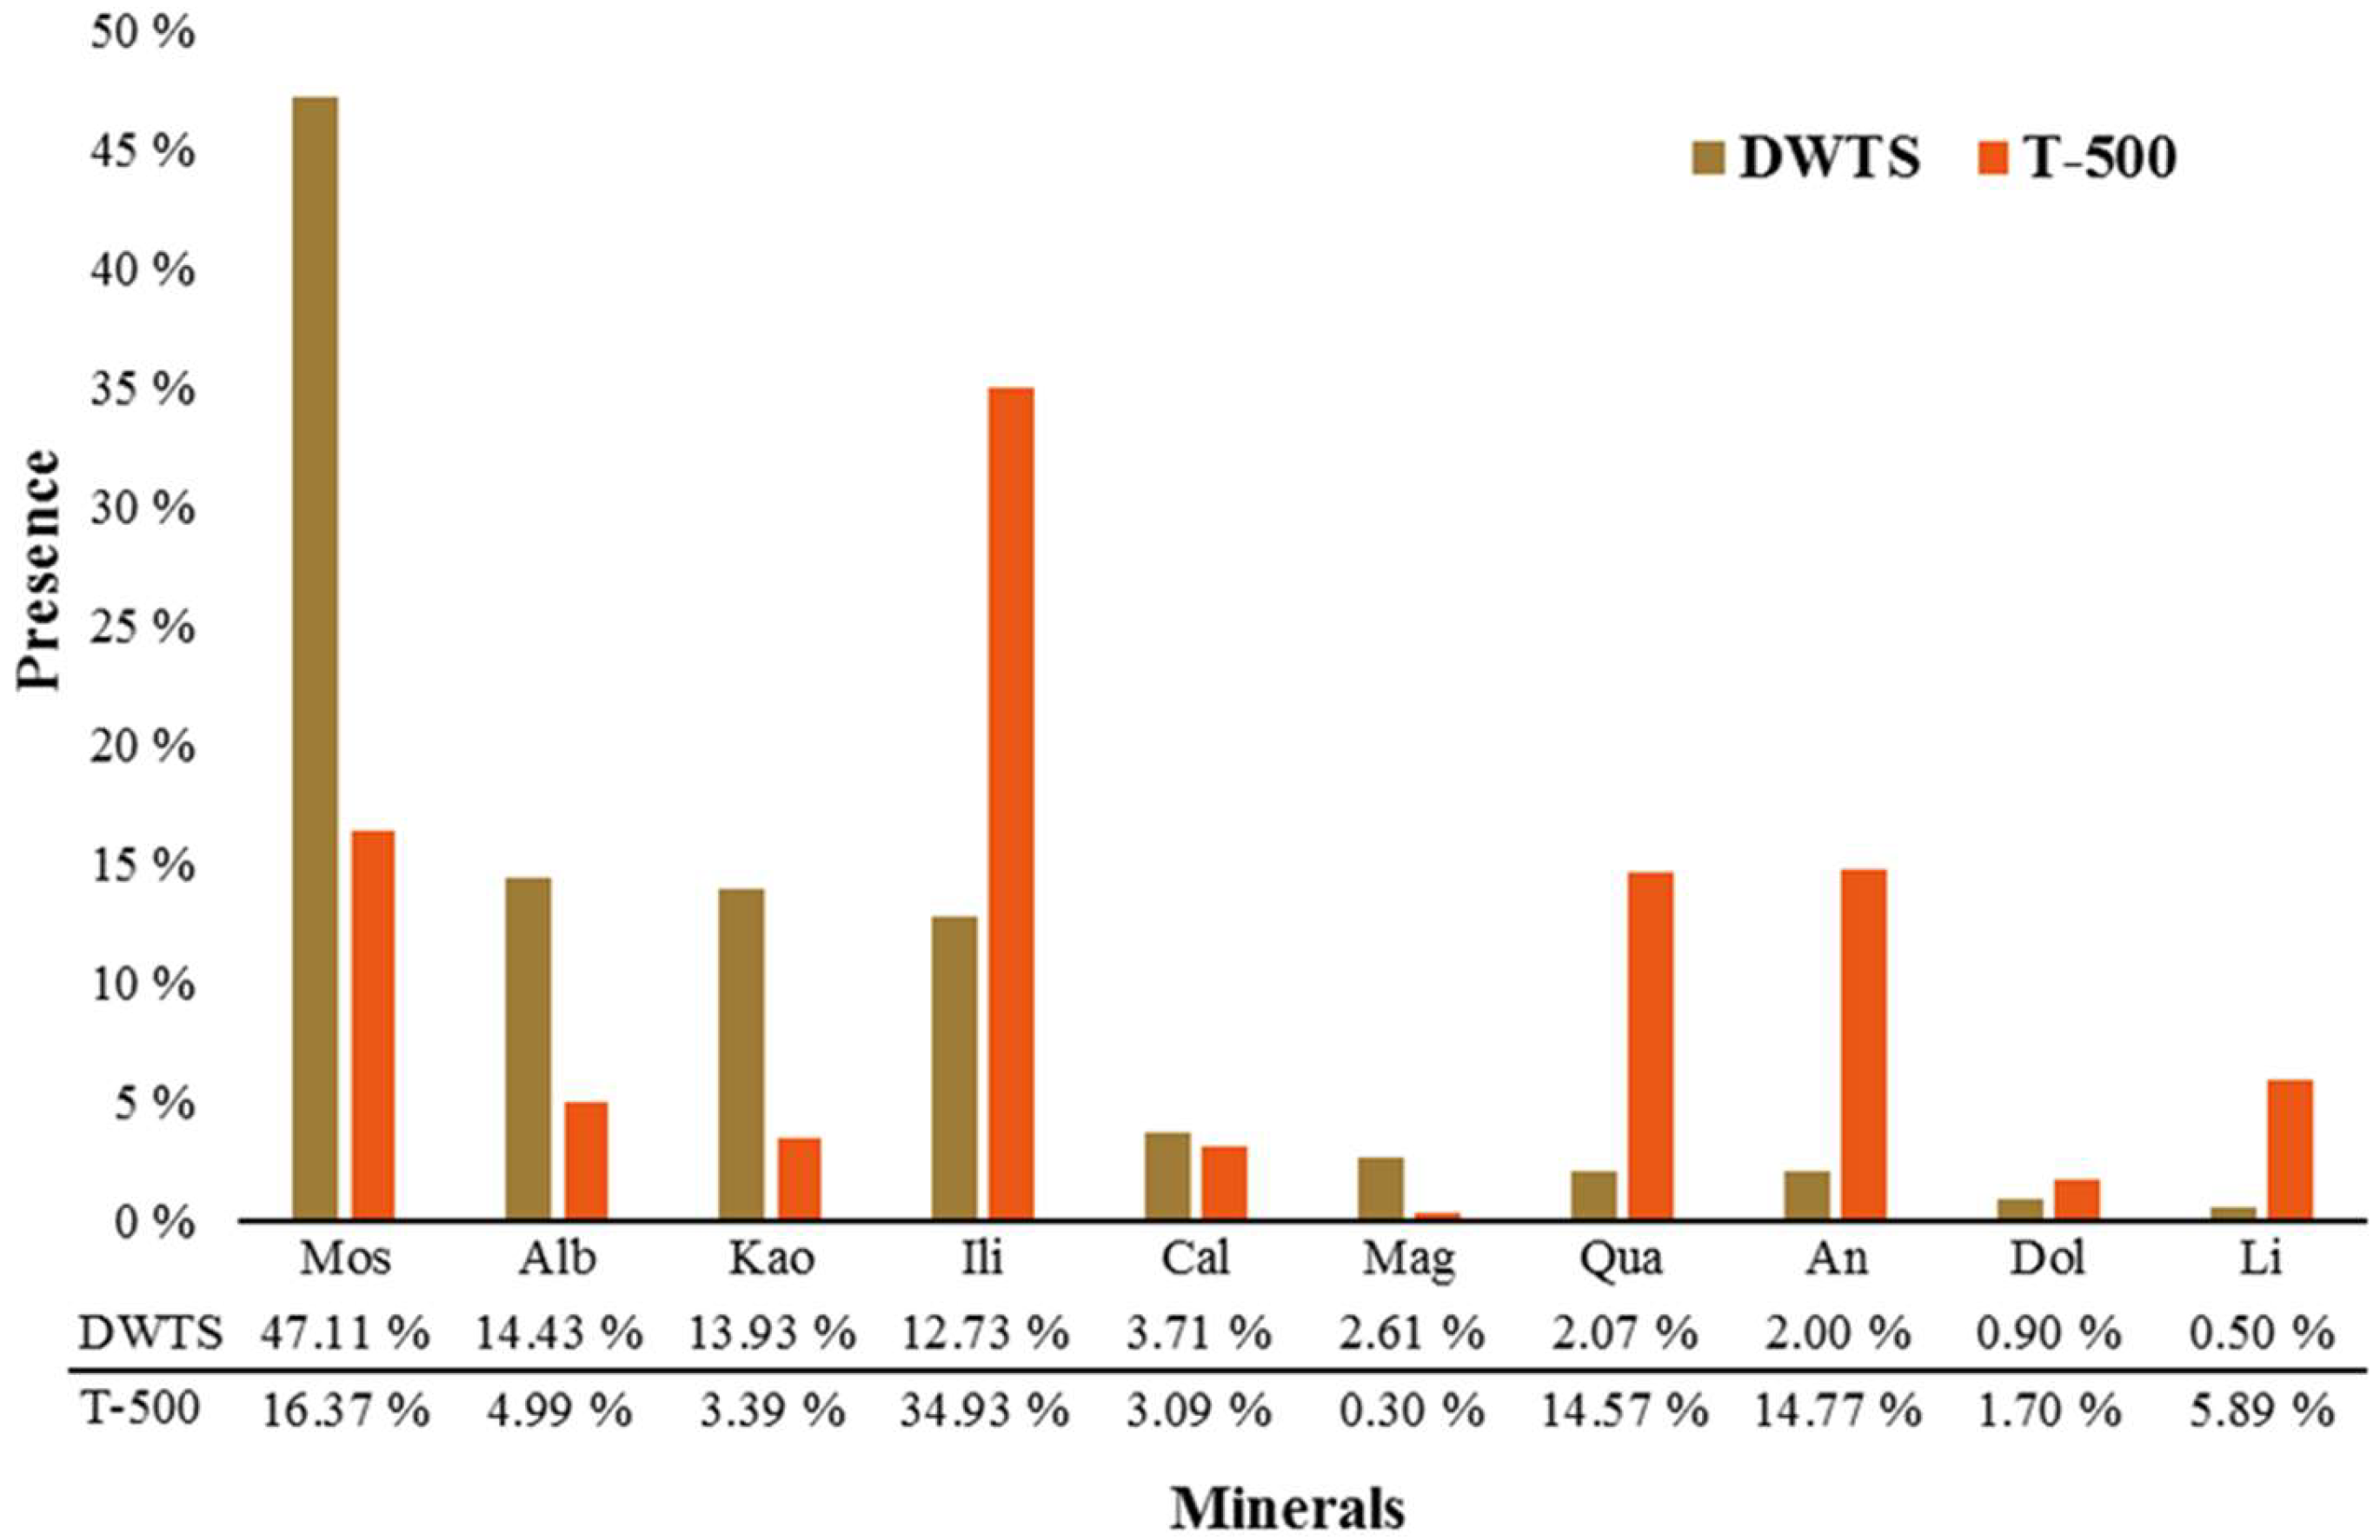
3.1. Adsorbent Characterization
3.2. Bordeaux B Removal Capacity on Activated DWTS
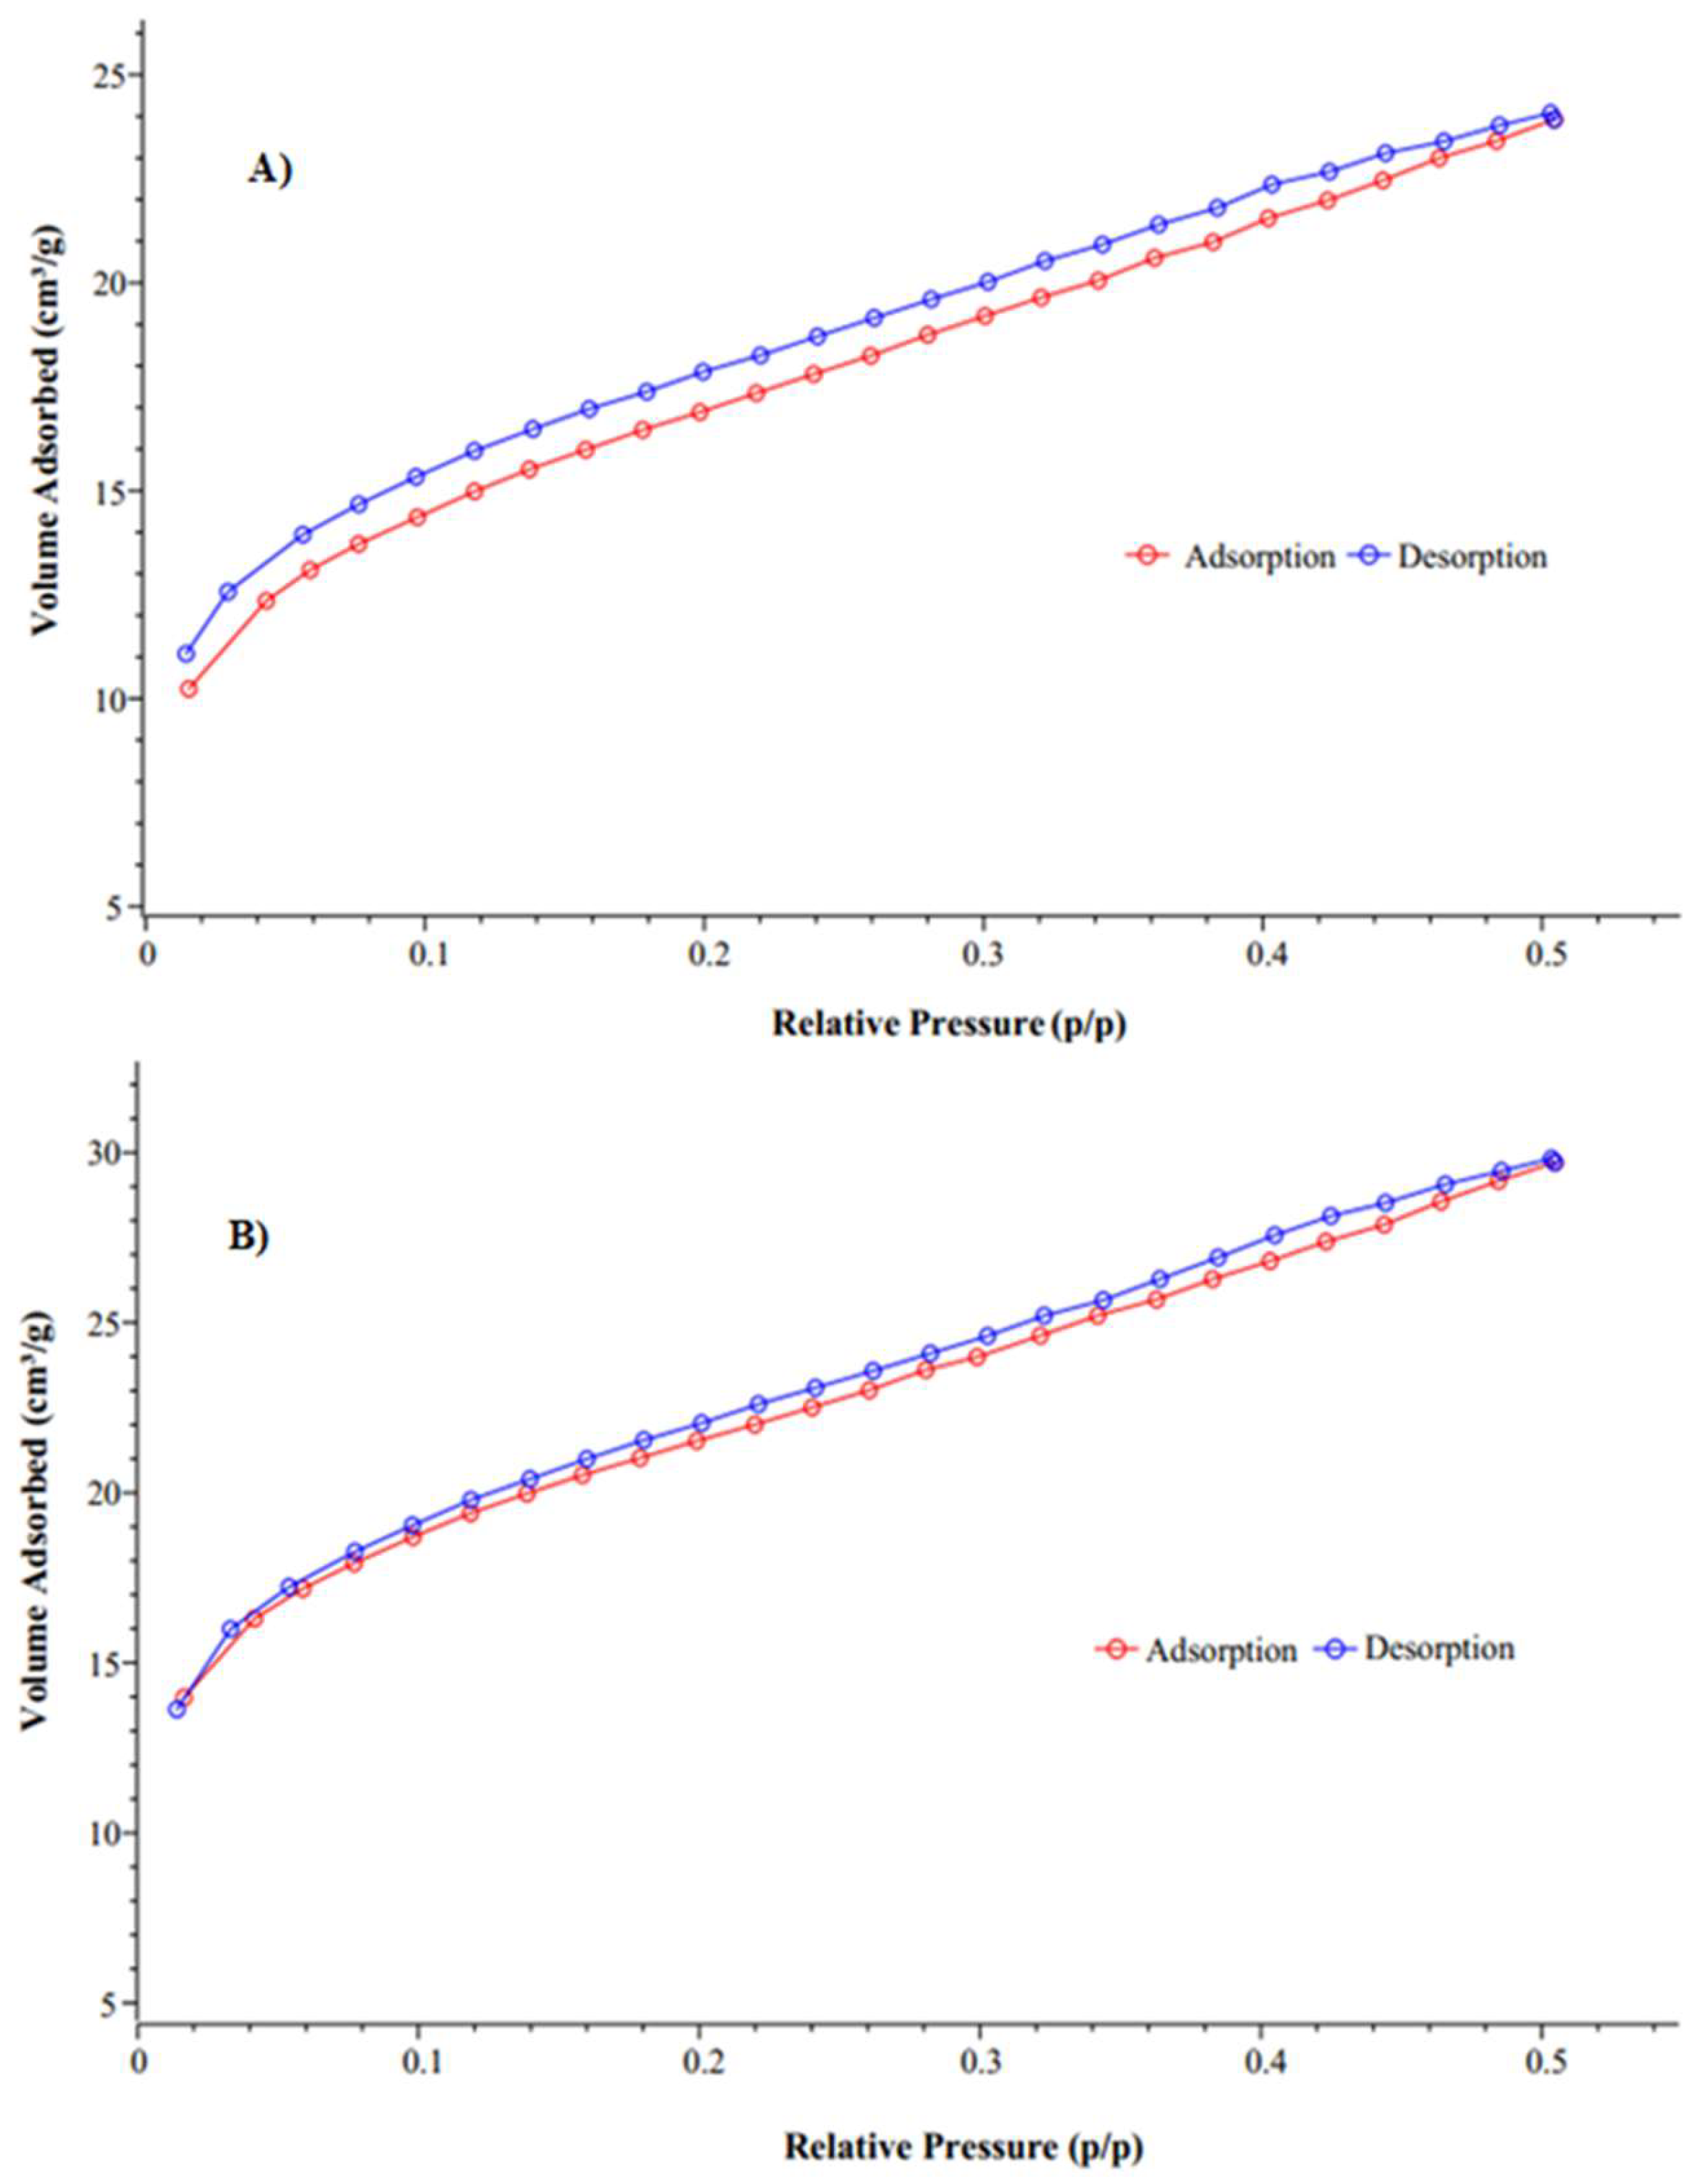
3.3. DWTS and T-500 Physicochemical and Surface Characterization
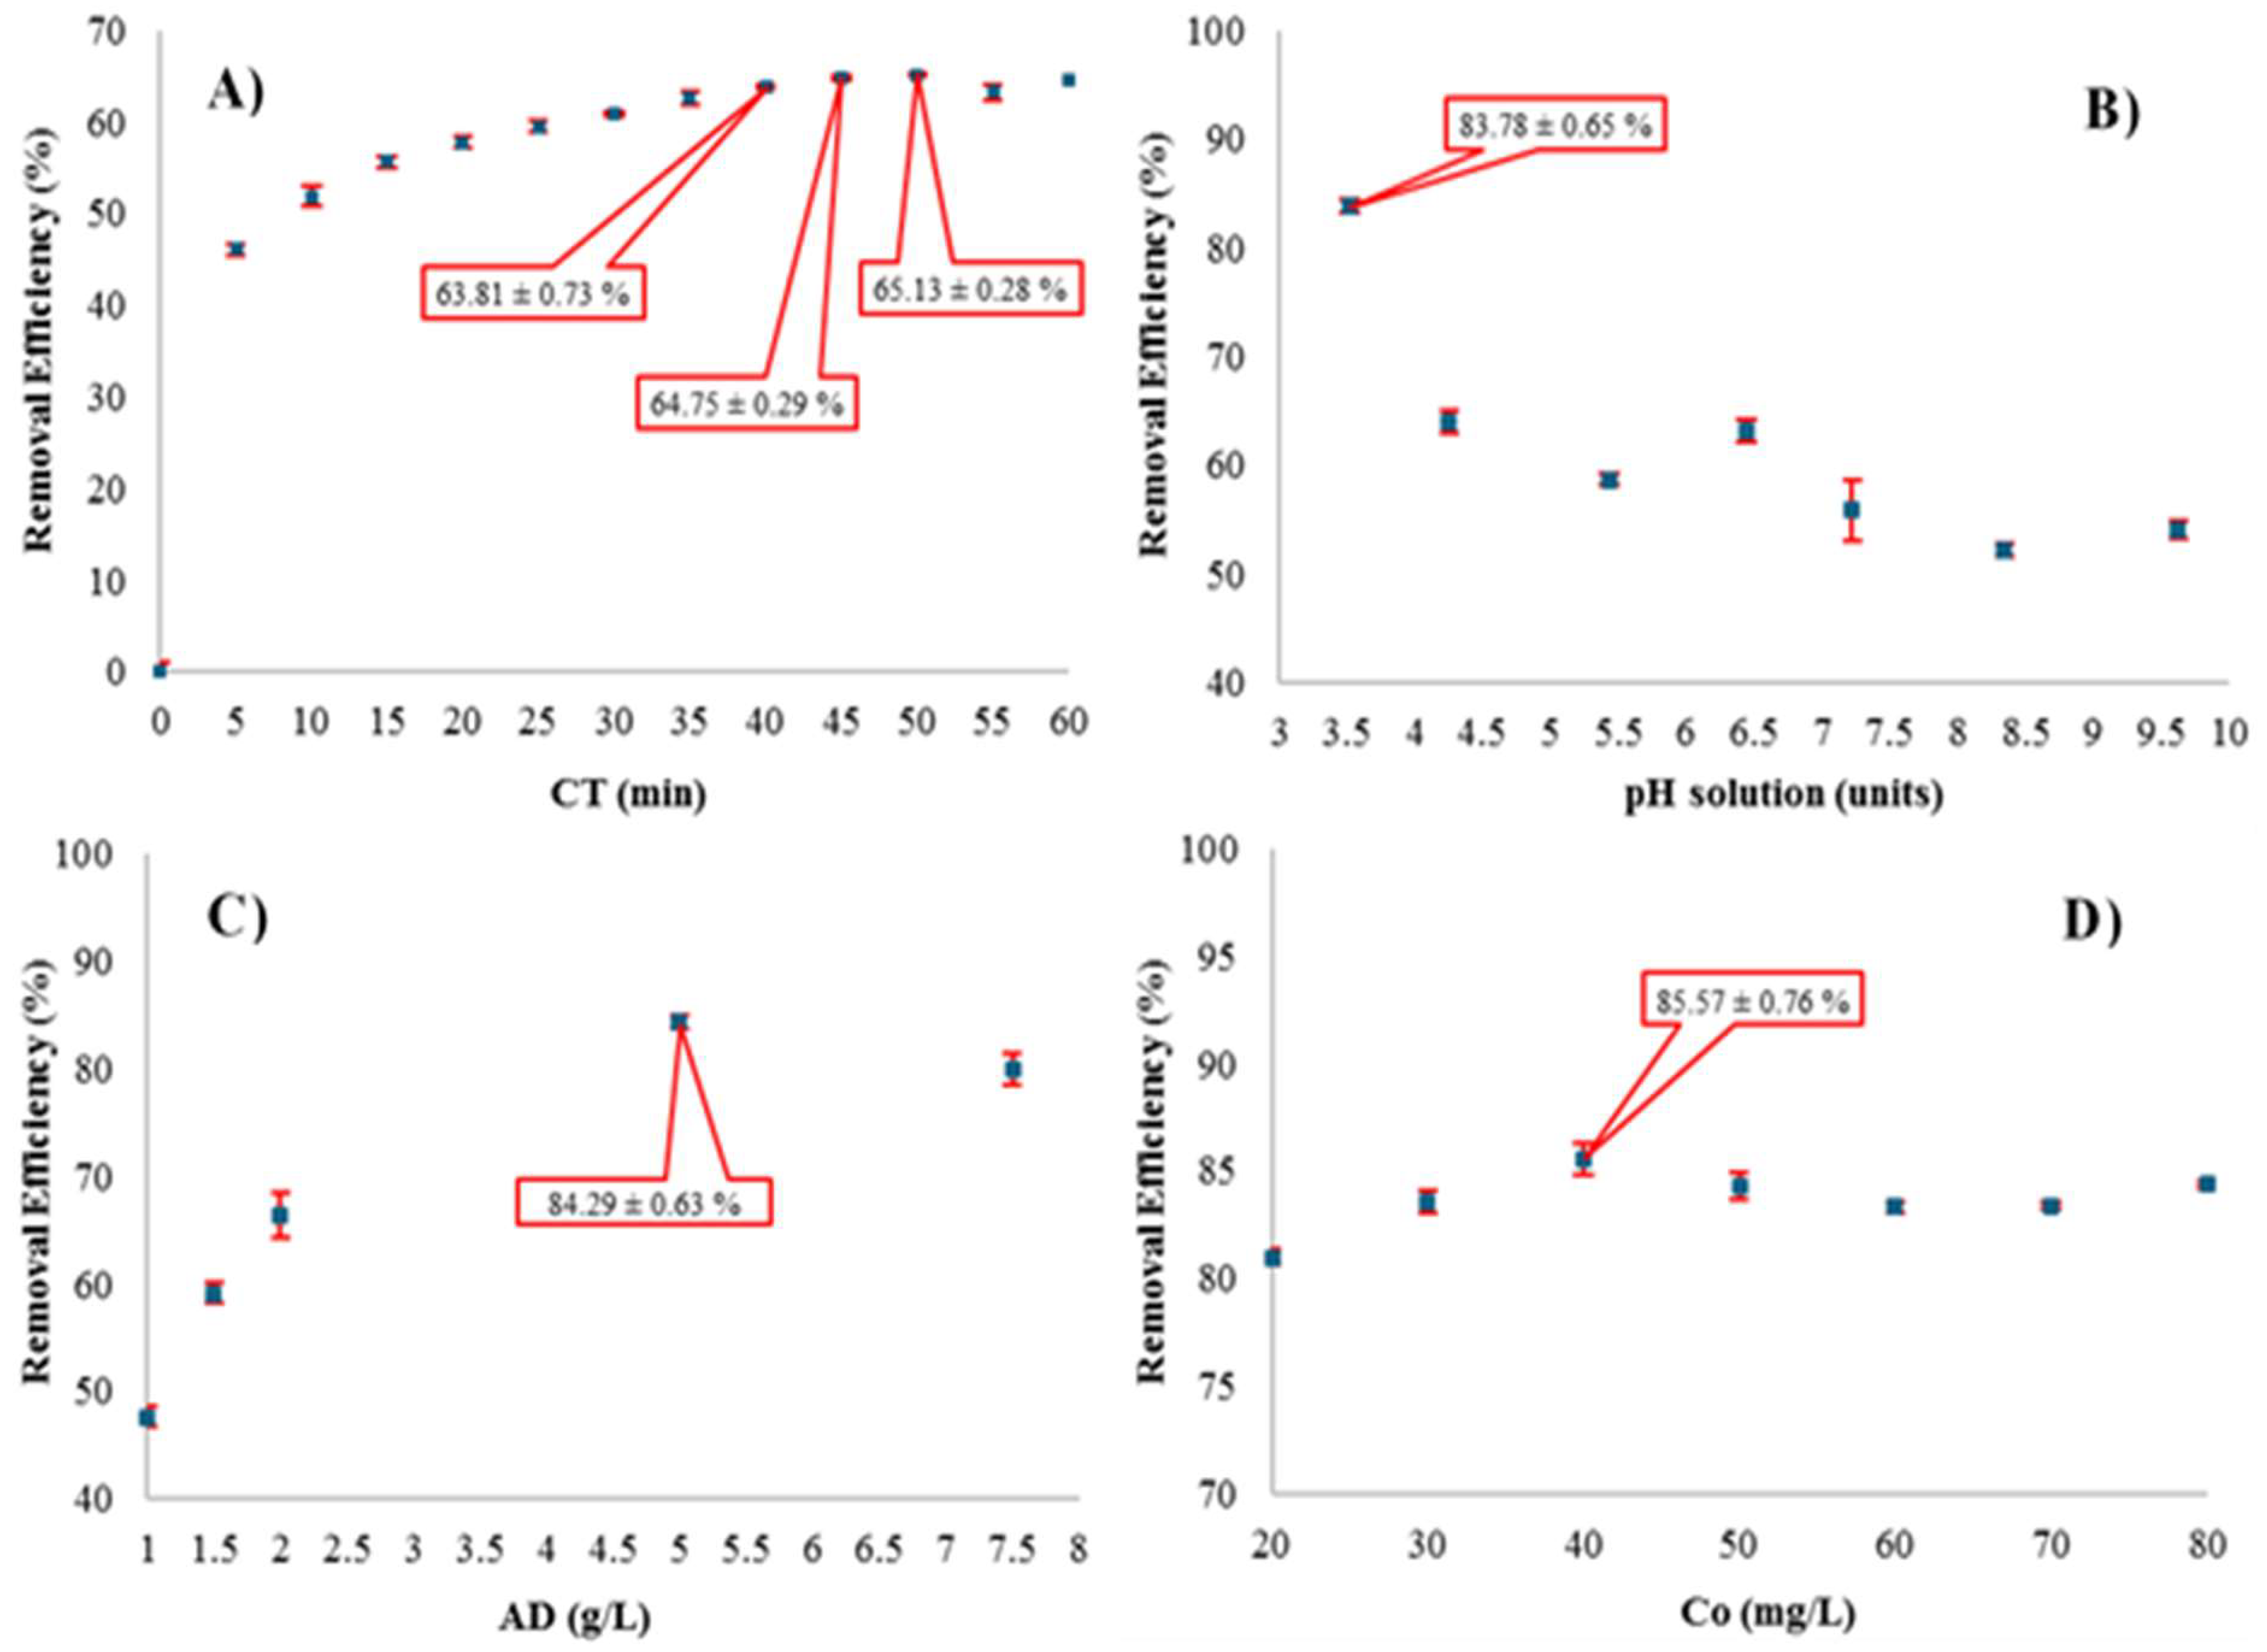
3.4. Effect of Adsorbent Variables (CT, pH, AD and Co) on the Removal of Bordeaux R in the T-500
3.5. Adsorption Isotherms
Constant Determination of Isotherm Models
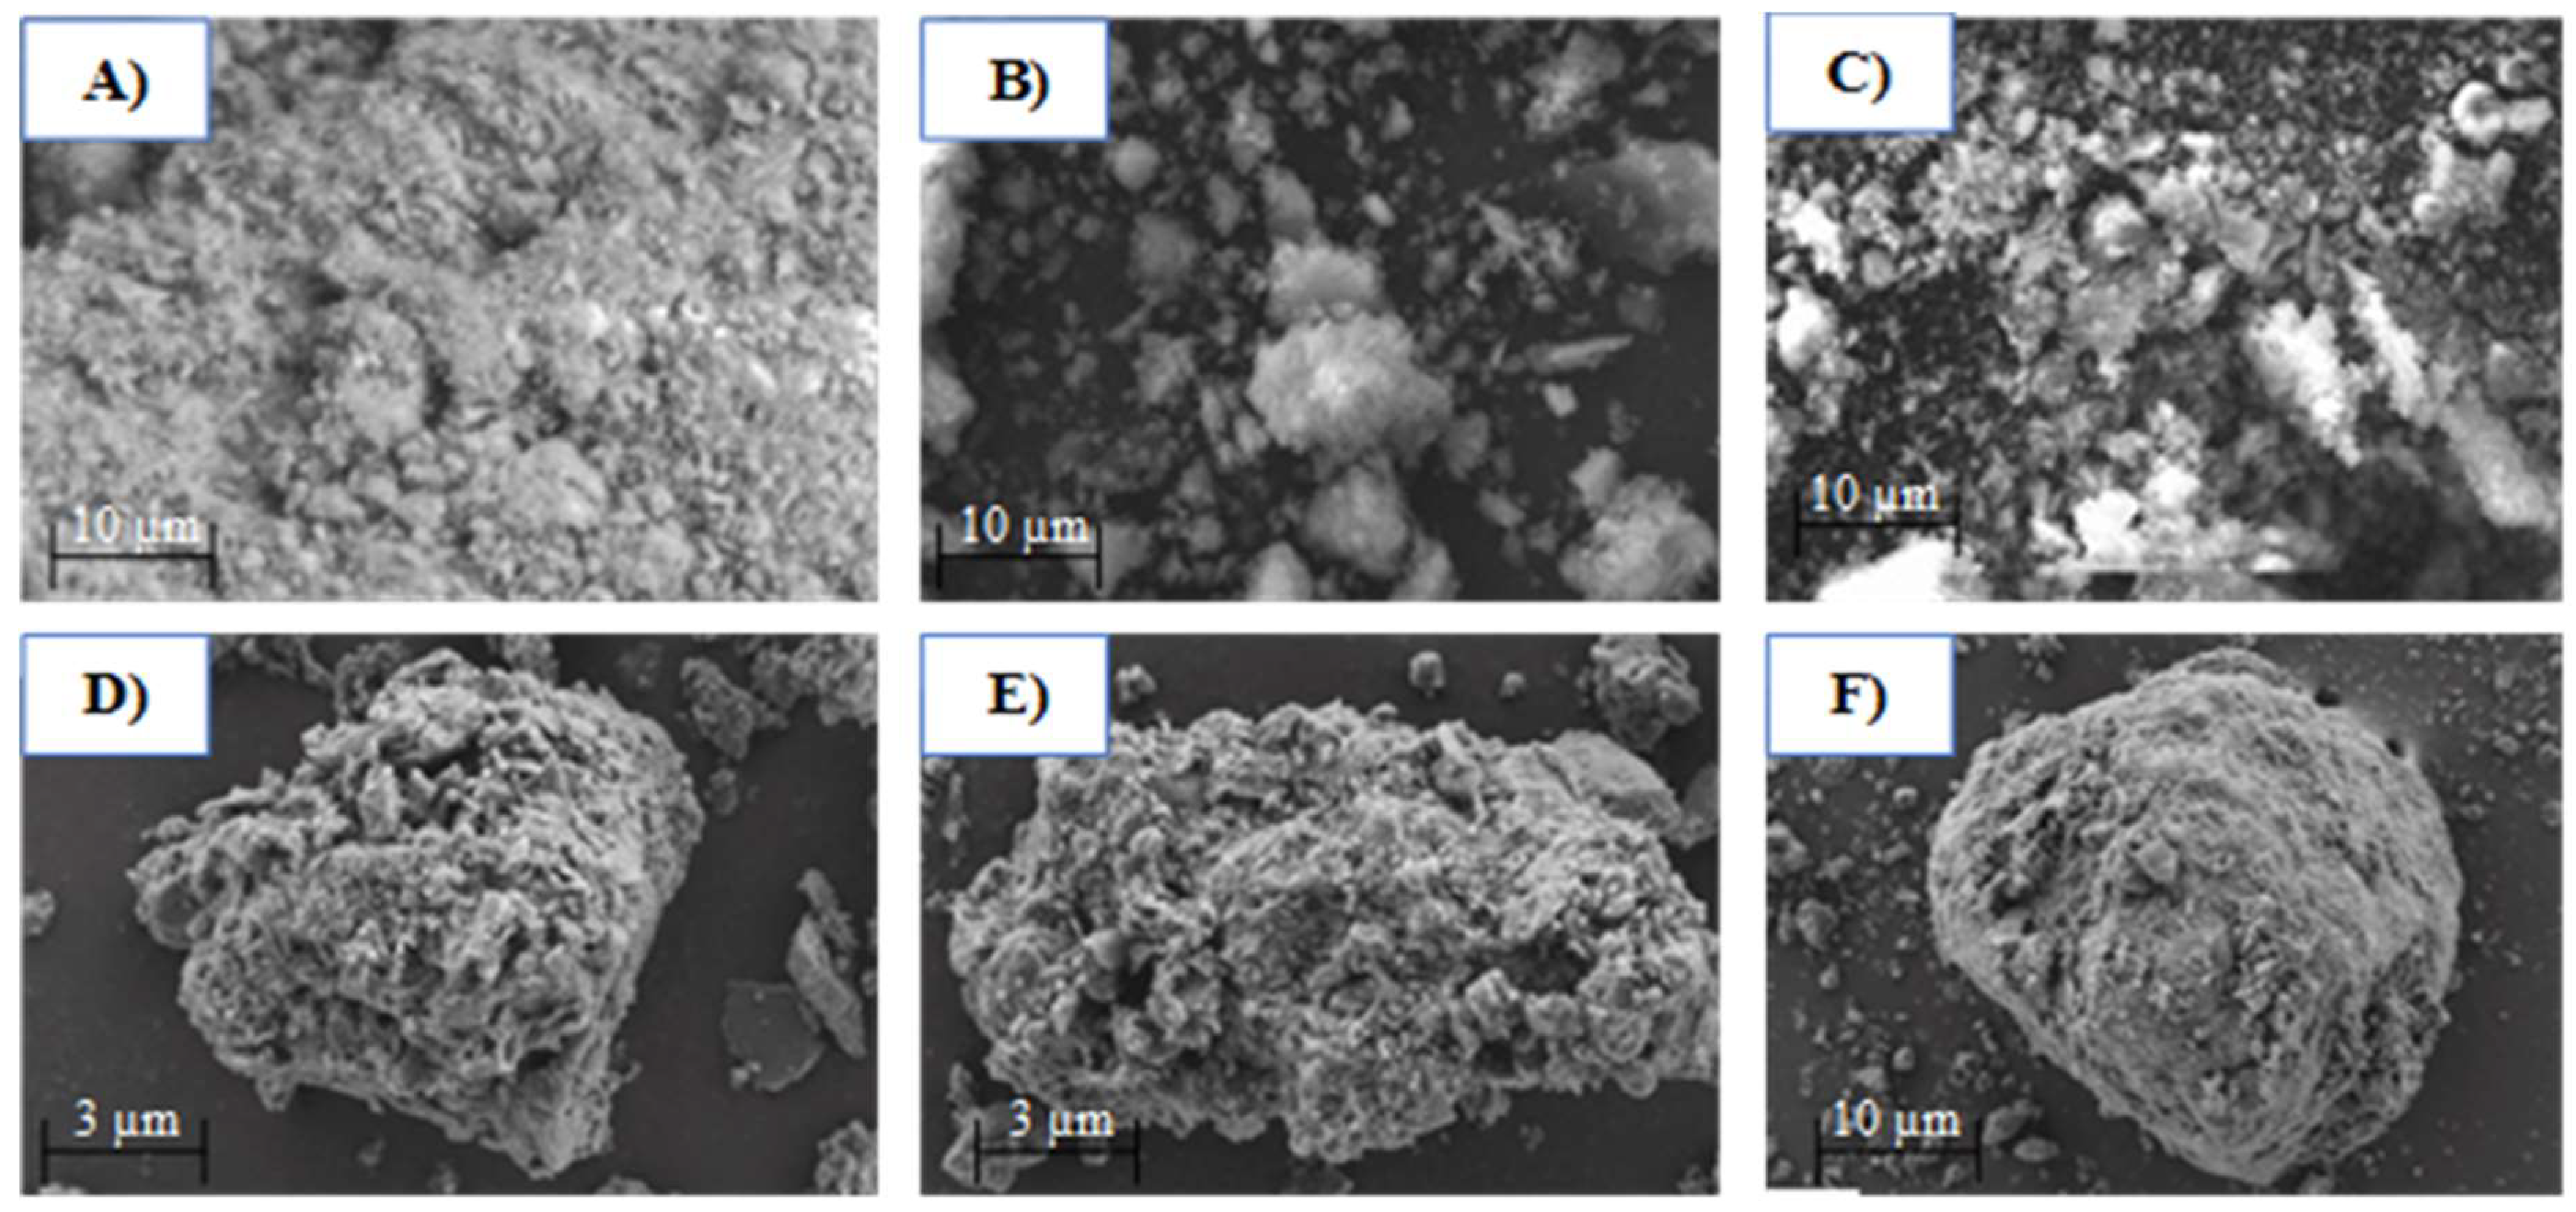
3.6. SEM Images
3.7. Sustainability of the DWTS and T-500
4. Discussion
4.1. Limitations
4.2. Future Directions
5. Conclusions
Author Contributions
Funding
Institutional Review Board Statement
Data Availability Statement
Acknowledgments
Conflicts of Interest
References
- Nguyen, M.D.; Thomas, M.; Surapaneni, A.; Moon, E.M.; Milne, N.A. Beneficial reuse of water treatment sludge in the context of circular economy. Environ. Technol. Innov. 2022, 28, 102651. [Google Scholar] [CrossRef]
- Ahmad, T.; Ahmad, K.; Alam, M. Sustainable management of water treatment sludge through 3‘R’ concept. J. Clean. Prod. 2016, 124, 1–13. [Google Scholar] [CrossRef]
- Babatunde, A.O.; Zhao, Y.Q. Constructive Approaches Toward Water Treatment Works Sludge Management: An International Review of Beneficial Reuses. Crit. Rev. Environ. Sci. Technol. 2007, 37, 129–164. [Google Scholar] [CrossRef]
- Gomes, S.D.C.; Zhou, J.L.; Li, W.; Long, G. Progress in manufacture and properties of construction materials incorporating water treatment sludge: A review. Resour. Conserv. Recycl. 2019, 145, 148–159. [Google Scholar] [CrossRef]
- Ahmad, T.; Ahmad, K.; Alam, M. Characterization of Water Treatment Plant’s Sludge and its Safe Disposal Options. Procedia Environ. Sci. 2016, 35, 950–955. [Google Scholar] [CrossRef]
- Mortula, M.; Bard, S.M.; Walsh, M.E.; Gagnon, G.A. Aluminum toxicity and ecological risk assessment of dried alum residual into surface water disposalA paper submitted to the Journal of Environmental Engineering and Science. Can. J. Civ. Eng. 2009, 36, 127–136. [Google Scholar] [CrossRef]
- De Godoy, L.G.G.; Rohden, A.B.; Garcez, M.R.; da Costa, E.B.; Da Dalt, S.; de Oliveira Andrade, J.J. Valorization of water treatment sludge waste by application as supplementary cementitious material. Constr. Build. Mater. 2019, 223, 939–950. [Google Scholar] [CrossRef]
- Foroughi, M.; Chavoshi, S.; Bagheri, M.; Yetilmezsoy, K.; Samadi, M.T. Alum-based sludge (AbS) recycling for turbidity removal in drinking water treatment: An insight into statistical, technical, and health-related standpoints. J. Mater. Cycles Waste Manag. 2018, 20, 1999–2017. [Google Scholar] [CrossRef]
- Khedher, M.; Awad, J.; Donner, E.; Drigo, B.; Fabris, R.; Harris, M.; Braun, K.; Chow, C.W. The potential reuse of drinking water treatment sludge for organics removal and disinfection by-products formation control. J. Environ. Chem. Eng. 2022, 10, 108001. [Google Scholar] [CrossRef]
- Muisa, N.; Nhapi, I.; Ruziwa, W.; Manyuchi, M.M. Utilization of alum sludge as adsorbent for phosphorus removal in municipal wastewater: A review. J. Water Process Eng. 2020, 35, 101187. [Google Scholar] [CrossRef]
- Abo-El-Enein, S.A.; Shebl, A.; El-Dahab, S.A. Drinking water treatment sludge as an efficient adsorbent for heavy metals removal. Appl. Clay Sci. 2017, 146, 343–349. [Google Scholar] [CrossRef]
- Shen, C.; Zhao, Y.; Li, W.; Yang, Y.; Liu, R.; Morgen, D. Global profile of heavy metals and semimetals adsorption using drinking water treatment residual. Chem. Eng. J. 2019, 372, 1019–1027. [Google Scholar] [CrossRef]
- Martins, D.S.; Estevam, B.R.; Perez, I.D.; Américo-Pinheiro, J.H.P.; Isique, W.D.; Boina, R.F. Sludge from a water treatment plant as an adsorbent of endocrine disruptors. J. Environ. Chem. Eng. 2022, 10, 108090. [Google Scholar] [CrossRef]
- Gadekar, M.R.; Ahammed, M.M. Modelling dye removal by adsorption onto water treatment residuals using combined response surface methodology-artificial neural network approach. J. Environ. Manag. 2019, 231, 241–248. [Google Scholar] [CrossRef]
- Tony, M.A. Zeolite-based adsorbent from alum sludge residue for textile wastewater treatment. Int. J. Env. Environ. Sci. Technol. 2020, 17, 2485–2498. [Google Scholar] [CrossRef]
- Soliman, M.F.; Rashed, M.N.; Ahmd, A.A. Chemical Activation of Sludge from Drinking Water Treatment Plant for Adsorption of Methylene Blue Dye. Water Air Soil. Pollut. 2023, 234, 228. [Google Scholar] [CrossRef]
- Azanaw, A.; Birlie, B.; Teshome, B.; Jemberie, M. Textile effluent treatment methods and eco-friendly resolution of textile wastewater. Case Stud. Chem. Environ. Eng. 2022, 6, 100230. [Google Scholar] [CrossRef]
- Mani, S.; Chowdhary, P.; Bharagava, R.N. Textile Wastewater Dyes: Toxicity Profile and Treatment Approaches. In Emerging and Eco-Friendly Approaches for Waste Management [Internet]; Bharagava, R.N., Chowdhary, P., Eds.; Springer: Singapore, 2019; pp. 219–244. [Google Scholar] [CrossRef]
- Bonilla-Petriciolet, A.; Mendoza-Castillo, D.I.; Reynel-Ávila, H.E. (Eds.) Adsorption Processes for Water Treatment and Purification [Internet]; Springer International Publishing: Cham, Switzerland, 2017. [Google Scholar] [CrossRef]
- Husien, S.; El-taweel, R.M.; Salim, A.I.; Fahim, I.S.; Said, L.A.; Radwan, A.G. Review of activated carbon adsorbent material for textile dyes removal: Preparation, and modelling. Curr. Res. Green Sustain. Chem. 2022, 5, 100325. [Google Scholar] [CrossRef]
- Li, W.; Mu, B.; Yang, Y. Feasibility of industrial-scale treatment of dye wastewater via bio-adsorption technology. Bioresour. Technol. 2019, 277, 157–170. [Google Scholar] [CrossRef]
- Chu, W. Dye Removal from Textile Dye Wastewater Using Recycled Alum Sludge. Water Res. 2001, 35, 3147–3152. [Google Scholar] [CrossRef] [PubMed]
- Elmontassir, H.; Elfalaki, K.; Karhat, Y.; Afdali, M. Adsorption of a dye and a real rejection of textile on sludge from drinking water treatement. Moroc. J. Chem. 2019, 7, 7–505. [Google Scholar]
- Gomonsirisuk, K.; Yotyiamkrae, K.; Prajuabsuk, M.; Lumlong, S.; Kamsri, P.; Pungpo, P.; Thavorniti, P. Synthesis of Zeolite from Water Treatment Sludge and its Application to the Removal of Brilliant Green. Key Eng. Mater. 2018, 766, 111–116. [Google Scholar] [CrossRef]
- Kayranli, B. Adsorption of textile dyes onto iron based waterworks sludge from aqueous solution; isotherm, kinetic and thermodynamic study. Chem. Eng. J. 2011, 173, 782–791. [Google Scholar] [CrossRef]
- Laib, S.; Rezzaz-Yazid, H.; Sadaoui, Z. Comparative Study on Removal of Textile Dyes in Aqueous Medium by Adsorption Using Modified Drinking Water Treatment Sludge. Arab. J. Sci. Eng. 2022, 47, 6085–6098. [Google Scholar] [CrossRef]
- Nageeb Rashed, M.; El-Daim El Taher, M.A.; Fadlalla, S.M.M. Adsorption of methylene blue using modified adsorbents from drinking water treatment sludge. Water Sci. Technol. 2016, 74, 1885–1898. [Google Scholar] [CrossRef]
- Tong, D.S.; Liu, M.; Li, L.; Lin, C.X.; Yu, W.H.; Xu, Z.P.; Zhou, C.H. Transformation of alunite residuals into layered double hydroxides and oxides for adsorption of acid red G dye. Appl. Clay Sci. 2012, 70, 1–7. [Google Scholar] [CrossRef]
- Ackah, L.A.; Guru, R.; Peiravi, M.; Mohanty, M.; Ma, X.; Kumar, S.; Liu, J. Characterization of Southern Illinois Water Treatment Residues for Sustainable Applications. Sustainability 2018, 10, 1374. [Google Scholar] [CrossRef]
- Likus, M.; Komorowska-Kaufman, M.; Pruss, A.; Zych, Ł.; Bajda, T. Iron-Based Water Treatment Residuals: Phase, Physicochemical Characterization, and Textural Properties. Materials 2021, 14, 3938. [Google Scholar] [CrossRef]
- Dennington, R.; Keith, T.; Millam, J. GaussView; Semichem Inc.: Shawnee Mission, KS, USA, 2009. [Google Scholar]
- Yanai, T.; Tew, D.P.; Handy, N.C. A new hybrid exchange–correlation functional using the Coulomb-attenuating method (CAM-B3LYP). Chem. Phys. Lett. 2004, 393, 51–57. [Google Scholar] [CrossRef]
- Bilal, M.; Ihsanullah, I.; Shah, M.U.H.; Reddy, A.V.B.; Aminabhavi, T.M. Recent advances in the removal of dyes from wastewater using low-cost adsorbents. J. Environ. Manag. 2022, 321, 115981. [Google Scholar] [CrossRef]
- Hamous, H.; Khenifi, A.; Orts, F.; Bonastre, J.; Cases, F. Carbon textiles electrodes modified with RGO and Pt nanoparticles used for electrochemical treatment of azo dye. J. Electroanal. Chem. 2021, 887, 115154. [Google Scholar] [CrossRef]
- Abidi, N.; Duplay, J.; Jada, A.; Baltenweck, R.; Errais, E.; Semhi, K.; Trabelsi-Ayadi, M. Toward the understanding of the treatment of textile industries’ effluents by clay: Adsorption of anionic dye on kaolinite. Arab. J. Geosci. 2017, 10, 373. [Google Scholar] [CrossRef]
- Wang, G.; Wang, S.; Sun, W.; Sun, Z.; Zheng, S. Oxygen functionalized carbon nanocomposite derived from natural illite as adsorbent for removal of cationic and anionic dyes. Adv. Powder Technol. 2017, 28, 1943–1953. [Google Scholar] [CrossRef]
- Colina Andrade, G.J.; Vilca Quilla, J.M.; Terán Hilares, R.; Tejada Meza, K.; Mogrovejo Valdivia, A.C.; Aguilar-Pineda, J.A.; Cárdenas García, J.D.; Pacheco Tanaka, D.A. Enhanced Removal of Bordeaux B and Red G Dyes Used in Alpaca Wool Dying from Water Using Iron-Modified Activated Carbon. Water 2022, 14, 2321. [Google Scholar] [CrossRef]
- ASTM D2854-96; Standard Test Method for Apparent Density of Activated Carbon. ASTM International: New York, NY, USA, 2000.
- ASTM D3838-80; Standard Test Method for pH of Activated Carbon. ASTM International: New York, NY, USA, 1999.
- ASTM D2867-04; Standard Test Methods for Moisture in Activated Carbon. ASTM International: New York, NY, USA, 2004.
- ASTM D2866-99; Standard Test Method for Total Ash Content of Activated Carbon. ASTM International: New York, NY, USA, 1999.
- Yang, J.; Ren, Y.; Chen, S.; Zhang, Z.; Pang, H.; Wang, X.; Lu, J. Thermally activated drinking water treatment sludge as a supplementary cementitious material: Properties, pozzolanic activity and hydration characteristics. Constr. Build. Mater. 2023, 365, 130027. [Google Scholar] [CrossRef]
- Crittenden, J.C.; Trussell, R.R.; Hand, D.W.; Howe, K.J.; Tchobanoglous, G. MWH’s Water Treatment: Principles and Design; John Wiley & Sons: Hoboken, NJ, USA, 2012. [Google Scholar]
- Gutiérrez Pulido, H. Análisis y Diseño de Experimentos; Biblioteca Hernán Malo González: Cuenc, Ecuador, 2012. [Google Scholar]
- Carretero, M.I.; Pozo, M. Mineralogía Aplicada: Salud y Medio Ambiente; Ediciones Paraninfo, SA: Madrid, Spain, 2007. [Google Scholar]
- Porta Casanellas, J.; López-Acevedo Reguerín, M.; Roquero de Laburu, C. Edafología Para la Agricultura y el Medio Ambiente; Mundi-prensa: Madrid, Spain, 2003. [Google Scholar]
- Harlow, G.E. The anorthoclase structures: The effects of temperature and composition. Am. Mineralogist. 1982, 67, 975–996. [Google Scholar]
- Amrhar, O.; Berisha, A.; El Gana, L.; Nassali, H.; Elyoubi, M. Removal of methylene blue dye by adsorption onto Natural Muscovite Clay: Experimental, theoretical and computational investigation. Int. J. Environ. Anal. Chem. 2023, 103, 2419–2444. [Google Scholar] [CrossRef]
- Dash, B.; Jena, S.K.; Rath, S.S. Adsorption of Cr (III) and Cr (VI) ions on muscovite mica: Experimental and molecular modeling studies. J. Mol. Liq. 2022, 357, 119116. [Google Scholar] [CrossRef]
- Kausar, A.; Iqbal, M.; Javed, A.; Aftab, K.; Bhatti, H.N.; Nouren, S. Dyes adsorption using clay and modified clay: A review. J. Mol. Liq. 2018, 256, 395–407. [Google Scholar] [CrossRef]
- Vieira, Y.; Netto, M.S.; Lima, É.C.; Anastopoulos, I.; Oliveira, M.L.; Dotto, G.L. An overview of geological originated materials as a trend for adsorption in wastewater treatment. Geosci. Front. 2022, 13, 101150. [Google Scholar] [CrossRef]
- Hillel, D. Introduction to Environmental Soil Physics; Elsevier: Amsterdam, The Netherlands, 2003. [Google Scholar]
- Bouachera, R.; Kasimi, R.; Ibnoussina, M.; Hakkou, R.; Taha, Y. Reuse of sewage sludge and waste glass in the production of lightweight aggregates. Mater. Today Proc. 2021, 37, 3866–3870. [Google Scholar] [CrossRef]
- Pigatto, R.S.; Somavilla, E.A.; Carissimi, É.; Roth, D.A.M.; Jahn, S.L.; Dotto, G.L. Thermally treated sludge obtained from a coagulation–flocculation water treatment process as a low-cost and eco-friendly adsorbent for water defluorination. Braz. J. Chem. Eng. 2021, 38, 451–460. [Google Scholar] [CrossRef]
- Tantawy, M.A.; Mohamed, R.S. Middle Eocene clay from Goset Abu Khashier: Geological assessment and utilization with drinking water treatment sludge in brick manufacture. Appl. Clay Sci. 2017, 138, 114–124. [Google Scholar] [CrossRef]
- Wolowiec, M.; Pruss, A.; Komorowska-Kaufman, M.; Lasocka-Gomuła, I.; Rzepa, G.; Bajda, T. The properties of sludge formed as a result of coagulation of backwash water from filters removing iron and manganese from groundwater. Appl. Sci. 2019, 1, 639. [Google Scholar] [CrossRef]
- Díaz, A.; Ramírez, J.F. Estudio Geológico-Económico de Rocas y Minerales Industriales de Arequipa y Alrededores-[Boletín B 22]; Geological, Mining, and Metallurgical Institute: Lima, Peru, 2010. [Google Scholar]
- Kandil, H.; Ali, H. Simultaneous removal of cationic crystal violet and anionic reactive yellow dyes using eco-friendly chitosan functionalized by talc and cloisite 30B. J. Polym. Environ. 2023, 31, 1456–1477. [Google Scholar] [CrossRef]
- Bourahla, S.; Nemchi, F.; Belayachi, H.; Belayachi, A.; Harrats, C.; Belhakem, M. Removal of the AO7 dye by adsorption on activated carbon based on grape marc: Equilibrium, regeneration, and FTIR spectroscopy. J. Iran. Chem. Soc. 2023, 20, 669–681. [Google Scholar] [CrossRef]
- Ociński, D.; Jacukowicz-Sobala, I.; Mazur, P.; Raczyk, J.; Kociołek-Balawejder, E. Water treatment residuals containing iron and manganese oxides for arsenic removal from water–Characterization of physicochemical properties and adsorption studies. Chem. Eng. J. 2016, 294, 210–221. [Google Scholar] [CrossRef]
- Siswoyo, E.; Qoniah, I.; Lestar, P.; Fajri, J.A.; Sani, R.A.; Sari, D.G.; Boving, T. Development of a floating adsorbent for cadmium derived from modified drinking water treatment plant sludge. Environ. Technol. Innov. 2019, 14, 100312. [Google Scholar] [CrossRef]
- Zhou, Y.F.; Haynes, R.J. A comparison of inorganic solid wastes as adsorbents of heavy metal cations in aqueous solution and their capacity for desorption and regeneration. Water Air Soil Pollut. 2011, 218, 457–470. [Google Scholar] [CrossRef]
- Al-Ghouti, M.A.; Da’ana, D.A. Guidelines for the use and interpretation of adsorption isotherm models: A review. J. Hazard. Mater. 2020, 393, 122383. [Google Scholar] [CrossRef]
- Wang, J.; Guo, X. Adsorption isotherm models: Classification, physical meaning, application and solving method. Chemosphere 2020, 258, 127279. [Google Scholar] [CrossRef] [PubMed]
- Kouda, I.; Seddik, N.B.; Laaziz, A.; Hadri, M.; Draoui, K.; Elmidaoui, A. Efficient removal of cationic dye from wastewater using novel low-cost adsorbent, cellulose-clay composite: Insights from isotherm, kinetic, thermodynamic, and molecular dynamics simulation studies. J. Mol. Struct. 2023, 1291, 135865. [Google Scholar] [CrossRef]
- Dassanayake, K.B.; Jayasinghe, G.Y.; Surapaneni, A.; Hetherington, C. A review on alum sludge reuse with special reference to agricultural applications and future challenges. Waste Manag. 2015, 38, 321–335. [Google Scholar] [CrossRef] [PubMed]
- Giles, C.; MacEwan, T.; Nakhwa, S.; Smith, D. Studies in adsorption. Part, X.I. A system of classification of solution adsorption isotherms, and its use in diagnosis of adsorption mechanisms and in measurements of specific surface areas of solids. J. Chem. Soc. 1960, 786, 3973–3993. [Google Scholar] [CrossRef]
- Wakkel, M.; Khiari, B.; Zagrouba, F. Textile wastewater treatment by agro-industrial waste: Equilibrium modelling, thermodynamics and mass transfer mechanisms of cationic dyes adsorption onto low-cost lignocellulosic adsorbent. J. Taiwan. Inst. Chem. Eng. 2019, 96, 439–452. [Google Scholar] [CrossRef]
- Kushwaha, P.; Agarwal, M. Adsorption of cationic dye by using metal industry solid waste as an adsorbent. Mater. Today Proc. 2023, 78, 198–203. [Google Scholar] [CrossRef]
- Şentürk, İ.; Alzein, M. Adsorptive removal of basic blue 41 using pistachio shell adsorbent-Performance in batch and column system. Sustain. Chem. Pharm. 2020, 16, 100254. [Google Scholar] [CrossRef]
- Sitab, A.A.; Tujjohra, F.; Rashid, T.U.; Rahman, M.M. Thermally crosslinked electrospun nanofibrous mat from chrome-tanned solid wastes for cationic dye adsorption in wastewater treatment. Clean. Eng. Technol. 2023, 13, 100621. [Google Scholar] [CrossRef]
- Bougrine, O.; El Fellah, I.; Kada, I.; Rabie, F.A.; Lanjri, A.F.; Ammari, M. Advancing Circular Economy: A study of Drinking Water Sludge for Potential Uses. Results Eng. 2024, 15, 102426. [Google Scholar] [CrossRef]
- Ighalo, J.O.; Omoarukhe, F.O.; Ojukwu, V.E.; Iwuozor, K.O.; Igwegbe, C.A. Cost of adsorbent preparation and usage in wastewater treatment: A review. Clean. Chem. Eng. 2022, 3, 100042. [Google Scholar] [CrossRef]


| Variable | Unit | Levels |
|---|---|---|
| Activation temperature | °C | 200, 300, 400, 500, 600 and 700 |
| CT | Min | 5, 10, 15, 20, 25, 30, 35, 40, 45, 50, 55 and 60 |
| pH solutions | Units | 3, 4, 5, 6, 7, 8 and 9 |
| AD | g/L | 1, 1.5, 2, 5 and 7.5 |
| Co | mg/L | 20, 30, 40, 50, 60, 70 and 80 |
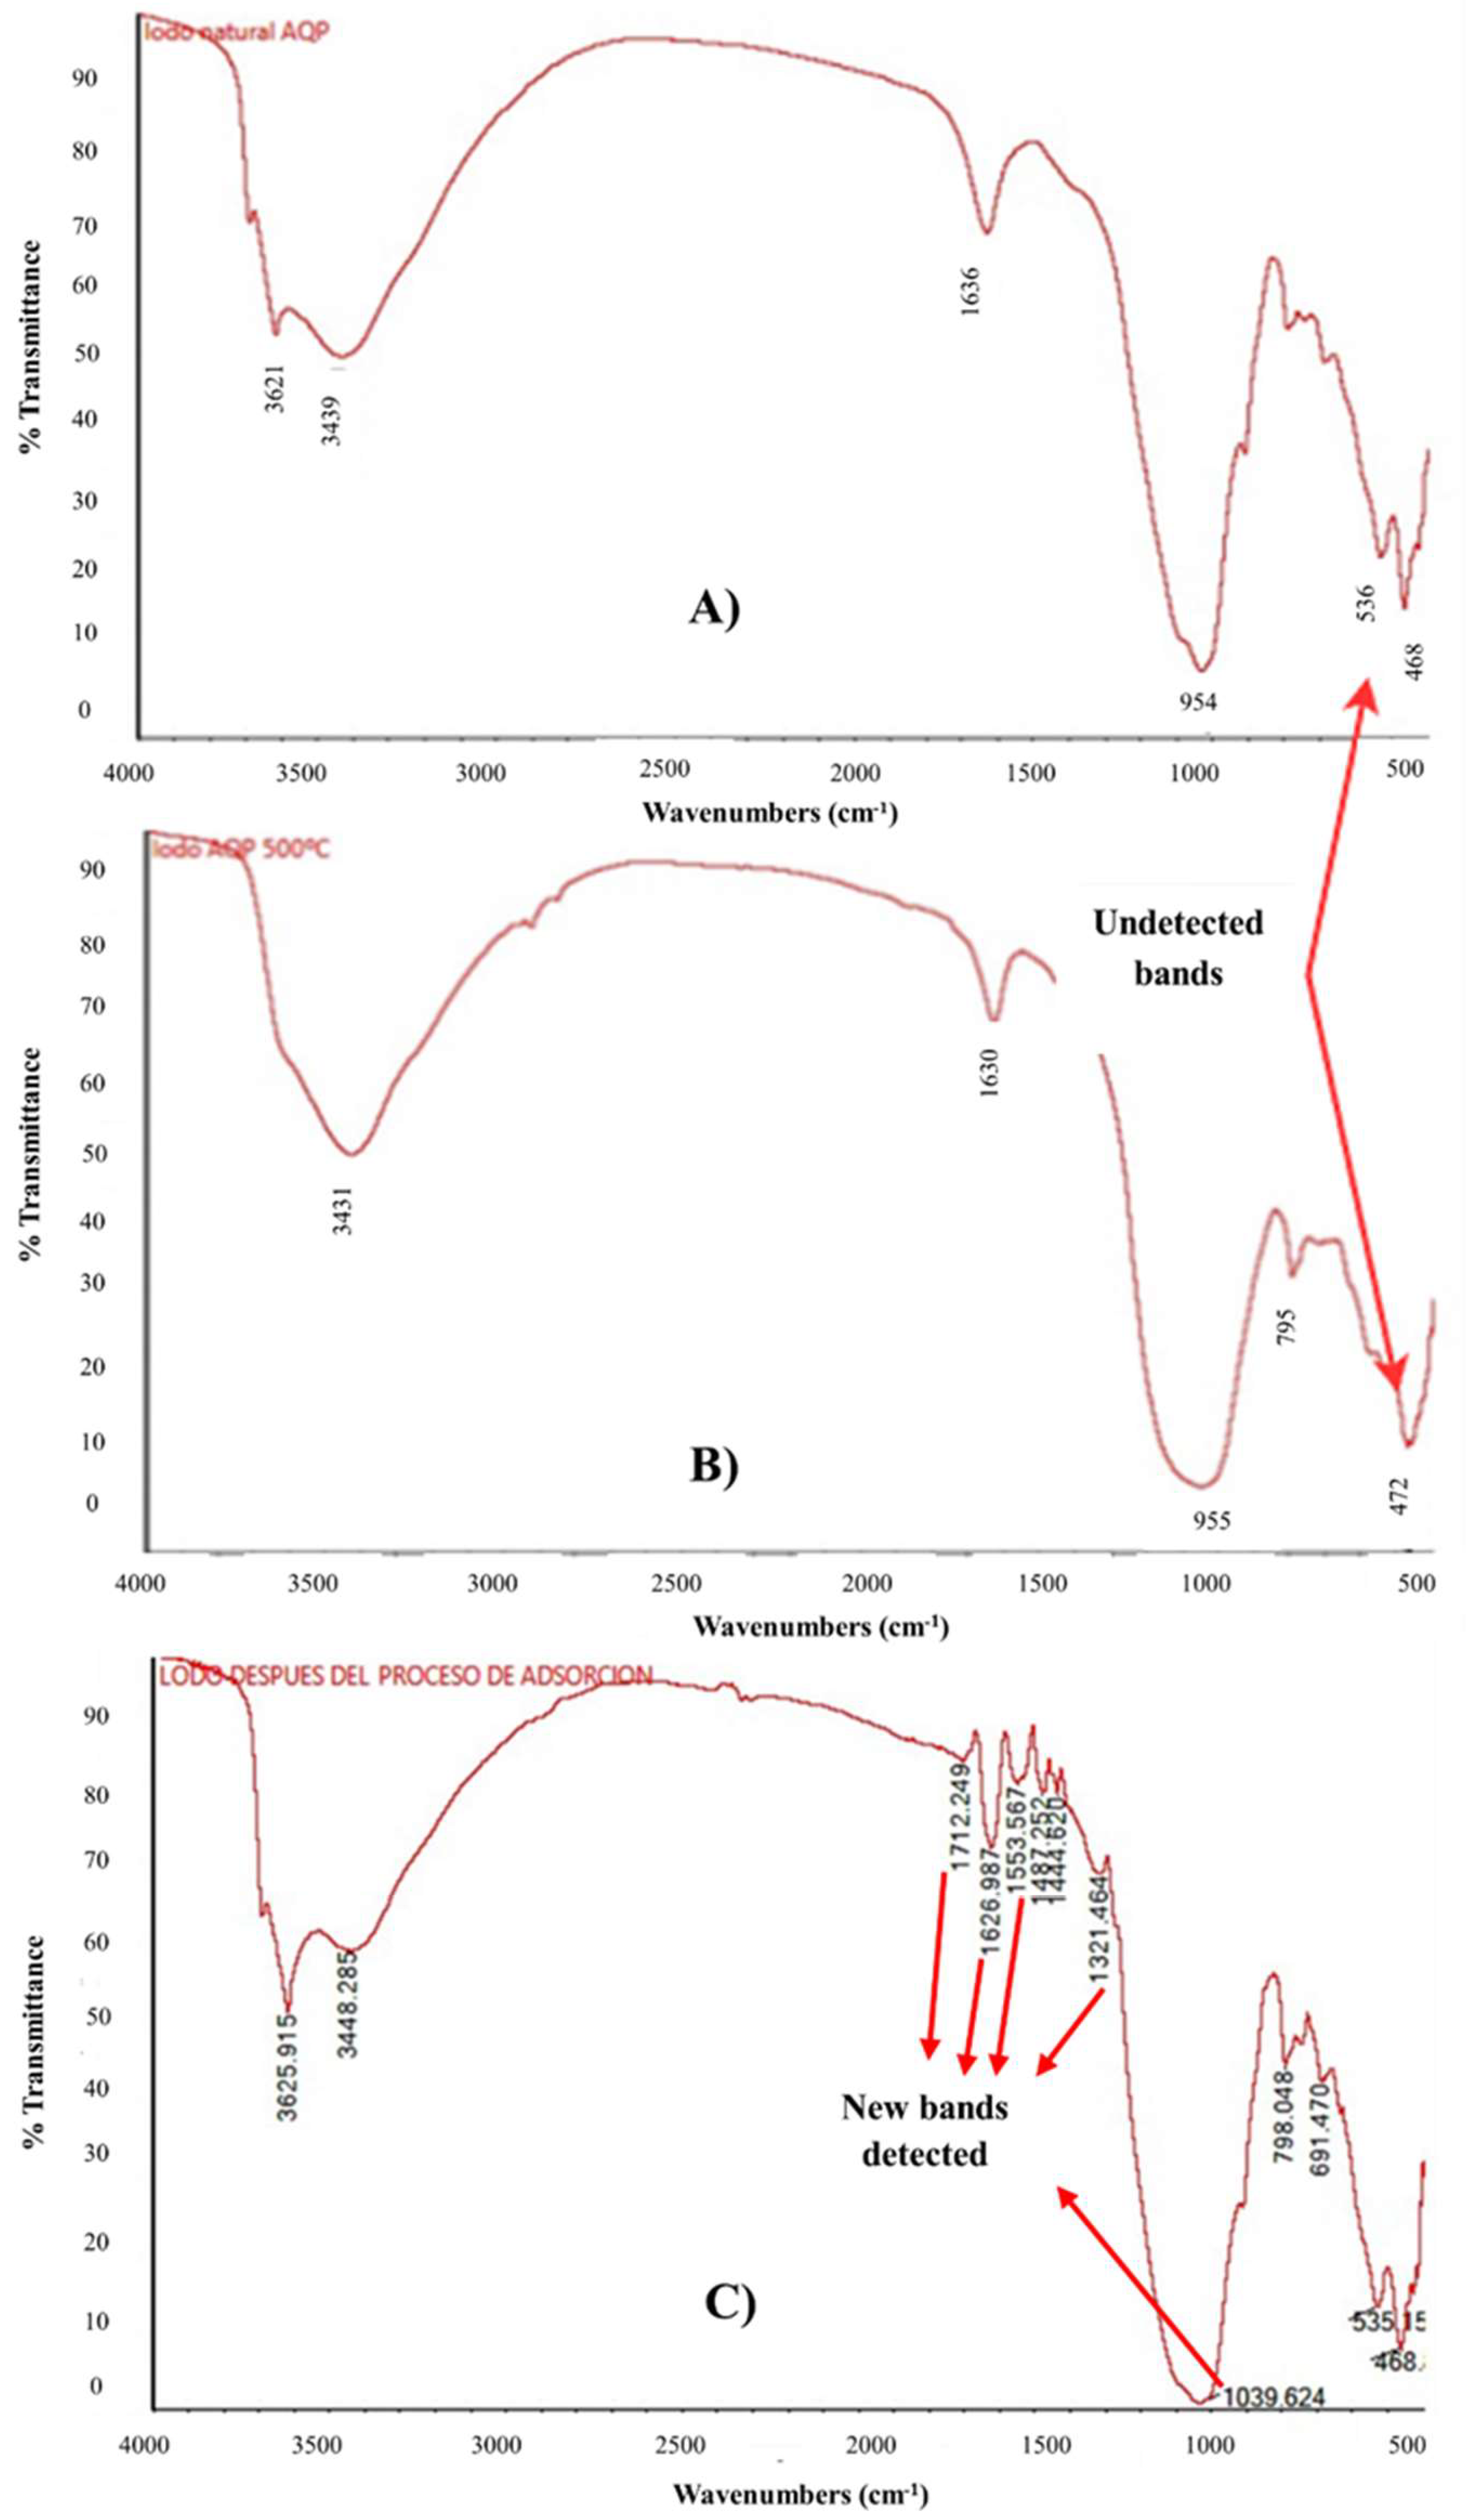
| Sample | Wave Number (cm−1) | Associated Functional Group | References |
|---|---|---|---|
| Dry DWTS | 3439 and 3621 | O-H | Dash et al. [49], Laib et al. [26], Likus et al. [30], Pigatto et al. [54], Tantawy & Mohamed [55] and Yang et al. [42]. |
| 1636 | O-H-O | ||
| 954 | Al-OH | ||
| 468 | Si-O-Si/Si-O-Al | ||
| 536 | Fe-O/Al-O | ||
| T-500 | 3431 | O-H | |
| 1630 | O-H-O | ||
| 955 | Al-OH | ||
| 472 and 795 | Si-O-Si/Si-O-Al |
| Sample | Parameter | Units | Results |
|---|---|---|---|
| DWTS | Specific surface area | m2/g | 54.77 |
| Average pore volumen | cm3/g | 0.01 | |
| Average pore diameter | nm | 3.14 | |
| T-500 | Specific surface area | m2/g | 67.90 |
| Average pore volume | cm3/g | 0.01 | |
| Average pore diameter | nm | 3.00 |
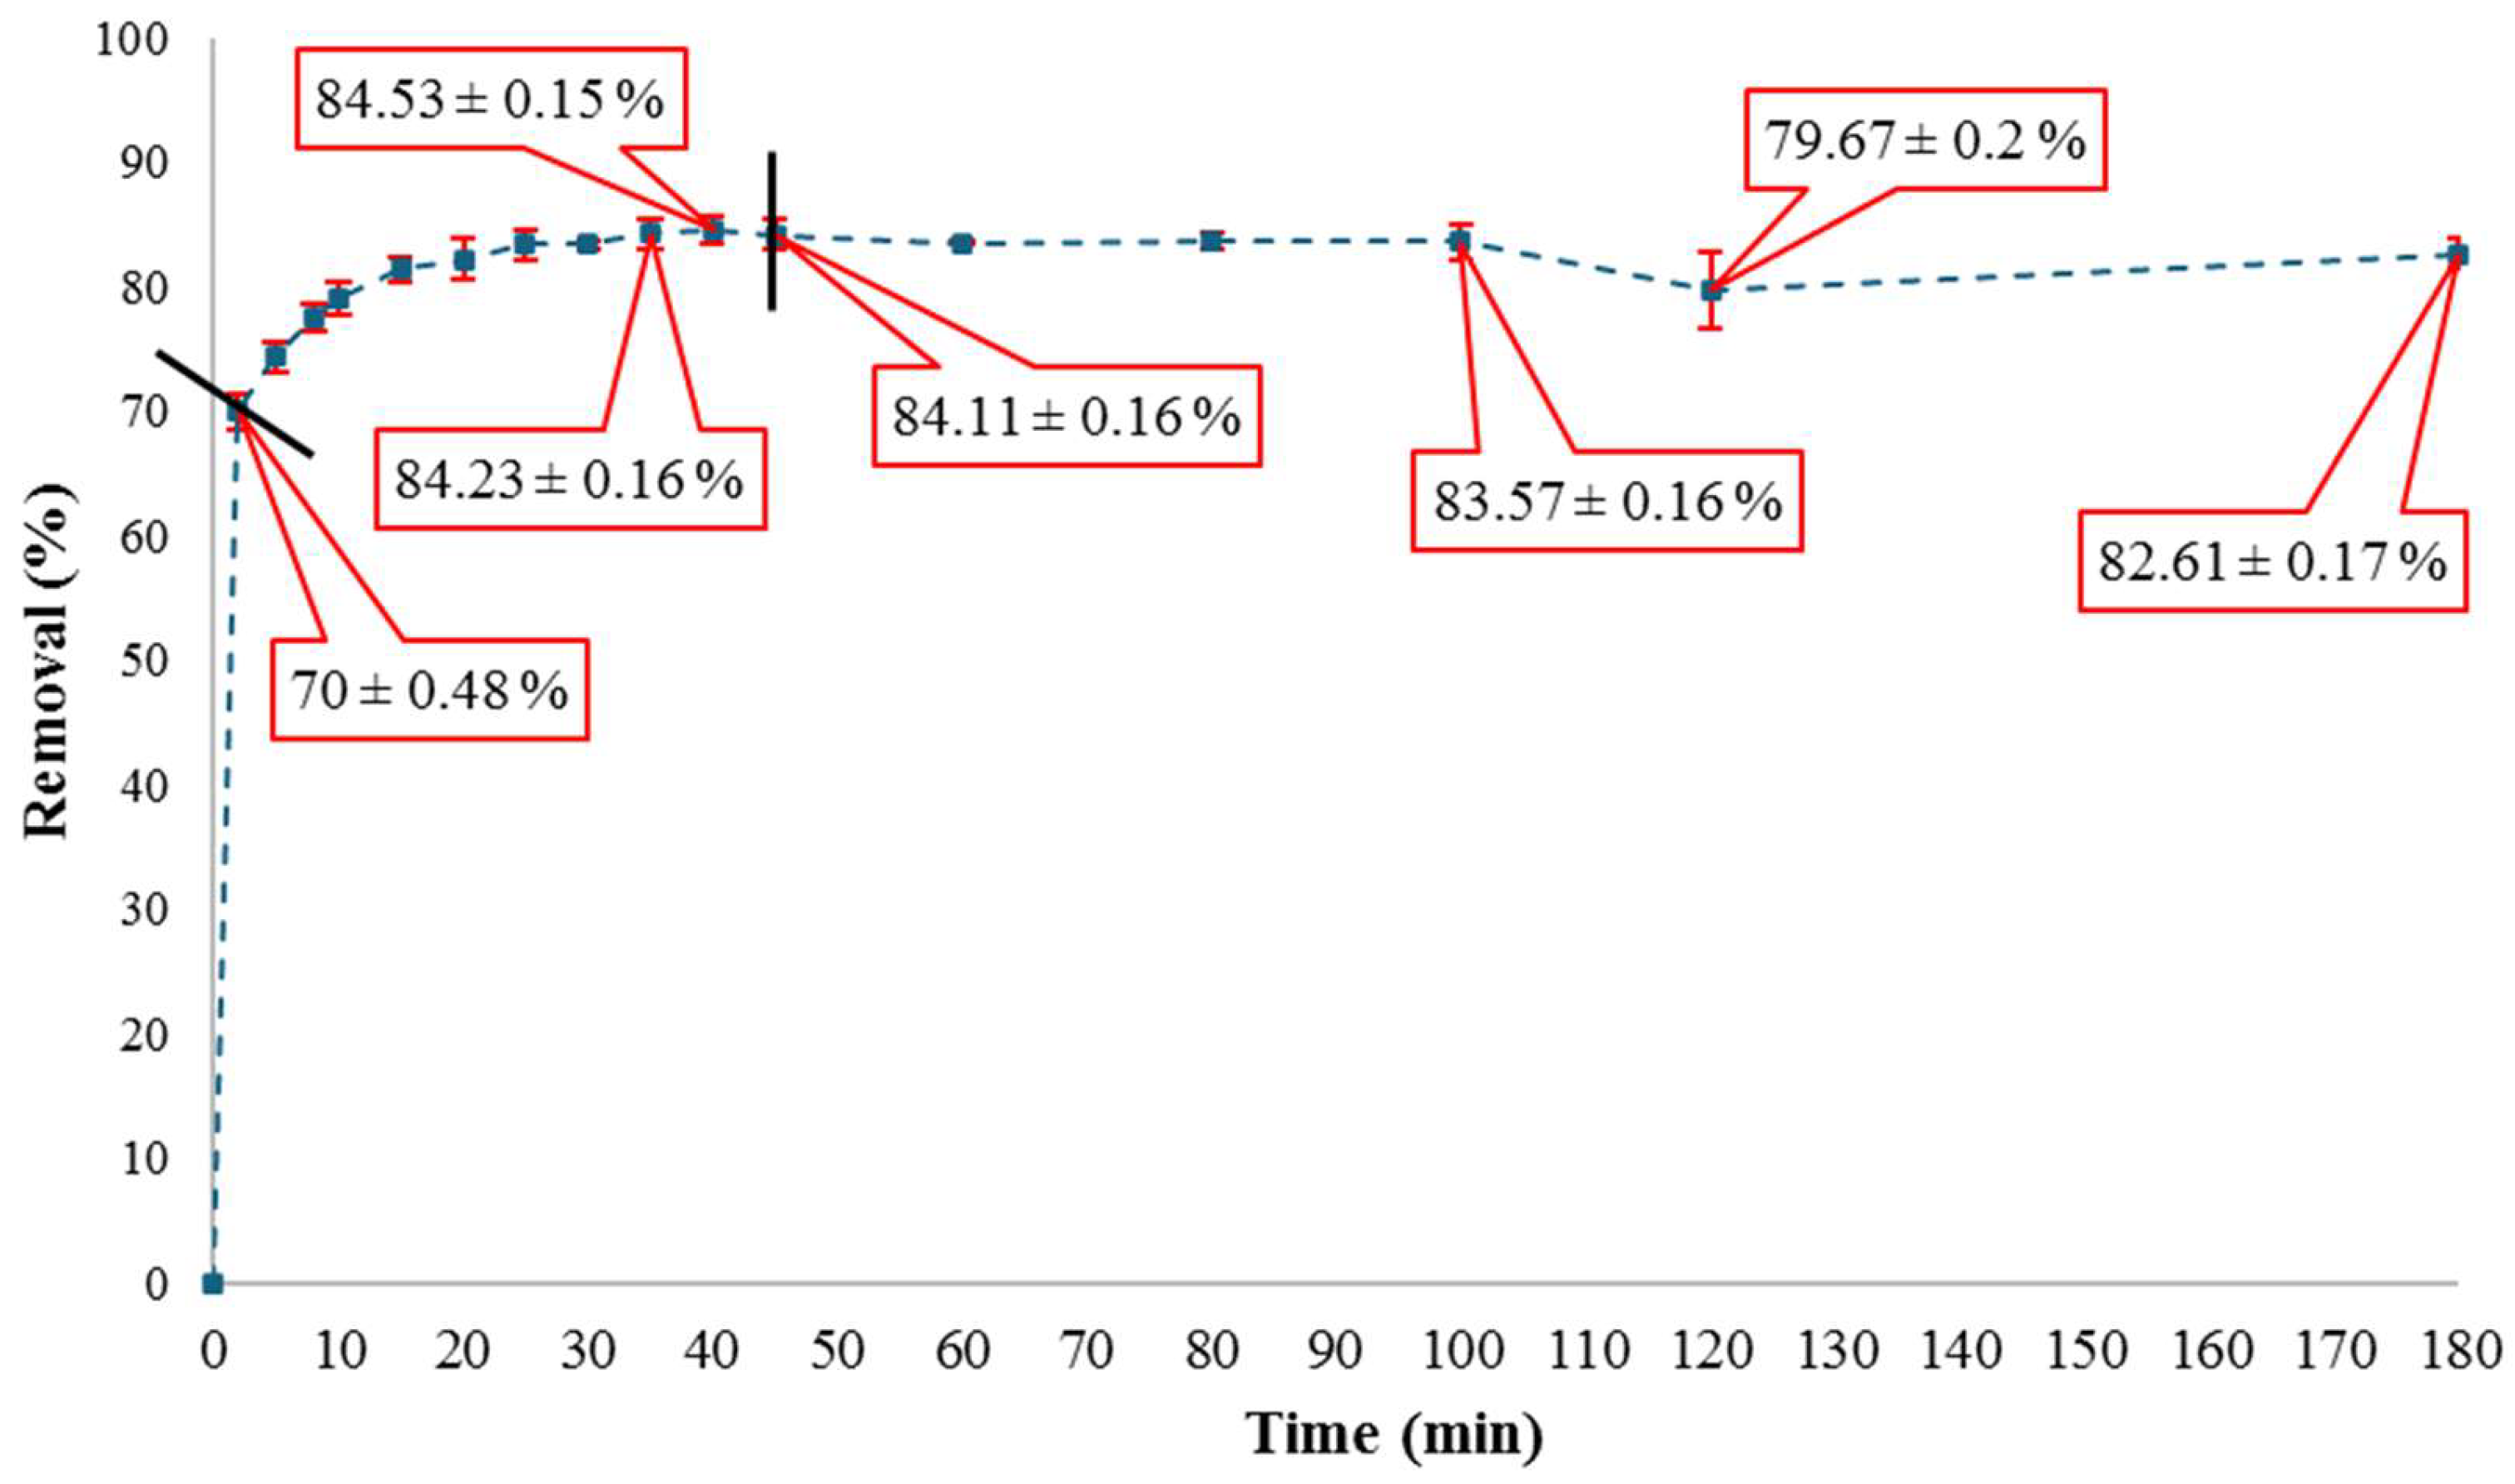
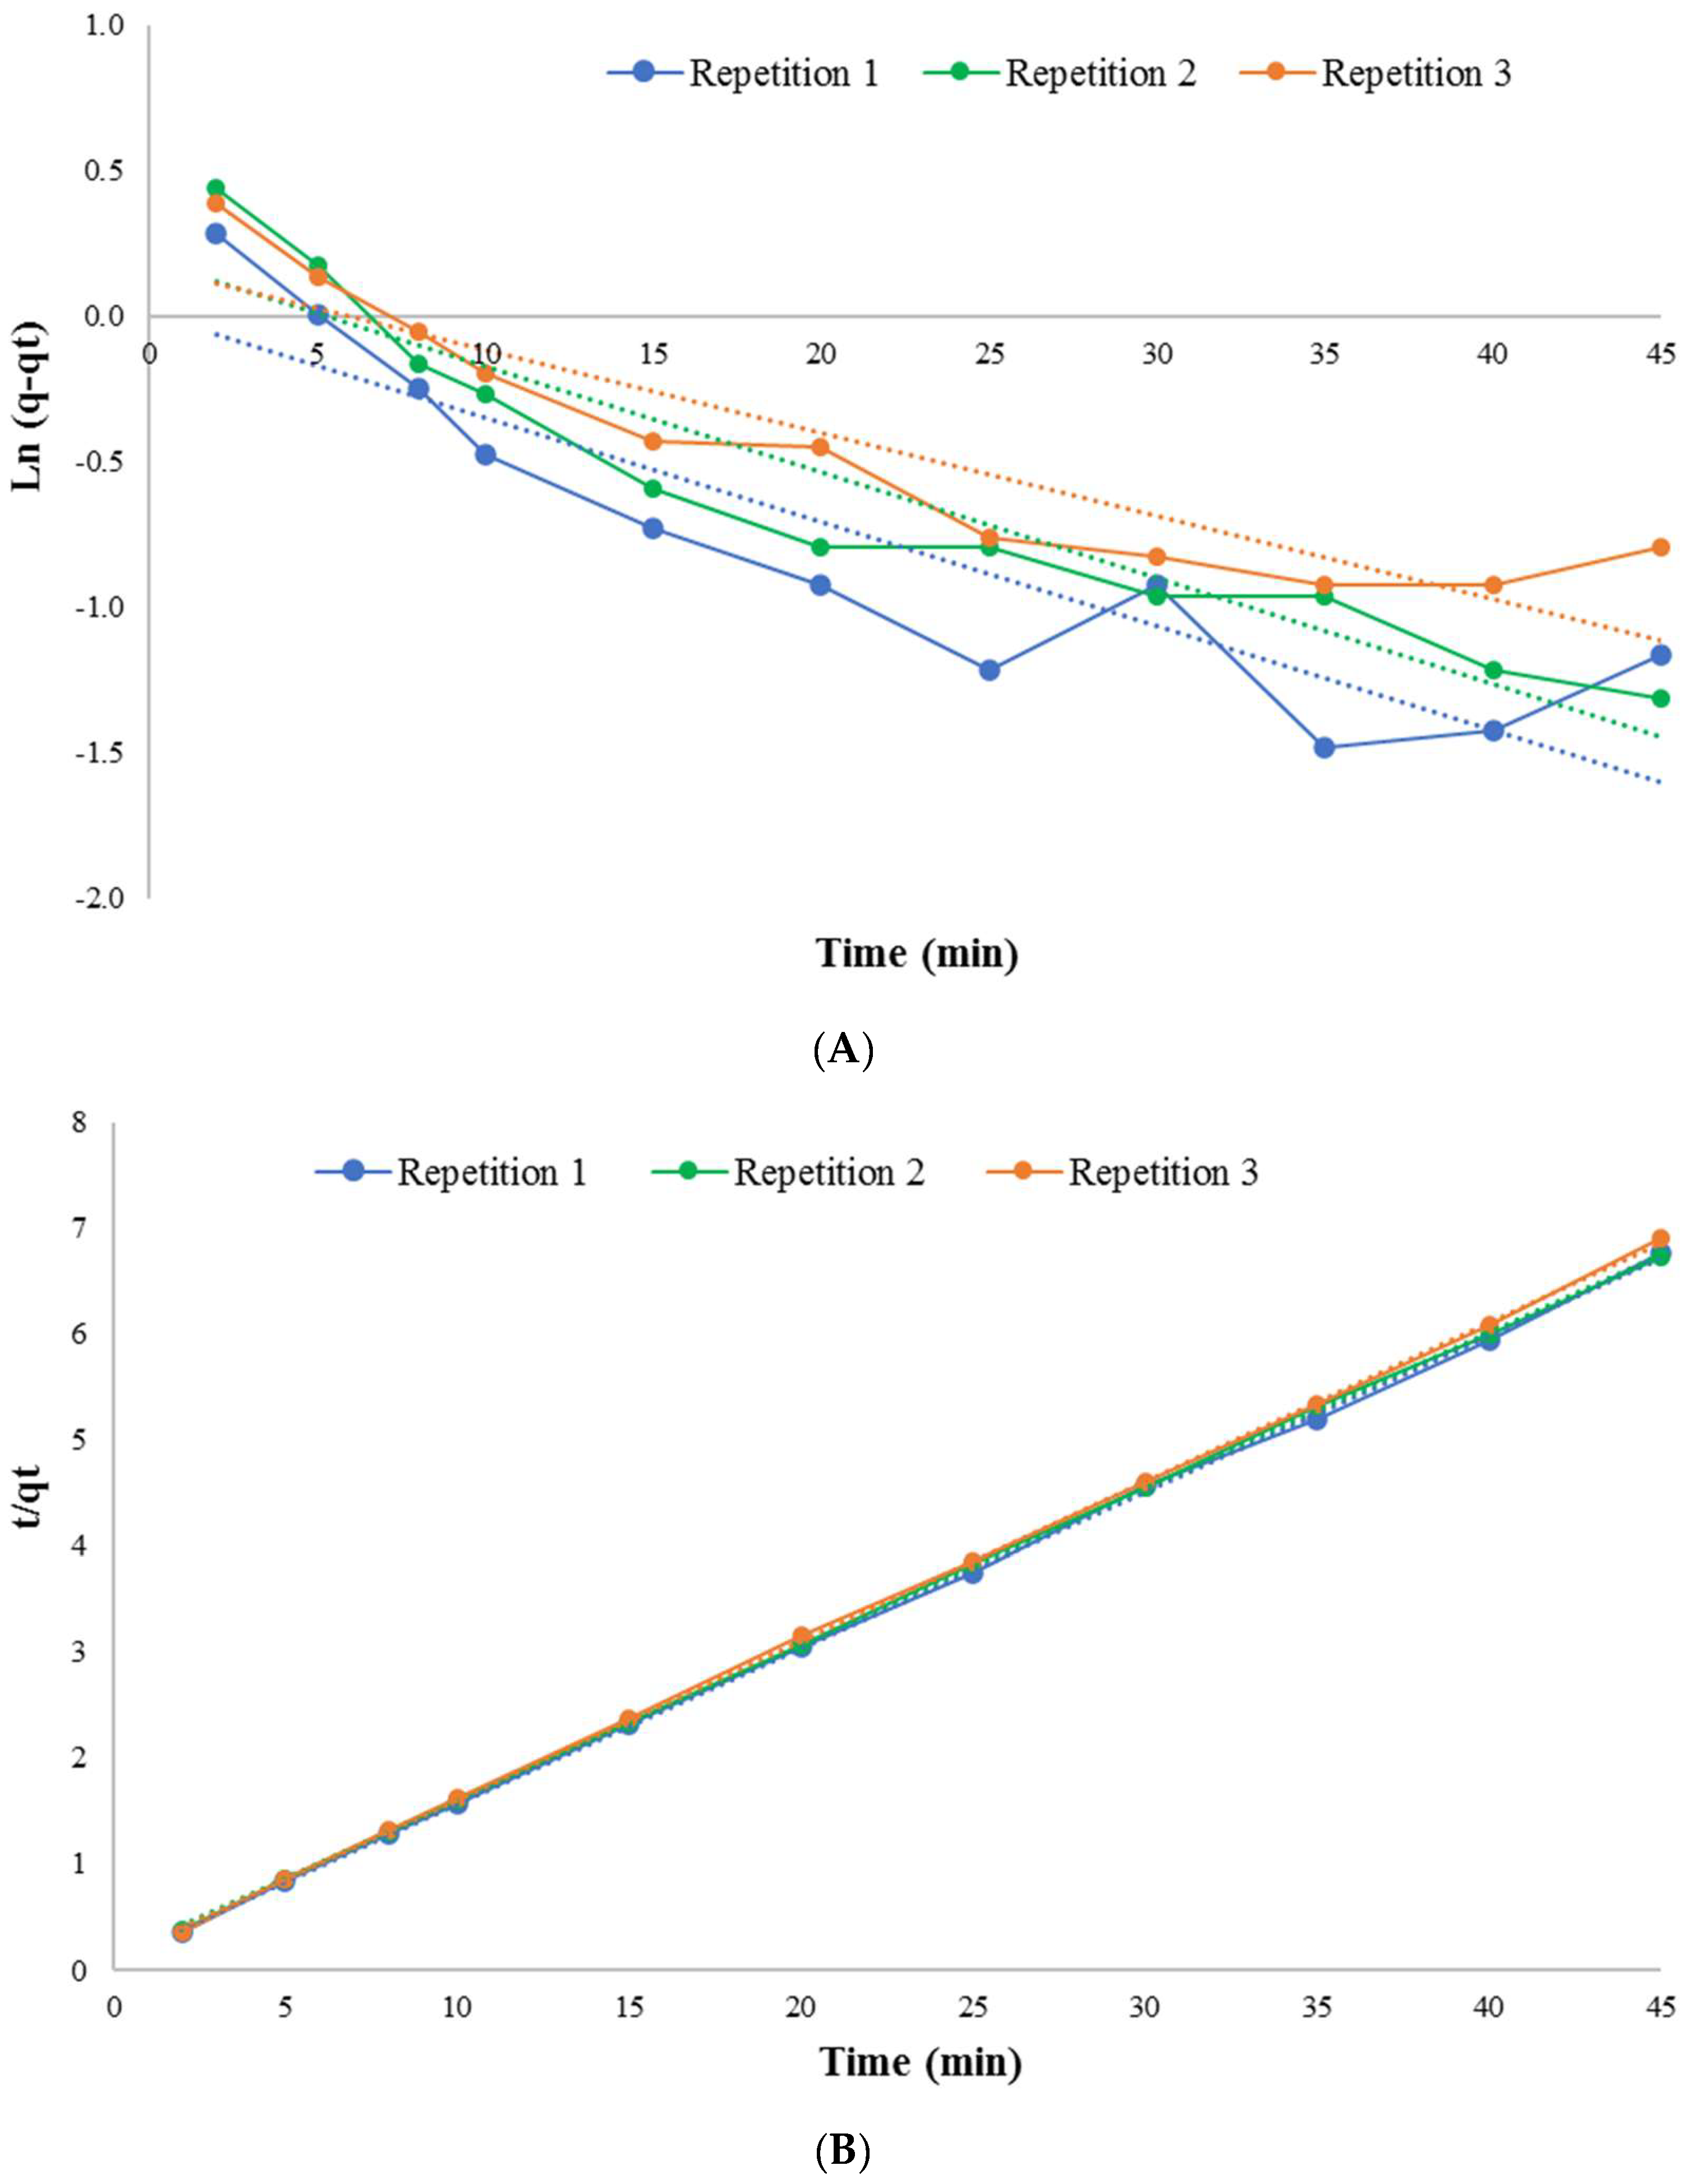
| Kinetic Model | Parameter | Unit | Numerical Value |
|---|---|---|---|
| Pseudo First Order | qe (Estimated) | mg/g | 1.22 |
| K1 | min−1 | 0.04 | |
| Linear correlation coefficient simple (R2) | - | 0.90 | |
| Pseudo Second Order | qe (Estimated) | mg/g | 8.08 |
| K2 | g/(mg·min) | 0.1 | |
| Linear correlation coefficient simple (R2) | - | 0.99 | |
| Experimental value | qe (Experimental) | mg/g | 6.96 |
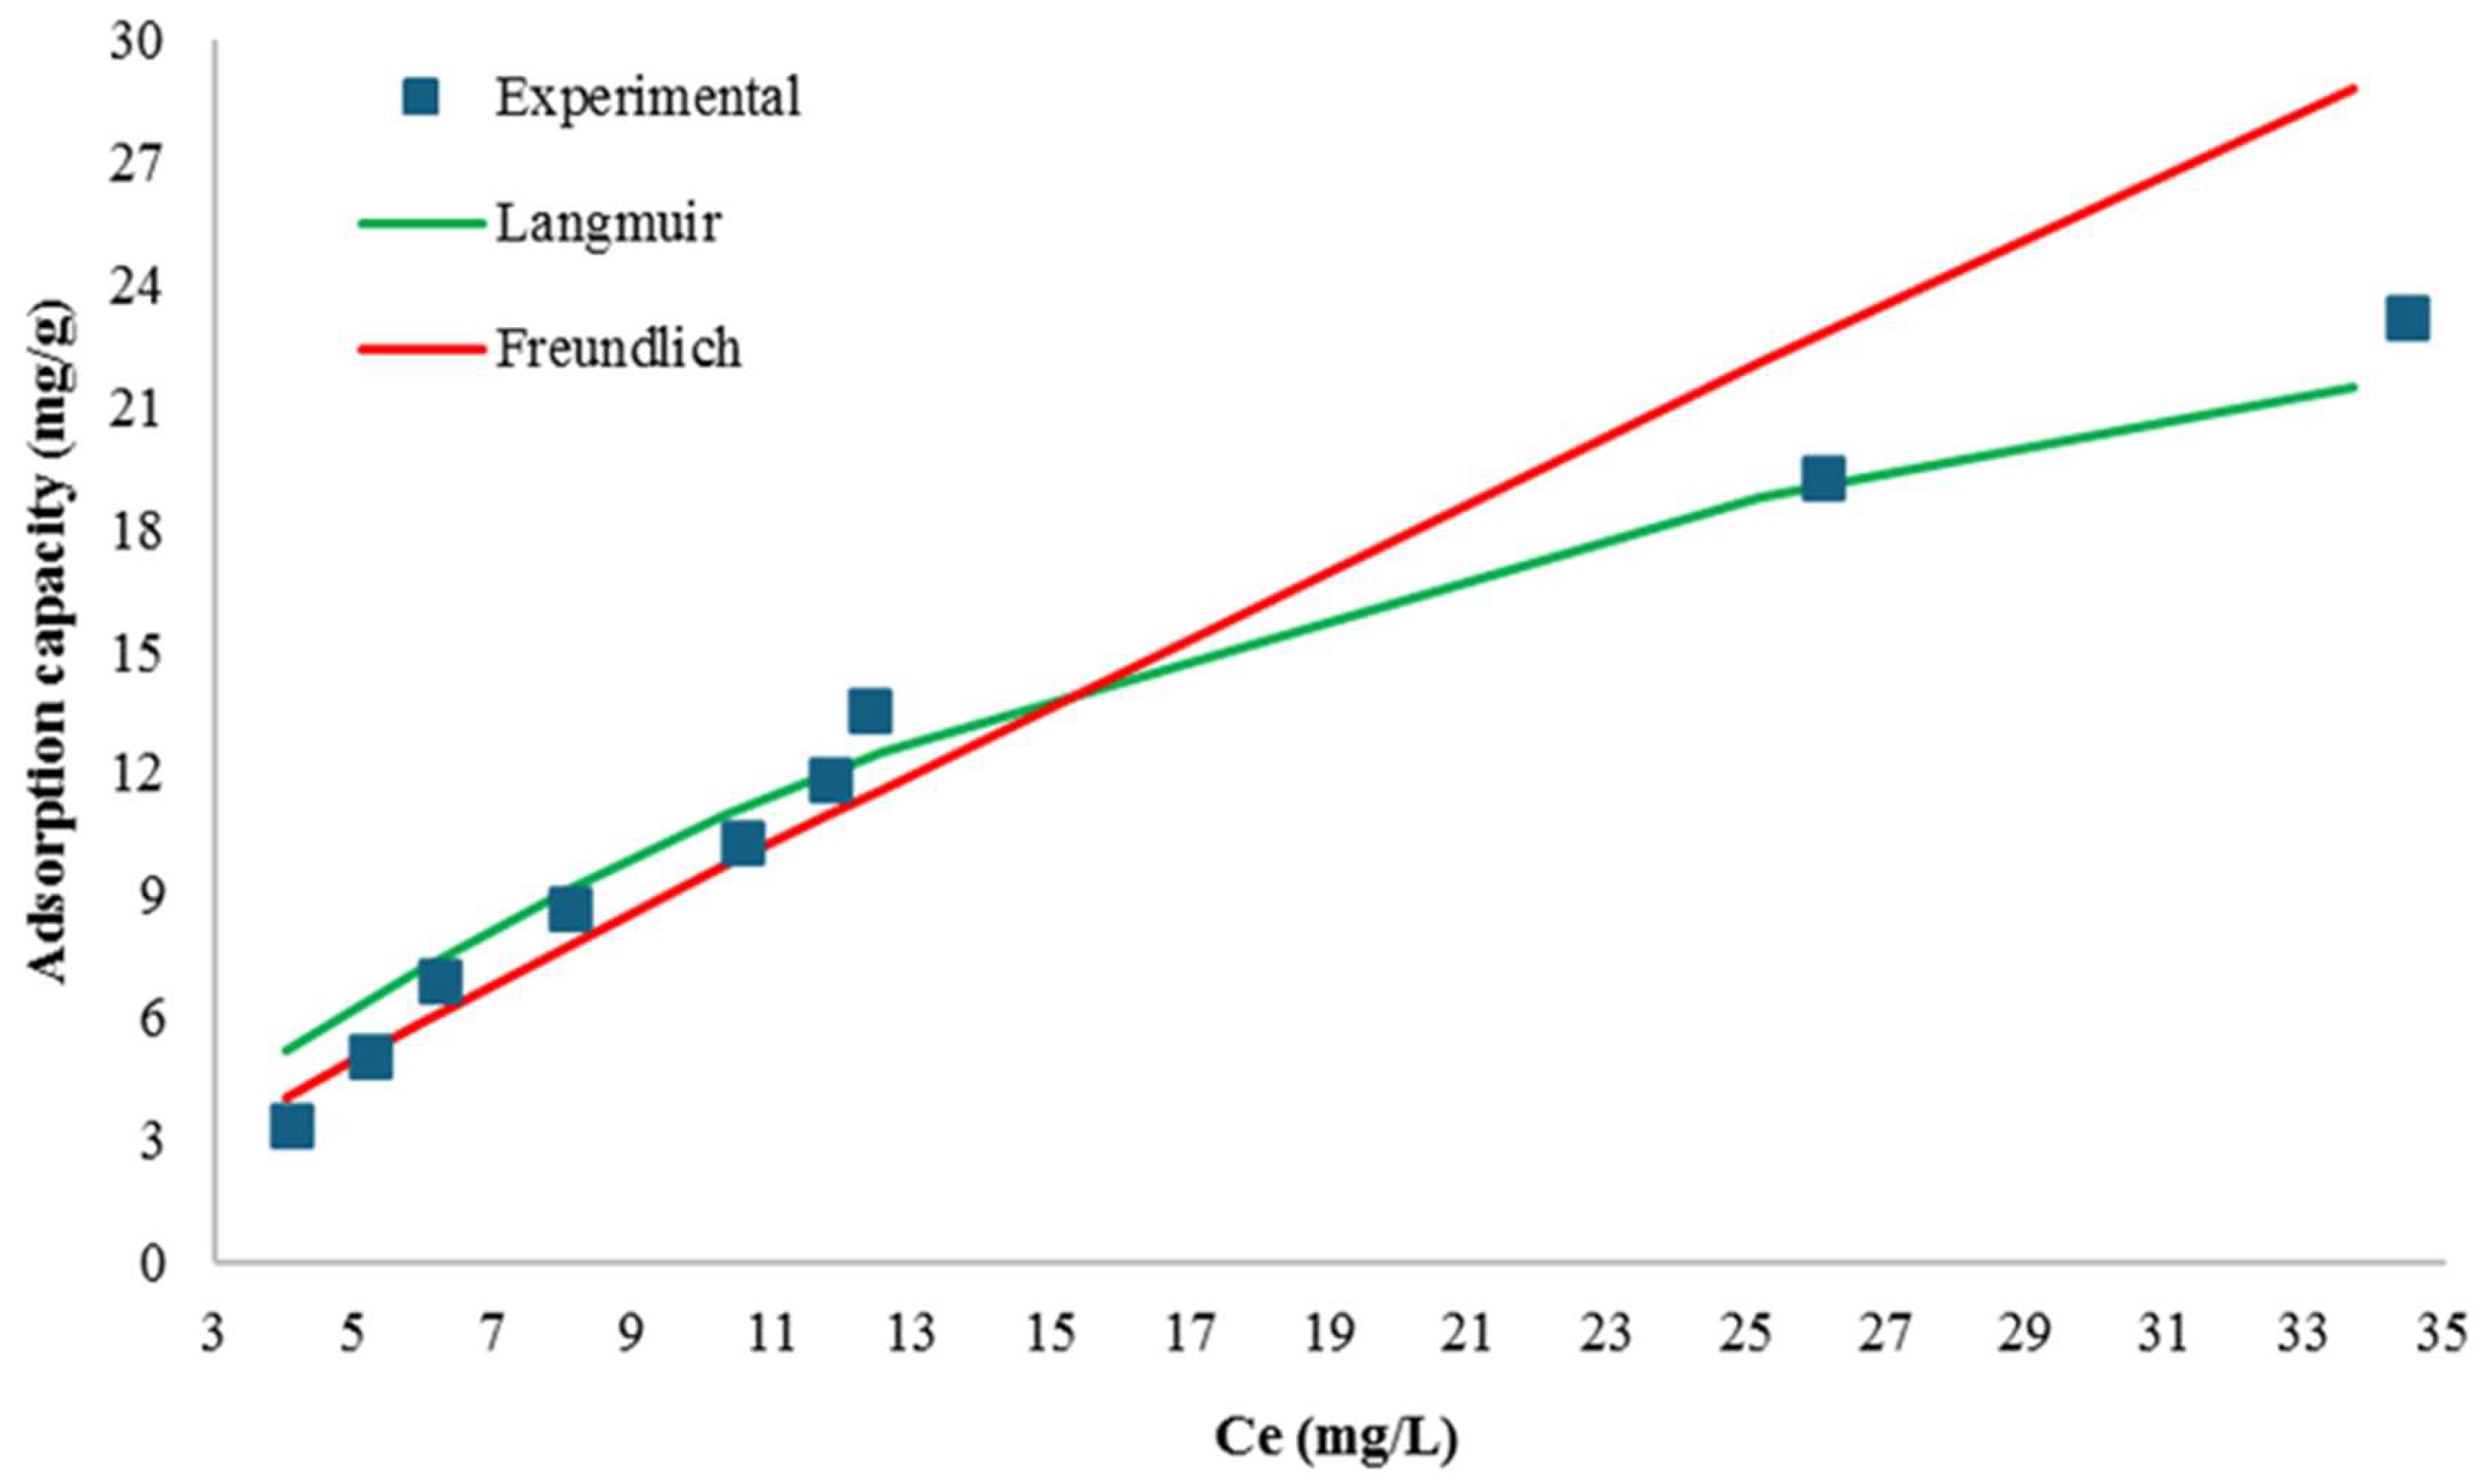
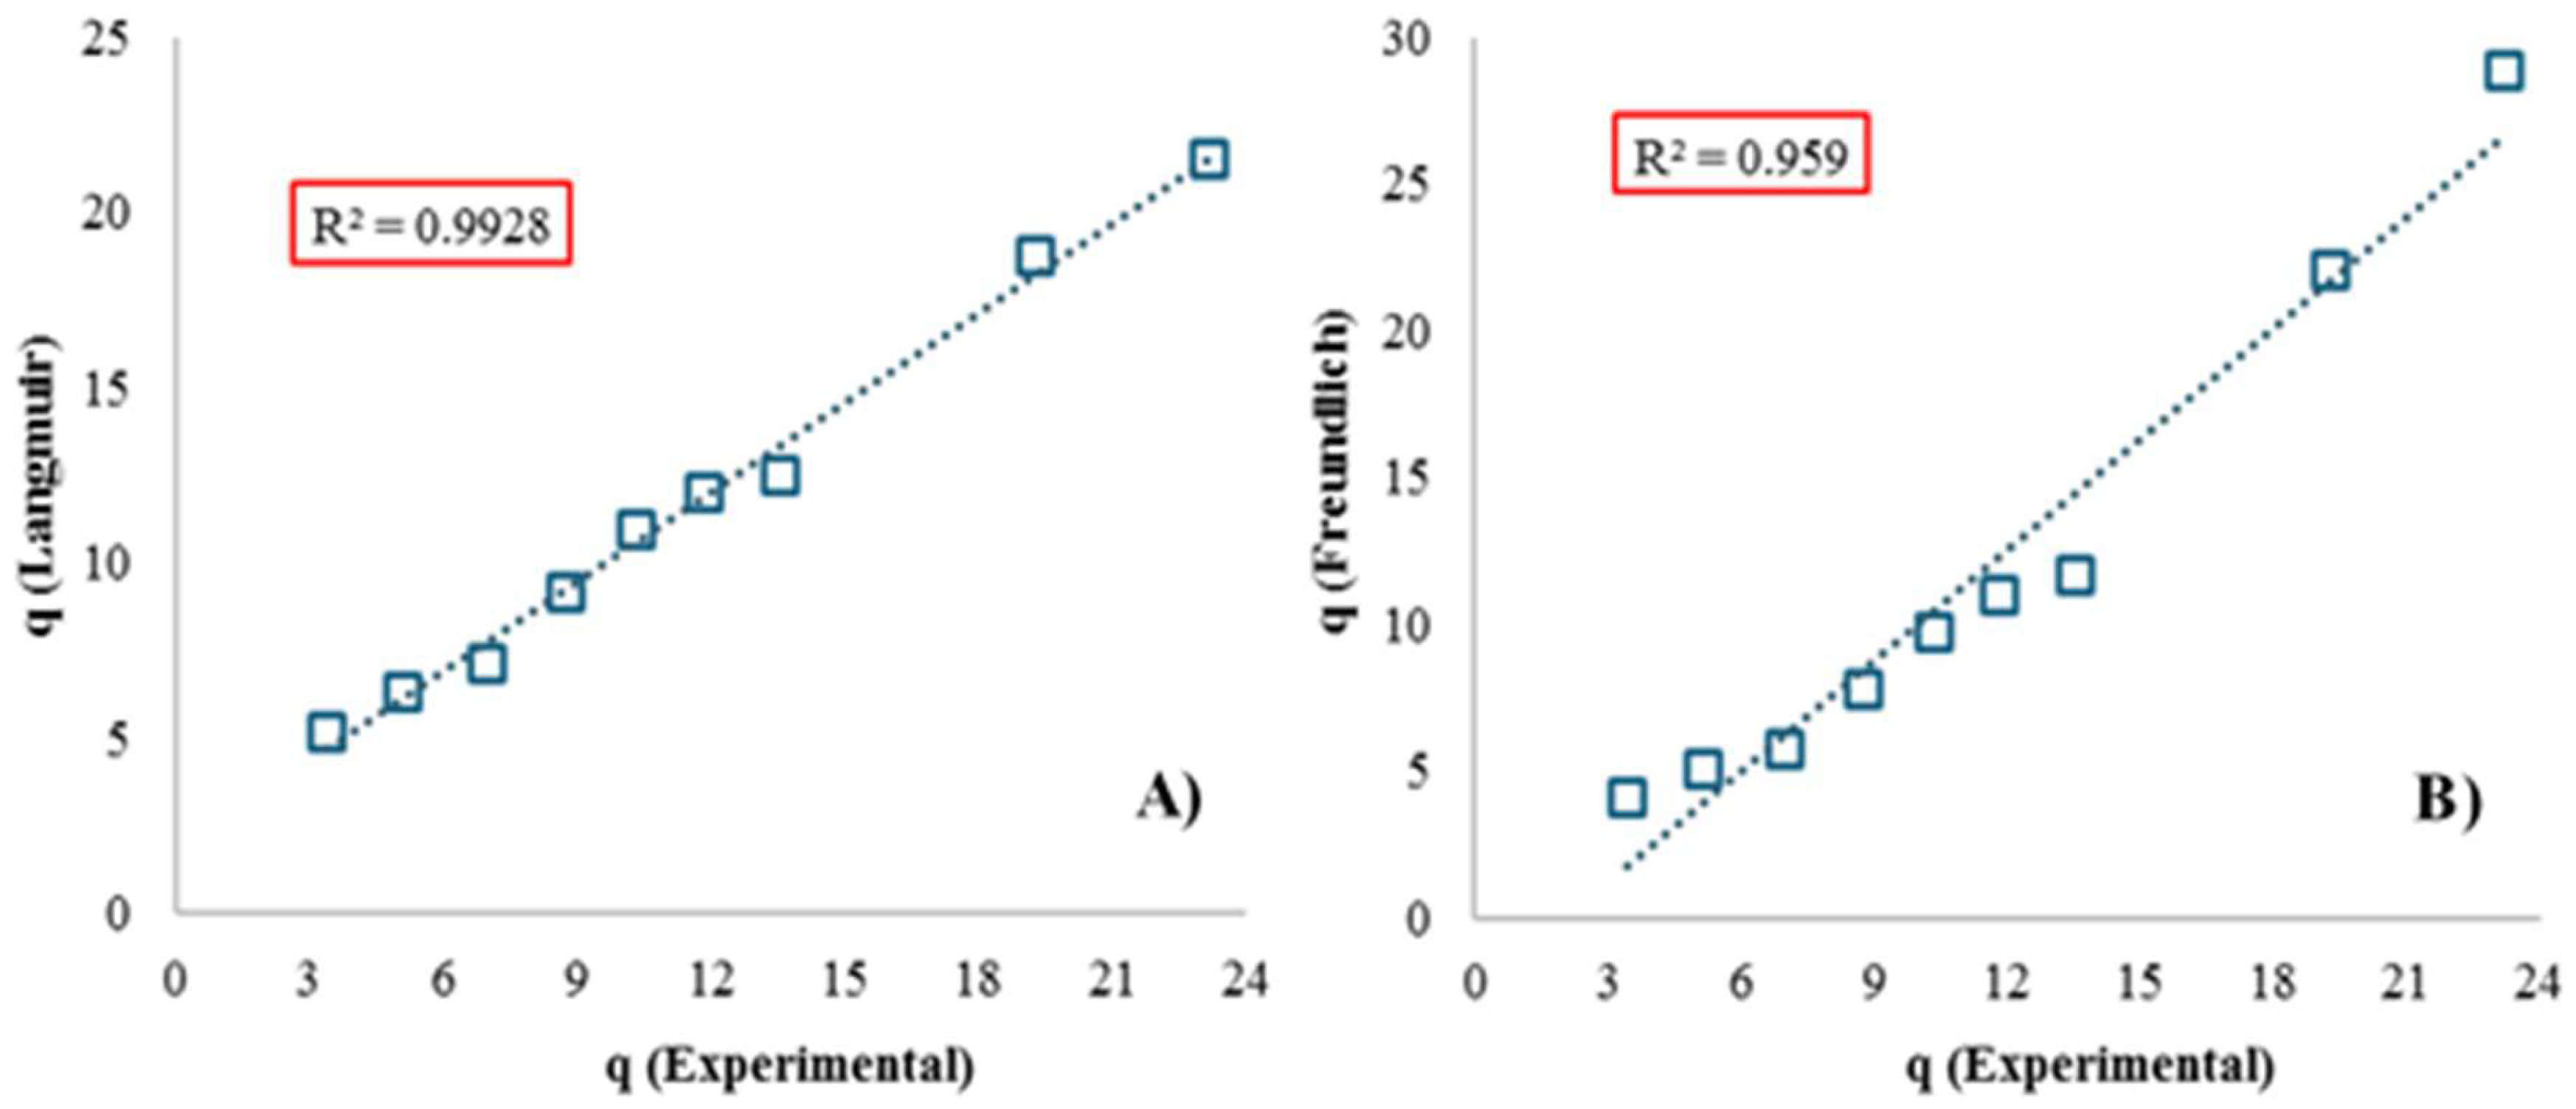
| Isotherm Model | Parameter | Unit | Numerical Value |
|---|---|---|---|
| Freundlich | KF | mg/g | 1.13 ± 0.01 |
| n | - | 1.09 ± 0.01 | |
| 1/n | - | 0.91 | |
| Mean Square Error (MSE) | - | 2.29 | |
| Simple Linear Correlation Coefficient | - | 0.96 | |
| Langmuir | KL | L/mg | 0.04 ± 0.00 |
| qmax | mg/g | 37.45 ± 0.14 | |
| RL (for all Initial Dye Concentrations) | - | 0.14–0.56 | |
| Mean Square Error (MSE) | - | 1.02 | |
| Simple Linear Correlation Coefficient | - | 0.99 |
| Adsorbent | Dye | qmax (mg/g) | R on Their BOC (%) | Reference |
|---|---|---|---|---|
| T-500 | Bordeaux B | 37.45 ± 0.14 | 85.57 | This study |
| DWTS Chemically Activated | Methyl Blue | 65.1 | 93.5 | Elmontassir et al. [23] |
| DWTS Thermally & Chemically Activated | Methyl Blue | 70.4 | 93.55 | Nageeb Rashed et al. [27] |
| DWTS Thermally Activated | Protion Blue | 6.5 | >80 | Tony [15] |
| DWTS enriched with Fe and thermally activated | Methyl Blue (MB) and Reactive Blue 19 (AR19) | 46.73 for AM and 40.65 for AR19 | 99.19% for AM and 90.31% for AR19 | Laib et al. [26] |
| Adsorbent | Dye | qmax (mg/g) | R in Their BOC (%) | Reference |
|---|---|---|---|---|
| T-500 | Bordeaux B | 37.45 ± 0.14 | 85.57 | This study |
| Coconut shell activated carbon | Basic Purple 3 | 2.8 | 93 | Wakkel et al. [68] |
| Metallurgical residue (jarosite) | Methyl Blue | 61.7 | 92.5 | Kushwaha & Agarwal [69] |
| Pistachio shell | Basic Blue 41 | 21.84 | 70 | Şentürk & Alzein [70] |
| Solid tannery waste | Methylene Blue | 99.87 | 88.8 | Sitab et al. [71] |
| Stage | Equipment | Electrical Consumption | Use Time | Price (USD) |
|---|---|---|---|---|
| Obtaining the precursor material (DWTS) | Hand sampler | - | - | 0 |
| Pretreatment (drying) | BINDER Brand stove | Approx. 1.10 kW | 24 h | 2.45 |
| Thermal activation up to 500 °C | THERMO SCIENTIFIC muffle furnace | Approx. 1.06 kW | 2 h | 0.20 |
| Total Cost | 2.65 | |||
| Cost/gran | 0.09 USD/g | |||
Disclaimer/Publisher’s Note: The statements, opinions and data contained in all publications are solely those of the individual author(s) and contributor(s) and not of MDPI and/or the editor(s). MDPI and/or the editor(s) disclaim responsibility for any injury to people or property resulting from any ideas, methods, instructions or products referred to in the content. |
© 2024 by the authors. Licensee MDPI, Basel, Switzerland. This article is an open access article distributed under the terms and conditions of the Creative Commons Attribution (CC BY) license (https://creativecommons.org/licenses/by/4.0/).
Share and Cite
Andrade, G.C.; Jiménez Orihuela, A.; Challco Hihui, A.; Tejada Meza, K.; Pacheco, C.R.; Terán Hilares, R. Environmental Sustainability of the Removal of Alpaca Fiber Dye Using a Thermally Modified Sludge from a Drinking Water Treatment Facility. Sustainability 2024, 16, 7876. https://doi.org/10.3390/su16187876
Andrade GC, Jiménez Orihuela A, Challco Hihui A, Tejada Meza K, Pacheco CR, Terán Hilares R. Environmental Sustainability of the Removal of Alpaca Fiber Dye Using a Thermally Modified Sludge from a Drinking Water Treatment Facility. Sustainability. 2024; 16(18):7876. https://doi.org/10.3390/su16187876
Chicago/Turabian StyleAndrade, Gilberto Colina, Alberto Jiménez Orihuela, Annie Challco Hihui, Kevin Tejada Meza, Claudia Revilla Pacheco, and Ruly Terán Hilares. 2024. "Environmental Sustainability of the Removal of Alpaca Fiber Dye Using a Thermally Modified Sludge from a Drinking Water Treatment Facility" Sustainability 16, no. 18: 7876. https://doi.org/10.3390/su16187876