Abstract
Urbanization affects economic production activities and energy demand, as well as lifestyle and consumption behavior, affecting carbon dioxide emissions. This study constructs the System Generalized Method of Moments (Sys-GMM) model of the impact of urbanization rate on carbon dioxide emissions based on panel data of 136 countries and regions in the world from 1990 to 2020, grounded on the extended Stochastic Impacts by Regression on Population, Affluence, and Technology (STIRPAT) model. This study found that (1) there is a negative relationship between urbanization rate and CO2 emissions from 1990 to 2020. (2) The impact of the urbanization rate on CO2 emissions is heterogeneous. An increase in urbanization rate in non-OECD countries significantly reduces CO2 emissions, while the effect is not significant in OECD countries. (3) The carbon intensity of fossil energy consumption moderates the relationship between urbanization rate and CO2 emissions, weakening the effect of urbanization rate on CO2 emissions. Based on these findings, policy recommendations such as promoting urbanization and increasing the regulation and control of fossil energy carbon intensity are proposed.
1. Introduction
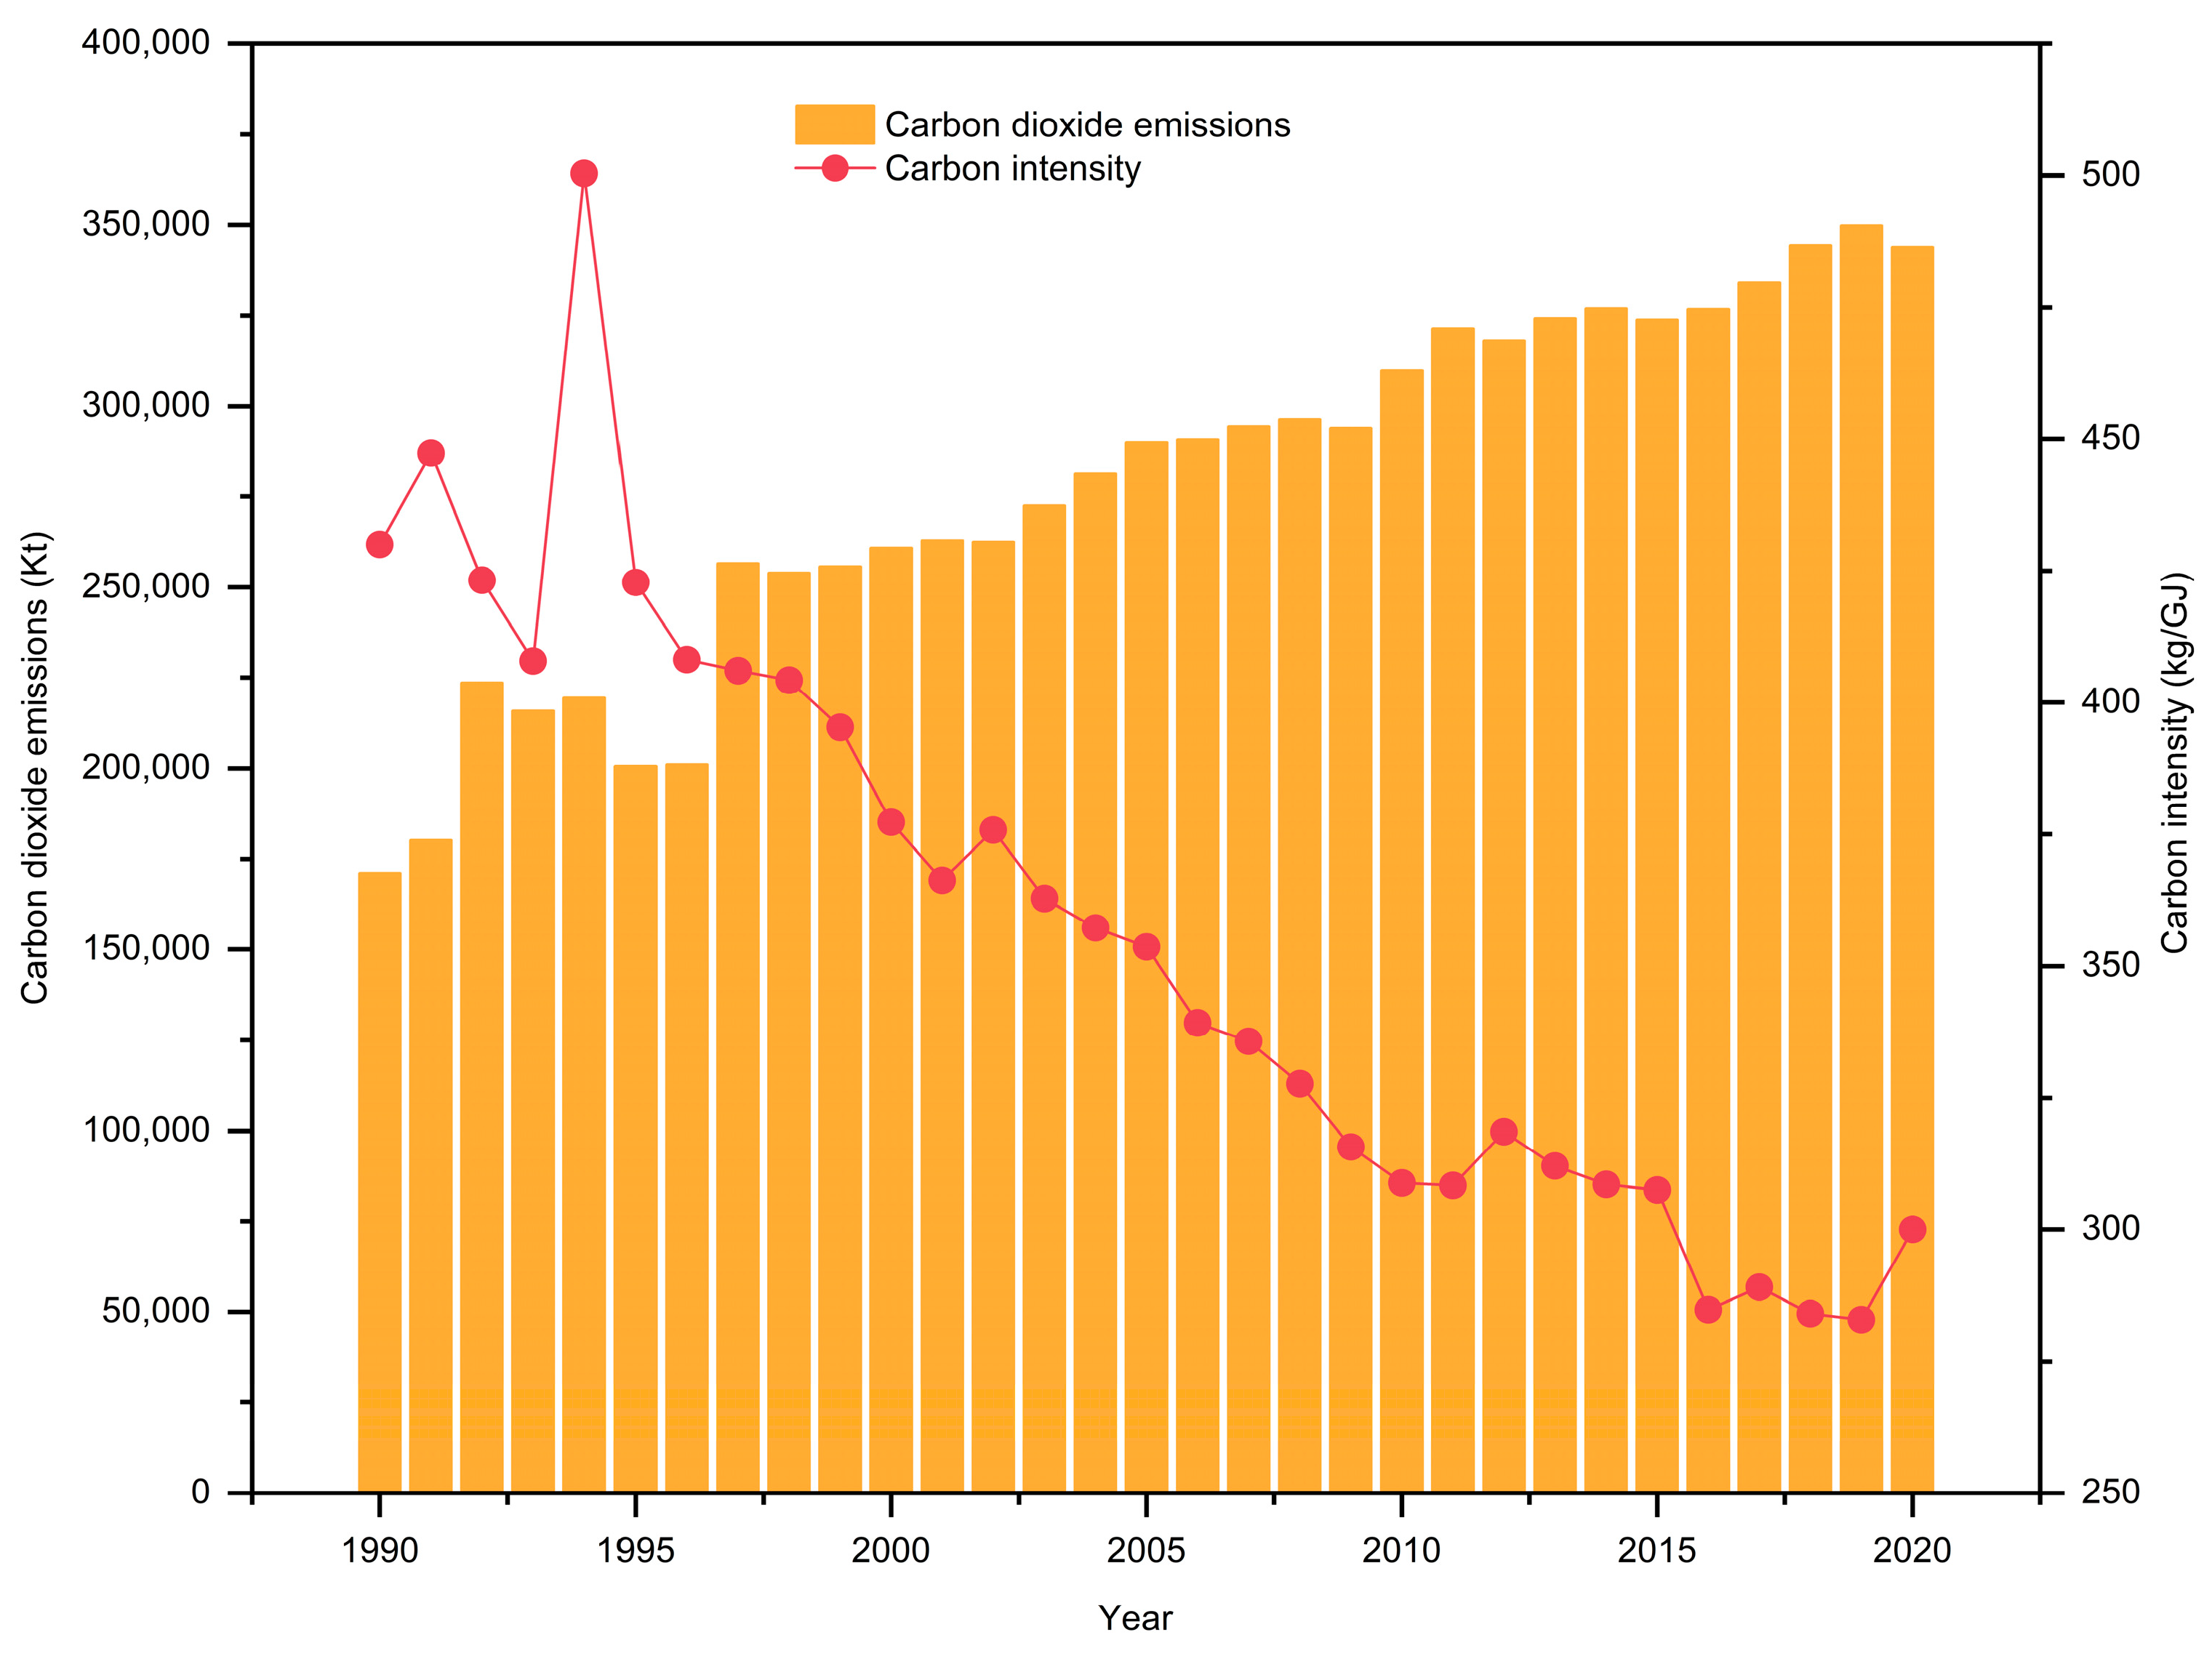
As industrialization progresses, global climate change is becoming increasingly severe. Figure 1 illustrates the average values of total carbon dioxide emissions and carbon intensity of fossil energy consumption of all countries from 1990 to 2020, showing that, with the gradual reduction in carbon intensity, the average carbon dioxide emission growth rate worldwide is decreasing annually. For a global society, an in-depth understanding of and control of the critical factors affecting the carbon emissions of greenhouse gases is important for achieving sustainable development. As urbanization affects human production and living activities as the primary source of CO2 emissions, the accelerated urbanization process in recent years has led more scholars to pay attention to the impact of urbanization on CO2 emissions.
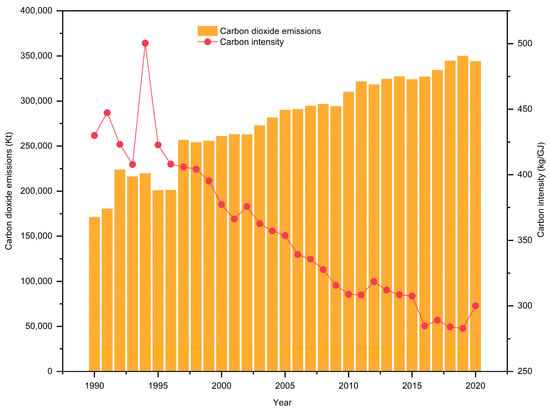
Figure 1.
World average of total carbon dioxide emissions and carbon intensity, 1990–2020.
However, the academic community is divided on the impact of urbanization on CO2 emissions. Some scholars believe that urbanization increases carbon emissions [1,2], as the urbanization process promotes CO2 emissions through infrastructure construction, the industrial and transport sectors, and increasing residential energy consumption due to rural-to-urban migration [3]. Conversely, scholars point out that urbanization decreases carbon emissions by affecting economic growth, energy efficiency, and the final energy consumption structure [4]. The construction of low-carbon infrastructures such as railways, metros, or tramways in line with green policies positively affects CO2 emissions, reducing carbon emissions [5]. Additionally, research findings indicate an inverted U-shaped relationship between urbanization and carbon emissions, with the turning point occurring at approximately 73.80% [6].
Some studies show significant international differences in the relationship between urbanization and carbon emissions, which vary widely depending on the level of economic development. Although urbanization is not conducive to the improvement of carbon emission efficiency in higher-income countries, it does improve carbon emission efficiency in lower-income countries [7].
Regarding the moderating mechanisms of urbanization rates on carbon emissions, China’s urbanization can reduce carbon intensity through technological progress, energy consumption structure, and foreign direct investment, but increase carbon intensity through industrial structure [8].
These studies collectively construct the multifaceted relationship between urbanization and carbon emissions, encompassing research across various countries and regions using multiple models and methods. This comprehensive perspective provides a rich theoretical and empirical foundation for a deeper understanding of the impact of urbanization on carbon emissions. These insights can help policymakers coordinate the conflict between urbanization and carbon emissions.
This study aims to analyze the impact of the urbanization rate on carbon emissions at the global level for 136 countries and regions by applying the Stochastic Impacts by Regression on Population, Affluence, and Technology (STIRPAT) model. A panel data analysis method is used to effectively control for country differences and time trends, thus improving the accuracy and interpretability of the model. The estimation method of the System Generalized Method of Moments (Sys-GMM) model is used to solve the possible endogeneity problem. Through this method, we expect to reveal the relationship between urbanization rate changes and carbon emissions more clearly and introduce more control variables to enhance the scientific validity of the study. This will provide a new perspective for understanding the underlying mechanism of carbon emissions and empirical support for constructing more effective carbon emission reduction policies in the future.
2. Literature Review
The following literature review (Table 1) appears following the STIRPAT model, the GMM models, the influencing factors of CO2 emissions, and the effect of urbanization on carbon emissions.
2.1. Research on Influencing Factors of CO2 Emissions Based on the STIRPAT Framework
The STIRPAT model is widely used in the field of carbon emission issues. Numerous studies have utilized the STIRPAT model to explore the factors influencing carbon emissions.
Zhang et al. [6] used panel data from 141 countries from 1961 to 2011 and employed a two-way fixed-effects model based on the extended STIRPAT frameworks. They found an inverted U-shaped relationship between urbanization and carbon emissions; the turning point is around 73.80%. Nguyen-Thanh et al. [9] incorporated FDI and urbanization into the classic STIRPAT model. They validated the pollution haven hypothesis, indicating that the affluence of the economy, urbanization, FDI, and the industrial sector contribute to harmful effects on global carbon dioxide emissions. Shen et al. [10] extended the STIRPAT model with provincial and municipal panel data from 2004 to 2015 in China to study the effects of urbanization. The findings provided a theoretical basis for developing differentiated regional environmental governance policies. Lee and Zhao [11] focused on the impact of human capital, urbanization, and FDI on carbon emissions using the extended STIRPAT with 96 counties as research objects. The results show significant heterogeneity among different countries and regions regarding the above-influencing factors, which provides a basis for formulating differentiated emission reduction policies.
The STIRPAT model is widely used to avoid omitted variables and can incorporate affluence, population, and technology into the same model. Additionally, the STIRPAT model is usually coupled with other econometric models to analyze the factors influencing carbon emissions. Next, we synthesize the GMM modeling literature.
2.2. Measurement and Estimation Methods
Guo and Chen [12] evaluated the effectiveness of China’s environmental regulations in reducing carbon emissions using the Tapio decoupling and the GMM models. The GMM model assesses the efficiency of these regulations over time, providing insights into policy effectiveness and areas needing improvement. Wang et al. [7] focuses on achieving carbon neutrality by enhancing carbon efficiency across 131 countries using a system-GMM dynamic panel analysis. It was found that there are heterogeneities in terms of urbanization, population aging, and trade openness regarding carbon emission efficiency. Liu et al. [13] explored the concept of energy vulnerability and its impact on carbon emissions based on a balanced panel dataset of 119 countries from 2000 to 2019 using the sys-GMM model. The study decomposes the total effect into scale, structural, and technology effects to investigate the impact mechanism and then examines the potential heterogeneity. Wang et al. [14] examined the impact of trade openness, human capital, renewable energy, and natural resource rent on carbon emissions using the differential GMM model. Furthermore, the study revisited the environmental Kuznets curve (EKC) hypothesis, with trade openness and renewable energy playing significant roles in reducing emissions, while natural resource rent and human capital have mixed effects. Deka et al. [15] analyzed the impact of GDP, renewable energy, and total energy supply on carbon emissions in the EU-27 countries using first difference and systems GMM models, which helps deal with endogeneity and obtain unbiased estimates.
It can be seen that the use of advanced econometric models like GMM provides robust insights into the dynamic and complex relationships between carbon emissions and various factors, such as economic growth, technological advancements, policy measures, and energy practices. The existing literature has identified many key factors that contribute to carbon emissions.
2.3. The Effect of Urbanization on Carbon Emissions
Existing studies on the relationship between urbanization and carbon emissions are conducted across various contexts. Generally, urbanization is associated with increased carbon emissions due to higher energy consumption and industrial activities [1,9,11]. However, the extent and nature of this impact vary significantly based on regional development stages, technological advancements, and policy measures.
Urbanization is a double-edged sword in developing countries, with both positive and negative effects on carbon emissions. In China, urbanization is associated with increased carbon emissions due to higher energy consumption and industrialization [3,16,17]. In ASEAN countries, there is a significant positive relationship between urbanization and carbon emissions, suggesting that urbanization may increase carbon emissions [2]. Similarly, in BRICS countries, urbanization significantly increases carbon emissions, highlighting the environmental challenges posed by rapid urban growth in these emerging economies [2,5]. However, some studies argue that urbanization could contribute to reducing the scale of carbon emissions, per capita carbon emissions, and carbon intensity [8]. In addition, Xu et al. [18] suggested that land and economic urbanization displayed a Kuznets curve relationship with carbon emissions.
In regional and sectoral studies, urbanization reduces carbon emissions by improving the public transportation system and the use of household clean energy, affecting economic growth, energy efficiency, and the final energy consumption structure [4,19,20]. Meanwhile, Huang et al. [21] found that urbanization and financial development tend to increase emissions, while the effective management of natural resources can mitigate this effect.
From the global perspective, the relationship between urbanization and carbon emissions, linear and nonlinear, has been widely confirmed by a few current studies. Some research claims that increased urbanization aggravates CO2 emissions [9,11]. In contrast, other studies found that urbanization plays a vital role in inducing carbon emissions [7,13]. Additionally, some studies have shown an inverted U-shaped relationship between urbanization and carbon emissions [6].
We find that previous studies only measured the direct effects of urbanization on carbon dioxide emissions yet did not comprehensively analyze the specific mechanisms of the moderating effects. Additionally, few studies have analyzed the long-term multilevel, heterogeneous, and lagged effects. This article aims to address the deficiencies of the previous research literature. The main contributions of this article are as follows: First, using the extended STIRPAT model, the effects of population, economy, energy intensity, carbon intensity, fossil energy share, and FDI on carbon emissions are considered, providing a new perspective on evaluating the factors influencing CO2 emissions. Second, this paper applies a dynamic panel model and the Sys-GMM method to quantify the interaction between urbanization and carbon emissions. Third, analyzing the impact of urbanization rates on the heterogeneity of impacts on OECD and non-OECD countries, this study provides an important basis for formulating CO2 reduction policies. Finally, by analyzing the moderating role of carbon intensity of fossil energy consumption in the relationship between urbanization rate and carbon emissions, this study is more representative and can better guide each country to reduce emissions.

Table 1.
Overview of the relevant literature.
Table 1.
Overview of the relevant literature.
| Paper | Country | Period | Explained Variables | Influencing Factors | Methodology | STIRPAT Model | Heterogeneity Classification Method |
|---|---|---|---|---|---|---|---|
| Wu et al. (2016) [16] | China | 1990–2012 | carbon emissions | energy carbon emission; coefficient; energy intensity; population; GDP per capita; urbanization rate | Kaya Identity formula | No | No |
| Wang et al. (2016a) [1] | Association of Southeast Asian Nations countries | 1980–2009 | carbon emissions; urban; population; energy use | carbon emissions; urban population; energy use | modified ordinary least squares technique; Granger; VECM | No | No |
| Wang et al. (2016b) [2] | BRICS countries | 1985–2014 | carbon emissions | urbanization | panel Granger causality | No | No |
| Ouyang et al. (2017) [3] | China and Japan | 1978–2011 | carbon emissions | energy structure; energy intensity; GDP; cement manufacture | cointegration model; Granger causality in the error correction modeling framework | No | No |
| Zhang et al. (2017) [6] | 141 countries | 1961–2011 | carbon emissions | total population; GDP per capita; population structure; GDP growth; trade openness; urbanization; the square of urbanization; urban agglomeration; urban primacy | two-way fixed-effects model; Two-Stage Least Squares (2SLS) | Yes | OECD countries or not |
| Guo et al. (2018) [12] | China | 2004–2015 | carbon emissions | environmental regulation; per capita real GDP | differential GMM method | Yes | geographical location |
| Yao et al. (2018) [8] | China’s 30 provincial-level regions | 2001–2014 | carbon emissions | urbanization rate; per capita gross domestic product; technological progress; industrial structure; energy consumption structure; foreign direct investment; environmental regulation | threshold effect; Mediating effect model | Yes | income level; urbanization rate |
| Xu et al. (2018) [18] | the Pearl River Delta region of China | 1990–2014 | carbon emissions | land urbanization; population urbanization; economic urbanization; urbanization | basis of a spatial agglomeration function; grey correlation model; Kuznets curve model | No | geographical location |
| Pradhan et al. (2021) [20] | G20 counties | 1961–2016 | as influencing factors | urbanization; transportation infrastructure; ICT infrastructure; economic growth | panel vector error-correction model | No | No |
| Cao et al. (2021) [19] | Henan Province in China | face-to-face survey | cooking energy grade | per capita income; aging; per capita agricultural income; number of permanent residents; non-agricultural population; cultivated land area; distance to nearest city; household head age | logistic regression | No | No |
| Wang et al. (2021) [4] | OECD countries | 1960–2014 | carbon emissions | urbanization; GDP per capita; energy intensity; population; energy consumption structure | dynamic panel autoregressive distribution lag | No | income level |
| Wang et al. (2022) [7] | 131 counties | 1996–2015 | carbon emission efficiency | aging population; urbanization; foreign trade; renewable energy; industrialization | systematic GMM; entropy method | Yes | income level |
| Shen et al. (2022) [10] | China | 2004–2015 | residential and industrial wastewater and waste gas | urbanization; province GDP; energy use efficiency; innovation; openness; industrial structure; construction industry | spatial Durbin model | Yes | geographical location |
| Nguyen-Thanh et al. (2022) [9] | 96 countries | 2004–2014 | carbon emissions | total population; real per capita GDP; energy intensity; the percentage share of industry (including manufacturing) and service sectors value-added in GDP; the percentage of the total population living in urban areas; FDI-inflows | different GMM | Yes | income level |
| Lee et al. (2023) [11] | 96 counties | 2000–2020 | carbon emissions | population size; GDP per capita; technological level | finite mixture model | Yes | income level |
| Liu et al. (2023) [13] | 119 counties | 2000–2019 | carbon emissions | energy vulnerability; economic growth; energy efficiency; urbanization evolution; trade openness | systematic GMM | Yes | income level |
| Xiao et al. (2023) [17] | China | 2009–2020 | carbon emissions | total urban population; urban population density; urban building areas; value added of the tertiary industry; per capita value added of the tertiary industry; the proportion of tertiary industry; urban population proportion; per capita urban building areas; plot ratio of the urban buildings; urban green areas; per capita urban green areas; green coverage rate of built-up area | panel data model | No | geographical location |
| Gnangoin et al. (2023) [5] | 30 Belt and Road Initiative countries | 1980–2019 | carbon emissions | urbanization; human capital; square of human capital | feasible generalized least squares; 2SLS | Yes | No |
| Wang et al. (2023) [14] | 208 counties | 1990–2018 | pollution emissions | economic growth; trade openness; renewable energy consumption; human capital; natural resource rents | differential GMM | Yes | geographical location |
| Deka et al. (2023) [15] | EU-27 | 1990–2019 | carbon emissions | GDP; population size; renewable energy; primary energy supply; capital stock; effective capita | first difference and systems GMM | No | No |
| Huang et al. (2023) [21] | USA | 1995–2015 | carbon emissions | urbanization; financial development; natural resource rent | quantile autoregressive distributed lagged model | No | No |
3. Material and Methods
3.1. Theoretical Model
This study employed an extended STIRPAT model, and regression analysis was conducted using the Sys-GMM method. The STIRPAT model is a stochastic form of the IPAT identity, which was initially proposed by Ehrlich and Holdren in 1972 and has since become a classic theoretical framework in the field of environmental economics [22,23,24]. The basic expression of the IPAT model is as follows:
where I represents the impact of human activities on the environment, including carbon emissions, resource and energy consumption, etc.; P represents population size; A represents affluence, typically represented by per capita wealth; and T represents the level of technology.
I = P × A × T,
This model analyzes the impact of human activities on the environment and provides a theoretical basis for a deeper understanding of carbon emission mechanisms. While this theoretical framework provides insights into the trends of carbon emissions growth, it also offers a foundation for understanding the impact of changes in urbanization rates on carbon emissions. However, this model is simplistic and assumes proportional effects of each influencing factor. To address this limitation, Dietz and Wa [25] proposed the STIRPAT model, which has the following basic expression:
where a is the constant term of the model; b, c, and d are the respective coefficients of the independent variables; and e is the error term. STIRPAT is a multivariate nonlinear model. To analyze the effects of various factors on I, Equation (2) can be transformed into its linear form through logarithmic processing:
the regression coefficients b, c, and d represent the elasticity coefficients between the dependent and independent variables, indicating the percentage change in the dependent variable resulting from a 1% change in the independent variable, while other independent variables remain constant.
I = a × bP × cA × dT × e,
lnI = lna + blnP + clnA + dlnT + lne
This study extends the STIRPAT model by introducing the urbanization rate to examine the impact of urbanization on carbon emissions. The extended STIRPAT model is formulated as follows:
where the environmental pressure variable I is represented by carbon dioxide emissions; the population scale variable is defined by the core explanatory variables urbanization rate (URB) and total population (P); the wealth level A is represented by per capita gross domestic product (GDP); the technological level is defined by energy intensity (EI), carbon intensity (CI), the proportion of industry sectors and service sectors value added in GDP (IS and SS), energy structure (ES), net foreign direct investment as a percentage of GDP (FDI), and the degree of trade openness (TO); wt represents the time period dummy variables; and Δuit is the error term.
lnI = b1lnP + b2URB + b3lnA + b4lnA2 + b5lnEI + b6lnCI + b7SS + b8IS + b9ES + b10FDI + b11TO + wt + Δuit,
In this study, the greenhouse gas emissions of carbon dioxide equivalents are selected as the dependent variable, representing carbon emissions. The proportion of the urban population to the total population is chosen as the core explanatory variable, representing the urbanization rate. Variations in urbanization may directly influence economic production activities, energy demand, lifestyle, and consumption behaviors, affecting energy usage and waste emissions. Thus, changes in urbanization rate may directly impact carbon emissions.
As the control variables, the total population is a fundamental characteristic of a country or region and may positively correlate with carbon emissions, as a larger population may imply greater energy demand. Per capita GDP is typically associated with living standards and energy consumption levels, considering the possibility of a Kuznets curve; hence, the quadratic term of per capita GDP is included. Energy intensity represents the energy consumption required per unit of GDP and may affect changes in carbon emissions while per capita GDP increases. CI represents the carbon emissions generated per unit of energy consumption and is crucial for understanding the environmental impact of energy structures. The industrial and service sectors’ proportional contribution to GDP reflects the development of these sectors, which may have different impacts on energy demand and carbon emissions, especially in highly technologically intensive service areas. The share of fossil fuel consumption represents the energy structure, and different energy structures may lead to different carbon emission effects, primarily because renewable energy sources may reduce carbon emissions compared with fossil fuels. There are two mechanisms for how trade openness and FDI influence the environment. The pollution halo hypothesis presumes that foreign investment and trade openness may lead to technology transfer, improvement, and industrial restructuring, thereby reducing carbon emissions. Conversely, the pollution haven hypothesis assumes that it may also introduce energy-intensive industries or transfer industries with high carbon emissions, thereby increasing carbon emissions [11,26]. This study uses the export-plus-import ratio of GDP to represent trade openness [27].
3.2. Materials
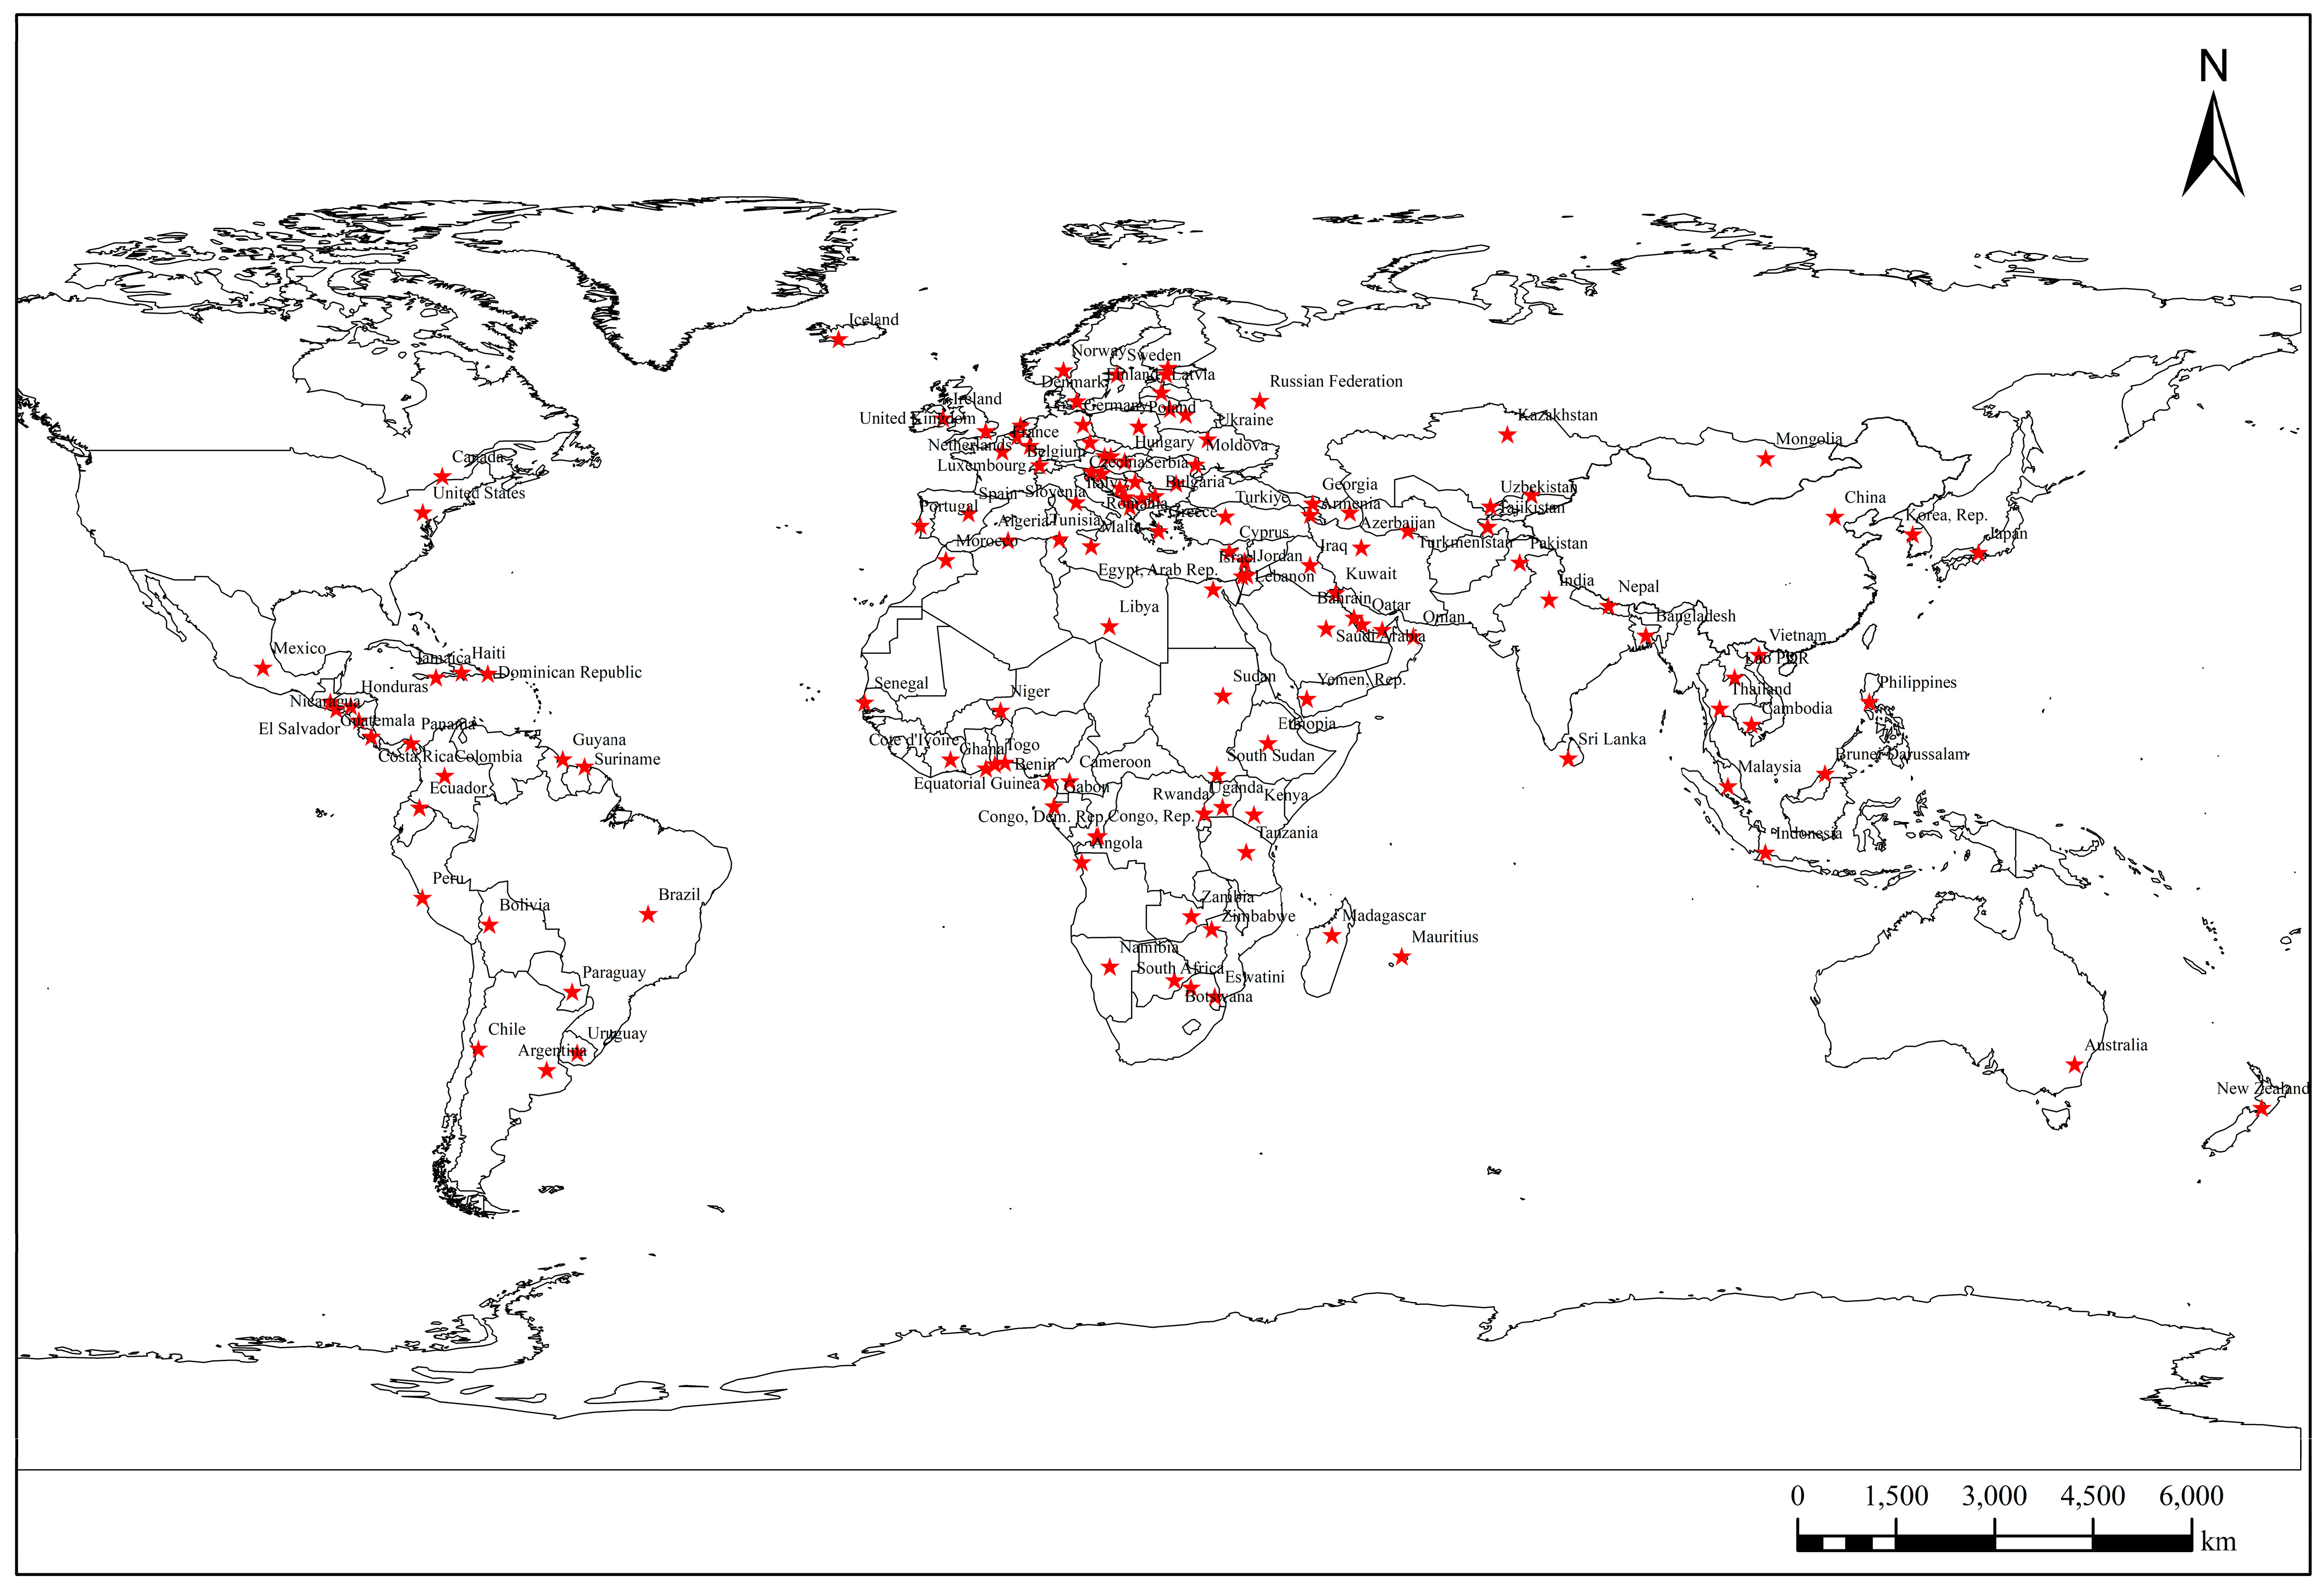
Considering data availability and missing statistical data, the data used in this study are unbalanced panel data of 136 countries and regions worldwide from 1990 to 2020, after excluding missing values. The 136 subject countries and regions of this study are labeled as shown in Figure 2. The data are sourced from the International Energy Agency (IEA) [28] and the World Bank [29]. Descriptive statistics for each variable are presented in Table 2. The data obtained from IEA and the World Bank were analyzed using STATA 17.0 software.
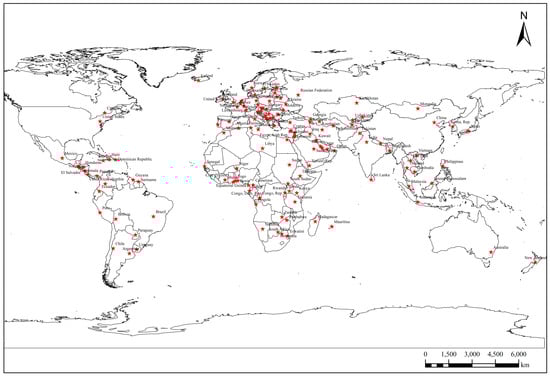
Figure 2.
Map of the 136 countries analyzed.
Table 2.
Descriptive statistics of each variable.
4. Empirical Study and Discussion
4.1. Empirical Results of Benchmark Regression
This study analyzes the relationship between urbanization rates and carbon emissions using an unbalanced panel dataset of 136 countries and regions from 1990 to 2020. Since the number of countries in the sample far exceeds the number of years, unit root tests are unnecessary.
We examine the relationship between labor participation rates and carbon emissions by employing various empirical regression methods, which include three static models, Ordinary Least Squares, Fixed Effects, and Random Effects, and two dynamic models, the differential GMM (Diff-GMM) and the Sys-GMM.
This study selects Sys-GMM as the benchmark model for the following reasons. First, dynamic models account for the lagged effects of carbon emissions compared with static models. Second, dynamic models can also address endogeneity issues arising from bidirectional causality. However, the introduction of lagged dependent variables generates new endogeneity problems. Arellano and Bond [30] proposed the Diff-GMM method to address this endogeneity issue by using lagged variables as instruments. Blundell and Bond [31] extended the work of Arellano and Bover [32] by proposing the Sys-GMM method, which estimates the difference and level equations as a system of equations. Unlike Diff-GMM, Sys-GMM offers higher estimation efficiency and can resolve potentially weak instrument problems [33].
In addition, to ensure the accuracy of the estimation results, the Arellano-Bond (A-B) test and the Hansen test must be conducted. The A-B test requires that the difference in the random disturbance term in the estimation results does not exhibit second-order autocorrelation, i.e., the p-value for AR(2) should be greater than 0.1. The Hansen test is used to check for overidentification of the instrumental variables, and the p-value must be greater than 0.1 to ensure that all instrumental variables are valid.
Table 3 reports the results of various regression methods on the impact of different variables on carbon emissions. According to the benchmark regression results (column (5) of Table 3), there is a significant association between urbanization rate and global greenhouse gas emissions. This result is consistent with the theoretical framework of the STIRPAT model, indicating that a 1% increase in urbanization leads to a 0.00382% change in carbon emissions. This demonstrates that changes in urbanization rate substantially impact carbon emissions globally, which is consistent with the hypothesis.
Table 3.
Estimation results of benchmark regression.
Regarding control variables, the findings support the EKC hypothesis [34]. A significant negative relationship exists between the quadratic term of per capita GDP and carbon emissions, indicating an inverted U-shaped relationship between per capita GDP and carbon emissions. Additionally, the coefficients for EI, CI, and ES are all significantly positive, implying higher energy consumption per unit of GDP results in higher carbon emissions, greater carbon emissions per unit of energy used to lead to increased total carbon emissions, and a higher proportion of fossil energy in total energy consumption results in higher carbon emissions. In summary, improving energy efficiency, developing carbon-reducing technologies, and promoting the use of renewable energy can significantly reduce carbon emissions [35,36,37].
4.2. Empirical Results of Robustness Tests
This study conducted the following robustness tests based on Equation (4) to ensure the credibility of the benchmark regression results.
Replacement of the Dependent Variable. The benchmark regression uses each country’s carbon emissions as a dependent variable I. To further enhance the robustness of the conclusions, the dependent variable is replaced with the per capita carbon emissions of each country for robustness testing. The results are shown in column (1) of Table 4. The further robustness test supports the conclusion that the urbanization rate reduces carbon emissions. The relationship remains robust after replacing the dependent variable with per capita emissions. This indicates that our conclusion does not solely depend on the choice of total emissions but also holds when considering per capita factors, confirming the relationship between urbanization rate and carbon emissions.
Table 4.
Estimation results of robustness tests.
Replacing explanatory variables. To further enhance the robustness of the conclusions, the explanatory variables IS and SS in the baseline regression are replaced with the ratio of the added value of the tertiary industry to the secondary industry (ISU) [38] for robustness testing. The results are shown in column (2) of Table 4. Even after replacing the core explanatory variables, the urbanization rate still significantly negatively impacts carbon emissions levels.
Balanced panel regression. Considering that the baseline regression used an unbalanced panel sample, robustness testing is conducted on the balanced panel after excluding countries with missing data for certain years to further enhance the robustness of the conclusions. As shown in column (3) of Table 4, the urbanization rate still significantly negatively impacts carbon emissions levels, indicating that unbalanced panel data do not influence the conclusions.
Subsample Analysis. The carbon emission stage of various countries may differ depending on economic development and changes in industrial structure; thus, the data were divided into different subsamples based on the relative size of GDP growth rate and CO2 emission growth rate to examine the consistency of results under different circumstances. Columns (4) and (5) in Table 4 present the regression results for countries where the GDP growth rate is higher than the CO2 emission growth rate and countries where the GDP growth rate is lower than the CO2 emission growth rate, respectively. It can be observed that the impact of urbanization rate on carbon emissions is consistently significant and negative in both cases. Thus, having passed the above robustness tests, there are reasons to believe that the estimation results and conclusions of this paper are very robust.
4.3. Comparison of Heterogeneous among OECD and Non-OECD Member Countries
Columns (1) and (2) in Table 5 present the results of the regression analysis conducted on the Organization for Economic Co-operation and Development (OECD) and non-OECD countries, respectively. We find significant heterogeneity in the impact of urbanization rate on carbon emissions. In OECD countries, the effect of urbanization rate on carbon emissions is not significant, whereas in non-OECD countries, the impact of urbanization rate on carbon emissions is significantly negative.
Table 5.
Estimation results of heterogeneity analysis and moderating analysis.
This result could be related to the higher urbanization rates in OECD countries, where urban infrastructure is generally more efficient, incorporating sustainable design and green building practices that help minimize energy consumption and emissions. Several additional factors might reduce the impact of urbanization on carbon emissions. Hence, due to advanced technological levels, higher energy efficiency standards, and cleaner production methods, the effect of urbanization on carbon emissions in OECD countries is often moderated. Furthermore, OECD countries often emphasize environmental protection and sustainable development, implementing various environmental policies and measures to reduce carbon emissions.
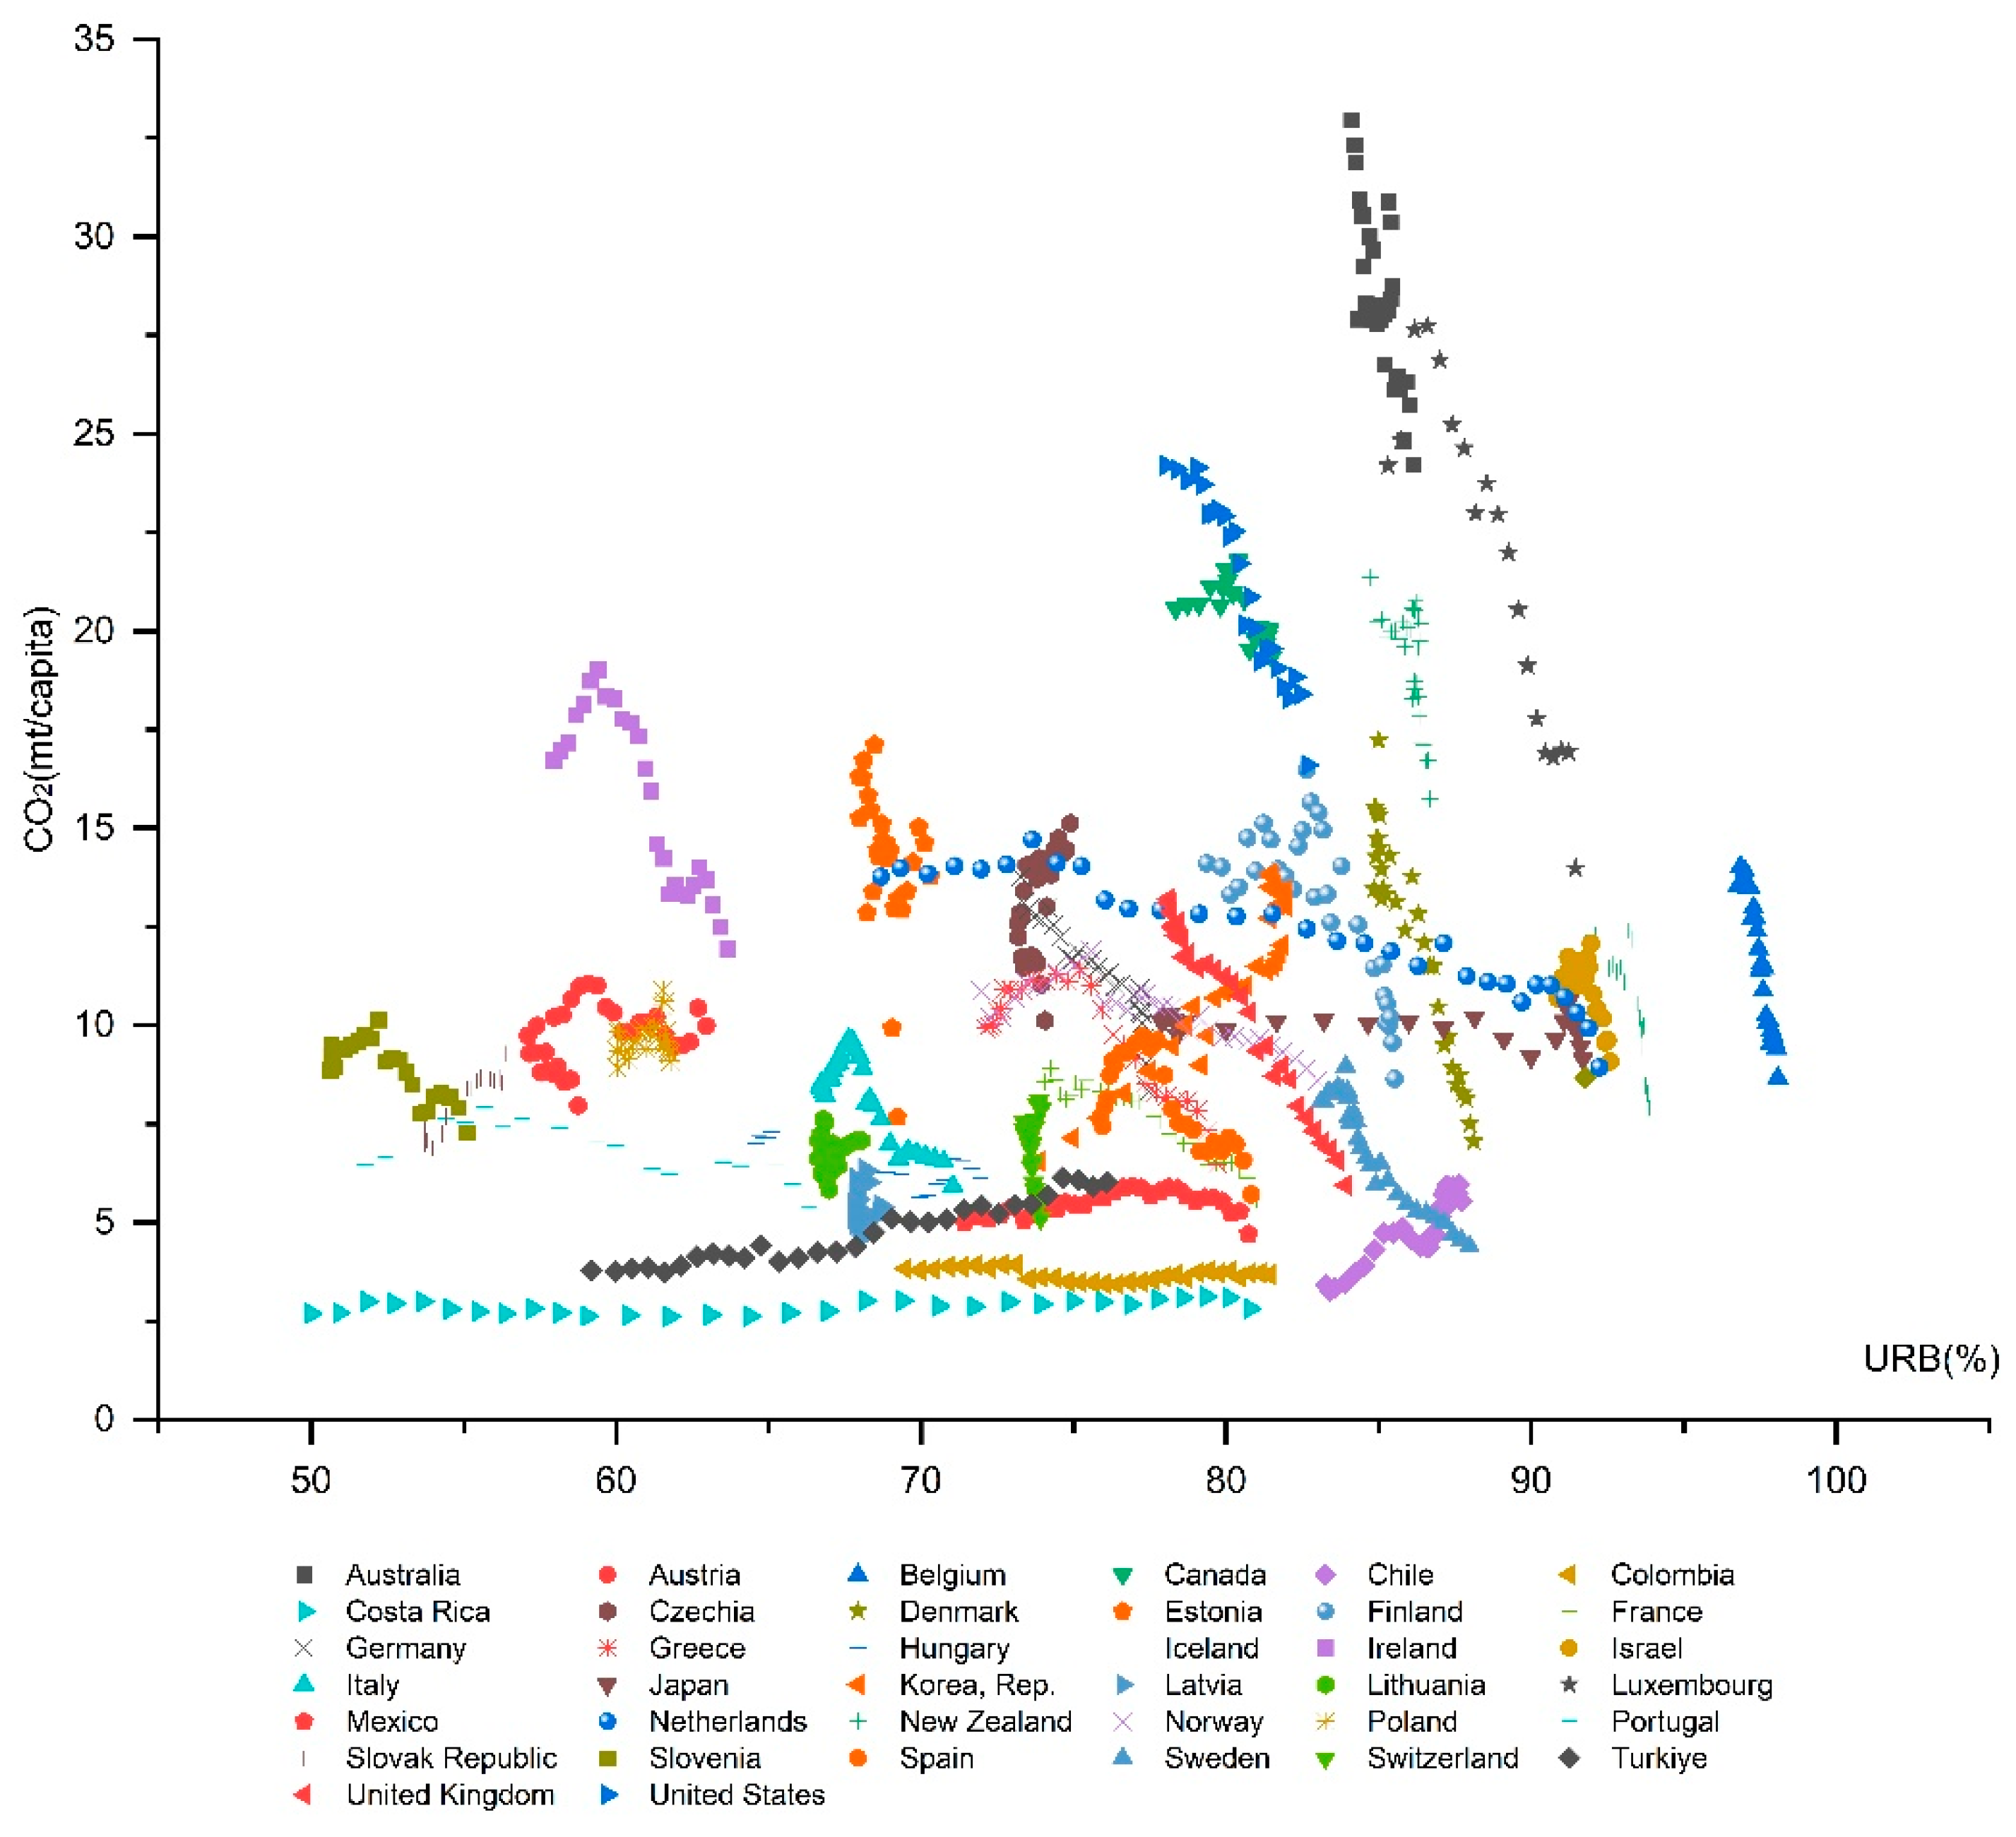
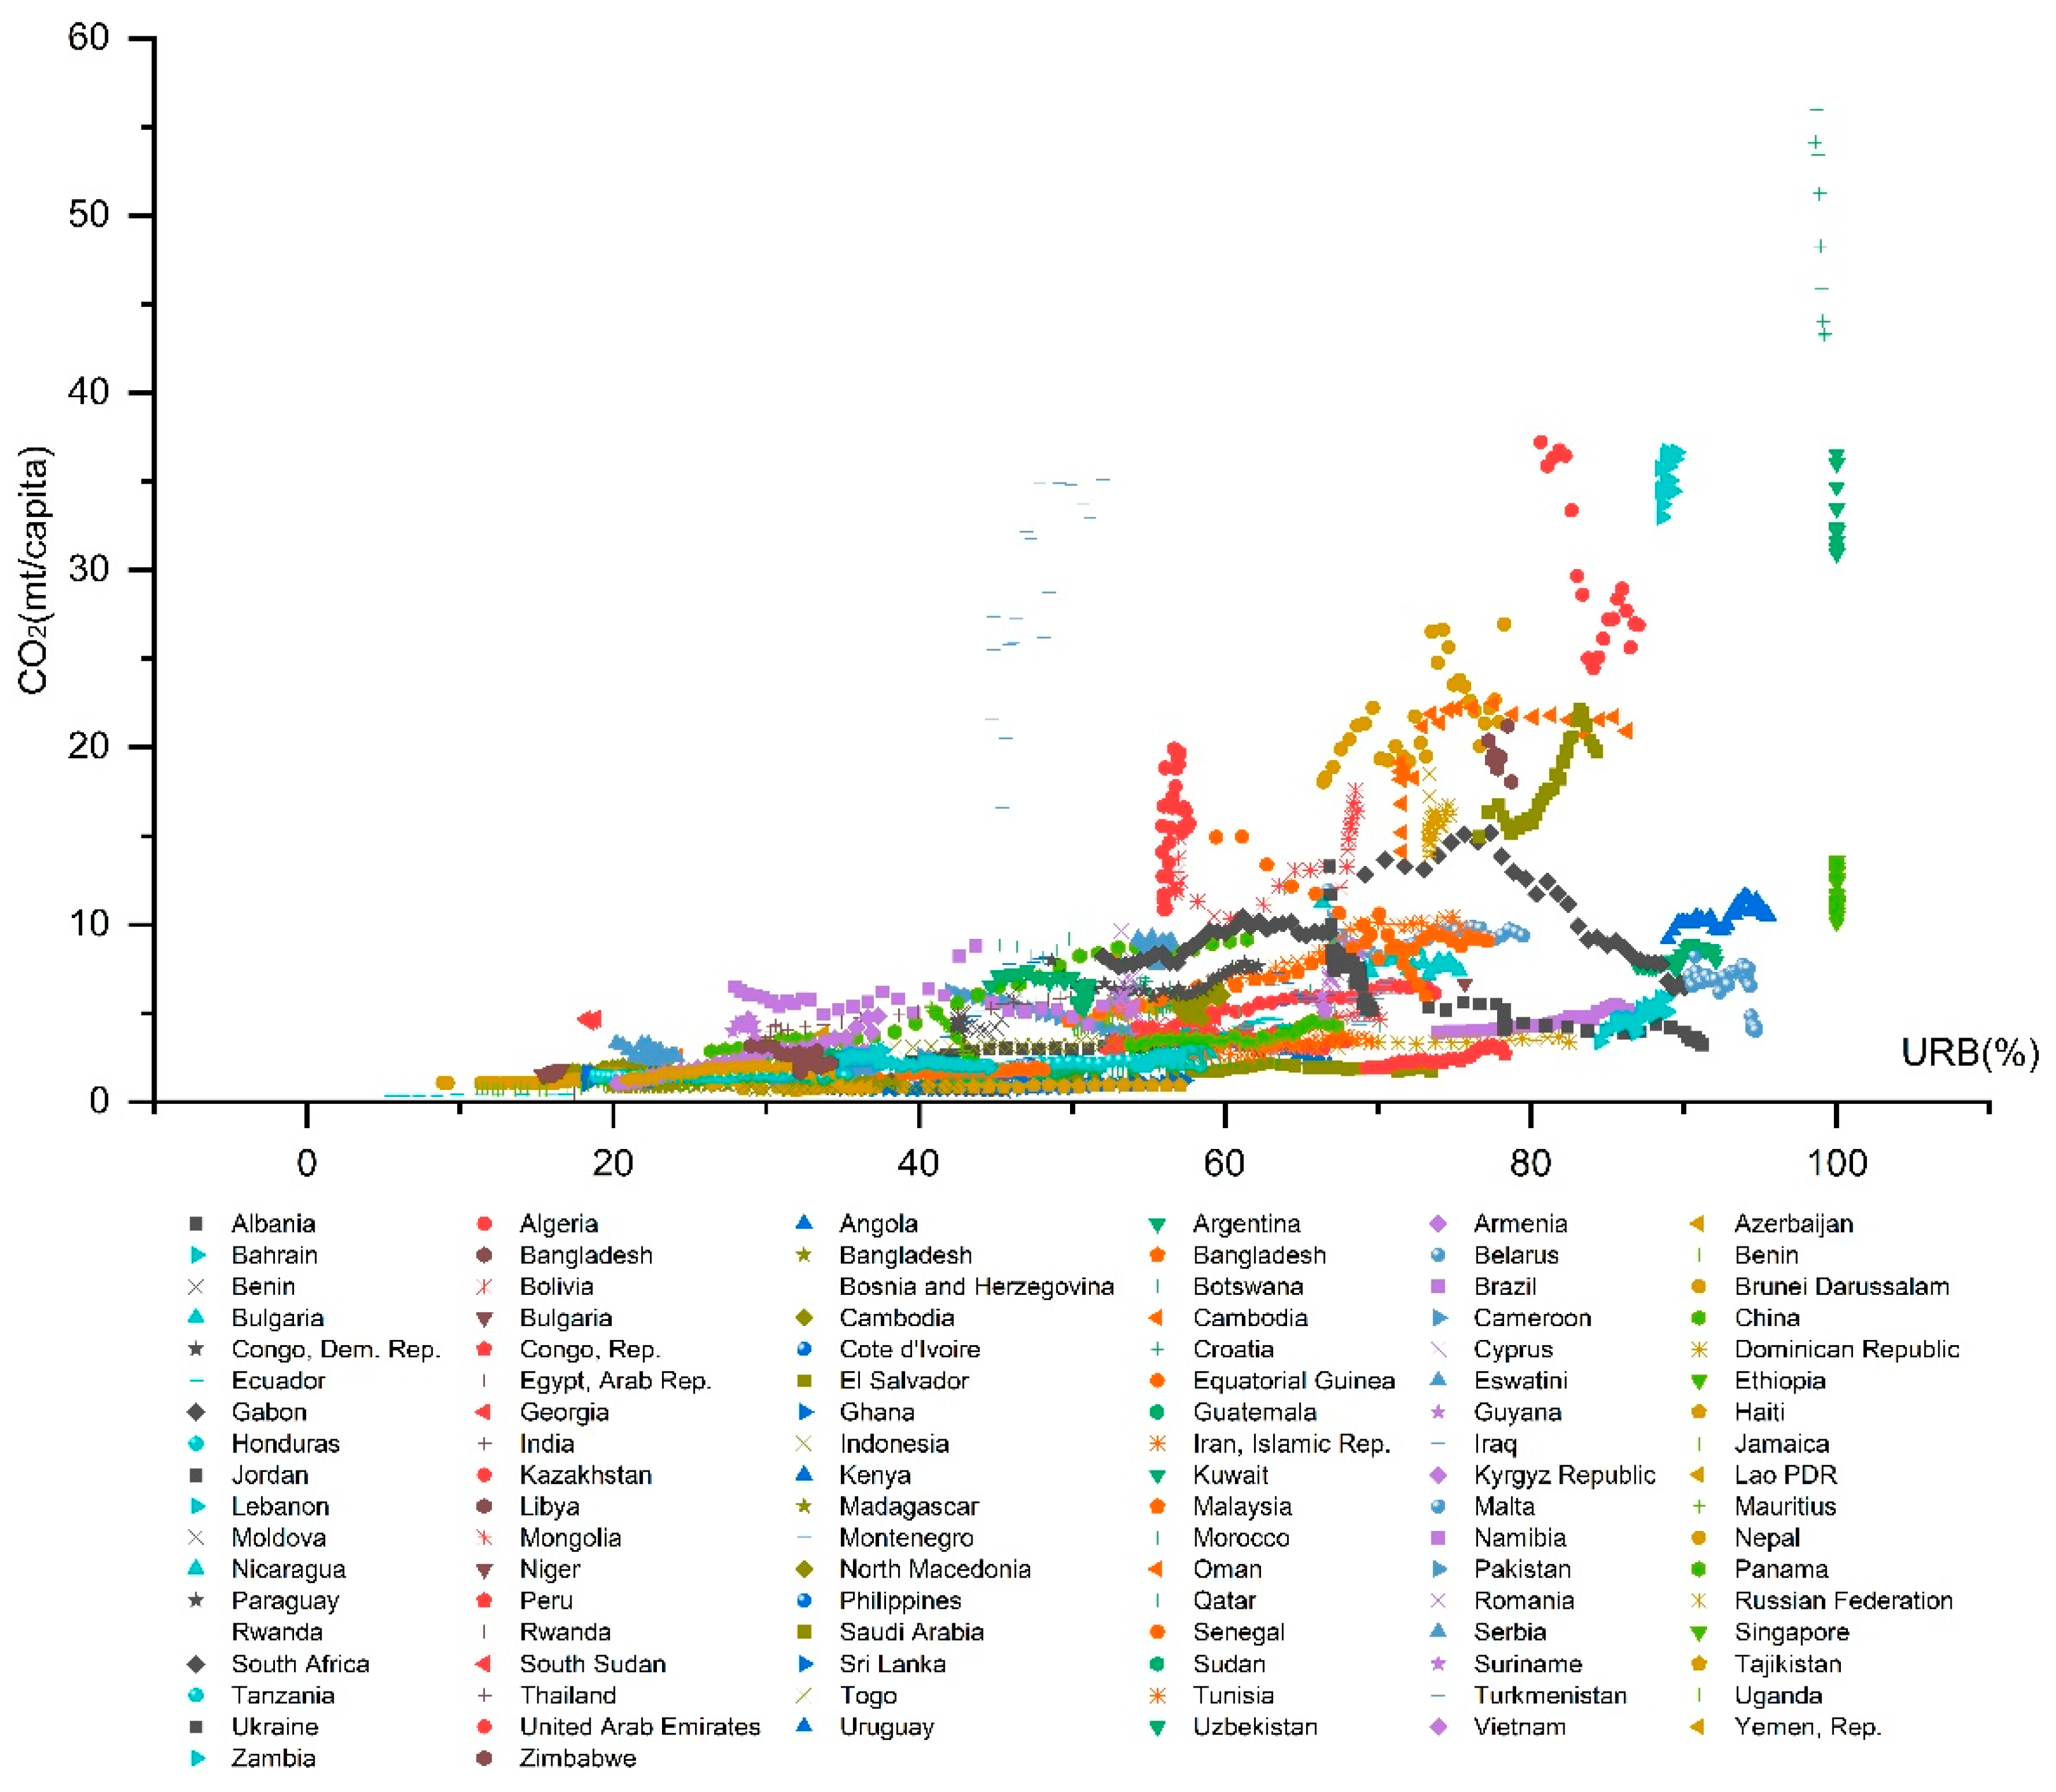
Many non-OECD countries are still in the early stages of industrialization and economic development, with lower urbanization rates. Rural areas often rely on traditional biomass fuels and inefficient energy equipment, lowering energy use efficiency. As urbanization progresses, improvements in energy use efficiency and more advanced environmental infrastructure are brought about, significantly negatively impacting the effect of urbanization on carbon emissions. Figure 3 and Figure 4 depict scatter plots of urbanization rates and per capita carbon emissions for OECD and non-OECD countries from 1990 to 2020, respectively. It can be observed that urbanization rates in OECD countries are primarily above 70%, while in non-OECD countries, urbanization rates are mostly below 70%.
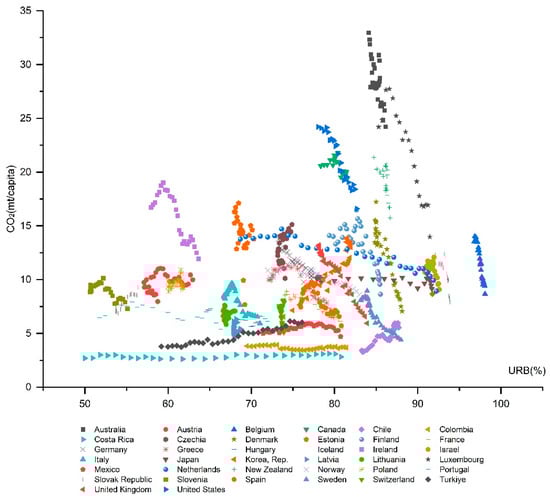
Figure 3.
Urbanization rate vs. per capita CO2 emissions in OECD countries, 1990–2020.

Figure 4.
Urbanization rate vs. per capita CO2 emissions in non-OECD countries, 1990–2020.
This phenomenon reflects the complexity of the environmental impact of urbanization under different stages of development and economic structures. This result also reminds us that it is essential to fully consider the differences in development stages and economic structures between countries when formulating and implementing carbon reduction policies. Only through differentiated policies, international cooperation, and technology transfer, combined with the concept of sustainable development, can we effectively address the challenges of global climate change. Promoting sustainable development globally is key to tackling climate change and a necessary pathway for achieving long-term economic and social progress.
4.4. Empirical Results of Moderating Analysis
The results of the moderating effect are shown in column (3) of Table 5. The negative coefficient of the urbanization rate indicates that, holding CI constant, an increase in urbanization rate is associated with decreased carbon emissions. This could be because higher urbanization rates might lead to more efficient energy use and more advanced technologies, thereby reducing carbon emissions. The interaction term’s positive coefficient indicates that the impact of the urbanization rate on carbon emissions decreases with higher CI. This means that in high carbon-intensity environments, the benefits of urbanization are partially negated by the high emissions levels associated with energy use.
This analysis reveals the complex interdependent relationship between urbanization and CI. Specifically, it suggests that urbanization may reduce carbon emissions in environments with low CI by promoting energy efficiency improvements and modernizing infrastructure. However, in environments with high CI, increased urbanization may not be sufficient to counteract the rise in carbon emissions caused by a reliance on high-carbon-energy sources. Therefore, this moderation effect model helps guide policymaking by emphasizing the need to control and manage energy use intensity while promoting urbanization. This is particularly crucial in high carbon-intensity environments to ensure the sustainable development of urbanization.
5. Conclusions and Policy Implications
Adopting the panel data of 136 countries and regions from 1990 to 2020, this study explores the impact of urbanization on carbon emissions from a multidimensional perspective by using the sys-GMM model, grounded on the STIRPAT model. Additionally, this study analyzes the heterogeneity of urbanization affecting carbon emissions among different countries and pays attention to the moderating effect of CI. We can obtain the following conclusions:
First, based on the panel model regression result of the impact of urbanization on carbon emissions, urbanization could contribute to declines in carbon emissions scale and per capita emissions.
Next, the impact of urbanization on carbon emissions demonstrates notable heterogeneity between OECD and non-OECD countries. In non-OECD countries, the urbanization process can potentially reduce carbon emissions. In contrast, the urbanization rate in OECD countries does not significantly impact carbon emissions. This difference is influenced by the varying stages of economic development, technological advancements, energy efficiency, and environmental policies, especially, urbanization.
Finally, by analyzing the interplay between urbanization and CI, we can see that urbanization reduces carbon emissions while higher CI increases them. The impact of urbanization on reducing carbon emissions is less effective as CI increases. In other words, while urbanization may generally reduce emissions, its effectiveness diminishes in environments with higher CI, potentially because the high emissions from intensive carbon use offset the gains from urbanization.
These findings have several important implications for policymaking:
First, policymakers in OECD countries need to implement policies to facilitate the positive role of urbanization in emission reduction. This can include encouraging the development of green infrastructure, promoting advanced energy management systems in industries and residential areas, providing incentives for renewable energy adoption, and enforcing strict environmental regulations. By integrating these strategies, governments can harness the potential of urbanization to significantly lower carbon emissions while fostering sustainable growth.
Second, policymakers in OECD countries should focus on enhancing existing sustainable practices. This includes strengthening energy efficiency standards, investing in green technology and infrastructure, and promoting public transportation. Additionally, policies should encourage innovation in low-carbon technologies and support the transition to renewable energy sources to further reduce carbon emissions.
Finally, policymakers can design more effective strategies to reduce carbon emissions and promote sustainable development by understanding the moderation effect of urbanization and CI. Policymakers should create strategies that promote urbanization alongside aggressive CI reduction measures. This can include investing in clean energy technologies, implementing strict energy efficiency standards, and encouraging green urban planning practices to ensure that the benefits of urbanization are not offset by increased CI.
Reducing carbon emissions requires collective efforts from all countries. This study’s limitation is the absence of data from certain countries and years, as a result of utilizing panel data from 136 countries. Future research aims to expand the targeted sample size. Additionally, urbanization manifests in various aspects, and using population urbanization rates has its limitations. Future endeavors will strive to establish a comprehensive indicator system to measure urbanization and further explore its impact on carbon emissions.
Author Contributions
Conceptualization, B.M.; Methodology, B.M.; Software, B.M.; Investigation, S.O.; Data curation, S.O. All authors have read and agreed to the published version of the manuscript.
Funding
This research received no external funding.
Institutional Review Board Statement
Not applicable.
Informed Consent Statement
Not applicable.
Data Availability Statement
The data presented in this study are available on request from the corresponding author.
Conflicts of Interest
The authors declare no conflict of interest.
References
- Wang, Y.; Chen, L.; Kubota, J. The Relationship between Urbanization, Energy Use and Carbon Emissions: Evidence from a Panel of Association of Southeast Asian Nations (ASEAN) Countries. J. Clean. Prod. 2016, 112, 1368–1374. [Google Scholar] [CrossRef]
- Wang, Y.; Li, L.; Kubota, J.; Han, R.; Zhu, X.; Lu, G. Does Urbanization Lead to More Carbon Emission? Evidence from a Panel of BRICS Countries. Appl. Energy 2016, 168, 375–380. [Google Scholar] [CrossRef]
- Ouyang, X.; Lin, B. Carbon Dioxide (CO2) Emissions during Urbanization: A Comparative Study between China and Japan. J. Clean. Prod. 2017, 143, 356–368. [Google Scholar] [CrossRef]
- Wang, W.-Z.; Liu, L.-C.; Liao, H.; Wei, Y.-M. Impacts of Urbanization on Carbon Emissions: An Empirical Analysis from OECD Countries. Energy Policy 2021, 151, 112171. [Google Scholar] [CrossRef]
- Gnangoin, T.Y.; Kassi, D.F.; Kongrong, O. Urbanization and CO2 Emissions in Belt and Road Initiative Economies: Analyzing the Mitigating Effect of Human Capital in Asian Countries. Environ. Sci. Pollut. Res. 2023, 30, 50376–50391. [Google Scholar] [CrossRef]
- Zhang, N.; Yu, K.; Chen, Z. How Does Urbanization Affect Carbon Dioxide Emissions? A Cross-Country Panel Data Analysis. Energy Policy 2017, 107, 678–687. [Google Scholar] [CrossRef]
- Wang, Q.; Zhang, C.; Li, R. Towards Carbon Neutrality by Improving Carbon Efficiency—A System-GMM Dynamic Panel Analysis for 131 Countries’ Carbon Efficiency. Energy 2022, 258, 124880. [Google Scholar] [CrossRef]
- Yao, X.; Kou, D.; Shao, S.; Li, X.; Wang, W.; Zhang, C. Can Urbanization Process and Carbon Emission Abatement Be Harmonious? New Evidence from China. Environ. Impact Assess. Rev. 2018, 71, 70–83. [Google Scholar] [CrossRef]
- Nguyen-Thanh, N.; Chin, K.-H.; Nguyen, V. Does the Pollution Halo Hypothesis Exist in This “Better” World? The Evidence from STIRPAT Model. Environ. Sci. Pollut. Res. 2022, 29, 87082–87096. [Google Scholar] [CrossRef]
- Shen, Y.; Zhang, F.; Gong, M.; Huang, J. The Urbanization–Environmental Pollution Nexus: An Analysis Based on a Spatial Perspective. Emerg. Mark. Financ. Trade 2022, 58, 2355–2367. [Google Scholar] [CrossRef]
- Lee, C.-C.; Zhao, Y.-N. Heterogeneity Analysis of Factors Influencing CO2 Emissions: The Role of Human Capital, Urbanization, and FDI. Renew. Sustain. Energy Rev. 2023, 185, 113644. [Google Scholar] [CrossRef]
- Guo, W.; Chen, Y. Assessing the Efficiency of China’s Environmental Regulation on Carbon Emissions Based on Tapio Decoupling Models and GMM Models. Energy Rep. 2018, 4, 713–723. [Google Scholar] [CrossRef]
- Liu, Y.; Dong, K.; Jiang, Q. Assessing Energy Vulnerability and Its Impact on Carbon Emissions: A Global Case. Energy Econ. 2023, 119, 106557. [Google Scholar] [CrossRef]
- Wang, Q.; Zhang, F.; Li, R. Revisiting the Environmental Kuznets Curve Hypothesis in 208 Counties: The Roles of Trade Openness, Human Capital, Renewable Energy and Natural Resource Rent. Environ. Res. 2023, 216, 114637. [Google Scholar] [CrossRef]
- Deka, A.; Ozdeser, H.; Seraj, M. The Effect of GDP, Renewable Energy and Total Energy Supply on Carbon Emissions in the EU-27: New Evidence from Panel GMM. Environ. Sci. Pollut. Res. 2022, 30, 28206–28216. [Google Scholar] [CrossRef]
- Wu, Y.; Shen, J.; Zhang, X.; Skitmore, M.; Lu, W. The Impact of Urbanization on Carbon Emissions in Developing Countries: A Chinese Study Based on the U-Kaya Method. J. Clean. Prod. 2016, 135, 589–603. [Google Scholar] [CrossRef]
- Xiao, Y.; Huang, H.; Qian, X.-M.; Zhang, L.-Y.; An, B.-W. Can New-Type Urbanization Reduce Urban Building Carbon Emissions? New Evidence from China. Sustain. Cities Soc. 2023, 90, 104410. [Google Scholar] [CrossRef]
- Xu, Q.; Dong, Y.; Yang, R. Urbanization Impact on Carbon Emissions in the Pearl River Delta Region: Kuznets Curve Relationships. J. Clean. Prod. 2018, 180, 514–523. [Google Scholar] [CrossRef]
- Cao, Z.; Meng, Q.; Gao, B. The Consumption Patterns and Determining Factors of Rural Household Energy: A Case Study of Henan Province in China. Renew. Sustain. Energy Rev. 2021, 146, 111142. [Google Scholar] [CrossRef]
- Pradhan, R.P.; Arvin, M.B.; Nair, M. Urbanization, Transportation Infrastructure, ICT, and Economic Growth: A Temporal Causal Analysis. Cities 2021, 115, 103213. [Google Scholar] [CrossRef]
- Huang, S.-Z.; Sadiq, M.; Chien, F. The Impact of Natural Resource Rent, Financial Development, and Urbanization on Carbon Emission. Environ. Sci. Pollut. Res. 2023, 30, 42753–42765. [Google Scholar] [CrossRef] [PubMed]
- Ehrlich, P.; Holdren, J. A Bulletin Dialogue on the ‘Closing Circle’: Critique: One-Dimensional Ecology. Bull. At. Sci. 1972, 28, 16–27. [Google Scholar] [CrossRef]
- Stern, P.C.; Young, O.R.; Druckman, D. (Eds.) Global Environmental Change: Understanding the Human Dimensions; National Academy Press: Washington, DC, USA, 1992; p. ix. 308p, ISBN 978-0-309-04494-3. [Google Scholar]
- Harrison, P.; Pearce, F. AAAS Atlas of Population and Environment; University of California Press: Los Angeles, CA, USA, 2000; ISBN 978-0-520-23084-2. [Google Scholar]
- Dietz, T.; Rosa, E.A. Rethinking the environmental impacts of population, affluence and technology. Hum. Ecol. Rev. 1994, 1, 277–300. [Google Scholar]
- Haug, A.A.; Ucal, M. The Role of Trade and FDI for CO2 Emissions in Turkey: Nonlinear Relationships. Energy Econ. 2019, 81, 297–307. [Google Scholar] [CrossRef]
- Dauda, L.; Long, X.; Mensah, C.N.; Salman, M.; Boamah, K.B.; Ampon-Wireko, S.; Kofi Dogbe, C.S. Innovation, Trade Openness and CO2 Emissions in Selected Countries in Africa. J. Clean. Prod. 2021, 281, 125143. [Google Scholar] [CrossRef]
- IEA. Energy Statistics Data Browser, IEA, Paris, 2023. Available online: https://www.iea.org/data-and-statistics/data-tools/energy-statistics-data-browser (accessed on 12 August 2024).
- World Bank. World Development Indicators [WWW Document]. 2022. Available online: https://databank.worldbank.org/reports.aspx?source=world-development-indicators (accessed on 19 September 2023).
- Arellano, M.; Bond, S. Some Tests of Specification for Panel Data: Monte Carlo Evidence and an Application to Employment Equations. Rev. Econ. Stud. 1991, 58, 277–297. [Google Scholar] [CrossRef]
- Blundell, R.; Bond, S. Initial Conditions and Moment Restrictions in Dynamic Panel Data Models. J. Econom. 1998, 87, 115–143. [Google Scholar] [CrossRef]
- Arellano, M.; Bover, O. Another Look at the Instrumental Variable Estimation of Error-Components Models. J. Econom. 1995, 68, 29–51. [Google Scholar] [CrossRef]
- Bun, M.J.G.; Windmeijer, F. The Weak Instrument Problem of the System GMM Estimator in Dynamic Panel Data Models. Econom. J. 2010, 13, 95–126. [Google Scholar] [CrossRef]
- Grossman, G.M.; Krueger, A.B.; Grossman, G.M.; Krueger, A.B. Economic Growth and the Environment. Q. J. Econ. 1995, 110, 353–377. [Google Scholar] [CrossRef]
- Akram, R.; Majeed, M.T.; Fareed, Z.; Khalid, F.; Ye, C.; Akram, R.; Majeed, M.T.; Fareed, Z.; Khalid, F.; Ye, C. Asymmetric Effects of Energy Efficiency and Renewable Energy on Carbon Emissions of BRICS Economies: Evidence from Nonlinear Panel Autoregressive Distributed Lag Model. Environ. Sci. Pollut. Res. 2020, 27, 18254–18268. [Google Scholar] [CrossRef] [PubMed]
- Jin, L.; Duan, K.; Shi, C.; Ju, X.; Jin, L.; Duan, K.; Shi, C.; Ju, X. The Impact of Technological Progress in the Energy Sector on Carbon Emissions: An Empirical Analysis from China. J. Environ. Res. Public. Health 2017, 14, 1505. [Google Scholar] [CrossRef] [PubMed]
- Wang, B.; Zhao, J.; Dong, K.; Jiang, Q.; Wang, B.; Zhao, J.; Dong, K.; Jiang, Q. High-Quality Energy Development in China: Comprehensive Assessment and Its Impact on CO2 Emissions. Energy Econ. 2022, 110, 106027. [Google Scholar] [CrossRef]
- Dong, J.; Dou, Y.; Jiang, Q.; Zhao, J. How Does Industrial Structure Upgrading Affect the Global Greenhouse Effect? Evidence From RCEP and Non-RCEP Countries. Front. Energy Res. 2021, 9, 683166. [Google Scholar] [CrossRef]
Disclaimer/Publisher’s Note: The statements, opinions and data contained in all publications are solely those of the individual author(s) and contributor(s) and not of MDPI and/or the editor(s). MDPI and/or the editor(s) disclaim responsibility for any injury to people or property resulting from any ideas, methods, instructions or products referred to in the content. |
© 2024 by the authors. Licensee MDPI, Basel, Switzerland. This article is an open access article distributed under the terms and conditions of the Creative Commons Attribution (CC BY) license (https://creativecommons.org/licenses/by/4.0/).