
Transmission Characteristics of the Macropore Flow in Vegetated Slope Soils and Its Implication for Slope Stability


Abstract
:1. Introduction
2. Materials and Methods
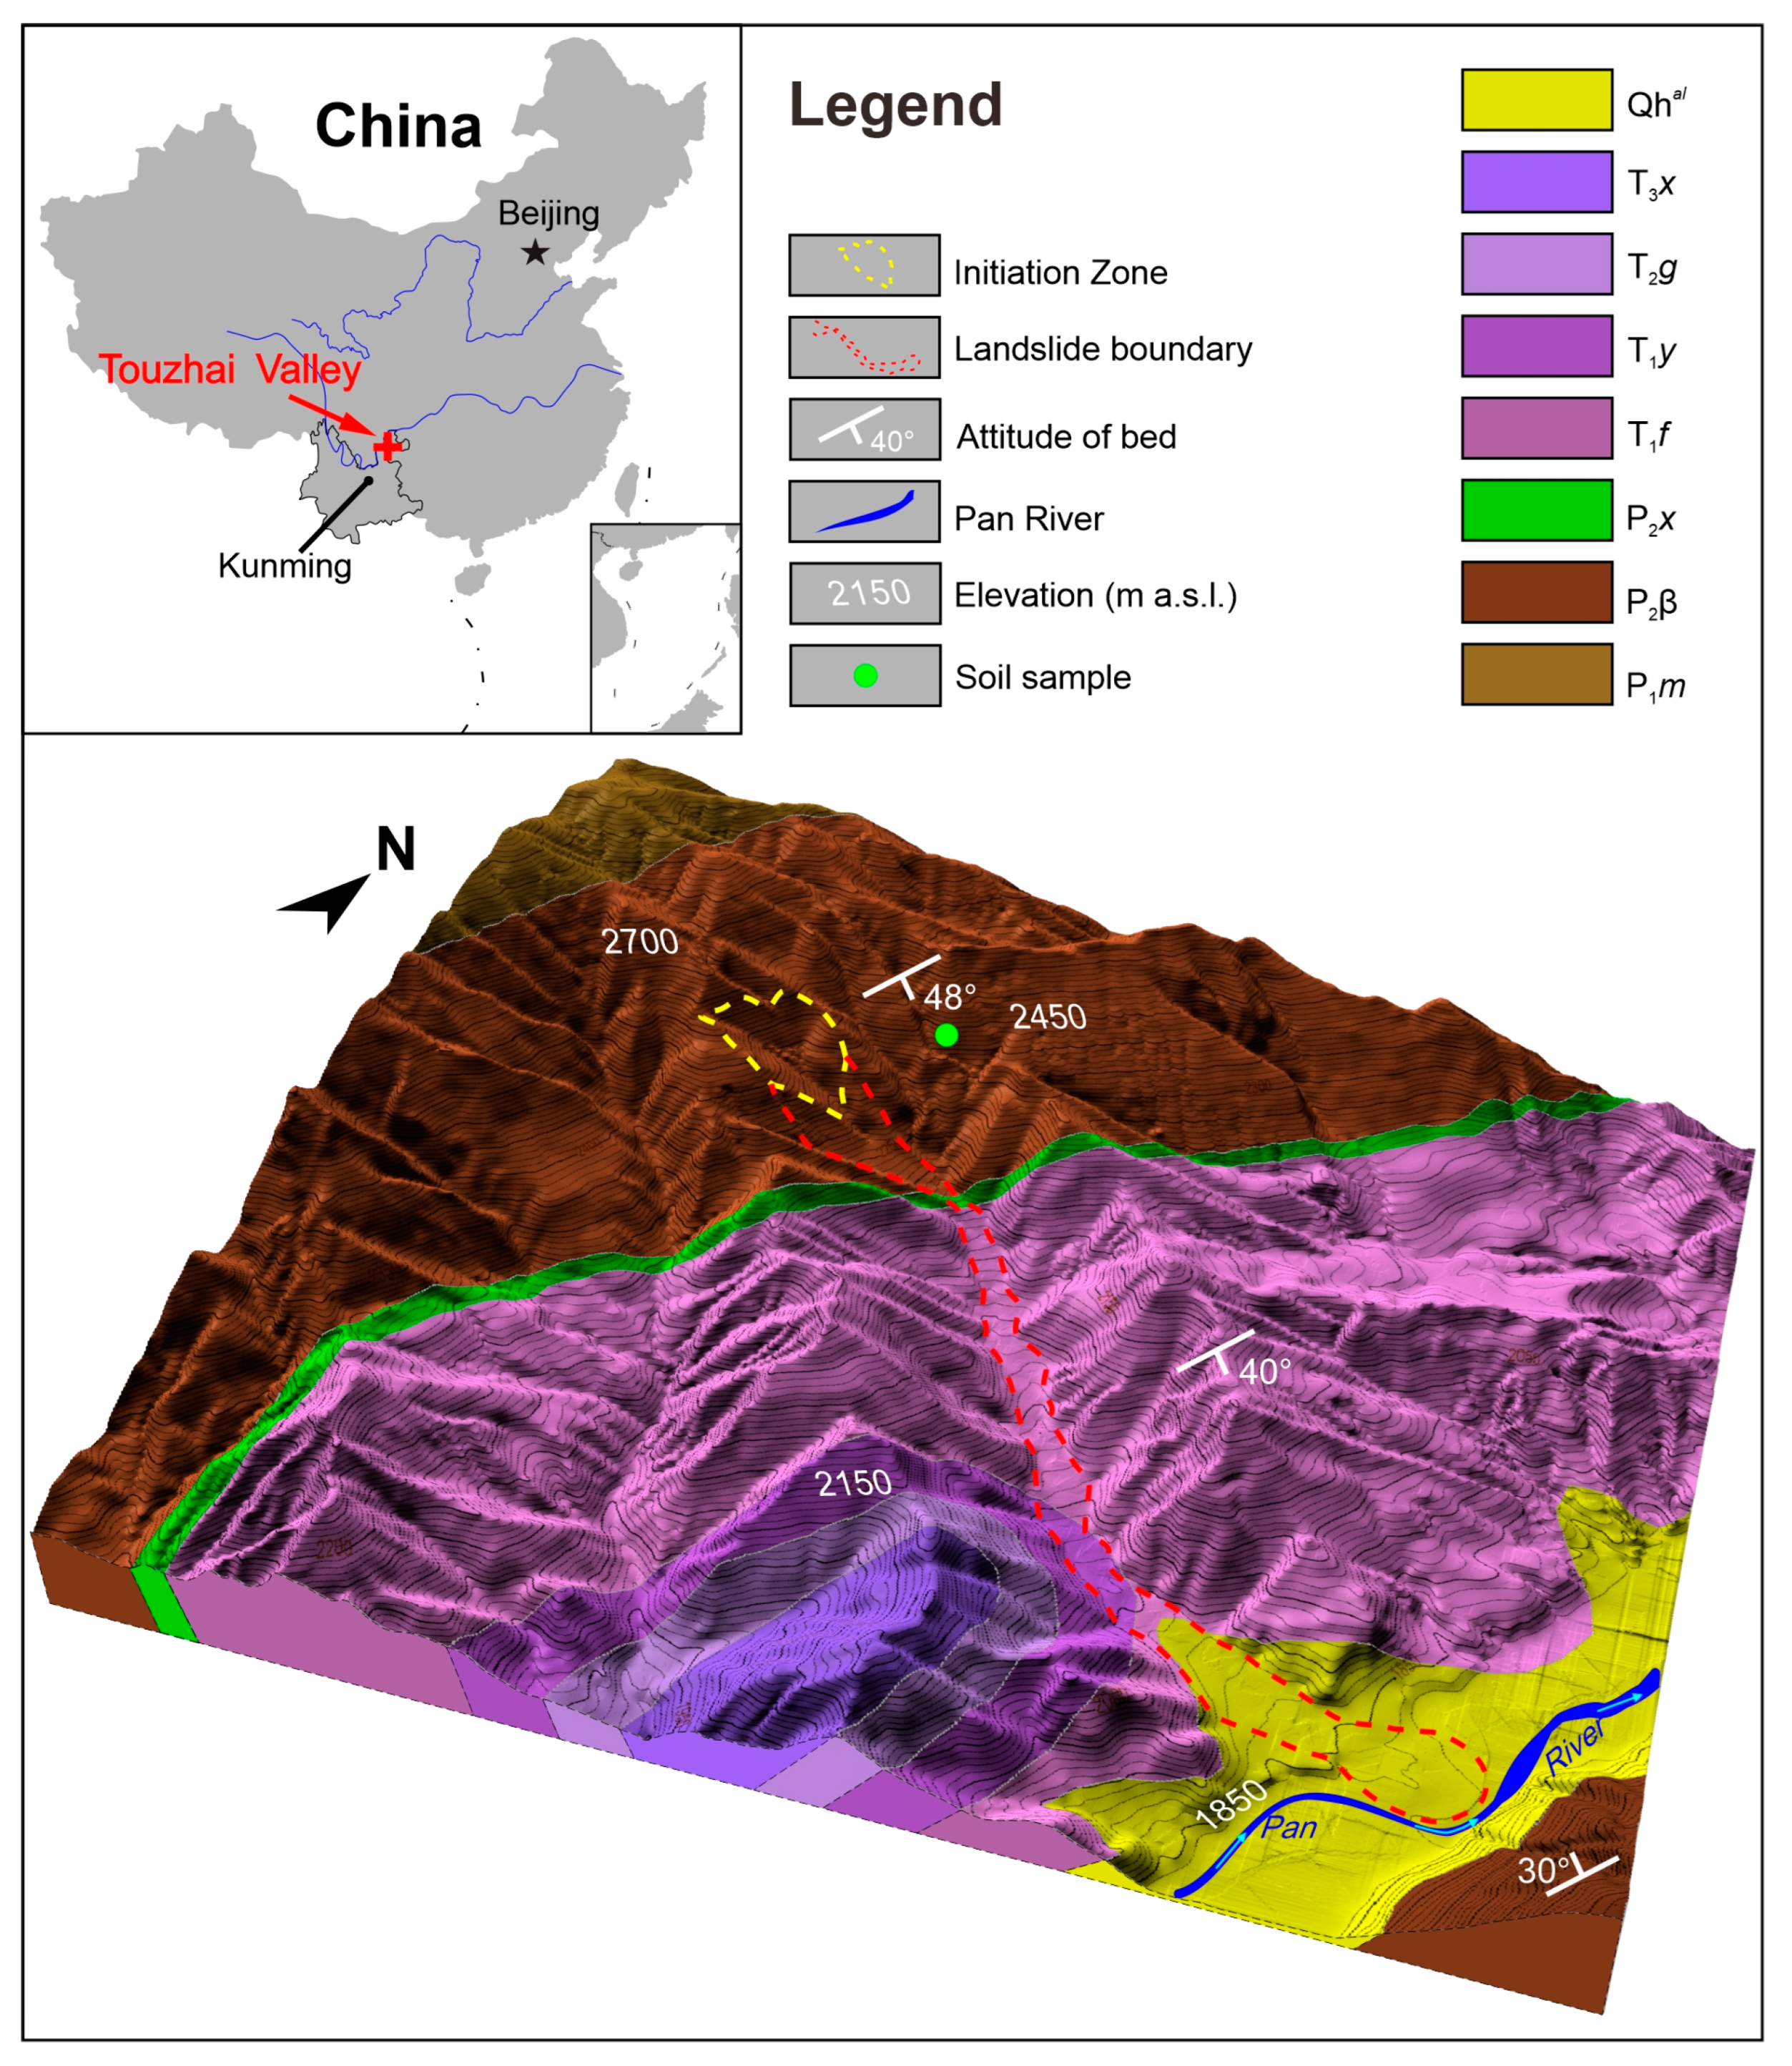
2.1. Study Area
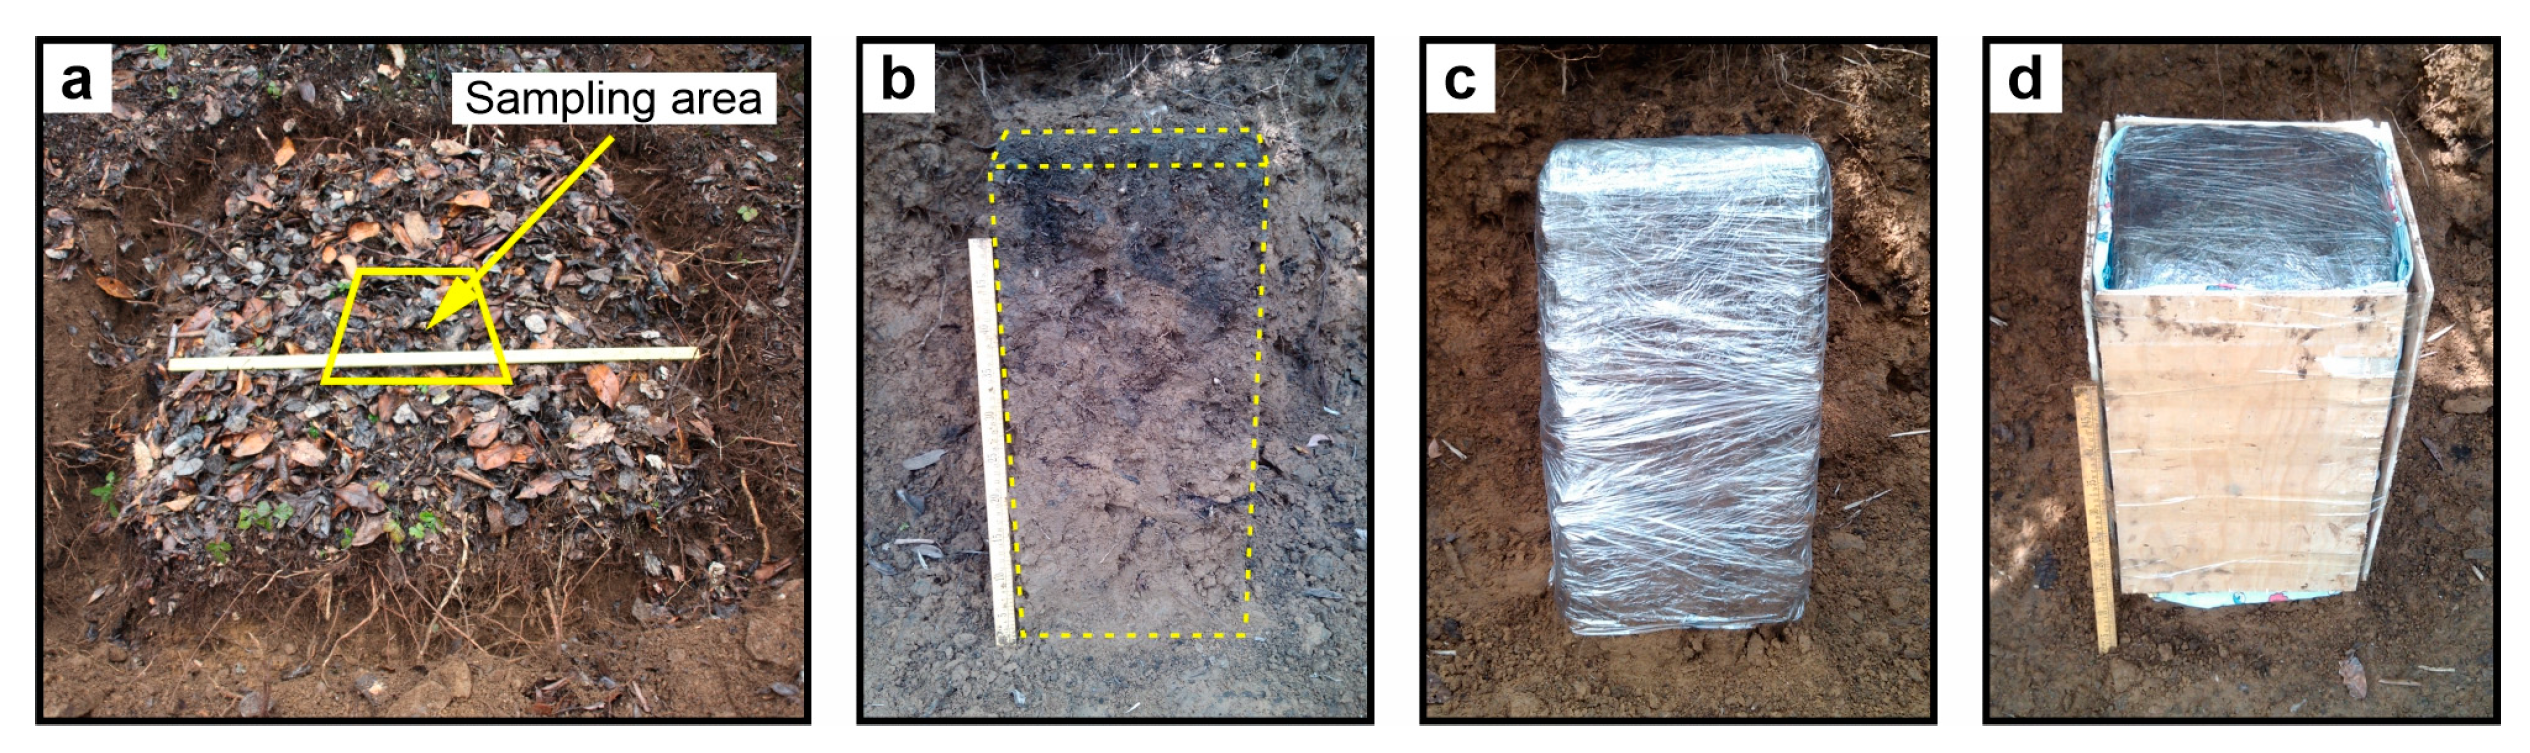
2.2. Soil Sampling
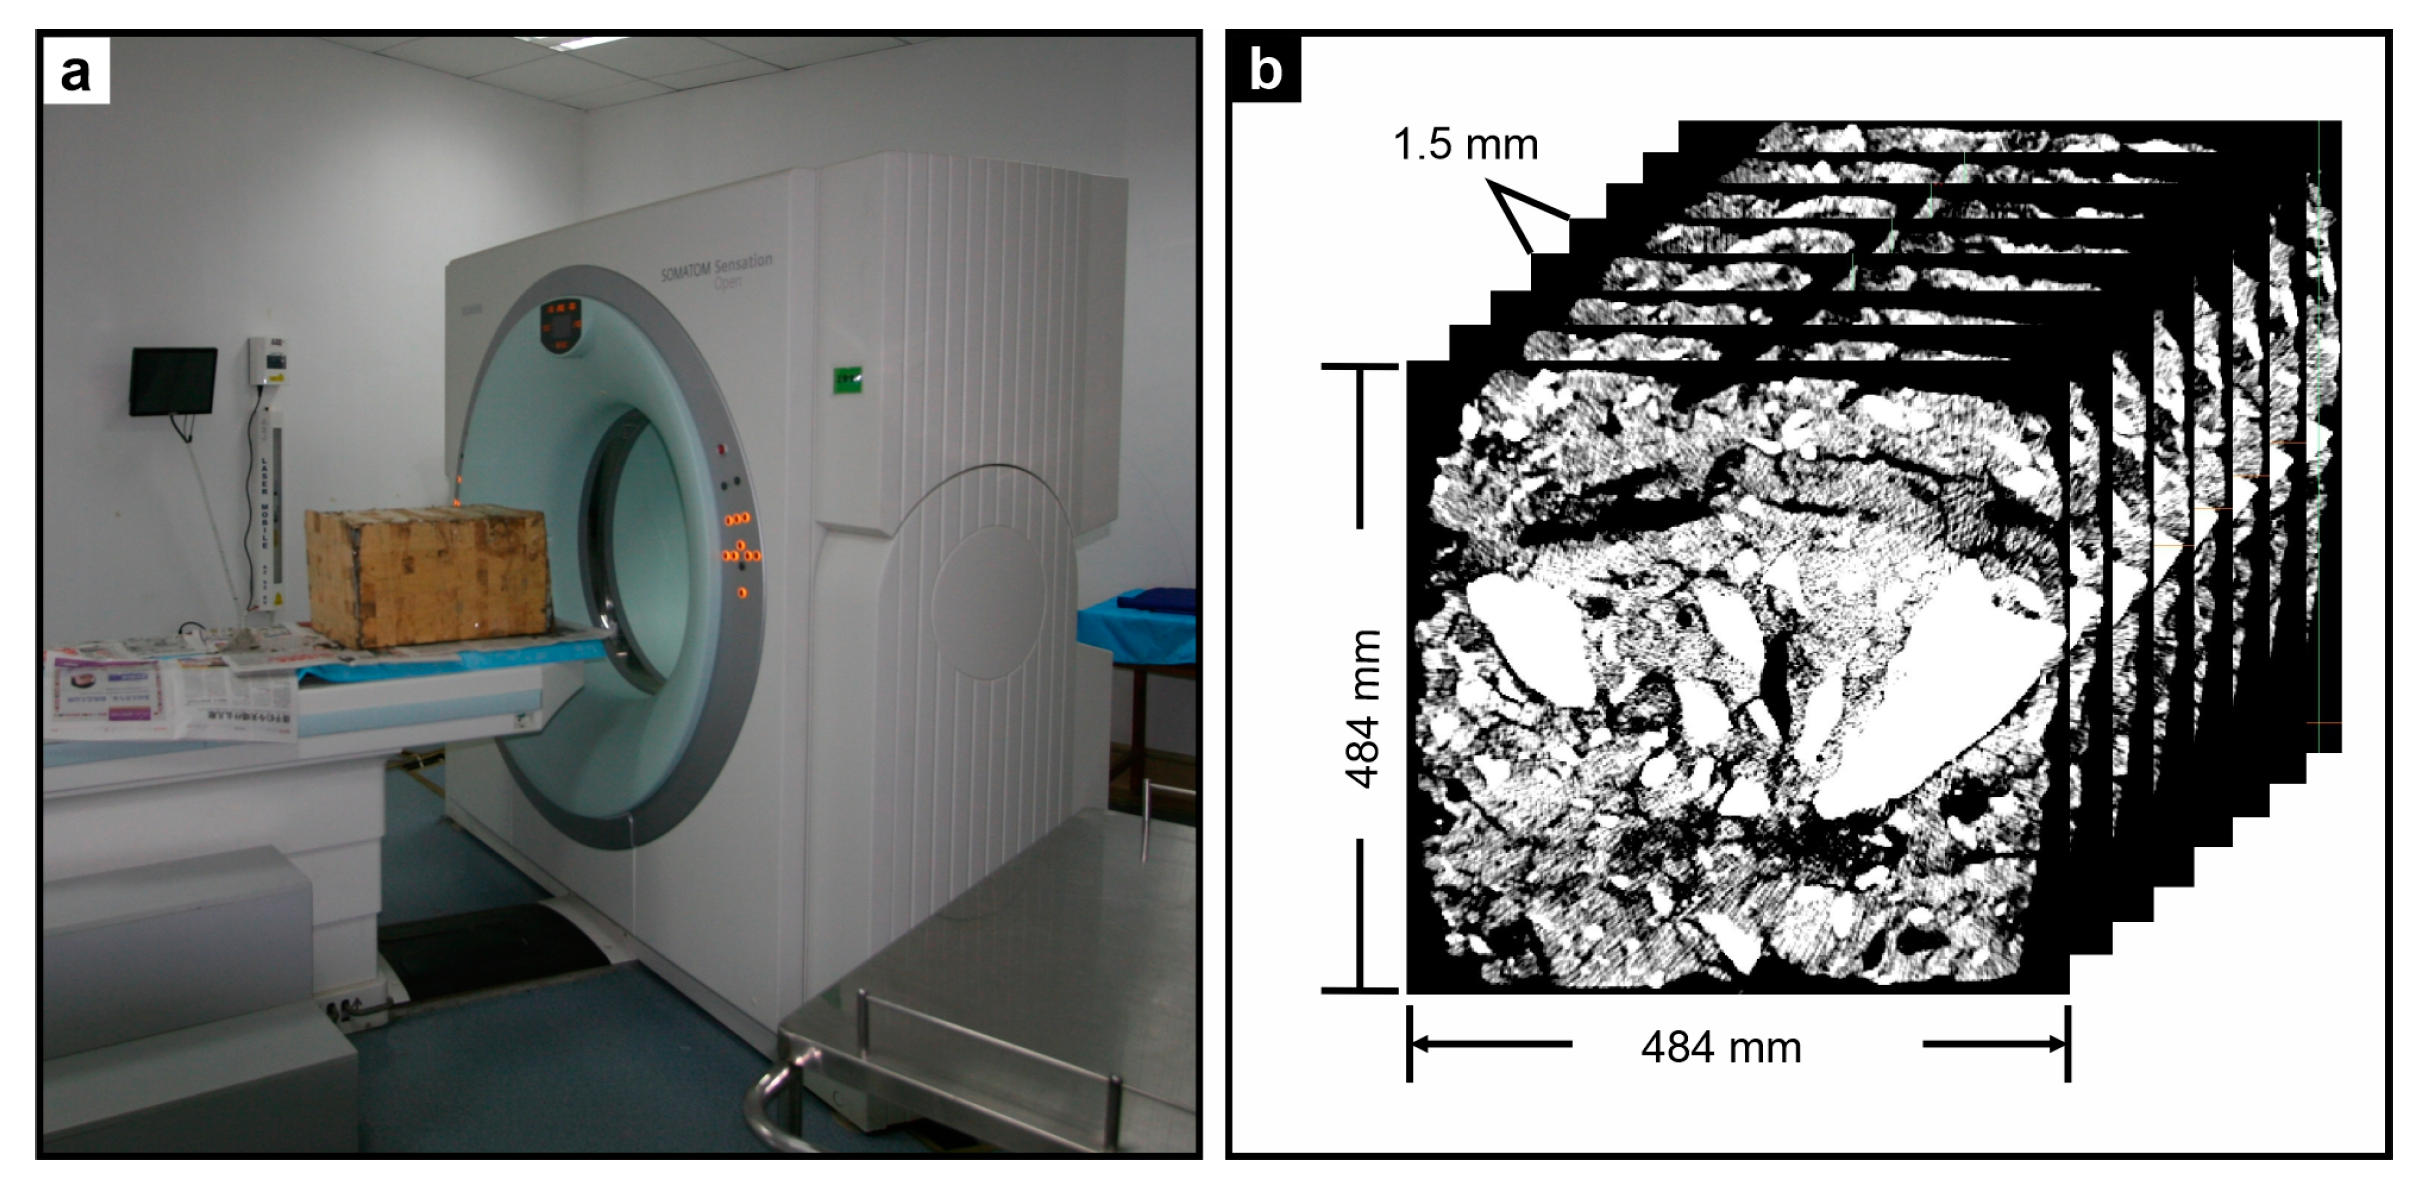
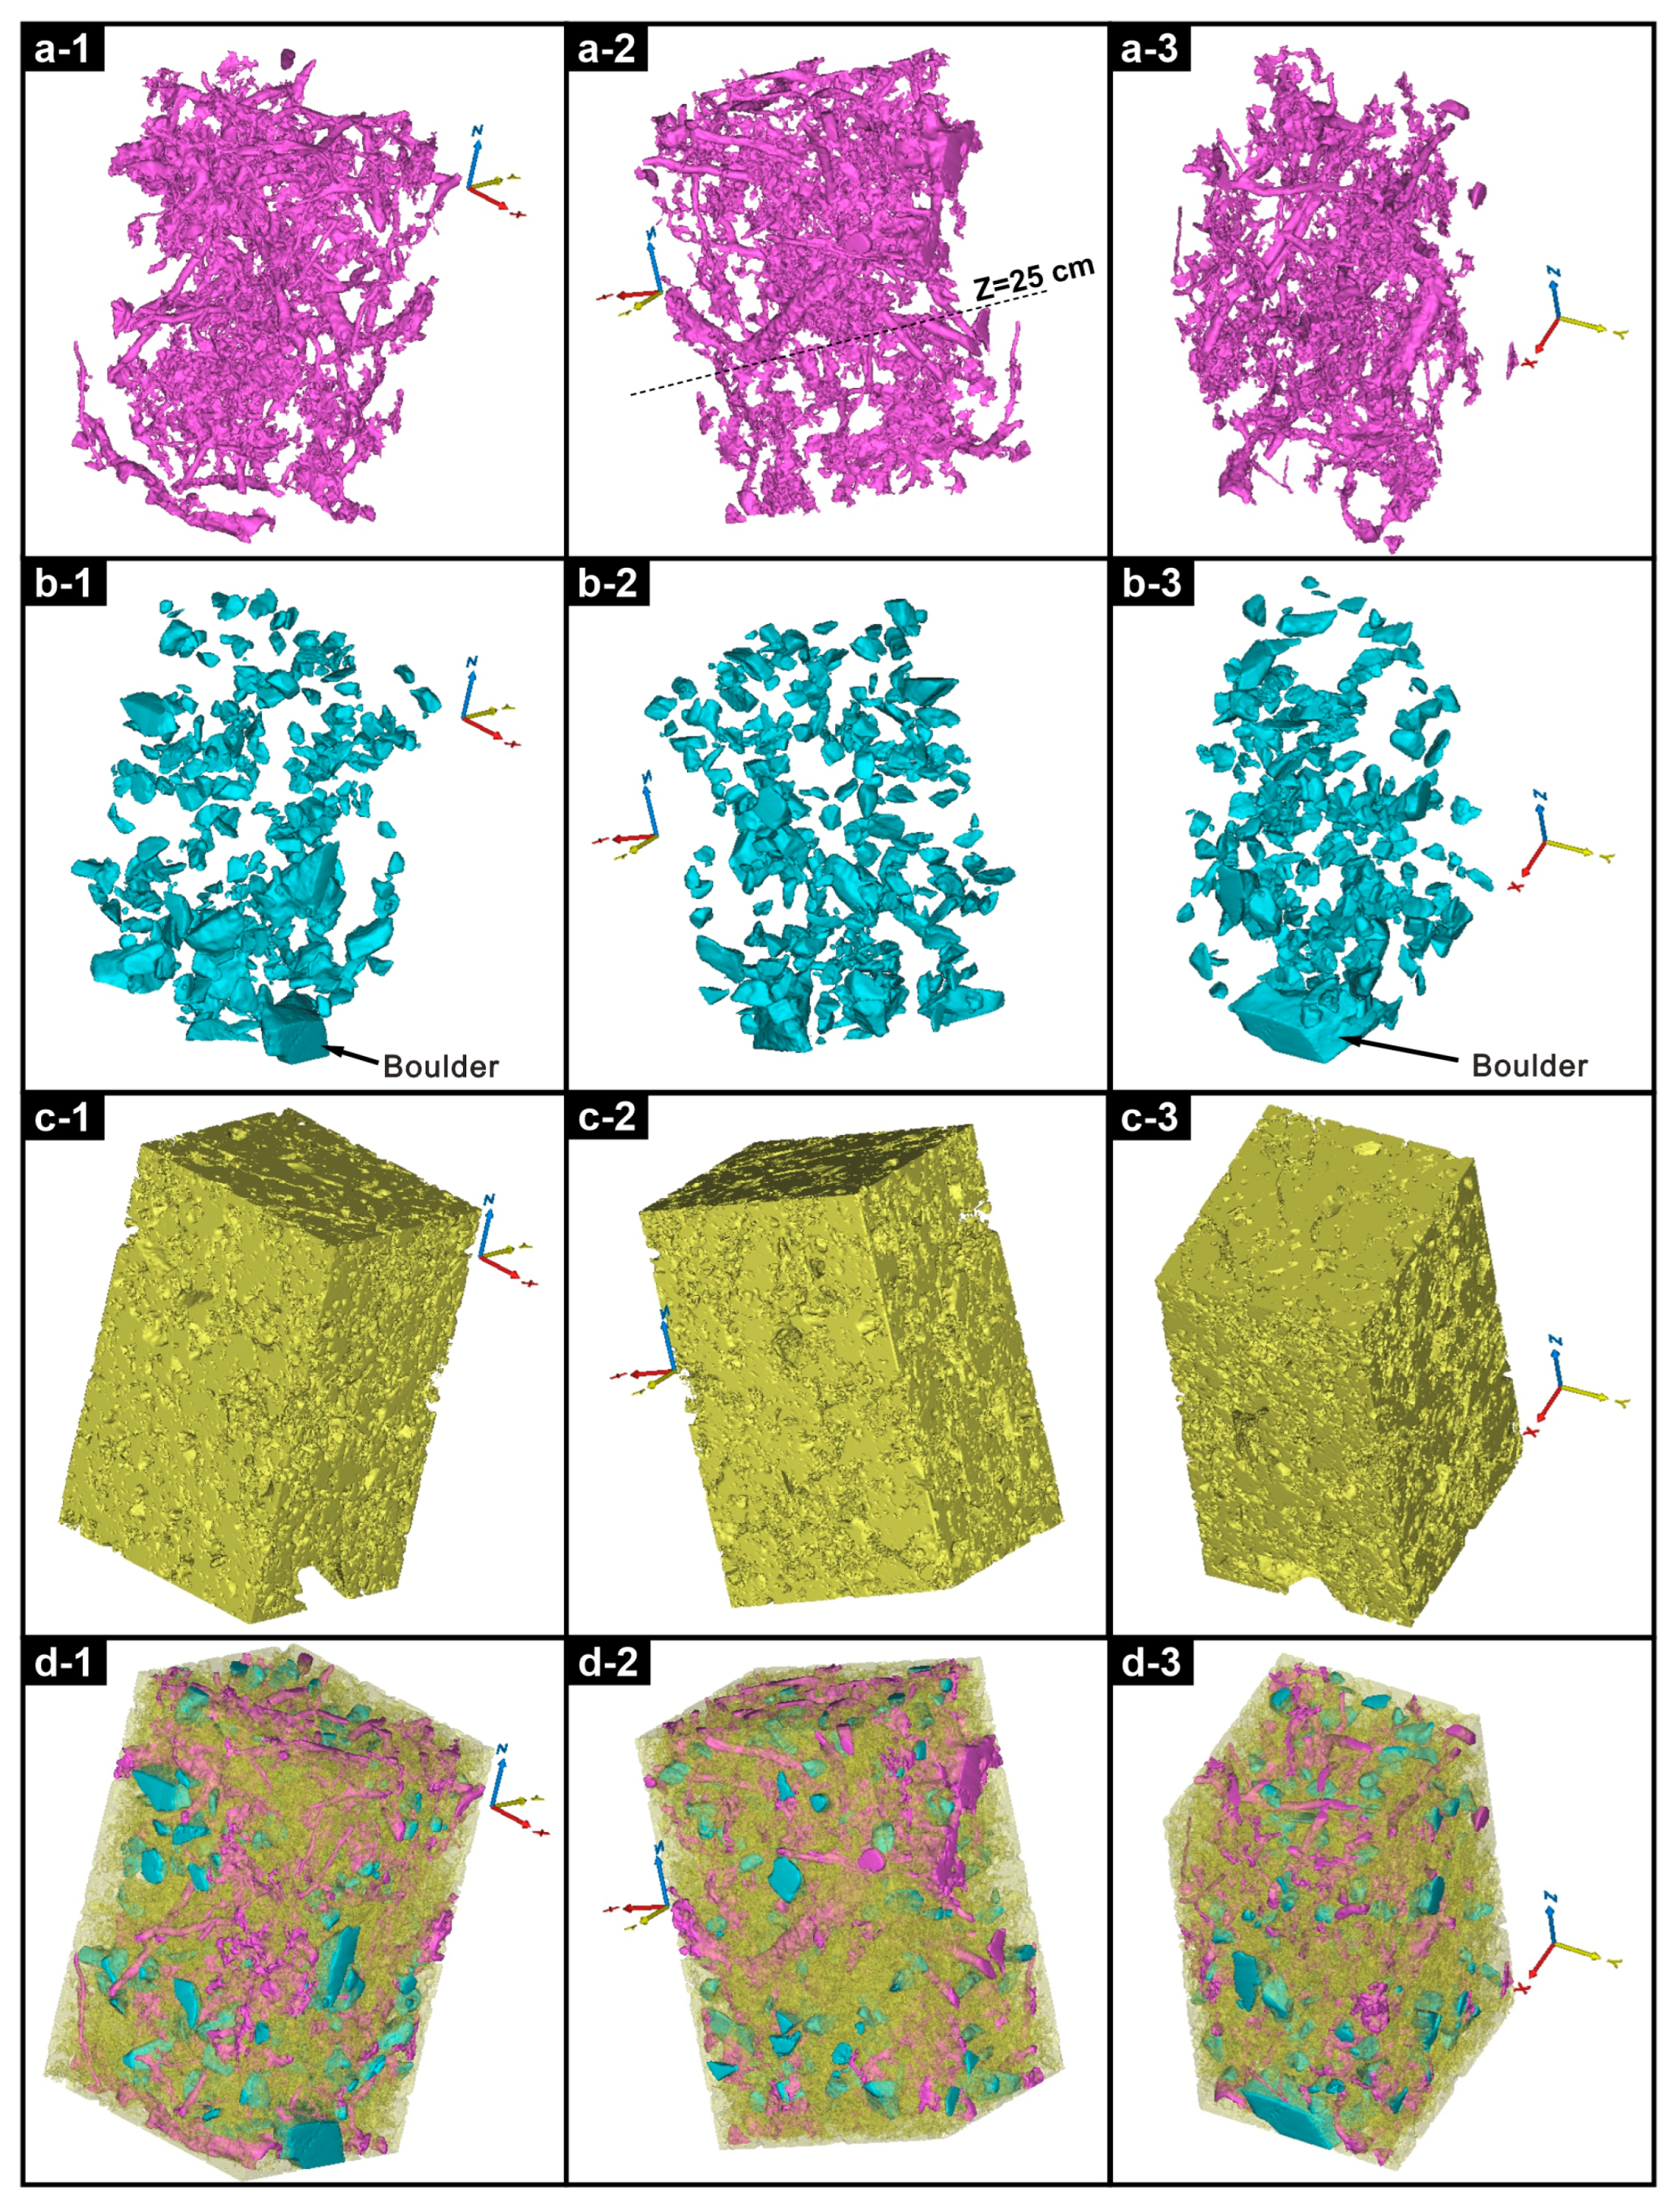
2.3. Computed Tomography Scanning and Processing
2.4. MODFLOW Simulation Program
3. Model Construction
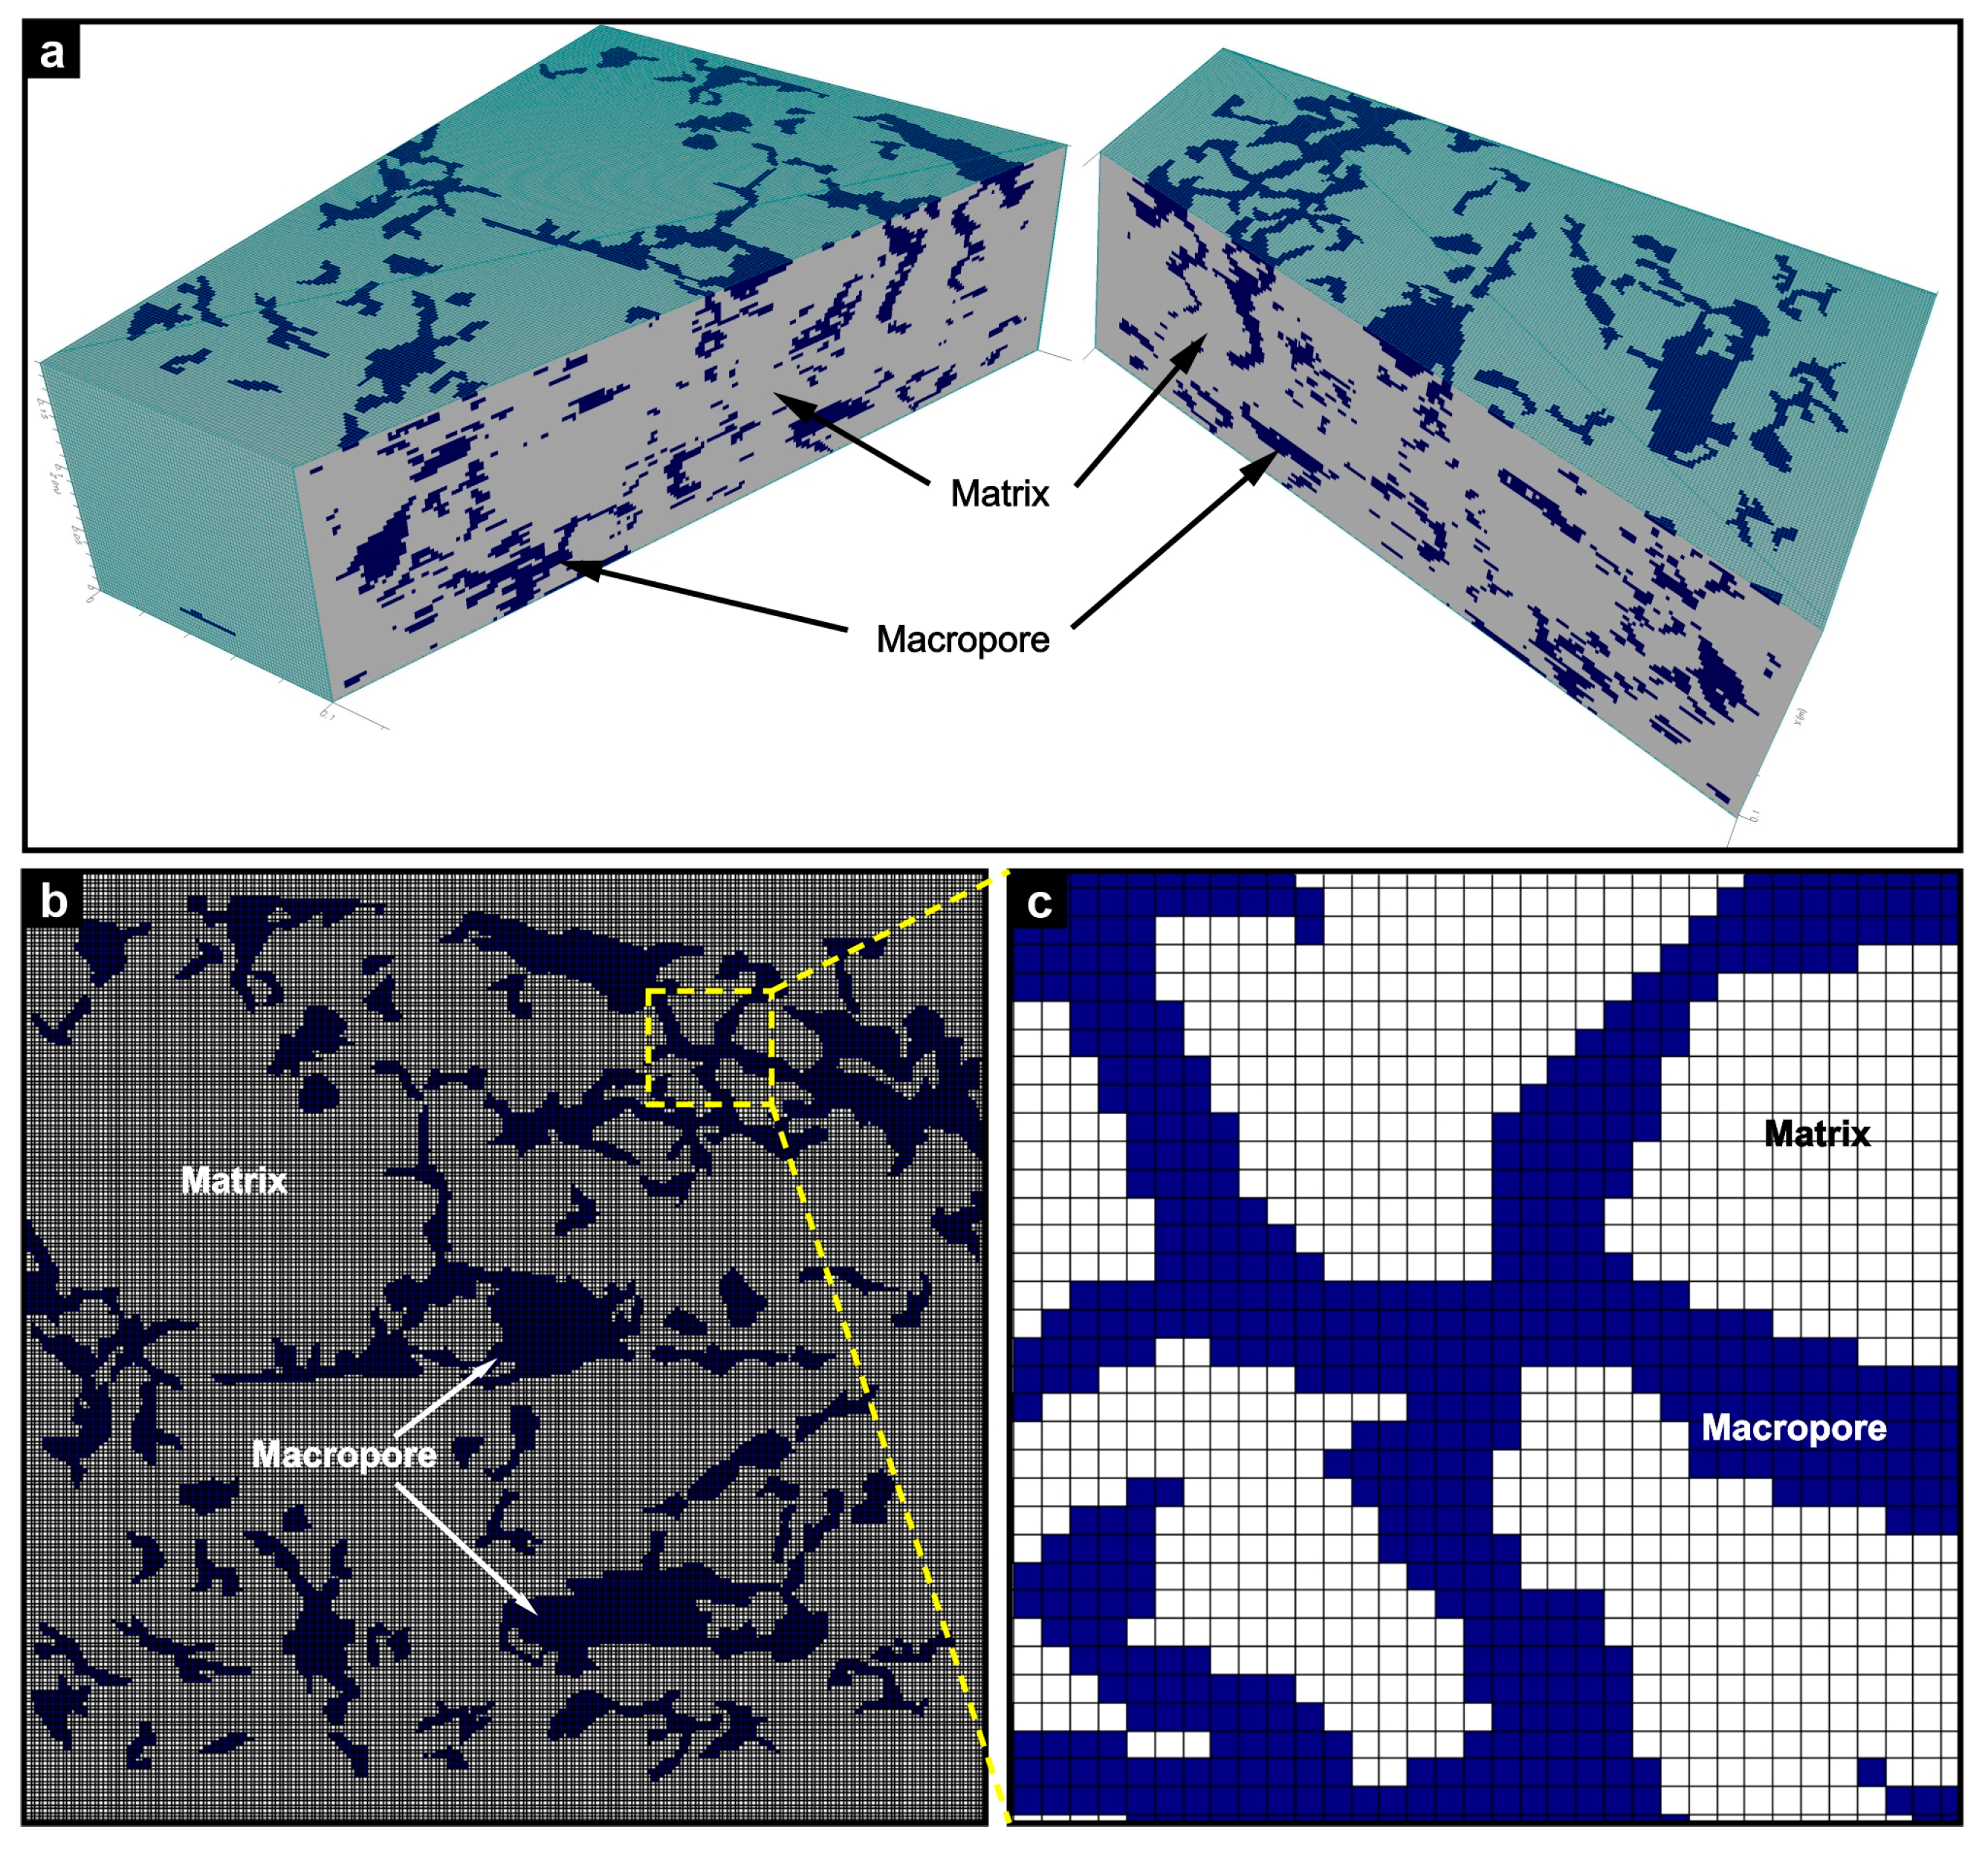
3.1. Numerical Model
3.2. Hydraulic Conductivity and Boundaries
4. Simulation Results
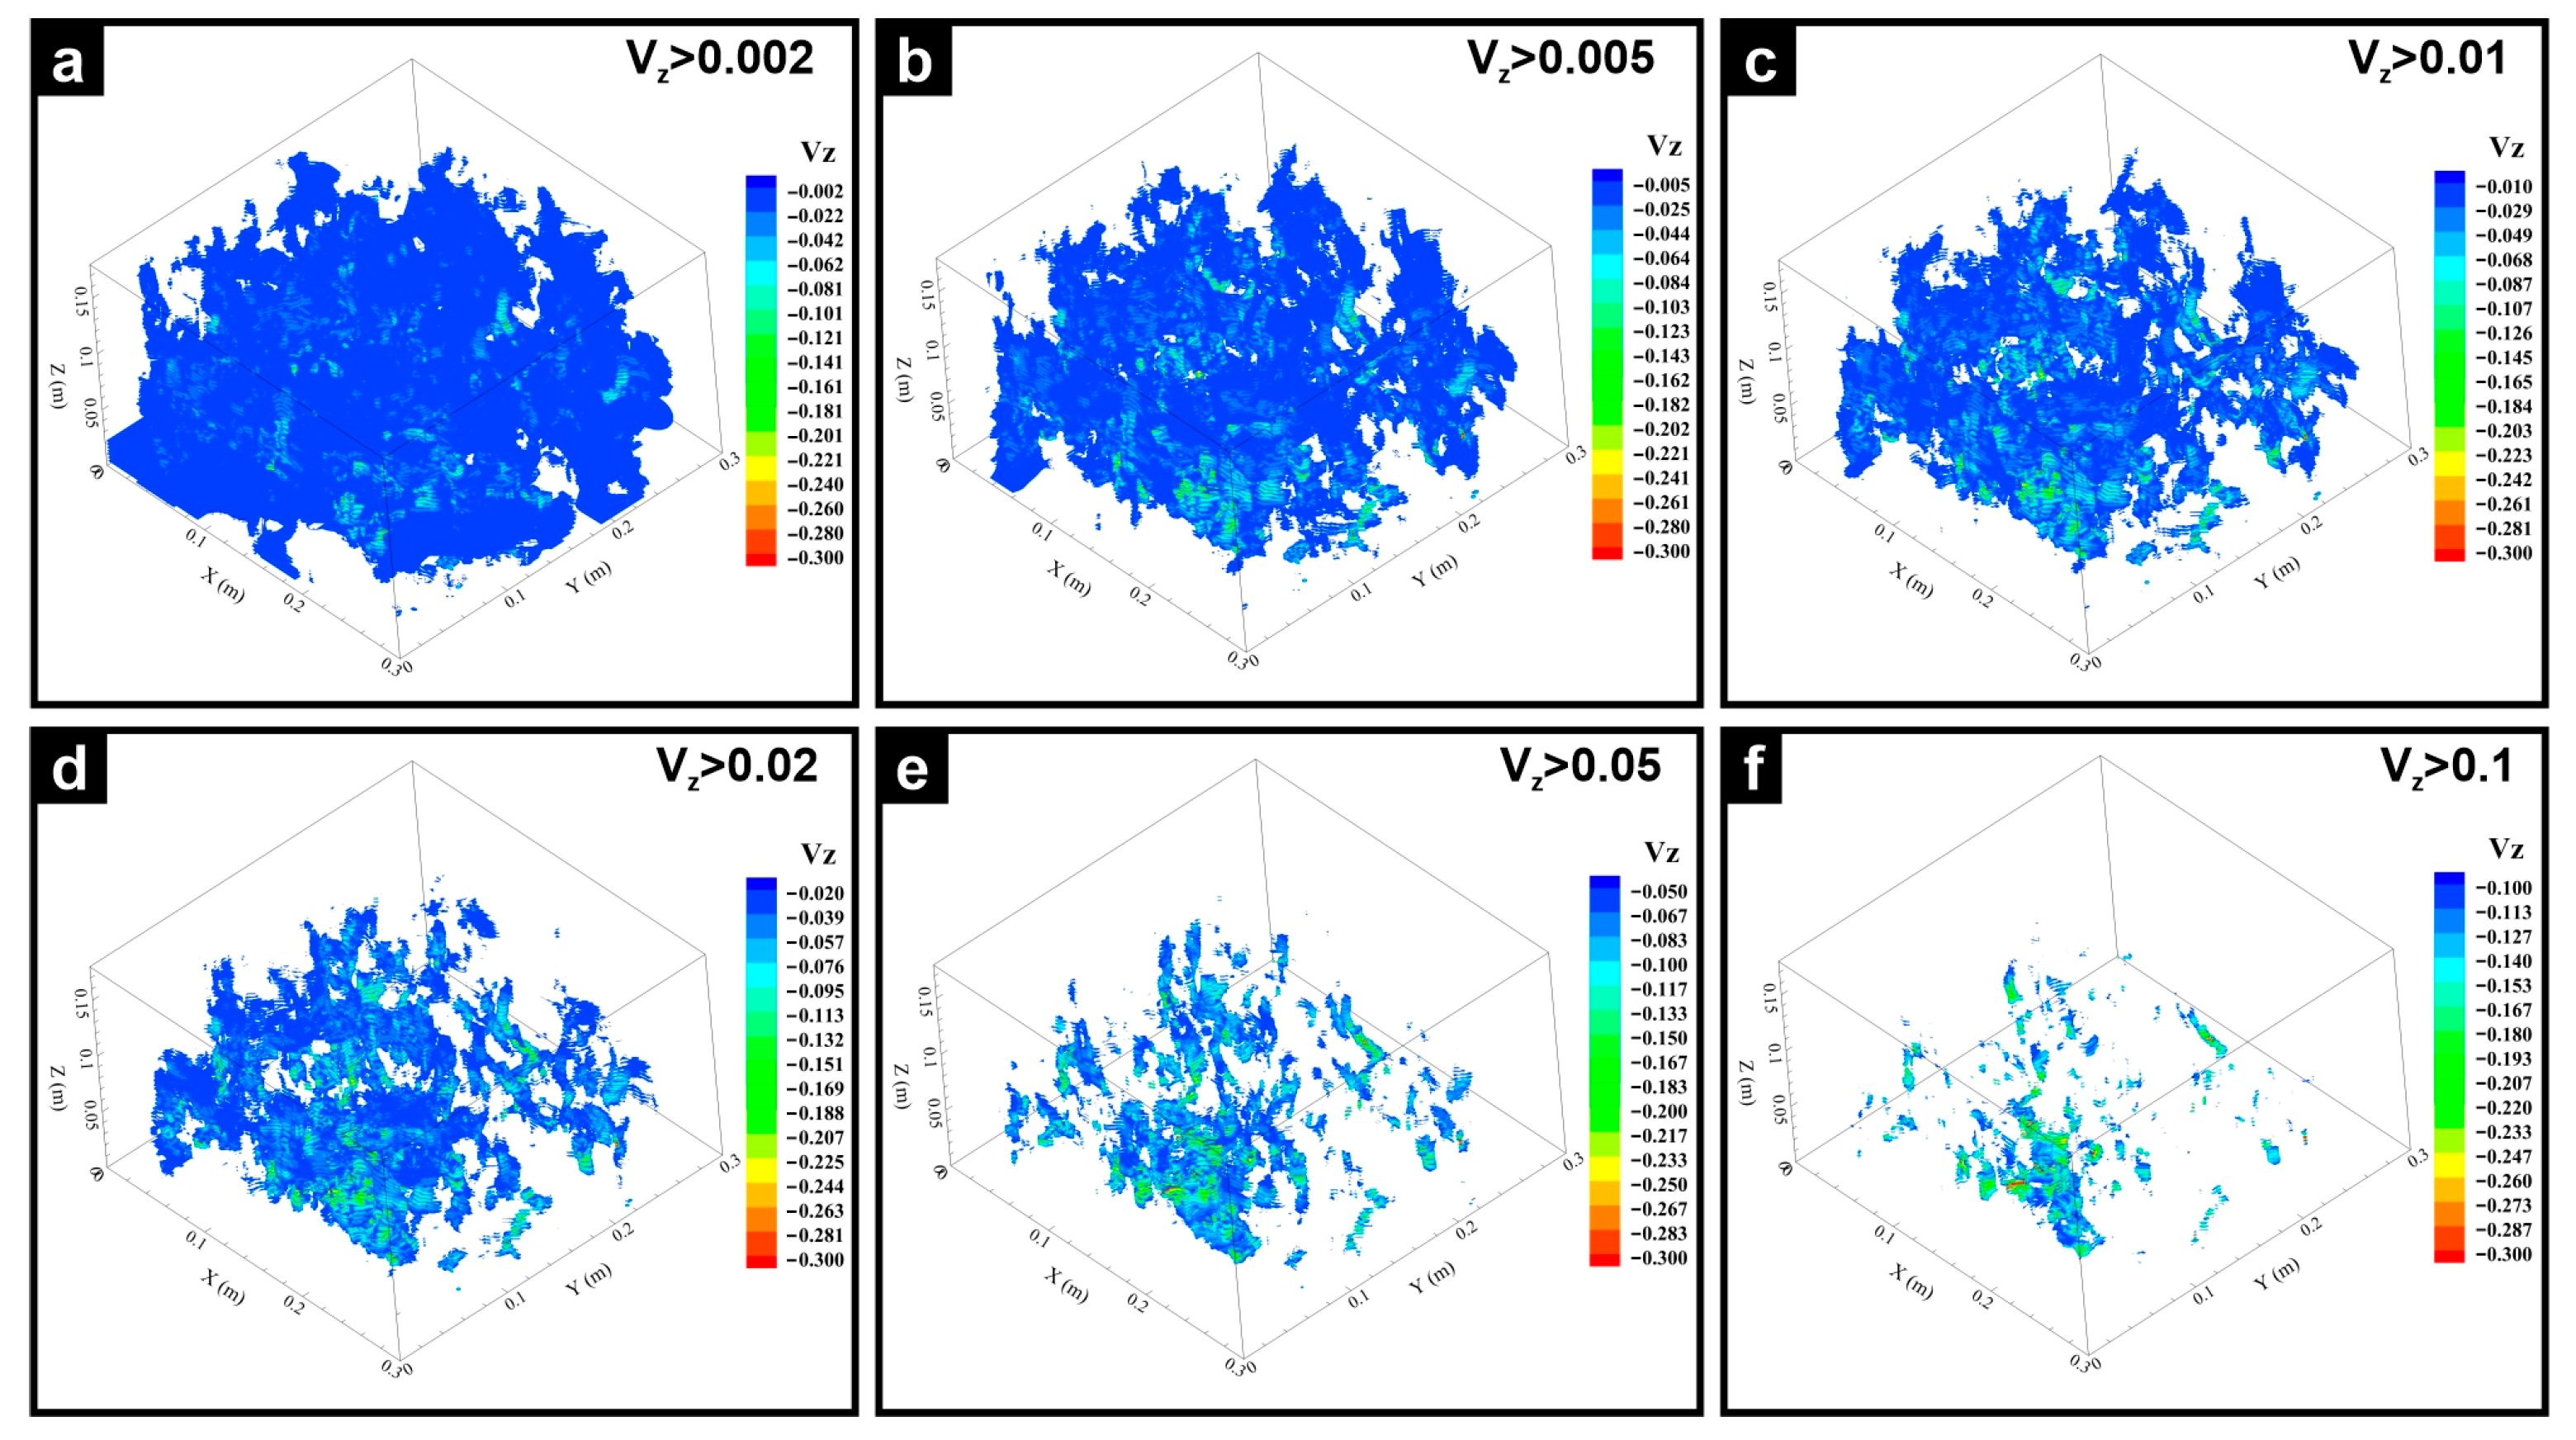
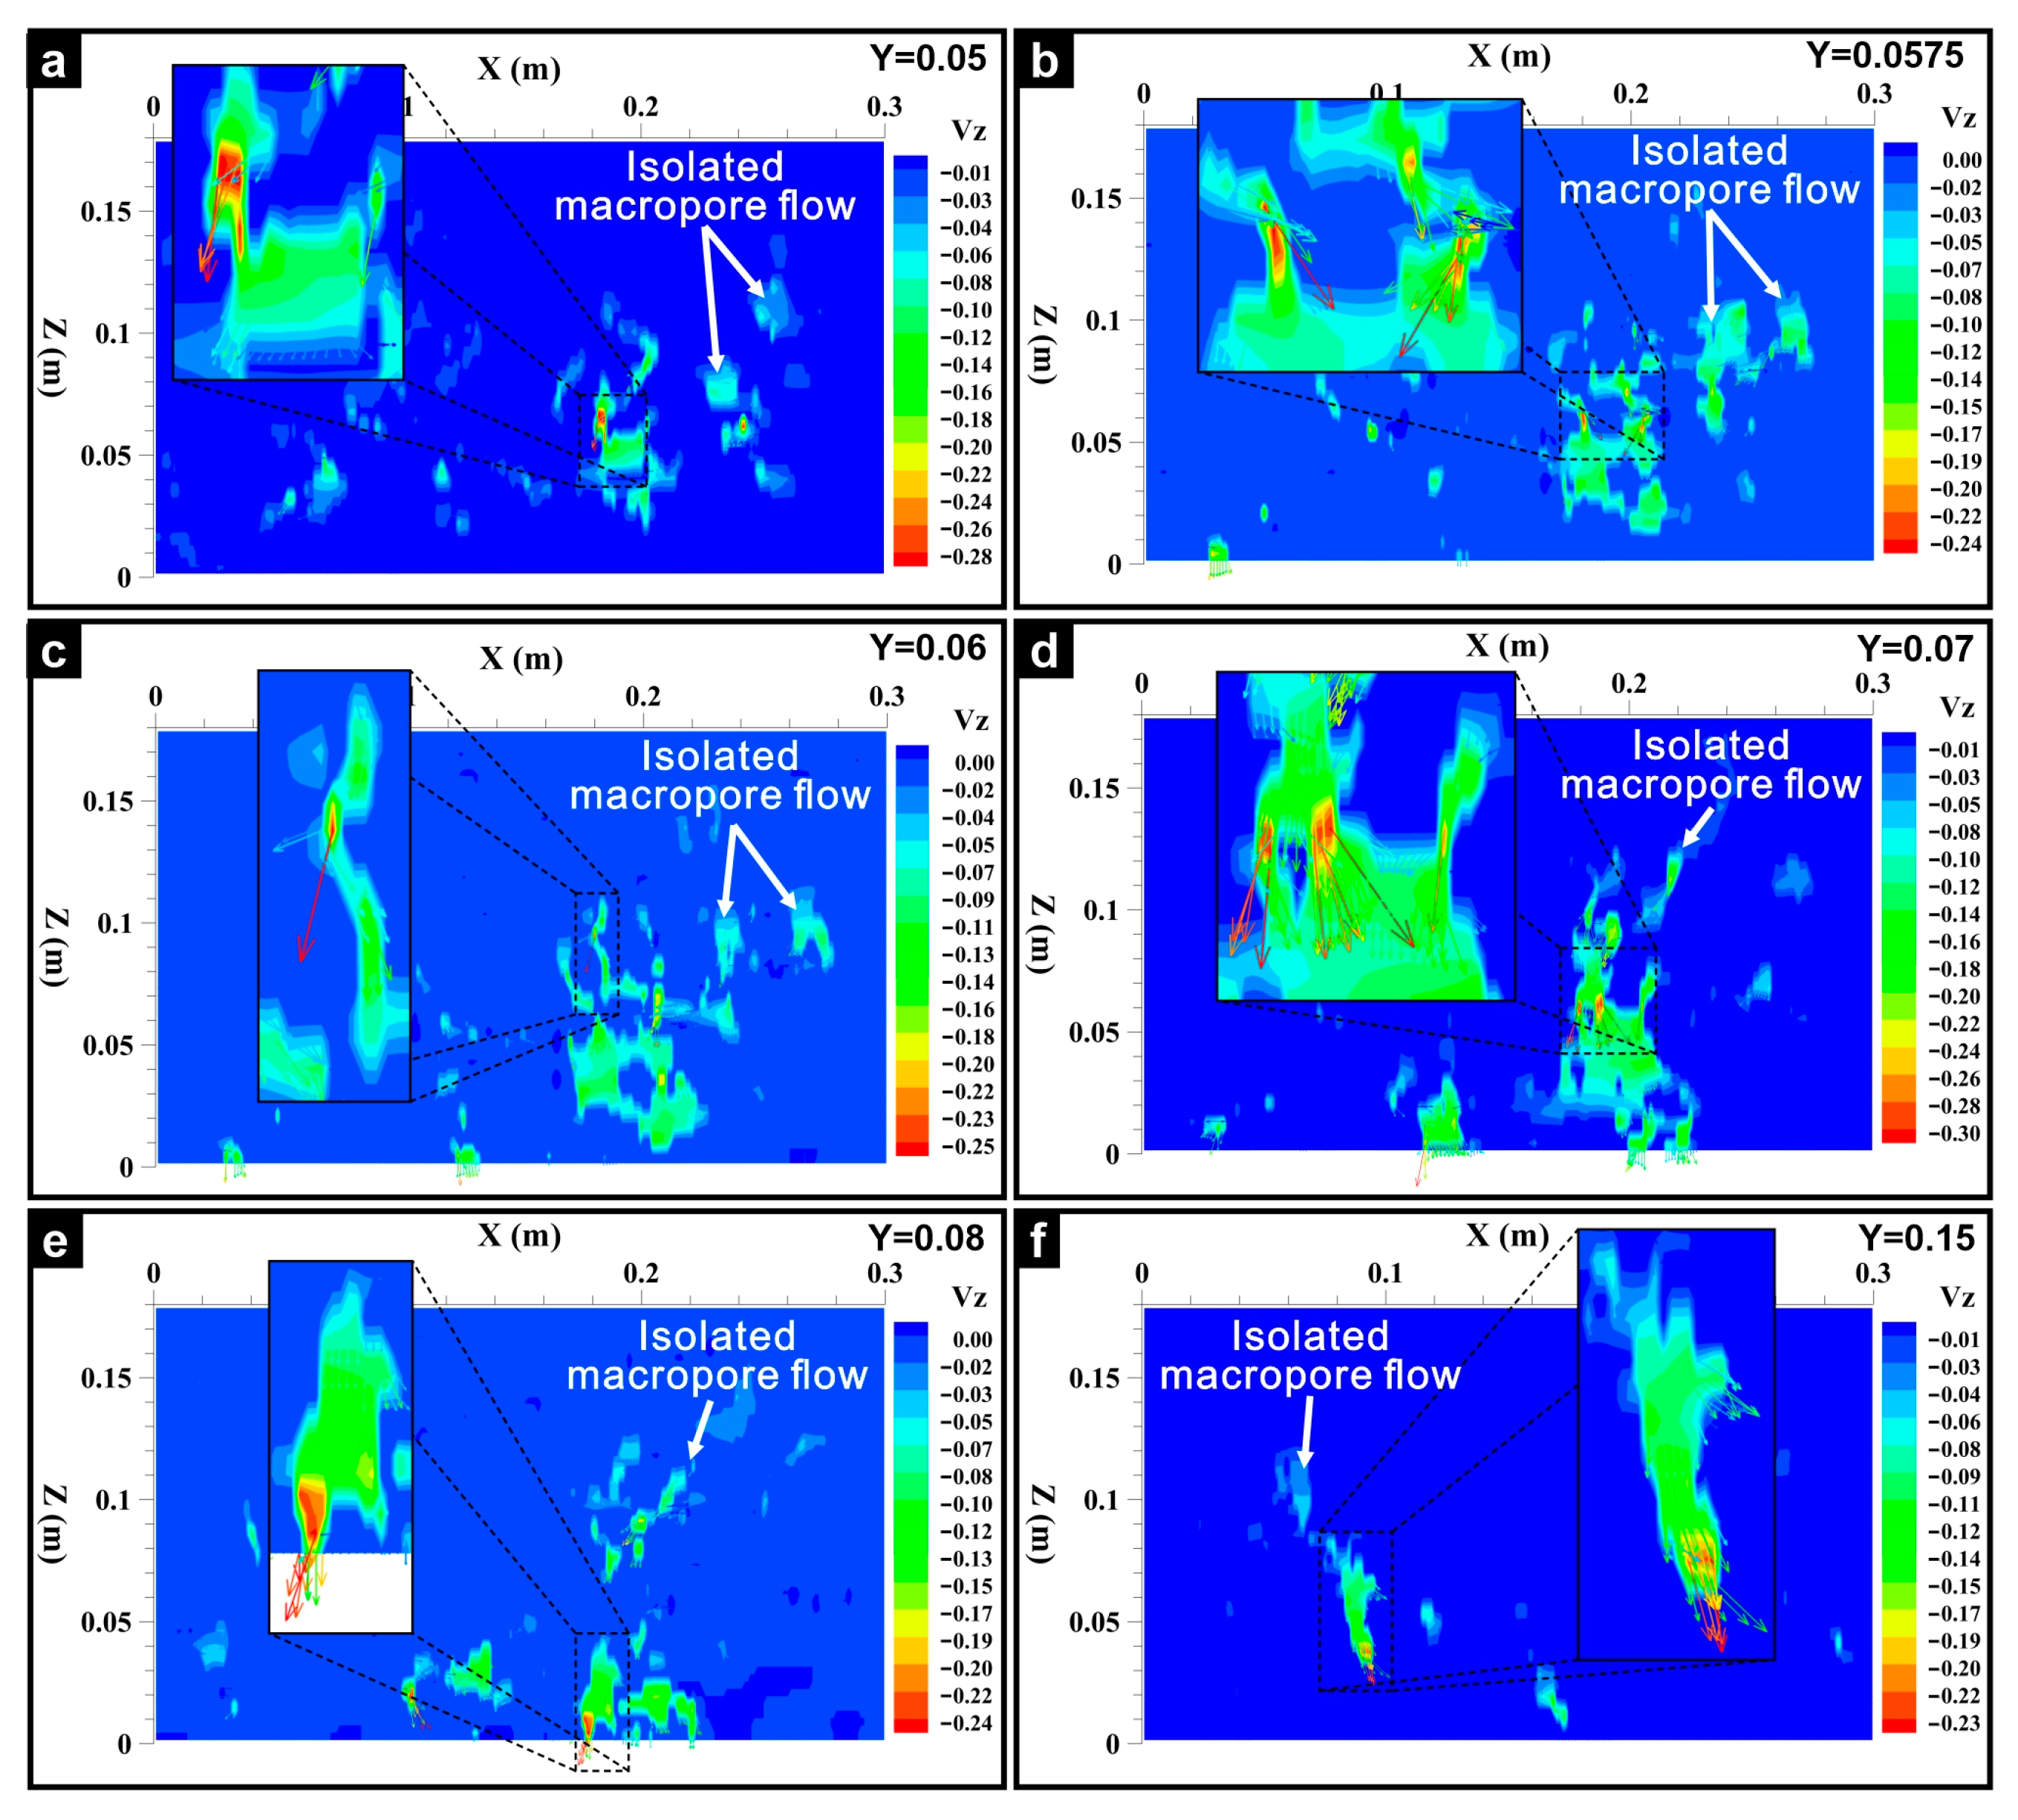
4.1. Transmission Characteristics of the Macropore Flow in the Steady Seepage Simulation
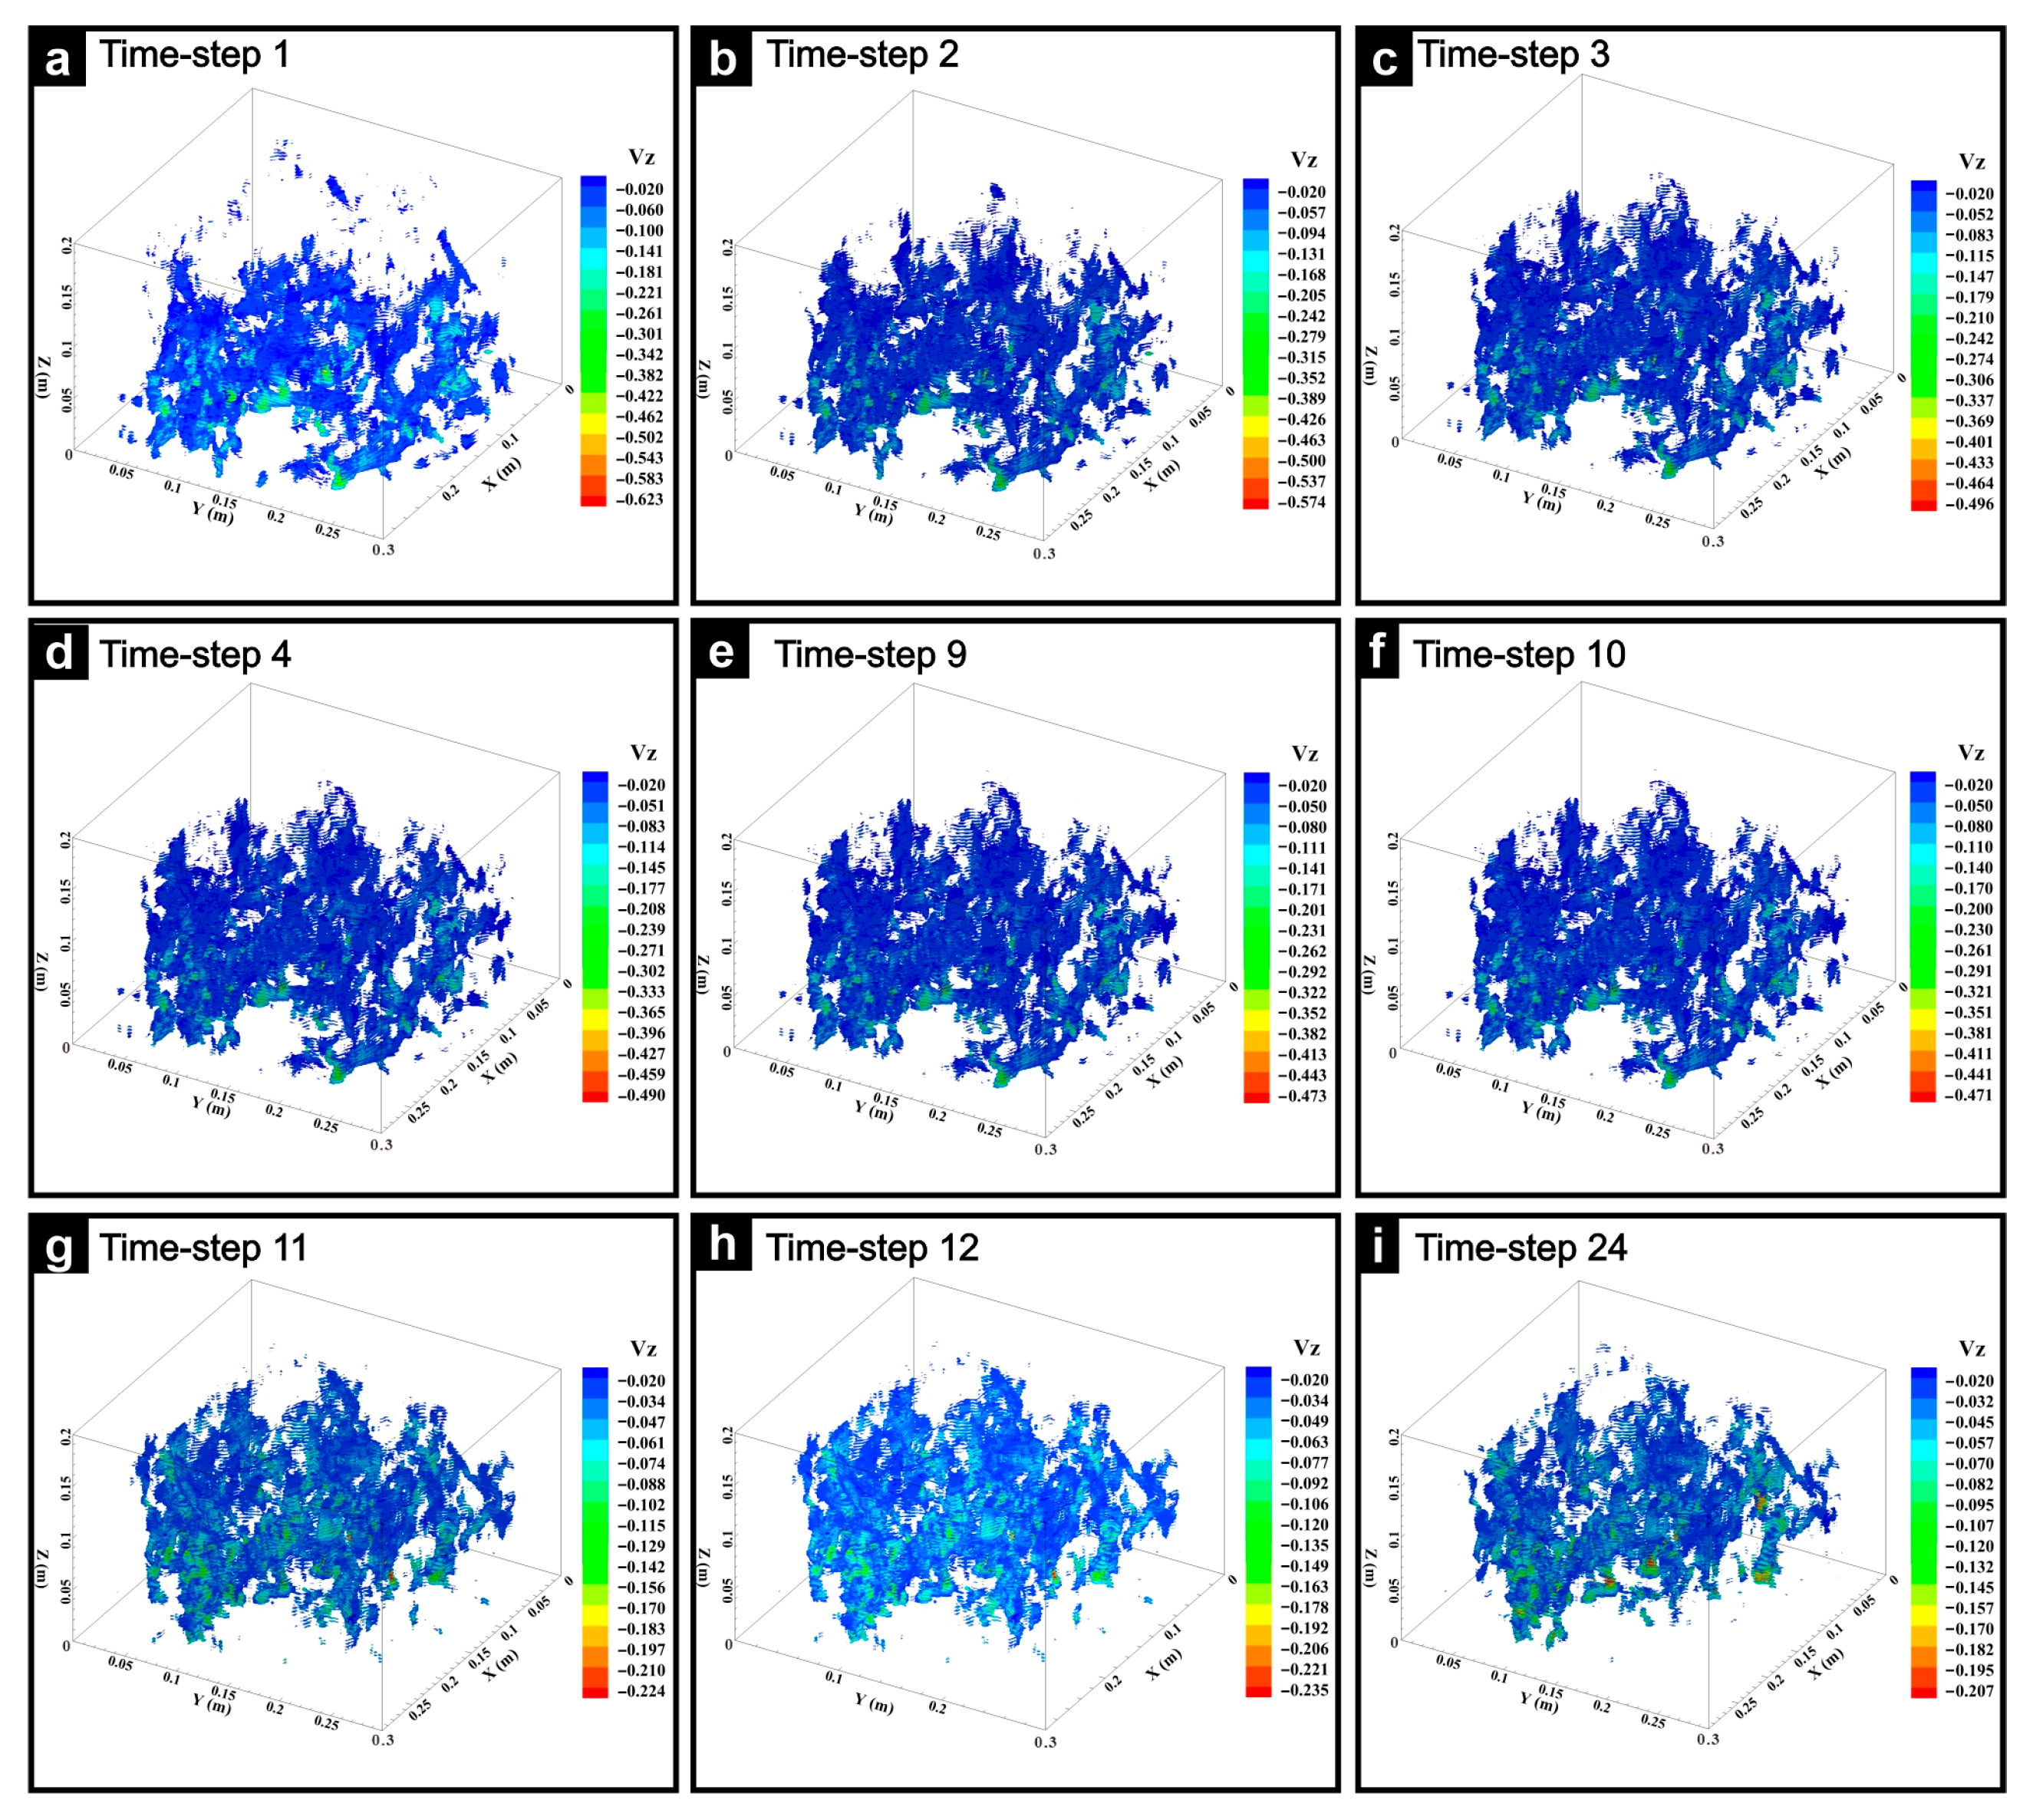
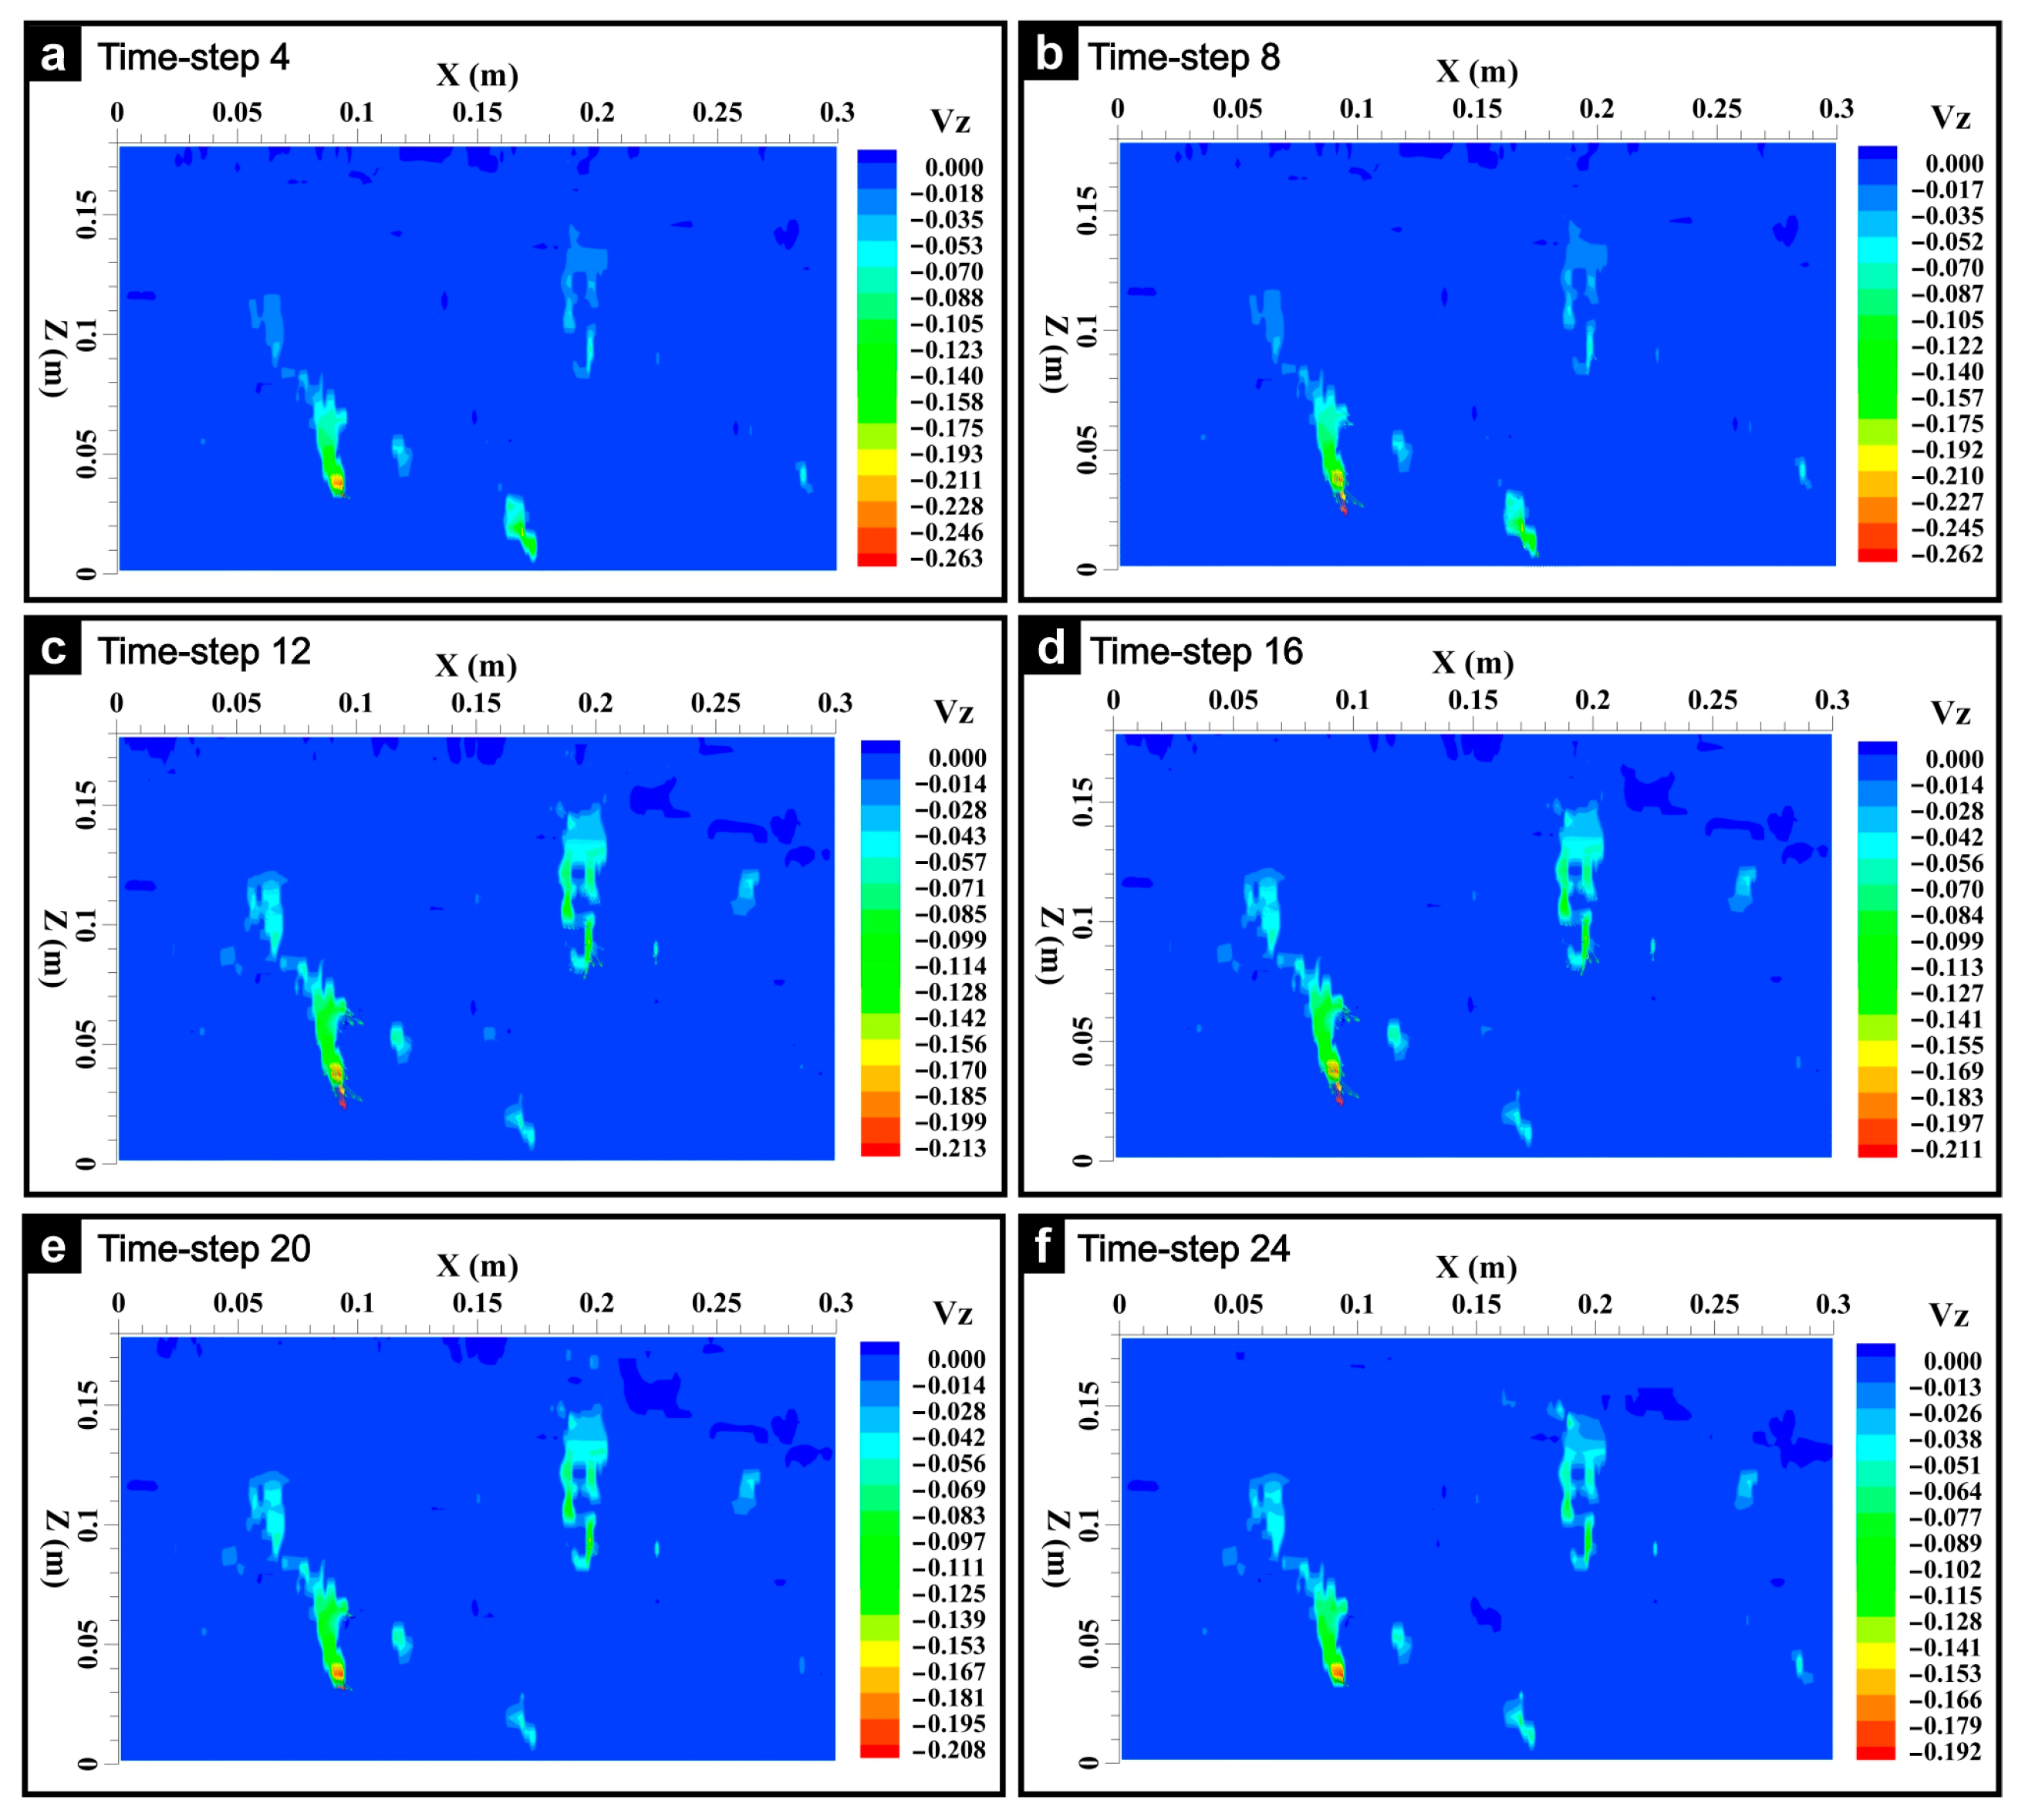
4.2. Transmission Characteristics of the Macropore Flow in the Transient Seepage Simulation
5. Discussion
5.1. Variation of Macropore Flow Velocity in the Transient Seepage Simulation
5.2. Implications of the Rapid Response Behavior of Groundwater to Rainfall for the Stability of Vegetated Slopes
6. Conclusions
- (1)
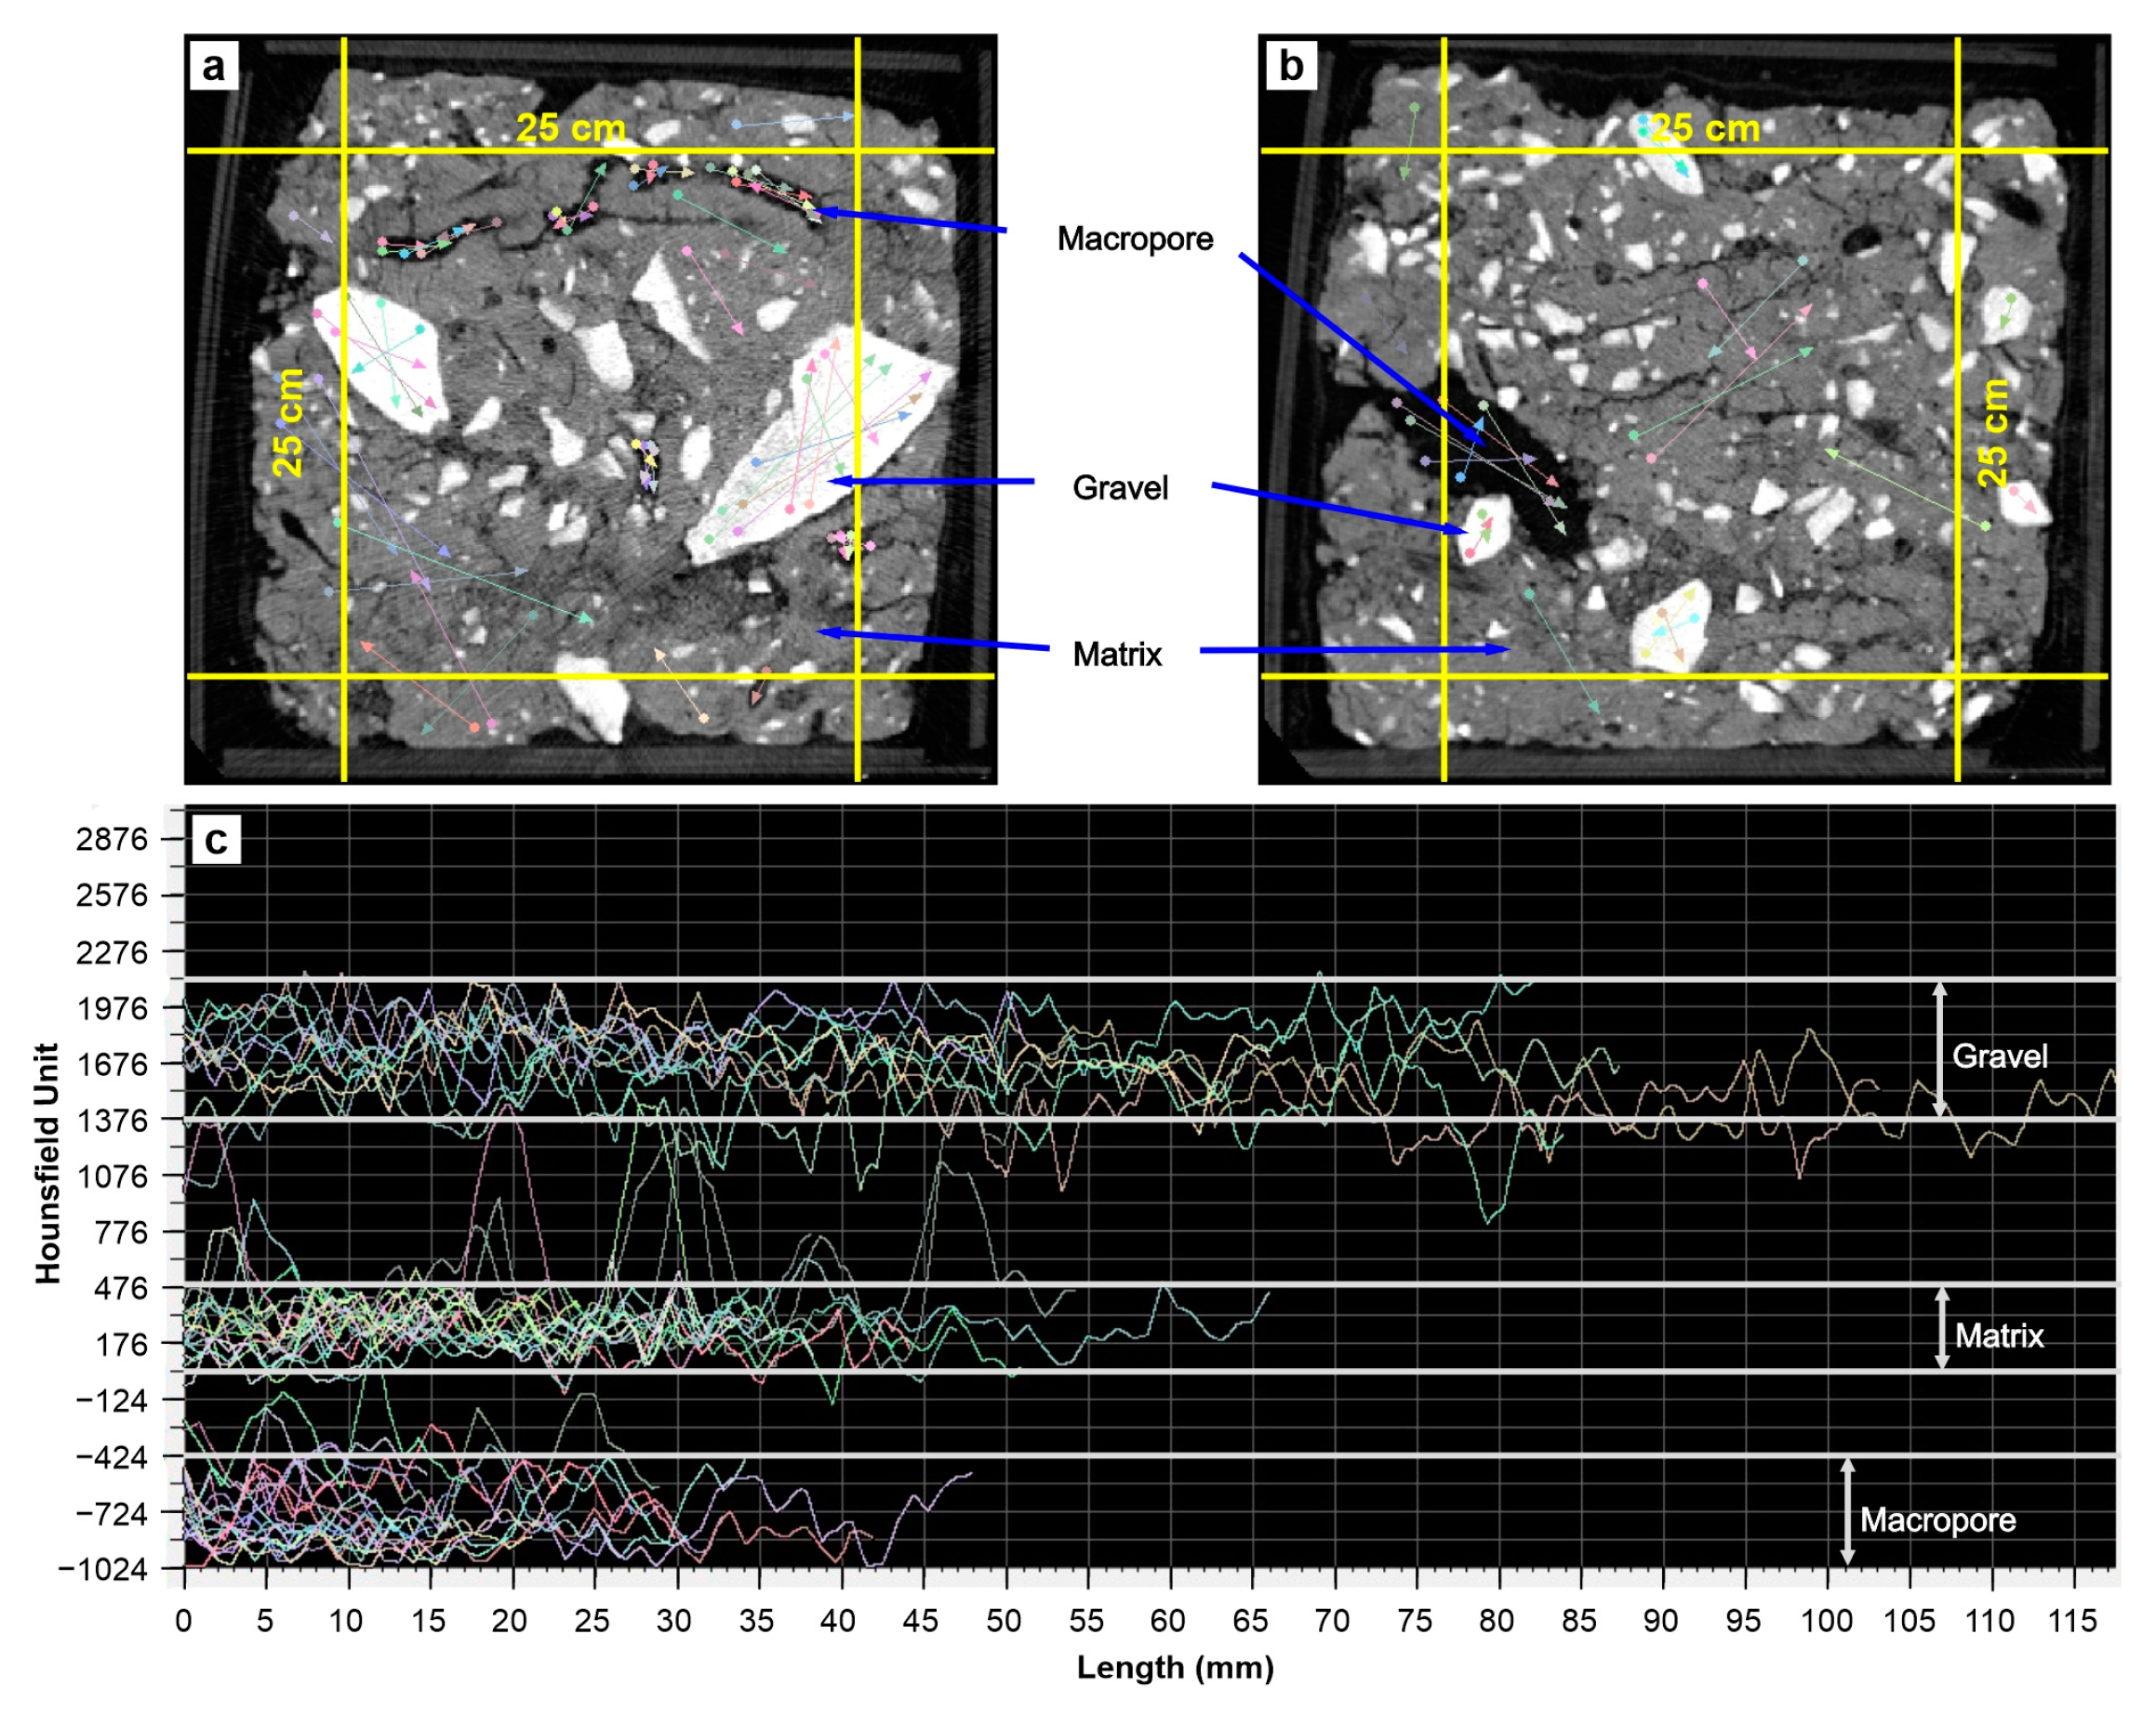
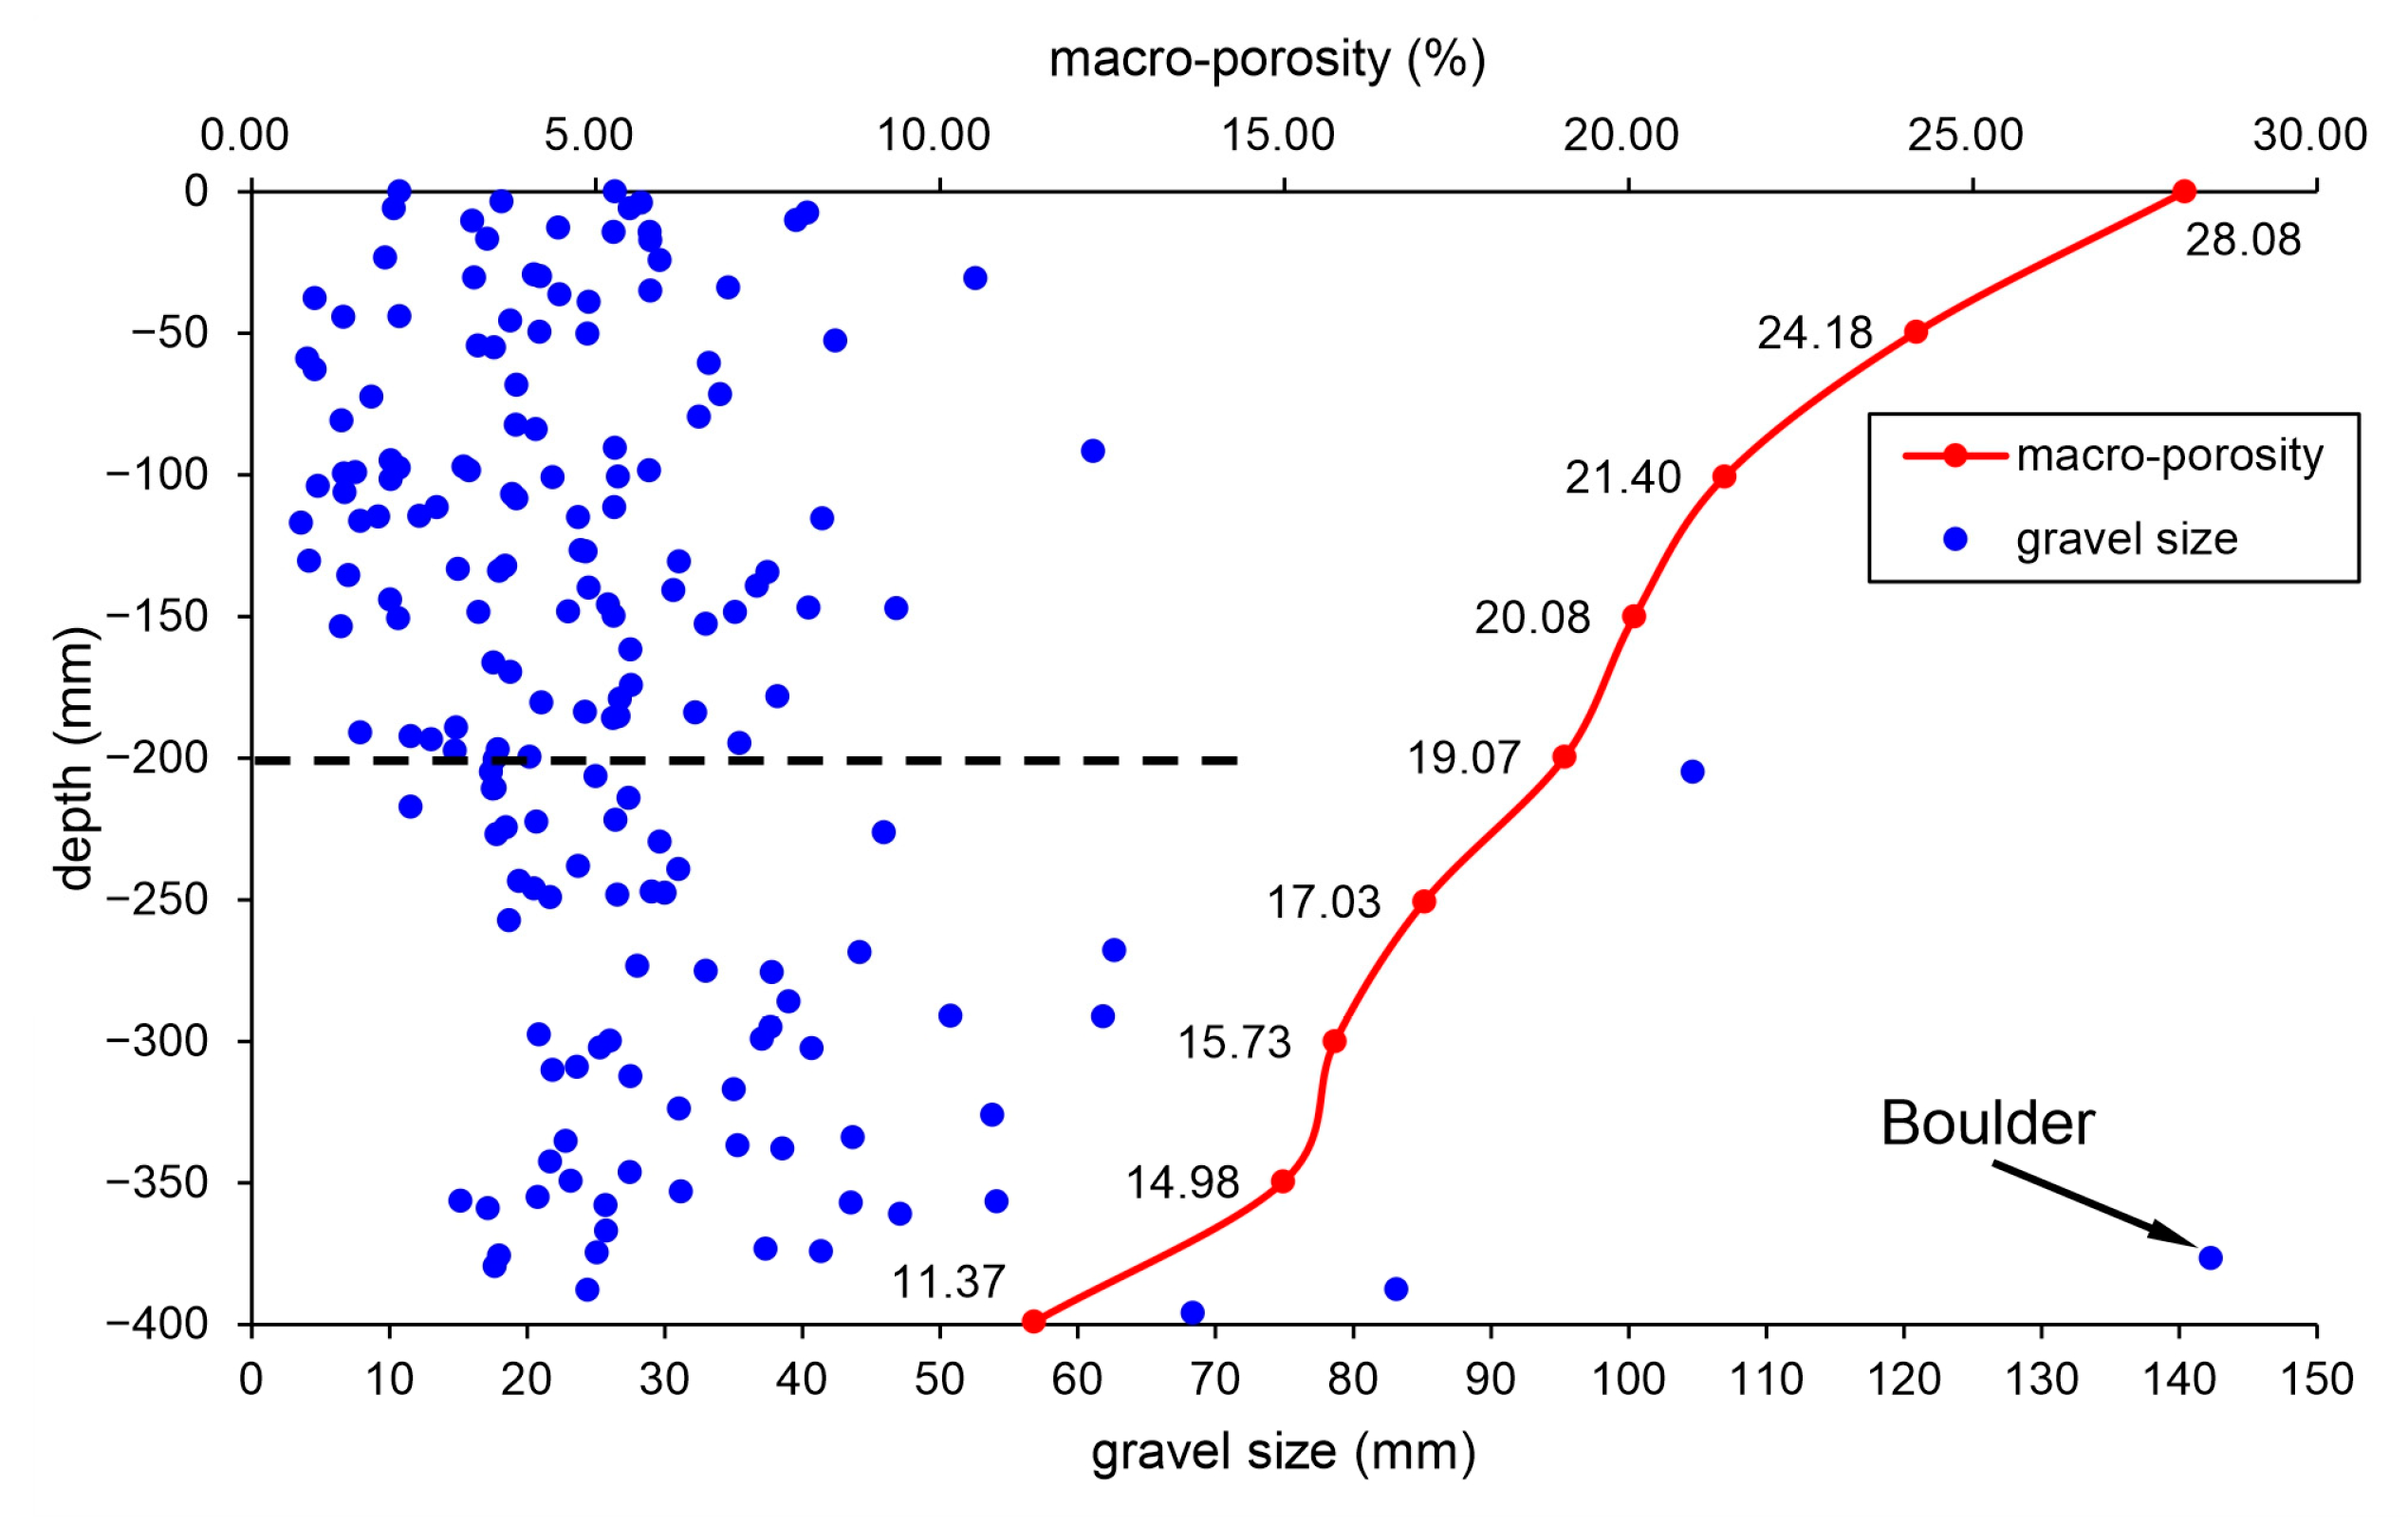
- The distribution pattern of macropores in the soil is not coordinated but is rather in the direction of horizontal or oblique extension into the depth. The shape of the macropores contains not only a dominant proportion of circular tubes (mainly biological macropores, decreasing with the depth) but also a small proportion of flakes (mainly structural macropores). Overall, the soil macro-porosity decreases with increasing depth.
- (2)
- The numerical simulation results showed that the velocity of macropore flow was greater than 0.02 m/s, which was much larger than that of flow in the matrix, and the maximum flow velocity in some macropores with a diameter of >1 cm was 0.2~0.3 m/s. The better the connectivity of the macropores was, the faster the flow rate became. In every single macropore, the velocity reached the maximum at the center perpendicular to the extension and at the throat along the extension. In addition, the transient seepage simulation displayed that the transmission velocity of macropore flow decreased with time elapsed, which was attributed to the gradual decrease in the initial head over time.
- (3)
- Groundwater should be the primary factor responsible for slope failure. Due to the development of vegetation, a large number of macropores, which are characterized by different types but a stable existence, are formed in the slope soil, altering the infiltration behavior of the soil. Rainwater can quickly pass through the soil profile in the form of preferential flow or pipe flow, which will not only accelerate and increase the recharge process and amount of groundwater but also shorten the lag time of the peak discharge response to rainfall. This process can free up space for the next recharge, which is beneficial to slope stability. However, it also reduces the overall quality of the soil, laying the foundation for slope failure.
Author Contributions
Funding
Institutional Review Board Statement
Informed Consent Statement
Data Availability Statement
Acknowledgments
Conflicts of Interest
References
- Chigira, M. Geologic factors contributing to landslide generation in a pyroclastic area: August 1998 Nishigo Village, Japan. Geomorphology 2002, 46, 117–128. [Google Scholar] [CrossRef]
- Cardinali, M.; Galli, M.; Guzzetti, F.; Ardizzone, F.; Reichenbach, P.; Bartoccini, P. Rainfall induced landslides in December 2004 in southwestern Umbria, central Italy: Types, extent, damage and risk assessment. Nat. Hazard Earth Syst. Sci. 2006, 6, 237–260. [Google Scholar] [CrossRef]
- Vessia, G.; Parise, M.; Brunetti, M.T.; Peruccacci, S.; Rossi, M.; Vennari, C.; Guzzetti, F. Automated reconstruction of rainfall events responsible for shallow landslides. Nat. Hazards Earth Syst. Sci. 2014, 14, 2399–2408. [Google Scholar] [CrossRef]
- Nikolopoulos, E.I.; Crema, S.; Marchi, L.; Marra, F.; Guzzetti, F.; Borga, M. Impact of uncertainty in rainfall estimation on the identification of rainfall thresholds for debris flow occurrence. Geomorphology 2014, 221, 286–297. [Google Scholar] [CrossRef]
- Marra, F.; Nikolopoulos, E.I.; Creutin, J.D.; Borg, M. Space-time organization of debris flows-triggering rainfall and its effect on the identification of the rainfall threshold relationship. J. Hydrol. 2016, 541, 246–255. [Google Scholar] [CrossRef]
- Piciullo, L.; Gariano, S.L.; Melillo, M.; Brunetti, M.T.; Peruccacci, S.; Guzzetti, F.; Calvello, M. Definition and performance of a threshold-based regional early warning model for rainfall-induced landslides. Landslides 2017, 14, 995–1008. [Google Scholar] [CrossRef]
- Vessia, G.; Curzio, D.D.; Chiaudani, A.; Rusi, S. Regional rainfall threshold maps drawn through multivariate geostatistical techniques for shallow landslide hazard zonation. Sci. Total Environ. 2020, 705, 135815. [Google Scholar] [CrossRef]
- Qiang, X.; Peng, D.; Zhang, S.; Zhu, X.; He, C.; Qi, X.; Zhao, K.; Xiu, D.; Ju, N. Successful implementations of a real-time and intelligent early warning system for loess landslides on the Heifangtai terrace, China. Eng. Geol. 2020, 278, 105817. [Google Scholar] [CrossRef]
- Abraham, M.T.; Satyam, N.; Rosi, A.; Pradhan, B.; Segoni, S. Usage of antecedent soil moisture for improving the performance of rainfall thresholds for landslide early warning. Catena 2021, 200, 105147. [Google Scholar] [CrossRef]
- Rana, H.; Babu, G.L.S. Regional back analysis of landslide events using TRIGRS model and rainfall threshold: An approach to estimate landslide hazard for Kodagu, India. Bull. Eng. Geol. Environ. 2022, 81, 160. [Google Scholar] [CrossRef]
- Wang, K.; Xu, Z.M.; Tian, L.; Ren, Z.; Yang, K.; Tang, Y.J.; Gao, H.Y.; Luo, J.Y. Estimating the dynamics of the groundwater in vegetated slopes based on the monitoring of streams. Eng. Geol. 2019, 259, 105160. [Google Scholar] [CrossRef]
- Campbell, R.H. Soil slips, debris flows, and rainstorms in the Santa Monica Mountains and Vicinity, southern California. In US Geological Survey Professional Paper 851; U.S. Government Printing Office: Washington, DC, USA, 1975; pp. 18–20. [Google Scholar]
- Huang, C.C.; Ju, Y.J.; Hwu, L.K.; Lee, J.L. Internal soil moisture and piezometric responses to rainfall-induced shallow slope failures. J. Hydrol. 2009, 370, 39–51. [Google Scholar] [CrossRef]
- Luxmoore, R.J.; Jardine, P.M.; Wilson, G.V.; Jones, J.R.; Zelazny, L.W. Physical and chemical controls of preferred path flow through a forested hillslope. Geoderma 1990, 46, l139–l154. [Google Scholar] [CrossRef]
- Carey, S.K.; Quinton, W.L.; Goeller, N.T. Field and laboratory estimates of pore size properties and hydraulic characteristics for subarctic organic soils. Hydrol. Process. 2007, 21, 2560–2571. [Google Scholar] [CrossRef]
- Lamandé, M.; Labouriau, R.; Holmstrup, M.; Torp, S.B.; Greve, M.H.; Heckrath, G.; Bo, V.I.; Jonge, L.W.D.; Moldrup, P.; Jacobsen, O.H. Density of macropores as related to soil and earthworm community parameters in cultivated grasslands. Geoderma 2011, 162, 319–326. [Google Scholar] [CrossRef]
- Zhang, W.; Huang, R.; Xiang, J.; Zhang, N. Recent advances in bio-inspired geotechnics: From burrowing strategy to underground structures. Gondwana Res. 2024, 130, 1–17. [Google Scholar] [CrossRef]
- Aubertin, G.M. Nature and extent of macropores in forest soils and their influence on subsurface water movement. In U.S.D.A. Forest Service Research Paper NE-192; Northeastern Forest Experiment Station: Amherst, MA, USA, 1971. [Google Scholar]
- Mosley, M.P. Streamflow Generation in a Forested Watershed, New Zealand. Water Resour. Res. 1979, 15, 795–806. [Google Scholar] [CrossRef]
- Beven, K.; Germann, P. Macropores and water flow in Soils. Water Resour. Res. 1980, 18, 1311–1325. [Google Scholar] [CrossRef]
- Cey, E.E.; Rudolph, D.L. Field study of macropore flow processes using tension infiltration of a dye tracer in partially saturated soils. Hydrol. Process. 2009, 23, 1768–1779. [Google Scholar] [CrossRef]
- Qin, M.; Qin, P.; Qin· Jiang, Y.; Guo, J.; Zhang, G.; Ramzan, M. Occurrence of shallow landslides triggered by increased hydraulic conductivity due to tree roots. Landslides 2022, 19, 2593–2604. [Google Scholar] [CrossRef]
- Christiansen, J.S.; Thorsen, M.; Clausen, T.; Hansen, S.; Refsgaard, J.C. Modelling of macropore flow and transport processes at catchment scale. J. Hydrol. 2004, 299, 136–158. [Google Scholar] [CrossRef]
- Köhne, J.M.; Mohanty, B.P. Water flow processes in a soil column with a cylindrical macropore: Experiment and hierarchical modeling. Water Resour. Res. 2005, 41, W03010. [Google Scholar] [CrossRef]
- Alaoui, A. Modelling susceptibility of grassland soil to macropore flow. J. Hydrol. 2015, 525, 536–546. [Google Scholar] [CrossRef]
- Zhang, J.; Wen, N.; Sun, Q.; Horton, R.; Liu, G. The effect of macropore morphology of actual anecic earthworm burrows on water infiltration: A COMSOL simulation. J. Hydrol. 2023, 618, 129261. [Google Scholar] [CrossRef]
- Wang, K.; Ren, Z.; Mei, X.F.; Tian, L.; Yang, K.; Zhou, Z.H.; Luo, J.J.; Xu, Z.M. Rainfall difference between the deposition fan and source area of Touzhai Landslide in Yunnan, China. Bull. Eng. Geol. Environ. 2019, 78, 1937–1954. [Google Scholar] [CrossRef]
- Warner, G.S.; Nieber, J.L.; Moore, I.D.; Geise, R.A. Charactering macropores in soils by computed tomography. Soil Sci. Soc. Am. J. 1989, 53, 653–660. [Google Scholar] [CrossRef]
- Anderson, S.H.; Peyton, R.L.; Gantzer, C.J. Evaluation of constructed and natural soil macropores using X-ray computed tomography. Geoderma 1990, 46, 13–29. [Google Scholar] [CrossRef]
- Zeng, Y.; Gantzer, C.J.; Payton, R.L.; Anderson, S.H. Fractal dimension and lacunarity determined with X-ray computed tomography. Soil Sci. Soc. Am. J. 1996, 60, 1718–1724. [Google Scholar] [CrossRef]
- Gao, M.; Yang, M.; Lu, Y.; Levin, V.A.; He, P.; Zhu, H. Mechanical characterization of uniaxial compression associated with lamination angles in shale. Adv. Geo-Energy Res. 2024, 13, 56–68. [Google Scholar] [CrossRef]
- Zhu, H.; Huang, C.; Ju, Y.; Bu, H.; Li, X.; Yang, M.; Chu, Q.; Feng, H.; Qiao, P.; Qi, Y.; et al. Multi-scale multidimensional characterization of clay-hosted pore networks of shale using FIBSEM, TEM, and X-ray micro-tomography: Implications for methane storage and migration. Appl. Clay Sci. 2021, 213, 106239. [Google Scholar] [CrossRef]
- United States Geological Survey Website. Available online: https://www.usgs.gov/mission-areas/water-resources/science/modflow-and-related-programs?qt-science_center_objects=0#qt-science_center_objects (accessed on 3 September 2024).
- Ren, Z.; Wang, K.; Yang, K.; Zhou, Z.H.; Tang, Y.J.; Tian, L.; Xu, Z.M. The grain size distribution and composition of the Touzhai rock avalanche deposit in Yunnan, China. Eng. Geol. 2018, 234, 97–111. [Google Scholar] [CrossRef]
- Nieber, J.L.; Sidle, R.C. How do disconnected macropores in sloping soils facilitate preferential flow. Hydrol. Process. 2010, 24, 1582–1594. [Google Scholar] [CrossRef]
- Walsh, R.P.D.; Howells, K.A. Soil pipes and their role in runoff generation and chemical denudation in a humid tropical catchment in Dominica. Earth Surf. Process. Landf. 1988, 13, 9–17. [Google Scholar] [CrossRef]
- Uchida, T.; Kosugi, K.; Mizuyama, T. Effects of pipeflow on hydrological process and its relation to landslide: A review of pipeflow studies in forested headwater. Hydrol. Process. 2001, 15, 2151–2174. [Google Scholar] [CrossRef]
- Weiler, M. Macropores and preferential flow—A love-hate relationship. Hydrol. Process. 2017, 31, 15–19. [Google Scholar] [CrossRef]
- Nieber, J.L.; Misra, D. Modeling flow and transport in heterogeneous, dual-porosity drained soils. Irrig. Drain. Syst. 1995, 9, 217–237. [Google Scholar] [CrossRef]
- Návar, J.; Turton, D.J.; Miller, E.L. Estimating macropore and matrix flow using the hydrograph separation procedure in an experimental forest plot. Hydrol. Process. 1995, 9, 743–753. [Google Scholar] [CrossRef]
- Arora, B.; Mohanty, B.P.; McGuire, J.T. Inverse estimation of parameters for multidomain flow models in soil columns with different macropore densities. Water Resour. Res. 2011, 47, W04512. [Google Scholar] [CrossRef]
- Elçi, A.; Molz, F.J. Identification of lateral macropore flow in a forested riparian wetland through numerical simulation of a subsurface tracer experiment. Water Air Soil Pollut. 2009, 197, 149–164. [Google Scholar] [CrossRef]
- Yu, X.; Duffy, C.; Baldwin, D.C.; Lin, H. The role of macropores and multi-resolution soil survey datasets for distributed surface–subsurface flow modeling. J. Hydrol. 2014, 516, 97–106. [Google Scholar] [CrossRef]
- Furuya, G.; Sassa, K.; Hiura, H.; Fukuoka, H. Mechanism of creep movement caused by landslide activity and underground erosion in crystalline schist, Shikoku Island, Southwestern Japan. Eng. Geol. 1999, 53, 311–325. [Google Scholar] [CrossRef]
- Tóth, J. Groundwater as a geologic agent: An over view of the cause, processes, and manifestations. Hydrogeol. J. 1999, 7, 1–14. [Google Scholar] [CrossRef]
- Scanlon, B.R.; Healy, R.W.; Cook, P.G. Choosing appropriate techniques for quantifying groundwater recharge. Hydrogeol. J. 2002, 10, 18–39. [Google Scholar] [CrossRef]
- Sohrt, J.; Ries, F.; Sauter, M.; Lange, J. Significance of preferential flow at the rock soil interface in a semi-arid karst environment. Catena 2014, 123, 1–10. [Google Scholar] [CrossRef]
- Weiler, M. An infiltration model based on flow variability in macropores: Development, sensitivity analysis and applications. J. Hydrol. 2005, 310, 294–315. [Google Scholar] [CrossRef]
- Reynolds, E.R.C.; Thompson, F.B. Forests, Climate, and Hydrology Regional Impacts; United Nations University Press: Tokyo, Japan, 1998. [Google Scholar]


| KS of Macropores(cm/s) | References |
|---|---|
| 0.667 | [39] |
| 0.042 | [40] |
| 0.0042 | [17] |
| 0.061 | [24] |
| 0.126 | |
| 0.167 | |
| 0.046 | [21] |
| 0.023 | [41] |
| 50~70 | [38] |
| Experiment Sites | Depth (cm) | KS (cm/s) | ||
|---|---|---|---|---|
| Soil Mass | Average of Soil Mass | Macropores | ||
| P-1# | 0 | 0.0311 | 0.01277 | 1.92 |
| 10 | 0.0115 | |||
| 60 | 0.0177 | |||
| P-2# | 0 | 0.00774 | ||
| 10 | 0.00358 | |||
| 60 | 0.00502 | |||
| Model Size (cm) | Boundary Condition | Hydraulic Conductivity (cm/s) | ||
|---|---|---|---|---|
| Steady Seepage | Transient Seepage | Matrix | Macropore | |
| 30 × 30 × 20 | Htop = 0.2 m Hbottom = 0 | Top: IH = 0.4 m Bottom: drainage rate = 1010 m3/day | 0.01277 | 1.92 |
Disclaimer/Publisher’s Note: The statements, opinions and data contained in all publications are solely those of the individual author(s) and contributor(s) and not of MDPI and/or the editor(s). MDPI and/or the editor(s) disclaim responsibility for any injury to people or property resulting from any ideas, methods, instructions or products referred to in the content. |
© 2024 by the authors. Licensee MDPI, Basel, Switzerland. This article is an open access article distributed under the terms and conditions of the Creative Commons Attribution (CC BY) license (https://creativecommons.org/licenses/by/4.0/).
Share and Cite
Bao, J.; Wang, K.; Xu, Z. Transmission Characteristics of the Macropore Flow in Vegetated Slope Soils and Its Implication for Slope Stability. Sustainability 2024, 16, 7897. https://doi.org/10.3390/su16187897
Bao J, Wang K, Xu Z. Transmission Characteristics of the Macropore Flow in Vegetated Slope Soils and Its Implication for Slope Stability. Sustainability. 2024; 16(18):7897. https://doi.org/10.3390/su16187897
Chicago/Turabian StyleBao, Jingkun, Kun Wang, and Zemin Xu. 2024. "Transmission Characteristics of the Macropore Flow in Vegetated Slope Soils and Its Implication for Slope Stability" Sustainability 16, no. 18: 7897. https://doi.org/10.3390/su16187897