Article

Chemical and Physical Characterization of Three Oxidic Lithological Materials for Water Treatment

by
José G. Prato
1,2,*,
Fernando Millán
3,*,
Marin Senila
4,
Erika Andrea Levei
4,
Claudiu Tănăselia
4,
Luisa Carolina González
5,6,*,
Anita Cecilia Ríos
1,
Luis Sagñay Yasaca
7 and
Guillermo Eduardo Dávalos
8
1
Grupo de Investigación: Estudios Interdisciplinarios, Facultad de Ingeniería, Universidad Nacional de Chimborazo, Riobamba 060103, Ecuador
2
Facultad de Ingeniería, Ingeniería Química, Universidad de Los Andes, Mérida 5101, Venezuela
3
Ingeniería Química, Instituto Universitario Politécnico “Santiago Mariño”, Mérida 5101, Venezuela
4
Research Institute for Analytical Instrumentation, INCDO INOE 2000, Donath 67, RO-400293 Cluj-Napoca, Romania
5
Grupo de Investigación “Análisis de Muestras Biológicas y Forenses”, Laboratorio Clínico, Facultad de Ciencias de la Salud, Universidad Nacional de Chimborazo, Av. Antonio José de Sucre km 1½ vía Guano, Riobamba 060103, Ecuador
6
Laboratorio de Investigaciones Parasitológicas “Jesús Moreno Rangel”, Cátedra de Parasitología, Departamento de Microbiología y Parasitología, Facultad de Farmacia y Bioanálisis, Universidad de Los Andes, Mérida 5101, Venezuela
7
Semillero de Investigación: Lechos de Materiales Oxídicos, Universidad Nacional de Chimborazo, Riobamba 060103, Ecuador
8
Facultad de Ciencias, Escuela Superior Politécnica de Chimborazo, Panamericana Sur km 1½, Riobamba 060103, Ecuador
*
Authors to whom correspondence should be addressed.
Sustainability 2024, 16(18), 7902; https://doi.org/10.3390/su16187902
Submission received: 8 July 2024 / Revised: 17 August 2024 / Accepted: 26 August 2024 / Published: 10 September 2024
(This article belongs to the Section Environmental Sustainability and Applications)

Abstract

:
Water treatment necessitates the sustainable use of natural resources. This paper focuses on the characterization of three oxidic lithological materials (OLMs) with the aim of utilizing them to prepare calcined adsorbent substrates for ionic adsorption. The three materials have pH levels of 7.66, 4.63, and 6.57, respectively, and organic matter contents less than 0.5%. All of the materials are sandy loam or loamy sand. Their electric conductivities (0.18, 0.07, and 0.23 dS/m) show low levels of salinity and solubility. Their CEC (13.40, 13.77, and 6.76 cmol(+)kg) values are low, similar to those of amphoteric oxides and kaolin clays. Their aluminum contents range from 7% up to 12%, their iron contents range from 3% up to 7%, their titanium contents range from 0.3% to 0.63%, and their manganese contents range from 0.007% up to 0.033%. The amphoteric oxides of these metals are responsible for their ionic adsorption reactions due to their variable charge surfaces. Their zirconium concentrations range from 100 to 600 mg/g, giving these materials the refractory properties necessary for the preparation of calcined adsorbent substrates. Our XRD analysis shows they share a common mineralogical composition, with quartz as the principal component, as well as albite, which leads to their thermal properties and mechanical resistance against abrasion. The TDA and IR spectra show the presence of kaolinite, which is lost during thermal treatments. The results show that the OLMs might have potential as raw materials to prepare calcined adsorbent substrates for further applications and as granular media in the sustainable treatment of both natural water and wastewater.

1. Introduction

Throughout the evolution of water treatment techniques, various methods have been implemented, such as reverse osmosis, flotation, coagulation–flocculation, adsorption, direct-contact crossflow packed beds, and multi-stage flash distillation [1,2,3,4,5]. Each of these systems operates under different conditions and faces specific challenges in balancing environmental sustainability with efficiency in contaminant removal.
Adsorption methods stand out from other methods and techniques due to their simplicity, cost-effectiveness, high efficiency, and the ease of adsorbent recovery and reuse [1,6]. These characteristics make adsorption a compelling and sustainable alternative, particularly when the adsorbent is affordable, readily available, and environmentally friendly [6,7].
Therefore, it is important to identify new natural materials with adsorptive and refractory properties that can be used as raw materials to prepare adsorbent granular media that can be applied in the treatment of natural water and wastewater. Oxidic lithological materials (OLMs) are materials belonging to the Earth’s crust, though they are not classified as “soils”. According to its pedological definition, soil is defined by the presence of certain layers or horizons that are clearly differentiated according to their characteristics and composition; that is to say, it has a defined profile [8,9,10]. The first of these horizons, called the A horizon, is organic because of the natural recycling of vegetation on the surface; the second, called the B horizon, is mineral or argillic, composed mainly of clays and certain minerals; and the third one is where the parental material breaks down, forming the B horizon. Therefore, when digging one or two meters deep, all these soil layers are well differentiated [8]. In the case of OLMs, there is an absence of these layers, and the soil appears to be composed of monophasic materials at a depth of two or more meters. Therefore, these materials might be wrongly classified as soil.
In general, OLMs behave as “oxisols” because of their high contents of iron and aluminum, as well as other metallic oxides and crystalline phases in the form of clays [10]. That is why they are called “oxidic lithologic materials”. Arid conditions, high temperatures, low levels of rainfall, and excipient vegetation are factors that slow the pedogenetic process of soil formation. The sun’s heat dehydrates oxides at the soil’s surface, forming ferruginous cuirass that becomes irreversibly hard, presenting serious limitations for agronomical uses [11].
OLMs are used by potters for making kitchen hardware and construction materials, like bricks and crockery, via thermal treatments because of their thermal and mechanical resistance. In the same way, these materials could also be used to prepare an adsorbent substrate via thermal treatments and conduct ionic adsorption studies. Practical applications of these kinds of substrates include water softening [12] and heavy metal retention [13,14]. Sulfate, phosphate, and arsenic oxyanion retention studies have also been conducted [15,16,17,18].
All these applications are possible because of the variable charge properties of the amphoteric oxides of iron and aluminum, as well as titanium and manganese if they are present, according to the following mechanism [14,18]:
M O + O H M O H 0 + H + M O H 2 +
In acidic media, the reaction towards the right allows for the protonation of oxide, increasing the positive charge density on the surface and enabling anion adsorption. On the other side, in alkaline media, the reaction towards the left shows that the oxide is deprotonated, so the negative charge density increases, enabling cation adsorption. The pH at which the surface positive charge equals the surface negative charge is called the point of zero charge, PZC, or pHo [19,20]. It measures the relative affinity of H+ and OH for amphoteric surfaces and shows which type of ion will be adsorbed preferentially at a given pH value. According to this model, at lower pH values, PZC anions will be adsorbed preferentially, while at higher values, cations will be adsorbed preferentially [14,21].
In searching for new natural materials that can be used for preparing solid ionic adsorbents, the general objective of this research is to perform a chemical and physical characterization of three kinds of OLMs in order to determine their potential use as raw materials for preparing solid ionic adsorbent substrates via thermal treatments in order to use them in water treatment. Because they are widely dispersed natural materials, OLMs are easy to find at a relatively low cost, making their use possible at small and medium scales in water treatment systems at relatively low cost in comparison with conventional and commercial filtering systems.

2. Materials and Methods

2.1. Oxidic Lithological Material

The OLMs were sampled from three natural deposits located at the coordinates 8°28′47″ N and 71°23′47″ W (labeled as L), at 8°, 35′, 5″ N and 71°, 14′, 15″ W (labeled as G), and at 8°, 31′, 6″ N and 71°, 06′, 58.6″ W (labeled as V). These places were selected because these natural deposits of OLM have already been exploited by potters with different purposes, artisanal as well as industrial, over many years, so information about the raw materials and processes is available. The samples were taken from a unique horizon, down to 200 cm deep. Lithologic materials were ground and sieved in three granulometric fractions: gross fraction, GF (1200–425 µm), medium fraction, MF (425–250 µm), and fine fraction, FF (<250 µm). Separation was performed with the respective ASTME II Laboratory Test Sieve (Endecotts Ltd., London, UK), and the samples were shaken in an automatic vibrator Octagon Digital CE for 15 min.

2.2. Chemical Analysis

Routine radioactivity and IR analyses were performed on the granulometric fractions up to 1200 µm. Soil color was determined using Munsell Tables. Texture was measured by dispersion with sodium hexametaphosfate; pH was measured in a 1:10 soil:water composition [22], with a Hanna HI2210-01 pH meter (HANNA® Instruments, San José, Costa Rica). Conductivity was measured in the same suspension as pH with an HC3010 Hanna Conductimeter (HANNA® Instruments, San José, Costa Rica).
The cation exchange capacity (CEC) was measured with the ammonium acetate method, and organic matter was determined with the Wakley and Black method [23]. Apparent density was measured on the disturbed soil samples. PZC was measured using potentiometric titration in a water suspension and KCl 1M according to the methodology described in the literature [21,24].
X-ray diffraction (XRD), metallic profile analysis, and thermogravimetric analysis (TGA) were conducted on the three granulometric fractions GF, MF, and FF. XRD was carried out using a Malvern Panalytical B.V. diffractometer, model CUBIX3 (Lelyweg, Almelo, The Netherlands), with Kα-Cu monochromatic radiation, and the diffractograms were analyzed with X’Pert High Score Plus software V4.0 (Malvern Panalytical B.V., Lelyweg, Almelo, The Netherlands). TGA was performed at a heating rate of 20 °C/min up to 1000 °C under a nitrogen atmosphere using a METTLER TOLEDO model TGA/A851 thermobalance (Columbus, OH, USA).
The metallic profile was measured after the hot acid digestion (using aqua regia) of a 0.2 g sample of OLM, weighed in an Ohaus analytical balance model Scout with 210 g × 0.1 mg capacity (OHAUS Latinoamérica, Mexico City, Mexico). Except for iron, aluminum, and manganese, the soil extracts were measured with an inductively coupled plasma mass spectrometer (ICP-MS), equipped with a dynamic reaction cell, ELAN DRC II (Perkin Elmer, Waltham, MA, USA). Iron, manganese, and aluminum were measured by inductively coupled plasma optical emission multichannel spectrometry (ICP-OES) using an Optima 5300 DV (Perkin Elmer, Waltham, MA, USA). Two-point background correction and 6 replicates were used to measure the analytical signal. IR spectra were recorded with an FTIR Spectrum BX Perkin Elmer and source MIR and DTGS detector in 5% soil—KBr pils.
The specific surface area and average pore volume of the calcined materials were determined using the N2 adsorption method at −196 °C. The samples were pre-treated at 400 °C under vacuum for 12 h using a Micromeritics ASAP 2420 analyzer (Norcross, GA, USA). The macroporosity was measured via water absorption according to the method described by Foth [9]. Pellets were prepared from a saturated paste, which was air- and oven-dried and then calcined up to 750 °C in a muffle furnace for 4 h and then left to cool before being removed. Thermal treatment favors oxides’ formation.

3. Results and Discussion

3.1. Characterization of Raw Materials

Table 1 shows the physical and chemical parameters yielded by the routine tests for the three OLMs L, G, and V. The L and G materials showed very low contents of clay and fit into the sandy loam and loamy sand textural classes, respectively. The V material fit into the loam textural class because of its great clay content [9,10,25]. All three materials presented low contents of organic matter due to the sparsity of vegetation growing on the soil’s surface. The low CEC values that were found are similar to those identified for amphoteric oxides and kaolinite [25,26], and we expected to find one or two of these kinds of minerals. The low EC indicates the depreciable effects of salinity and the low solubility of the materials, which are mostly quartz and insoluble iron and aluminum oxides, among other metallic oxides and insoluble minerals.
The brick-red color of the L material indicates the high degree of iron oxidation, as in hematite Fe2O3. The V and G materials showed different colors, with one showing up as yellow-brownish and the second one appearing similar to a yellow goethite [26]. The bulk densities of all three materials are similar and agree with the expected values.

3.2. Radioactivity Analysis

Table 2 shows the measured radioactivity for uranium, thorium, radium, and potassium. For the first three, radioactivity ranges between 1.3 and 2.4 nCi/kg, but potassium’s radioactivity is a little bit higher, and the L material notably presented a value of 23.7 nCi/kg. This level in the solid phase does not represent any human danger, but national regulations placed on potable water do not allow more than 1 pCi for α radiation and 27 pCi for β radiation.
Such high radioactivity of potassium, especially in the L material, is related to the 40K isotope, which has a natural abundance of 0.012% in the Earth’s crust and is decomposed by β emission in around 109 years, with the formation of a certain degree of Ar [27,28]. Th and Ra belong to the 238U decomposition series. However, the isotope 235U has a natural abundance of 0.72%, and it decomposes in 108 years, with Th and Ra among its disintegration products [28]. It is assumed that this radioactivity has a natural origin because of the absence of anthropogenic sources.

3.3. Point of Zero Charge—PCZ

The presence of variable charge on the surface can be proven by the ΔpH values, defined as the difference between pHKCl and pHH2O. If ΔpH is positive, the surface charges are negative, while if ΔpH is negative, then the surface charges are positive [20,25]. The intersection of the saline titration curves with the ΔpH axes equals zero, showing the value of pH at the PZC point. If all the three curves coincide in a single point, then the PZC is unique, but if not, then the PZC value is taken as the average of the different curves.
Figure 1 shows the variations in charge density in the raw materials with their pH values. The PZC values for the L and G materials lie between 6.76 and 6.75 and 6.0 and 6.4, respectively, whereas the V material shows a single PZC equal to 7.4. These intervals are similar to those reported in the literature [10,24] for different minerals, such as amorphous Fe(OH)3—8.5, goethite—7.6, α-Al(OH)3—5, and α-Fe2O3—6.7. The variable charge is a physico–chemical characteristic related to the iron and aluminum amphoteric oxides contents, which can be very reactive. They can change the charge densities depending on the acidic or alkaline conditions in the solution; under acidic conditions, the oxide protonates, producing a positive species capable of anion adsorption, while under alkaline conditions, the oxide deprotonates, becoming a negative species capable of catonic adsorption. Therefore, these variable charges are responsible for the ionic exchange and adsorption reactions, which can be reversible or non-reversible [20,25].

3.4. Specific Surface of Raw Granulometric Fractions

Figure 2 shows the BET surface area and external surface area for the three granulometric fractions of the three lithological materials coming from the G, V, and L materials. In general, the specific surface area is low, under 100 m2/g, compared with illite (up to 150 m2/g) and kaolinite (up to 20 m2/g) [28,29,30]. However, there are marked differences between materials. As can be seen from the figure, all three fractions coming from the L material present higher specific surface values relative to the other lithological materials. In general, medium and fine fractions (LMF, LFF) present higher values purely because the finest particles present the highest values. All three granulometric fractions from the V material present the smallest specific and external surface values, ranging between 5 and 20 m2/g, compared with kaolinite alone.
Figure 3 shows values of pore volume, micropore volume, and micropore area for the three granulometric fractions of the three lithological materials. According to these results, the L material could present better adsorbent properties, with pores and micropores of greater volume and a greater micropore area.
Figure 4 shows that, in general, the calcination process reduces the specific and external surface areas and the pore volume, results that are unfavorable for the adsorption process [14,18]. During the calcination process, materials suffer some kind of cementation that reduces the active surface and thus the number of active sites available for absorption to occur. Contrarily, the calcination process seems to enhance the amount of surface available for the adsorption process in the V material, especially in the gross fraction, where the surface increases by around 90% and pore volume increases around 60%.

3.5. Mineralogy, XRD Analysis

Figure 5 shows the XR diffractograms for the three granulometric fractions from the L material. The low-intensity lines indicate a mineral with poor crystallinity. However, quartz is present in all three granulometric fractions and shows similar mineral compositions, consisting mainly of illite and albite [31,32,33,34,35,36]. The pattern drifts show low crystallinity and the presence of amorphous compounds, such as metallic oxides.
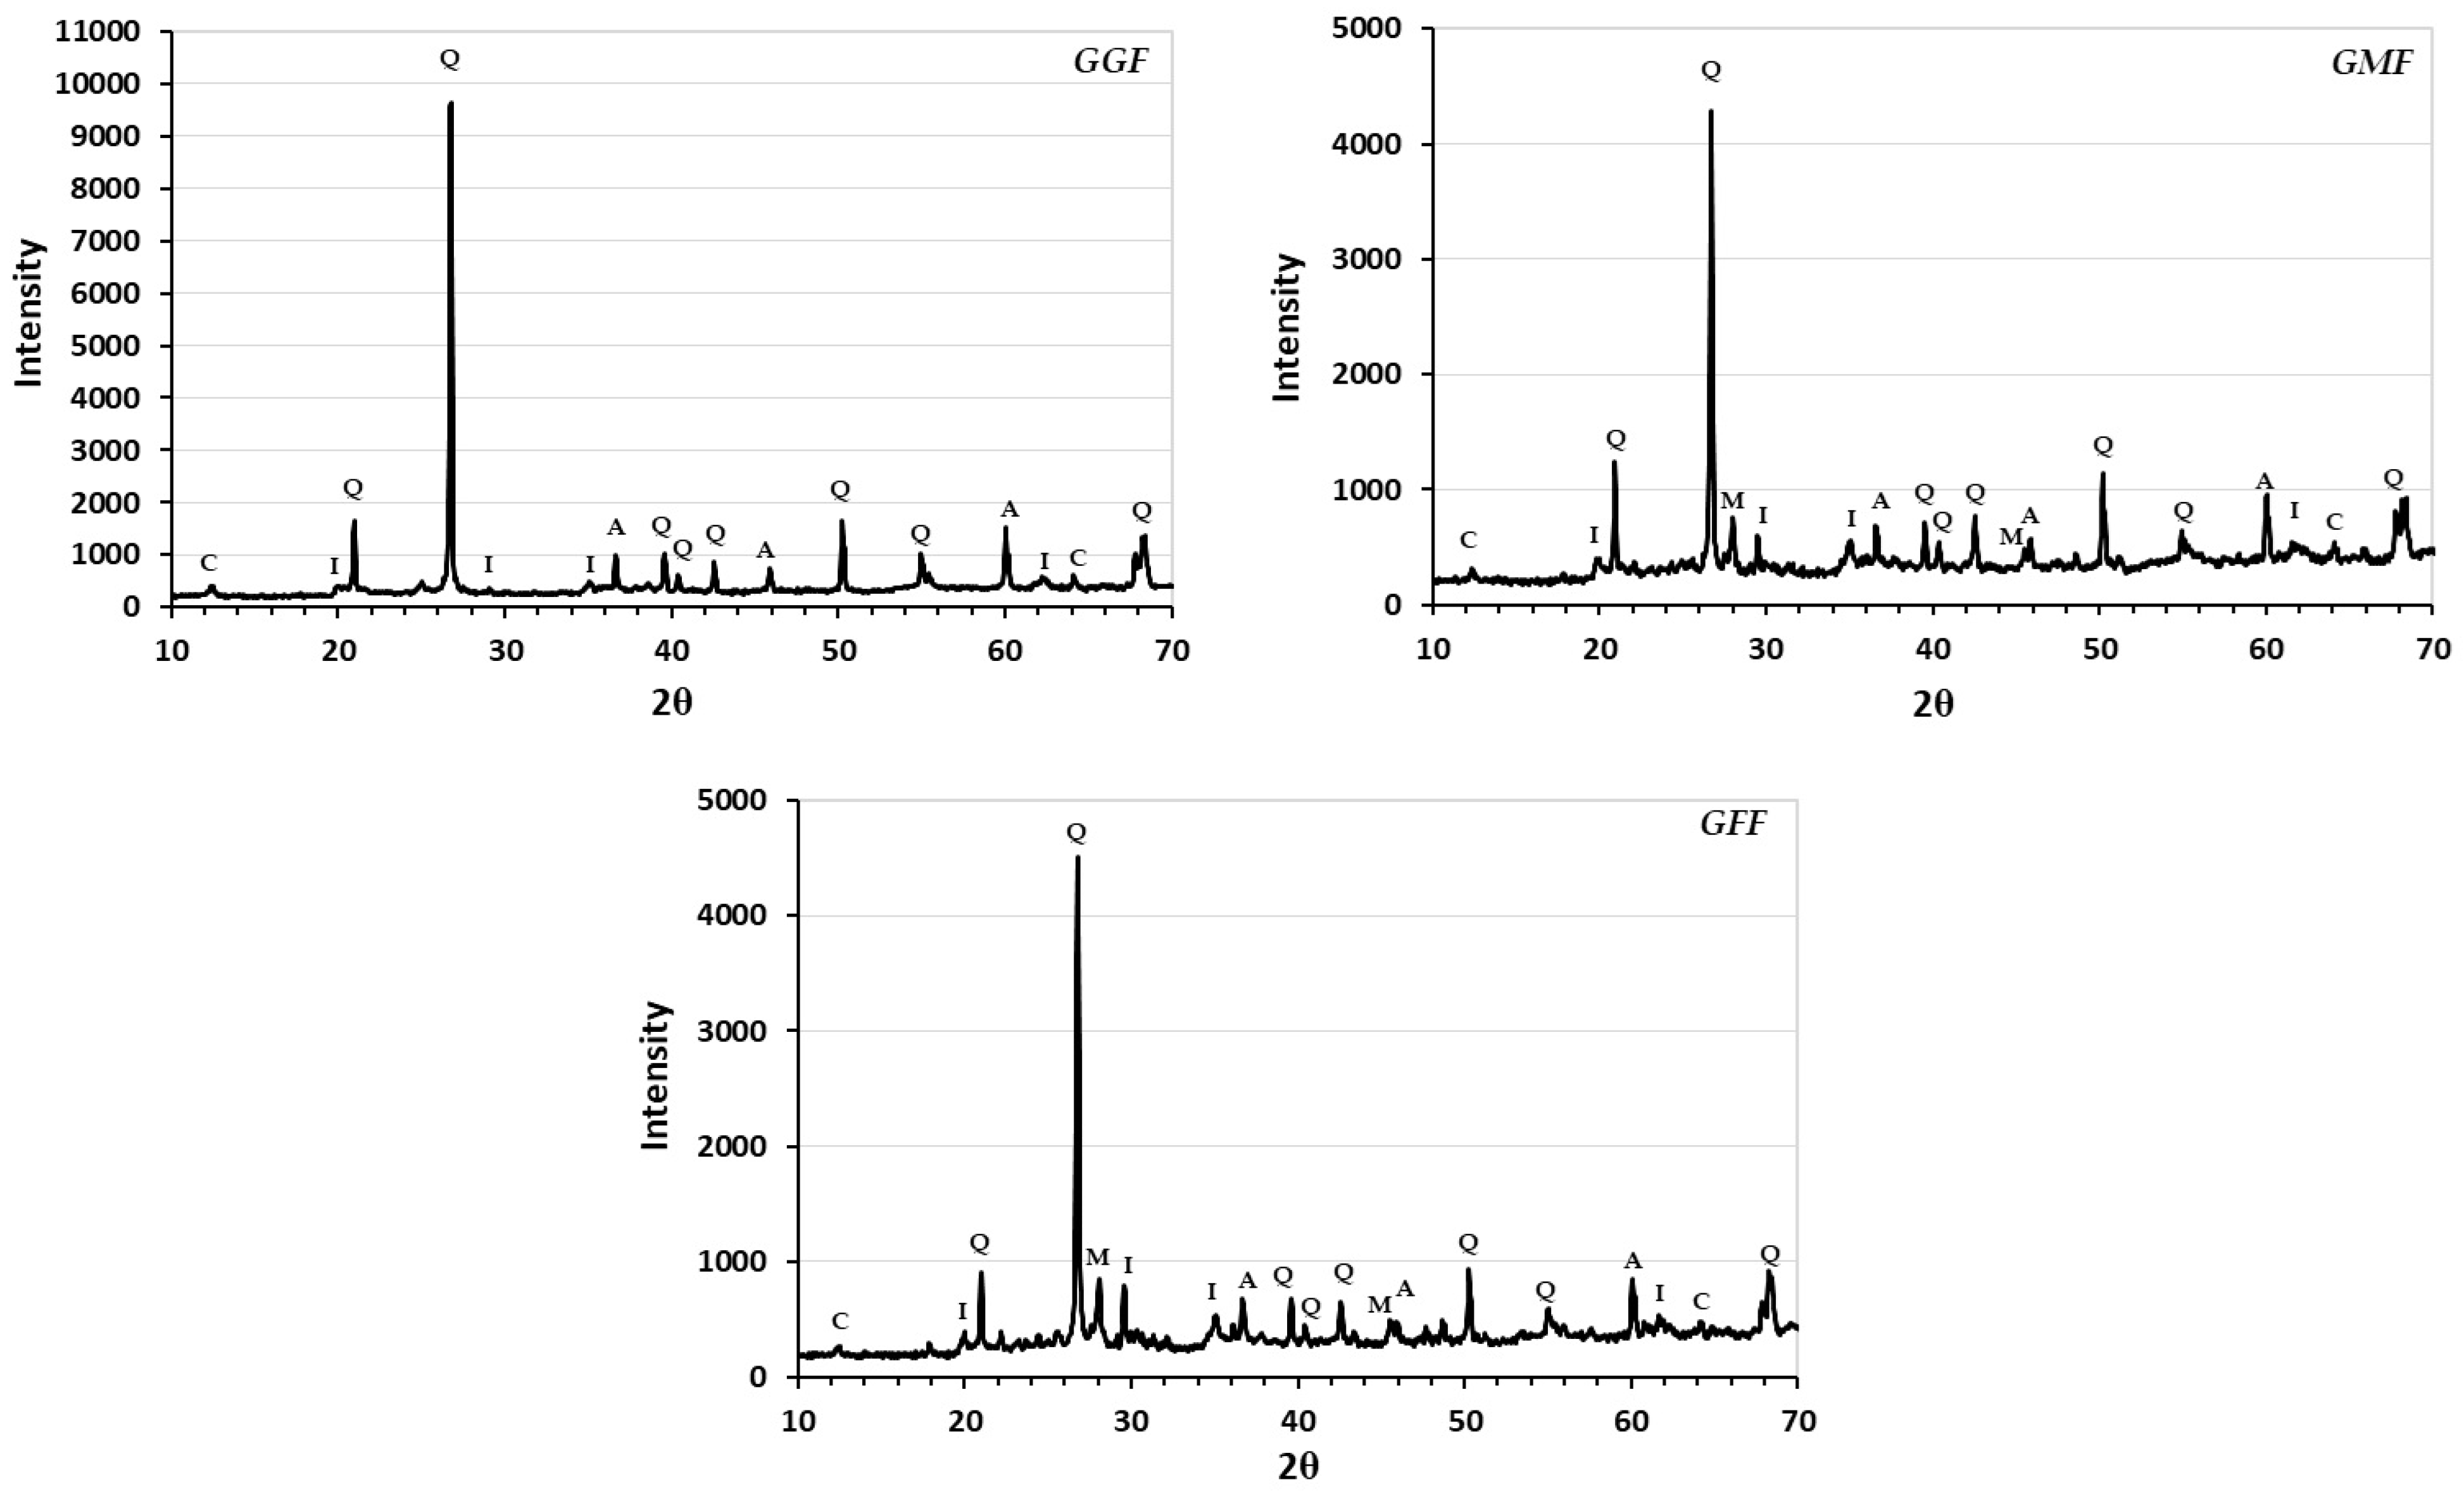
Figure 6 shows XR diffractograms for the three granulometric fractions from the G materials. The gross fraction, GFG, is primarily quartz, but the diffractograms for the medium and fine fractions show some difference because of the presence of different crystalline phases, such as a mixture of iron and aluminum minerals (clinoclhore—AlFeHO3Si; muscovite—Al2.9H2KO12Si31; illite—KxAlx(Si4-xAlx)O10(OH)2; and albite—NaAlSi3O8), which are sources of iron, aluminum, and alkaline metals [34,37]. The last mineral imparts good thermal properties and mechanical resistance against abrasion, which is why it is used in the ceramic industry. The shapes of the diffractograms are more indicative of the presence of crystalline phases than amorphous minerals, but could also be evidence of the presence of non-crystalline minerals in the medium and fine fractions.
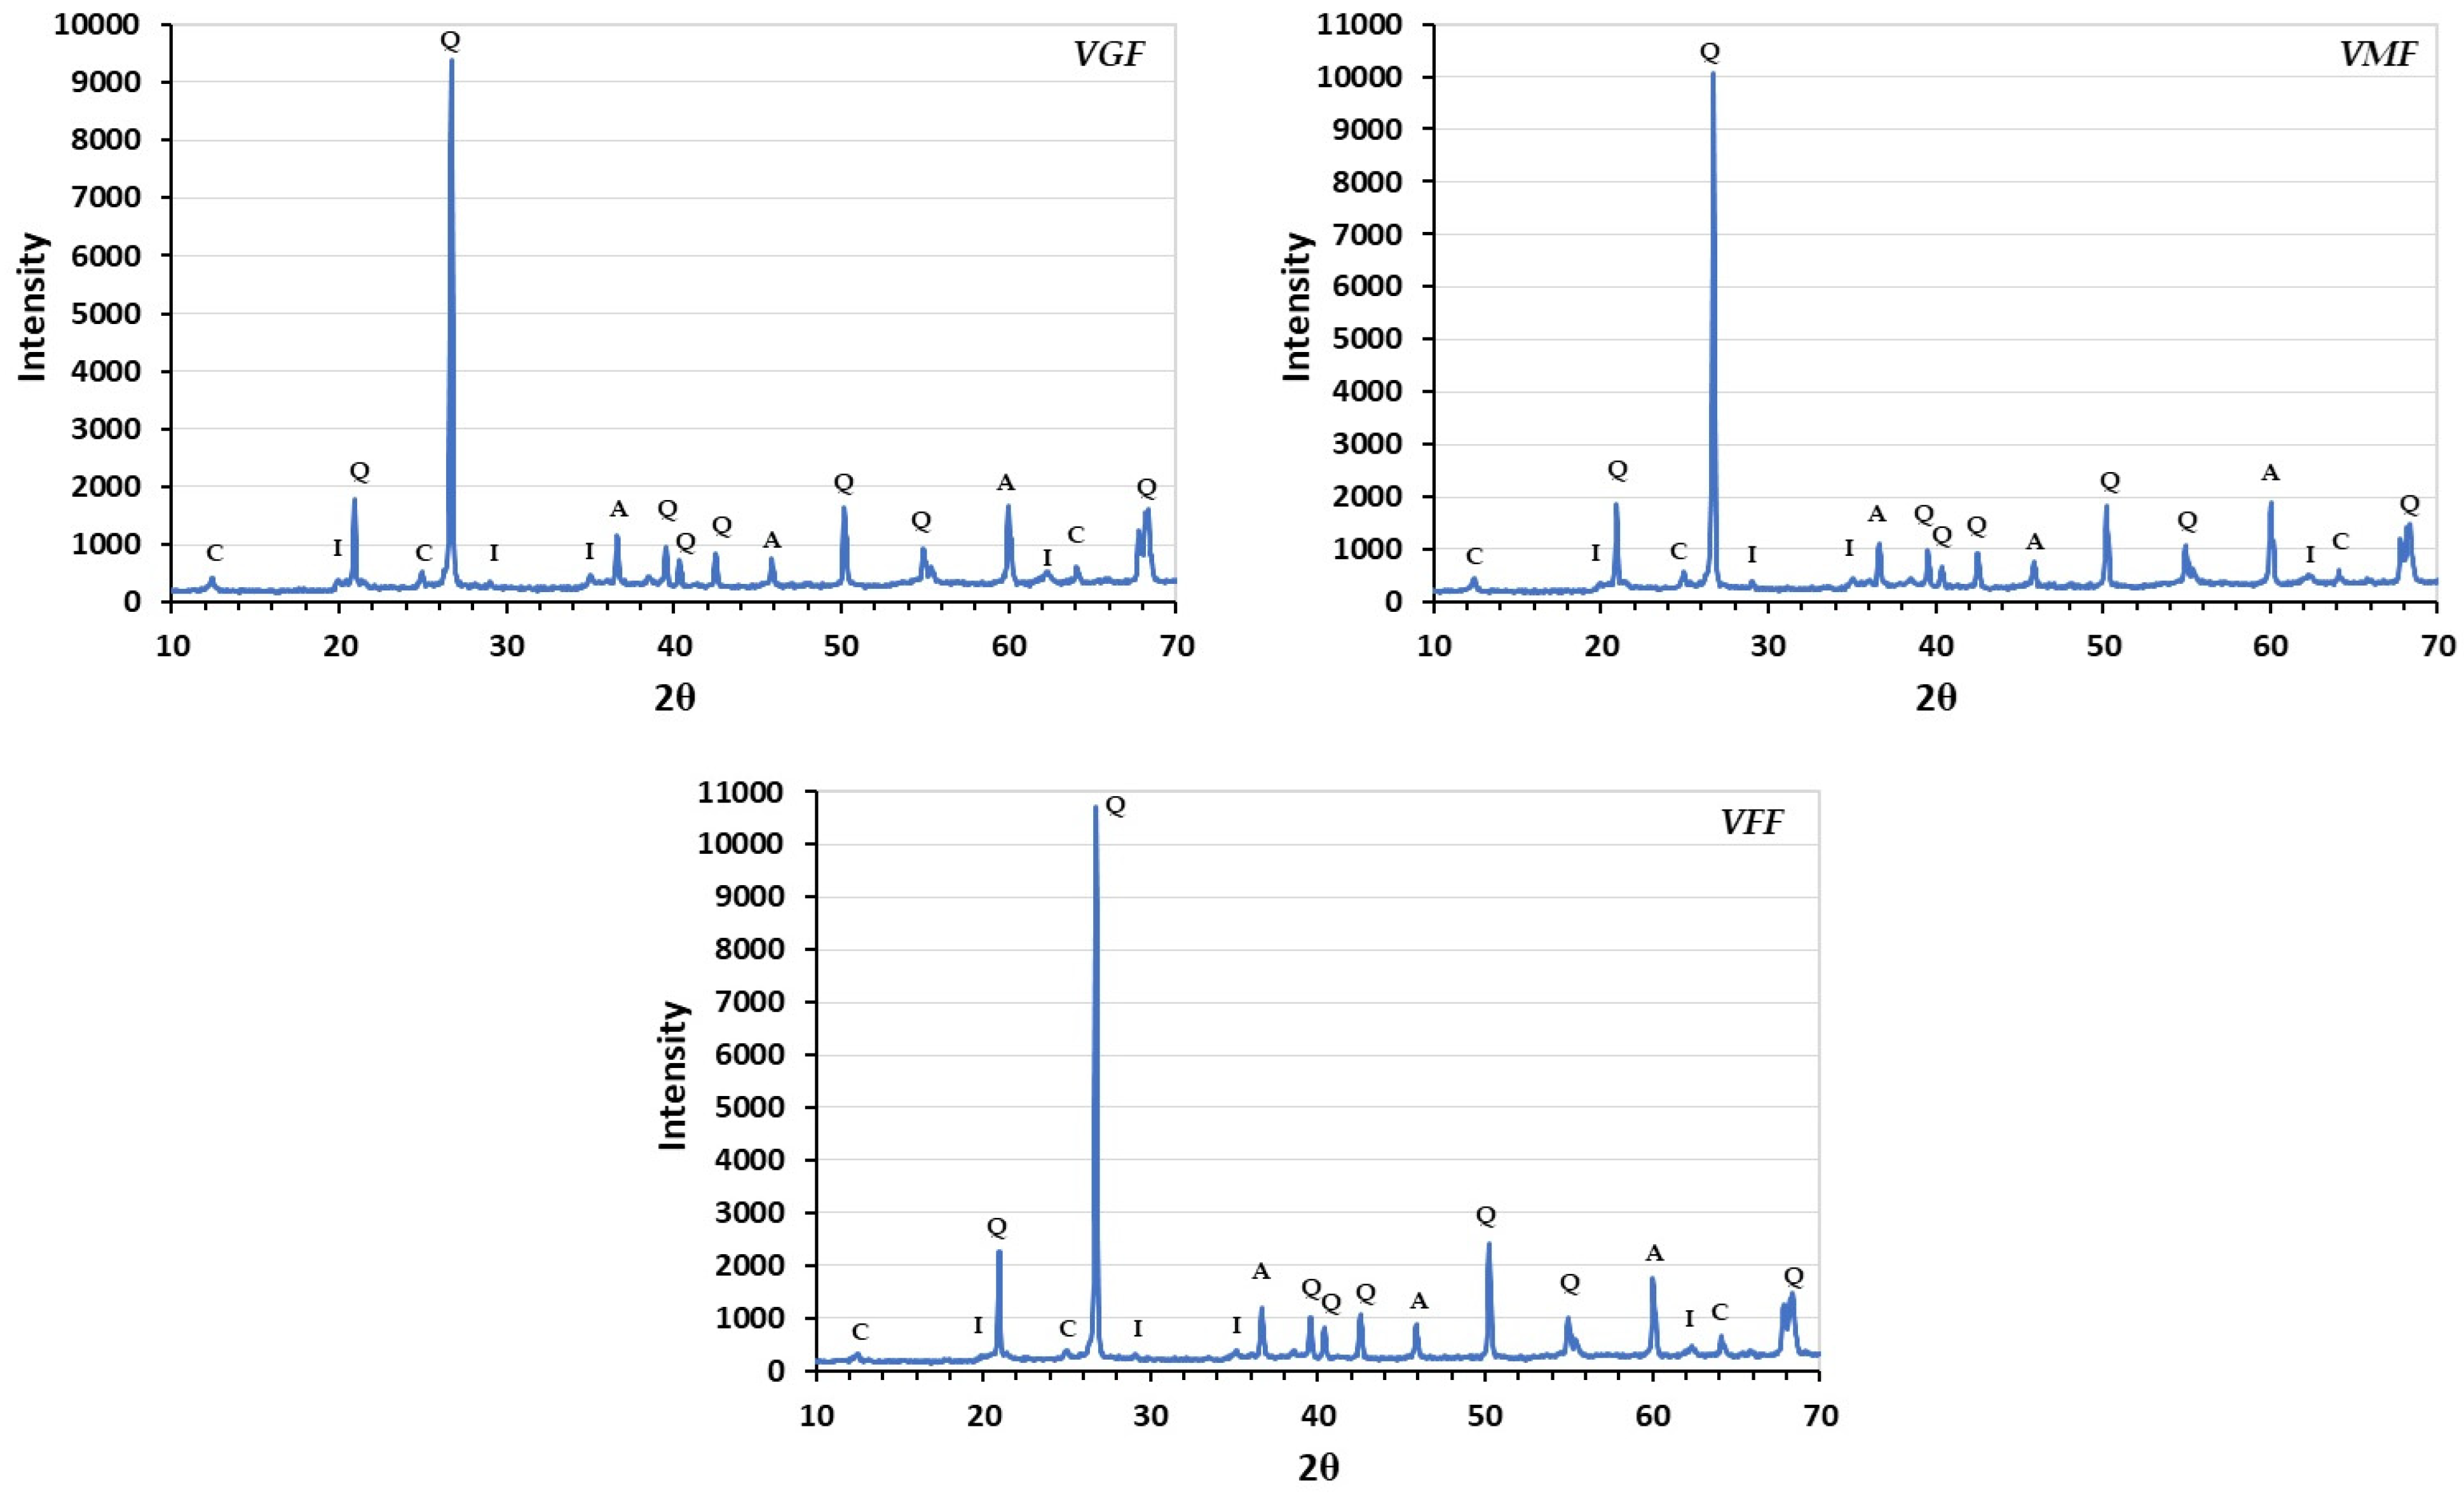
Figure 7 shows the XR diffractograms for the three granulometric fractions from the V material. The shape of the diffractograms is indicative of the presence, primarily, of crystalline phases and is not evidence of the presence of non-crystalline minerals—the patterns do not show any drift, as can be seen in the patterns of the L material. This fact might be explained by the high clay content in the raw material. From the patterns, we can identify quartz as a principal component, along with other minerals such as albite, illite, and clinoclhore.
Although the different XRD patterns show more or less the same mineral compositions, with quartz as a major component, there are some differences between the three diffractograms; for example, they show different drifting degrees, which may reflect the crystallinity degree of the material. The patterns of the V material show no drifting; this might be evidence of a greater degree of crystallinity than in the L material, with a notable drifting degree. Drifting indicates the presence of mixed amorphous metal oxides as well as minerals with low crystallinity, as evidenced by the sharp and intense peaks corresponding to the primary crystalline phases. Illite and albite are present in all three OLMs; these are inorganic oxides with a capacity for ionic adsorption, characteristic of eroded tropical environments [16,18,38].

3.6. TDA Analysis

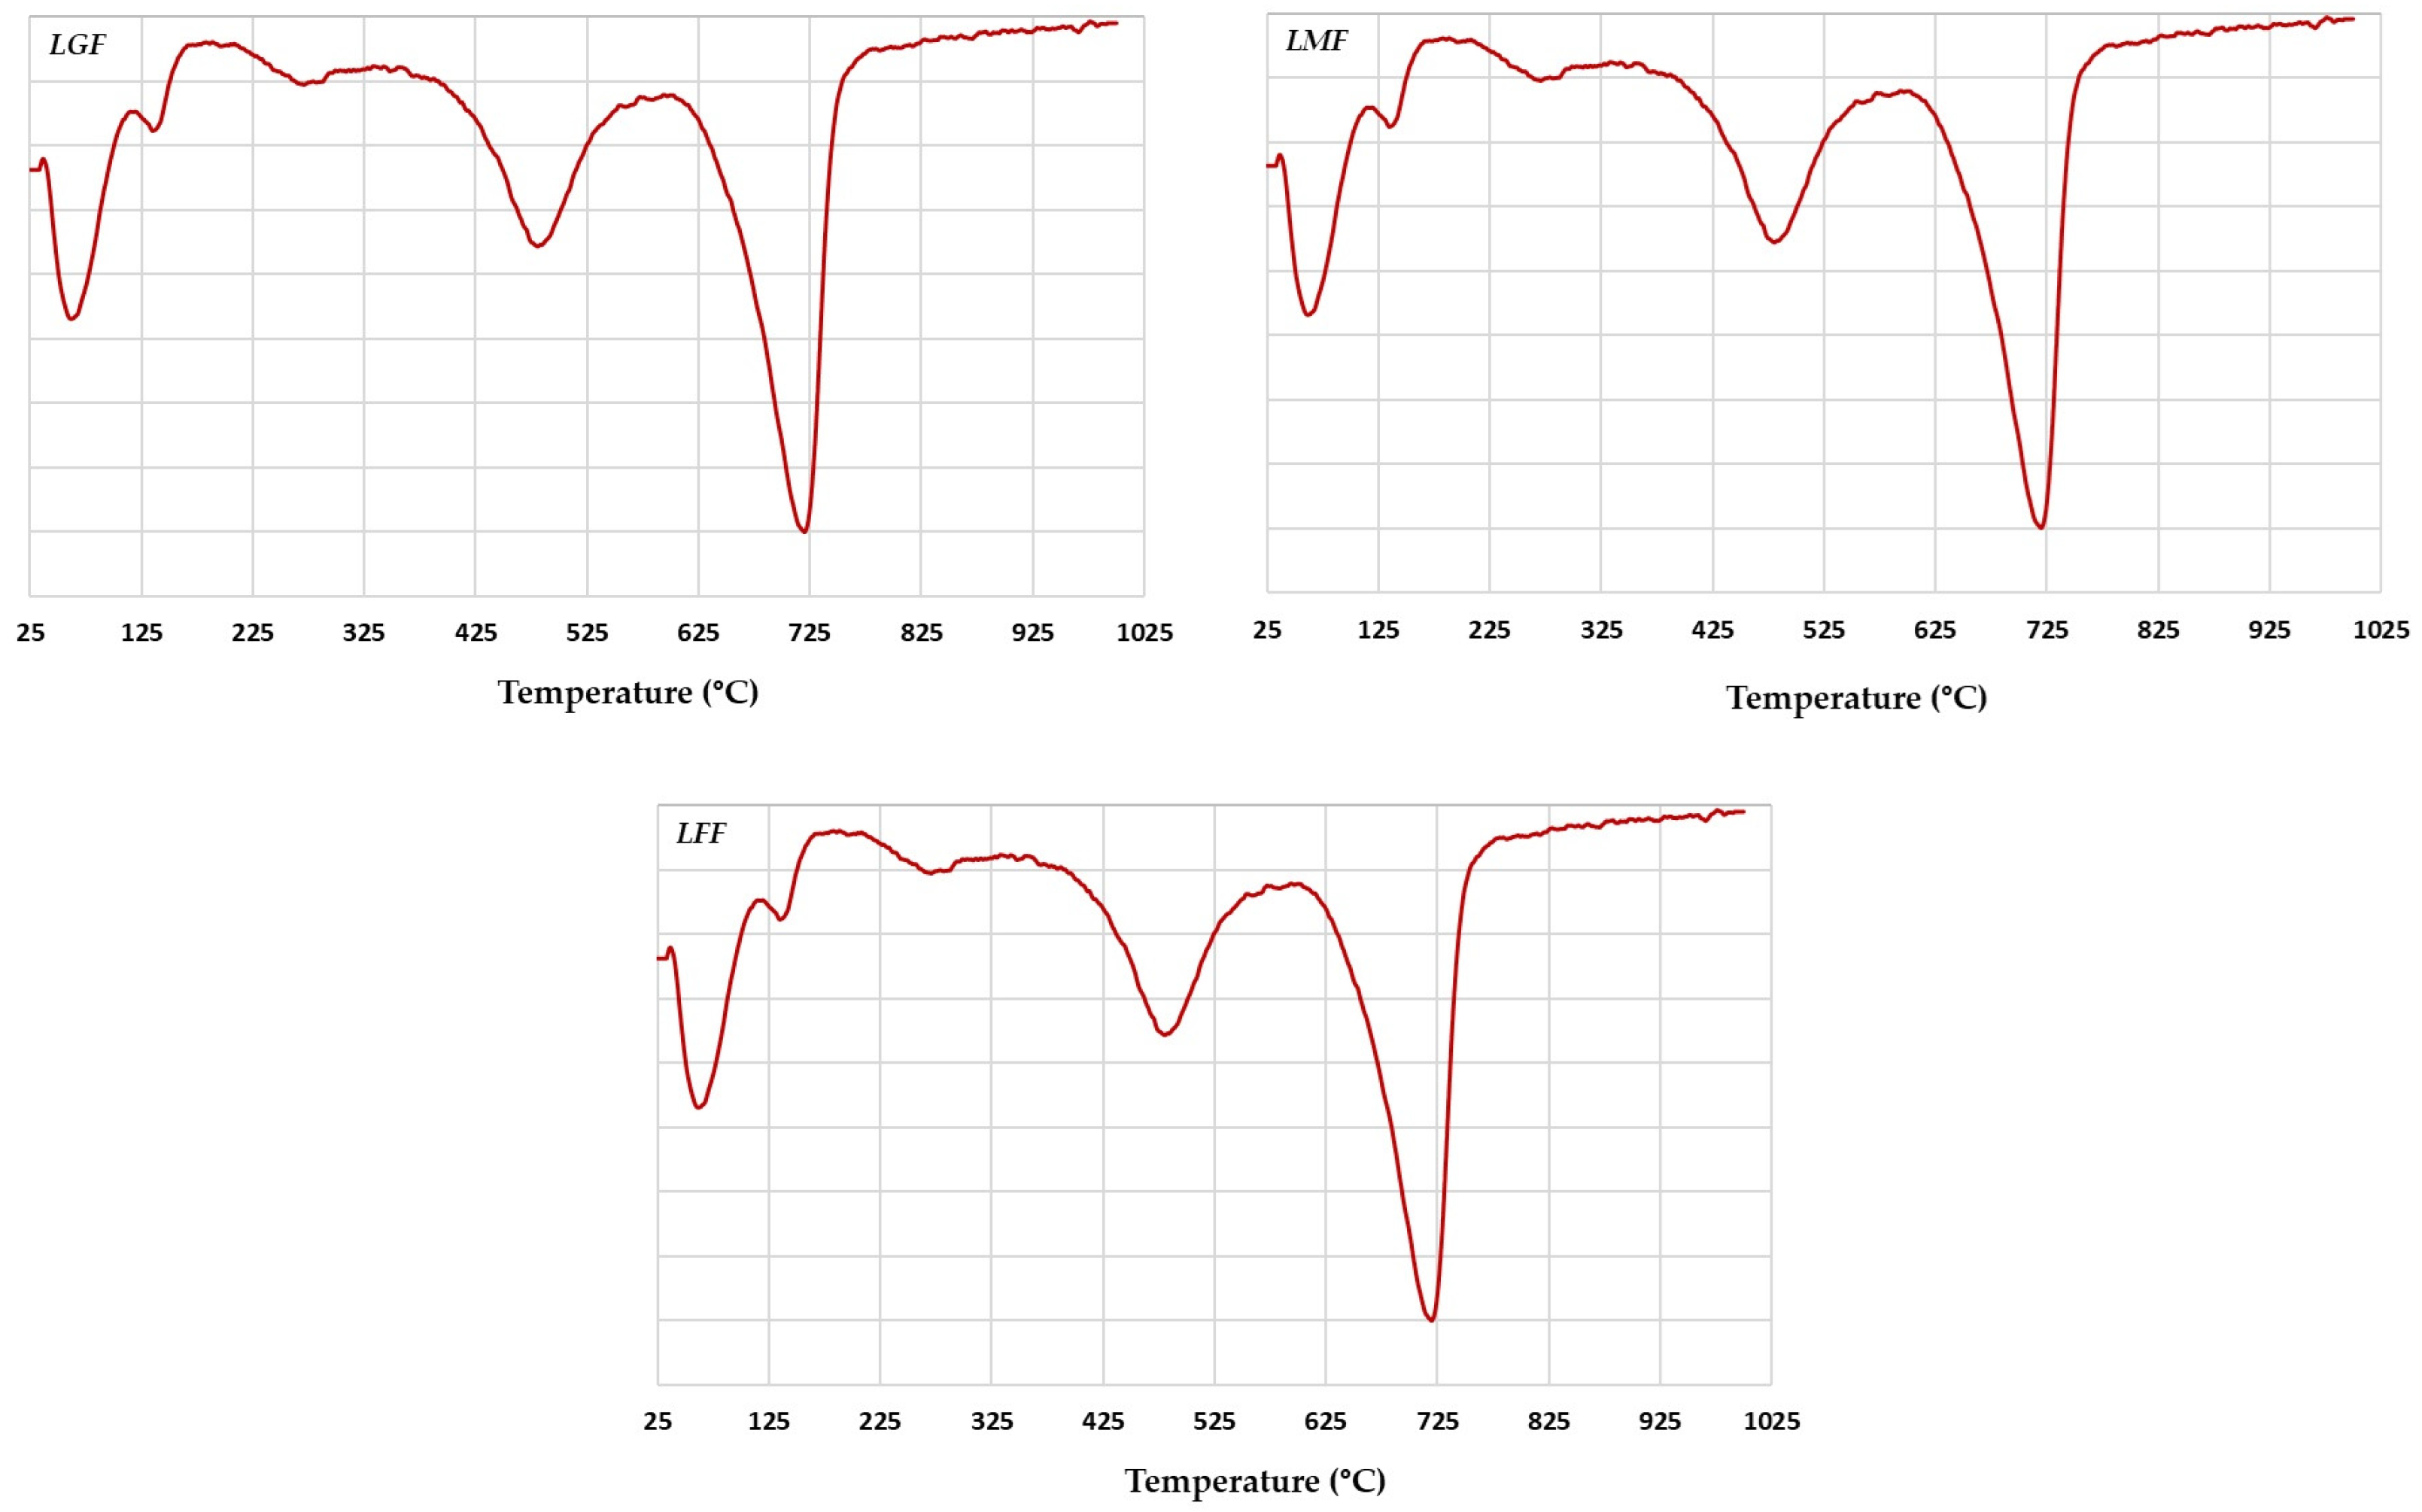
Figure 8 shows thermograms taken up to 1000 degrees for the three granulometric fractions of the L material. All the thermograms are very similar; there is also a lack of any exothermic reactions, with strong endothermic reactions between 50 and 150 degrees associated with water desorption from allophanes [37]. A weak endothermic reaction can be seen at 275 degrees, associated with the dehydroxylation of gibbsite, and a strong endothermic reaction occurs between 400 and 600 degrees, where the α–β transformation of quartz and the dehydroxylation of illite may overlap [25,39,40,41]. The absence of exothermic reactions at high temperatures indicates the presence of siliceous non-crystalline minerals such as silica gels and elemental allophanes [18,40], as was already confirmed by XRD.
Figure 9 shows thermograms taken up to 1000 degrees for the three granulometric fractions from the G material, each being quite different from the other, but in all three fractions there is a lack of any exothermic reactions. The gross fractions yielded thermograms similar to those of L material, but the endothermic reaction of allophanes was not well-defined here. The thermograms of medium and fine fractions show different characteristics. The endothermic reactions of allophanes are well-defined, but with different intensities.
An intense endothermic reaction of dehydroxilation arises between 450 and 500 degrees (associated with the α-AlOOH isostructure containing goethite), and another strong endothermic reaction of dehydroxilation arises between 650 and 750 degrees (associated with smectite, but the XRD shows no evidence of the presence of smectite) [25,31,38,39,40]. These two endothermic peaks show different profiles in the fine fractions’ thermograms, being more intense in the last. As seen previously, the lack of any exothermic reactions at high temperatures indicates the presence of siliceous and aluminum non-crystalline minerals as well as allophanes in the medium and fine fractions.
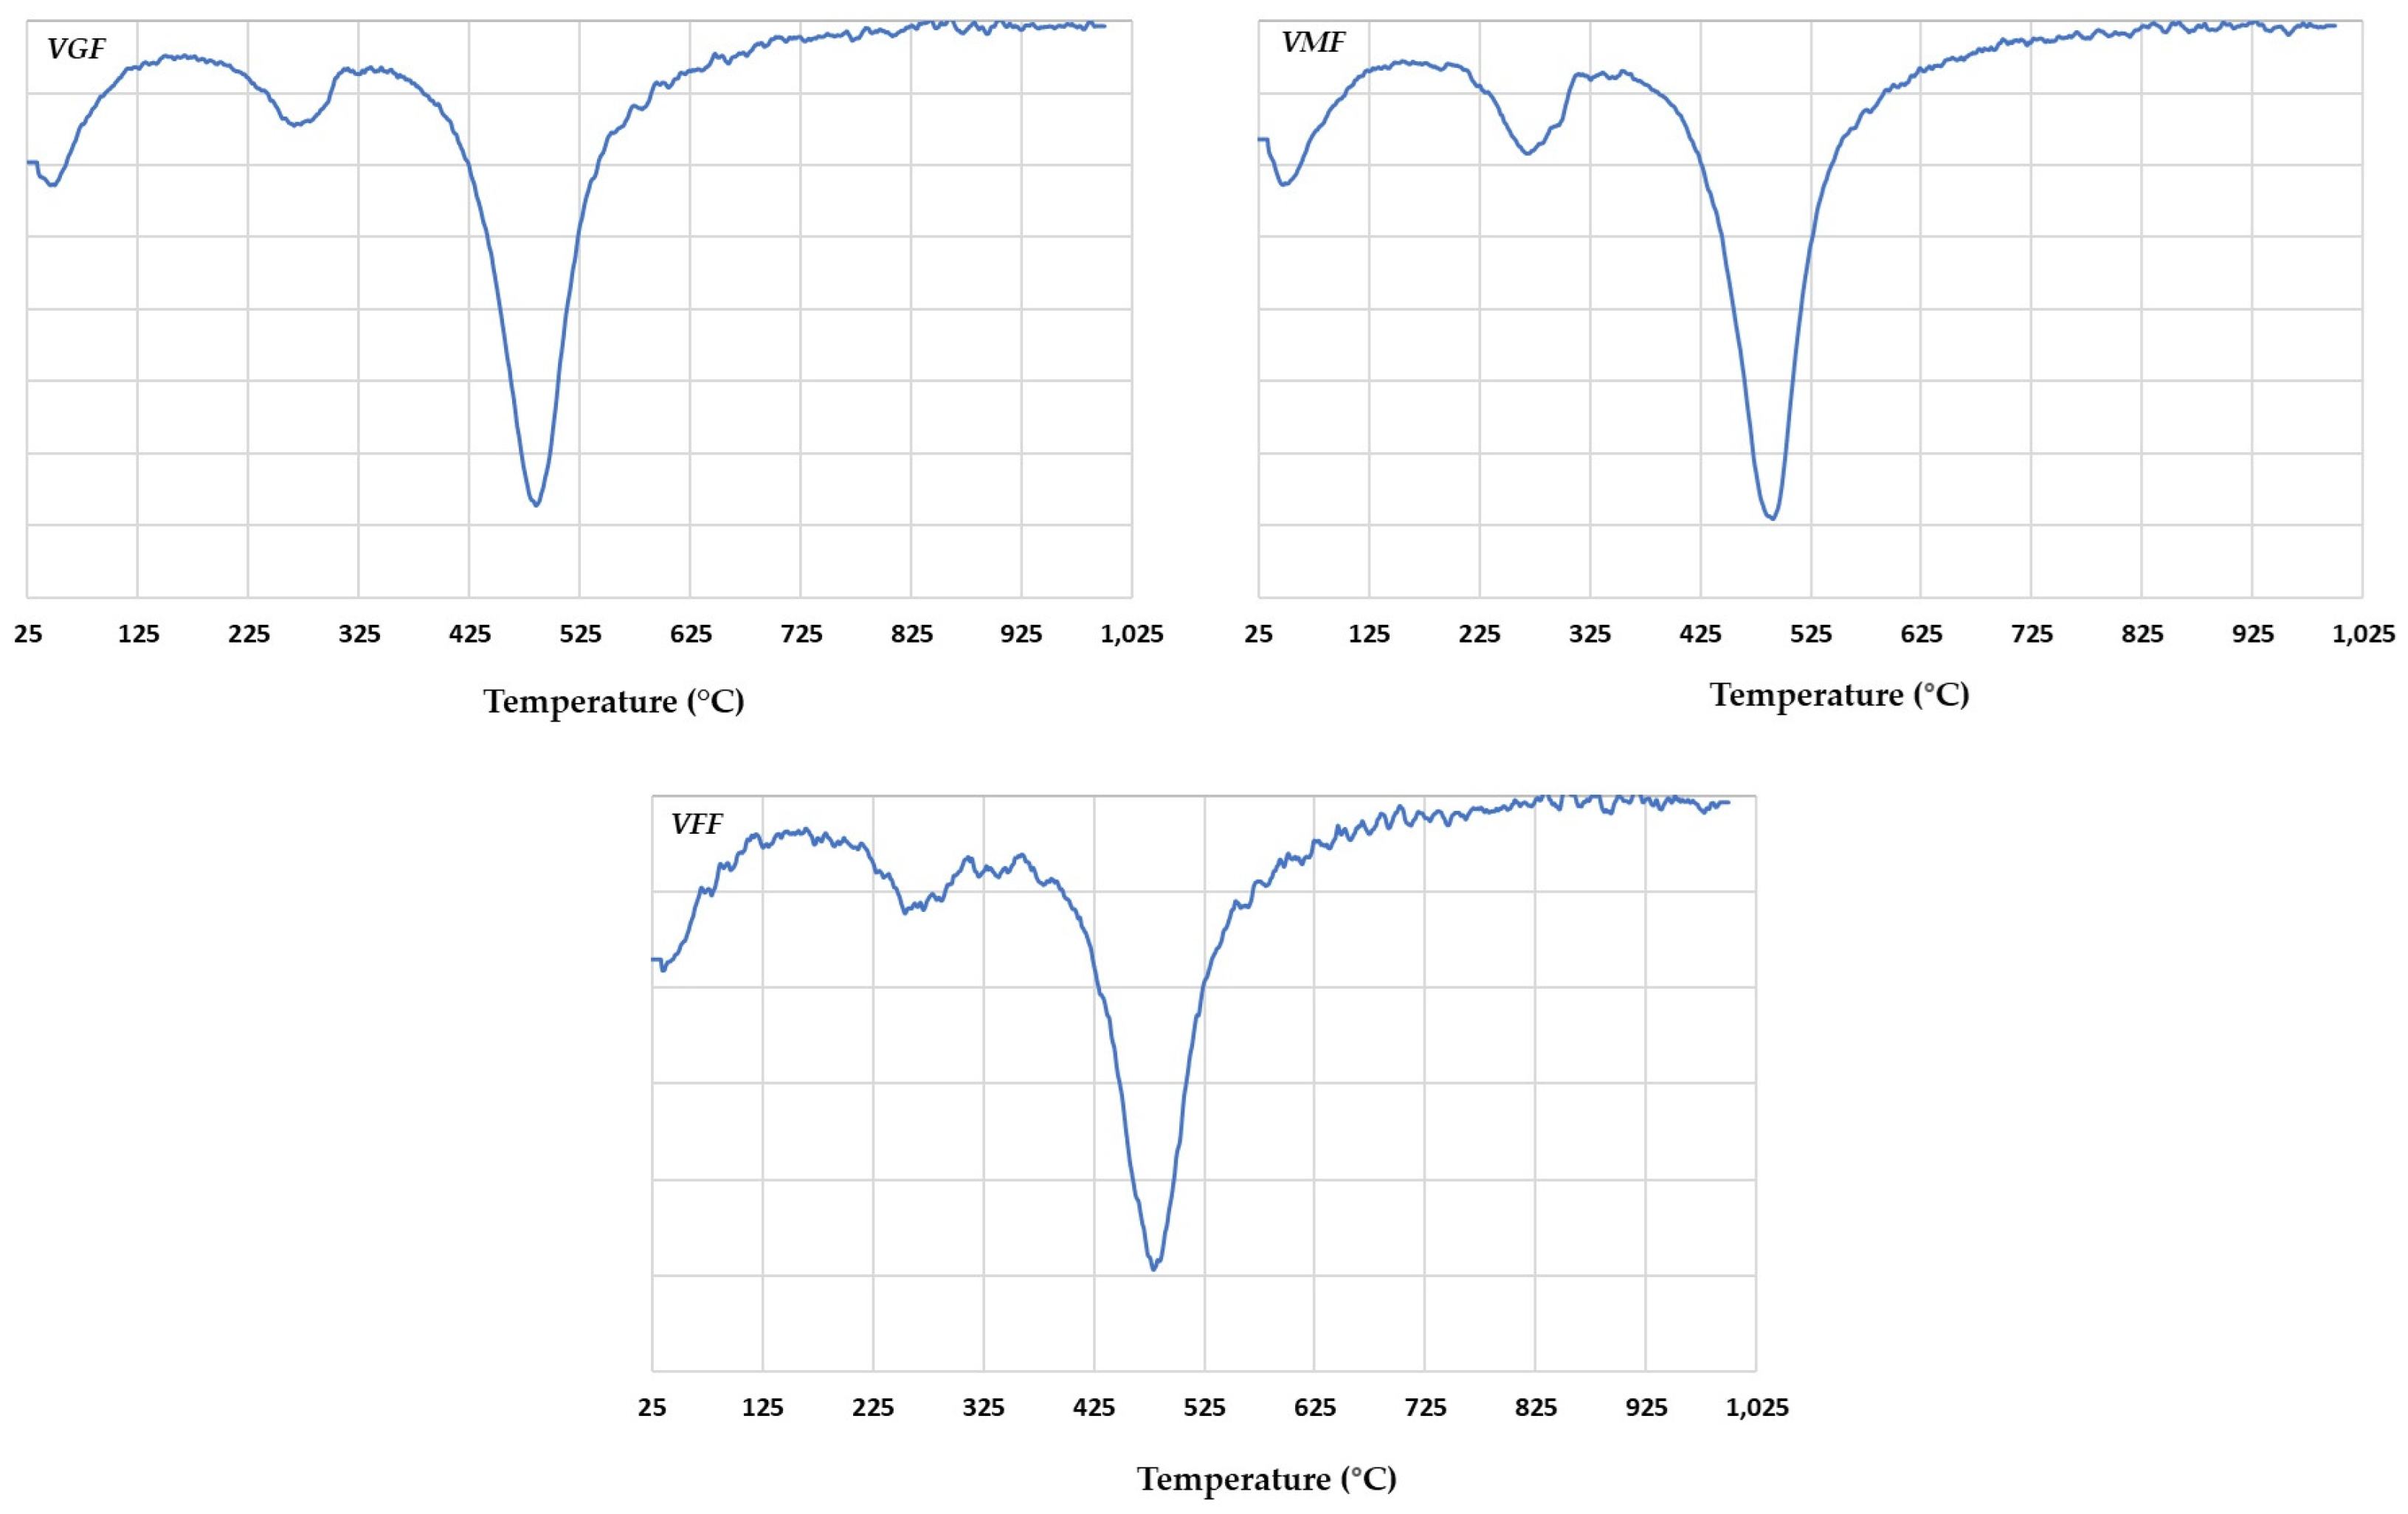
Figure 10 shows thermograms taken up to 1000 degrees for the three granulometric fractions of the V material. These thermograms are similar to each other and also to those of the L material, but the weak endothermic reaction at 275 degrees, associated with the dehydroxylation of gibbsite, is slightly more pronounced here. Additionally, the absence of kaolinite is indicated by the lack of an exothermic peak near 980 degrees, which corresponds to the formation of an alumina-reach spinel or mullite [18,22,25].
In actuality, minerals and clays are rarely found in soils in the form of pure minerals, and particles can form from stratified layers of different mineral phases; clays can be composed of a diversity of oxides and amorphous materials, making the identification of specific minerals very difficult. It has been reported that mixed clays and minerals are very common in many types of soils [14,38].

3.7. Metals Forming Amphoteric Oxides

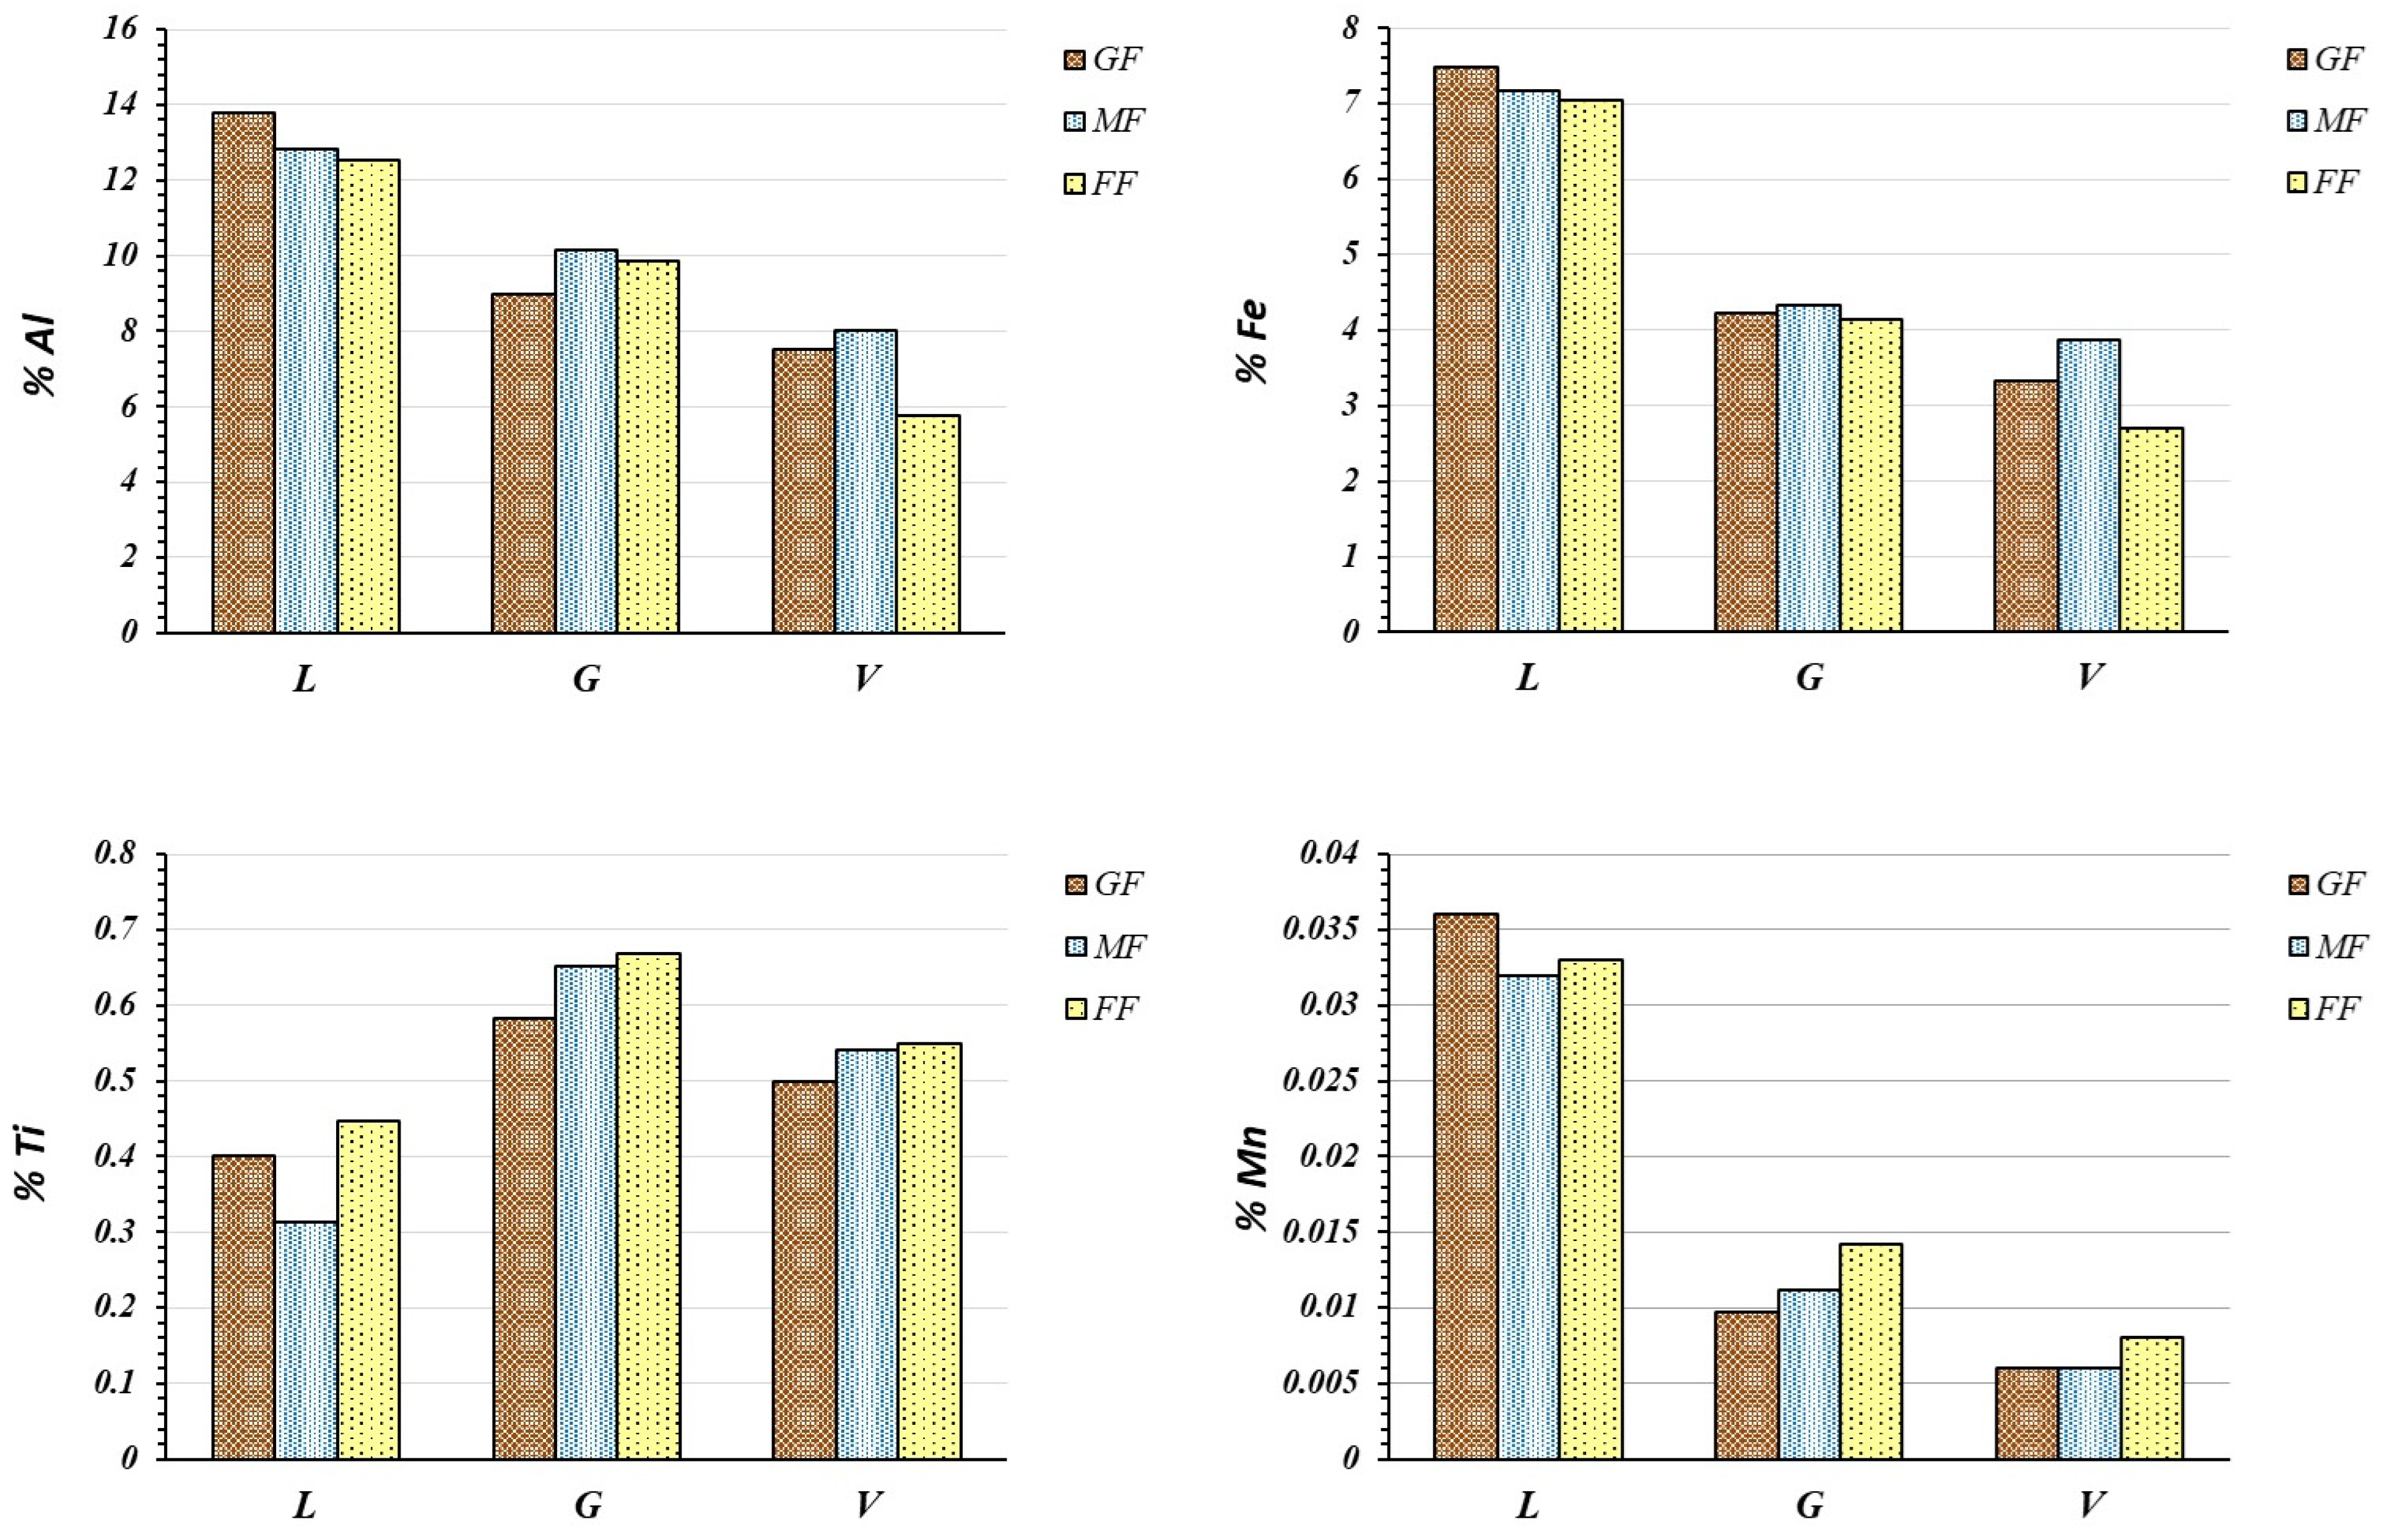
Figure 11 shows the average compositions in % pp of Fe, Al, Ti, and Mn in the three granulometric fractions of the three OLMs tested. The oxides of these metals might contribute to the adsorption phenomena owing to the formation of variable charges at their surfaces, which are themselves pH-dependent [7,12,42]. Aluminum is also present in allophanes, together with silica, in a variable composition with a large variable charge [18,22].
Each of these metals, when in their oxide form, exhibits varying tendencies towards adsorption, which depend on the surface acidity and reactivity of the oxide. These can be analyzed by comparing the surface acid dissociation constants for the reactions (shown in (1)), where M could be Al, Fe, Ti, or Mn.
M O H 2 + M O H + H + M O H M O + H +
For groups with >Ti-OH acidity constants, the Ka1 is greater than 10−4, but for groups > Al-OH and >Fe-OH, the Ka1 values are smaller than 10−7 [43]. Therefore, the first group is more acidic than the latter two. The ratio of metal valence to coordination number is related to metal oxides’ acidity and reactivity. In the case of silica, this relation is equal to 1 (4/4), which means that each surface OH group receives a charge of +1 from the silica (Si+4), and the bond shows a great degree of polarization, while the Si-O behaves as a weak Lewis base. For this reason, metal chemisorption is less likely here. For alumina, the ratio is equal to 1/2 (3/6), so each surface OH group receives a charge of +1/2 from the aluminum (Al+3), as a result of which chemisorption is more likely. This with relevance to alumina is also valid for iron, which presents the same ratio of metal valence to coordination number. In this case, the metal’s electronegativity is an important factor in determining its adsorption behavior [44]. The most electronegative metal will bond strongly with oxygen atoms on the mineral’s surface. On the other hand, based on the electrostatic model, metals with a high charge-to-radius ratio will form stronger covalent bonds.
The compositions of the three granulometric fractions are all more or less homogeneous, and the metallic distribution in V appears to be similar to that in the G materials. Three of the four metals formed amphoteric oxides; that is to say, iron, aluminum, and titanium were more highly concentrated in the L material, increasing the opportunities for oxides to form. Because of the greater contents of these metals, a greater adsorption capacity on the part of the calcined substrate prepared from the L material might be anticipated. Because there are few differences in terms of metal distribution in the different granulometric fractions, an optimal substrate for adsorption could be prepared using granulometric fractions under 800 µm.
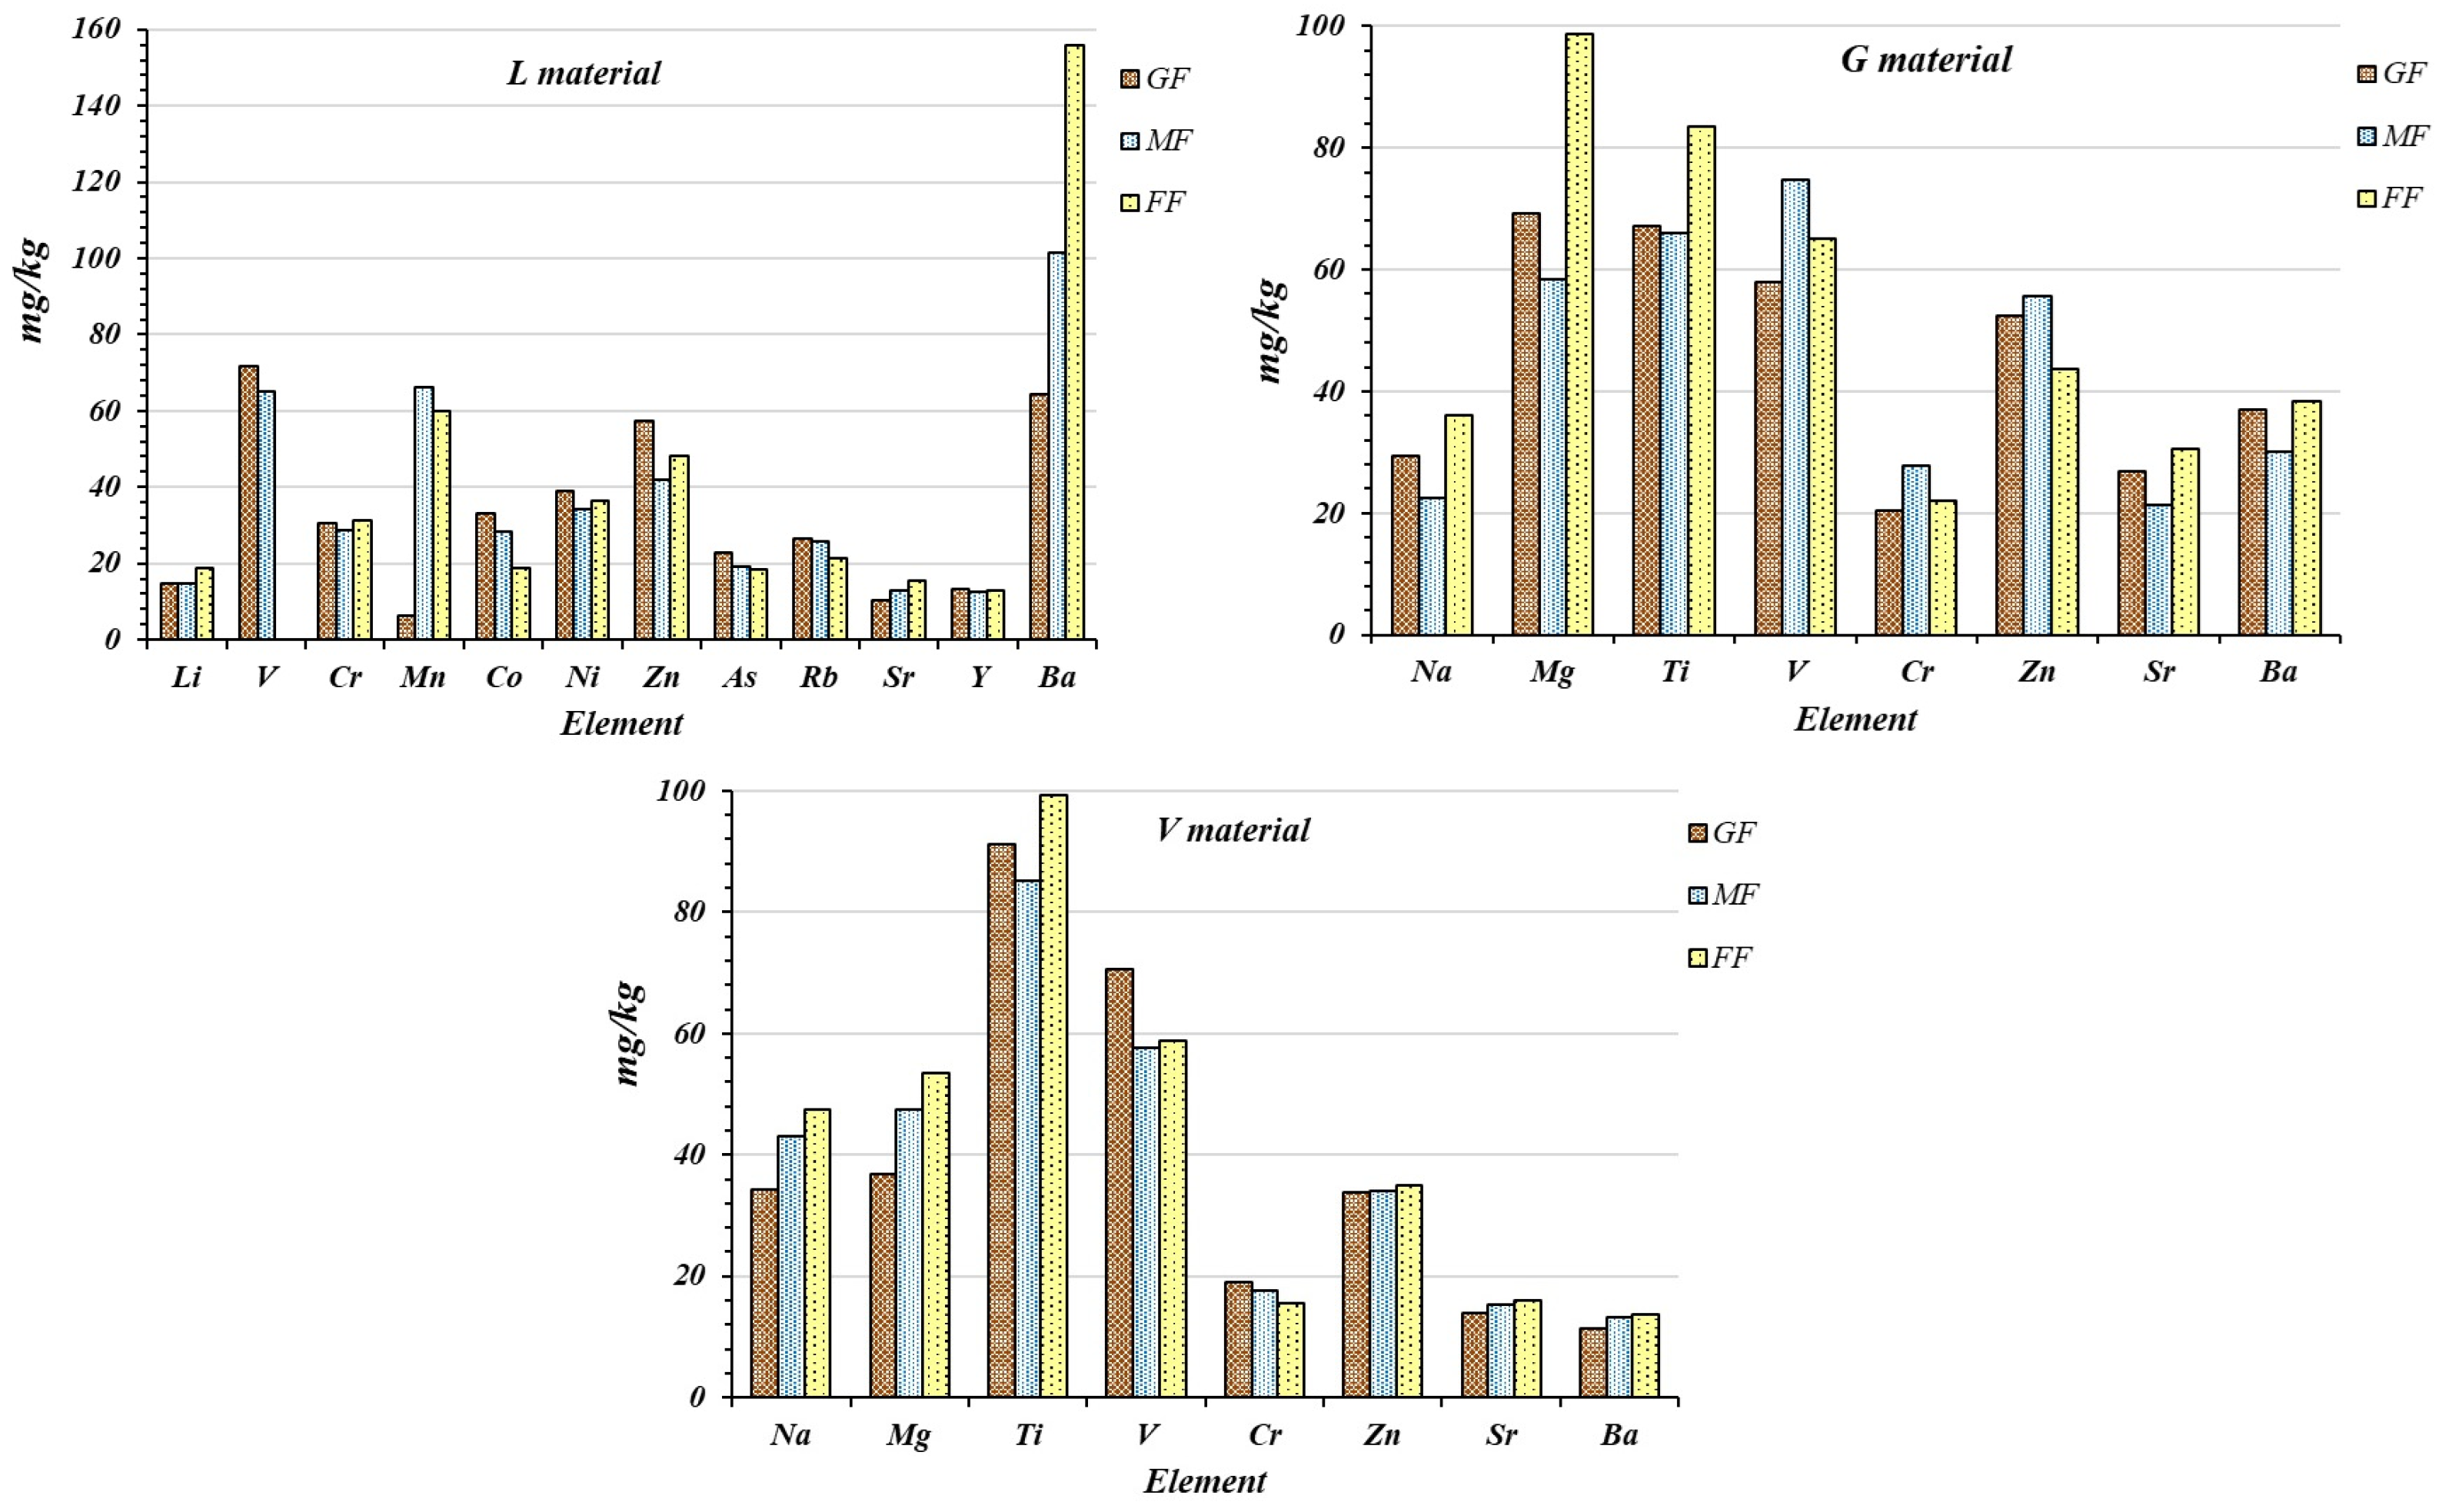
Figure 12 shows the presence of a metallic content greater than 1000 mg/g in the three lithological materials L, G, and V in the three granulometric fractions of GF (1200–425 µm), MF (425–250 µm), and FF (<250 µm). Alkaline and alkaline earth are not present as major components, which might explain the low EC values of the raw materials, the salts of which are always more soluble. The radioactivity found in the raw materials most likely originates from the 40K, and the greater radioactivity index found in the L material (six times greater) might be explained by the greater potassium content. Si comes from the aluminosilicates dissolved by the acid. The Si–quartz phase remains undissolved following acid digestion.

3.8. Other Metallic Species

Figure 13 shows metallic contents between 10 and 100 mg/g in the three lithological materials L, G, and V in three granulometric fractions: GF (1200–425 µm), MF (425–250 µm), and FF (<250 µm). As above, the metallic distributions appear similar in the V and G materials. Alkaline and alkaline earth are present as primary minerals in the feldspars, micas, and clays [9,18,38]. The presence of sodium, for example, could be associated with the presence of albite (NaAlSi3O8), as reported by XRD. This mineral gives these materials—especially G and L—a refractory property and better mechanical resistance, which are necessary for the preparation of calcined substrates. Transitional metals can be found in the fourth period, governed by Ti and V, followed by Cr and Zn. However, Mn, the fourth metal forming amphoteric oxides, is more highly concentrated in the L material, especially in the MF and FF fractions, compared to the other transitional metals Co, Ni, and Y, all of which are in the fifth period of the periodic table. This metal is more stable when in oxide form, as Y2O3; however, it has not been identified as an amphoteric oxide.
Figure 14 shows the metallic profiles between 1 and 10 mg/g in the three lithological materials L, G, and V in three granulometric fractions: GF (1200–425 µm), MF (425–250 µm), and FF (<250 µm). The most important transitional and rare earth metals, lanthanides and actinides, are present in this range of concentration. In general, these metals are more concentrated in the L material, but they are less (or not) involved in the adsorption process. The presence of Zr is important because zircon minerals endow these materials with the refractory properties necessary for the preparation of calcined adsorbent substrates.
The metallic richness of these materials, especially L, makes them suitable for use in several applications and in research on refractory and ceramic materials. The presence of Al, Zr, Be, and Mg could induce the formation of binary refractory systems, such as Al2O3–(MO, M2O3, MO2) and ZrO2–(MO, M2O3) (where M could be Ca, Mg, Co, or Ni), or ternary refractory systems such as ZrO2–Al2O3–BeO [45].
Figure 15 shows the metallic contents below 1 mg/g of the most important internal transitional metals in the three lithological materials L, G, and V in three granulometric fractions: GF (1200–425 µm), MF (425–250 µm), and FF (<250 µm). The most important lanthanides and actinides are present here. The U and Th concentrations reflect their natural abundance in the terrestrial crust and might be responsible for the material’s radioactivity. The presence of thorium could also induce the formation of ternary refractory systems such as ThO2–Al2O3–BeO, or even refractory systems of higher order, such as (ZrO2·ThO2)–Al2O3–BeO [45]. These refractory systems are widely employed in the siderurgic and metallurgic industries, as well as in ceramic and thermal isolating materials. Despite the metallic richness of these materials, the absence of Au, Ag, Pt, and Ir, as well as Os and Hg, is notable.
Because the main intention here is to prepare an adsorbent substrate via thermal processes and use it for water treatment, the presence of heavy metals might represent a problem because some of them could dissolve in the water being treated. For example, the WHO recommends the presence of no more than 10 µg/L of As in potable waters, but the As content in the L material is almost twice this amount, so there is a risk of contamination. Former studies have shown that, in actuality, metallic contributions are made to the water; however, the same studies showed that three stages of washing with distillated water drastically reduce the contributions of metal to the water to below their critical levels [46].

3.9. IR Analysis

Figure 16 shows the IR spectra of raw materials (blue line) and the calcined substrate (red line) up to a 1200 mm particle diameter, derived from the L, G, and V materials. The IR spectra of the G and V materials look similar, showing two characteristic strong bands between 3700 and 3600 cm−1, corresponding to Al–OH and Si–OH stretching vibrations [22,25,40,47]. The lower-frequency region (2000–400 cm−1) shows characteristic bands for kaolinite and quartz that may overlap or mix with each other owing to their proximity [36,48]. Quartz has already been detected by XRD as a macro component mineral in all these materials. Table 3 shows the frequencies identified for these minerals and their attribution according to the Fagundo classification [48]. These spectra also coincide with those identified by Tang [25,40] for kaolinite-type clay.
The IR spectra of the calcined material (red line) show changes in the characteristic band between 3700 and 3600 cm−1, associated with Al–OH and Si–OH stretching. Here, we see a weak, broad, and flat band, with a maximum value of 3400 cm−1. This band change profile was produced by the dehydroxilation reaction that took place in the calcination process at around 500 degrees. The lower-frequency region shows a characteristic band associated with Si–O vibration at around 1000 cm−1, an Si–Si valence vibration associated with quartz at 779 and 694 cm−1, and Si–O–M valence vibration at around 478–479 cm−1 [22,39]. All these bands can be associated with amorphous silica and/or primary minerals [47].
The IR spectra from the raw L material (blue line) show a single sharp band at 3625.98 cm−1 corresponding to Al–OH and Si–OH stretching, followed by a broad band at 3440 cm−1 assigned to water molecules associated with the exchangeable cation [22,25,39,45]. The lower-frequency region shows a broad band associated with Si–O vibration at 1031.52 cm−1, Si–Si valence vibration associated with quartz at 754.19 and 693.77 cm−1, and Si–O–M and M–O–H valence vibrations at 535.63 and 471.39 cm−1. These spectra also coincide with those identified by Tang [25,40] for smectite-type clay, but all these bands could also be associated with amorphous silica and/or primary minerals.
The IR spectra of the calcined material (red line) also show similar changes in characteristic band associated with Al–OH and Si–OH stretching, appearing as a weak, broad, and flat band with a maximum at 3400 cm−1. This change in band profile is also related to the dehydroxilation reaction taking place at around 500 degrees during the calcination process. In the lower-frequency region, the spectra show a strong band at 1040 cm−1 corresponding to the Si–O valence vibrations, the Si–Si valence vibration in quartz at 777.58 cm−1, and the Si–O–M and M–O–H valence vibrations associated with the smectite-type clay.

4. Conclusions

Three oxidic lithologic materials were here studied for their capacity to be used as raw materials in the preparation of a granular adsorbent substrate via thermal treatment, to be tested for utility in water and wastewater purification by the filtration/adsorption process. The raw materials fit into the sandy loam and loamy sand textural classes, with low CEC characteristic of amphoteric oxides and kaolinite and very low EC because they are hardly soluble. The DTA results suggest the presence of non-crystalline aluminosilicates and elemental allophanes with surface charges that are pH-dependent, indicating that they can participate in ionic adsorption reactions. The XRD results identify quartz as a major component, and some important clays have also been found, such as albite and illite, which provide good thermal properties and mechanical resistance against abrasion.
The high contents of metals that form amphoteric oxides, such as Fe, Al, Ti, and Mn, with pH-dependent variable charges, favor ionic adsorption acting through nonspecific as well as specific adsorption processes. In an acidic medium, oxide protonation can take place, creating a positive charge that allows anions to be adsorbed; on the other hand, in an alkaline medium, oxide deprotonation can take place, creating a negative charge and allowing cations to be adsorbed. The presence of transitional and rare earth metals, such as Zr, Be, Th, and Mg, as the oxides form might induce the formation of refractory systems, endowing these materials with high thermal and mechanical resistance. These thermal and mechanical properties are necessary during the preparation of calcined adsorbing substrates via thermal treatment. The calcination process favors oxide formation and the cementation of pellets, precluding the pellet’s dispersion in the solution. However, the calcination process did not favor the development of a specific surface sufficient for adsorption in two of the three tested materials. The FTIR results show changes after the calcination process.
Their thermal and mechanical properties, as well as the presence of metals that form amphoteric oxides such as Fe, Al, Ti, and Mg, make these lithological materials amenable to the preparation of calcined adsorbing substrates that can be used for several purposes, such as water and wastewater treatment by the filtration process, heavy metal removal, or turbidity and organic matter content reduction. These lithological materials are easy to find and collect, so the preparation of suitable adsorbent substrates for water treatment should be relatively economically feasible. On the other hand, although commercial ionic exchange resins show better performances, they are very expensive and not easily available; additionally, these systems require technological installation and expensive maintenance procedures that can be performed by the supply company alone, so their use must be strongly justified.
Future studies could focus on their use in the desalinization of sea water as a pretreatment before reverse osmosis treatment, allowing their useful life to be prolonged. Further, after saturation, the substrate can be totally or partially washed and reused.

Author Contributions

Conceptualization, J.G.P., F.M. and L.C.G.; methodology, J.G.P., F.M., L.C.G., M.S., E.A.L. and C.T.; software, J.G.P., F.M., M.S., E.A.L., C.T. and L.S.Y.; validation, J.G.P., F.M., M.S., E.A.L., C.T. and L.S.Y.; formal analysis, J.G.P., F.M., L.C.G. and A.C.R.; investigation, J.G.P., F.M., L.C.G., M.S., E.A.L., C.T., A.C.R. and G.E.D.; resources, J.G.P., F.M. and L.C.G.; data curation, J.G.P., F.M., L.C.G. and L.S.Y.; writing—original draft preparation, J.G.P., F.M. and L.C.G.; writing—review and editing, J.G.P., F.M., L.C.G., A.C.R. and G.E.D.; visualization, F.M., A.C.R., L.S.Y. and G.E.D.; supervision, J.G.P., F.M. and L.C.G.; project administration, J.G.P., F.M., L.C.G. and A.C.R.; funding acquisition, J.G.P., F.M., L.C.G. and A.C.R. All authors have read and agreed to the published version of the manuscript.

Funding

This research received no external funding.

Institutional Review Board Statement

Not applicable.

Informed Consent Statement

Not applicable.

Data Availability Statement

The datasets used and analyzed during the current study are available from the corresponding author on reasonable request.

Acknowledgments

The authors would like to thank the Universidad Nacional de Chimborazo for supporting this work through the research projects program (Project: Materiales litológicos oxídicos como medios de adsorción para la retención de iones de metales pesados en aguas naturales); IUPSM for institutional support; CEE, ULA and the UNET for their help through the project “Reforsing of the capacity of Environmental Interactive Management”; the Chemistry Technology Institute (UPV–CSIC) for the TDA, DRX and BET surface area studies in Valencia, Spain; ICIA, Cluj Napoca, Romania for their collaboration in metal analysis and recording of IR spectra; Constantin Cosma from the Chemical Institute, Babes Bolyai Univ. Cluj Napoca, Romania for the radioactivity analysis; Salvador Lomónaco from ICT, UCV for XRD interpretation; Francisco Lama for the information about zone geology; and to Yimy, the Potter from San Juan de Lagunillas, who shared with us his knowledge and methodology.

Conflicts of Interest

The authors declare no conflicts of interest.

References

  1. Tran, H.N. Adsorption Technology for Water and Wastewater Treatments. Water 2023, 15, 2857. [Google Scholar] [CrossRef]
  2. Feng, Q.; Zhang, G.; Zhang, Q.; Zhao, W. Synergistic Activation of Sulfidized Hemimorphite with Copper-lead Species for Improving Surface Hydrophobicity and Floatability. Sep. Purif. Technol. 2024, 332, 125854. [Google Scholar] [CrossRef]
  3. Melliti, E.; Van der Bruggen, B.; Elfil, H. Chemical Inhibition of Combined Gypsum and Iron Oxides Membrane Fouling during Reverse Osmosis Desalination Process: Prevention and Regeneration of Membranes. Desalination 2023, 551, 116414. [Google Scholar] [CrossRef]
  4. Tan, X.; Saha, P.; Klausner, J.; Abbasi, B.; Benard, A. Modeling and Experimental Validation of Direct Contact Crossflow Packed Beds Condenser used in HDH Desalination Systems. Desalination 2023, 551, 116414. [Google Scholar] [CrossRef]
  5. Feng, Q.; Yang, W.; Chang, M.; Wen, S.; Liu, D.; Han, G. Advances in Depressants for Flotation Separation of Cu-Fe Sulfide Minerals at Low Alkalinity: A critical Review. Int. J. Miner. Metall. Mater. 2024, 31, 1–17. [Google Scholar] [CrossRef]
  6. Nazari, M.T.; Schnorr, C.; Rigueto, C.V.T.; Alessandretti, A.; Melara, E.; da Silva, N.F.; Crestani, L.; Ferrari, V.; Vieillard, J.; Dotto, G.L.; et al. A Review of the Main Methods for Composite Adsorbents Characterization. Environ. Sci. Pollut. Res. 2022, 29, 88488–88506. [Google Scholar] [CrossRef]
  7. Prato, J.G.; Millán, F.; Rangel, M.; Márquez, A.; González, L.C.; Ríos, I.; García, C.; Rondón, C.; Wang, E. Adsorption of Pb (II) Ions on Variable Charge Oxidic Calcined Substrates with Chemically Modified Surface. F1000Research 2024, 12, 747. [Google Scholar] [CrossRef]
  8. Owens, P.R.; Libohova, Z. Soil Morphology. In Encyclopedia of Soils in the Environment, 2nd ed.; Goss, M.J., Oliver, M., Eds.; Elsevier: Amsterdam, The Netherlands, 2023; pp. 149–170. [Google Scholar] [CrossRef]
  9. Foth, H.D. Fundamentals of Soil Science, 8th ed.; John Wiley & Sons, Inc.: New York, NY, USA, 1990. [Google Scholar]
  10. Fassbender, H.W.; Bornemisza, E. Química de Suelos con Énfasis en Suelos de América Latina, 2nd ed.; Instituto Interamericano de Ciencias Agrícolas—IICA: San José, Costa Rica, 1994; pp. 7–156. Available online: https://repositorio.iica.int/handle/11324/6801 (accessed on 7 July 2024).
  11. Naorem, A.; Jayaraman, S.; Dang, Y.P.; Dalal, R.C.; Sinha, N.K.; Rao, C.S.; Patra, A.K. Soil Constraints in an Arid Environment—Challenges, Prospects, and Implications. Agronomy 2023, 13, 220. [Google Scholar] [CrossRef]
  12. Prato, J.G.; Millán, F.; Ríos, A.; González-Ramírez, L.C. Uso de Materiales Litológicos Oxídicos para la Reducción de la Dureza en Aguas Naturales. Inf. Tecnol. 2022, 33, 145–156. [Google Scholar] [CrossRef]
  13. Xu, R.; Wang, Y.; Tiwari, D.; Wang, H. Effect of Ionic Strength on Adsorption of As(III) and As(V) on variable charge soils. J. Environ. Sci. 2009, 21, 927–932. [Google Scholar] [CrossRef]
  14. Millán, F.; Prato, J.G.; González, L.C.; Márquez, A.; Djabayan, P. Cu (II) Chemisorption on Calcined Substrates made with an Oxidic Refractory Variable Charges Lithological Material. Rev. Tec. Ing. Univ. Zulia 2019, 42, 10–18. [Google Scholar] [CrossRef]
  15. Sadeghalvad, B.; Khorshidi, N.; Azadmehr, A.; Sillanpää, M. Sorption, Mechanism, and Behavior of Sulfate on Various Adsorbents: A Critical Review. Chemosphere 2021, 263, 12806. [Google Scholar] [CrossRef] [PubMed]
  16. Xu, R.K.; Qafoku, N.P.; Van Ranst, E.; Li, J.Y.; Jiang, J. Adsorption Properties of Subtropical and Tropical Variable Soils: Implication from Climate Change and Biochard Amendment. Adv. Agron. 2016, 135, 1–58. [Google Scholar] [CrossRef]
  17. Wang, Y.; Jiang, J.; Xu, R.K.; Tiwari, D. Phosphate Adsorption at Variable Charge Soils/water Interfaces as Influenced by Ionic Strength. Aust. J. Soil Res. 2009, 47, 529–536. [Google Scholar] [CrossRef]
  18. Prato, J.G.; Millán, F.C.; González, L.C.; Ríos, A.C.; López, E.; Ríos, I.; Navas, S.; Márquez, A.; Carrero, J.C.; Díaz, J.I. Adsorption of Phosphate and Nitrate Ions on Oxidic Substrates Prepared with a Variable-Charge Lithological Material. Water 2022, 14, 2454. [Google Scholar] [CrossRef]
  19. McBride, M.B. Environmental Chemistry of Soils; Oxford University Press: New York, NY, USA, 1994; pp. 406–407. [Google Scholar]
  20. Sposito, G. The Operational Definition of the Zero Point of Charge in soils. Soil Sci. Soc. Am. J. 1981, 45, 292–297. [Google Scholar] [CrossRef]
  21. Marcano-Martínez, E.; McBride, M.B. Comparison of the Titration and Ion Adsorption Methods for Surface Charge Measurement in Oxisols. Soil Sci. Soc. Am. J. 1989, 53, 1040–1045. [Google Scholar] [CrossRef]
  22. Pansu, M.; Gautheyrou, J. Handbook of Soil Analysis; Springer: Berlin/Heidelberg, Germany, 2006; pp. 551–656. [Google Scholar] [CrossRef]
  23. McKean, S.J. Manual de Análisis de Suelo y Tejido Vegetal; Centro Internacional de Agricultura Tropical: Bogotá, Colombia, 1993; pp. 95–99. [Google Scholar]
  24. Adams, M. Fundamentos de Química de Suelos; Consejo de Desarrollo Científico y Humanístico—Universidad Central de Venezuela: Caracas, Venezuela, 1995; pp. 230–257. [Google Scholar]
  25. Tan, K.H. Principles of Soil Chemistry, 4th ed.; CRC Press: New York, NY, USA, 2011; pp. 133–241. [Google Scholar]
  26. Freitas, J.M.; Netto, A.M.; Correa, M.M.; Xavier, B.T.; Assis, F.X. Potassium Adsorption in Soil Cultivated with Sugarcane. An. Acad. Bras. Cienc. 2018, 90, 541–555. [Google Scholar] [CrossRef]
  27. Renne, P.R.; Mundil, R.; Balco, G.; Min, K.; Ludwig, K.R. Joint Determination of 40K Decay Constants and 40Ar∗/40K for the Fish Canyon Sanidine Standard, and Improved Accuracy for 40Ar/39Ar Geochronology. Geochim. Cosmochim. Acta 2010, 74, 5349–5367. [Google Scholar] [CrossRef]
  28. Cinelli, G.; De Cort, M.; Tollefsen, T. (Eds.) European Atlas of Natural Radiation; Publication Office of the European Union: Luxembourg, 2019. [Google Scholar] [CrossRef]
  29. Macht, F.; Eusterhues, K.; Pronk, G.J.; Totsche, K.U. Specific Surface Area of Clay Minerals: Comparison between Atomic Force Microscopy Measurements and Bulk-gas (N2) and -Liquid (EGME) Adsorption Methods. Appl. Clay Sci. 2011, 53, 20–26. [Google Scholar] [CrossRef]
  30. Ji, B.; Zhang, W. Rare Earth Elements (REEs) Recovery and Porous Silica Preparation from Kaolinite. Powder Technol. 2021, 391, 522–531. [Google Scholar] [CrossRef]
  31. Conconi, M.S.; Guana, M.R.; Serra, M.F.; Suarez, G.; Aglietti, E.F.; Rendtorff, N.M. Quantitative Firing Transformations of a Triaxial Ceramic by X-ray Diffraction Methods. Cerâmica 2014, 60, 524–531. [Google Scholar] [CrossRef]
  32. Dah-Traoré, Y.; Zerbo, L.; Seynou, M.; Ouedraogo, R. Mechanical, Microstructural and Mineralogical Analyses of Porous Clay Pots Elaborated with Rice Husks. JMMCE 2018, 6, 257–270. [Google Scholar] [CrossRef]
  33. Allali, A.; Monsif, M.; Idrissi Kandri, N.; Zerouale, A. Caractérisation Physico-Chimique des Enduits Anciens et de Restauration de la Muraille (Al Moahades) Bab Chaâfa de la Médina de Salé: Etude Comparative. J. Mater. Environ. Sci. 2014, 5, 2205–2211. [Google Scholar]
  34. Sedmale, G.; Randers, M.; Grase, L.; Kostjukovs, J. Use of Differential Treatment of Illite to Modify Their Structure and Properties. Mater. Sci. Appl. Chem. 2015, 32, 19–22. [Google Scholar] [CrossRef]
  35. Burduhos Nergis, D.D.; Abdullah, M.; Sandu, A.V.; Vizureanu, P. XRD and TG-DTA Study of New Alkali Activated Materials Based on Fly Ash with Sand and Glass Powder. Materials 2020, 13, 343. [Google Scholar] [CrossRef]
  36. Manoharan, C.; Sutharsan, P.; Dhanapandian, S.; Venkatachalapathy, R. Characteristics of Some Clay Materials from Tamilnadu, India, and their Possible Ceramic Uses. Cerâmica 2012, 58, 412–418. [Google Scholar] [CrossRef]
  37. Damian, G.; Damian, F.; Szakács, Z.; Iepure, G.; Aştefanei, D. Mineralogical and Physico-Chemical Characterization of the Oraşu-Nou (Romania) Bentonite Resources. Minerals 2021, 11, 938. [Google Scholar] [CrossRef]
  38. Kirsten, M.; Mikutta, R.; Vogel, C.; Thompson, A.; Mueller, C.W.; Kimaro, D.N.; Bergsma, H.L.T.; Feger, K.H.; Kalbitz, K. Iron Oxides and Aluminous Clays Selectively Control Soil Carbon Storage and Stability in the Humid Tropics. Sci. Rep. 2021, 11, 5076. [Google Scholar] [CrossRef]
  39. Kgabi, D.P.; Ambushe, A.A. Characterization of South African Bentonite and Kaolin Clays. Sustainability 2023, 15, 12679. [Google Scholar] [CrossRef]
  40. Tan, K.H. Soil Sampling, Preparation and Analysis, 2nd ed.; CRC Press: New York, NY, USA, 2005; pp. 198–470. [Google Scholar] [CrossRef]
  41. Húlan, T.; Trník, A.; Medved, I. Kinetics of Thermal Expansion of Illite-based Ceramics in the Dehydroxylation Region during Heating. J. Therm. Anal. Calorim. 2017, 127, 291–298. [Google Scholar] [CrossRef]
  42. Qafoku, N.P.; Van Ranst, E.; Noble, A.; Baert, G. Variable Charge Coils: Their Mineralogy, Chemistry and Management. Adv. Agron. 2004, 84, 159–214. [Google Scholar] [CrossRef]
  43. Schindler, P.W.; Stumm, W. The Surface Chemistry of Oxides, Hydroxides and Oxide Minerals. In Environmental Science and Technology. Aquatic Surface Chemistry. Chemical Processes at the Particle-Water Interface, 1st ed.; Stumm, W., Ed.; Wiley: New York, NY, USA, 1987; pp. 83–110. [Google Scholar]
  44. Ouyang, D.; Zhuo, Y.; Hu, L.; Zeng, O.; Hu, Y.; He, Z. Research on the Adsorption Behavior of Heavy Metal Ions by Porous Material Prepared with Silicate Tailings. Minerals 2019, 9, 291. [Google Scholar] [CrossRef]
  45. Macarovici, G.; Macarovici, D. Chimia Oxizilor Dubli si Utilizarea, 1st ed.; Editura Academiei Socialiste Romania: Bucuresti, Romania, 1975; pp. 100–194. [Google Scholar]
  46. Millán, F.; Prato, J.G.; Montilla, T.; Tănăselia, C. Using of Variable Charge Adsorption Beds for Filtration of Residual Waters. Rev. Tec. Ing. Univ. Zulia 2018, 41, 98–110. [Google Scholar]
  47. González Martínez, S.P. Caracterización de la Fracción Arcilla en algunos Suelos Derivados de Cenizas Volcánicas de Costa Rica. Tesis de Grado de Magister Scientiae, Instituto Interamericano de Ciencias Agrícolas de la OEA, San José, Costa Rica, 1972. [Google Scholar]
  48. Fagundo, J.R.; Valdés, J.J.; Pajón, J.M. Determinación del Contenido de los Minerales Cuarzo y Caolinita en Sedimentos Mediante Espectroscopia Infrarroja. Rev. Cienc. Químicas 1984, 15, 327–333. [Google Scholar]
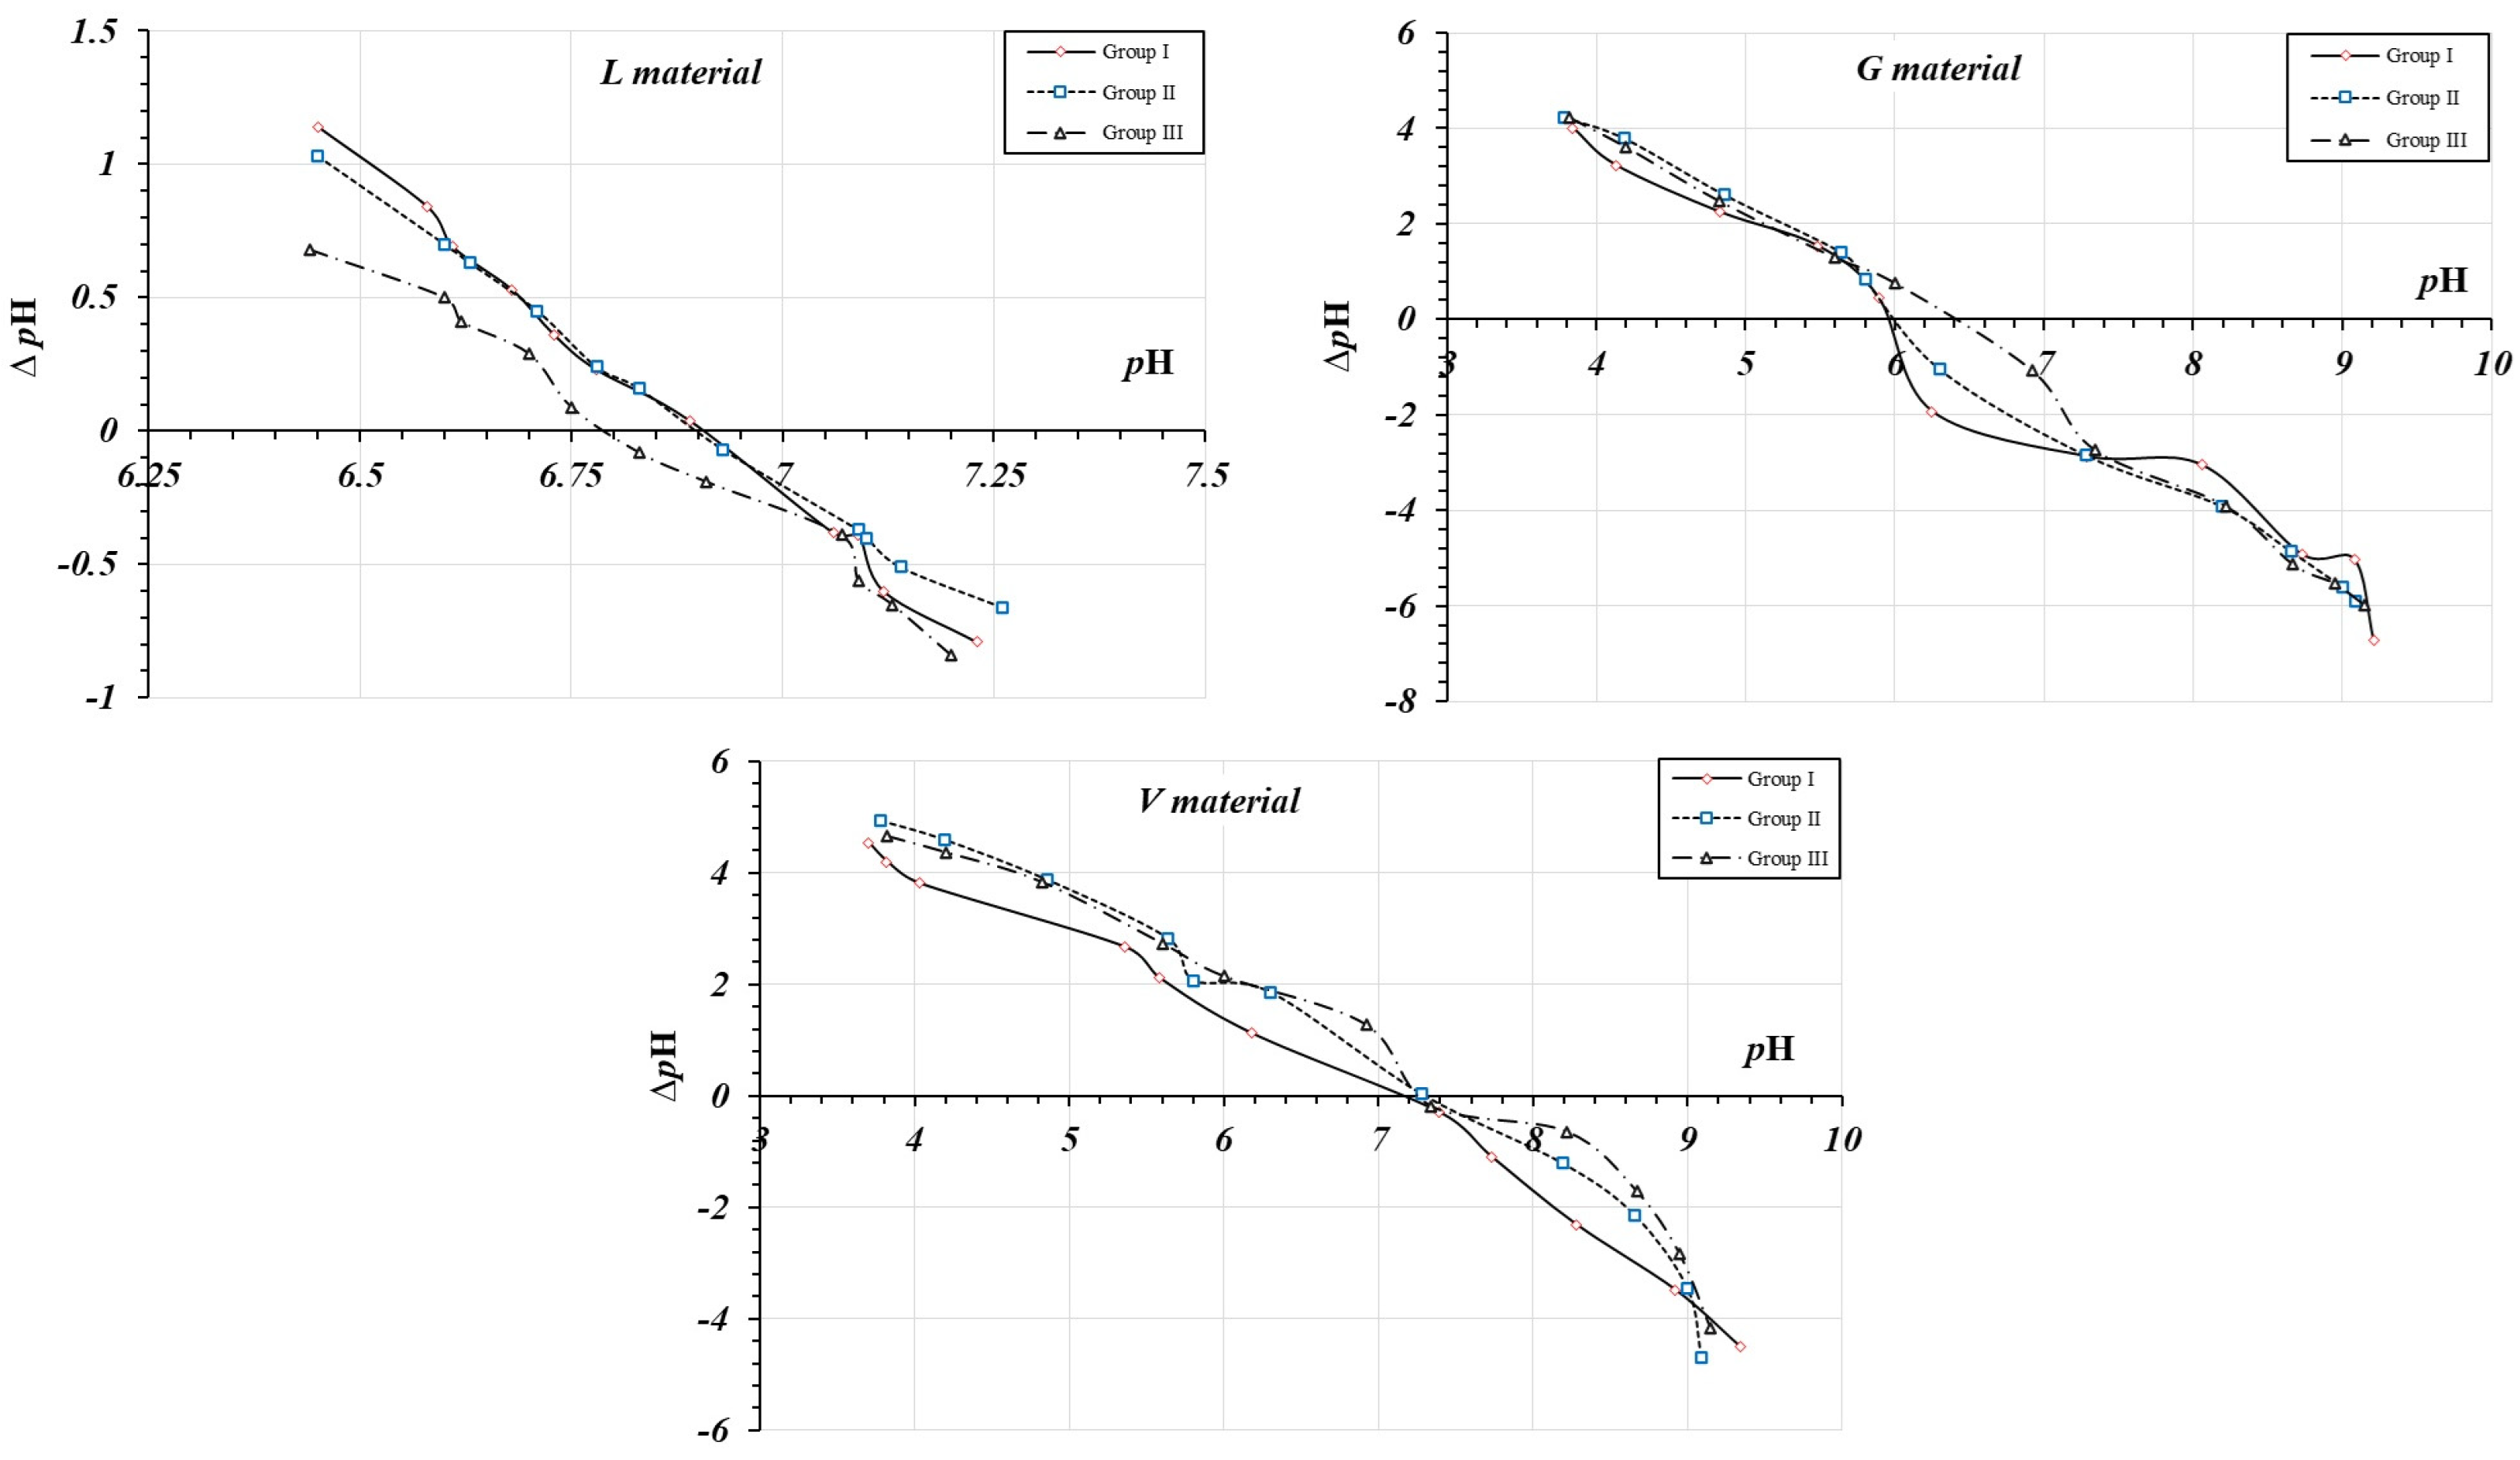
Figure 1. Point of zero charge for the raw materials.
Sustainability 16 07902 g001
Figure 2. (a) BET surface area and external surface area for the three granulometric fractions of the three OLMs L, G, and V, in three granulometric fractions: GF (1200–425 µm), MF (425–250 µm), and FF (<250 µm). (b) Linear correlation between external SA and BET SA.
Sustainability 16 07902 g002
Figure 3. Pore volume, micropore volume, and micropore area in the three lithological materials L, G, and V in the three granulometric fractions: GF (1200–425 µm), MF (425–250 µm), and FF (<250 µm).
Sustainability 16 07902 g003
Figure 4. Effect of calcination pores on the external surface area and pore volume in the three lithological materials L, G, and V in three granulometric fractions: GF (1200–425 µm), MF (425–250 µm), and FF (<250 µm).
Sustainability 16 07902 g004
Figure 5. XR diffractograms of the L material in three granulometric fractions: GF (1200–425 µm), MF (425–250 µm), and FF (<250 µm).
Sustainability 16 07902 g005
Figure 6. XR diffractograms from the G material in three granulometric fractions: GF (1200–425 µm), MF (425–250 µm), and FF (<250 µm).
Sustainability 16 07902 g006
Figure 7. XR diffractograms from V material in three granulometric fractions: GF (1200–425 µm), MF (425–250 µm), and FF (<250 µm).
Sustainability 16 07902 g007
Figure 8. DTA from the L material in three granulometric fractions: GF (1200–425 µm), MF (425–250 µm), and FF (<250 µm).
Sustainability 16 07902 g008
Figure 9. DTA from the G material in three granulometric fractions: GF (1200–425 µm), MF (425–250 µm), and FF (<250 µm).
Sustainability 16 07902 g009
Figure 10. DTA from the V material in three granulometric fractions: GF (1200–425 µm), MF (425–250 µm), and FF (<250 µm).
Sustainability 16 07902 g010
Figure 11. Fe, Al, Ti, and Mn contents in the three lithological materials L, G, and V in the three granulometric fractions: GF (1200–425 µm), MF (425–250 µm), and FF (<250 µm).
Sustainability 16 07902 g011
Figure 12. Other metallic contents greater than 1000 mg/g in the three lithological materials L, G, and V in the three granulometric fractions: GF (1200–425 µm), MF (425–250 µm), and FF (<250 µm).
Sustainability 16 07902 g012
Figure 13. Metallic contents between 10 and 100 mg/g in the three lithological materials L, G, and V in three granulometric fractions: GF (1200–425 µm), MF (425–250 µm), and FF (<250 µm).
Sustainability 16 07902 g013
Figure 14. Metallic contents between 1 and 10 mg/g in the three lithological materials L, G, and V in three granulometric fractions: GF (1200–425 µm), MF (425–250 µm), and FF (<250 µm).
Sustainability 16 07902 g014
Figure 15. Metallic contents below 1 mg/g in the three lithological materials L, G, and V in three granulometric fractions: GF (1200–425 µm), MF (425–250 µm), and FF (<250 µm).
Sustainability 16 07902 g015
Figure 16. IR spectra from raw and calcined material from L, G, and V OLMs.
Sustainability 16 07902 g016
Table 1. Characterization of raw materials.
MaterialColor *Texture (%)dap (g/mL)Organic
Matter (%)
pHC.E.C cmol (+)/kgEC
(dS/m)
SandSiltClay
L10R 3/6544421.180.407.6613.400.18
G10YR 8/1742421.280.356.576.760.23
V10YR 8/24533221.290.254.6313.770.07
* Munsell table, dried samples.
Table 2. Radioactivity in Bq/kg.
SampleMass (g)UThRaKI(r)
L11.3373.147.271.58780.79
G12.0045.755.863.43080.59
V12.5387.156.283.32530.63
I(r) = Ra/300 + Th/200 + K/3000 (radioactivity index).
Table 3. Classification of frequencies identified in the IR spectra recorded from G and V materials up to a 1200 mm particle diameter.
Quartz(1100–800) cm−1 Si–O valence vibration
G: 1101.87, 1033.42, 1008.12, and 913 cm−1
V: 1007.43, 1033.42, and 1104 cm−1
 
(800–600) cm−1 Si–Si valence vibration
G: 798.01, 779.08, and 694.70 cm−1
V: 798.41, 779.44, and 694.81 cm−1
 
(460–430) cm−1 Si–O–Si distortion
G: 431.00 and 470.12 cm−1
V 430.68 and 469.75 cm−1
Kaolinite(3600–3700) cm−1 O–Al–OH and O–Si–OH stretching
G: 3697.78, 3625.06, and 3622.35 cm−1
V: 3698.02, 3653.25, and 3622.83 cm−1
 
(1120–1003) cm−1 Si–O valence vibration
G: 1008.12, 1033.42, and 1101.87 cm−1
V: 1007.43, 1033.42, and 1104.47 cm−1
 
(936–818) cm−1 M–O–H distortion
G: 913 cm−1
V: 913.21 cm−1
 
(587–430) Si–O–M and M–O–H vibration
G: 431, 470.12, and 536.68 cm−1
V: 430.68, 469.75, and 536.70 cm−1
Disclaimer/Publisher’s Note: The statements, opinions and data contained in all publications are solely those of the individual author(s) and contributor(s) and not of MDPI and/or the editor(s). MDPI and/or the editor(s) disclaim responsibility for any injury to people or property resulting from any ideas, methods, instructions or products referred to in the content.