
Unlocking Manufacturing Sustainability: Energy Efficiency Opportunities through the US Department of Energy’s Better Plants Program Energy Treasure Hunts (2023–2024)


Abstract
:1. Introduction
2. Methods
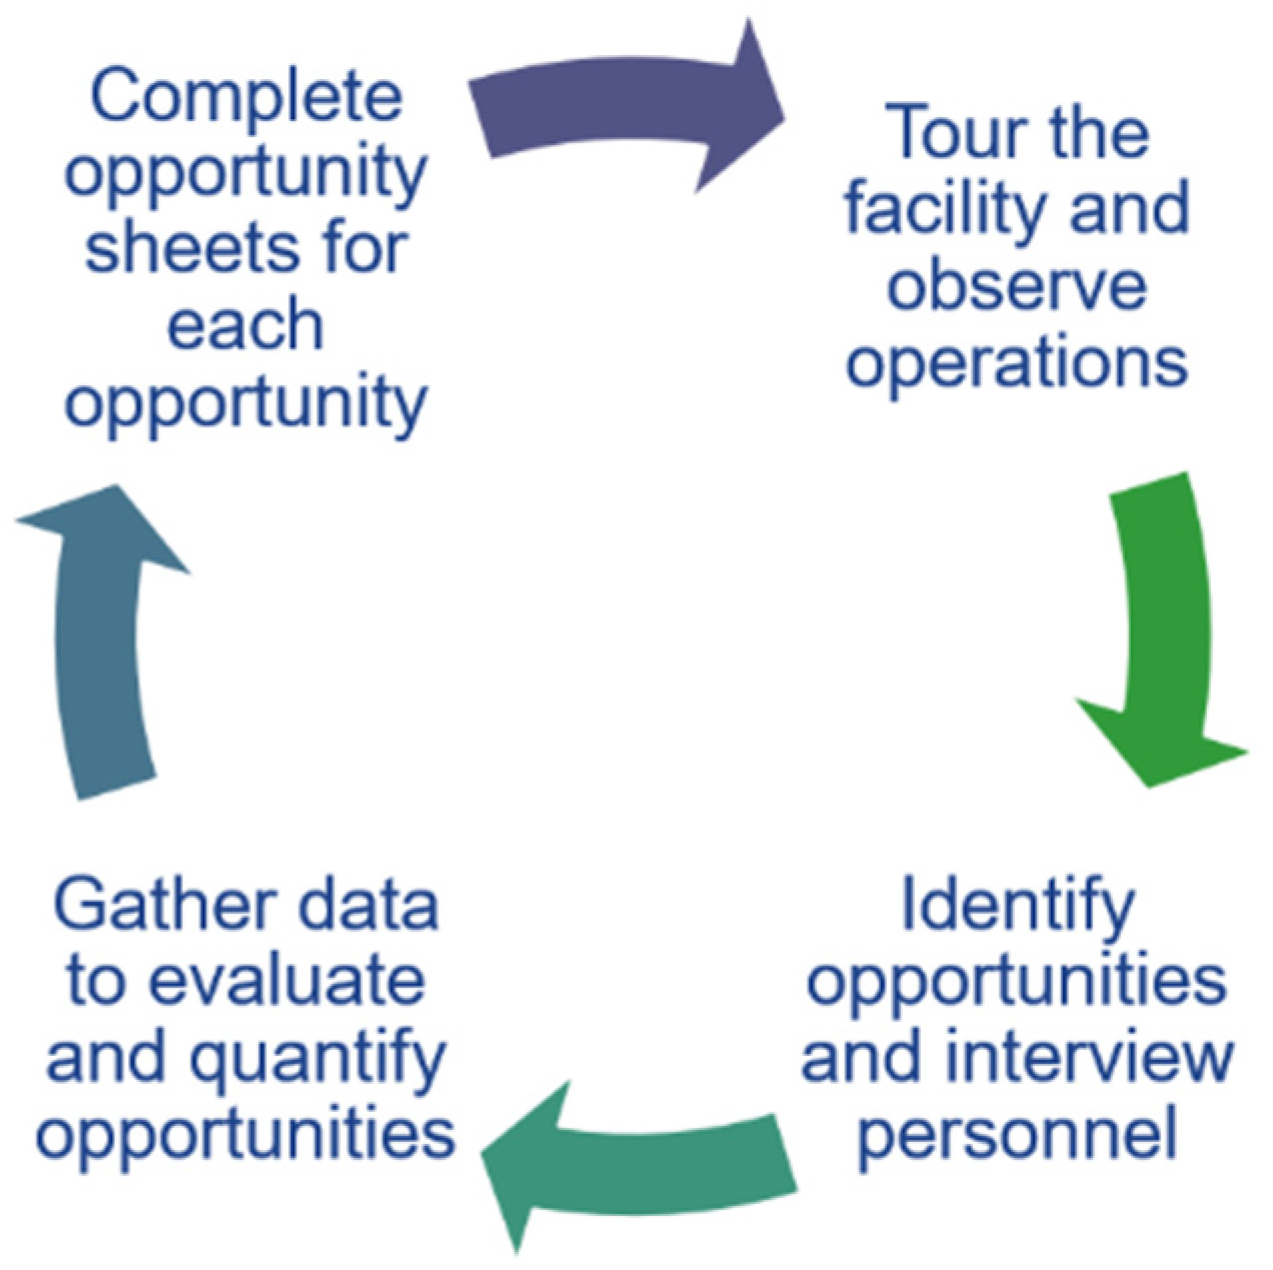
2.1. What Does an Energy Treasure Hunt Entail?
2.1.1. Phase One: Preparation
2.1.2. Phase Two: Event
2.1.3. Phase Three: Follow-Up
2.2. Analysis Methods for Reviewing DOE’s Better Plants Energy Treasure Hunt Events
3. Results
4. Future Work
5. Conclusions
Author Contributions
Funding
Institutional Review Board Statement
Informed Consent Statement
Data Availability Statement
Acknowledgments
Conflicts of Interest
Appendix A

| Energy System | Count | Total Energy Savings | Total Emissions Savings | Total Cost Savings |
|---|---|---|---|---|
| MMBtu | tCO2e | USD | ||
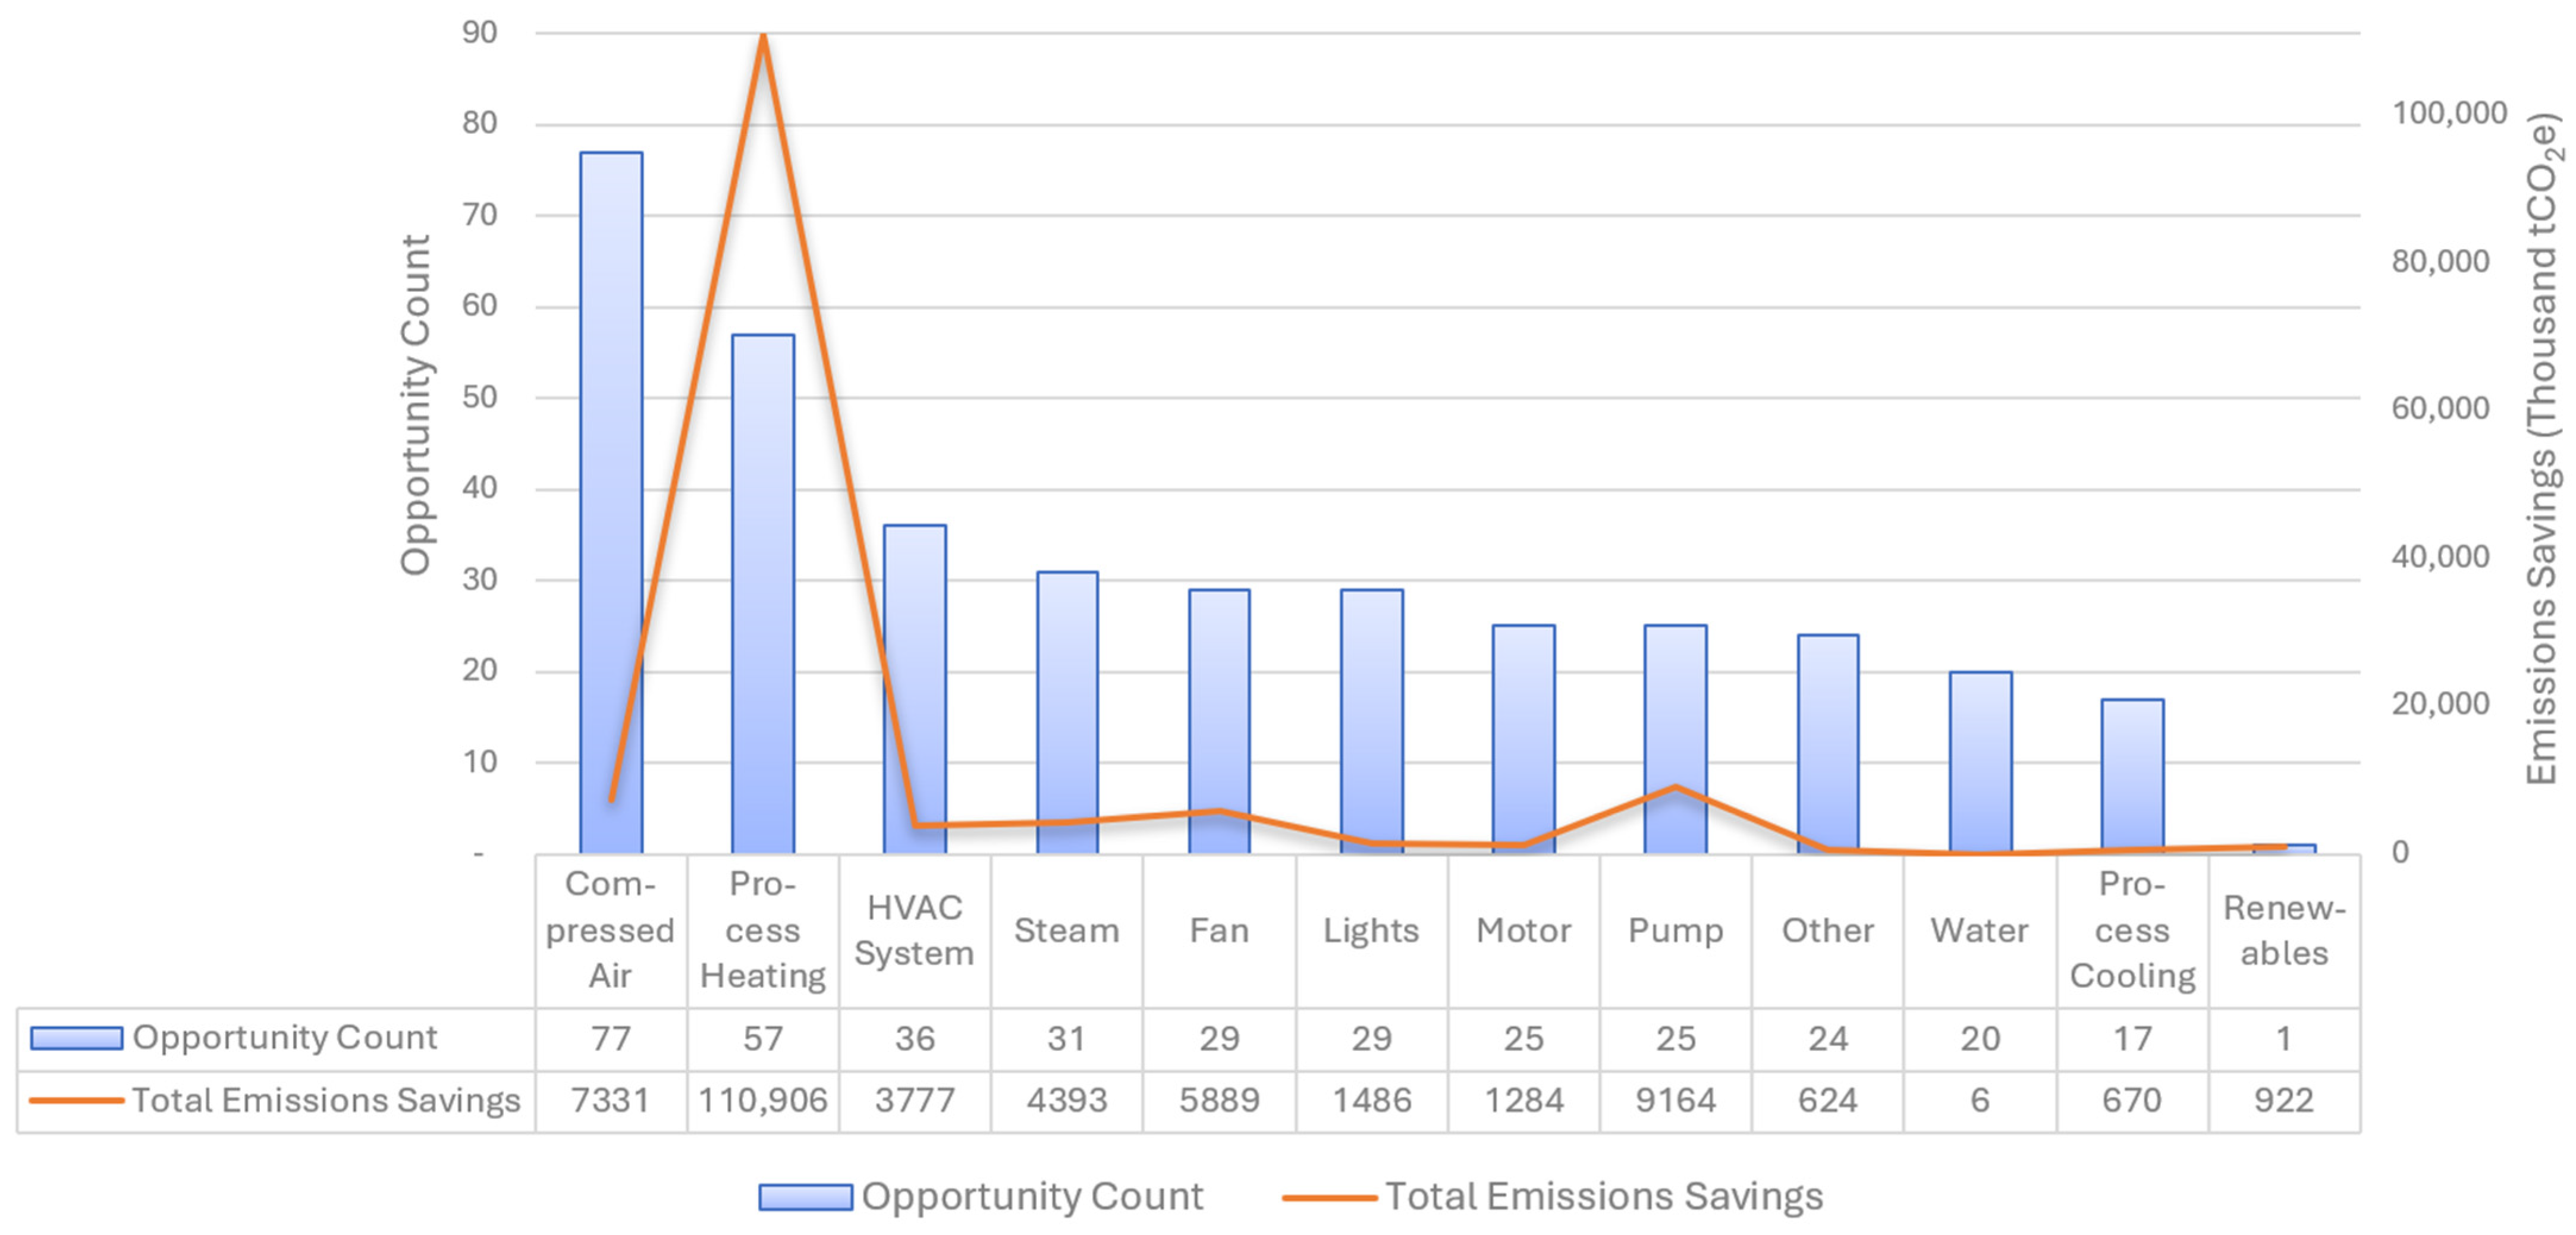
| Compressed Air | 77 | 68,484 | 7,330,967 | 1,183,536 |
| Process Heating | 57 | 2,085,134 | 110,905,680 | 10,229,991 |
| HVAC System | 36 | 38,506 | 3,776,883 | 635,468 |
| Steam | 31 | 82,709 | 4,392,675 | 422,021 |
| Fan | 29 | 57,104 | 5,889,084 | 935,467 |
| Lights | 29 | 13,520 | 1,485,970 | 242,543 |
| Motor | 25 | 11,685 | 1,284,223 | 209,613 |
| Pump | 25 | 83,384 | 9,164,409 | 1,689,194 |
| Other | 24 | 5676 | 623,840 | 101,824 |
| Water | 20 | 51 | 5585 | 280,630 |
| Process Cooling | 17 | 6094 | 669,823 | 124,898 |
| Renewables | 1 | 8392 | 922,374 | 150,552 |
Appendix B
| ARC | ARC Description | Count | Total Energy Savings | Total Emissions Savings | Total Cost Savings |
|---|---|---|---|---|---|
| MMBtu | tCO2e | USD | |||
| 2.6218 | Turn off equipment when not in use | 78 | 209,850 | 16,769,482 | 2,318,153 |
| 2.4236 | Eliminate leaks in inert gas and compressed air lines/valves | 44 | 16,044 | 1,763,314 | 287,812 |
| 2.4146 | Use adjustable frequency drive or multiple speed motors on existing system | 25 | 66,987 | 7,362,328 | 1,201,694 |
| 2.7142 | Utilize higher efficiency lamps and/or ballasts | 24 | 12,702 | 1,396,064 | 227,868 |
| 2.1131 | Repair faulty insulation in furnaces, boilers, etc | 15 | 85,241 | 4,534,097 | 420,360 |
| 2.2135 | Repair and eliminate steam leaks | 15 | 34,813 | 1,848,918 | 186,886 |
| 2.2511 | Insulate bare equipment | 14 | 21,525 | 1,193,204 | 116,704 |
| 2.7224 | Reduce space conditioning during non-working hours | 11 | 3871 | 374,131 | 57,652 |
| 2.4231 | Reduce the pressure of compressed air to the minimum required | 7 | 1564 | 171,882 | 28,055 |
| 2.7313 | Recycle air for heating, ventilation and air conditioning | 7 | 28,952 | 2,731,563 | 415,870 |
| 2.2414 | Use waste heat from hot flue gases to preheat | 6 | 84,653 | 4,495,921 | 413,783 |
| 2.4239 | Eliminate or reduce compressed air usage | 6 | 403 | 44,276 | 7227 |
| 2.7447 | Install vinyl strip/high speed/air curtain doors | 6 | 3793 | 249,678 | 29,626 |
| 3.4154 | Eliminate leaks in water lines and valves | 6 | - | - | 6664 |
| 2.1113 | Reduce combustion air flow to optimum | 5 | 77,563 | 4,119,371 | 379,127 |
| 2.1116 | Improve combustion control capability | 5 | 1,584,916 | 84,174,889 | 7,747,053 |
| 3.4116 | Meter recycled water (to reduce sewer charges) | 5 | - | - | 242,656 |
| 3.4151 | Minimize water usage | 5 | - | - | 70,976 |
| 2.1121 | Use insulation in furnaces to facilitate heating/cooling | 4 | 43,419 | 2,359,303 | 224,485 |
| 2.1133 | Adjust burners for efficient operation | 4 | 10,859 | 592,722 | 56,757 |
| 2.2694 | Use highest temperature for chilling or cold storage | 4 | 442 | 48,537 | 7922 |
| 2.2113 | Repair or replace steam traps | 3 | 17,078 | 907,013 | 83,477 |
| 2.2127 | Flash condensate to produce lower pressure steam | 3 | 3052 | 162,092 | 15,938 |
| 2.2531 | Re-size charging openings or add movable cover or door | 3 | 2357 | 125,180 | 11,521 |
| 2.4322 | Use or replace with energy efficient substitutes | 3 | 635 | 69,779 | 11,389 |
| 2.6211 | Conserve energy by efficient use of vending machines | 3 | 32 | 3521 | 575 |
| 2.6231 | Utilize controls to operate equipment only when needed | 3 | 437 | 48,050 | 7843 |
| 2.7135 | Install occupancy sensors | 3 | 658 | 72,332 | 11,806 |
| 2.7231 | Use radiant heater for spot heating | 3 | 1974 | 137,228 | 17,094 |
| 3.4146 | Change method of deionized water production | 3 | 78 | 8541 | 1394 |
| 3.4156 | Use flow control valves on equipment to optimize water use | 3 | - | - | 43,288 |
| 2.1233 | Analyze flue gas for proper air/fuel ratio | 2 | 42,194 | 2,240,923 | 206,244 |
| 2.2211 | Use optimum temperature | 2 | 4995 | 265,284 | 87,488 |
| 2.2422 | Use waste heat from hot flue gases to generate steam | 2 | 7651 | 406,345 | 37,542 |
| 2.2514 | Cover open tanks 2.2515 use optimum thickness insulation | 2 | 5148 | 283,554 | 27,492 |
| 2.2614 | Use cooling tower or economizer to replace chiller cooling | 2 | 1685 | 185,208 | 30,230 |
| 2.4111 | Utilize energy-efficient belts and other improved mechanisms | 2 | 2189 | 240,541 | 39,262 |
| 2.4222 | Install adequate dryers on air lines to eliminate blowdown | 2 | 7373 | 810,301 | 132,259 |
| 2.4323 | Use optimum size and capacity equipment | 2 | 414 | 45,450 | 7418 |
| 2.7124 | Make a practice of turning off lights when not needed | 2 | 160 | 17,574 | 2868 |
| 2.8117 | Install sub-metering equipment | 2 | 108 | 11,916 | 1945 |
| 3.4114 | Replace city water with recycled water via cooling tower | 2 | - | - | 11,232 |
| 3.7222 | Minimize overflows by installing level controls | 2 | - | - | 97,951 |
| 2.1134 | Eliminate leaks in combustible gas lines | 1 | 6354 | 337,461 | 31,058 |
| 2.1135 | Repair furnaces and oven doors so that they seal efficiently | 1 | 6 | 319 | 29 |
| 2.2437 | Recover waste heat from equipment | 1 | 3449 | 183,176 | 16,859 |
| 2.2622 | Replace existing chiller with high efficiency model | 1 | 2771 | 304,560 | 49,711 |
| 2.2625 | Chill water to the highest temperature possible | 1 | 185 | 20,339 | 3320 |
| 2.2691 | Shut off cooling if cold outside air will cool process | 1 | 2565 | 281,898 | 46,012 |
| 2.4133 | Use most efficient type of electric motors | 1 | 6 | 626 | 102 |
| 2.4224 | Upgrade controls on compressors | 1 | 359 | 39,420 | 6434 |
| 2.4226 | Use/purchase optimum sized compressor | 1 | 20,427 | 2,245,050 | 366,442 |
| 2.4237 | Substitute compressed air cooling with water or air cooling | 1 | 12 | 1293 | 211 |
| 2.5123 | Reduce fluid flow rates | 1 | 500 | 54,947 | 8969 |
| 2.6127 | Maintain air filters by cleaning or replacement | 1 | 145 | 15,884 | 2593 |
| 2.6212 | Turn off equipment during breaks, reduce operating time | 1 | 615 | 67,544 | 11,025 |
| 2.6232 | Install set-back timers | 1 | 13 | 1418 | 231 |
| 2.6241 | Reduce temperature of process equipment when on standby | 1 | 8 | 885 | 144 |
| 2.6242 | Minimize operation of equipment maintained in standby condition | 1 | 602 | 66,145 | 10,796 |
| 2.7229 | Air condition only space necessary | 1 | 6 | 649 | 106 |
| 2.7312 | Minimize use of outside make-up air for ventilation except when used for economizer cycle | 1 | 2159 | 237,300 | 38,733 |
| 2.7492 | Use proper thickness of insulation on building envelope | 1 | 1855 | 98,519 | 9067 |
| 2.9114 | Use solar heat to make electricity | 1 | 8392 | 922,374 | 150,552 |
| 3.4152 | Carefully control water level in mass finishing equipment | 1 | 24,500 | 1,301,195 | 119,756 |
References
- U.S. Energy Information Administration (EIA). U.S. Energy Consumption by Source and Sector, 2023. April 2024. Available online: https://www.eia.gov/totalenergy/data/monthly/pdf/flow/total_energy_2023.pdf (accessed on 15 July 2024).
- Sustainable Manufacturing. United States Environmental Protection Agency. 2 January 2024. Available online: https://www.epa.gov/sustainability/sustainable-manufacturing (accessed on 15 July 2024).
- H.R.5376—Inflation Reduction Act, United States of America, 2022. Available online: https://www.congress.gov/bill/117th-congress/house-bill/5376 (accessed on 30 July 2024).
- Intergovernmental Panel on Climate Change (IPCC) (Ed.) Climate Change 2022—Mitigation of Climate Change: Working Group III Contribution to the Sixth Assessment Report of the Intergovernmental Panel on Climate Change; Cambridge University Press: Cambridge, MA, USA, 2023. [Google Scholar]
- NewClimate Institute; Oxford Net Zero; Energy and Climate Intelligence UInit; Data-Driven EnviroLab. Net Zero Stocktake 2023. 2023. Available online: https://ca1-nzt.edcdn.com/Reports/Net_Zero_Stocktake_2023.pdf?v=1696255114 (accessed on 30 July 2024).
- United Nations Environment Programme. Emissions Gap Report 2023: Broken Record—Temperatures Hit New Highs, Yet World Fails to Cut Emissions (Again). November 2023. Available online: https://wedocs.unep.org/20.500.11822/43922 (accessed on 2 July 2024).
- United States of America. Net Zero Tracker. Available online: https://zerotracker.net/countries/united-states-of-america-cou-0112 (accessed on 2 July 2024).
- United States Environmental Protection Agency. Inventory of U.S. FGreenhouse Gas Emissions and Sinks. 11 April 2024. Available online: https://www.epa.gov/ghgemissions/inventory-us-greenhouse-gas-emissions-and-sinks (accessed on 1 July 2024).
- U.S. Department of Energy. DOE Industrial Decarbonization Roadmap. Available online: https://www.energy.gov/industrial-technologies/doe-industrial-decarbonization-roadmap (accessed on 2 July 2024).
- Sundaramoorthy, S.; Kamath, D.; Nimbalkar, S.; Price, C.; Wenning, T.J. Energy Efficiency as a Foundational Technology Pillar for Industrial Decarbonization. Sustainability 2023, 15, 9487. [Google Scholar] [CrossRef]
- Worrell, E.; Boyd, G. Bottom-up Estimates of Deep Decarbonization of U.S. Manufacturing in 2050. J. Clean. Prod. 2022, 330, 129758. [Google Scholar] [CrossRef]
- Kim, J.; Sovacool, B.K.; Bazilian, M.; Griffiths, S.; Yang, M. Energy, Material, and Resource Efficiency for Industrial Decarbonization: A Systematic Review of Sociotechnical Systems, Technological Innovations, and Policy Options. Energy Res. Soc. Sci. 2024, 112, 103521. [Google Scholar] [CrossRef]
- U.S. Department of Energy. Better Plants. Available online: https://betterbuildingssolutioncenter.energy.gov/better-plants/about (accessed on 2 July 2024).
- U.S. Department of Energy. Better Climate Challenge. Available online: https://betterbuildingssolutioncenter.energy.gov/climate-challenge (accessed on 2 July 2024).
- U.S. Department of Energy. Better Plants In-Plant Trainings (INPLTs). Available online: https://betterbuildingssolutioncenter.energy.gov/plant-trainings-inplts (accessed on 17 June 2024).
- U.S. Environmental Protection Agency. What Is an Energy Treasure Hunt? 16 September 2020. Available online: https://energystar.my.site.com/PortfolioManager/s/article/What-is-an-Energy-Treasure-Hunt-1600088545836 (accessed on 1 August 2024).
- Nimbalkar, S.U.; Brockway, W.F.; Lung, B.; Thirumaran, K.; Wenning, T.J. U.S. DOE’s Energy Treasure Hunt Exchange In-Plant Trainings—DOE Resources, Early Results and Lessons Learned. In Proceedings of the Industrial Energy Technology Conference (IETC), New Orleans, LA, USA, 20–22 June 2017. [Google Scholar]
- Androniceanu, A.; Enache, I.-C.; Walter, E.-N.; Raduica, F.-F. Increasing Energy Efficiency Based on the Kaizen Approach. Energies 2023, 16, 1930. [Google Scholar] [CrossRef]
- Venkatesan, T.M.I.; Kundu, G.K. An Empirical Study on Kaizen Events in Indian Small and Medium Enterprises. Int. J. Sci. Oper. Manag. 2020, 37, 197–219. [Google Scholar] [CrossRef]
- U.S. Enviromental Protection Agency ENERGY STAR®. Energy Treasure Hunt Guide: Simple Steps to Finding Energy Savings; U.S. Environmental Protection Agency (EPA) Office of Atmospheric Programs: Washington, DC, USA, 2014.
- ISO50001:2018; Energy Management Systems—Requirements with Guidance for Use. International Organization for Standardization: Gevena, Switzerland, 2018.
- Slovensky, M.; Belmont, S. NREL Lessons Learned in the Pursuit of ISO 50001; National Renewable Energy Laboratory: Golden, CO, USA, 2019.
- Grennier, M. Culture Building with ENERGY STAR® Energy Treasure Hunts. Compressed Air Best Practices Magazine. Available online: https://www.airbestpractices.com/energy-manager/corporate-sustainability-programs/culture-building-energy-star%C2%AE-energy-treasure-hunts (accessed on 22 October 2019).
- US Energy Information Administration (EIA). 2018 MECS Flipbook. 2021. Available online: https://www.eia.gov/consumption/manufacturing/pdf/MECS%202018%20Results%20Flipbook.pdf (accessed on 15 July 2024).
- 2023 Better Practice Award Poster—General Motors: GM Supplier Energy Treasure Maps. March 2023. Available online: https://betterbuildingssolutioncenter.energy.gov/sites/default/files/attachments/General_Motors_Summit.pdf (accessed on 1 August 2024).
- Implementation Model—Johnson Controls: Supplier Efficiency Program. Available online: https://betterbuildingssolutioncenter.energy.gov/implementation-models/johnson-controls-supplier-efficiency-program (accessed on 1 August 2024).
- US Department of Energy. Better Plants Energy Treasure Hunts. Available online: https://betterbuildingssolutioncenter.energy.gov/better-plants/energy-treasure-hunts (accessed on 1 August 2024).
- Botts, A.; Cox, D.; Lemar, P.; Thirumaran, K.; Wenning, T. US Department of Energy Federal Energy Management Program Energy Treasure Hunt Toolkit; US Department of Energy: Oak Ridge, TN, USA, 2024.
- Diagnostic Tools. Available online: https://betterbuildingssolutioncenter.energy.gov/better-plants/diagnostic-tools (accessed on 17 June 2024).
- Armstrong, K.; Botts, A.; Wenning, T. MEASUR Up: Identifying Opportunities in a Facility. Facil. Manag. J. 2023. Available online: https://fmj.ifma.org/articles/measur-up (accessed on 30 July 2024).
- Accawi, G.; Root, R.M.; Blondheim, N.; Howard, D.; Hernandez, R.; Armstrong, K.; Cranfill, K.; Shires, P.; Kaminski, M.; Hadden, J.; et al. MEASUR—Manufacturing Energy Assessment Software for Utility Reduction; US DOE Office of Energy Efficiency and Renewable Energy (EERE), Energy Efficiency Office. Advanced Manufacturing Office: Oak Ridge, TN, USA, 2022.
- IPCC. Climate Change 2014: Synthesis Report. Contribution of Working Groups I, II, and III to the Fifth Assessment Report of the Intergovernmental Panel on Climate Change; Core Writing Team, Pachauri, R.K., Meyer, L.A., Eds.; IPCC: Geneva, Switzerland, 2014; p. 151. [Google Scholar]
- GHG Emission Factors Hub. United States Environmental Protection Agency. 2023. Available online: https://www.epa.gov/climateleadership/ghg-emission-factors-hub (accessed on 15 June 2024).
- PVWatts Calculator. National Renewable Energy Laboratory (NREL). Available online: https://pvwatts.nrel.gov/pvwatts.php (accessed on 15 July 2024).
- Database of State Incentives for Renewables & Efficiency (DSIRE). NC Clean Energy Technology Center. Available online: https://www.dsireusa.org/ (accessed on 15 July 2024).


| Term | Results |
|---|---|
| Total number of events | 17 |
| Total number of opportunities identified | 371 |
| Total identified water savings (kgal) | 24.42 million |
| Total identified energy savings (MMBtu) | 2.46 million |
| Total identified emissions savings (tCO2e) | 146.45 million |
| Total identified cost savings | $16.2 million |
| Utility Type | Count (%) | Utility Savings | Utility Units | Total Energy Savings | Total Emissions Savings | Total Cost Savings |
|---|---|---|---|---|---|---|
| MMBtu | tCO2e | USD | ||||
| Electricity | 261 (70%) | 81,333,922 | kWh | 277,511 | 30,500,221 | 4,978,309 (31%) |
| Natural gas | 78 (21%) | 2,183,229 | MMBtu | 2,183,229 | 115,951,292 | 10,671,601 (66%) |
| Water | 32 (9%) | 24,422,309 | kgal | - | 555,827 (3%) | |
| Grand total | 371 | 2,460,740 | 146,451,513 | 16,205,737 |
| Energy System | Count (%) | Average Energy Savings | Total Energy Savings | Average Emissions Savings | Total Emissions Savings | Average Cost Savings | Total Cost Savings |
|---|---|---|---|---|---|---|---|
| MMBtu | tCO2e | USD | |||||
| Compressed Air | 77 (21%) | 889 | 68,484 | 95,207 | 7,330,967 | 15,371 | 1,183,536 |
| Process Heating | 57 (15%) | 37,235 | 2,085,134 | 1,945,714 | 110,905,680 | 179,474 | 10,229,991 |
| HVAC System | 36 (10%) | 1167 | 38,506 | 104,913 | 3,776,883 | 17,652 | 635,468 |
| Steam | 31 (8%) | 3308 | 82,709 | 141,699 | 4,392,675 | 13,614 | 422,021 |
| Fan | 29 (8%) | 1969 | 57,104 | 203,072 | 5,889,084 | 32,257 | 935,467 |
| Lights | 29 (8%) | 466 | 3,520 | 51,240 | 1,485,970 | 8364 | 242,543 |
| Motor | 25 (7%) | 467 | 11,685 | 51,369 | 1,284,223 | 8385 | 209,613 |
| Pump | 25 (7%) | 3625 | 83,384 | 366,576 | 9,164,409 | 67,568 | 1,689,194 |
| Water | 20 * (5%) | 51 | 51 | 279 | 5585 | 14,032 | 280,630 |
| Process Cooling | 17 (5%) | 381 | 6094 | 39,401 | 669,823 | 7347 | 124,898 |
| Renewables | 1 (0.3%) | 8392 | 8392 | 922,374 | 922,374 | 150,552 | 150,552 |
| Other | 24 (6%) | 237 | 5676 | 25,993 | 623,840 | 4243 | 101,824 |
| Misc. plug loads | 10 (3%) | 47 | 282 | 5166 | 30,993 | 843 | 5059 |
| Computers/office Plug loads | 6 (3%) | 470 | 4703 | 51,686 | 516,864 | 8436 | 84,364 |
| Vacuum systems | 4 (1%) | 162 | 647 | 17,787 | 71,146 | 2903 | 11,613 |
| Vending | 4 (1%) | 11 | 44 | 1209 | 4837 | 197 | 789 |
| Grand total | 371 | 2,460,740 | 146,451,513 | 16,205,737 | |||
| ARC | ARC Description | Count (%) | Total Energy Savings | Total Emissions Savings | Total Cost Savings |
|---|---|---|---|---|---|
| MMBtu | tCO2e | USD | |||
| 2.6218 | Turn off equipment when not in use | 78 (21%) | 209,850 | 16,769,482 | 2,318,153 |
| 2.4236 | Eliminate leaks in inert gas and compressed air lines/valves | 44 (12%) | 16,044 | 1,763,314 | 287,812 |
| 2.4146 | Use adjustable frequency drive or multiple speed motors on existing system | 25 (7%) | 66,987 | 7,362,328 | 1,201,694 |
| 2.7142 | Utilize higher efficiency lamps and/or ballasts | 24 (6%) | 12,702 | 1,396,064 | 227,868 |
| 2.1131 | Repair faulty insulation in furnaces, boilers, etc. | 15 (4%) | 85,241 | 4,534,097 | 420,360 |
Disclaimer/Publisher’s Note: The statements, opinions and data contained in all publications are solely those of the individual author(s) and contributor(s) and not of MDPI and/or the editor(s). MDPI and/or the editor(s) disclaim responsibility for any injury to people or property resulting from any ideas, methods, instructions or products referred to in the content. |
© 2024 by the authors. Licensee MDPI, Basel, Switzerland. This article is an open access article distributed under the terms and conditions of the Creative Commons Attribution (CC BY) license (https://creativecommons.org/licenses/by/4.0/).
Share and Cite
Miera, K.; Botts, A.; Lemar, P.; Kamath, D.; Wenning, T. Unlocking Manufacturing Sustainability: Energy Efficiency Opportunities through the US Department of Energy’s Better Plants Program Energy Treasure Hunts (2023–2024). Sustainability 2024, 16, 7918. https://doi.org/10.3390/su16187918
Miera K, Botts A, Lemar P, Kamath D, Wenning T. Unlocking Manufacturing Sustainability: Energy Efficiency Opportunities through the US Department of Energy’s Better Plants Program Energy Treasure Hunts (2023–2024). Sustainability. 2024; 16(18):7918. https://doi.org/10.3390/su16187918
Chicago/Turabian StyleMiera, Kalie, Alex Botts, Paul Lemar, Dipti Kamath, and Thomas Wenning. 2024. "Unlocking Manufacturing Sustainability: Energy Efficiency Opportunities through the US Department of Energy’s Better Plants Program Energy Treasure Hunts (2023–2024)" Sustainability 16, no. 18: 7918. https://doi.org/10.3390/su16187918