Abstract
As climatic and geographical conditions change in the future, species’ habitats will also change. Phoebe zhennan is a national second-level key protected wild plant in China with extremely high economic value and landscape value. In order to better protect the resources of P. zhennan and achieve the goal of the sustainable development of P. zhennan resources, we predict potential suitable areas for P. zhennan under different scenarios in the future. We collect the current distribution data of P. zhennan, and in combination with nine climate factors and three geographical factors, use the MaxEnt ecological niche model and ArcGIS geographic information system software to predict and analyze potential suitable areas for P. zhennan in different climate scenarios in the future. The result shows that more accurate prediction results can be obtained by using China’s climatic and geographical data before clipping as environmental variables. The precipitation of the warmest quarter and the slope are the main influencing factors in the prediction of potential suitable areas for P. zhennan. The future potential suitable areas for P. zhennan are mainly distributed in the central–southern and southern regions of China, with a tendency to expand towards the Tibet Autonomous Region and the northeast. The suitable habitat area will increase significantly, and the highly suitable habitat area will be more concentrated. These research results can provide valuable references for the effective protection of existing P. zhennan populations, the cultivation of P. zhennan within suitable habitats in the future, the establishment of a P. zhennan reserve, and the promotion of the sustainable utilization of P. zhennan resources.
1. Introduction
Climate plays a decisive role in the distribution of species, and climate change will cause changes in temperature and water availability in the future, which will seriously affect the stability and balance of global vegetation ecosystems [1]. As the global climate changes, the potential distribution areas of species will also change [2]. However, the potential distribution range of species is also greatly influenced by other environmental factors, such as growth environments and habits [3,4]. Therefore, it is important to take geographical factors into account when predicting the response of the potential geographical distribution of a species to climate change, which is of great significance for the protection and sustainable development of species.
Phoebe zhennan S. K. Lee & F. N. Wei is a precious timber species unique to China. It is a national secondary protected endangered species in China and is mainly distributed in the western part of the subtropical evergreen broad-leaved forest area, with a humid climate, abundant rainfall, and an elevation of generally less than 1500 m. According to Hu Shengke [5], man-made interference leads to the deterioration of habitat conditions, which is one of the factors influencing the loss of P. zhennan resources. In addition, natural climate change is likely to further endanger P. zhennan [6]. Climate change may lead to changes in the environmental conditions of its habitat, such as temperature and humidity, which, in turn, would affect the growth and reproduction of P. zhennan. With the increase in greenhouse gas concentrations, the relatively stable subtropical broad-leaved forest may be threatened in the subtropical region due to its vulnerability to climate change, and this will also affect the potential suitable habitat of P. zhennan in the future [7].
The niche model has become a powerful tool for predicting the potential geographic distribution of species. It predicts the potential geographic distribution of a species in an entire research area based on different algorithms, using the distribution records of known species and environmental factors that may affect each species’ distribution [8]. At present, the widely used niche models include Climex [9], Bioclim [10], Domain [11], and MaxEnt [12], among which the MaxEnt (Maximum entropy model) model is the best-performing and most widely applied model [13,14,15,16]. Many scholars have used the MaxEnt model to predict species distribution [17,18,19,20]. For example, Yang Shanyun et al. [21] identified that the main factor affecting the potential suitable habitat distribution of P. zhennan is climate. In addition, Huang Chengshi et al. [22] studied the relationship between P. zhennan and altitude, aspect, and slope. Therefore, in this study, P. zhennan will be used as the research subject, and its potential suitable habitat in China will be predicted under both climate-only conditions and climate–geographic dual conditions using the MaxEnt model, exploring its range of variation and migration trend. The research results will provide a scientific theoretical basis for the formulation of protection measures for P. zhennan, which is of great significance for maintaining the stability of the ecosystem.
2. Materials and Methods
2.1. Species Data
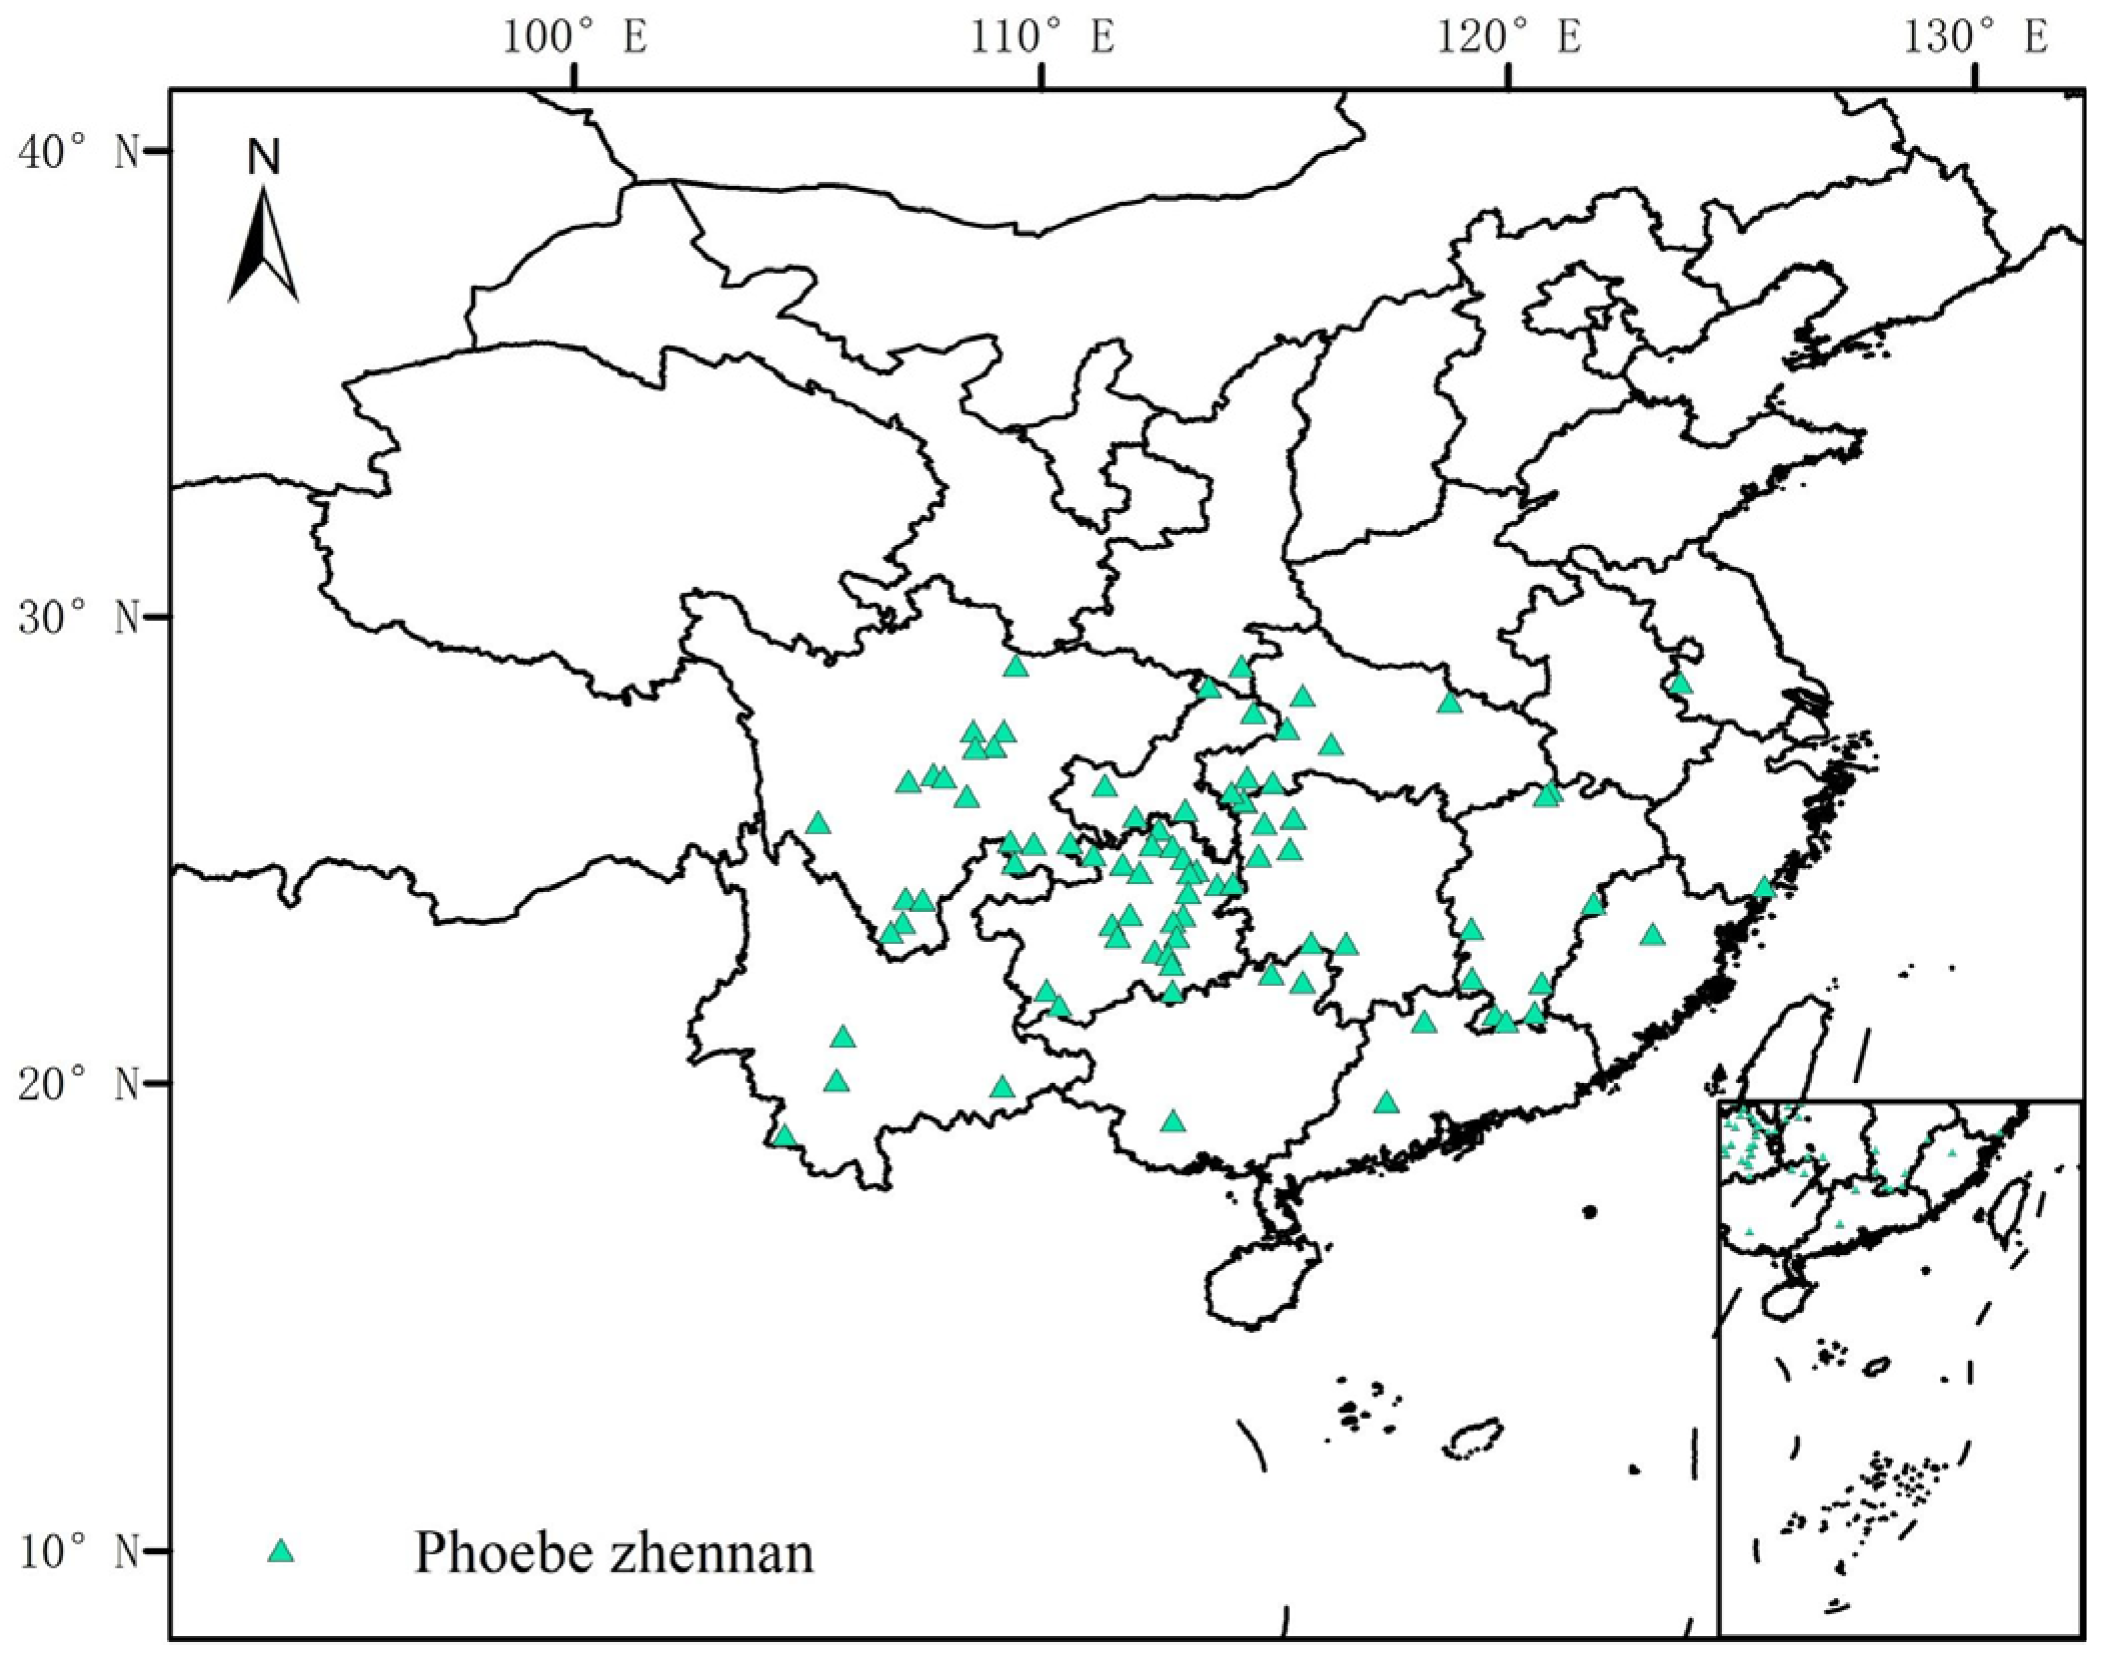
Through the database of the Chinese Virtual Herbarium [23], 436 records of geographical distribution data on P. zhennan were obtained. After removing duplicate and incomplete data, a total of 85 valid data points were determined for this study. The green markers in (Figure 1) represent the sampling distribution points of P. zhennan.
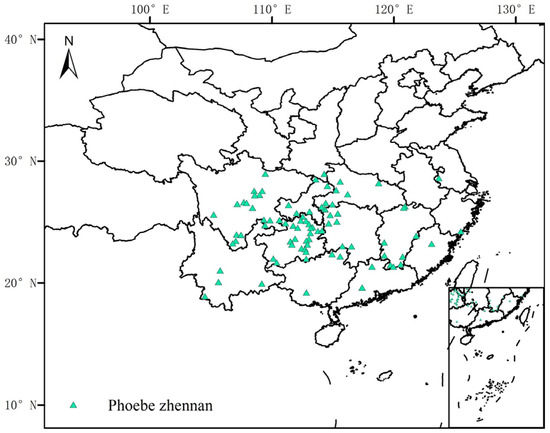
Figure 1.
The distribution of Phoebe zhennan sample points in China.
The current main distribution range of P. zhennan is in southern and southwestern China. The provinces of Sichuan and Guizhou had the greatest amount of P. zhennan, followed by Jiangxi, Hubei, Hunan, and Chongqing. P. zhennan sampling points in other provinces and cities had relatively fewer distribution areas.
2.2. Climate Data
All climate data used in this study were sourced from the WorldClim database [24], with a resolution of 2.5 min. The climate data consisted of 19 specific factors, as shown in Table 1, and their correlation analysis is shown in Figure 2.

Table 1.
Bioclimatic variables.
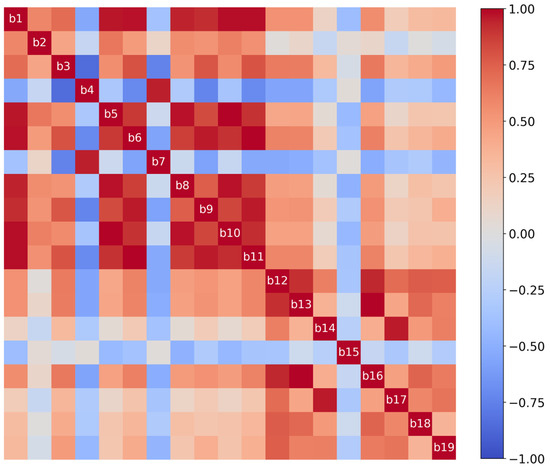
Figure 2.
Results of partial correlation analysis of climate factors.
The correlation coefficient was the Pearson correlation coefficient. Pearson correlation analysis requires two or more variables. The covariance was the basis for the correlation analysis. The covariance calculation formula is as follows (1).
where and are the variable values, and are the average values of the variables, is the sample size, and is the calculated value of the covariance. The larger the value, the more obvious the correlation between the variables, and the correlation was also divided into positive correlation and negative correlation. When the variable value unit was not uniform, the data difference was too large, which led to the correlation analysis not being accurate enough. Therefore, to solve this problem, a correlation analysis could be carried out after standardization. At the same time, the correlation coefficient could be obtained by using covariance divided by standard deviation (2).
where represents the correlation coefficient after the standardization of the dimensionless influence, and the value range was within [−1, 1]. When the absolute value tended towards 1, the correlation was greater, and when it tended towards 0, the correlation was smaller. When the coefficient was negative, this showed a negative correlation. When the coefficient was regular, this showed a positive correlation [25].
According to significance testing, the correlation analysis of climate factors in this study was credible. The absolute value of the correlation coefficient exceeded 0.7, which showed a very close correlation relationship. A coefficient between 0.4 and 0.7 indicated a close relationship, and a coefficient between 0.2 and 0.4 indicated a general relationship. In order to avoid multicollinearity between climatic factors, which would lead to the over-fitting of the model, combined with the environmental needs and survival characteristics of P. zhennan, this study selected the climatic factors with a correlation coefficient absolute value of less than 0.8 as the important influencing factors regarding suitable areas for P. zhennan and retained them. Among them, these factors included annual mean temperature (b1), mean diurnal range (b2), isothermality (b3), max temperature of the warmest month (b5), min temperature of the coldest month (b6), mean temperature of the wettest quarter (b8), precipitation of the driest month (b14), precipitation seasonality (b15), and precipitation of the warmest quarter (b18). Among them, the wettest and warmest quarters refer to the months of June, July, and August.
The future climate scenario data adopted the BCC-CSM2-MR climate system model, using four different shared socioeconomic pathways: SSP1-2.6, SSP2-4.5, SSP3-7.0, and SSP5-8.5. The medium-resolution climate system model, BCC-CSM2-MR, is one of the latest models developed by the National Climate Center. This model significantly improves the simulation of global temperature evolution and the distribution of the annual average precipitation climate in China compared to its earlier version, BCC-CSM1.1m. Therefore, this study used the future data from this model to predict and analyze the potential suitable habitat of P. zhennan.
For the prediction of potential suitable areas for P. zhennan, two time periods, 2041–2060 and 2061–2080, were selected for this study. The reason for choosing these two time periods was that model uncertainty tends to increase with longer prediction times, which can affect the accuracy of model predictions. Given that the focus of this study was on the mid-century sustainability of P. zhennan, these time periods were of particular importance for conservation efforts. Taking these factors into account, we decided to focus on the time periods of 2041–2060 and 2061–2080 to more accurately predict potential suitable areas for P. zhennan.
2.3. Geographic Data
The elevation data were sourced from the historical climate data in the WorldClim database [24]. Data with a variable of 2.5 min were used as the research object, and the data unit was consistent with the variable of climate data. Slope and aspect data were obtained through the “Slope Extraction” and “Aspect Extraction” tools in ArcMap.
2.4. MaxEnt Ecological Niche Model
The MaxEnt niche model is a commonly used research method for predicting the distribution of suitable areas for species. The MaxEnt model used in this study was based on JAVA implementation, and the Maximum Entropy Species Distribution Modeling, Version 3.4.4 software was used to calculate the current suitable areas for P. zhennan in different environmental situations and predict potential suitable areas in the future. The model parameter setting included options to check the created response curves, generate pictures of predictions, and perform jackknife to measure variable importance. Additionally, the settings panel included an option to add a random seed. The random test percentage was set to 25, replicates were set to 10, and other parameters maintained the default values of the MaxEnt model. The prediction results of the MaxEnt model were evaluated by a Receiver Operating Characteristic (ROC) curve, and the Area Under the Curve (AUC) value was used to evaluate the prediction effect. The closer the AUC value was to 1, the better the prediction effect of the model was. Generally, an AUC value less than 0.7 indicated that the prediction effect of the model was very poor, 0.7~0.8 indicated that the prediction effect was relatively accurate, 0.8~0.9 indicated that the prediction effect was very accurate, and 0.9~1.0 indicated that the prediction effect was extremely accurate [26,27,28].
In this study, two different environmental variables were used to predict the future suitable areas for P. zhennan. The first one only considered the influence of climatic factors on suitable areas for P. zhennan. The nine selected climatic factors were used as the biological environment variables of the MaxEnt model to explore the changes in suitable areas for P. zhennan in different climatic conditions. In the second model, the geographical factors were added to the environmental factors, and a total of 12 biological environment variables were used for the MaxEnt model to explore the changes in the potential suitable areas for P. zhennan in the future.
3. Results
3.1. Potential Suitable Areas for P. zhennan under Climatic Conditions Only
3.1.1. Predicted Results of Potential Suitable Areas for P. zhennan
Taking climate as the environmental factor, the future potential distribution of P. zhennan under different climate conditions was obtained by repeatedly calculating the MaxEnt model 10 times and taking the average value. The results showed the predicted distribution of suitable areas for P. zhennan in different socioeconomic scenarios for the periods of 2041–2060 and 2061–2080 (Figure 3). The area of each potential suitable area for P. zhennan was calculated (Table 2). In this study, we used the natural discontinuity point classification method (Jenks) to reclassify the prediction results for P. zhennan. The natural discontinuity point classification method was based on the characteristics of the existing data, and the classification interval was identified. Similar values were more appropriately grouped [29,30]. This classification method maximized the differences between the categories of each suitable area and minimized the differences within these categories [31].

Figure 3.
Potential suitable areas for Phoebe zhennan under climatic conditions.
Table 2.
Potential suitable area sizes under different future scenarios of climatic conditions. (unit: 10,000 square kilometers).
In the future scenario of SSP1-2.6, the potential suitable habitat range of P. zhennan expanded from the southwest of China to the northeast. In the years 2061–2080, the highly suitable habitat in the eastern part of Jiangxi Province and most of Fujian Province transformed into a moderately suitable habitat. In the future scenario of SSP2-4.5, the overall suitable habitat range in the years 2061–2080 was not much different from the previous 20 years, but the distribution of highly suitable habitat areas for P. zhennan shifted from the south to the north and the area increased significantly. In the future scenario of SSP3-7.0, the suitable habitat range for P. zhennan continued to expand towards the northwest of China, and the distribution range of each suitable habitat extended outward. In the future scenario of SSP5-8.5, the range of highly suitable habitat and moderately suitable habitat for P. zhennan in the years 2061–2080 shrunk compared to the years 2041–2060, but the most significant change was a significant decrease in the area of highly suitable habitat, which transformed into moderately suitable habitat, while some moderately suitable habitat transformed into poorly suitable habitat. In summary, the range of highly suitable habitat areas and moderately suitable habitat areas for P. zhennan increased by varying degrees in the future.
3.1.2. Evaluation Indicators for the Prediction of Suitable Areas for P. zhennan
After the completion of the MaxEnt model, the accuracy of the predicted model results could be determined based on the AUC value of the running results. In this study, eight model results were predicted based on climate data for two future time periods, 2041–2060 and 2061–2080, as well as four different shared socioeconomic pathway scenarios.
Figure 4 shows the ROC curves for the period 2061–2080 under the SSP1-2.6 socioeconomic pathway scenario. The area under the ROC curve represents the AUC value. According to the standard for model performance indicators, a higher AUC value closer to 1 and a lower standard deviation indicate a higher accuracy and reliability of the MaxEnt model predictions. In this study, each model was calculated 10 times, and the AUC value was averaged over the 10 calculations.
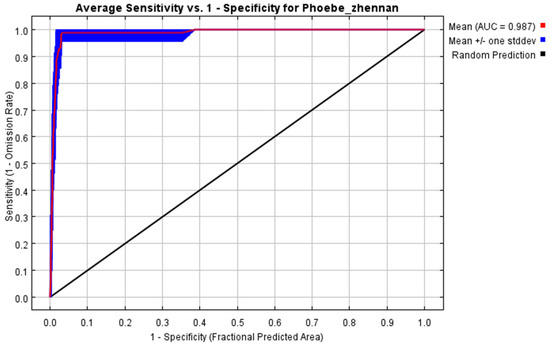
Figure 4.
The ROC curve of distribution model based solely on climatic variables in China.
Table 3 shows the AUC values and standard deviations for the two future time periods under the four different future scenarios. All AUC values were above 0.98, with very small standard deviations. The accuracy of the model’s predictions was very high, indicating that the model’s predictive performance was very good.
Table 3.
AUC values and standard deviations for Phoebe zhennan’s under different future scenarios of climatic conditions.
3.1.3. Analysis of Environmental Factors for the Prediction of P. zhennan’s Suitable Areas
Different climate factors had a significant impact on the suitable habitat areas for P. zhennan, and the results of the knife-cutting method are presented through a bar graph to show the influence of important climate factors on the distribution of P. zhennan. Figure 5 shows the impact of the nine climate factors on the distribution of P. zhennan.
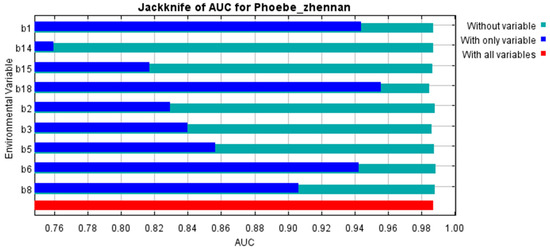
Figure 5.
Variable importance analysis of Phoebe zhennan based solely on climatic factors.
There were few differences in the model environment variable analysis charts of different scenarios and different periods. Therefore, the model environmental variable analysis chart for the period of 2061–2080 for SSP1-2.6 was taken as an example. Based on an analysis of the environmental factors predicted for the years 2041–2060 and 2061–2080 using four different future climate models, the main three climate influencing factors for predicting the potential habitat of P. zhennan were the precipitation of the warmest quarter (b18), the min temperature of coldest month (b6), and the annual mean temperature (b1). If these climate factors were missing in the prediction model for the potential habitat of P. zhennan, it would greatly affect the prediction results. The precipitation of the driest month (b14) was the least influential climate factor in the prediction of the potential habitat of P. zhennan, which was consistent with the characteristics of P. zhennan being shade-tolerant and moisture-loving but not heat-tolerant. Therefore, it could be concluded from the literature that the selected climate factors were reliable for model calculations and suitable for predicting the potential habitat of P. zhennan.
Although the importance of the variables was approximately the same under different socioeconomic scenarios and time periods, the range of suitable variables for P. zhennan growth varied. Since precipitation during the warmest season (June–August) was the most important climatic variable influencing the prediction of potential suitable areas for P. zhennan, the optimal range for this variable is provided. According to the model results, the optimum ranges of precipitation suitable for P. zhennan growth during 2041–2060 under the four different socioeconomic pathways (SSP1-2.6, SSP2-4.5, SSP3-7.0, and SSP5-8.5) were 399.61–2213.20 mm, 401.49–1621.10 mm, 400.21–1254.53 mm, and 407.45–1443.77 mm, respectively. Similarly, for the period of 2061–2080, the optimum ranges of precipitation suitable for the growth of P. zhennan were 403.52–1295 mm, 403.65–1230.36 mm, 393.38–1160.12 mm, and 394.46–2051.29 mm, respectively.
3.2. Potential Suitable Areas for P. zhennan under Climatic and Geographical Conditions
3.2.1. Predicted Results of Potential Suitable Areas for P. zhennan
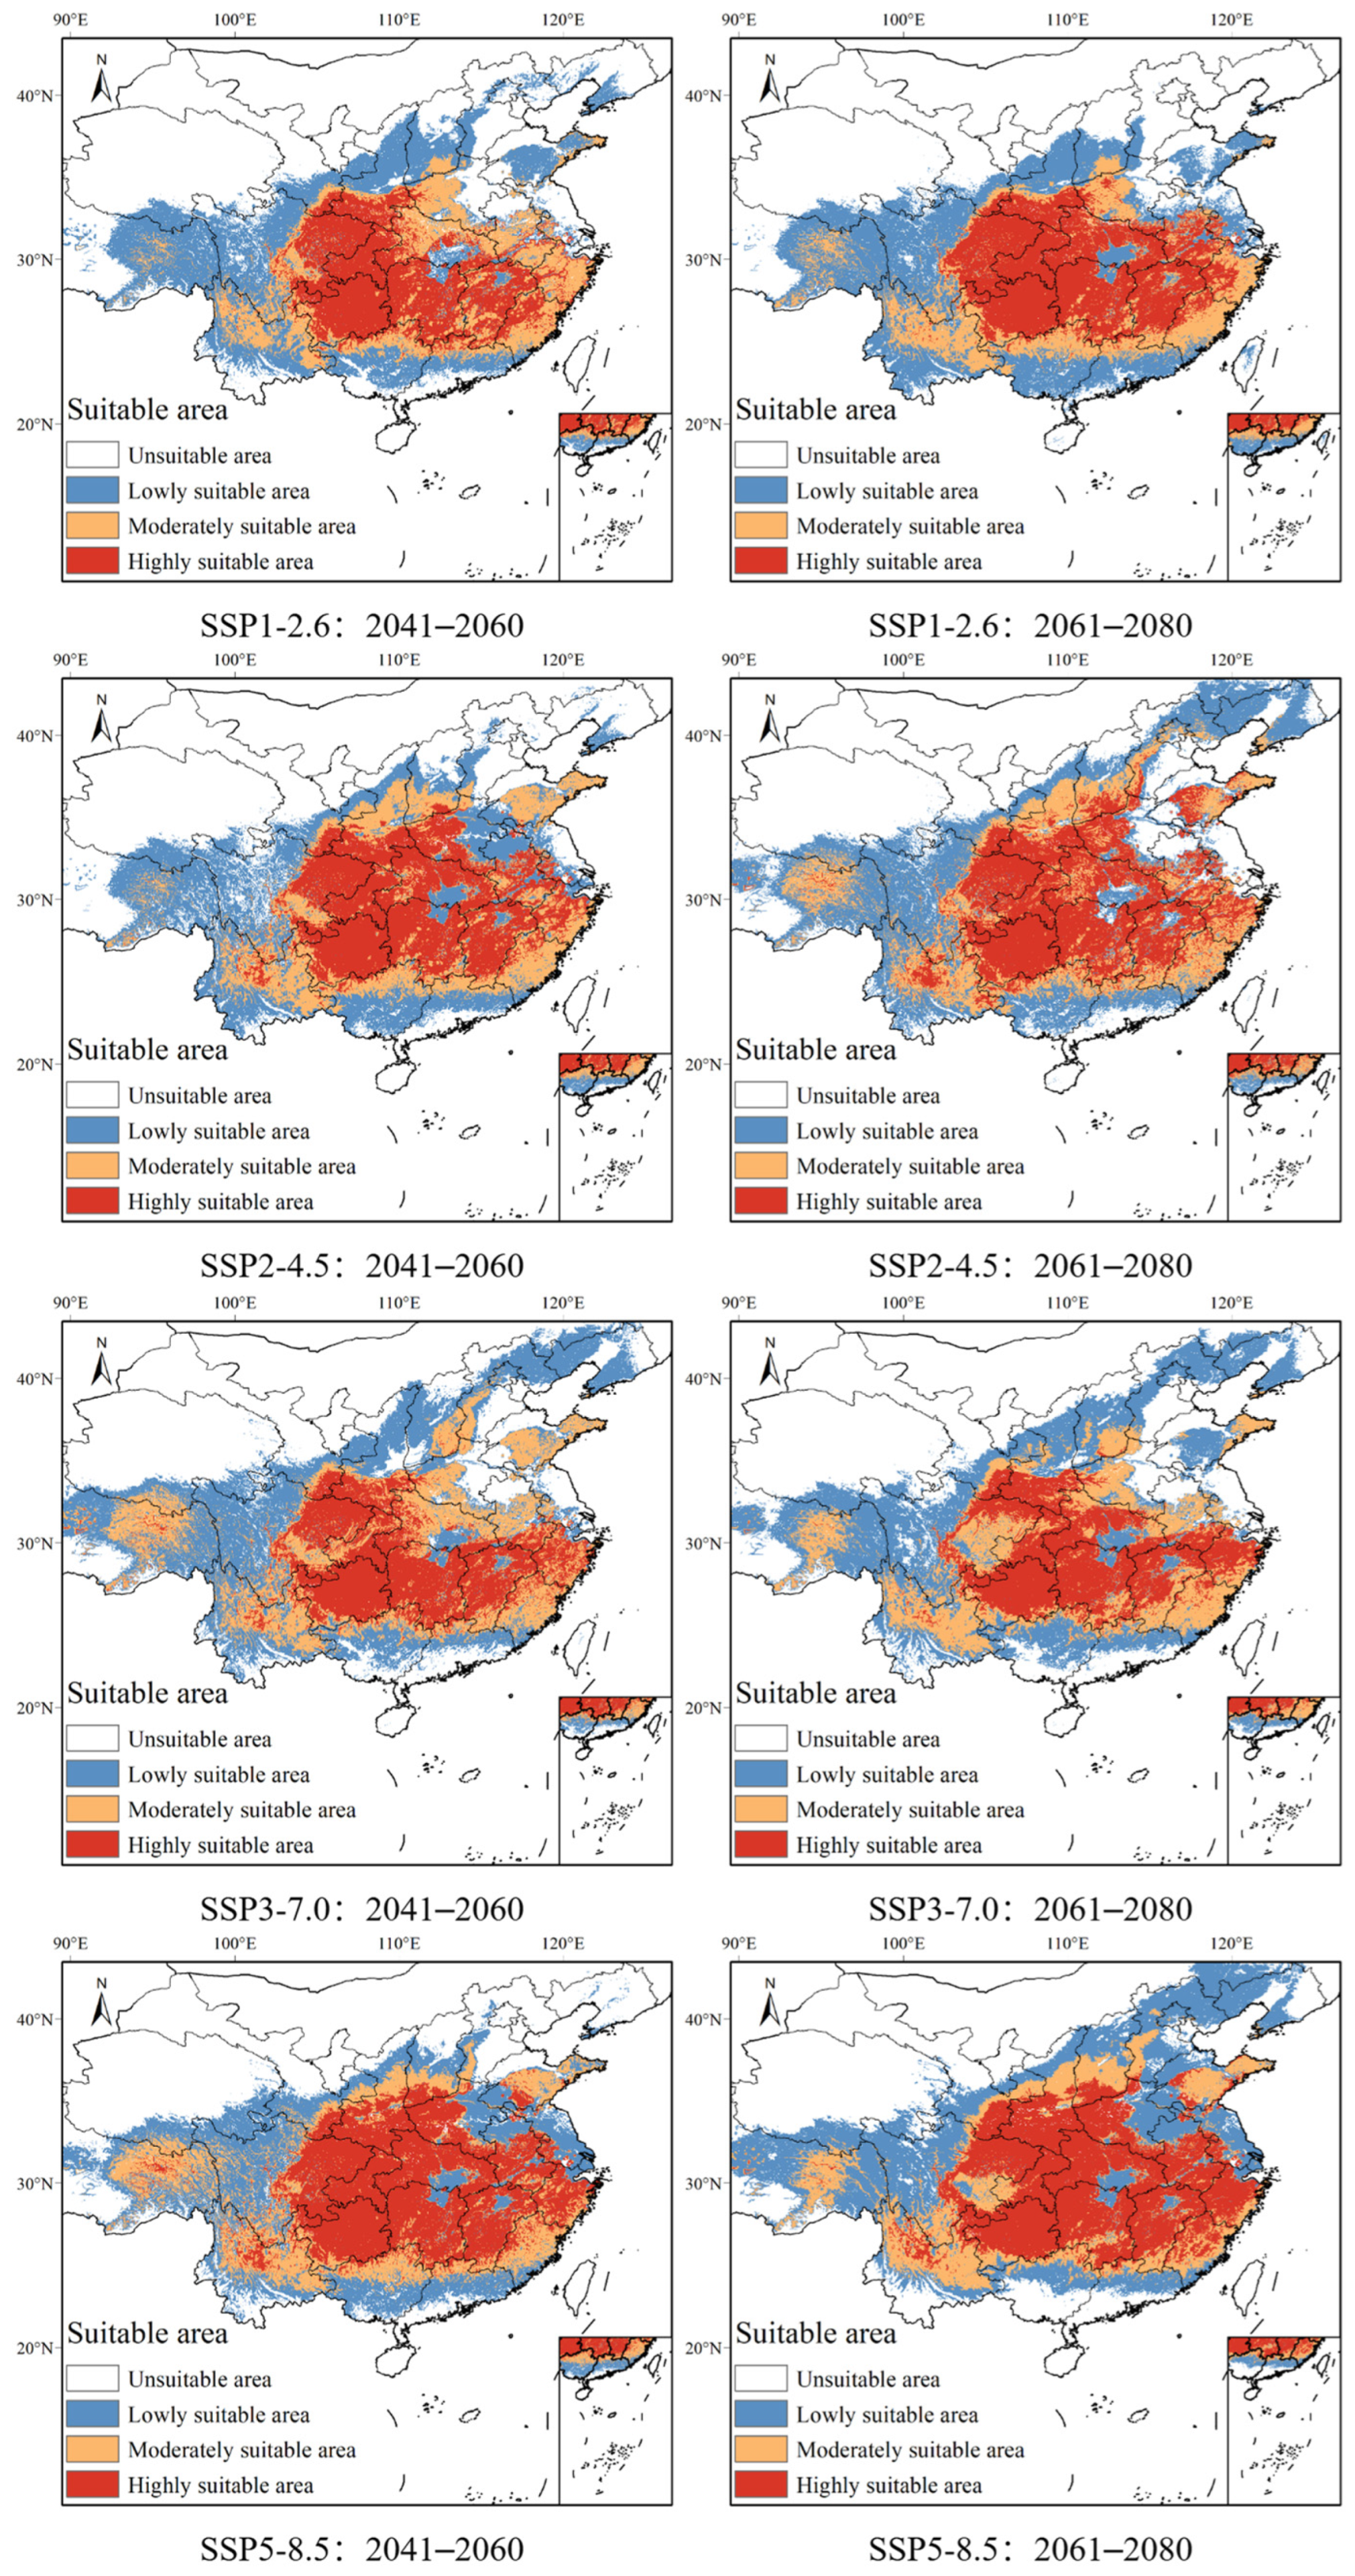
Using climate and geography as environmental factors, the potential distribution of P. zhennan in the future was obtained by calculating the average value through the MaxEnt model 10 times. The results showed the distribution range of suitable habitats for P. zhennan under different future scenarios at different prediction times (Figure 6). Table 4 displays the areas of suitable habitats for each future scenario.
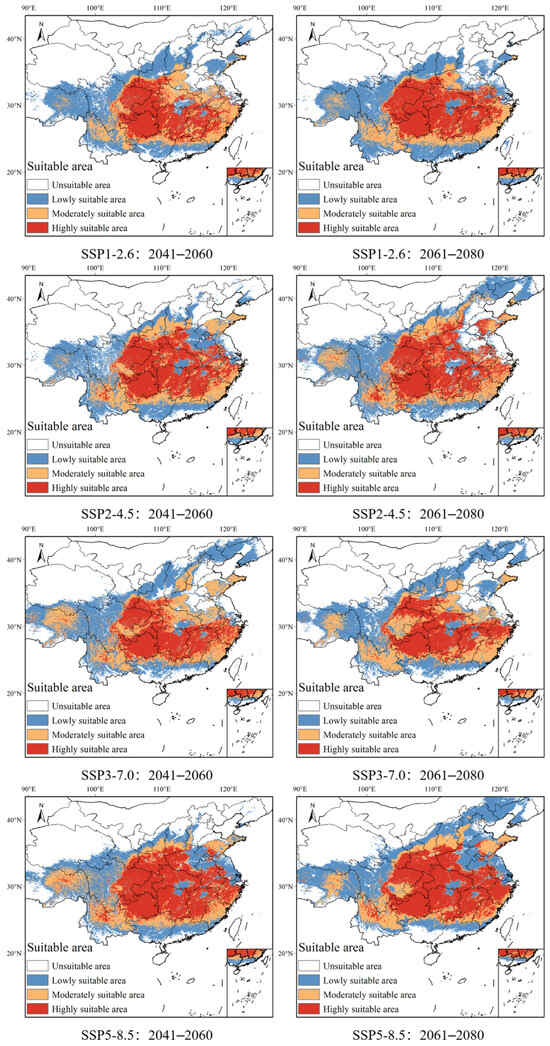
Figure 6.
Potential suitable areas of Phoebe zhennan under climatic and geographical conditions.
Table 4.
Potential suitable area sizes under different future scenarios of climatic and geographical conditions (unit: 10,000 square kilometers).
In the future scenario of SSP1-2.6, the main distribution range of P. zhennan expanded towards the Tibet Autonomous Region. The central region of China was mainly a highly suitable area for P. zhennan. Over time, the distribution range of this highly suitable area further expanded. In addition, considering the future environmental changes in the Tibet Autonomous Region, the southeastern part was warm and humid, suitable for the growth of P. zhennan. Therefore, the southeastern part of Tibet became the main potential suitable area for P. zhennan in the future. In the future scenario of SSP2-4.5, the distribution range of suitable areas for P. zhennan further extended towards the northeast direction from 2061 to 2080. The area of poorly suitable areas significantly increased compared to the current situation, and the moderately suitable area in the Tibet Autonomous Region also expanded compared to the period from 2041 to 2060. Not much change was seen in the distribution ranges of other highly suitable areas and moderately suitable areas. In the future scenario of SSP3-7.0, the distribution range of suitable areas shrunk from 2061 to 2080, and there was a trend of eastward migration in the distribution range of highly suitable areas. In the future scenario of SSP5-8.5, the potential distribution range of suitable areas for P. zhennan continued to expand towards the northeast from 2061 to 2080, with the most significant increase observed for the area of poorly suitable areas.
3.2.2. Evaluation Indicators for the Prediction of Suitable Areas for P. zhennan
The mean performance metrics of ROC curves, AUC values, and standard deviations for 2014–2060 and 2061–2080 under climatic–geographic conditions were obtained by the MaxEnt model with 10 calculations for four different models.
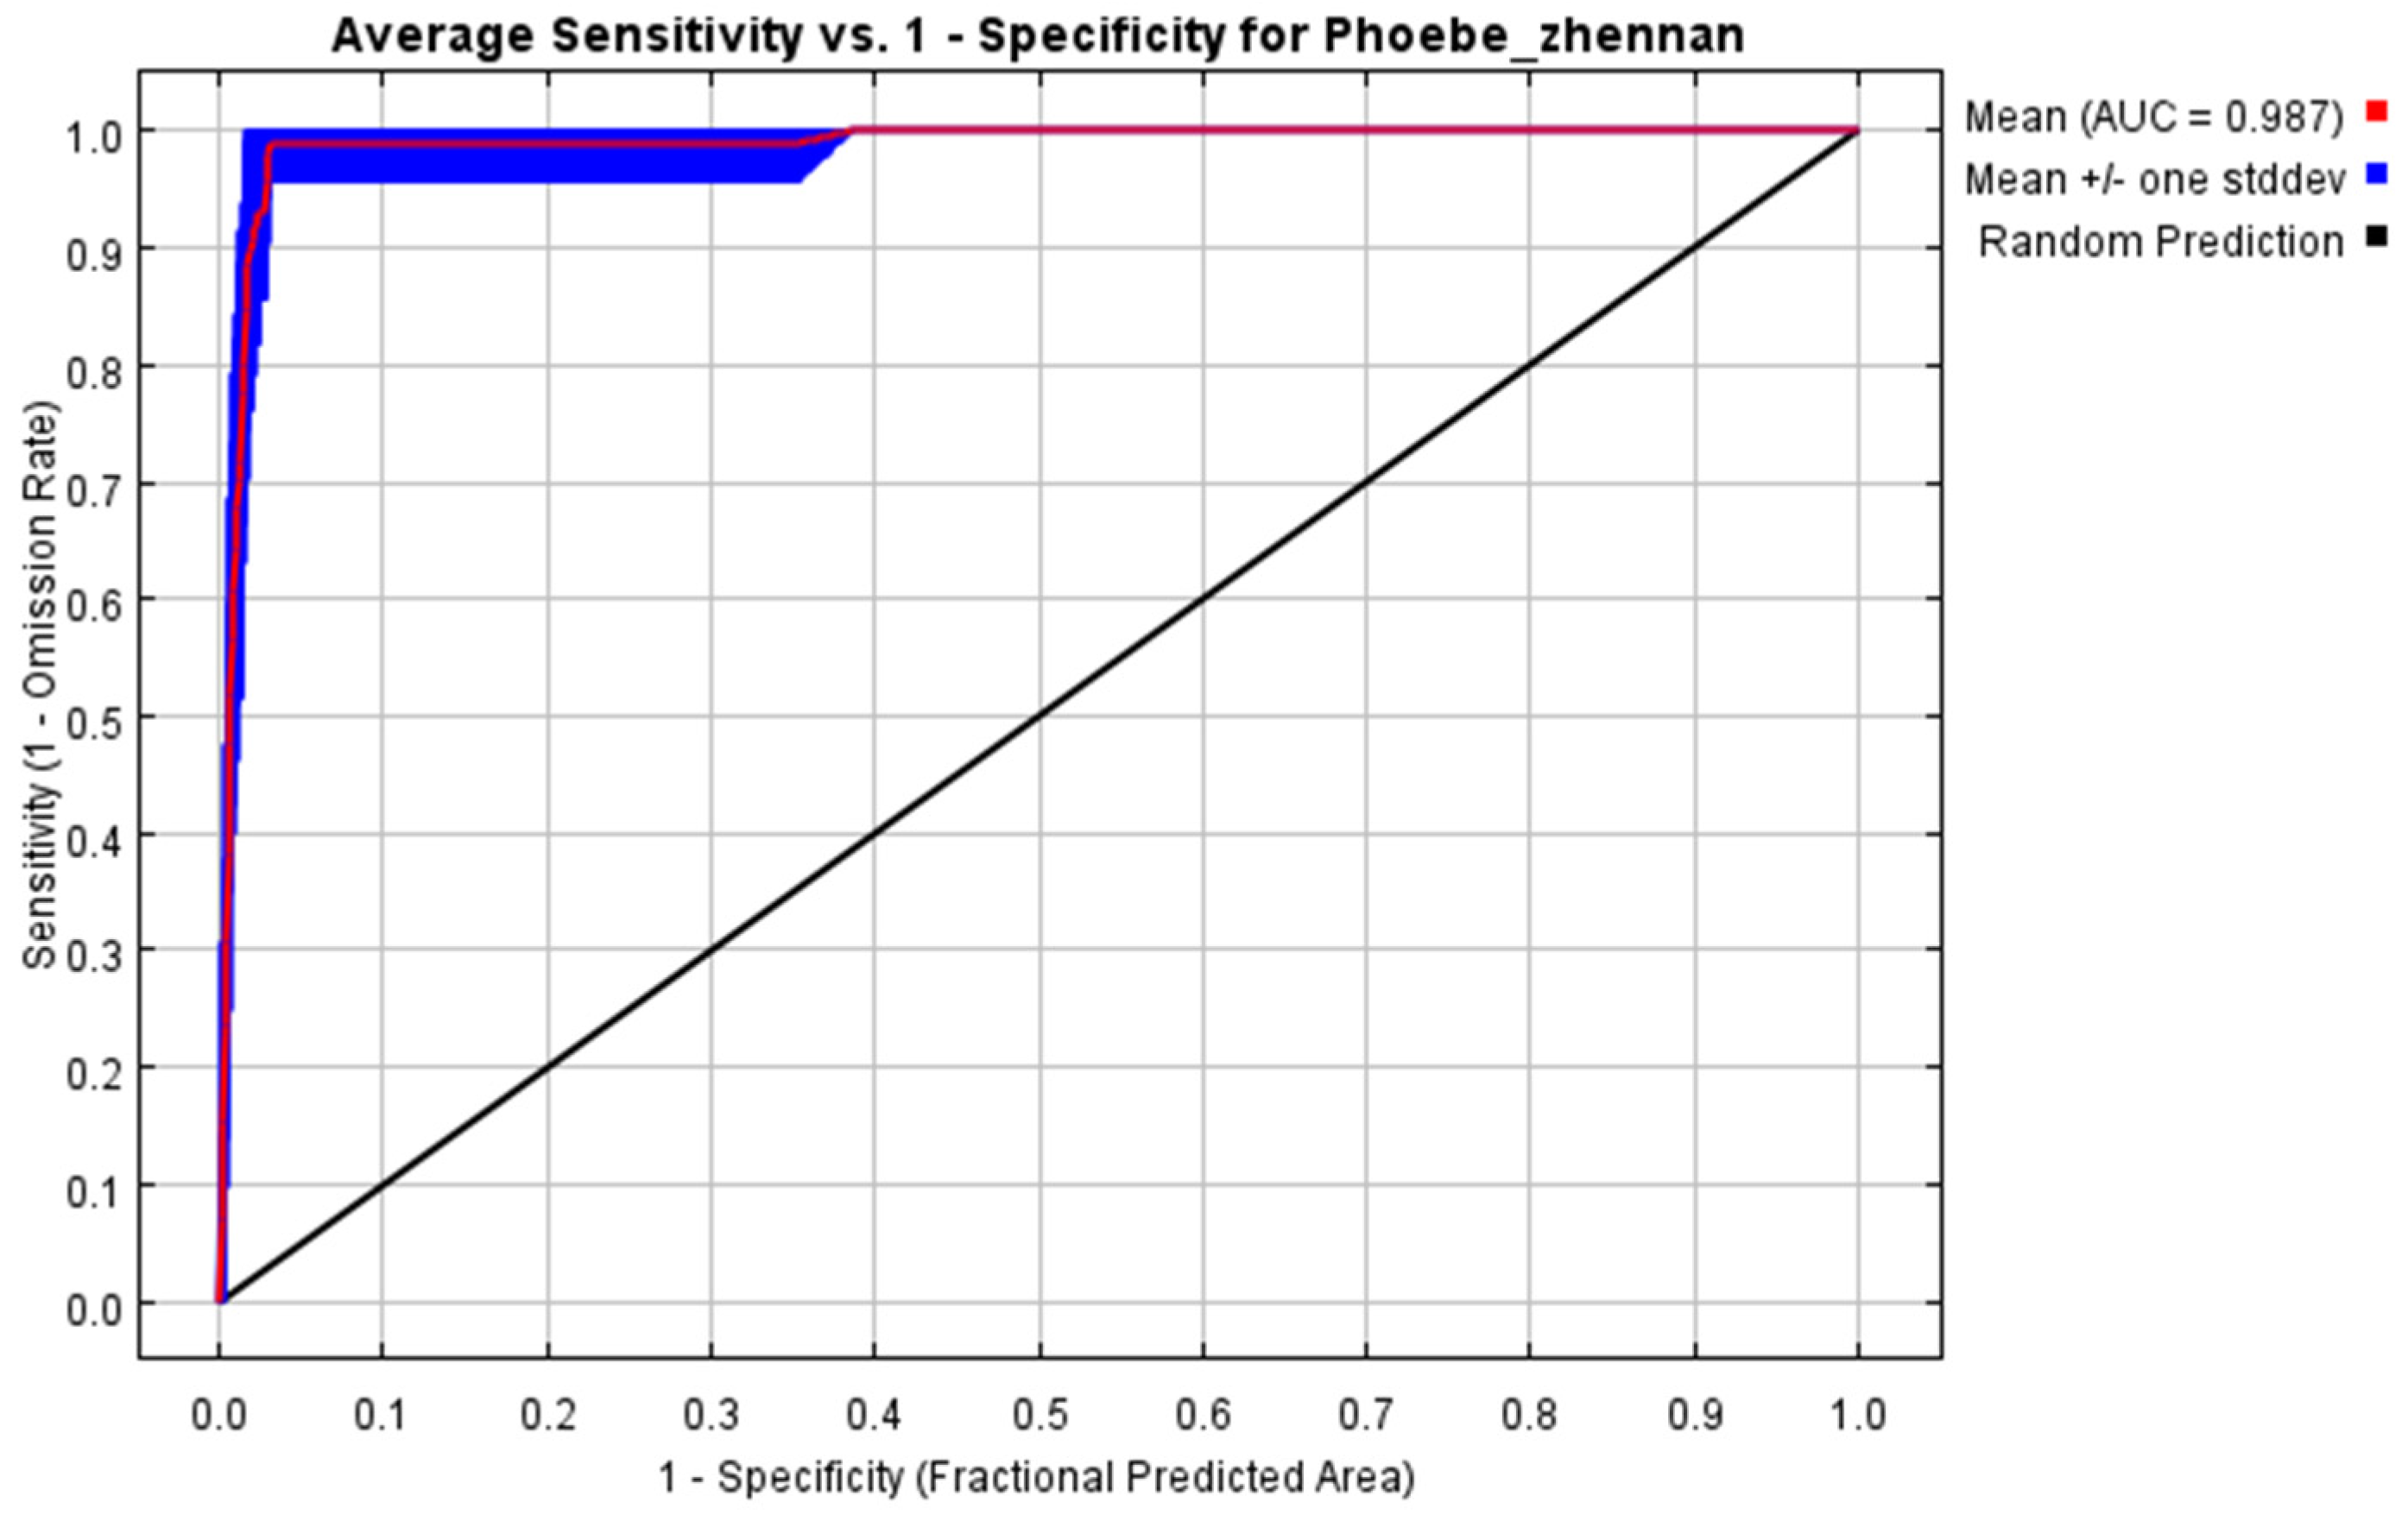
The ROC curves for the projected potential suitable areas for P. zhennan under the SSP1-2.6 scenario for 2061–2080 are shown (Figure 7). The area below the ROC curve is the AUC value.
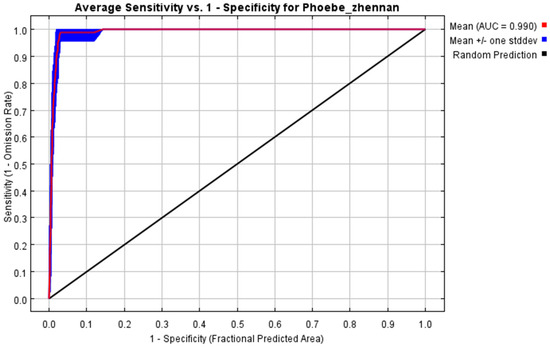
Figure 7.
The ROC curve of distribution model based on climatic and geographical variables in China.
The analysis showed that the ROC curve for this future scenario of environmental factors was significantly different from the curve for the climate-only factors, and the performance index AUC value was 0.990.
According to the data in Table 5, it can be seen that the AUC values of the four different future scenarios for 2041–2060 and 2061–2080 were above 0.980, and the AUC values of each model were the averages of 10 repetitions of the MaxEnt model with standard deviations below 0.010.
Table 5.
AUC values and standard deviations for Phoebe zhennan under different future scenarios of climatic and geographical conditions.
3.2.3. Analysis of Environmental Factors for the Prediction of P. zhennan’s Suitable Areas
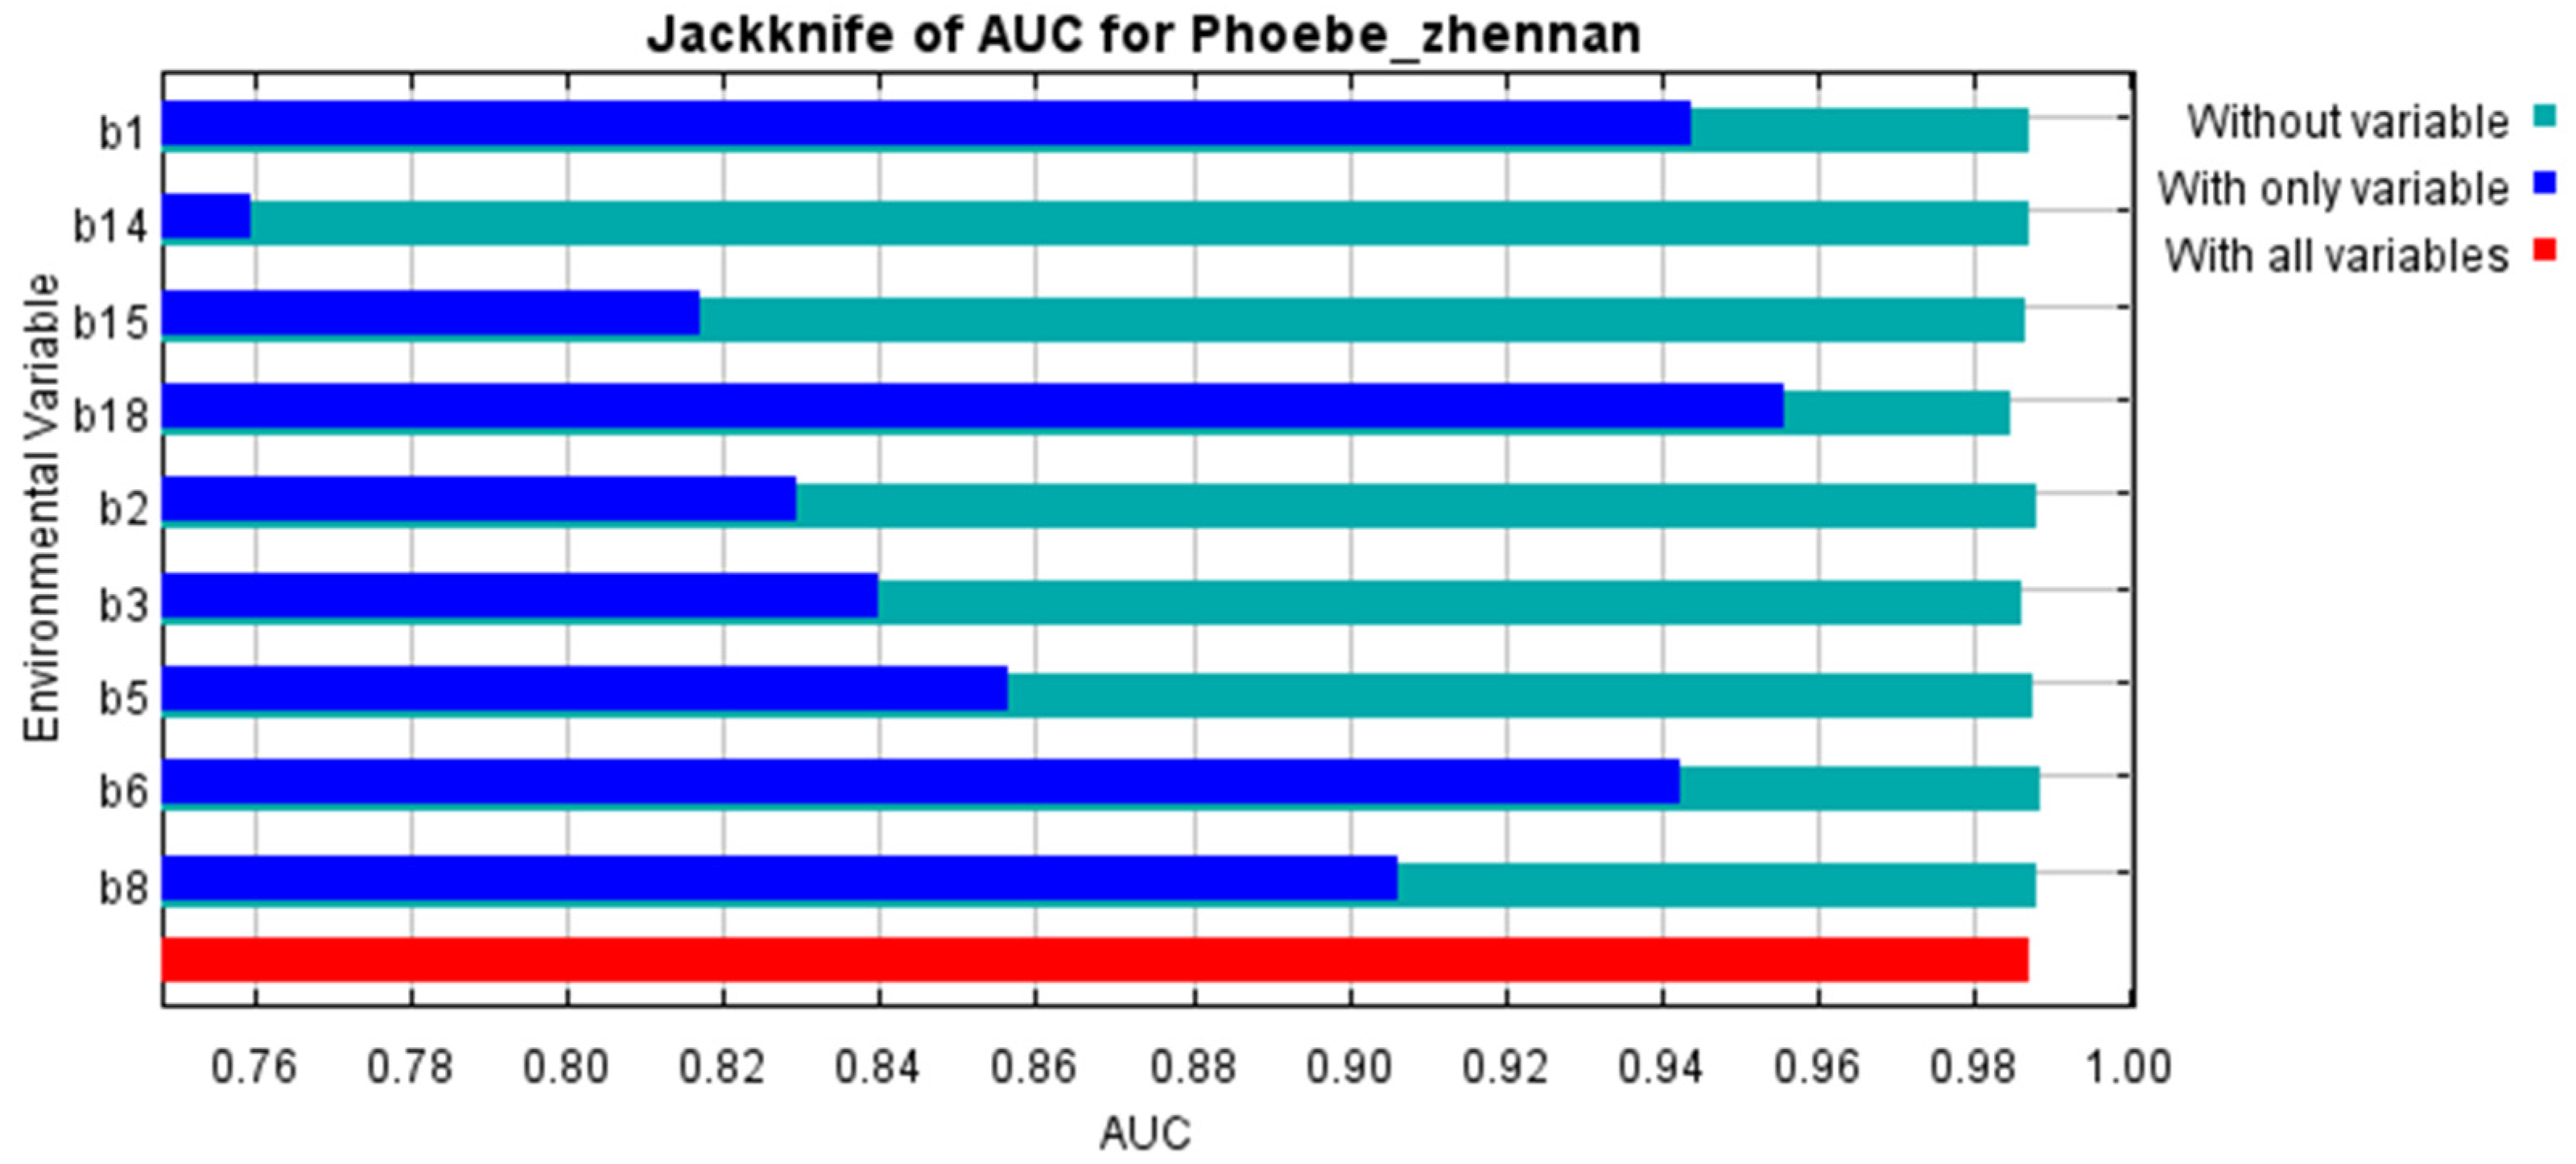
Elevation, aspect, and slope were used as ecological factors along with the climatic factors for predicting the distribution range of potential suitable habitat areas, and the potential habitat of P. zhennan was re-projected in the MaxEnt model. The influence of climatic and geographical factors on the prediction of potential habitat for P. zhennan was analyzed (Figure 8).
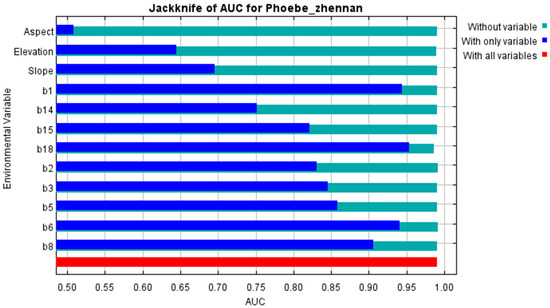
Figure 8.
Variable importance analysis of Phoebe zhennan based on climatic and geographical factors.
Since the results of the environmental factor analysis for each period of the four different future models did not differ significantly, environmental variable maps for the period of 2061–2080 for SSP1-2.6 were taken for analysis. According to the future analysis, slope had the greatest influence among the geographic factors on the prediction of potential suitable areas for P. zhennan, and slope direction had the least influence (Figure 8). Among the climatic factors, the precipitation during the warmest quarter (b18) was the factor that had the greatest influence on the prediction of potential suitable areas for P. zhennan, and the annual mean temperature (b1) and the min temperature of the coldest month (b6) also had a very high degree of influence on the prediction of suitable areas for P. zhennan, while the precipitation during the driest month (b14) was the climatic factor that had the least influence on the prediction of the distribution of potential suitable areas for P. zhennan in the future. Among the most influential variables of climate and geography, the optimal range of variables suitable for P. zhennan growth was predicted based on the MaxEnt model results. Under the four different socioeconomic pathways (SSP1-2.6, SSP2-4.5, SSP3-7.0, and SSP5-8.5), the ranges of the warmest season (June–August) precipitation suitable for the growth of P. zhennan during the period of 2041–2060 were 399.69–1134.17 mm, 401.62–1720.64 mm, 404.02–1374.34 mm, and 411.23–1285.33 mm, respectively. The optimum slope ranges were 0.07–14.34°, 0.06–5.87°, 0.06–7.12°, and 0.08–5.52°. Additionally, the optimum warmest seasonal precipitation suitable for P. zhennan during 2061–2080 was from 412.73–1386.55 mm, 402.11–1335.51 mm, 387.46–1513.93 mm, and 387.32–1099.09 mm, respectively. The optimum slope was 0.08–20.21°, 0.07–13.95°, 0.05–18.38°, and 0.05–18.7°, respectively.
The results showed that, although the effects of geographic factors on the prediction of potential suitable areas for P. zhennan were usually lesser than most climatic factors, they still played an important role in the accuracy of the prediction results by causing changes in temperature and precipitation. Therefore, analyzing the effects of geographic factors on the future distribution of potential suitable areas for P. zhennan was necessary to improve the accuracy of our predictions.
4. Discussion
4.1. Accuracy and Stability of the Predicted Results of the Model for the Potential Suitable Areas for P. zhennan
In this study, we found that the environmental factors were influenced by the Chinese border when using the MaxEnt model to predict potential suitable areas for P. zhennan in China. Therefore, it was not accurate to solely rely on climate and geographical data within China to predict potential suitable areas for P. zhennan. Instead, a more reasonable approach would be to first predict the potential suitable areas for P. zhennan in southwest China and neighboring countries, considering the continuity of altitude and climatic factors in the region. Subsequently, the potential suitable areas within China could be accurately identified by cutting out the suitable areas. This approach ensured the accuracy of the results while avoiding the loss of altitude and climatic factor continuity that could have occurred if the environmental factors were applied after cutting.
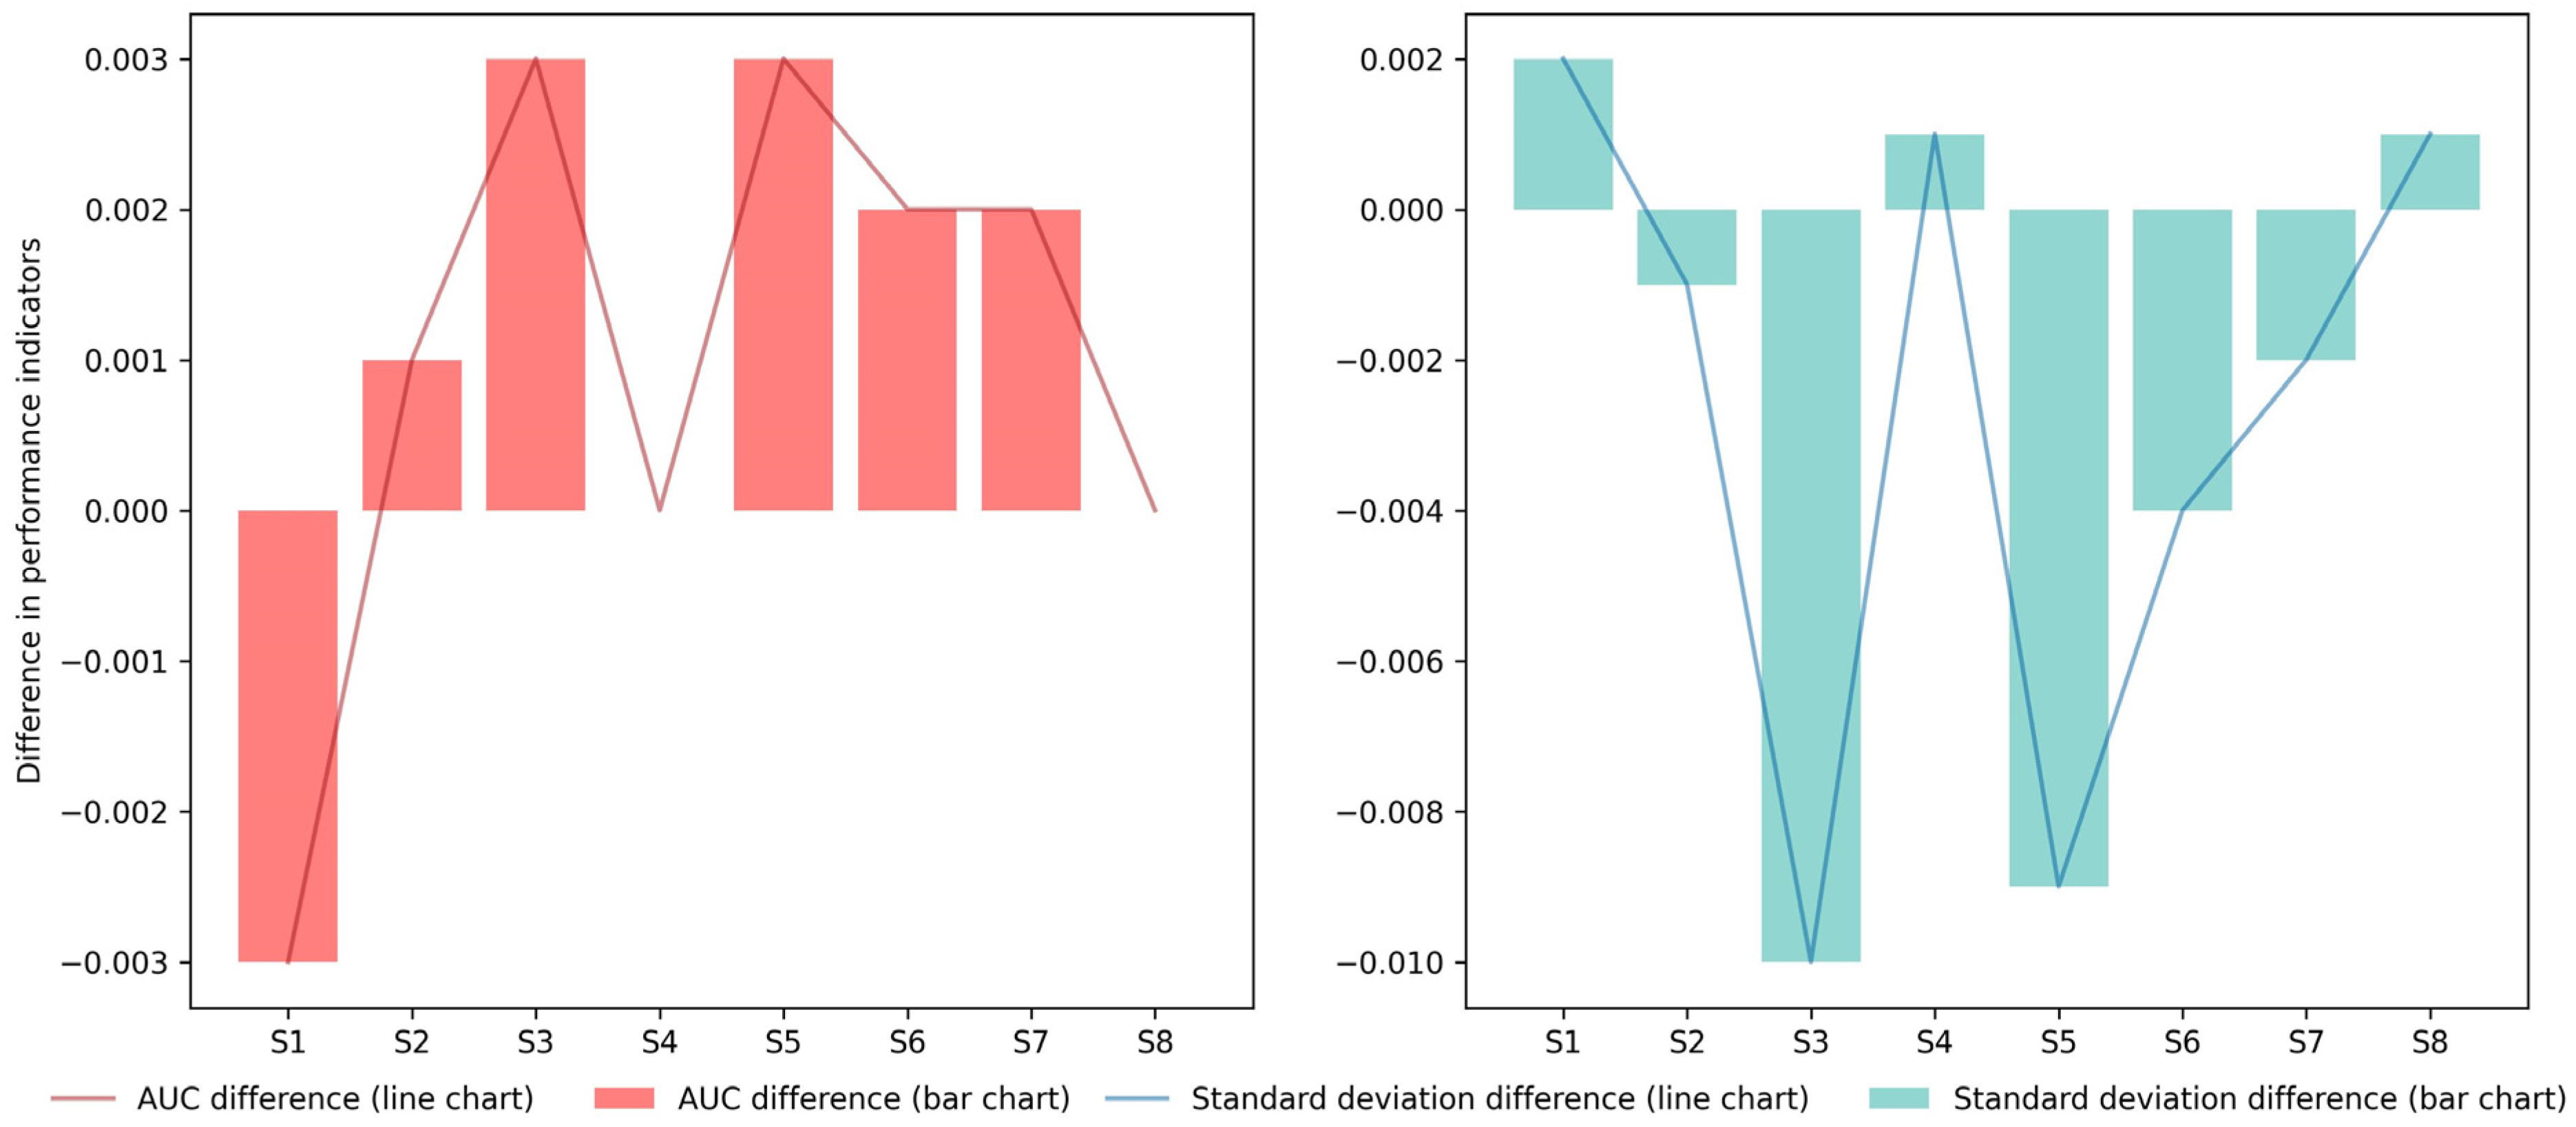
The range and area of potential suitable areas for P. zhennan obtained by the MaxEnt model calculations differed only under climatic conditions and under both climatic and geographical conditions. The AUC value was the performance evaluation metric of the MaxEnt model, and it was the difference in the performance metric for two different environmental factors (Figure 9).

Figure 9.
Analysis of AUC values and standard deviations for P. zhennan’s predictive performance metrics under different periods and scenarios.
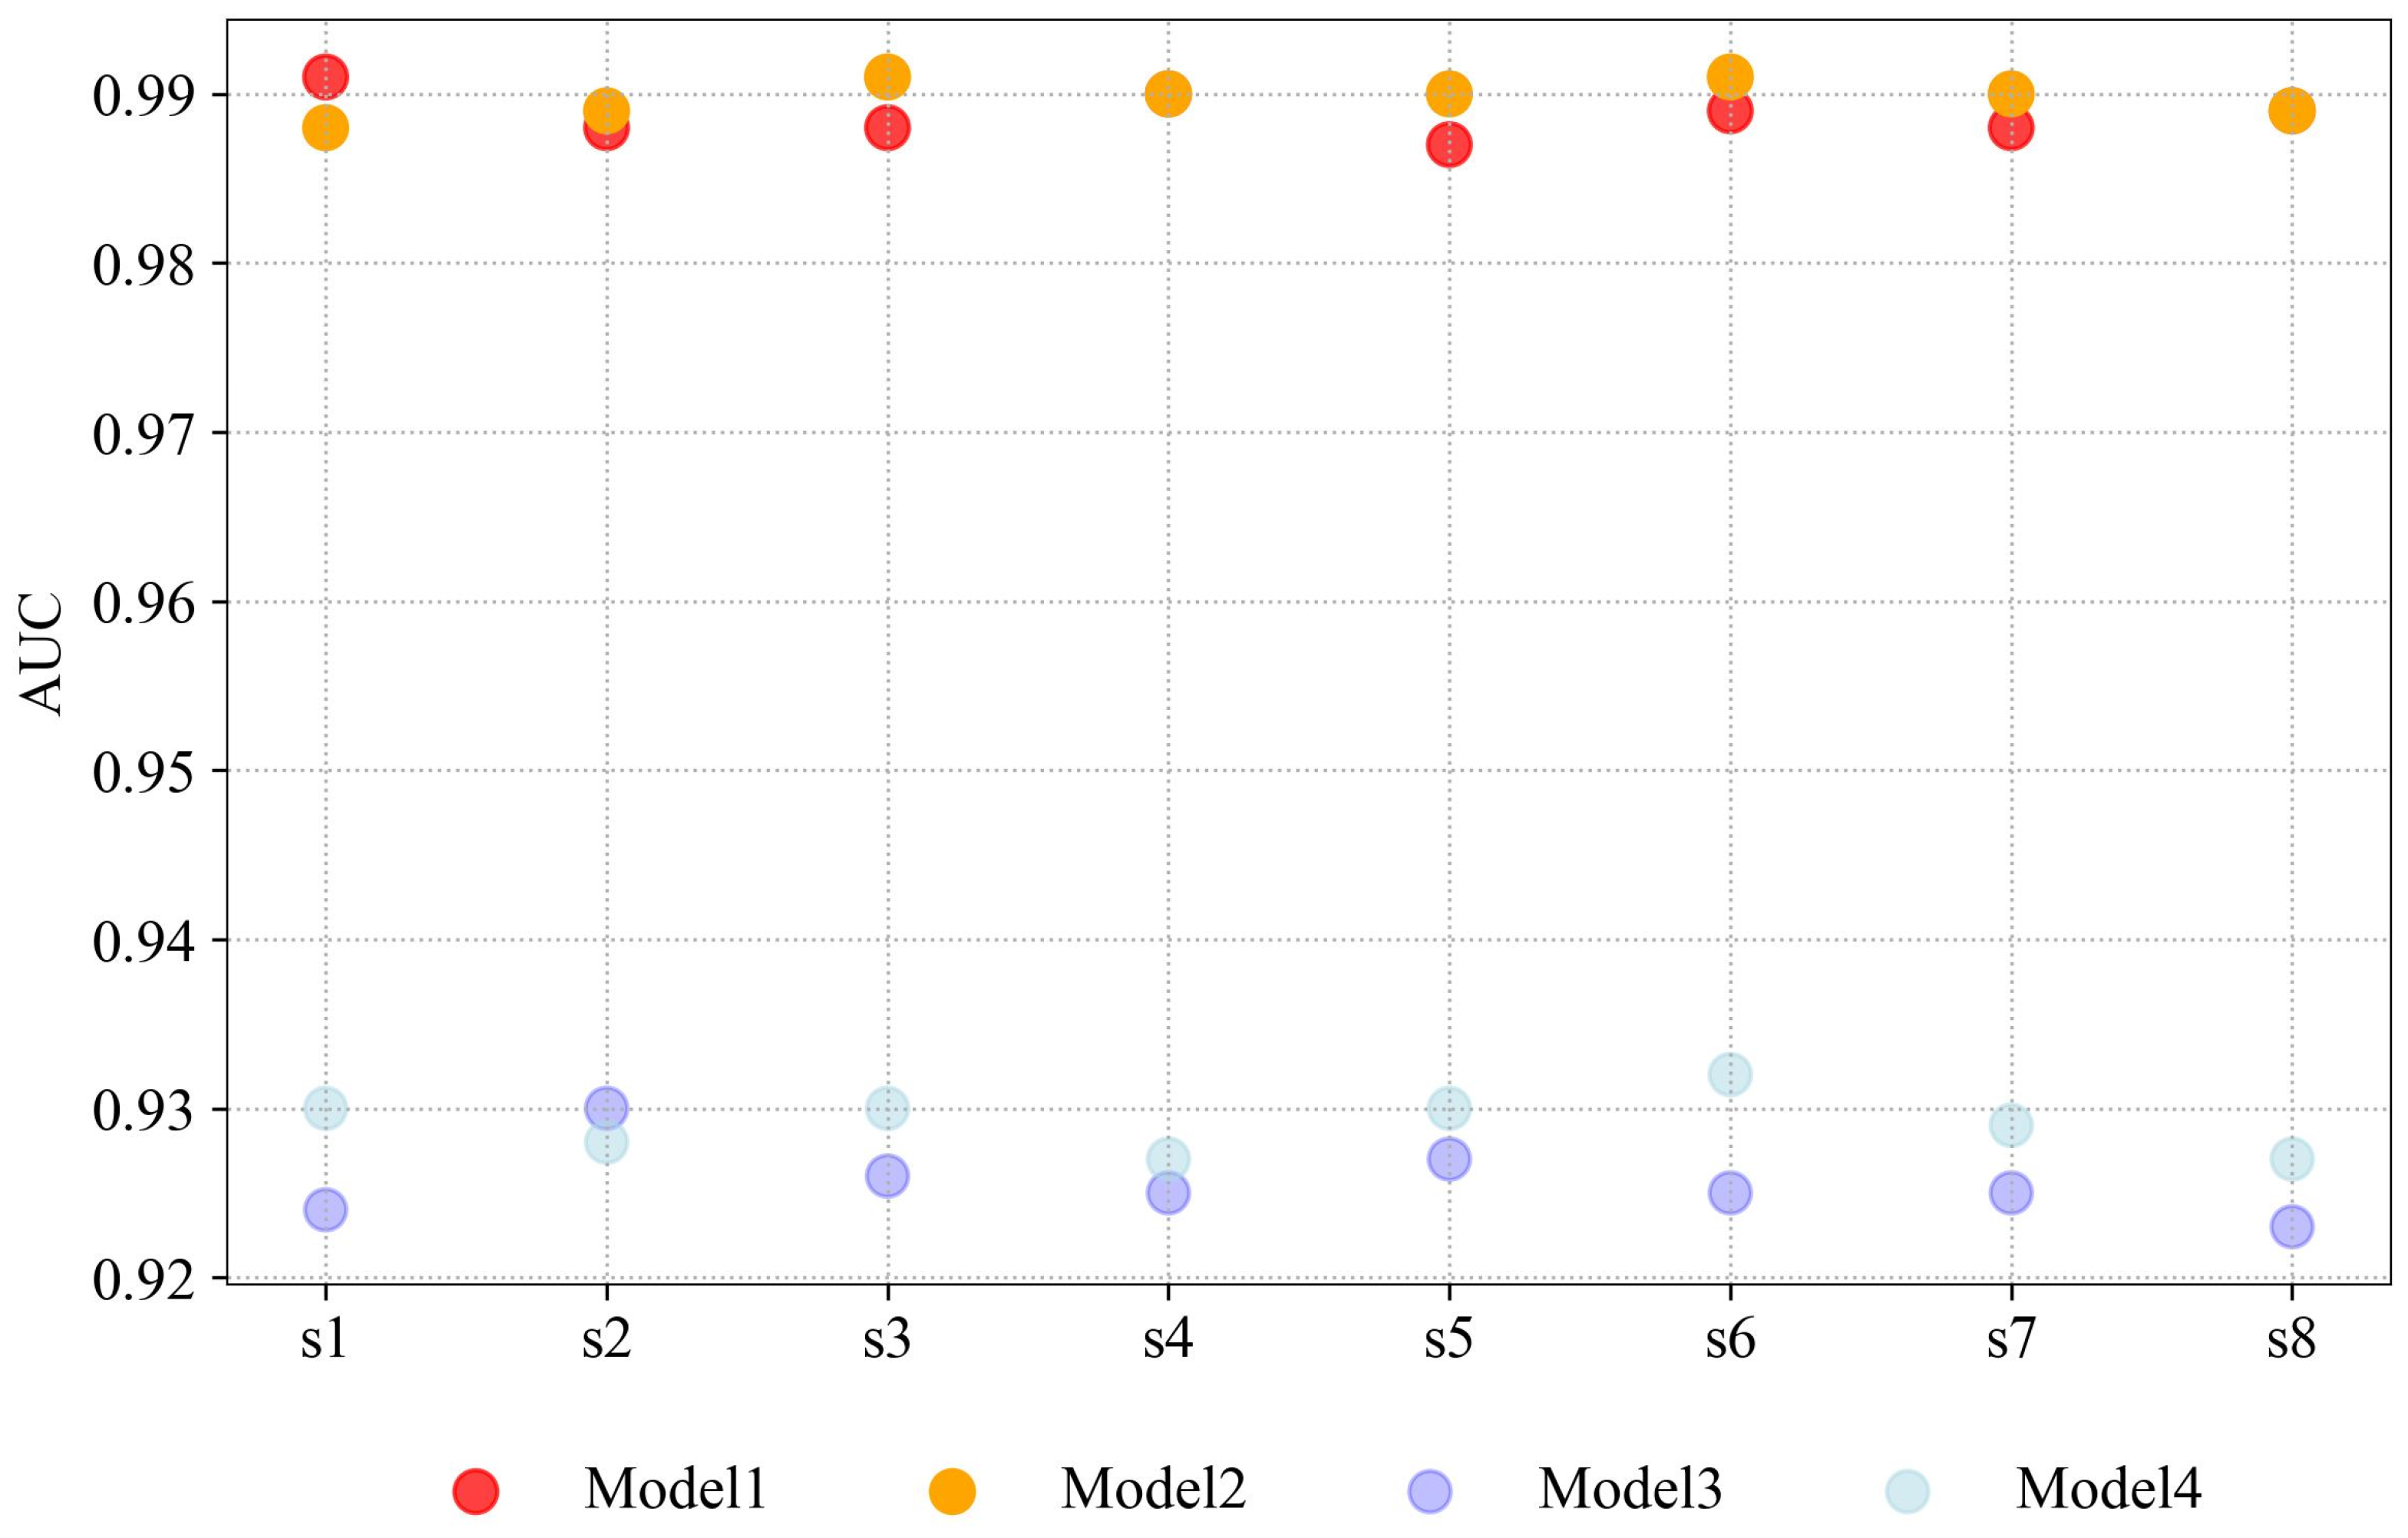
This study conducted a comprehensive analysis on the prediction of potential suitable areas for P. zhennan in eight future scenarios in China. The future scenarios were composed of four socioeconomic paths (SSP1-2.6, SSP2-4.5, SSP3-7.0, and SSP5-8.5) and two future time periods (2041–2060 and 2061–2080). S1-S4 represented the future scenarios of SSP1-2.6, SSP2-4.5, SSP3-7.0, and SSP5-8.5 during the time period of 2041–2060, while S5-S8 represented the future scenarios of SSP1-2.6, SSP2-4.5, SSP3-7.0, and SSP5-8.5 during the time period of 2061–2080. It was noteworthy that there were differences in the performance indicators between the climate–geographical condition prediction results and the performance indicators of the only climate conditions. A line graph of the differences in performance indicators for the four different shared socioeconomic path scenarios is plotted in Figure 9, which shows the difference and standard deviation of the AUC values of P. zhennan in climatic geography and in climatic conditions only. Geographical factors were important influencing factors on biological suitable areas [32]. The analysis of the figure showed that the accuracy of model predictions was generally higher when climatic geography was used as an environmental factor, except for the 2041–2060 period of SSP2-2.6. The standard deviations of 2041–2060 for SSP1-2.6, 2041–2060 for SSP5-8.5, and 2061–2080 for SSP5-8.5 increased when climate geography was considered as an environmental factor. However, the standard deviations of other future models decreased.
The predictive performance of the model was very good, as indicated by the AUC values being above 0.980 under different climate and geographical conditions, with standard deviations below 0.010. To address the issue of the multicollinearity of climate variables and its impact on prediction accuracy, this study conducted a correlation analysis among the environmental variables used to predict the suitable habitat of P. zhennan. Based on this analysis, specific climate factors were selected to improve the accuracy of the prediction results. The prediction effect of the data before clipping on the suitable areas for P. zhennan was much better than that after clipping, as can be seen from the following figure, showing a significant difference in the AUC value of the performance index between the environmental data before and after clipping (Figure 10). The predicted distribution map of the potential future suitable areas for P. zhennan revealed the use of climate and geography as an environmental factor for prediction, resulting in more refined results (Figure 6). Hence, it was more reliable to use the climatic and geographical data before clipping as the environmental data in predicting the potential suitable areas for P. zhennan using the MaxEnt model.
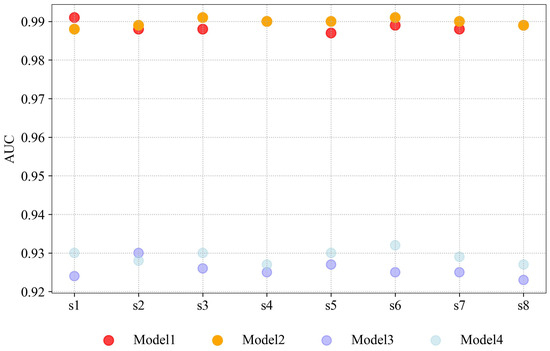
Figure 10.
Differences in AUC values under different models for climatic conditions and models that consider only climatic and geographical conditions.
Among these models, Model1 represented a prediction model that only included climate factors before data clipping in China. Model2 represented a prediction model that included climate and geographical factors before data clipping. Model3 and Model4 represented the prediction of suitable areas after data clipping and the results of prediction models that only used climate and climate geography as environmental factors. Furthermore, the other eight future scenarios, composed of four socioeconomic paths (SSP1-2.6, SSP2-4.5, SSP3-7.0, and SSP5-8.5) and two time periods (2041–2060 and 2061–2080), were used to analyze the AUC value performance index. Specifically, s1-s4 represented the four future scenarios from 2041 to 2060, and s5-s8 represented the four future scenarios from 2061 to 2080. The AUC value analysis demonstrated the model’s performance and suitability for predicting potential suitable areas.
4.2. Analysis of Potential Suitable Areas for P. zhennan for Different Environmental Factors
When climate and geography were used as an environmental factor, P. zhennan had an overall larger area of potential future suitable areas (poorly suitable areas, moderately suitable areas, and highly suitable areas) and a larger range of suitable areas in the four different socioeconomic pathway scenarios and two future time periods, 2041–2060 and 2061–2080, than when only climate was used as an environmental factor.
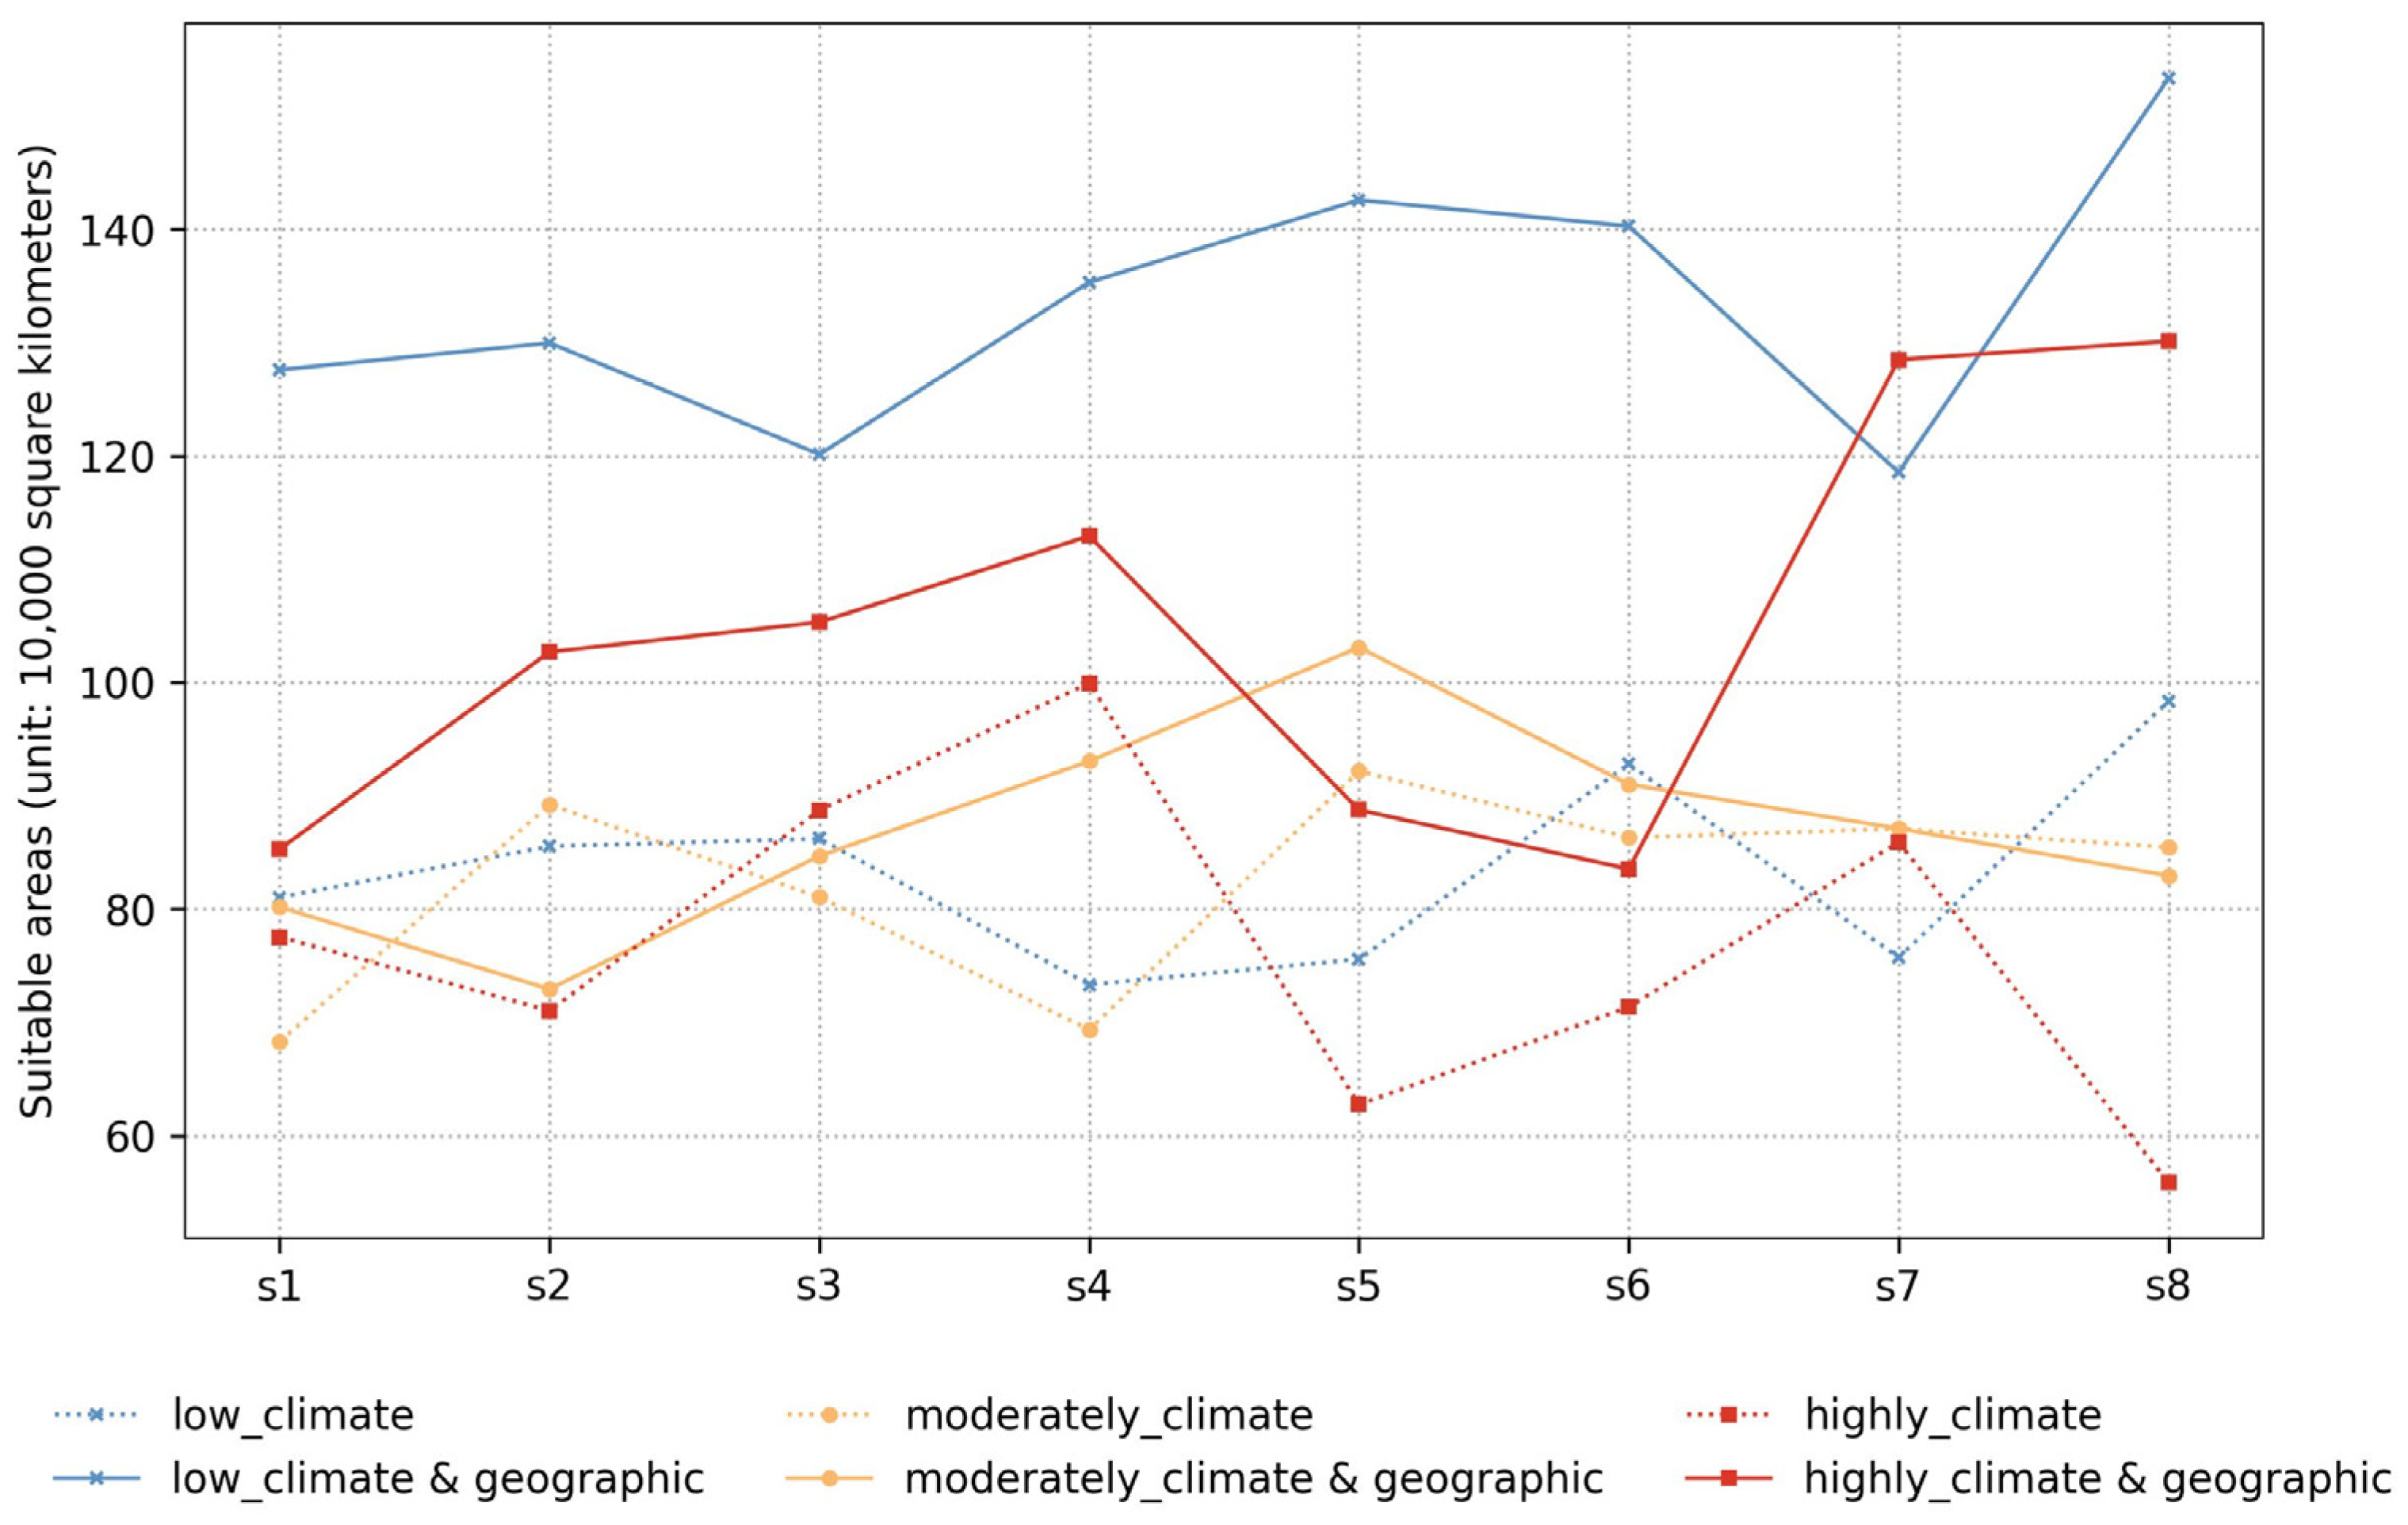
The analysis showed that the area of highly suitable and poorly suitable zones of P. zhennan was larger than the area under climatic conditions only when climatic and geography factors were used as an environmental factor, while the area of moderately suitable zones did not differ significantly between the two environmental factor cases (Figure 11).
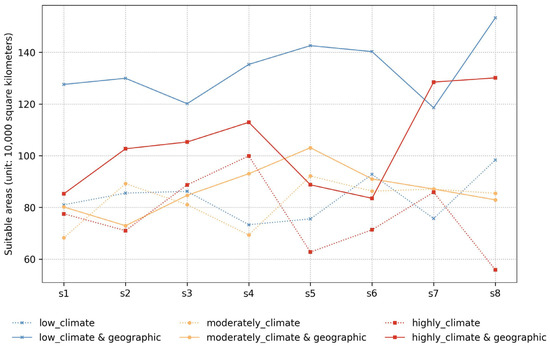
Figure 11.
The areas of potential suitable areas for Phoebe zhennan under climate-only conditions and combined climate and geographical conditions.
This study examined the different potential suitable areas for P. zhennan in China under different environmental variables. The areas of these zones were analyzed based on climate conditions only and climate conditions combined with geographic conditions. There were six categories of potential suitable areas identified as follows: poorly suitable areas under climate conditions only (low_climate), moderately suitable areas under climate conditions only (moderately_climate), highly suitable areas under climate conditions only (highly_climate), poorly suitable areas under both climate and geographic conditions (low_climate and geographic), moderately suitable areas under both climate and geographic conditions (moderately_climate and geographic), and highly suitable areas under both climate and geographic conditions (highly_climate and geographic). The study showed that the potential future suitable area for P. zhennan will expand from the southwest to the northeast over time, and the overall area of this suitable area will increase. The demonstrated expansion trend of the suitable area for P. zhennan is consistent with the findings of Xie [33], who determined that there will be an expansion in the future suitable area for ancient trees (including P. zhennan) in Sichuan. It also coincides with the conclusion prediction that the suitable area for P. zhennan will expand in China as a whole, and is largely consistent with the conclusion by Ding X [34], who concluded that the suitable area for P. zhennan will migrate to the north. P. zhennan prefers a warm and humid climate environment, and also has high requirements for the geographical conditions of its growth environment. Therefore, it is reasonable to add geographic factors to the environmental factors used for predicting the potential future suitable areas for P. zhennan.
4.3. Migration Paths of P. zhennan’s Potential Suitable Areas
In Section 4.2, we discussed the area size that may be suitable for P. zhennan to grow in under different environmental conditions. In order to more comprehensively understand the future distribution of P. zhennan, it is particularly important to further study the overall distribution range of its potential suitable areas. Therefore, in this section, we will focus on the migration paths of P. zhennan in potential suitable areas under the influence of only climate and both climate and geography factors, in order to more accurately predict the adaptability and distribution of P. zhennan under different environmental conditions.
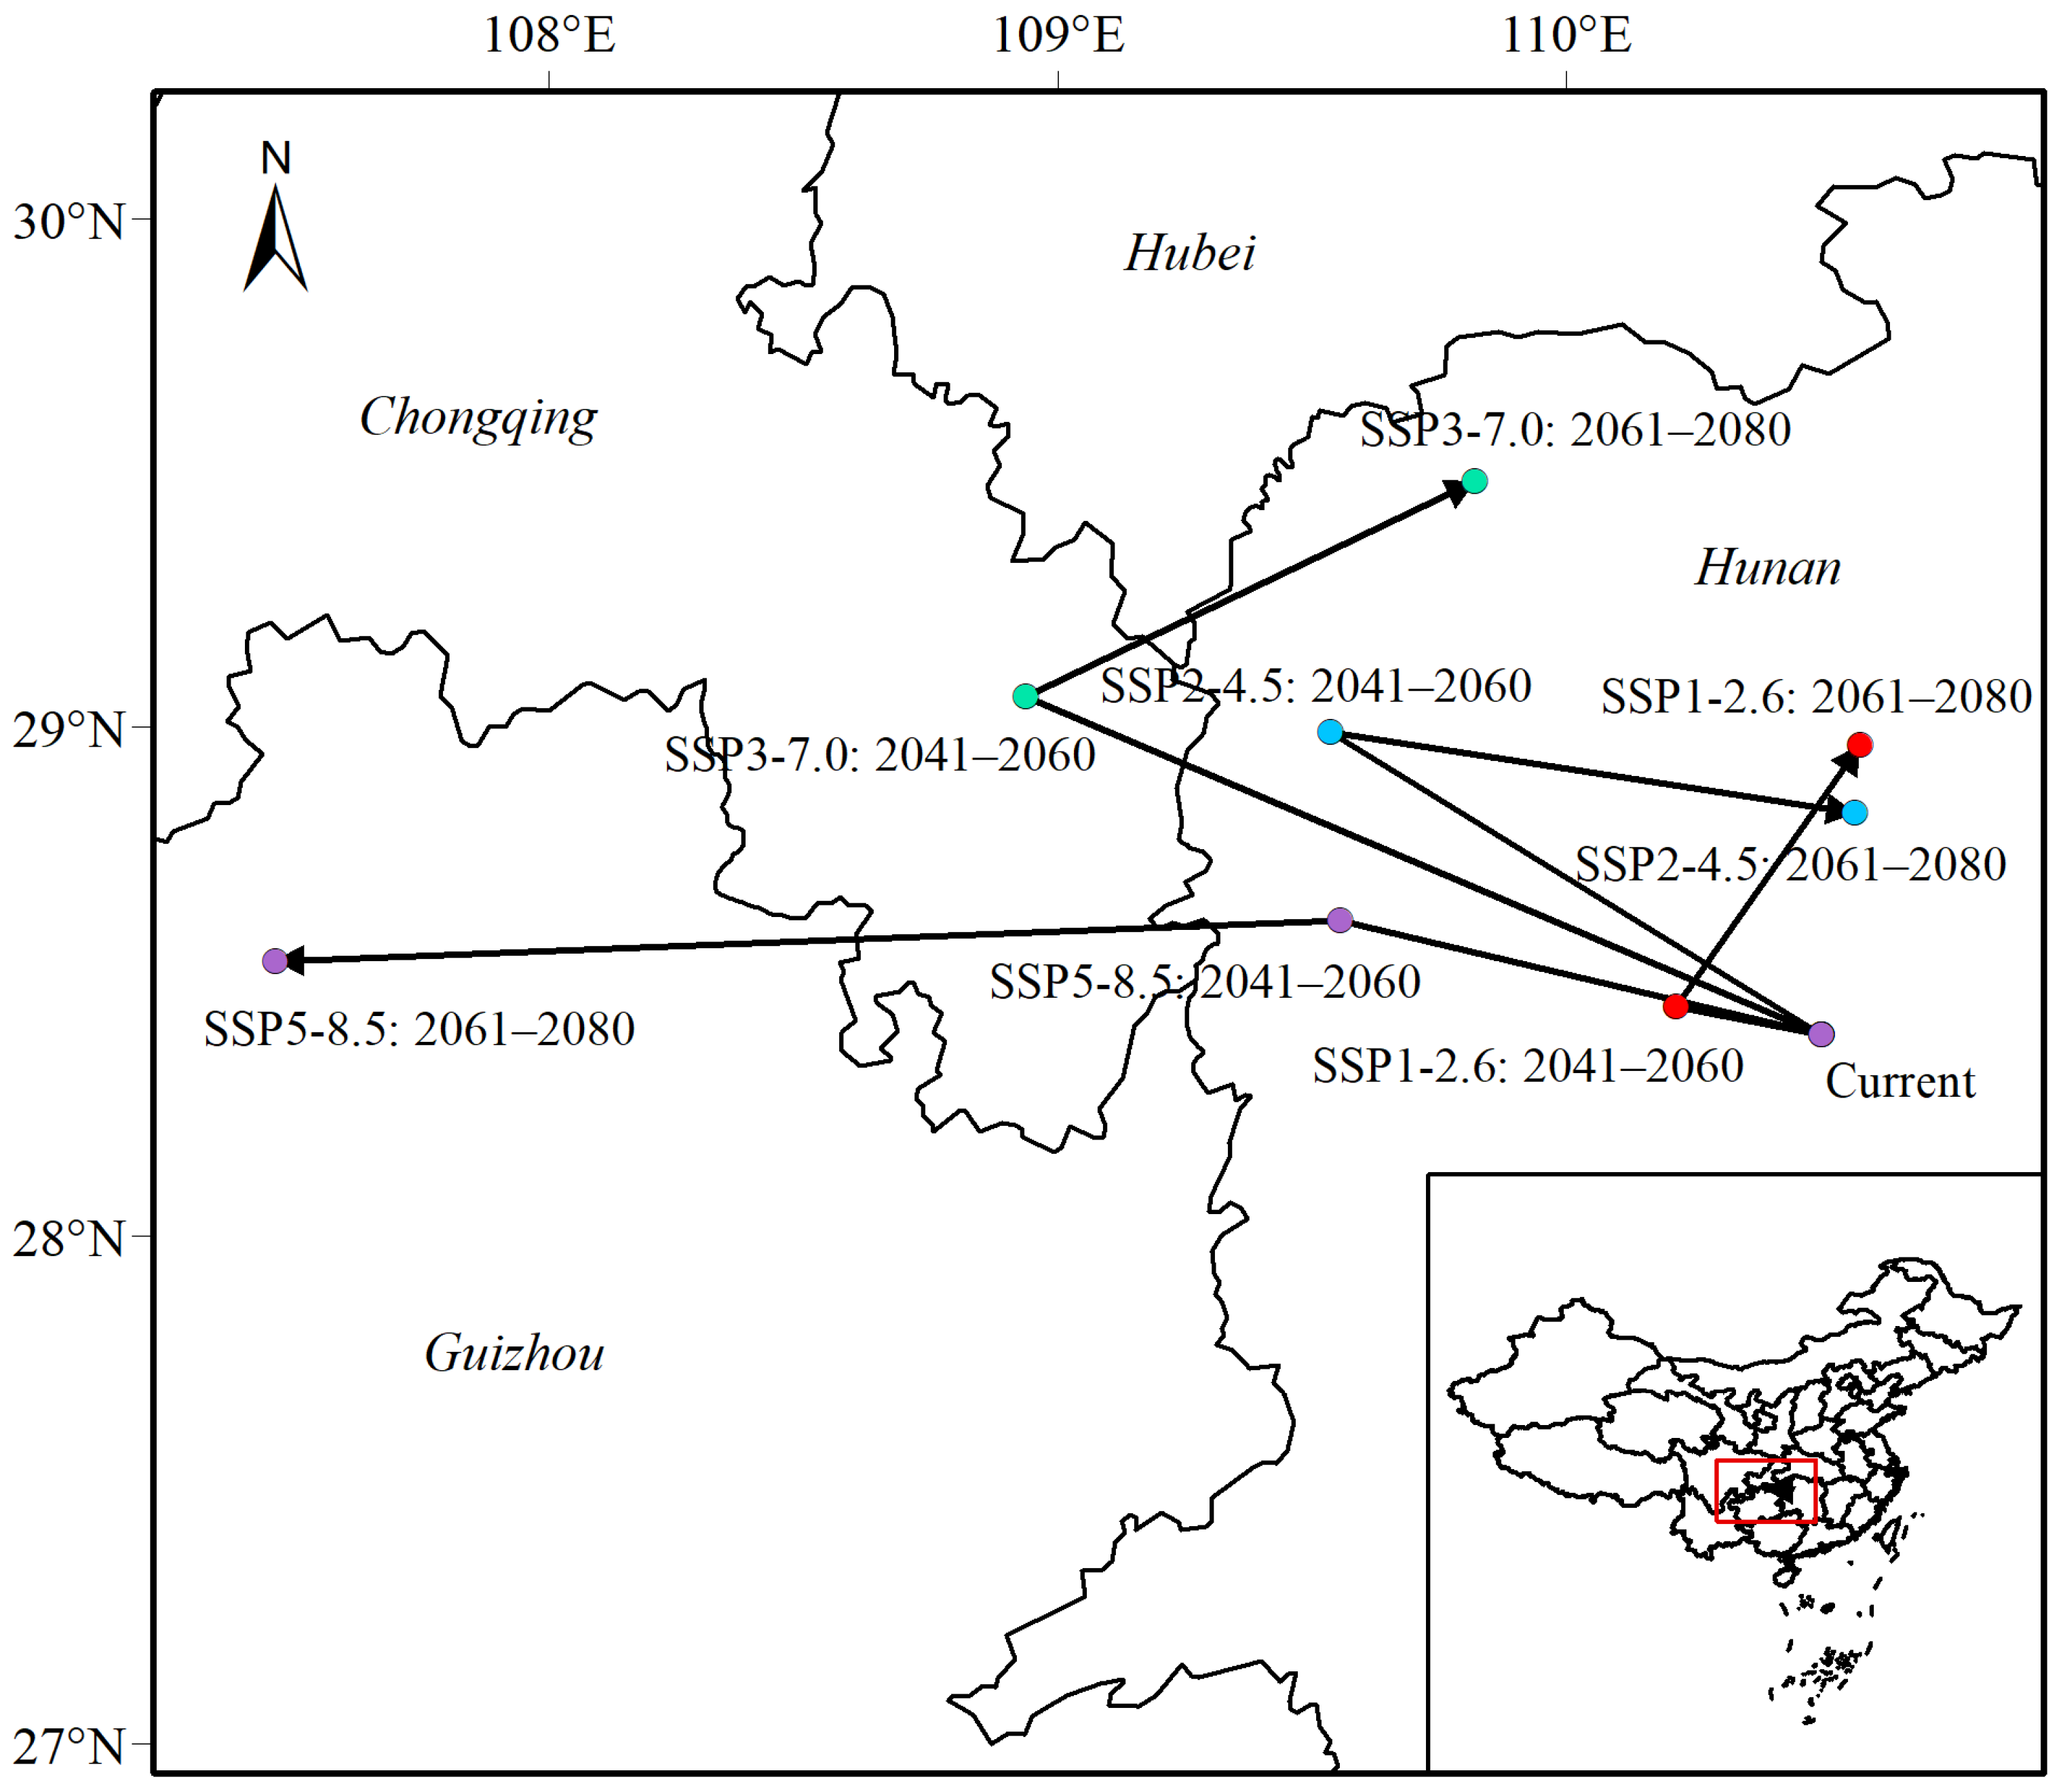
From the analysis in Figure 12, it can be seen that in the period of 2041–2060, regardless of the socioeconomic path scenario, the potential suitable habitat area for P. zhennan showed an overall trend of migrating to the northwest. However, in the future period of 2061–2080, this situation began to change. Under the three socioeconomic path scenarios of SSP1-2.6, SSP2-4.5 and SSP3-7.0, the potential suitable areas for P. zhennan began to move eastward. For the SSP5-8.5 scenario, this was a high-forcing climate scenario characterized by strong climate change impacts [35]. This study shows that, under this scenario, environmental conditions suitable for the growth of P. zhennan appeared in the western region. Therefore, compared with other scenarios, the migration path of P. zhennan under the SSP5-8.5 scenario showed significant differences, and the potential suitable areas for P. zhennan move farther west. This may reflect that, under more severe climate change conditions, the distribution range of P. zhennan may undergo greater adjustments in order to adapt to environmental changes.
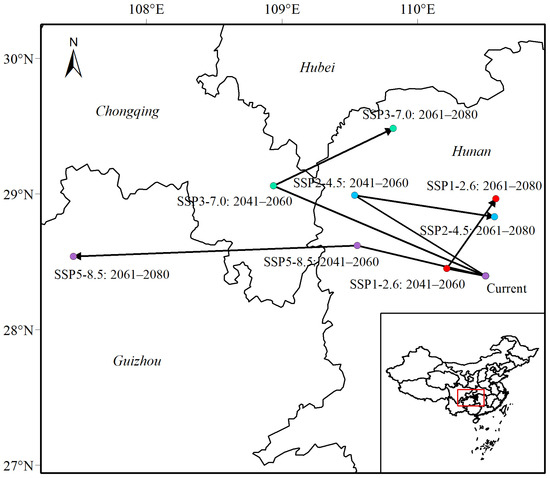
Figure 12.
Migration pathways of Phoebe zhennan in climate-only future potential suitable areas.
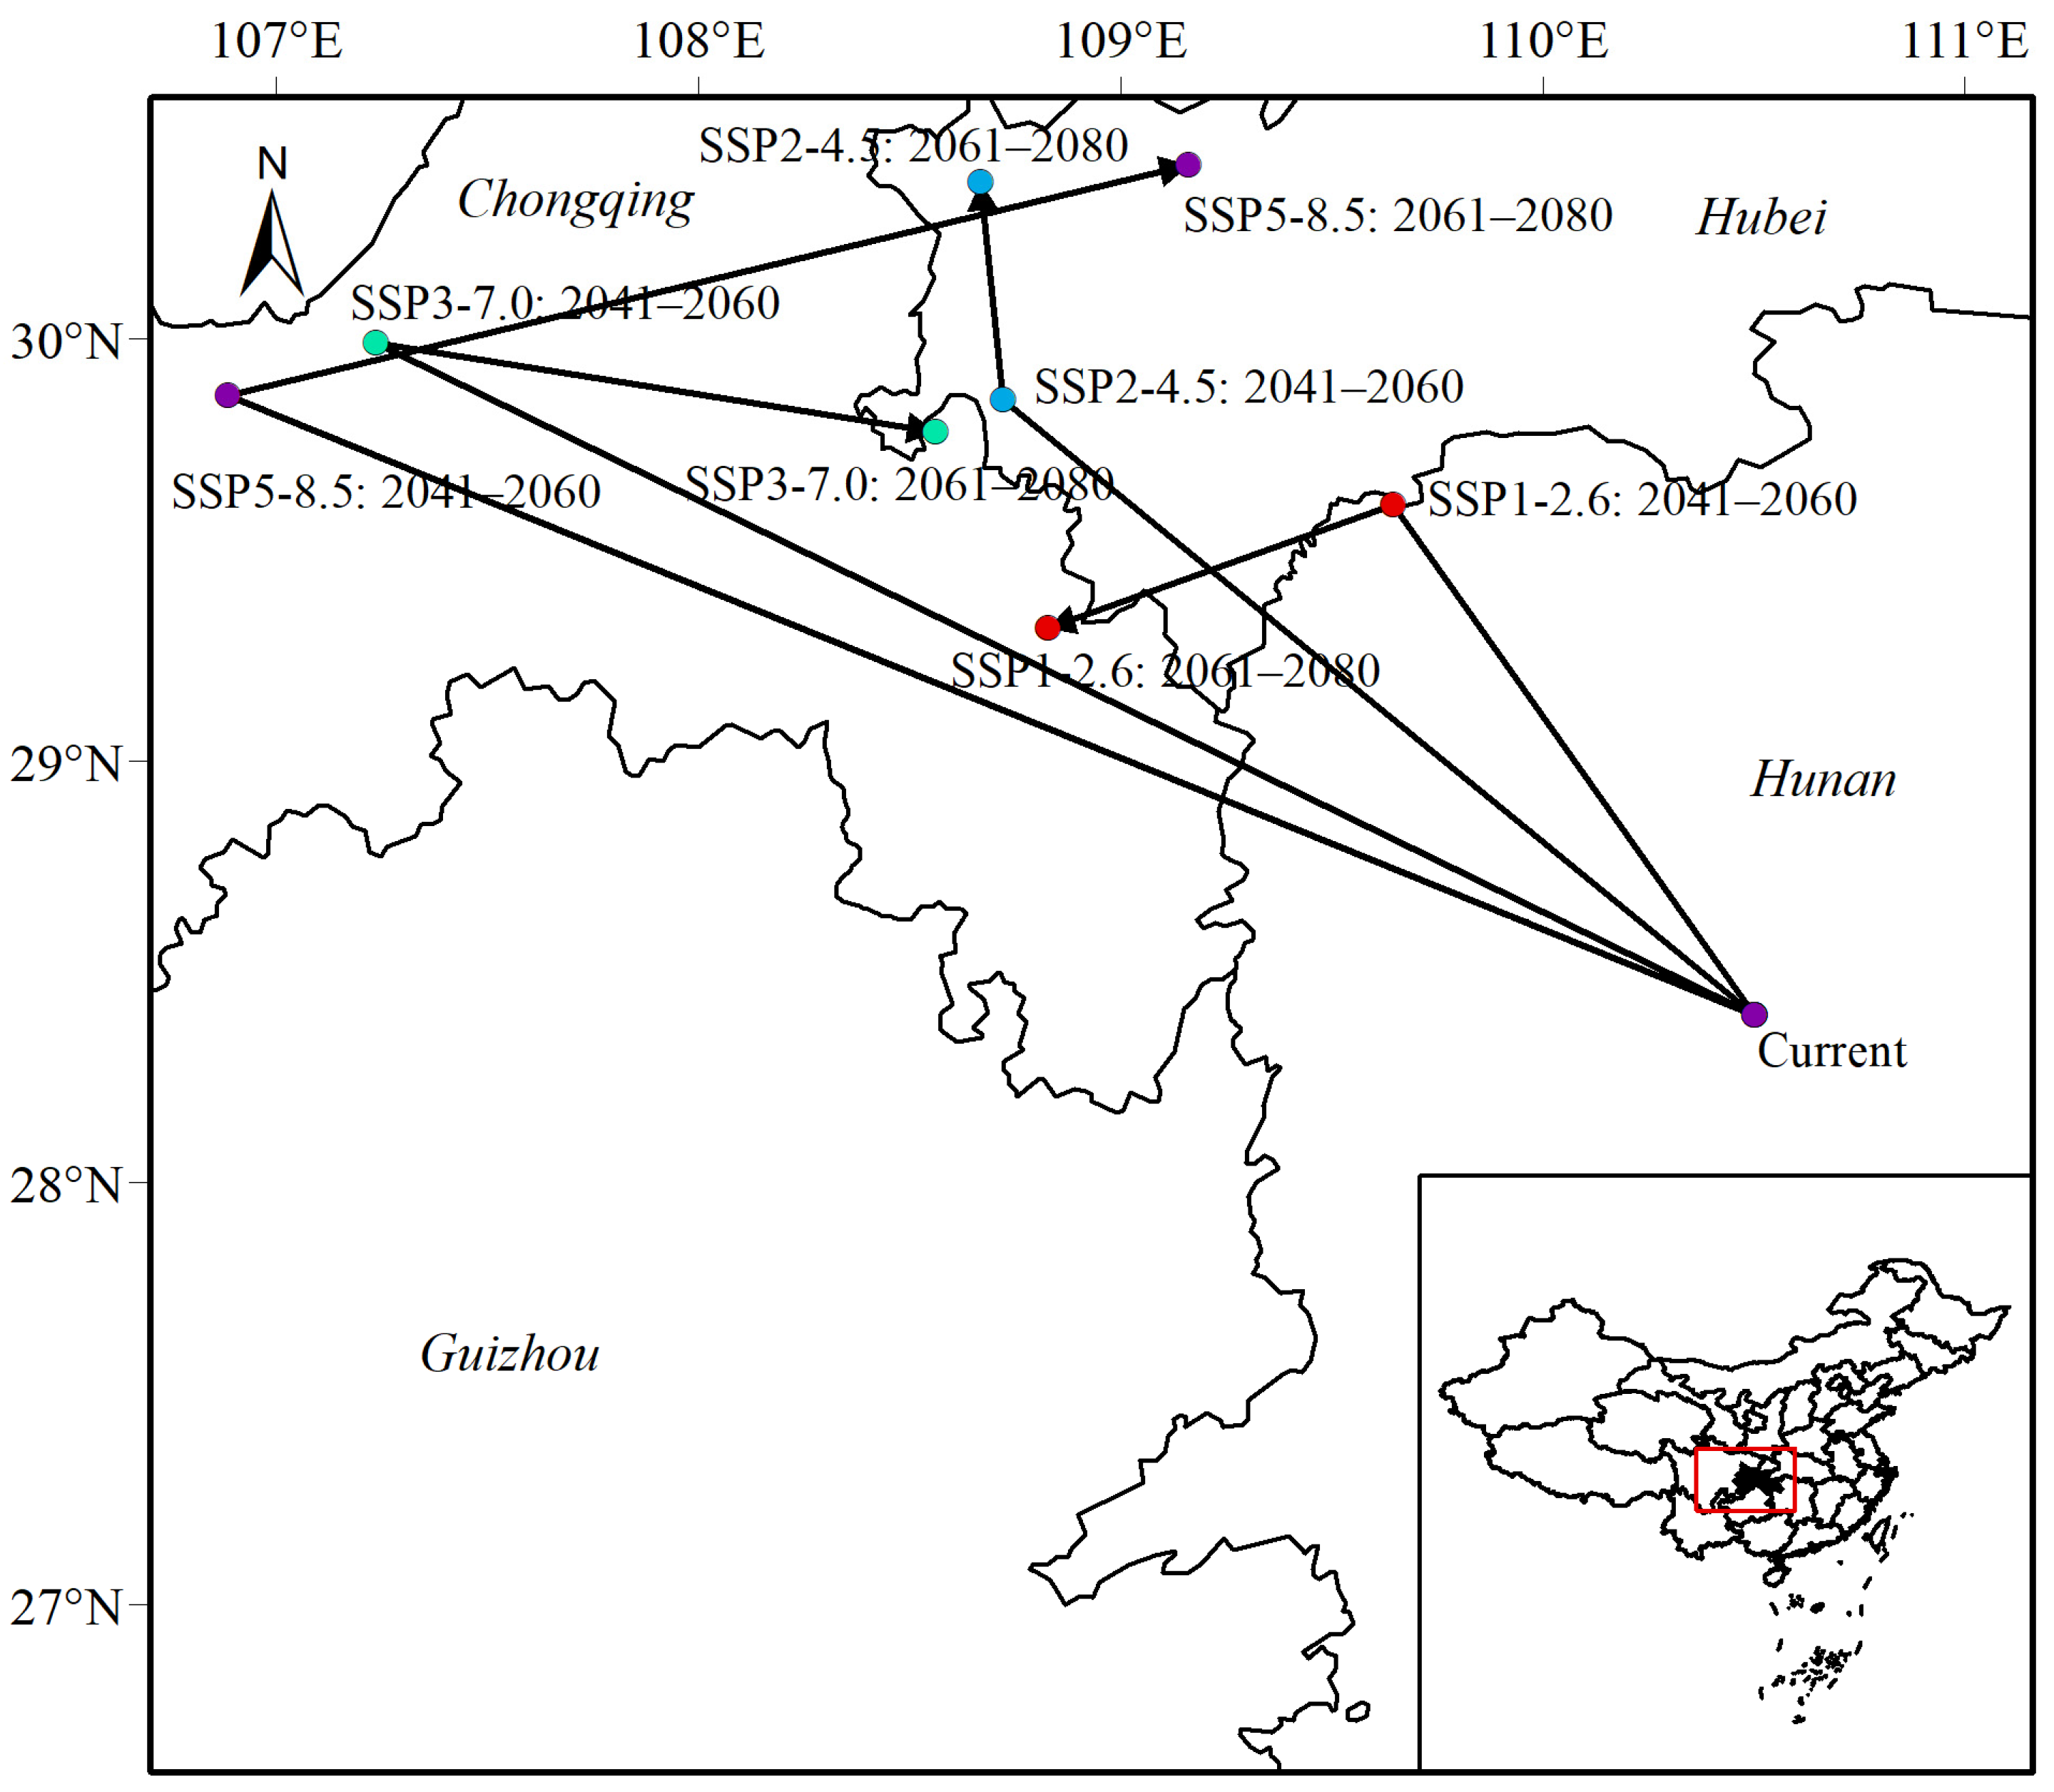
Through the analysis of Figure 13, we can observe that there was a significant difference between the migration path of P. zhennan under the combined influence of climate and geographical factors and the migration path only affected by climate factors. Under the combined influence of these two factors, the potential suitable area for P. zhennan showed a migration trend toward the northwest in all four socioeconomic pathway scenarios. This trend reflects the ecological niche adjustment of P. zhennan to adapt to climate change. As the socioeconomic path scenario changed from SSP1 to SSP5, that is, with the acceleration of climate change and the increase in environmental challenges in the future, the survival pressure faced by P. zhennan also increased accordingly. In order to survive in more severe climatic conditions, the potential suitable area for P. zhennan not only changed more widely, but also migrated further.
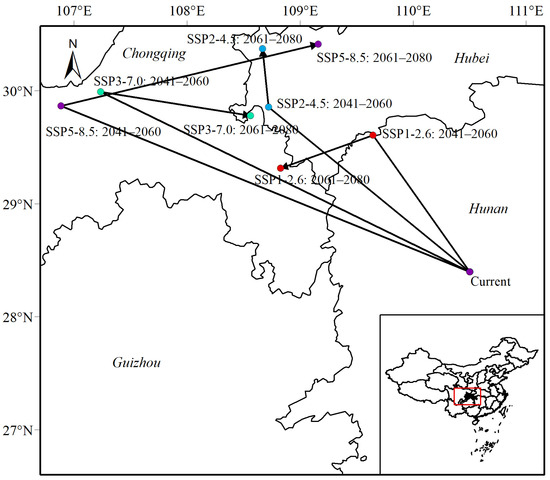
Figure 13.
Migration pathways of Phoebe zhennan in potential suitable areas in the future under the dual influences of climate and geography.
Despite the different environments, by analyzing the migration behavior of P. zhennan under different socioeconomic pathways, the potential impact of future climate change on biodiversity can be better predicted. This migration behavior is the natural response of P. zhennan as an organism to environmental changes, and it is also an adaptive way for its population to continue to survive and reproduce.
5. Conclusions
This study used the MaxEnt model to predict the distribution range of potential suitable areas for P. zhennan in different future ecological environments, and the distribution of potential suitable areas for P. zhennan was compared and analyzed in four shared socioeconomic path scenarios and two time periods (2041–2060 and 2061–2080). The research results showed that more accurate prediction results could be obtained by using climatic and geographical factors before clipping as environmental variables.
Among the climatic factors, precipitation during the warmest quarter was the most influential factor in predicting potential suitable areas for P. zhennan, while precipitation during the driest month was the least influential factor. Among the geographic factors, slope had the greatest impact on the prediction of potential suitable habitat, while aspect had the least impact.
According to the predictions of the MaxEnt model in the two periods of 2041–2060 and 2061–2080, the future potential suitable areas for P. zhennan were mainly located in the central–southern and southern regions of China. However, when future climate change and the growing conditions of P. zhennan were considered, the potential suitable area also tended to expand toward the Tibet Autonomous Region and northeast China. In the projections of future potential habitat areas that took both climatic and geographic factors into account, the areas of highly suitable, moderately suitable, and poorly suitable habitat areas for P. zhennan all increased significantly compared to the current suitable habitat areas. It was worth noting that the distribution range of potential suitable areas for P. zhennan was relatively stable in the two time periods. The poorly suitable area had the widest distribution range and was less suitable for P. zhennan growth, mostly surrounding the moderately suitable area, forming a ring-shaped area in which a small amount of P. zhennan was considered for planting. On the other hand, the moderately suitable area encompassed the highly suitable area for the growth of P. zhennan, and it was recommended that a large number of highly quality P. zhennan be cultivated in this area for future research to promote its use.
Author Contributions
Conceptualization, B.M. and Y.Z.; methodology, Y.Z.; software, B.M.; validation, B.M. and Y.Z.; formal analysis, B.M.; investigation, B.M.; resources, Y.Z.; data curation, B.M.; writing—original draft preparation, B.M.; writing—review and editing, Y.Z.; visualization, B.M.; supervision, Y.Z.; project administration, Y.Z.; funding acquisition, Y.Z. All authors have read and agreed to the published version of the manuscript.
Funding
This research was funded by forestry reform and development funds of the National Forestry and Grassland Administration; and Science Research Project of Hunan Education Department (22A0197).
Institutional Review Board Statement
Not applicable.
Informed Consent Statement
Not applicable.
Data Availability Statement
The original contributions presented in the study are included in the article; further inquiries can be directed to the corresponding author.
Acknowledgments
We thank Youhuang Guo and Yanan Chen for their valuable suggestions on the conservation of species’ habitat, and we are grateful for their continuous attention and support for our research. Additionally, we extend our thanks to Pan Huang for sharing his expertise on data resolution, which was crucial in predicting the potential suitable areas for P. zhennan. The species data of this study were provided by the Plant Science Center of the Network Information System for the Construction Project of the Biological Specimen Museum of the Chinese Academy of Sciences (free of charge).
Conflicts of Interest
The authors declare no conflicts of interest.
References
- Lambert, A.M.; Miller-Rushing, A.J.; Inouye, D.W. Changes in snowmelt date and summer precipitation affect the flowering phenology of Erythronium grandiflorum (glacier lily; Liliaceae). Am. J. Bot. 2010, 97, 1431–1437. [Google Scholar] [CrossRef]
- Xu, K.; Wang, X.; Jiang, C.; Sun, O.J. Assessing the vulnerability of ecosystems to climate change based on climate exposure, vegetation stability and productivity. For. Ecosyst. 2020, 7, 315–326. [Google Scholar] [CrossRef]
- Gou, L.; Xiao, J.; Huang, J.; Ying, L.; Wei, Y.; Peng, C.; Luo, M. Soil fauna community after removal of litter and herb layers in an artificial Phoebe zhennan plantation. J. Zhejiang A F Univ. 2017, 34, 895–906. [Google Scholar] [CrossRef]
- Moriuchi, K.S.; Winn, A.A. Relationships among growth, development and plastic response to environment quality in a perennial plant. New Phytol. 2005, 166, 149–158. [Google Scholar] [CrossRef]
- Hu, S.K.; Liu, C.; Wei, P.J.; Li, M.; Hu, D. Community characteristics of the wild Phoebe and Machilus plants in Yuan’an County, Hubei Province. J. Zhejiang A F Univ. 2020, 37, 702–709. [Google Scholar] [CrossRef]
- Zhao, Y.; Xiao, D.; Bai, H.; Tao, F. Research progress on the response and adaptation of crop phenology to climate change in China. Prog. Geogr. 2019, 38, 224–235. [Google Scholar] [CrossRef]
- Zhou, R.; Ci, X.; Xiao, J.; Cao, G.; Li, J. Effects and conservation assessment of climate change on the dominant group—The genus Cinnamomum of subtropical evergreen broad-leaved forests. Biodivers. Sci. 2021, 29, 697–711. [Google Scholar] [CrossRef]
- Zhu, G.; Liu, G.; Bu, W.; Gao, Y. Ecological niche modeling and its applications in biodiversity conservation. Biodivers. Sci. 2013, 21, 90–98. [Google Scholar] [CrossRef]
- Sutherst, R.W.; Maywald, G.F. A computerised system for matching climates in ecology. Agric. Ecosyst. Environ. 1985, 13, 281–299. [Google Scholar] [CrossRef]
- Honig, M.A.; Cowling, R.M.; Richardson, D.M. The invasive potential of Australian banksias in South African fynbos: A comparison of the reproductive potential of Banksia ericifolia and Leucadendron laureolum. Austral Ecol. 1992, 17, 305–314. [Google Scholar] [CrossRef]
- Carpenter, G.; Gillison, A.N.; Winter, J. DOMAIN: A flexible modelling procedure for mapping potential distributions of plants and animals. Biodivers. Conserv. 1993, 2, 667–680. [Google Scholar] [CrossRef]
- Phillips, S.J.; Dudík, M.; Schapire, R.E. A maximum entropy approach to species distribution modeling. In Proceedings of the Twenty-First International Conference on Machine Learning, Banff, AB, Canada, 4–8 July 2004; p. 83. [Google Scholar] [CrossRef]
- Shen, S.; Zheng, F.; Zhang, W.; Xu, G.; Li, D.; Yang, S.; Jin, G.; Clements, D.R.; Nikkel, E.; Chen, A.; et al. Potential distribution and ecological impacts of Acmella radicans (Jacquin) R.K. Jansen (a new Yunnan invasive species record) in China. BMC Plant Biol. 2024, 24, 494. [Google Scholar] [CrossRef]
- Zhang, Y.; Tang, J.; Ren, G.; Zhao, K.; Wang, X. Global potential distribution prediction of Xanthium italicum based on Maxent model. Sci. Rep. 2021, 11, 16545. [Google Scholar] [CrossRef]
- Song, X.; Milne, R.I.; Fan, X.; Xie, S.; Zhang, L.; Zheng, H.; Fan, L.; Chung, J.M.; Chung, M.G.; Ma, T.; et al. Blow to the Northeast? Intraspecific differentiation of Populus davidiana suggests a north-eastward skew of a phylogeographic break in East Asia. J. Biogeogr. 2020, 48, 187–201. [Google Scholar] [CrossRef]
- Phillips, S.; Dudík, M. Modeling of species distributions with MAXENT: New extensions and a comprehensive evaluation. Ecography 2008, 31, 161–175. [Google Scholar] [CrossRef]
- Chen, K.; Wang, B.; Chen, C.; Zhou, G.-y. MaxEnt Modeling to Predict the Current and Future Distribution of Pomatosace filicula under Climate Change Scenarios on the Qinghai–Tibet Plateau. Plants 2022, 11, 670. [Google Scholar] [CrossRef]
- Liu, L.; Guan, L.; Zhao, H.; Huang, Y.; Mou, Q.; Liu, K.; Chen, T.; Wang, X.; Zhang, Y.; Wei, B.; et al. Modeling habitat suitability of Houttuynia cordata Thunb (Ceercao) using MaxEnt under climate change in China. Ecol. Inform. 2021, 63, 101324. [Google Scholar] [CrossRef]
- Zhou, Y.; Zhang, Z.-X.; Zhu, B.; Cheng, X.-R.; Yang, L.; Gao, M.; Kong, R. MaxEnt Modeling Based on CMIP6 Models to Project Potential Suitable Zones for Cunninghamia lanceolata in China. Forests 2021, 12, 752. [Google Scholar] [CrossRef]
- Li, D.; Li, B.; Hou, X.; Wang, X.; Li, X.; Zhang, Y. Habitat suitability assessment for Saunders’s Gull (Saundersilarus saundersi) in the Yellow River Delta, China. Ecol. Inform. 2024, 79, 102393. [Google Scholar] [CrossRef]
- Yang, S.Y.; An, M.T.; Liu, F.; Zhang, Y.; Tian, L.; Chen, C.Y. Prediction of potential suitable area of Phoebe zhennan in Guizhou Province based on MaxEnt model. Guihaia 2023, 43, 846–857. [Google Scholar] [CrossRef]
- Huang, C.; Zhu, S.; Hu, D. Investigation into the Wild Phoebe Resources in Xingshan County, Hubei Province. J. Yunnan Agric. Univ. (Nat. Sci.) 2018, 33, 721–728. [Google Scholar] [CrossRef]
- CVH. Available online: https://www.cvh.ac.cn/species/taxon_tree.php (accessed on 18 February 2024).
- WorldClim. Available online: https://worldclim.org/data/index.html (accessed on 18 February 2024).
- Luo, J.J.; Tang, W.-Z.; Ding, J.T. Research of ATC Simulator Training Values Independence Based on Pearson Correlation Coefficient and Study of Data Visualization Based on Factor Analysis. Comput. Sci. 2021, 48, 623–628. [Google Scholar] [CrossRef]
- Lai, W.; Shi, C.; Wen, G.; Lu, Z.; Ye, L.; Huang, Q.; Zhang, G. Potential impacts of climate change on the distribution of the relict plant Shaniodendron subaequale. Heliyon 2023, 9, e14402. [Google Scholar] [CrossRef]
- Mahmoodi, S.; Heydari, M.; Ahmadi, K.; Khwarahm, N.R.; Karami, O.; Almasieh, K.; Naderi, B.; Bernard, P.; Mosavi, A. The current and future potential geographical distribution of Nepeta crispa Willd., an endemic, rare and threatened aromatic plant of Iran: Implications for ecological conservation and restoration. Ecol. Indic. 2022, 137, 108752. [Google Scholar] [CrossRef]
- Wang, Y.; Zhao, R.; Zhou, X.; Zhang, X.; Zhao, G.; Zhang, F. Prediction of potential distribution areas and priority protected areas of Agastache rugosa based on Maxent model and Marxan model. Front. Plant Sci. 2023, 14, 1200796. [Google Scholar] [CrossRef]
- Yang, F.; Zhang, X.; Li, Z. Spatial differentiation of the “production-life-ecology”competitiveness in urban tourism: A case study of five provinces in northwest China. Arid Land Geogr. 2019, 42, 664–672. [Google Scholar] [CrossRef]
- Li, N.; Xu, G. Grid analysis of land use based on natural breaks (jenks) classification. Bull. Surv. 2020, 106–110+156. [Google Scholar] [CrossRef]
- Lu, Y.; Xiang, P.A.; Yu, L. Agglomeration and spatial dependence of organic agriculture in China. Chin. J. Eco-Agric. 2021, 29, 440–452. [Google Scholar] [CrossRef]
- Zhu, X.; Liu, T.; Xu, K.; Chen, C. The impact of high temperature and drought stress on the yield of major staple crops in northern China. J. Environ. Manag. 2022, 314, 115092. [Google Scholar] [CrossRef]
- Xie, C.; Li, M.; Jim, C.Y.; Liu, D. Environmental Factors Driving the Spatial Distribution Pattern of Venerable Trees in Sichuan Province, China. Plants 2022, 11, 3581. [Google Scholar] [CrossRef]
- Ding, X.; Xiao, J.H.; Huang, J.F.; Li, J. Investigation on Wild Resource of Valuable Timber Tree Phoebe zhennan (Lauraceae). Plant Divers. Resour. 2015, 37, 629–639. [Google Scholar] [CrossRef]
- Weng, Y.; Cai, W.; Wang, C. The application and future directions of the Shared Socioeconomic Pathways (SSPs). Clim. Chang. Res. 2020, 16, 215–222. [Google Scholar] [CrossRef]


Disclaimer/Publisher’s Note: The statements, opinions and data contained in all publications are solely those of the individual author(s) and contributor(s) and not of MDPI and/or the editor(s). MDPI and/or the editor(s) disclaim responsibility for any injury to people or property resulting from any ideas, methods, instructions or products referred to in the content. |
© 2024 by the authors. Licensee MDPI, Basel, Switzerland. This article is an open access article distributed under the terms and conditions of the Creative Commons Attribution (CC BY) license (https://creativecommons.org/licenses/by/4.0/).