
Temporal–Spatial Characteristics of Carbon Emissions and Low-Carbon Efficiency in Sichuan Province, China

Abstract
:1. Introduction
2. Literature Review
2.1. Calculation of Regional Carbon Emissions
- (1)
- The emission factor method mainly investigates the emission level by multiplying the basic activity data of different emission sources by the corresponding carbon emission factors [24]. It is the most widely used calculation method, and is mainly applicable to the macro-level analysis at the national and provincial levels. Its advantages are that it is simple, clear and easy to understand, with mature calculation formulas and sufficient basic activity data from different statistical sources. Meanwhile, the existing emission factor database can provide the default parameters needed for calculation, and there is a large number of application examples for reference. Its disadvantage is that the calculation is mainly carried out at the macro level, and its response ability to the changes in the emission system is poor. Zhou [25] investigated the carbon emission characteristics of 31 provinces, municipalities, and autonomous prefectures in China, except Tibet, based on the emission factor method. However, this study mainly focused on carbon emissions from energy activities, so it was impossible to identify the key emission sources and the evaluation results were not comprehensive. Based on the emission factor method, Darwish [26] investigated the carbon emission characteristics of four cold metropolitan areas, such as Chicago and Boston, and made a comparative analysis with other areas in the United States. However, the research perspective was limited to the carbon emission contribution of land use practice and transportation behavior.
- (2)
- The mass balance method mainly calculates the share of new chemicals consumed to meet the capacity of new equipment or replace the removed gas in national production and residential life every year [27]. This method is mainly suitable for situations of rapid social and economic development, frequent replacement of emission equipment, and complex natural emission sources. Its advantage is that it can calculate the carbon emissions of facilities and equipment in different sectors at the micro level, thus improving the comprehensiveness of the analysis results. Its disadvantage is that there are many intermediate emission processes that need to be taken into consideration, which make it easy to increase system errors and difficult to obtain detailed basic data. Ryoo [28] and Fiehn [29] used the mass balance method based on flight observation data to investigate the carbon emission characteristics of Sacramento, California, and the Silesia coal basin, respectively. The errors mainly came from the uncertainty of atmospheric background mole fraction and the change in planetary boundary layer height during morning flight, and the biosphere flux also increased the difficulty of quantitative analysis. Based on the traditional mass balance method, Pitt [30] assumed that the scale emission is not limited to a clearly defined area, and comprehensively considered the carbon emission effect around the research area, thus proposing a new modeling method. Then, the carbon emission characteristics of London were investigated, and compared with the emission inventory calculated based on traditional methods. The new method did not need to separate the city from the surrounding emission sources, so it had wider applicability.
- (3)
- Based on the measured basic data of emission sources, the actual measurement method summarizes the relevant carbon emissions, which specifically includes an on-site measurement method and an off-site measurement method [31]. The method is mainly suitable for emission sources in small areas and is capable of obtaining first-hand monitoring data. Its advantage is that there are few intermediate links, so the results are accurate. Its disadvantage is that data acquisition is relatively difficult, the investment is large, and the accuracy is influenced by sample representativeness. Chen [32] investigated the annual carbon emission characteristics of 247 sewage treatment plants in 7 regions of China based on the actual measurement method and determined the emission reduction potential of regional sewage treatment. Weltman [33] investigated the carbon emissions of household solid fuel consumption in Haryana, India based on the actual measurement method. The results showed that there was a great difference between the field carbon emissions in daily cooking activities and the measurement values obtained in the laboratory.
2.2. Evaluation of Regional Low-Carbon Efficiency
- (1)
- The comprehensive indicator evaluation method mainly constructs a comprehensive index system from the aspects of economy, technology, environment, and policy. Furthermore, combined with objective weighting methods such as the entropy weight model and subjective weighting methods such as the Delphi model, the regional low-carbon efficiency is quantitatively evaluated [34]. Liu [35] established a low-carbon efficiency evaluation system for regional tourism development based on three dimensions: economic support level, low-carbon development level, and policy support level, and further used the Delphi and Analytic Hierarchy Process (AHP) methods to carry out an empirical evaluation of the Daxinganling area. However, because this study mainly determined the index weight based on expert experience, it inevitably had subjective defects. Ye [36] established a low-carbon efficiency evaluation system of regional power system based on three dimensions: power generation side, power grid side, and load side, and determined the weights through a multi-scenario dispatching simulation and an index sensitivity analysis. On this basis, an empirical evaluation for the power system in a certain area of Zhejiang Province, China was carried out.
- (2)
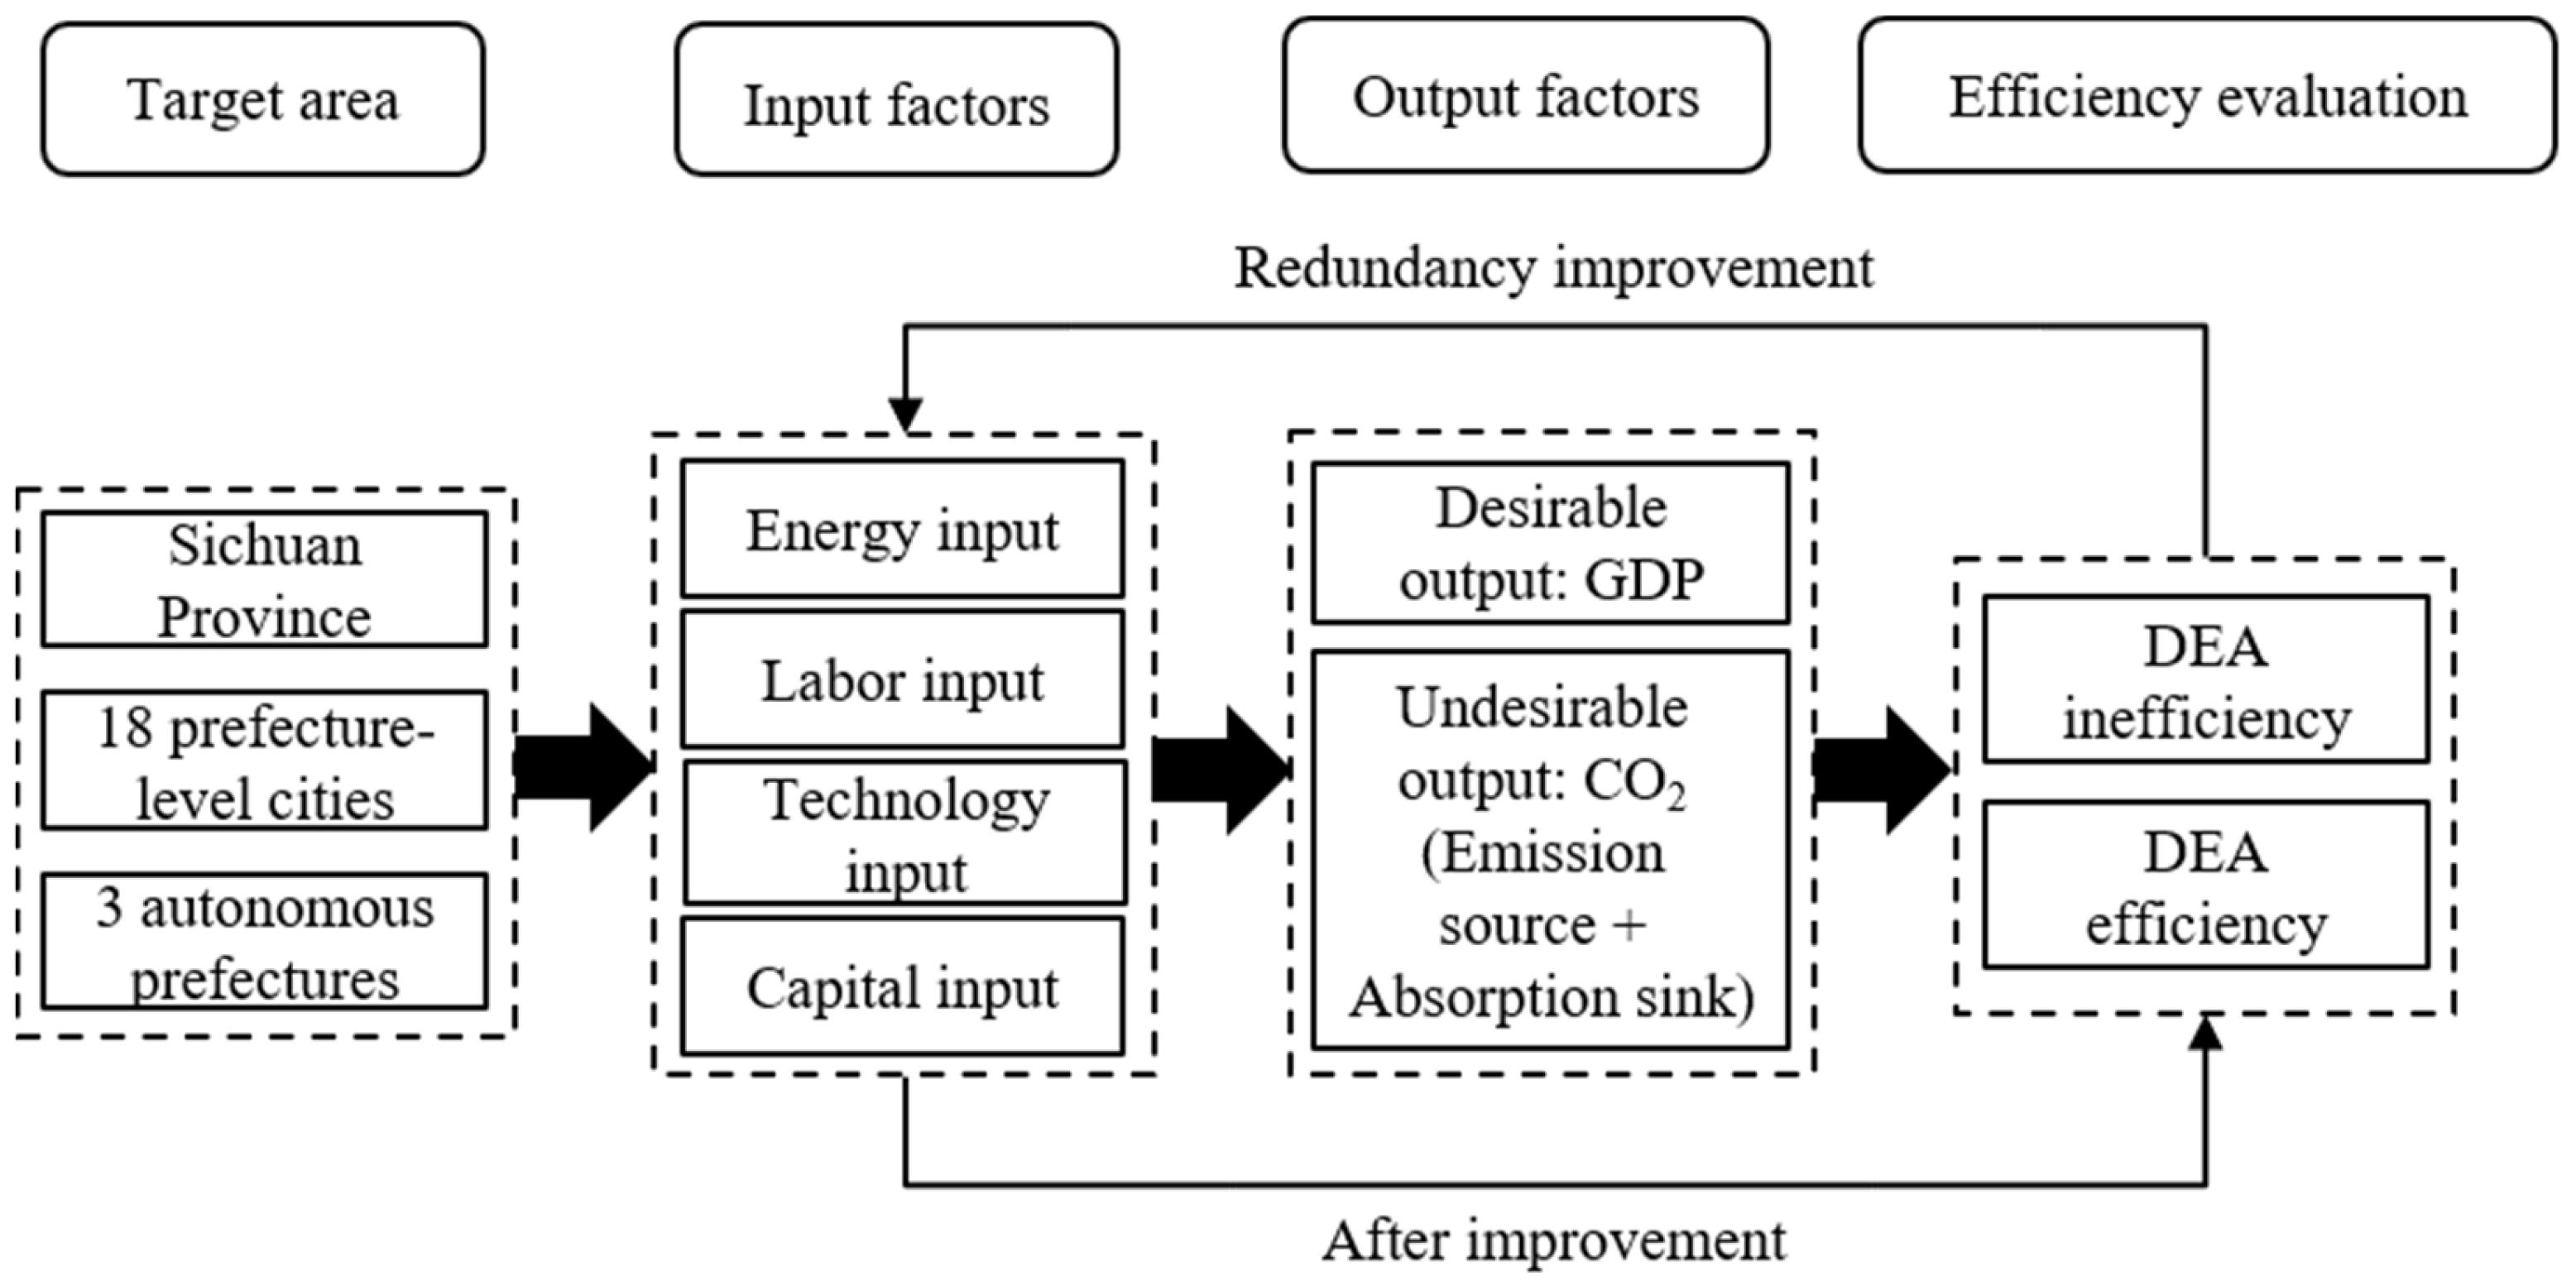
- The DEA model mainly evaluates efficiency by constructing an input–output index system. Specifically, the input mainly includes energy, population, assets, and other elements, and the output mainly includes desirable outputs such as GDP and undesirable outputs such as pollutants. DEA model analysis has the characteristics of dimensionless data processing, which can reduce model deviation and avoid subjective interference. Therefore, it has been widely used in the research field of efficiency evaluation. Gouveia [37] used the DEA model to evaluate the low-carbon economic efficiency of 23 beneficiary EU countries. However, the input and output indicators considered in this study only include four elements: EU co-financing, eligible total expenditure, decided eligible expenses, and greenhouse gas emission reduction, so the comprehensiveness of the evaluation results needs further improvement. However, this study mainly used emission reduction to evaluate the adverse output of economic development; that is, it was treated as a positive indicator in an actual evaluation. After data transformation, the model could only be solved under the condition of variable scale return, so the solution analysis had limitations. Keivani [38] further introduced the undesirable output into the DEA model and carried out an empirical evaluation for the low-carbon efficiency of regional petrochemical plants from 2011 to 2017. However, the traditional DEA model often assumes that the input, desirable output, and undesirable output need to be adjusted in equal proportion, which is contrary to the actual situation. Based on slack-based measurement (SBM), Zha [39] used the SBM-Undesirable model to evaluate the development efficiency of urban low-carbon tourism economy in Hubei Province from 2007 to 2013. However, in this study, the efficiency values of decision-making units (DMUs) on the frontier of effective production were all equal to 1, so it was impossible to carry out a differentiated ranking for these effective DMUs. Tao [40] and Zhang [41] further introduced the super-efficiency setting into DEA model; that is, the evaluation values of effective DMUs were allowed to be greater than one. On this basis, the green and low-carbon efficiencies of 30 selected provinces in China were quantitatively analyzed, respectively. However, the input factors considered in the above research are limited to labor, capital investment, and energy, and the comprehensiveness of the indicators need to be further improved.
3. Model and Data
3.1. Calculation Method of Regional Carbon Emissions
3.1.1. Energy Activity
- (1)
- Fuel Combustion
- (2)
- Inter-regional power allocation
3.1.2. Industrial Production
- (1)
- Cement production
- (2)
- Steel production
- (3)
- Glass production
- (4)
- Calcium carbide production
3.1.3. Forestry Activity
- (1)
- Biomass growth
- (2)
- Wood harvesting
- (3)
- Natural disturbance
3.1.4. Waste Disposal
3.2. Evaluation Method of Regional Low-Carbon Efficiency
3.2.1. Super-SBM-Undesirable Model
3.2.2. Indicator Selection and Data Source
- (1)
- Energy input. The total annual energy consumption of Sichuan Province and its 21 cities (states) is used to represent the energy input level [75]. In order to compare the energy consumption of different years more intuitively and eliminate the impact of differences in energy units, the consumption of primary energy such as coal, oil, and natural gas in different years is uniformly converted into standard coal for evaluation during data analysis.
- (2)
- Labor input. Due to the unavailability of data on indicators such as education level and labor efficiency of the labor force, the measurement of labor input is based on the annual number of employed personnel in Sichuan Province and its 21 cities (states) [76].
- (3)
- Technology input. The development speed of advanced technology depends on the investment level of scientific research funds [77]. Therefore, the technology input is expressed as the proportion of the annual scientific and technological expenditure of Sichuan Province and its 21 cities (states) to the regional public budget expenditure.
- (4)
- Capital input. Capital stock can effectively represent capital investment. However, because the relevant data of capital stock cannot be directly found, it is necessary to estimate the capital stock in statistical analysis. At present, academic circles usually use the perpetual inventory method (PIM) pioneered by Goldsmith [78] to measure the capital stock, and its basic formula is shown in Formula (13).
- (5)
- Desirable output. The regional GDP of Sichuan Province and its 21 cities (states) from 2015 to 2022 is selected as the desirable output variable of low-carbon efficiency calculation [79]. In order to avoid the impact of price changes, based on the GDP deflator, the original data are uniformly converted into a comparable GDP based on the price level in 2015.
- (6)
- Undesirable output. The undesirable output index is selected as the regional net carbon emission, and its level evaluation is based on the calculation method established in Section 3.1. Energy activity and industrial production are selected as the main carbon emission sources [80]. Meanwhile, in order to consider the driving effect of the forest carbon sink on the improvement in low-carbon efficiency, the carbon absorption in the process of forest growth is also included in the empirical evaluation.
4. Empirical Analysis
4.1. Regional Carbon Emission Characteristics
- (1)
- Energy activity
- (2)
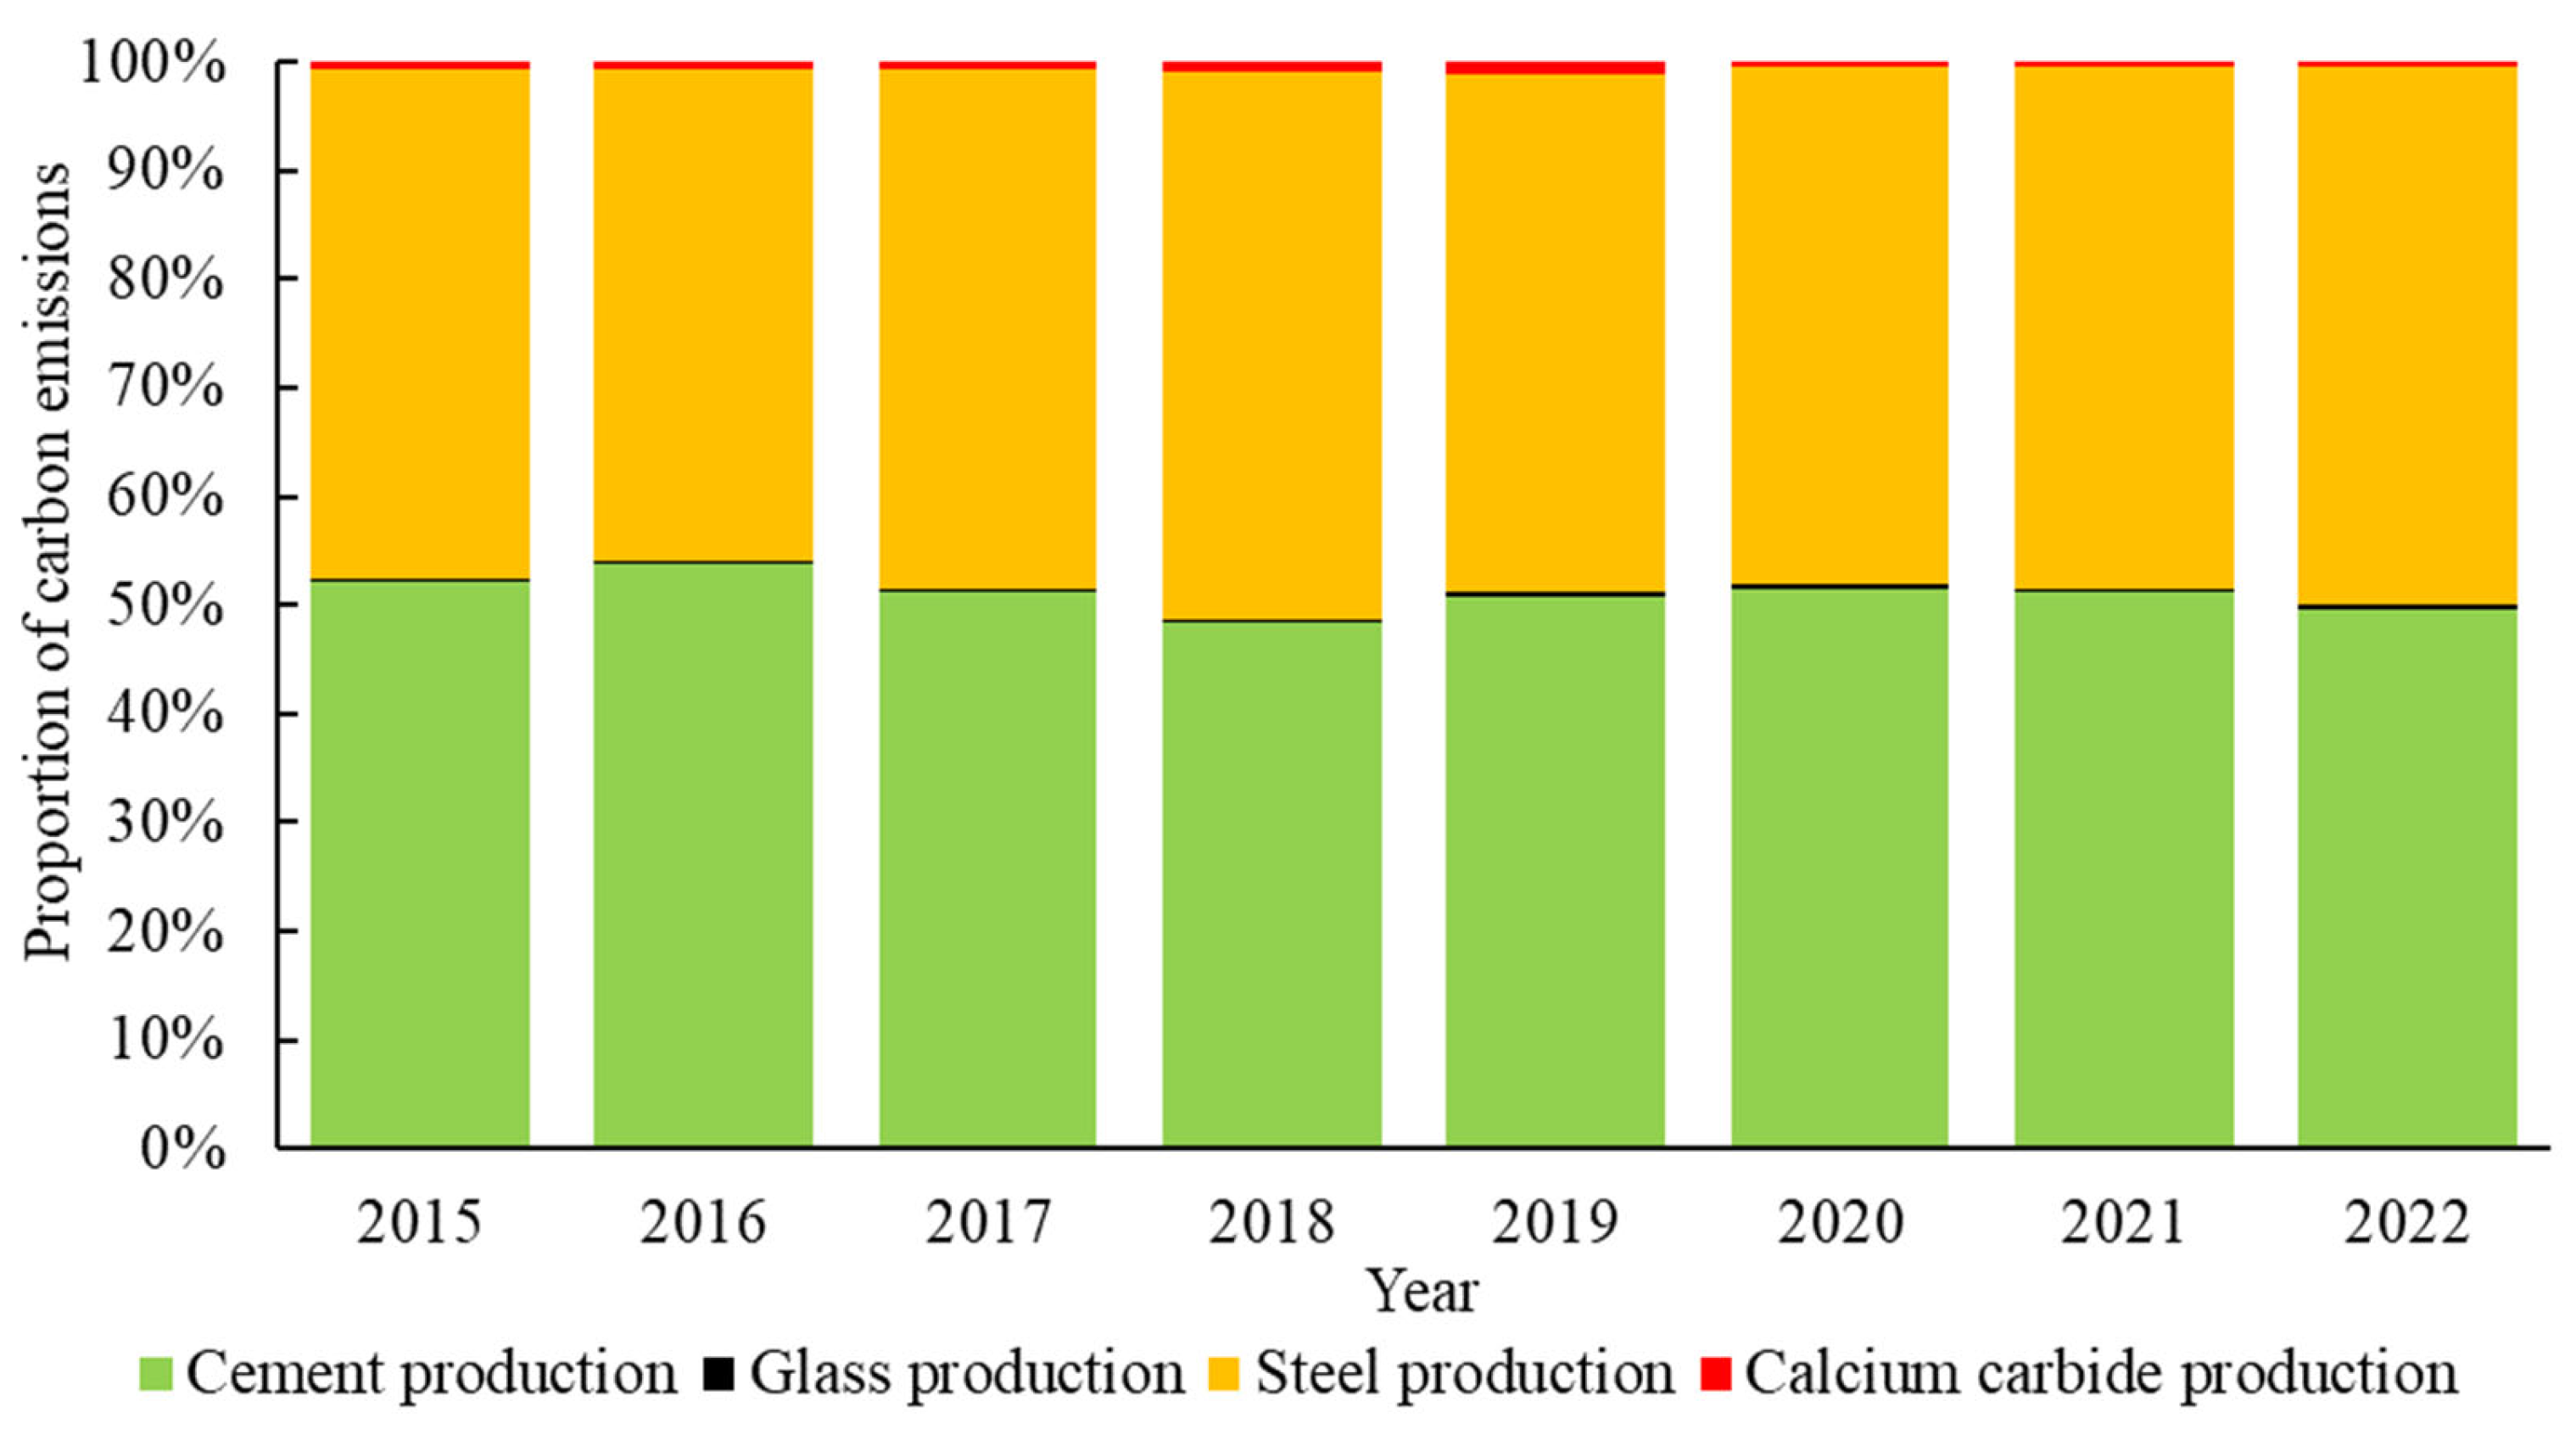
- Industrial production
- (3)
- Forestry activity
- (4)
- Waste disposal
4.2. Regional Low-Carbon Efficiency
- (1)
- Analysis based on provincial perspective
- (2)
- Analysis based on urban perspective
5. Conclusions and Policy Implications
Author Contributions
Funding
Institutional Review Board Statement
Informed Consent Statement
Data Availability Statement
Conflicts of Interest
References
- Silva, J.M.C.; Araujo, L.S.; Torres, R.R.; Barbosa, L.C.F. The sustainability of development pathways and climate change vulnerability in the Americas. Ecol. Econ. 2024, 220, 108164. [Google Scholar] [CrossRef]
- Lucas, A. Risking the earth Part 1: Reassessing dangerous anthropogenic interference and climate risk in IPCC processes. Clim. Risk Manag. 2021, 31, 100257. [Google Scholar] [CrossRef]
- Liang, X.Y.; Min, F.; Xiao, Y.T.; Yao, J. Temporal-spatial characteristics of energy-based carbon dioxide emissions and driving factors during 2004–2019, China. Energy 2022, 261, 124965. [Google Scholar] [CrossRef]
- Zhu, H.T.; Cao, S.; Su, Z.M.; Zhuang, Y. China’s future energy vision: Multi-scenario simulation based on energy consumption structure under dual carbon targets. Energy 2024, 301, 131751. [Google Scholar] [CrossRef]
- Luo, S.H.; Hu, W.H.; Liu, W.; Xu, X.; Huang, Q.; Chen, Z.; Lund, H. Transition pathways towards a deep decarbonization energy system—A case study in Sichuan, China. Appl. Energy 2021, 302, 117507. [Google Scholar] [CrossRef]
- Li, Q.C.; Zhang, P.; Chen, J.H. Does energy transformation improve green development efficiency? Evidence from Sichuan Province, China. Energy Rep. 2024, 12, 861–871. [Google Scholar] [CrossRef]
- Li, W.Q.; Zhang, F.; Pan, L.Y.; Li, Z. Scenario analysis of carbon emission trajectory on energy system transition model: A case study of Sichuan Province. Energy Strategy Rev. 2023, 45, 101015. [Google Scholar] [CrossRef]
- Ju, L.; Luo, M.S.; Luo, H.; Ma, Z.L.; Lu, X.P.; Jiang, G.X. Hydropower functional zoning with crowdsourced geospatial data: A case study in Sichuan Province. Appl. Sci. 2023, 13, 7260. [Google Scholar] [CrossRef]
- Li, Q.C.; Chen, J.H.; Zhang, P. Study on carbon emission characteristics and its influencing factors of energy consumption in Sichuan Province, China. Front. Environ. Sci. 2024, 12, 1414730. [Google Scholar] [CrossRef]
- Ito, A.; Nishina, K.; Noda, H. Evaluation of global warming impacts on the carbon budget of terrestrial ecosystems in monsoon Asia: A multi-model analysis. Ecol. Res. 2016, 31, 459–474. [Google Scholar] [CrossRef]
- Ligardo-Herrera, I.; Quintana-Gallardo, A.; Stascheit, C.W.; Gómez-Navarro, T. Make your home carbon-free. An open access planning tool to calculate energy-related carbon emissions in districts and dwellings. Energy Rep. 2022, 8, 11404–11415. [Google Scholar] [CrossRef]
- Ustaoglu, A.; Yaras, A.; Sutcu, M.; Gencel, O. Investigation of the residential building having novel environment-friendly construction materials with enhanced energy performance in diverse climate regions: Cost-efficient, low-energy and low-carbon emission. J. Build. Eng. 2021, 43, 102617. [Google Scholar] [CrossRef]
- Tekin, P.; Alici, H.; Demirdelen, T. A life cycle analysis of a polyester–wool blended fabric and associated carbon emissions in the textile industry. Energies 2024, 17, 312. [Google Scholar] [CrossRef]
- Zhang, W.P.; Wu, X.H.; Chen, J.H. Low-carbon efficiency analysis of rail-water multimodal transport based on cross efficiency network DEA approach. Energy 2024, 305, 132348. [Google Scholar] [CrossRef]
- Chen, K.Y.; Qiu, T.; Chen, X.S.; He, Q.F.; Huang, J.H.; Wang, L.; Su, D.; Lai, Y.N. Low-carbon efficiency assessment for Hong Kong’s oceanic artificial cities applying the novel prefabricated diaphragm wall technology. J. Build. Eng. 2024, 84, 108545. [Google Scholar] [CrossRef]
- Zhou, X.Y.; Li, G.C.; Wang, Q.W.; Zhou, D.Q. U-shaped relationship between digitalization and low-carbon economy efficiency: Mediation and spillover effects. J. Clean. Prod. 2024, 458, 142535. [Google Scholar] [CrossRef]
- Wu, S.; Yuan, X.Y.; Ni, J.W. Efficiency evaluation and redundancy analysis on low carbon economic development in Guangdong Province. PLoS ONE 2023, 18, e0294112. [Google Scholar] [CrossRef]
- Zhang, H.; Feng, C.; Zhou, X.X. Going carbon-neutral in China: Does the low-carbon city pilot policy improve carbon emission efficiency? Sustain. Prod. Consum. 2022, 33, 312–329. [Google Scholar] [CrossRef]
- Wen, S.Y.; Jia, Z.J.; Chen, X.Q. Can low-carbon city pilot policies significantly improve carbon emission efficiency? Empirical evidence from China. J. Clean. Prod. 2022, 346, 131131. [Google Scholar] [CrossRef]
- Borja-Patiño, J.; Robalino-López, A.; Mena-Nieto, A. Breaking the unsustainable paradigm: Exploring the relationship between energy consumption, economic development and carbon dioxide emissions in Ecuador. Sustain. Sci. 2024, 19, 403–421. [Google Scholar] [CrossRef]
- Nejati, M.; Taleghani, F. Pollution halo or pollution haven? A CGE appraisal for Iran. J. Clean. Prod. 2022, 344, 131092. [Google Scholar] [CrossRef]
- Jiang, Z.J.; Lyu, P.J. Stimulate or inhibit? Multiple environmental regulations and pollution-intensive Industries’ Transfer in China. J. Clean. Prod. 2021, 328, 129528. [Google Scholar] [CrossRef]
- Touza, J.; Lacambra, C.; Kiss, A.; Amboage, R.M.; Sierra, P.; Solan, M.; Godbold, J.A.; Spencer, T.; White, P.C.L. Coping and Adaptation in Response to Environmental and Climatic Stressors in Caribbean Coastal Communities. Environ. Manag. 2021, 68, 505–521. [Google Scholar] [CrossRef] [PubMed]
- Makondo, C.C. Green growth, sustainability, and decoupling carbon emissions from industrial activities in emerging economies: A focus on Zambia’s energy sector. Extr. Ind. Soc. 2023, 14, 101271. [Google Scholar] [CrossRef]
- Zhou, K.L.; Yang, J.N.; Yang, T.; Ding, T. Spatial and temporal evolution characteristics and spillover effects of China’s regional carbon emissions. J. Environ. Manag. 2023, 325, 116423. [Google Scholar] [CrossRef]
- Darwish, A.M.; Zagow, M.; Elkafoury, A. Impact of land use, travel behavior, and socio-economic characteristics on carbon emissions in cool-climate cities, USA. Environ. Sci. Pollut. Res. 2023, 30, 91108–91124. [Google Scholar] [CrossRef]
- Davydenko, I.; Hopman, M.; Fransen, R.; Harmsen, J. Mass-balance method for provision of net zero emission transport services. Sustainability 2022, 14, 6125. [Google Scholar] [CrossRef]
- Ryoo, J.M.; Iraci, L.; Tanaka, T.; Marrero, J.; Yates, E.; Fung, I.; Michalak, A.; Tadić, J.; Gore, W.; Bui, T.P.; et al. Quantification of CO2 and CH4 emissions over Sacramento, California, based on divergence theorem using aircraft measurements. Atmos. Meas. Tech. 2019, 12, 2949–2966. [Google Scholar] [CrossRef]
- Fiehn, A.; Kostinek, J.; Eckl, M.; Klausner, T.; Gałkowski, M.; Chen, J.X.; Gerbig, C.; Röckmann, T.; Maazallahi, H.; Schmidt, M.; et al. Estimating CH4, CO2 and CO emissions from coal mining and industrial activities in the Upper Silesian Coal Basin using an aircraft-based mass balance approach. Atmos. Chem. Phys. 2020, 20, 12675–12695. [Google Scholar] [CrossRef]
- Pitt, J.R.; Allen, G.; Bauguitte, S.J.B.; Gallagher, M.W.; Lee, J.D.; Drysdale, W.; Nelson, B.; Manning, A.J.; Palmer, P.I. Assessing London CO2, CH4 and CO emissions using aircraft measurements and dispersion modelling. Atmos. Chem. Phys. 2019, 19, 8931–8945. [Google Scholar] [CrossRef]
- Wiesner, A.; Pfeifer, S.; Merkel, M.; Tuch, T.; Weinhold, K.; Wiedensohler, A. Real world vehicle emission factors for black carbon derived from longterm in-situ measurements and inverse modelling. Atmosphere 2021, 12, 31. [Google Scholar] [CrossRef]
- Chen, J.B.; Ao, Z.D.; Chen, H.L.; Wang, Y.A.; Jiang, M.; Qi, L.; Liu, G.H.; Wang, H.C. Analyzing greenhouse gas emissions and influencing factors of 247 actual wastewater treatment plants in China using emission factor and operational data integrated methods (ODIM). Environ. Sci. Pollut. Res. 2024, 31, 37387–37403. [Google Scholar] [CrossRef] [PubMed]
- Weltman, R.M.; Edwards, R.D.; Fleming, L.T.; Yadav, A.; Weyant, C.L.; Rooney, B.; Seinfeld, J.H.; Arora, N.K.; Bond, T.C.; Nizkorodov, S.A.; et al. Emissions Measurements from Household Solid Fuel Use in Haryana, India: Implications for Climate and Health Co-benefits. Environ. Sci. Technol. 2021, 55, 3201–3209. [Google Scholar] [CrossRef] [PubMed]
- Yang, C.M.; Li, S.Y.; Huang, D.X.; Lo, W. Performance evaluation of carbon-neutral cities based on fuzzy AHP and HFS-VIKOR. Systems 2024, 12, 173. [Google Scholar] [CrossRef]
- Liu, Y.M.; Suk, S. Constructing an evaluation index system for China’s low-carbon tourism region—An example from the Daxinganling region. Sustainability 2021, 13, 12026. [Google Scholar] [CrossRef]
- Ye, J.C.; Zhang, H.B.; Huang, H.; Hu, X.W.; Wu, X.H.; Qiu, Y.; Liao, H.X.; Zhu, Y.F. A low-carbon evaluation framework for regional power systems. Front. Energy Res. 2024, 12, 1366682. [Google Scholar] [CrossRef]
- Gouveia, M.; Henriques, C.; Amaro, A. Is the cohesion policy efficient in supporting the transition to a low-carbon economy? Some insights with value-based data envelopment analysis. Sustainability 2022, 14, 11587. [Google Scholar] [CrossRef]
- Keivani, E.; Abbaspour, M.; Abedi, Z.; Ahmadian, M. Promotion of low-carbon economy through efficiency analysis: A case study of a petrochemical plant. Int. J. Environ. Res. 2021, 15, 45–55. [Google Scholar] [CrossRef]
- Zha, J.P.; He, L.M.; Liu, Y.; Shao, Y.H. Evaluation on development efficiency of low-carbon tourism economy: A case study of Hubei Province, China. Socio-Econ. Plan. Sci. 2019, 66, 47–57. [Google Scholar] [CrossRef]
- Tao, M.M.; Thye, G.L.; Chandran, G.V. The role of industrial structure adjustment in China’s low-carbon eco-efficiency: A Super-Slack-Based Measure (Super-SBM) approach. Int. J. Econ. Manag. 2022, 16, 21–43. [Google Scholar]
- Zhang, Y.; Shen, L.; Shuai, C.; Tan, Y.; Ren, Y.; Wu, Y. Is the low-carbon economy efficient in terms of sustainable development? A global perspective. Sustain. Dev. 2019, 27, 130–152. [Google Scholar] [CrossRef]
- Li, W.J.; Yu, X.Z.; Hu, N.; Huang, F.; Wang, J.; Peng, Q.N. Study on the relationship between fossil energy consumption and carbon emission in Sichuan Province. Energy Rep. 2022, 8, 53–62. [Google Scholar] [CrossRef]
- Liu, H.J.; Yan, F.Y. Quantitative analysis of impact factors and scenario prediction of energy related carbon emissions at county level. Int. J. Green Energy 2022, 20, 1342–1351. [Google Scholar] [CrossRef]
- Mitra, N.; Shahriar, S.A.; Lovely, N.; Khan, M.S.; Rak, A.E.; Kar, S.P.; Khaleque, M.A.; Amin, M.F.M.; Kayes, I.; Salam, M.A. Assessing energy-based CO2 emission and workers’ health risks at the shipbreaking industries in Bangladesh. Environments 2020, 7, 35. [Google Scholar] [CrossRef]
- Narayan, P.K.; Narayan, S. Carbon dioxide emissions and economic growth: Panel data evidence from developing countries. Energy Policy 2010, 38, 661–666. [Google Scholar] [CrossRef]
- Arana-Jiménez, M.; Sánchez-Gil, M.C.; Lozano, S. A fuzzy DEA slacks-based approach. J. Comput. Appl. Math. 2022, 404, 113180. [Google Scholar] [CrossRef]
- Wang, J.T.; Zhou, Y.; Cooke, F.L. Low-carbon economy and policy implications: A systematic review and bibliometric analysis. Environ. Sci. Pollut. Res. 2022, 29, 65432–65451. [Google Scholar] [CrossRef]
- Minx, J.C.; Lamb, W.F.; Andrew, R.M.; Canadell, J.G.; Crippa, M.; Döbbeling, N.; Forster, P.M.; Guizzardi, D.; Olivier, J.; Peters, G.P.; et al. A comprehensive and synthetic dataset for global, regional, and national greenhouse gas emissions by sector 1970–2018 with an extension to 2019. Earth Syst. Sci. Data 2021, 13, 5213–5252. [Google Scholar] [CrossRef]
- Köne, A.Ç.; Büke, T. Factor analysis of projected carbon dioxide emissions according to the IPCC based sustainable emission scenario in Turkey. Renew. Energy 2019, 133, 914–918. [Google Scholar] [CrossRef]
- ISO 14064-1; Greenhouse Gases—Part 1: Specifcation with Guidance at the Organization Level for Quantifcation and Reporting of Greenhouse Gas Emissions and Removals. ISO: Geneve, Switzerland, 2018.
- Du, T.T.; Jiao, Y.; Zhang, Y.; Jia, Z.Y.; Wang, J.Q.; Zhang, J.H.; Cheng, Z. Approach for calculating and analyzing carbon emissions and sinks of villages: A case study in Northern China. Energies 2024, 17, 2212. [Google Scholar] [CrossRef]
- Zhen, W.N.; Zang, M.R.; Wang, Y.S.; Qiao, S.J.; Wang, Q.H. Integrated analysis of energy carbon emissions and air pollution in Ningxia based on MGWR and multisource remote sensing data. Arab. J. Geosci. 2023, 16, 522. [Google Scholar] [CrossRef]
- Du Can, S.D.; Price, L.; Zwickel, T. Understanding the full climate change impact of energy consumption and mitigation at the end-use level: A proposed methodology for allocating indirect carbon dioxide emissions. Appl. Energy 2015, 159, 548–559. [Google Scholar] [CrossRef]
- Shamsuzzaman, M.; Shamsuzzoha, A.; Maged, A.; Haridy, S.; Bashir, H.; Karim, A. Effective monitoring of carbon emissions from industrial sector using statistical process control. Appl. Energy 2021, 300, 117352. [Google Scholar] [CrossRef]
- Sousa, V.; Bogas, J.A. Comparison of energy consumption and carbon emissions from clinker and recycled cement production. J. Clean. Prod. 2021, 306, 127277. [Google Scholar] [CrossRef]
- Yue, Q.; Chai, X.C.; Zhang, Y.J.; Wang, Q.; Wang, H.M.; Zhao, F.; Ji, W.; Lu, Y.Q. Analysis of iron and steel production paths on the energy demand and carbon emission in China’s iron and steel industry. Environ. Dev. Sustain. 2022, 25, 4065–4085. [Google Scholar] [CrossRef]
- Guseva, T.V.; Tikhonova, I.O.; Tsevelev, V.N.; Shchelchkov, K.; Averochkin, E.M. Optimization of technological regulation of container glass production: Best available technologies, general binding rules, and carbon intensity of products. Glass Ceram. 2022, 78, 397–401. [Google Scholar] [CrossRef]
- Liu, Z. National carbon emissions from the industry process: Production of glass, soda ash, ammonia, calcium carbide and alumina. Appl. Energy 2016, 166, 239–244. [Google Scholar] [CrossRef]
- Li, Z.J.; Mighri, Z.; Sarwar, S.; Wei, C. Effects of forestry on carbon emissions in China: Evidence from a dynamic spatial Durbin model. Front. Environ. Sci. 2021, 9, 760675. [Google Scholar] [CrossRef]
- Ahmad, A.; Ahmad, S.; Nabi, G.; Zeb, A.; Rajpar, M.N.; Ullah, S.; Khalid, F.; Rahman, M.; Liu, Q.J.; Zu, K.L.; et al. Carbon emissions with forest cover change and wood harvest in the dry temperate region of Pakistan between 1908 and 2015. Front. Environ. Sci. 2022, 10, 876225. [Google Scholar] [CrossRef]
- Xie, S.H.; Kurz, W.A.; McFarlane, P.N. Inward- versus outward-focused bioeconomy strategies for British Columbia’s forest products industry: A harvested wood products carbon storage and emission perspective. Carbon Balance Manag. 2021, 16, 30. [Google Scholar] [CrossRef]
- Zhang, W.Y.; Yang, Y.R.; Hu, C.; Zhang, L.Y.; Hou, B.; Wang, W.F.; Li, Q.Q.; Li, Y.S. NPP and carbon emissions under forest fire disturbance in southwest and northeast China from 2001 to 2020. Forests 2023, 14, 999. [Google Scholar] [CrossRef]
- Muhammad, I.; Zhang, J.J.; Arshian, S.; Cosimo, M. Evolving waste management: The impact of environmental technology, taxes, and carbon emissions on incineration in EU countries. J. Environ. Manag. 2024, 364, 121440. [Google Scholar]
- Charnes, A.; Gallegos, A.; Li, H.Y. Robustly efficient parametric frontiers via multiplicative DEA for domestic and international operations of the Latin American airline industry. Eur. J. Oper. Res. 1996, 88, 525–536. [Google Scholar] [CrossRef]
- Yang, H.D.; Zhang, X.L.; Liu, B.Y.; Huang, Y.L. Evaluation of green low-carbon innovation development efficiency: An improved two-stage non-cooperative DEA mode. J. Clean. Prod. 2023, 400, 136662. [Google Scholar] [CrossRef]
- Banker, R.D.; Charnes, A.; Cooper, W.W. Some models for estimating technical and scale inefficiencies in data envelopment analysis. Manag. Sci. 1984, 30, 1078–1092. [Google Scholar] [CrossRef]
- Seiford, L.M.; Zhu, J. Infeasibility of super-efficiency data envelopment analysis models. INFOR Inf. Syst. Oper. Res. 1999, 37, 174–187. [Google Scholar] [CrossRef]
- Lu, W.T.; Zhang, D.X. Green development efficiency of urban agglomerations in a developing country: Evidence from Beijing-Tianjin-Hebei in China. Environ. Dev. Sustain. 2023, 25, 6939–6962. [Google Scholar] [CrossRef]
- Tone, K.; Tsutsui, M. Network DEA: A slacks-based measure approach. Eur. J. Oper. Res. 2009, 197, 243–252. [Google Scholar] [CrossRef]
- Lee, C.C.; He, Z.W.; Yuan, Z.H. A pathway to sustainable development: Digitization and green productivity. Energy Econ. 2023, 124, 106772. [Google Scholar] [CrossRef]
- Mizuta, K.; Grunwald, S.; Phillips, M.A.; Moss, C.B.; Bacon, A.R.; Cropper, W.P. Sensitivity assessment of metafrontier data envelopment analysis for soil carbon sequestration efficiency. Ecol. Indic. 2021, 125, 107602. [Google Scholar] [CrossRef]
- Lee, H.S. Identifying Pareto-efficient projection of Super-SBM with undesirable outputs: One model approach. J. Oper. Res. Soc. 2023, 74, 1730–1745. [Google Scholar] [CrossRef]
- Olawumi, T.; Chan, D.A. Scientometric review of global research on sustainability and sustainable development. J. Clean. Prod. 2018, 183, 231–250. [Google Scholar] [CrossRef]
- Haas, C.; Jahns, H.; Kempa, K.; Moslener, U. Deep uncertainty and the transition to a low-carbon economy. Energy Res. Soc. Sci. 2023, 100, 103060. [Google Scholar] [CrossRef]
- Luo, H.Y.; Lin, X.Y. Empirical study on the low-carbon economic efficiency in Zhejiang Province based on an improved DEA model and projection. Energies 2023, 16, 300. [Google Scholar] [CrossRef]
- Iribarren, D.; Vázquez-Rowe, I. Is labor a suitable input in LCA + DEA studies? Insights on the combined use of economic, environmental and social parameters. Soc. Sci. 2013, 2, 114–130. [Google Scholar] [CrossRef]
- Wang, C.; Zeng, J.; Zhong, H.; Si, W. Scientific research input and output efficiency evaluation of universities in Chengdu-Chongqing economic circle based on data envelopment analysis. PLoS ONE 2023, 18, e0287692. [Google Scholar] [CrossRef]
- Nehru, V.; Swanson, E.; Dubey, A. A new database on human capital stock in developing and industrial countries: Sources, methodology, and results. J. Dev. Econ. 1995, 46, 379–401. [Google Scholar] [CrossRef]
- Wang, M.X.; Lu, N.; Liu, L.; Chen, L.; Li, X. Research on driving factors and efficiency measures of low-carbon levels in less-developed regions: A case of Western China. Greenh. Gases 2024, 14, 526–545. [Google Scholar] [CrossRef]
- Qin, X.H.; Xu, X.Y.; Yang, Q.K. Carbon peak prediction and emission reduction pathways of China’s low-carbon pilot cities: A case study of Wuxi city in Jiangsu province. J. Clean. Prod. 2024, 447, 141385. [Google Scholar] [CrossRef]
- Sun, G.J.; Gao, R.; Liu, Y.; Liu, Y.X.; Li, C.L. Studying regional low-carbon development: A case study of Sichuan Province in China. PLoS ONE 2024, 19, e0302733. [Google Scholar] [CrossRef]
- Sikarwar, V.S.; Reichert, A.; Jeremias, M.; Manovic, V. COVID-19 pandemic and global carbon dioxide emissions: A first assessment. Sci. Total Environ. 2021, 794, 148770. [Google Scholar] [CrossRef] [PubMed]
- Ray, R.L.; Singh, V.; Singh, S.K.; Acharya, B.S.; He, Y.P. What is the impact of COVID-19 pandemic on global carbon emissions? Sci. Total Environ. 2022, 816, 151503. [Google Scholar] [CrossRef] [PubMed]
- Liu, Z.; Deng, Z.; Davis, S.; Ciais, P. Monitoring global carbon emissions in 2022. Nat. Rev. Earth Environ. 2023, 4, 205–206. [Google Scholar] [CrossRef] [PubMed]
- Wang, J.B.; Chen, L.; Chen, L.; Zhao, X.H.; Wang, M.X.; Ju, Y.Y.; Xin, L. City-level features of energy footprints and carbon dioxide emissions in Sichuan Province of China. Energies 2019, 12, 2025. [Google Scholar] [CrossRef]
- Afroz, R.; Alofaysan, H.; Sarabdeen, M.; Muhibbullah, M.D.; Muhammad, Y.B. Analyzing the influence of energy consumption and economic complexity on carbon emissions: Evidence from Malaysia. Energies 2024, 17, 2900. [Google Scholar] [CrossRef]
- Skomedal, A.F.; Aarseth, B.L.; Haug, H.; Selj, J.; Marstein, E.S. How much power is lost in a hot-spot? A case study quantifying the effect of thermal anomalies in two utility scale PV power plants. Sol. Energy 2020, 211, 1255–1262. [Google Scholar] [CrossRef]
- Wang, G.F.; Mi, L.C.; Hu, J.M.; Qian, Z.Y. Spatial analysis of agricultural eco-efficiency and high-quality development in China. Front. Environ. Sci. 2022, 10, 847719. [Google Scholar] [CrossRef]
- Xiao, L.S.; Li, W.Y.; Dong, L.J.; Wu, X.; Ye, H. Characterizing spatiotemporal dynamics of carbon emissions in peri-urban residential communities: A life cycle perspective. J. Clean. Prod. 2024, 448, 141613. [Google Scholar] [CrossRef]
- Luo, G.Y.; Wu, D.; Liu, L.; Yang, P.J.; Lv, H. Carbon emission reduction strategies in Guangdong Province of China: A cost-effectiveness perspective. J. Environ. Sci. 2024; in press. [Google Scholar] [CrossRef]
- Song, C.Y.; Zhang, Z.M.; Xu, W.H.; Elshkaki, A. The spatial effect of industrial transfer on carbon emissions under firm location decision: A carbon neutrality perspective. J. Environ. Manag. 2023, 330, 117139. [Google Scholar] [CrossRef]
- Xiang, Q.; Pan, H.Y.; Ma, X.H.; Yang, M.D.; Lyu, Y.F.; Zhang, X.H.; Shui, W.; Liao, W.J.; Xiao, Y.L.; Wu, J.; et al. Impacts of energy-saving and emission-reduction on sustainability of cement production. Renew. Sustain. Energy Rev. 2024, 191, 114089. [Google Scholar] [CrossRef]
- Hasanbeigi, A.; Arens, M.; Cardenas, J.C.; Price, L.; Triolo, R. Comparison of carbon dioxide emissions intensity of steel production in China, Germany, Mexico, and the United States. Resour. Conserv. Recycl. 2016, 113, 127–139. [Google Scholar] [CrossRef]
- Kuoribo, E.; Shokry, H.; Asawa, T.; Mahmoud, H. A scientometric review of recycled glass waste as an alternative raw material in concrete production. Eur. J. Environ. Civ. Eng. 2024, 28, 2507–2533. [Google Scholar] [CrossRef]
- Koondhar, M.A.; Shahbaz, M.; Ozturk, I.; Randhawa, A.A.; Kong, R. Revisiting the relationship between carbon emission, renewable energy consumption, forestry, and agricultural financial development for China. Environ. Sci. Pollut. Res. 2021, 28, 45459–45473. [Google Scholar] [CrossRef] [PubMed]
- Li, H.Q.; Peng, X.L.; Jiang, P.; Xing, L.G.; Sun, X.P. Dynamic changes in the suitable areas for the pinewood nematode in the Sichuan-Chongqing Region of China. PLoS ONE 2023, 18, e0292893. [Google Scholar] [CrossRef]
- De Araújo, V.O.; Silva, F.A.T.; Marotta, H.; Madeira, J.G.F.; Rodrigues, C.A.F.; do Carmo, D.F.; Fiaux, S.B. New compact biodigester model for organic waste treatment in urban residences and buildings. J. Environ. Eng. 2021, 147, 04020156. [Google Scholar] [CrossRef]
- Kang, Y.T.; Yang, Q.; Wang, L.; Chen, Y.Q.; Lin, G.Y.; Huang, J.L.; Yang, H.P.; Chen, H.P. China’s changing city-level greenhouse gas emissions from municipal solid waste treatment and driving factors. Resour. Conserv. Recycl. 2022, 180, 106168. [Google Scholar] [CrossRef]
- Wang, Q.X.; Xin, Y.J.; Hu, A.; Du, Y.A. Stimulating energy efficiency by low-carbon transformation: Evidence from low-carbon city pilot in China. Energy Environ. 2024. [Google Scholar] [CrossRef]
- Ansari, M.; Akram, V.; Haider, S. A link between productivity, globalisation and carbon emissions: Evidence from emissions by coal, oil and gas. Environ. Sci. Pollut. Res. 2022, 29, 33826–33843. [Google Scholar] [CrossRef]
- Bianco, V.; Cascetta, F.; Nardini, S. Analysis of the carbon emissions trend in European Union. A decomposition and decoupling approach. Sci. Total Environ. 2024, 909, 168528. [Google Scholar] [CrossRef]
- Mishra, A.; Humpenöder, F.; Churkina, G.; Reyer, C.P.; Beier, F.; Bodirsky, B.L.; Schellnhuber, H.J.; Lotze-Campen, H.; Popp, A. Land use change and carbon emissions of a transformation to timber cities. Nat. Commun. 2022, 13, 4889. [Google Scholar] [CrossRef] [PubMed]
- Tang, K.; Zhang, K. The effects of low-carbon governance on energy-environmental efficiency: Evidence from China’s low-carbon city pilot policy. Emerg. Mark. Financ. Trade 2023, 60, 1227–1245. [Google Scholar] [CrossRef]
- Jiang, P.; Yang, Y.R.; Ye, W.; Liu, L.; Gu, X.C.; Chen, H.P.; Zhang, Y.H. Study on the efficiency, evolutionary trend, and influencing factors of rural-urban integration development in Sichuan and Chongqing regions under the background of dual carbon. Land 2024, 13, 696. [Google Scholar] [CrossRef]
- Li, Z.R.; Lai, A.L.; Cao, Y.R.; Wang, Q.W. Porter effect vs cost effect: The impact of China’s low carbon city pilot on carbon emissions and economic performance. J. Environ. Manag. 2024, 360, 121015. [Google Scholar] [CrossRef]
- Wang, J.J.; Zhang, Y.; Mei, L.D.; Xu, X.M.; Yin, H.M.; Feng, X.Q.; Chen, J.H. Carbon reduction of the Three-Year Air Pollution Control Plan under the LEAP model using a GREAT tool in Panzhihua, China. Int. J. Environ. Res. Public Health 2022, 19, 14482. [Google Scholar] [CrossRef]
- Lin, H.X.; Zhou, Z.Q.; Chen, S.; Jiang, P. Clustering and assessing carbon peak statuses of typical cities in underdeveloped Western China. Appl. Energy 2023, 329, 120299. [Google Scholar] [CrossRef]
- Chen, B.S.; Yu, Q.Y.; Lan, X.J.; Fang, L.H.; Wen, C.H. Assessing China’s development zones and carbon emissions. Environ. Sci. Pollut. Res. 2023, 30, 99298–99309. [Google Scholar] [CrossRef]
- Wang, M.M.; Kong, D.Z.; Mao, J.H.; Ma, W.J.; Ayyamperumal, R. The impacts of land use spatial form changes on carbon emissions in Qinghai-Tibet Plateau from 2000 to 2020: A case study of the Lhasa metropolitan area. Land 2023, 12, 122. [Google Scholar] [CrossRef]
- Tian, C.Y.; Huang, G.H.; Xie, Y.L. Systematic evaluation for hydropower exploitation rationality in hydro-dominant area: A case study of Sichuan Province, China. Renew. Energy 2021, 168, 1096–1111. [Google Scholar] [CrossRef]
- Zhao, G.C.; Yu, X.F.; Weng, Z.Y.; Zhang, Y.F. Exploring neighborhood low-carbon gene based on human cognition. Environ. Dev. Sustain. 2024, 1–25. [Google Scholar] [CrossRef]
- Guan, D.B.; Barker, T. Low-carbon development in the least developed region: A case study of Guangyuan, Sichuan province, southwest China. Nat. Hazards 2012, 63, 243–254. [Google Scholar] [CrossRef]


| Emission Unit | 2015 | 2016 | 2017 | 2018 | 2019 | 2020 | 2021 | 2022 | |
|---|---|---|---|---|---|---|---|---|---|
| Energy activity | Thermal power generation | 3750 | 2709 | 2697 | 2630 | 3457 | 3656 | 4572 | 5946 |
| Supply heat | 434 | 414 | 559 | 591 | 646 | 923 | 725 | 380 | |
| Agricultural industry | 575 | 526 | 502 | 413 | 432 | 483 | 486 | 527 | |
| Industry | 19,710 | 16,991 | 16,875 | 14,405 | 14,461 | 13,508 | 13,492 | 11,996 | |
| Construction industry | 222 | 346 | 366 | 427 | 441 | 420 | 498 | 563 | |
| Communications and transportation industry | 2004 | 2869 | 3021 | 2970 | 3111 | 2978 | 3089 | 3080 | |
| Commercial industry | 911 | 938 | 1046 | 874 | 864 | 766 | 676 | 710 | |
| Other service industries | 748 | 678 | 721 | 800 | 714 | 620 | 688 | 730 | |
| Residential life | 2541 | 2563 | 2526 | 2639 | 2758 | 2832 | 2914 | 3071 | |
| External power import | 434 | 408 | 560 | 897 | 996 | 1056 | 1479 | 1365 | |
| Local power export | −10,877 | −11,303 | −12,272 | −12,072 | −11,877 | −12,237 | −12,162 | −13,379 | |
| Industrial production | Cement production | 5665 | 5885 | 5572 | 5548 | 5718 | 5849 | 5708.35 | 5274 |
| Steel production | 5102 | 4950 | 5199 | 5792 | 5359 | 5420 | 5351 | 5280 | |
| Glass production | 20 | 27 | 28 | 27 | 46 | 47 | 48 | 49 | |
| Calcium carbide production | 79 | 83 | 71 | 113 | 125 | 57 | 59 | 54 | |
| Forestry activity | Biomass growth | −9185 | −9185 | −9185 | −9683 | −7600 | −7676 | −7714 | −7720 |
| Wood harvesting | 184 | 218 | 242 | 249 | 264 | 241 | 327 | 312 | |
| Forest fires | 3 | 2 | 11 | 17 | 7 | 16 | 3 | 3 | |
| Insect disasters | 13 | 13 | 20 | 16 | 3 | 4 | 216 | 167 | |
| Waste disposal | Solid waste incineration | 8 | 10 | 13 | 15 | 19 | 20 | 29 | 30 |
| Net carbon emission | 22,341 | 19,142 | 18,572 | 16,668 | 19,944 | 18,983 | 20,484 | 18,438 | |
| Region | 2015 | 2016 | 2017 | 2018 | 2019 | 2020 | 2021 | 2022 |
|---|---|---|---|---|---|---|---|---|
| Chengdu City | 0.9730 | 0.9621 | 0.9749 | 1.0078 | 1.0885 | 1.0996 | 1.0195 | 1.0956 |
| Zigong City | 1.0590 | 1.0205 | 1.0096 | 1.0229 | 1.0279 | 1.0291 | 1.0111 | 1.0272 |
| Panzhihua City | 1.0088 | 0.9983 | 0.9996 | 1.0161 | 1.0828 | 1.0942 | 1.0140 | 1.0820 |
| Luzhou City | 0.6940 | 0.6570 | 0.6491 | 0.6557 | 0.6630 | 0.6648 | 0.6441 | 0.6552 |
| Deyang City | 0.9762 | 0.9658 | 0.9827 | 1.0039 | 1.0237 | 1.0353 | 1.0028 | 1.0229 |
| Mianyang City | 0.8655 | 0.8985 | 0.9159 | 0.9471 | 0.9556 | 0.9574 | 0.9273 | 0.9461 |
| Guangyuan City | 0.6579 | 0.6926 | 0.7188 | 0.7582 | 0.8037 | 0.8154 | 0.8052 | 0.8132 |
| Suining City | 0.6733 | 0.7015 | 0.7614 | 0.8387 | 0.8411 | 0.8430 | 0.8222 | 0.8291 |
| Neijiang City | 0.8787 | 0.8472 | 0.8423 | 0.8566 | 0.8554 | 0.8565 | 0.8361 | 0.8472 |
| Leshan City | 0.8511 | 0.8302 | 0.8188 | 0.8168 | 0.8162 | 0.8170 | 0.8034 | 0.8105 |
| Nanchong City | 0.6958 | 0.6779 | 0.6924 | 0.7414 | 0.7766 | 0.7888 | 0.7697 | 0.7776 |
| Meishan City | 0.7061 | 0.7009 | 0.7039 | 0.7279 | 0.7474 | 0.7590 | 0.7389 | 0.7512 |
| Yibin City | 0.7496 | 0.7351 | 0.7346 | 0.7330 | 0.7495 | 0.7509 | 0.7319 | 0.7435 |
| Guang’an City | 0.7383 | 0.7036 | 0.7045 | 0.7354 | 0.7404 | 0.7454 | 0.7334 | 0.7422 |
| Dazhou City | 0.6121 | 0.6155 | 0.6049 | 0.6050 | 0.6150 | 0.6196 | 0.6056 | 0.6137 |
| Ya’an City | 0.5705 | 0.5732 | 0.6122 | 0.6381 | 0.6566 | 0.6668 | 0.6388 | 0.6541 |
| Bazhong City | 0.7112 | 0.6970 | 0.7337 | 0.7586 | 0.7871 | 0.7979 | 0.7679 | 0.7859 |
| Ziyang City | 0.8254 | 0.8629 | 0.9183 | 0.9650 | 1.0780 | 1.0910 | 1.0408 | 1.0809 |
| Aba Tibetan and Qiang Autonomous Prefecture | 0.3216 | 0.3245 | 0.3322 | 0.3438 | 0.3537 | 0.3559 | 0.3450 | 0.3521 |
| Ganzi Tibetan Autonomous Prefecture | 0.5948 | 0.5909 | 0.6230 | 0.6517 | 0.6543 | 0.6575 | 0.6473 | 0.6562 |
| Liangshan Yi Autonomous Prefecture | 0.6739 | 0.6515 | 0.6613 | 0.6808 | 0.6813 | 0.6819 | 0.6639 | 0.6726 |
| Sichuan Province | 0.7263 | 0.7264 | 0.7470 | 0.7677 | 0.7900 | 0.8110 | 0.7750 | 0.7950 |
Disclaimer/Publisher’s Note: The statements, opinions and data contained in all publications are solely those of the individual author(s) and contributor(s) and not of MDPI and/or the editor(s). MDPI and/or the editor(s) disclaim responsibility for any injury to people or property resulting from any ideas, methods, instructions or products referred to in the content. |
© 2024 by the authors. Licensee MDPI, Basel, Switzerland. This article is an open access article distributed under the terms and conditions of the Creative Commons Attribution (CC BY) license (https://creativecommons.org/licenses/by/4.0/).
Share and Cite
Li, Q.; Zhang, P. Temporal–Spatial Characteristics of Carbon Emissions and Low-Carbon Efficiency in Sichuan Province, China. Sustainability 2024, 16, 7985. https://doi.org/10.3390/su16187985
Li Q, Zhang P. Temporal–Spatial Characteristics of Carbon Emissions and Low-Carbon Efficiency in Sichuan Province, China. Sustainability. 2024; 16(18):7985. https://doi.org/10.3390/su16187985
Chicago/Turabian StyleLi, Qiaochu, and Peng Zhang. 2024. "Temporal–Spatial Characteristics of Carbon Emissions and Low-Carbon Efficiency in Sichuan Province, China" Sustainability 16, no. 18: 7985. https://doi.org/10.3390/su16187985