Abstract
This study introduces an innovative methodology for designing sustainable urban energy districts using Geographic Information Systems (GIS). The scope is to identify specific parts of the urban fabric, suitable for becoming energy districts that can meet the energy needs of dwellings and activities and produce an energy surplus for the city. The method uses building archetypes to characterize the districts and perform simulations through an algorithm based on correction coefficients considering variables such as total building height, exposure, year of construction, and building typology. By leveraging GIS, this approach supports the creation of urban energy maps, which help identify and address potential energy-related issues in various urban contexts. Additionally, the research explores different scenarios for developing energy communities within the district, aiming to optimize energy use and distribution. A case study in Naples, Southern Italy, demonstrates that installing photovoltaic panels on the roofs of buildings can allow a complete electrical supply to the building stock. The final goal is to provide a robust tool that enhances confidence in urban energy planning decisions, contributing to more sustainable and efficient energy management at the district level. This approach may support the urban and territorial governance towards sustainable solutions by developing strategies for the creation of energy communities and optimizing the potential of specific sites.
1. Sustainable Cities: Introduction
Arguably, the most serious challenge humanity faces today is related to climate change, which directly threatens urban settlements where the majority of the world’s population will live in a few years. Cities are the places where the future of humanity will be decided, and effective solutions are urgently needed, particularly from an energy perspective, for a sustainable common future. The link between cities and energy is complex and requires a global approach that integrates advanced technologies, sustainable urban planning policies, and the conscious participation of the community. Only by addressing energy challenges and adopting innovative solutions can cities be transformed into engines of mandatory sustainable development. Starting from current experiences of carbon-neutral cities, the premises and aims of this novel investigation are established, also investigating energy demands of common building districts through simplified methods by citing limits, potentialities and necessities for novel approaches.
After presenting the available literature regarding the state of the art, it will emerge that, today and according to our best knowledge, there are no available tools capable of identifying or predicting single or aggregated energy demands at the single building level, but as part of a district or a community, with reference to specific energy uses, and thus space heating, cooling, domestic hot water, appliances, electricity for equipment. On the other hand, local or central authorities—to identify priorities of interventions, funding programs specific issues to face and fix, promote the installation of renewables, and promote energy communities—may require a powerful tool capable of giving fast, single, or global information about thermal, electric or primary energy demands. This is the means for the decarbonization of cities and a way to achieve a smart and sustainable future for the built environment.
Finally, the development of a fast method—to map single and aggregated energy demands by taking into account the main energy uses—is the goal of this study, and in Section 1.3, it will be deeply stated.
1.1. Review of Real Examples
The target of “Sustainable cities and communities” is one of the 17 Sustainable Development Goals [1] listed in the 2030 agenda by the United Nations Member States. Buildings and, therefore, districts are a real power hub for the targets of energy transition and carbon neutrality, being directly involved in high energy demand and consequent CO2-eq emissions. To reach the aforementioned aims, the EU has launched several missions [2], among which one is “100 climate-neutral and smart cities by 2030”. The idea is to convert 100 cities to climate-neutral. They are called to design plans with all the strategies (Climate City Contract) to achieve their decarbonization. These plans will be shared among the European cities and will represent an example to accelerate the process of climate neutrality. In October 2023, the climate city contract for 10 cities was positively reviewed, so they received the EU mission label [3].
Some of these cities, like Stockholm, Vitoria Gasteiz, and Valencia, have already been recognized as European Green Capitals [4] in 2010, 2012, and 2024, respectively. This highlights the effort to guarantee a green and sustainable future, involving both private (namely, citizens) and public (namely, Government) actors. The city of Stockholm, the first to win the award of European Green Capital, reached this recognition thanks to its attention to urban mobility and to work in the transport sector with renewable fuels (indeed, in 2019, the city received the award for Clean Transport [5]). Moreover, in Stockholm, waste collection is centralized, the district heating network is characterized by the recovery of heat produced by data centers (widespread in the city), buildings are equipped with high-tech components and even public lighting is fitted with intelligent technologies. All these factors contribute to identifying the city as green and sustainable, increasingly reducing CO2 emissions, and expecting to have a positive carbon footprint by 2040 [6]. Another city with high attention to the environmental issue is Oslo. In Norway, 90% of the electricity needs (for buildings, transport, and other sectors) are satisfied with hydroelectric power plants. In this city, there is even a waste recovery for conversion into thermal and electrical energy. The construction sector is characterized by the adoption of passive and green technologies, the use of recycled materials, and the installation of PV systems.
In general, care for environmental, social, and economic well-being ensures the identification of sustainable cities. As shown by the real cases of green cities, there are key points that are redundant in all the cities recognized as highly sustainable (Copenhagen, Valencia, Amsterdam, and so on), i.e., the efficiency of the public transport, the resilience of buildings, the management of urban and water wastes, and the care of green areas with urban refurbishment. Therefore, a process of energy and ecological transition involves all these aspects.
Besides real cases, several scientific studies have been conducted to identify policies and strategies for the sustainability of the cities. The main findings from the analysis of the state-of-the-art totally reflect the points discussed in the real cases, and so the attention to the transport sector, the design of resilient infrastructure, the management of waste [7], the protection of water resources, the adoption of renewable energy sources [8,9].
The process of transition encompasses several areas and, above all, requires coordination between the different stakeholders [10], starting from the municipal, regional, and national agencies, which has led to the introduction of a new figure, namely the sustainability manager [11], up to citizens, whose role and participation are fundamental. For example, through a survey in southern Brazil involving 392 citizens, attention to public services and facilities and environmental welfare were identified as necessary elements for the sustainability of the city [12].
Focusing on buildings, the design of energy retrofit strategies adopting natural materials with low embodied energy, and the adoption of technologies using renewable energy sources are mandatory to have high-energy performance buildings that can contribute to the sustainable development of the sector [13]. For example, in [14], a system combining renewable energy systems (wind plants, PV, biomass) and hydrogen production was tested for several cities with different climatic conditions—Canada, Netherlands, Denmark, and South Africa—to improve the energy efficiency and therefore promote the carbon sustainability.
The electrification and, therefore, the gradual detachment from fossil fuels [15] for the energy transition is highly investigated. In this regard, the replacement of gas boilers with heat pumps has been proposed for an urban area in Switzerland [16] or in Spain, where through the electrification of 17% of buildings in the residential sector, savings on emissions of about 10% were achieved [17]. Furthermore, some of the authors have already proposed for some case studies, in particular considering five buildings in [18] and a slightly larger scale (29 buildings) in [19], to establish a small energy community trying to mitigate energy demand through various retrofit measures and also proposing the use of renewable energy, where possible, with excellent results in terms of sustainability. At the same time, however, it is essential to strengthen the electricity grid, which translates into an economic challenge [16]. Moreover, the role of smart technologies and ICT (information communication and technology) with sensors, actuators, and controllers plays an important role in the modernization of cities [20,21].
1.2. Review of Methodological Approaches
Currently, as highlighted in the previous introductive part, the most significant challenge is to move the focus from single buildings (largely interested in guidelines and policies to refurbish the stock) to whole districts, and thus the target of optimizing the energy performance with reference to the urban scale, promoting sharing and rationalization of energy flows. The scientific community recognizes that the increasing urbanization and the concentration of the population in metropolitan areas entail a series of complex problems to address. These include but are not limited to environmental pollution, natural resource management, and the need for sustainable infrastructures, which require innovative and interdisciplinary solutions. In this regard, the use of GIS software can be of great help, as demonstrated by its use for different purposes by the scientific community.
Raillani et al. [22] assessed the economic and technological viability of a large photovoltaic power plant, using 24 weather data, in order to highlight the potential for the production of hydrogen and electric energy in the eastern region of Morocco. After gathering the data, a regression model was used to include it and provide an appropriate energy production equation. The goal of this evaluation technique was to provide high-resolution GIS maps with accurate findings. Bosco et al. [23] analyzed the creation of renewable energy communities centered on photovoltaic systems in public buildings, especially schools, as a strategy to combat energy poverty in Southern Italy. It focused on the implementation at the neighborhood level, integrating energy efficiency with sustainable practices in vegetation and water management. The study proposed a methodology to determine the ideal size and configuration of renewable energy communities based on energy efficiency, economic benefits, and social cohesion. Koster et al. [24] integrated a solar potential mapping strategy that incorporates socio-economic characteristics indicative of energy poverty, using readily available GIS for a method that may be readily duplicated across cities experiencing energy poverty. Furthermore, a case study in Bulgaria has been investigated, demonstrating a high solar energy potential that could meet 29% of the city’s electricity needs and can save citizens about 44 M€/year. Mentis et al. [25] concentrated on creating a methodology based on Geographic Information Systems (GIS) to guide electrification plans and planning. The methodology was used to determine the best combination of electrification choices for Nigeria, including mini-grid, off-grid, and grid extensions. A novel GIS-based process for planning rural electrification was presented by Corigliano et al. [26]. This method is capable of choosing and creating an efficient energy system for a specific geographic area. Six microgrids and two interconnected grids were created in a rural area of a Mozambican province, where the procedure’s performance was assessed. This demonstrated the value of a GIS approach in determining the optimal electrification strategy to minimize cost increases. In this regard, with increasing climate challenges, sustainable urban energy networks are facing transmission congestion in electricity systems. The study by Zhong et al. [27] introduced a novel statistical approach that synergistically combines two powerful methodologies for urban energy network assessment and management: photovoltaic (PV) renewable energy source integration and Gated Recurrent Unit (GRU)-based PV forecasting. This dual optimization strategy leads to significantly reduced active power rescheduling values and congestion prices.
Innovative technologies, appropriate policies, and collaboration between different parties will be key to building resilient cities and achieving a more sustainable future. However, to achieve the climatic and energy objectives, it is imperative to align the environmental and economic plans. The last must be calibrated based on the climatic plans, and this does not always occur [28].
As cities urbanize, buildings consume over 75% of urban energy and generate two-thirds of emissions, driving the need for accurate urban building energy modeling. Remote sensing and GIS offer strong potential to enhance urban modeling input data, though their use has been limited. Anand et al. [29] offered a review of over 140 studies highlighting the challenges and opportunities in using satellite and UAV technologies for data acquisition.
Wanguba et al. [30] addressed the global challenge of water scarcity due to urbanization, population growth, and industrial development, highlighting the need for effective water management. Their study focused on the Lodwar municipality in Turkana, Kenya, using GIS and multi-criteria decision analysis to create a decision support model for improving water demand management. By analyzing data such as population density, proximity to water networks, and land use, the model identifies priority water demand sites and underserved areas. Yu et al. [31] proposed a holistic method that integrates GIS, building energy modeling, and global sensitivity analysis to evaluate the impact of eight key urban planning factors on community energy performance. Ali et al. [32] suggested a generalized methodology combining bottom-up, data-driven, and spatial modeling approaches to map building energy performance across multiple scales using data from 650,000 Irish Energy Performance Certificates. With an 88% prediction accuracy via deep learning, the methodology identifies high-energy-saving potential areas and supports targeted retrofit campaigns and sustainable energy policy decisions. HosseiniHaghighi et al. [33] proposed a workflow to generate city digital twins using GIS and local data, integrating and refining spatial data to address inconsistencies. Applied to Kelowna, Canada, the workflow achieved less than 2.5% deviation from measured data and supported retrofit scenario analysis for net-zero planning. Perwez et al. [34] introduced a new hybrid model that combines synthetic and spatial modeling techniques to enable the simultaneous analysis of several building-oriented components. In order to illustrate a long-term, multi-scale framework for energy modeling of commercial building stock, the model is further applied to Japanese building stock.
Cuesta-Fernández et al. [35] explored strategies for Mediterranean cities to achieve carbon neutrality and improve energy self-sufficiency by increasing photovoltaic generation. Focusing on cities in the European Mediterranean basin, they proposed an energy exchange model between cities and their metropolitan areas as an alternative to relying solely on PV generation within the city. Using Valencia, Spain, as a case study, they showed that rooftop PV installations can significantly increase energy self-sufficiency, increasing PV coverage from 61% in the city and its immediate metropolitan area to 79.2% when including the entire metropolitan region.
Hassan et al. [36] proposed a GIS-based multi-criteria analysis to assess the potential for solar, wind, and biomass energy in Iraq. The analysis identified zones for energy development based on energy surplus factors. The findings suggested that strategic development of these zones could fulfill 45% to 68% of Iraq’s energy demand and significantly reduce CO2 emissions. Overall, the research highlights the importance of strategic zoning to maximize renewable energy use and support Iraq’s climate and energy goals. The study by Wang et al. [37] introduced a comprehensive framework to assess the energy-saving potential of green roofs at the city scale by using GIS technologies to collect extensive building data and create prototype models that simulate the performance of buildings with different types of roof plants. A case study analysis in Xiamen, China, showed that implementing green roofs can lead to energy savings of 1.62–1.83% and reduce peak energy loads by 1.10–1.63%.
Calderón et al. [38] introduced a spatially referenced framework for estimating building-level domestic energy demand in sub-city areas, focusing on Newcastle, UK. The work combined detailed local building surveys with a national dataset and a domestic energy model to establish an energy consumption baseline. The study found that as spatial resolution increases, local socio-economic and physical factors significantly influence energy consumption estimates, leading to discrepancies with existing data. Lai et al. [39], instead, discussed the use of district cooling systems (DCS) as an efficient and flexible solution for urban cooling needs. It highlights the challenge of identifying suitable zones for DCS construction, as these zones significantly influence the system’s performance and benefits. The study introduces a GIS-based two-stage assessment method to identify potential large-scale DCS zones. The proposed method and indicators aim to improve macro-level planning and decision-making for DCS implementation.
As shown, the scientific world to date has been more interested in studying the renewable potential of the territory through a GIS-based approach, without, however, being interested in providing, at the urban scale, the energy needs and highlighting any energy criticisms. The objective of this study is to provide integration also from this point of view, providing a simplified methodology based on building archetypes to be able to integrate both the study of energy needs and the exploitation, if available and possible, of on-site renewable sources.
1.3. Energy Demands of Common Homogeneous Zones in Mediterranean Cities
Based on the presented analysis—concerning real or simulated cases of green and sustainable cities—it emerges that a deep path of urban and energy refurbishment, involving both citizens and governments, will ensure a reduction of the energy demand and emissions, giving more livable conditions in buildings and more in general in the cities. In order to design and plan the actions that can be adopted to improve the buildings’ performances and, therefore, of a district, it is important to assess the current state, investigating limits and potentialities of the context. As an example, an assessment of the energy demand of three different areas of a Mediterranean city is provided below. The choice of the three areas derives from the urban zoning planning, adopted to divide the whole territory of a city into homogeneous areas.
In detail, the three areas identified are (a) an old town zone, (b) a saturated expansion zone, and (c) a non-saturated expansion zone in the city of Naples and its surroundings (Figure 1). The city has been considered—for what concerns construction technologies, age of buildings, level of energy performance—representative of all cities lying on the Mediterranean coasts (e.g., France, Greece, Spain, Portugal, Balkans, North Africa) where the dominations were similar, and the buildings are made of masonry (<1950) or reinforced concrete (>1950) with clay hollow blocks.
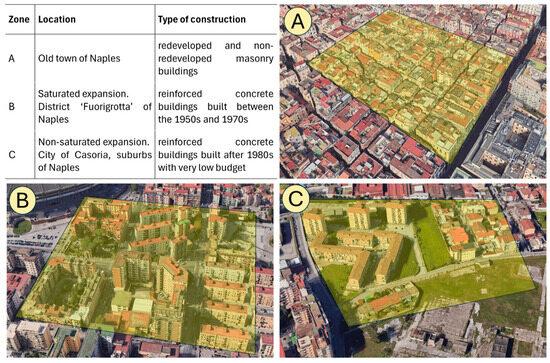
Figure 1.
Example of (A) old town zone, (B) saturated expansion zone, and (C) non-saturated expansion zone for the Mediterranean context, in detail in the city of Naples.
For each zone, an urban pattern of about four hectares (i.e., 200 × 200 m, 40,000 m2) has been selected (the yellow highlighted area in Figure 1). After counting the number of buildings belonging to each pattern, the types of construction—which affect the energy performance and, more in detail, the energy classes—are identified. Moreover, the size and the height of each building are collected. This investigation revealed:
- -
- A predominance of redeveloped and non-redeveloped masonry buildings with an EPC Energy Class of “D” and “E”, respectively, for the old town zone (Figure 1A);
- -
- A predominance of reinforced concrete buildings built between the 1950s and 1970s at different levels of conservation (or degradation), corresponding to an EPC Energy Class “F” or “G”, and a limited number of masonry buildings for the saturated expansion zone (Figure 1B);
- -
- A predominance of highly inefficient reinforced concrete buildings built after the 1980s with very low budgets for the unsaturated expansion zone, namely the suburbs, corresponding to Energy Classes “F” and “G” (Figure 1C).
To evaluate the energy demand of each urban pattern, a reference building is considered, specifically the one assessed in [40]. In this paper, a residential building located in Naples was studied, with a surface-to-volume ratio of about 0.45. This factor, given by the ratio between the heat-loss surfaces and the gross conditioned volume, affects the energy requirements of the building. As an example, a higher value of this ratio corresponds to higher energy demands. Indeed, an increase in the heat-loss surfaces involves higher thermal dispersions in winter and, at the same time, higher thermal gains in summer, which translates into a higher energy demand due to the need for microclimatic and thermal control.
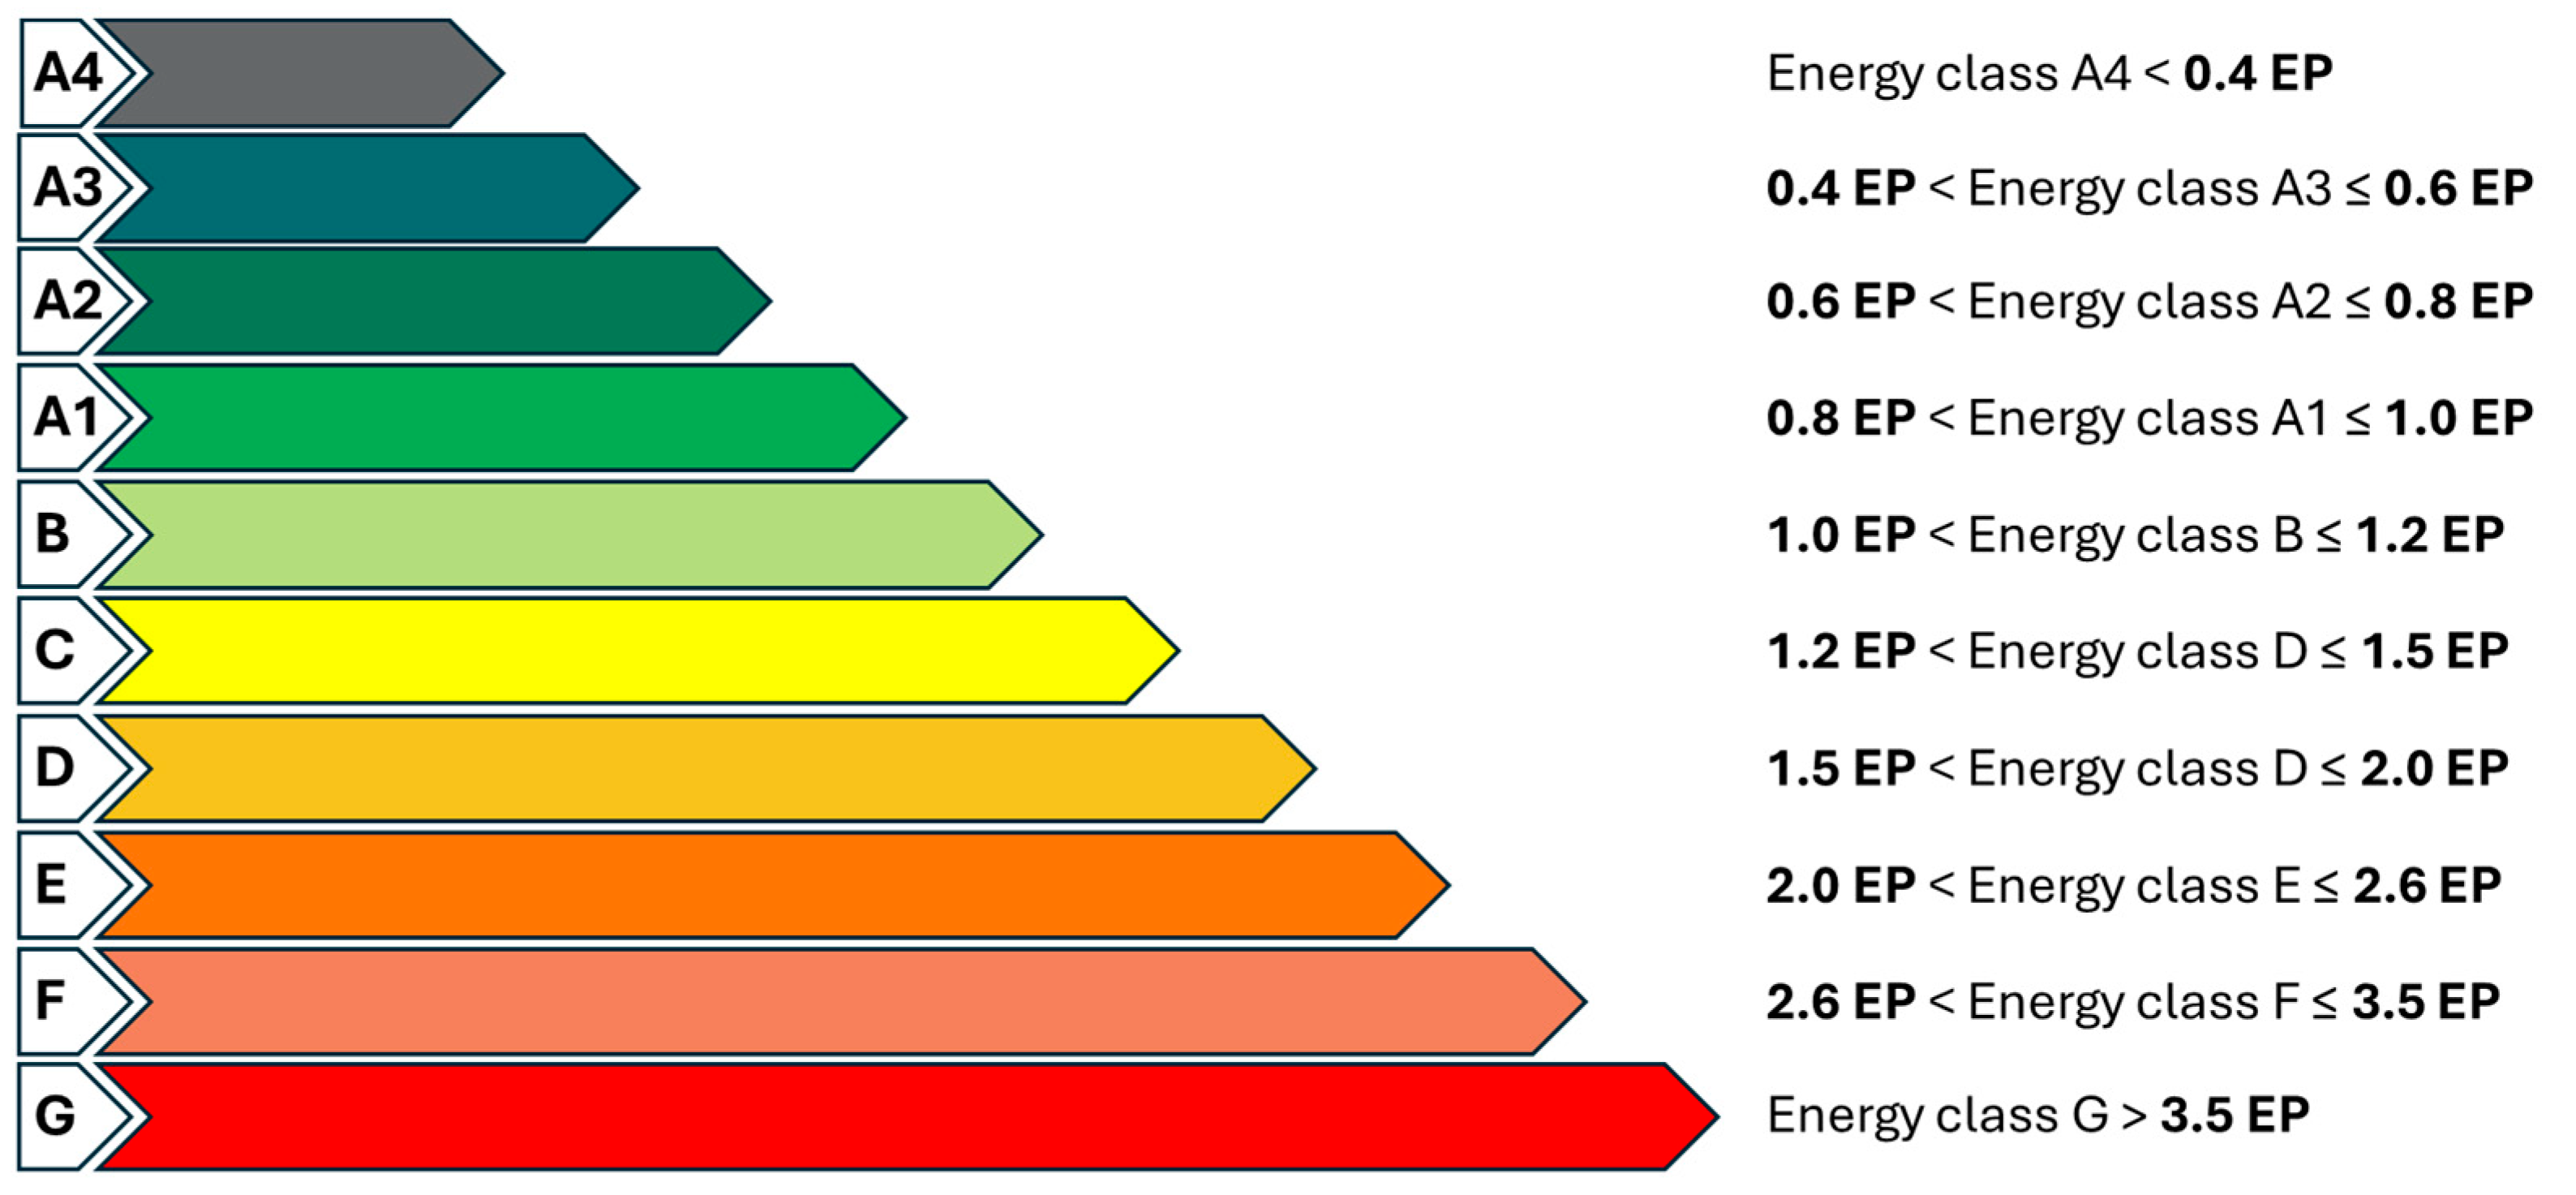
The energy requirements, and therefore, the energy performance of a building, determine its energy class, from A4 (the most efficient) to G (the poorest). The energy class of a building is established through a comparison of its global energy performance indicator, EPgl,nren, and the indicator related to the “reference building” (indicated as EPgl,nren,rif,standard). This “reference building” is defined, in accordance with the guidelines of Ministerial Decree 26 June 2015 [41], as a building “identical in terms of geometry, orientation, spatial location, intended use, boundary condition, thermal characteristics and energy parameters determined in accordance with the guidelines”. As previously cited in [40], the reference building for a typical residential building, located in climatic zone C (in detail in Naples), with a surface-to-volume ratio of 0.45, was constructed, and its EPgl,nren,rif,standard was determined. Such a building can also be adopted as a reference for the three investigated patterns because the climatic zone and the intended uses are the same, and the surface-to-volume-ratio is typical of compact buildings like the ones presented in this study.
The EPgl,nren,rif,standard represents the threshold between class A1 and B, the other energy classes are obtained through multiplication coefficients. For example, a building with a value of EPgl,nren in the range 2.0–2.6 of the EPgl,nren,rif,standard falls into class E (Figure 2).

Figure 2.
Method to attribute energy classes to buildings during the EPC process.
As previously discussed, for the three urban patterns, the energy class is obtained starting from the EPgl,nren,rif,standard defined in [40]. In particular, starting from the attributed energy classes—based merely on qualitative considerations (e.g., types of construction, kinds and quality of technology, partial or total refurbishments, construction periods, etc.), the EPgl,nren of each building, and therefore of the whole pattern, is evaluated. Indeed, for the energy classes D, E, and F, we put in the center of the range that defines the energy class. The coefficients 1.75, 2.30, 3.05, and 4.00 were adopted for Classes G, F, E, and D, respectively, to evaluate the EPgl,nren.
The results obtained from this analysis, or the energy demand of each pattern, are as follows:
- -
- For zone A: yearly energy demand of 14.6 GWh, i.e., around 132 kWh m−2 y−1;
- -
- For zone B: yearly energy demand of 18.1 GWh, i.e., about 228 kWh m−2 y−1;
- -
- For zone C: yearly energy demand of 8.2 GWh, i.e., about 265 kWh m−2 y−1.
The annual impact of the buildings, and therefore of the urban pattern, in terms of primary energy required for their operation, has been achieved. Surely, such values or simplified methods like the one here proposed—for instance, based on the available EPCs for a certain number of buildings, then used to attribute similar performance to close ones—can be used for fast evaluations of average energy demands of districts, even in order to identify priorities, lines of intervention, development of novel energy infrastructure, or local promotion of retrofits of critical neighborhoods, macro-objectives for regional decarbonization. However, these data present a high error margin because it is affected by different conditions and restrictions that have been established.
Finally, this method or similar ones are fast but too gross, so more accurate approaches, but with simplified calculation and replicability, may be needed.
1.4. Motivation and Novelty of a New Investigation
As said, the aforementioned approach does not allow for the identification of specific problems, for example, what is the most energy-intensive energy use or which limits the proposal of incentives policies. By way of example, governments have so far strongly promoted interventions to reduce winter energy needs, while the awareness is growing more and more that the next challenge is the reduction of energy demand for cooling or even the attempt to avoid active cooling for new buildings through the adoption of mitigation technologies.
Since these are centrally decided legislative measures, it is necessary to evaluate individual energy uses from which, through simple numerical regression procedures, it would also be possible to reverse annual consumption to daily values (by HDD, CDD, hours of sunshine, etc.). The purpose of the following sections, therefore, will be to quickly but accurately identify the individual energy uses of buildings aimed at extensive mapping to understand the priorities of intervention, the feasibility of the decarbonization objective, and the potential to balance energy demand by conversion on site.
The objective of this work is to develop a replicable calculation methodology that can also lead to the creation of a tool whose purpose is to evaluate the energy needs (namely, both partial and total) of buildings throughout an urban district. Through this tool, integrated with GIS software, the aim is to identify potential districts for which to suggest possible retrofit strategies, to reduce their energy demand, and the integration of different renewable sources, to create energy communities. To this end, the novelty of this work concerns the creation of the following:
- An algorithm, which considers various parameters, can determine the energy needs of urban areas starting from building archetypes;
- The possibility of integrating the algorithm with GIS software to create urban energy maps (UEM), allowing an immediate visual representation of the energy performance and any critical issues for buildings;
- Strategies not only at the level of a single building, but for the entire district aimed at also creating energy communities.
2. The City Description, with a Focus on the Western Industrial Site: Bagnoli-Coroglio
The method has been tested on an urban context that globally represents a complex system due to its physical-spatial, functional, and socio-anthropological characteristics: a district in the city of Naples.
Napoli (In Italian) is the third largest in Italy by population and is unique in the European urban landscape, thanks in part to its coastal location, which makes it the focal point of the Mediterranean, and its landscape-territorial features, both for the beauty and for the particular conditions of vulnerability that characterize the territory. Among these, the volcanic risk stands out, considering that around the world’s most dangerous volcano, Mount Vesuvius, there are 25 municipalities with a total population of about 700,000 inhabitants. As is known, the western area of the city is currently affected by seismic events attributable to the phenomenon of bradyseism, which has characterized this area for millennia. Naples is certainly one of the most interesting metropolitan settlements in Europe.
Naples is the most important urban center in southern Italy and one of the most interesting metropolitan areas in Europe. The city’s origins, excluding some findings dating back to the Neolithic period, can be attributed to the Cumans around the eighth century BC. Throughout its history, Naples, like other Italian cities, has undergone numerous dominations, which, however, have generated a culture and social capital that currently make it one of the city’s most polarizing cultural interests and tourist flows. It would be useful to remember, in this regard, that Naples is one of the oldest cities in Europe, where history has left unique testimonies. From the first public university in the world to the first astronomical observatory in Europe, or the first railway and urban gas lighting in Italy, Napoli has many global or local primates, celebrated by Goethe and Stendal, among others. From a geographical point of view, as mentioned earlier, it is possible to affirm that Naples, considering its coastal position, represents the fulcrum of the Mediterranean and the potential reference point for many of the commercial flows that use navigation for the transfer of goods and people. Urban morphogenesis, developed over the centuries, has shaped a fabric of considerable interest in which it is possible to distinguish, alongside the ancient nucleus in which the layout of the Hippodamian plan is still identifiable today, a series of other areas developed after the “reclamation” and more recently. In particular, some areas highlight typological and geometric homogeneity. In these areas, some characteristics can be distinguished that identify them as constituting an urban power hub. The main characteristics can be traced back to the geometric regularity of the plan, the prevalence of flat roofs, the uniformity of the average heights of the buildings, and the relative contiguity that allows to precisely delimit the homogeneous fabric of the potential power HUB. Considering the described characteristics, it is possible to identify in Naples the areas in the Mercato-Pendino district, the Vomero-Arenella district, the Bagnoli-Fuorigrotta district, etc. It is precisely this last urban context, in its coastal part, that represented one of the determinants for the choice, in 1905, to establish one of the most important industrial sites in Europe to the west, destined for steel production. This was one of the interventions that substantiated Italian industrial policy, which soon showed its limitations mainly attributable to the scant consideration of the actual vocations of the territory, which in the settlement of Bagnoli transformed, for industrial production, one of the most attractive places on the Neapolitan coast.
The Industrial site (Figure 3) remained active from 1910 until 1992, greatly influencing the western area of the city. After the dismission of the heavy factories, the city had to consider an urban conversion of an area of approximately 320 hectares, for which a significant reclamation action from soil and marine pollution had to be previously prepared.
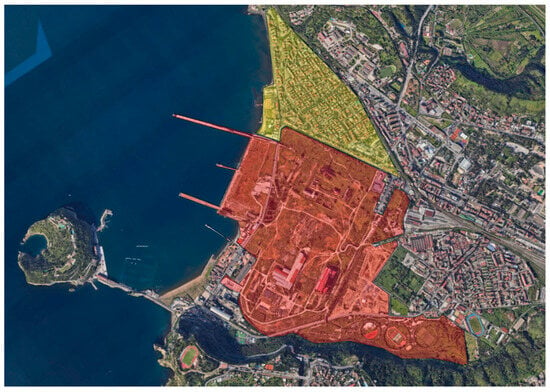
Figure 3.
The industrial mill (in red) and the surrounding district (in yellow).
Several urban plans have succeeded each other without, however, managing to arrive at a real definition for the immense urban territory. Currently, the area is governed by a Government Commission, and efforts are being made to find a solution for appropriate land uses that can recover some interventions already implemented and site conversion. Many of the factory workers resided in the close neighborhoods, created in contiguity to the industrial site to accommodate the workers. Many others lived in the Bagnoli district, not far from the workplace, born as a fishing village and become a working-class settlement. This led to a significant increase in population (the factory employed up to 8000 workers) and substantial urban development, manifested in the creation of residential areas around the industrial facilities. The 1920s and 1930s were characterized by the construction of houses, schools, and public structures to meet the growing needs of the rapidly expanding community. After the Second World War, the local community engaged in reconstruction, giving rise to a phase of economic growth and urban regeneration. As mentioned earlier, the transformation of the urban economy and the new functional references of the city, characterized by a significant development of the tertiary sector, determined the crisis of industrial production and the consequent closure of the steel mill. The urban history of the Bagnoli settlement has produced a building-residential context characterized by particularly interesting typologies for the methodological experimentation addressed in this study.
3. Materials and Methods
The precision and reliability of building energy analysis are closely linked to the quantity and quality of the data known. Therefore, before starting building energy performance analysis and modeling, it is crucial to have a first phase based on the identification of the most useful building characteristics and parameters for the study. To support the territorial analysis (and so for the screening of the urban landscape), Quantum Geographical Information System (QGIS v. 3.34 “Prizren”) is used. The software allows the creation of a digital environment in which the perimeters of the buildings are defined using a typical polygonal geometry. At this point, it is necessary to associate data with these buildings: the information can be obtained through direct investigations or from the processing of data coming from official sources, such as ISTAT (National Institute of Statistics) for Italy. The database that is then created includes a series of fields that contain useful information for evaluating energy needs, e.g., the covered surface area, the perimeter, the manufacturing height, the number of floors above ground, the year of construction, the destination of prevalent use (total and only on the ground floor), the building materials, the building type and the number of blind surfaces, etc. Each of these categories just listed represents a parameter that can influence the energy needs of a building and which is, therefore, of interest for calculation purposes. For example, the number of floors can be used to determine the total surface area, the heated/cooled volumes, and the quantity of surfaces.
The outputs selected as of interest and subsequently reported by the simulation software are those relating to the energy consumption of buildings, i.e., the energy requirement for space heating (), for space cooling (), the electrical energy for the lighting of the indoor environment () and that consumed to power the equipment (). For each of these outputs, the primary energy consumption (PEC) is calculated using the following equations (Equations (1)–(3)):
The primary energy demand for heating (), as well as that for cooling ), depending on the type of dedicated system. In this case, it is assumed that, for space heating, there is a traditional boiler in the buildings with an overall system efficiency of 0.62 (), while for space cooling, the presence of a split system with an energy efficiency ratio (EER) is assumed to be equal to 2.5. Referring to Equation (3), represents the quantity of electricity requested from the grid for various uses (lighting and equipment). Once the energy demand of the system is calculated, the latter is then multiplied by the primary energy factor (PEF) for heating with = 1.05, while in the case of electricity for = 1.95.
Subsequently, once the annual primary energy consumption has been obtained for each question, the objective is to obtain a generalizable value based on the archetype of the building considered. To this end, it is possible to calculate a specific annual primary energy consumption, both total and for each type of energy demand, compared to the usable floor area of the building, using Equation (4):
The aim of this method is to determine the energy needs of an entire territorial area starting from values obtained from archetypes (typical buildings that can be generalized for each building category) and, therefore, reusable for all similar buildings through the application of correction factors (cf), which consider the differences. In detail, the correction factors are established through an in-depth analysis, which varies from case to case and considers the value of the differences among buildings, even depending on the specific energy need calculation.
From the total energy requirement of buildings, it is then possible to understand, through an analysis of the potential renewable sources that can be installed, how it is possible to integrate a renewable rate to cover part or all the energy demand of buildings. The results can be viewed through urban energy maps (UEM), which can be created in the QGIS environment. These maps provide a complete and informed overview of an urban area’s energy dynamics, thus facilitating energy planning, environmental performance assessment, and the formulation of sustainability strategies.
This is a fast and outbreaking tool. Indeed, UEMs are useful tools for political decision-makers, urban planners, and researchers engaged in the sustainable development of cities, but also to more actively involve citizens who can understand government decisions regarding the energy and sustainable strategies of the community and express their needs in a participatory way.
As already stated, the methodology is based on the calculation of a homogeneous and densely populated urban area. However, at the same time, the authors’ aim is to provide a flexible calculation criterion that can be modified and adapted to any other type of urban pattern through appropriate modifications.
3.1. QGIS Description
In modern town planning research, technological innovation has enabled the definition of new perspectives for analysis and understanding of territorial phenomena. Particularly in the construction of knowledge frameworks, the use of urban and territorial survey techniques conducted through satellite imagery or drones is now consolidated. At the same time, the possibility of constructing new environments for knowledge development through the acquired data is represented by Geographic Information Systems (GIS) [42]. Currently, GIS represents the elective environment for every city planning and management activity and is naturally able to integrate the new algorithms of artificial intelligence that will increasingly characterize urban planning activities. The development of open-source software represents one of the most interesting trends in current technological innovation, considering the availability of code, including LLM, such as Meta’s Llama3. This is the main motivation that characterizes the choice to adopt open-source software for university research, which is subsequently transferred to teaching procedures and techniques for analysis and interpretation of phenomena.
In the field of GIS, QGIS software is the best example of an environment capable of ensuring user-friendliness, remarkable versatility of available functions, and significant computing power. This software, born in 2002 from the work of Gary Sherman, is now a widely used standard in the field of urban planning. The specific methodological application has allowed the development of interesting definitions for the considered building typologies. The possibility of using software routines (plug-ins) that can be loaded as needed, specifically developed for solving specific problems, undoubtedly represents one of the most interesting and powerful specificities of QGIS software.
Considering such potential, the development of a plug-in capable of autonomously identifying topological areas characterized by the presence of contiguous geometric entities (buildings) that can effectively constitute a power hub is currently under study and will be described in the following section.
3.2. Buildings Archetypes
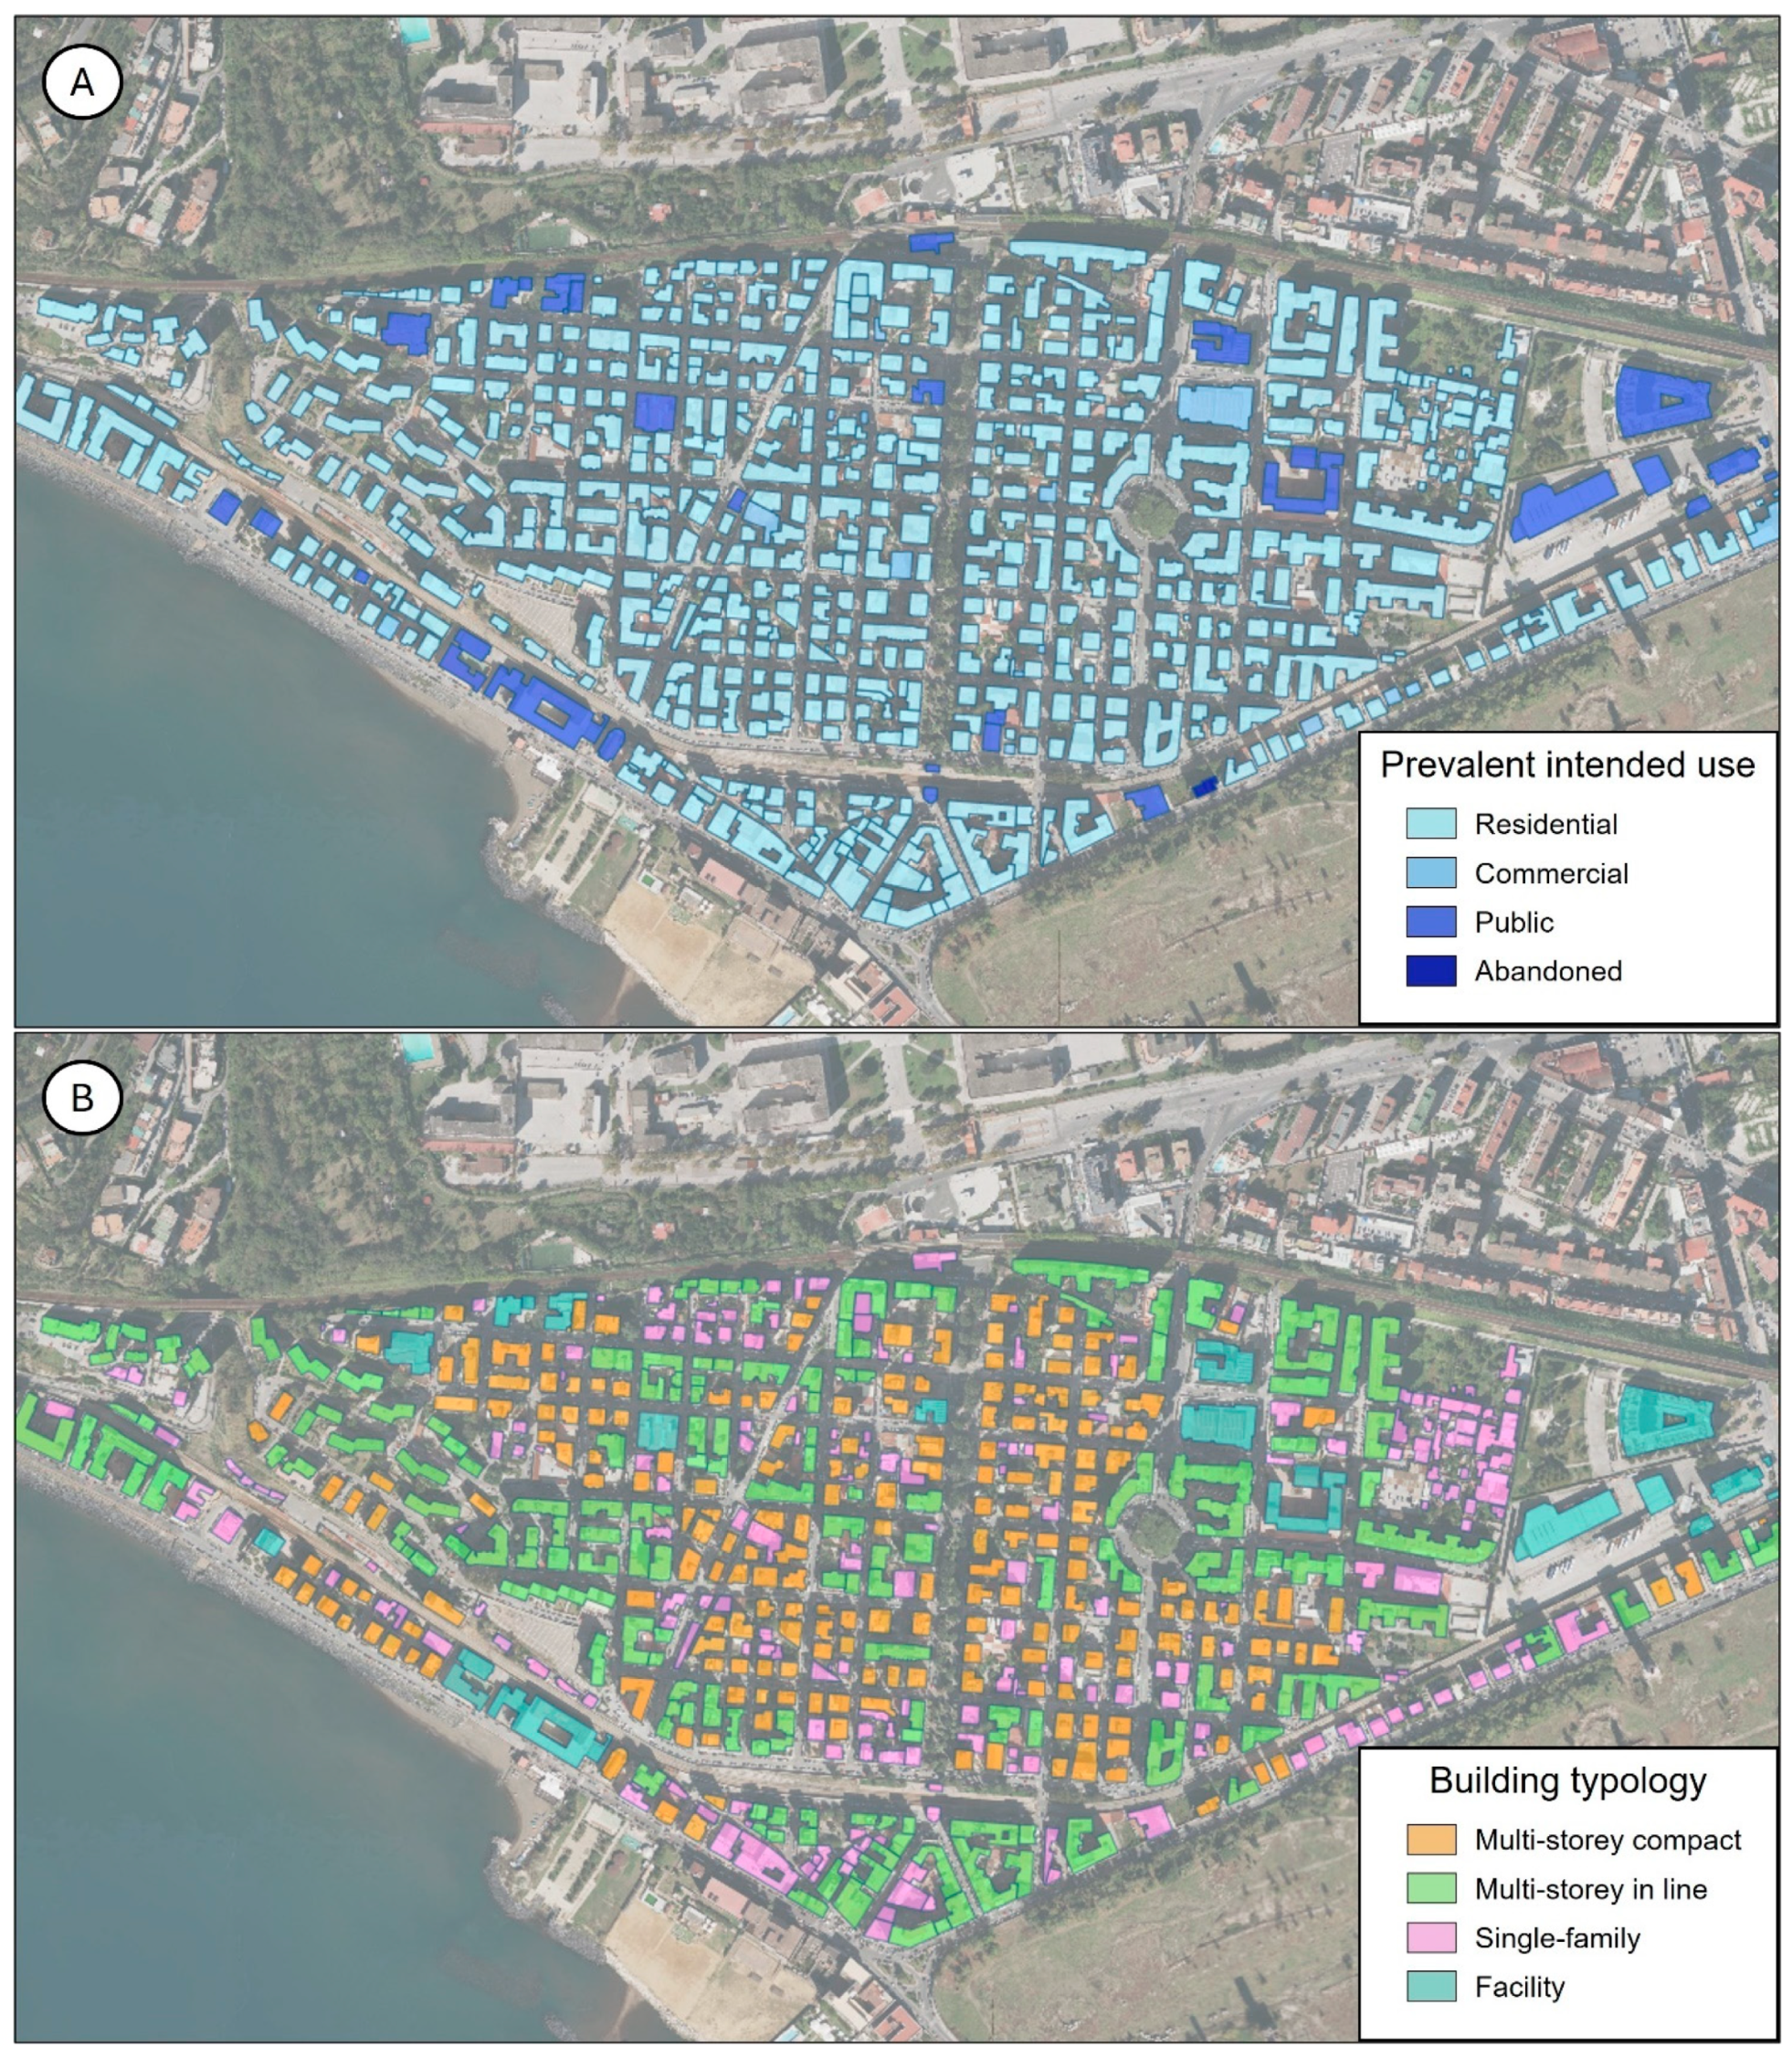
Figure 4 resumes, using QGIS, the building characterization based on (a) the building’s intended use and (b) the building’s archetype typology. The main intended use is undoubtedly residential, with a significant percentage of buildings used for this purpose. However, it is interesting to note the presence of buildings with public functions, such as schools and educational, as well as commercial buildings. The presence of some defunctionalized areas highlights the importance of adopting new flexible and dynamic urban planning strategies that adapt to changes over time and consider the needs of the local community.
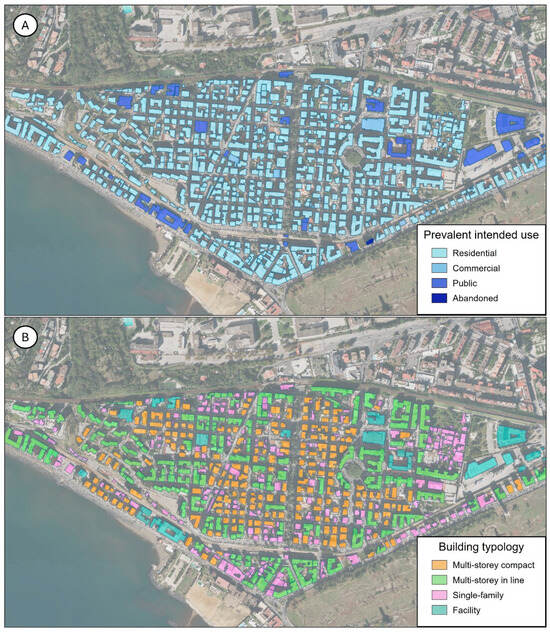
Figure 4.
(A) Prevalent intended use for the analyzed district buildings; (B) building typologies in the district.
Through careful analysis, four main building typologies (namely, the “archetypes”) are identified among those described in the previous chapter to classify all the existing buildings in the Bagnoli district area:
- Multi-story compact building unit;
- Multi-story building units, in line;
- Single-family isolated building unit;
- Facility and tertiary sector.
From Figure 4, where the categorization of buildings according to building type is also presented, it is immediately clear that most buildings belong to the compact or in-line multi-story typologies, with a significant presence even of the compact building unit type. Structures intended for urban functions are less present than the others.
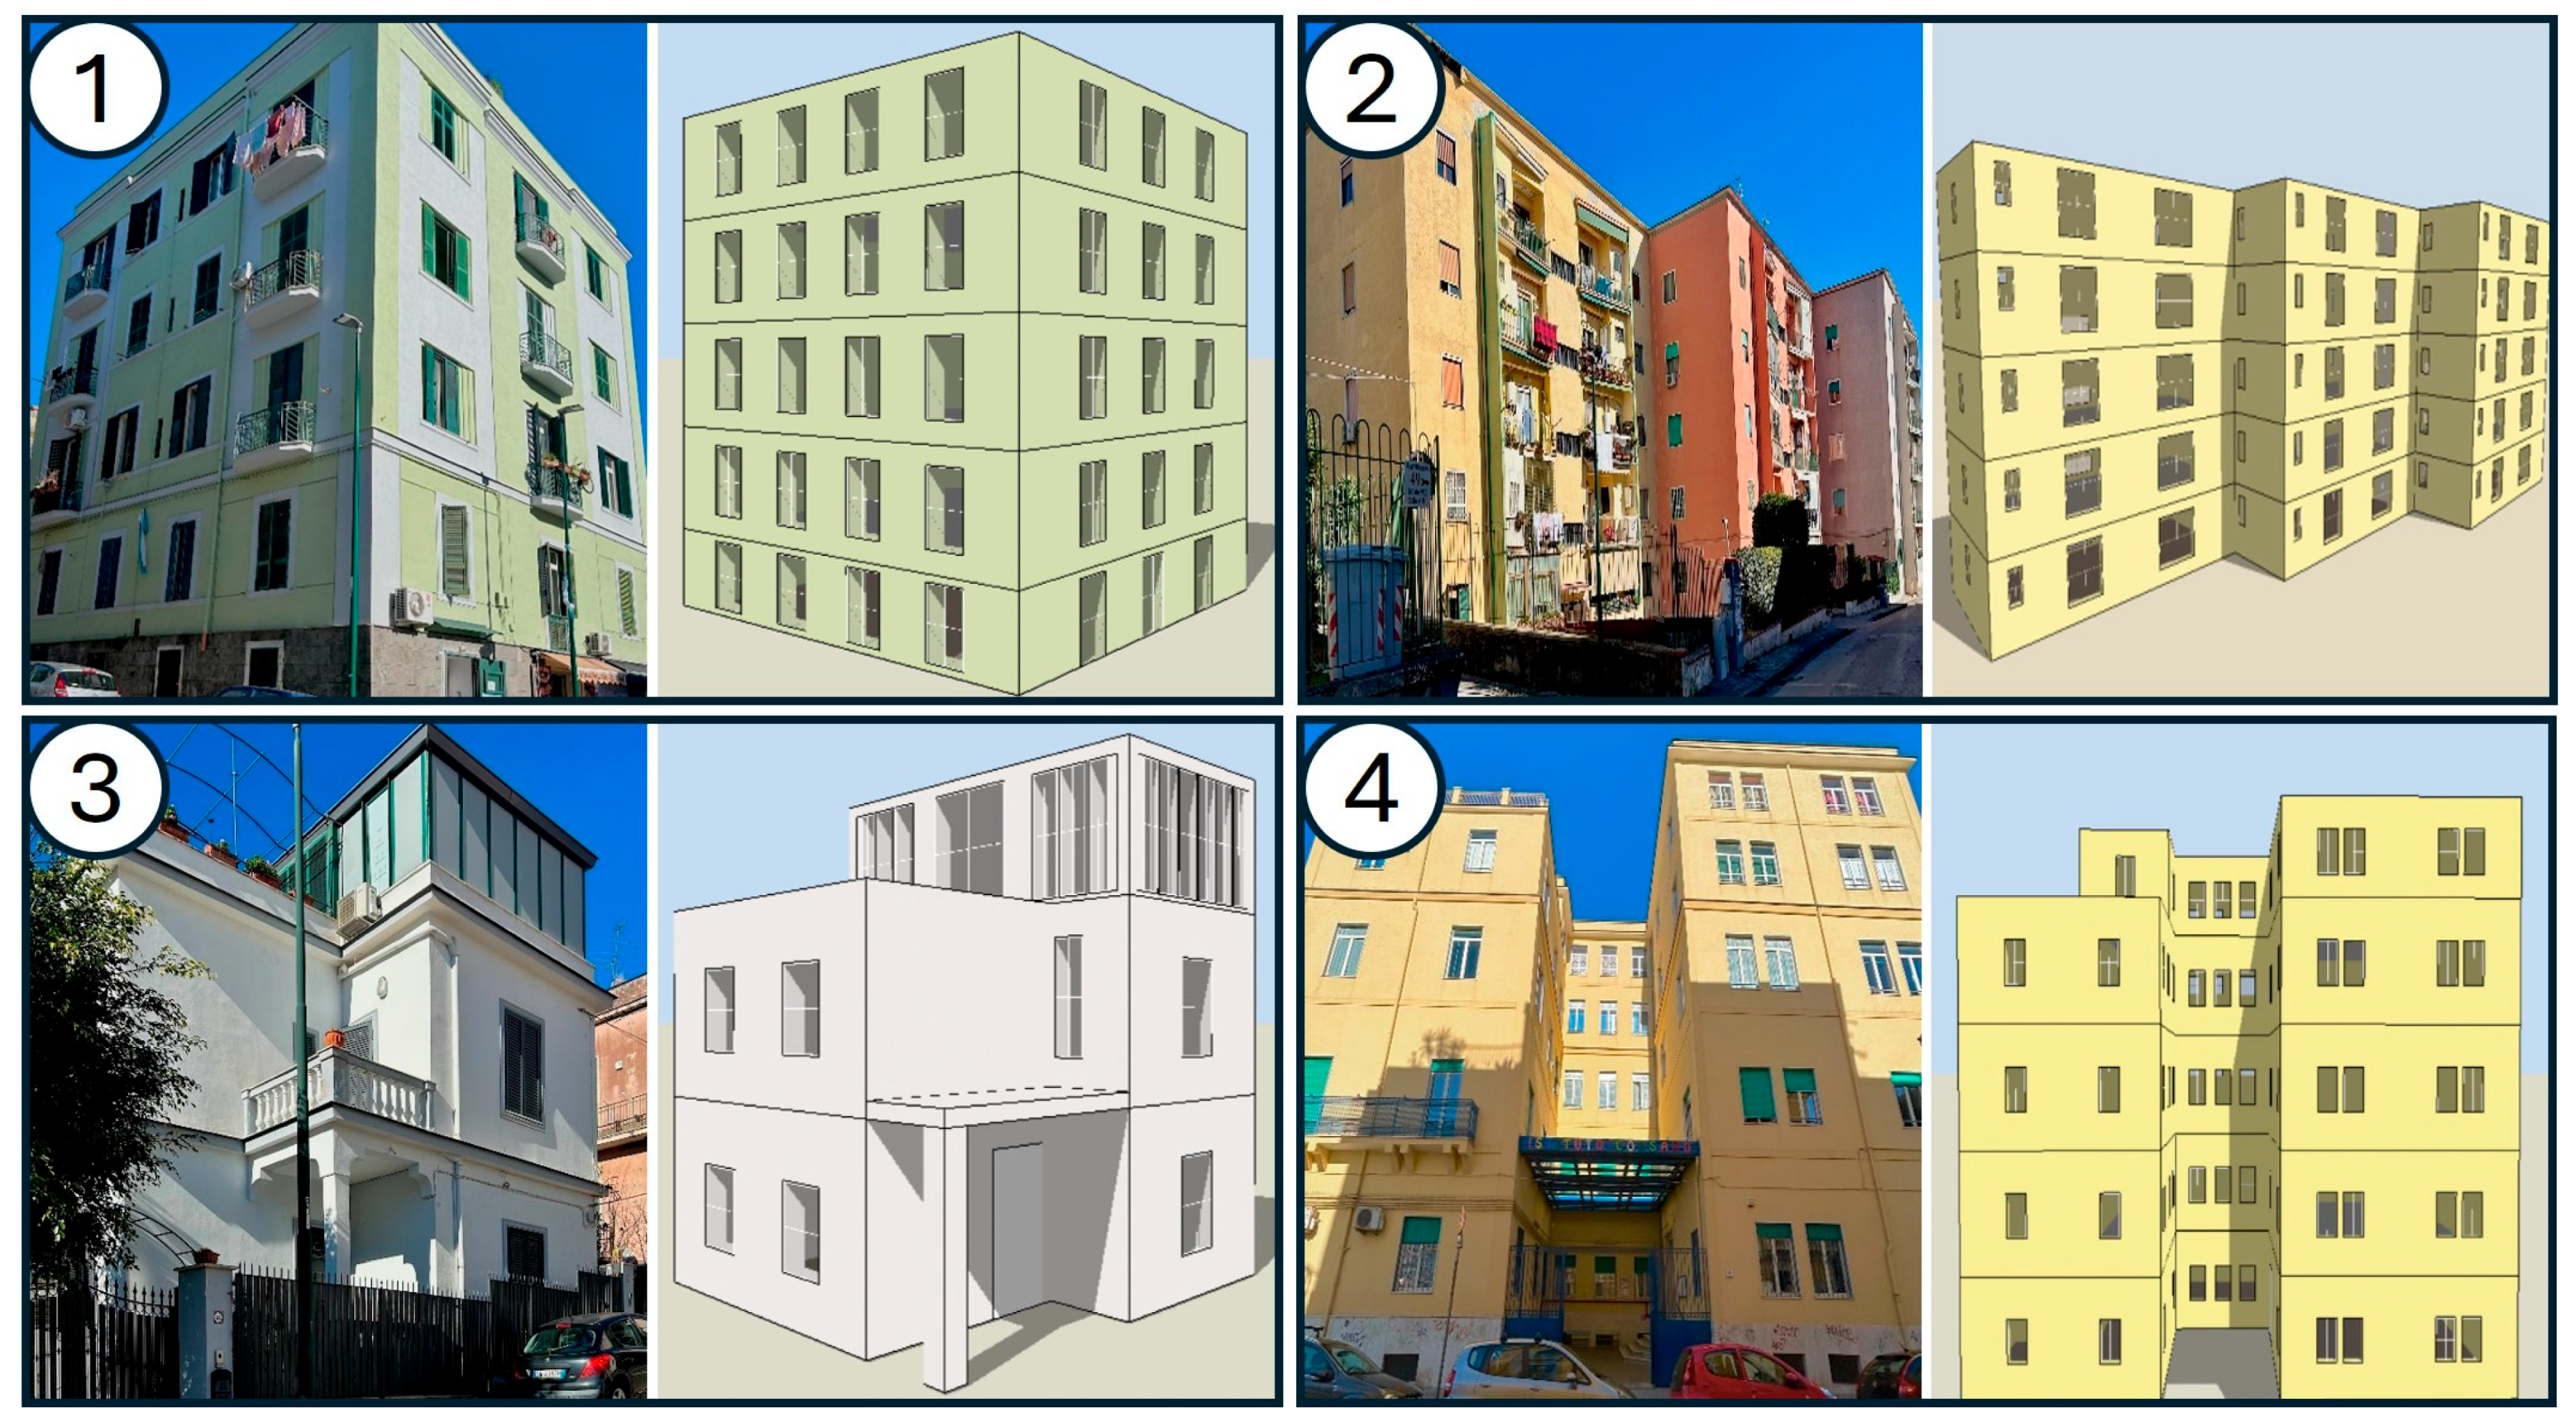
The next step of the analysis was to select the four representative archetypes, one for each type, to be studied in their shape, geometry, and constituent elements. Each archetype is defined and modeled in detail using DesignBuilder (v7.0.2.006) [43] and simulated in EnergyPlus (v9.4) [44] in order to obtain information relating to energy consumption, including space heating, space cooling, lighting, and equipment, useful for the case study. Figure 5 provides, for the four building archetypes, the reference real building (on the left) and the modeled one (on the right).
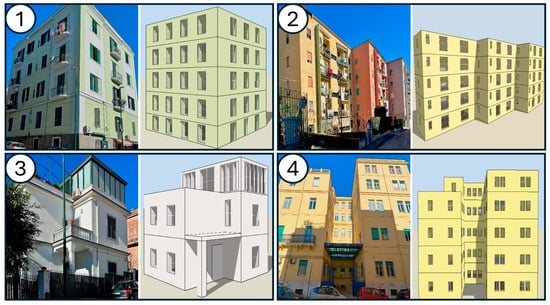
Figure 5.
Buildings archetypes: on the left the considered existing buildings, and on the right the building models. (1) Multi-story compact building unit; (2) multi-story building units, in line; (3) single-family isolated building unit; (4) facility and tertiary sector.
The building models of the archetypes have been defined with high care by considering tailored boundary conditions and input concerning all main aspects affecting the thermal and energy performance, and thus the accurate modeling of the building envelope, the thermos-physics of the opaque and transparent building components, the sub-systems and overall energy performance of the heating and cooling plants, the modality of buildings’ uses, the schedules governing the operation of systems, and so on. As said, transient energy simulations were applied by considering conduction transfer functions (CTF) as the algorithm to solve the heat transfer. Analogously, reliable modeling of lighting and electric equipment was also considered.
Finally, the outcomes were the thermal needs and energy demands, according to different energy uses and sources, of the four archetypes, regarding the single day, the whole season, yearly, and by considering a unitary floor surface.
3.3. Extension of Energy Demands to the Whole Building Stock
As already explained, the main objective of the study is to be able, starting from the information obtained from these four archetypes, to determine the energy needs of each building in the district by multiplying the values obtained by a series of coefficients obtained by carefully analyzing the differences between the individual buildings. The differences are weighted based on their value or with respect to the energy calculation, thus transforming them into multiplicative coefficients.
In this first study, the multiplicative coefficients identified, which evaluate various characteristics, are three, i.e., , , and :
- : considers the prevalent use of both the entire building and the ground floor (it is a combination of the two). This information was obtained through an accurate analysis of the territory and is necessary to have an idea of the typical operating schedules of the building and the needs in terms of energy demand;
- : considers the construction year of the building. This information was obtained from ISTAT data and is useful to know the construction technology for the period and, therefore, to know the typical compositions of the building envelope components, including the thermal transmittance values;
- : considers which surfaces are irradiated and which are shaded/blind, also depending on the orientation, i.e., whether they face east, west, north, or south. This information was acquired through the consultation of cartographic tools and is of particular importance for determining the free contributions linked to solar radiation in the building.
The values of these coefficients are reported in Table 1, Table 2 and Table 3, differentiated according to the type of energy demand, i.e., for heating, cooling, lighting, and equipment. Table 1 illustrates the correction factors for the different intended uses (): for example, a different value is considered if the building is entirely used for residential purposes or if only the ground floor of it has a commercial function since this affects energy consumption. Table 2, then, refers to the second correction factor, i.e., the one that takes into account the year of construction of the building (). About this coefficient, five different construction eras have been identified, which can be generalized as the main and most representative of the Italian building heritage. The last correction factors () are reported in Table 3 and are related to exposure and contiguity of surfaces: to this end, both the number of blind surfaces of a building and their orientation are considered.

Table 1.
Correction factors 1 (), for each energy demand, for different building intended uses.
Table 2.
Correction factors (), for each energy demand for different building construction years.
Table 3.
Correction factors (), for each energy demand, considering building contiguities.
These coefficients are multiplied by the values of to correct the annual energy demands per m2 of all the buildings in the examined district. By multiplying this value by the air-conditioned area of each individual building it is therefore possible to obtain its energy demand, from the sum of which that of the entire district is obtained.
Starting from the GIS software, it is possible to characterize and obtain a library of input necessary then, through an algorithm, to obtain the final values of the building’s energy demand. Obviously, the first thing to identify is the building typology (reference archetype), as depending on this, there is a default starting value for the building’s energy demand (see Table 2). Therefore, depending on the intended use of the building (), the construction year (), and the contiguities of the building (), if present, it is possible to obtain the building energy demand as an output. As an example, it is reported through Equation (5), an example of how it is calculated the for space heating through the algorithm.
Then, starting from the building archetype (), it is multiplied by the first corrective factor (—see Table 1), by the second corrective factor (—see Table 2), and finally, by the third correction factor (—see Table 3). The algorithm created allows once the archetype and, therefore, the basic energy demand has been identified for moving on the column of each correction factor (see Table 1, Table 2 and Table 3) to select the right one in reference to the building in question. Even for the other energy demands, the procedure is the same, but the correction factors are different, i.e., for cooling to , for lighting to , for the equipment to .
4. Results and Discussions
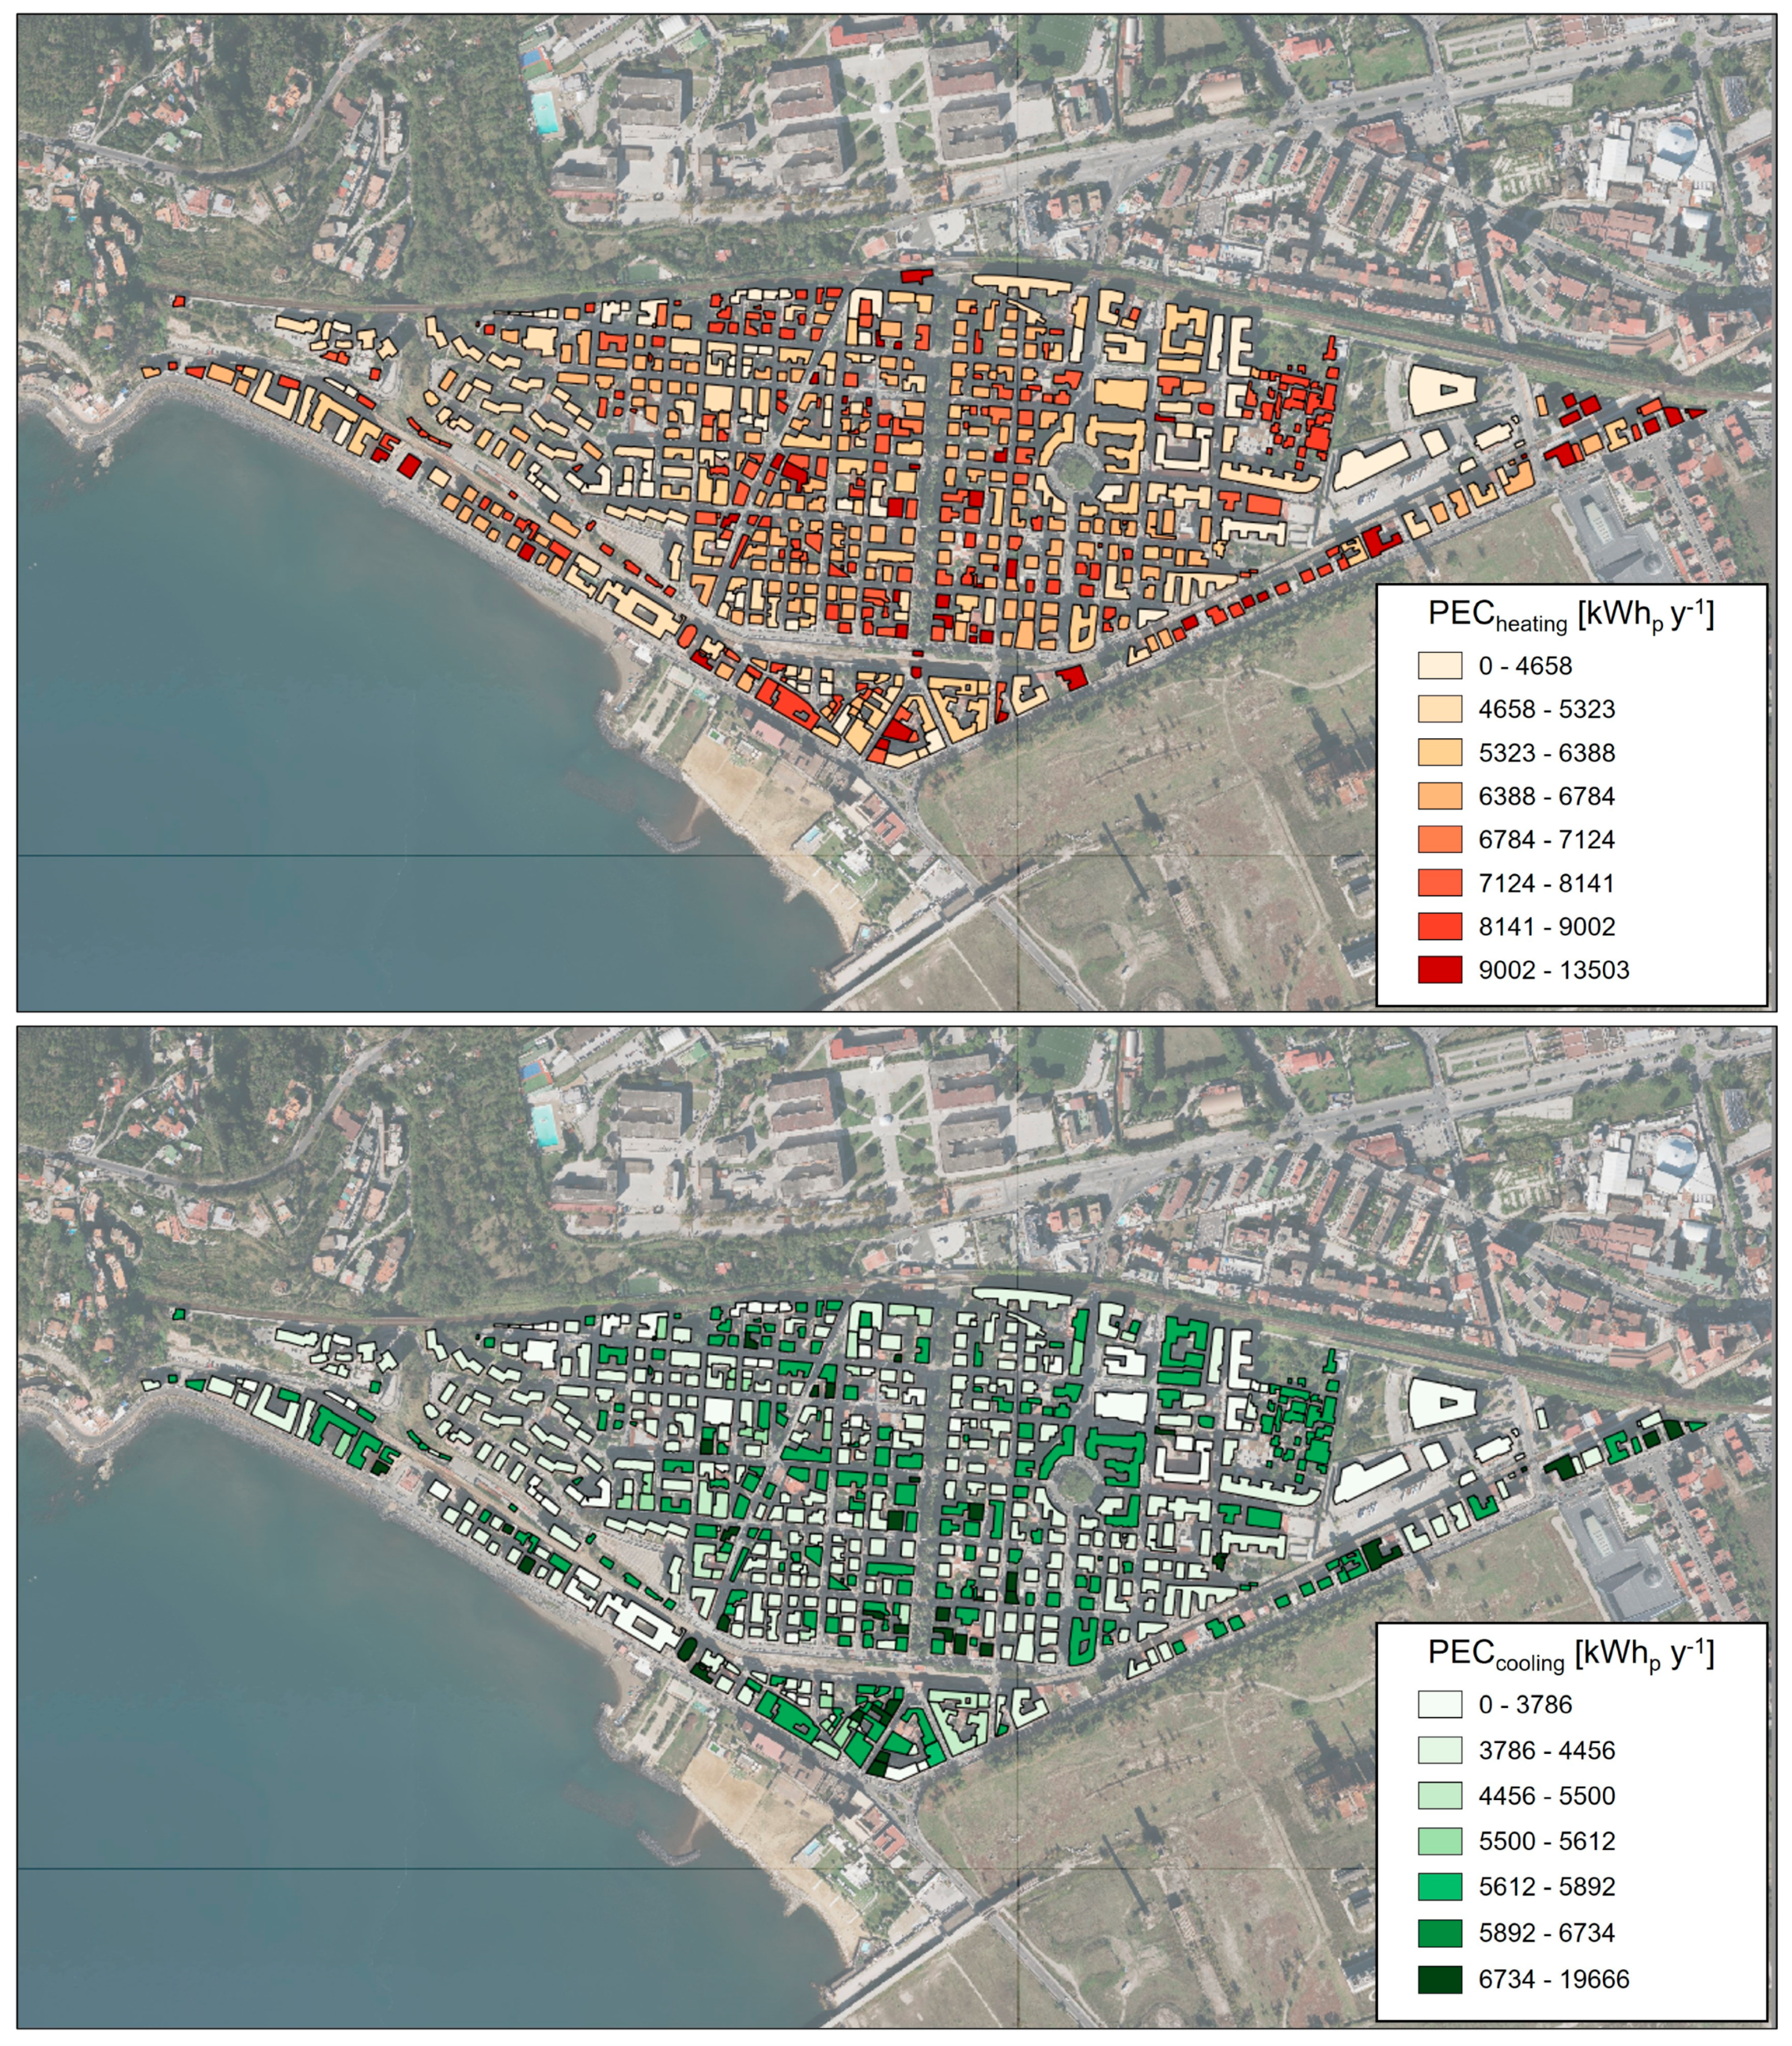
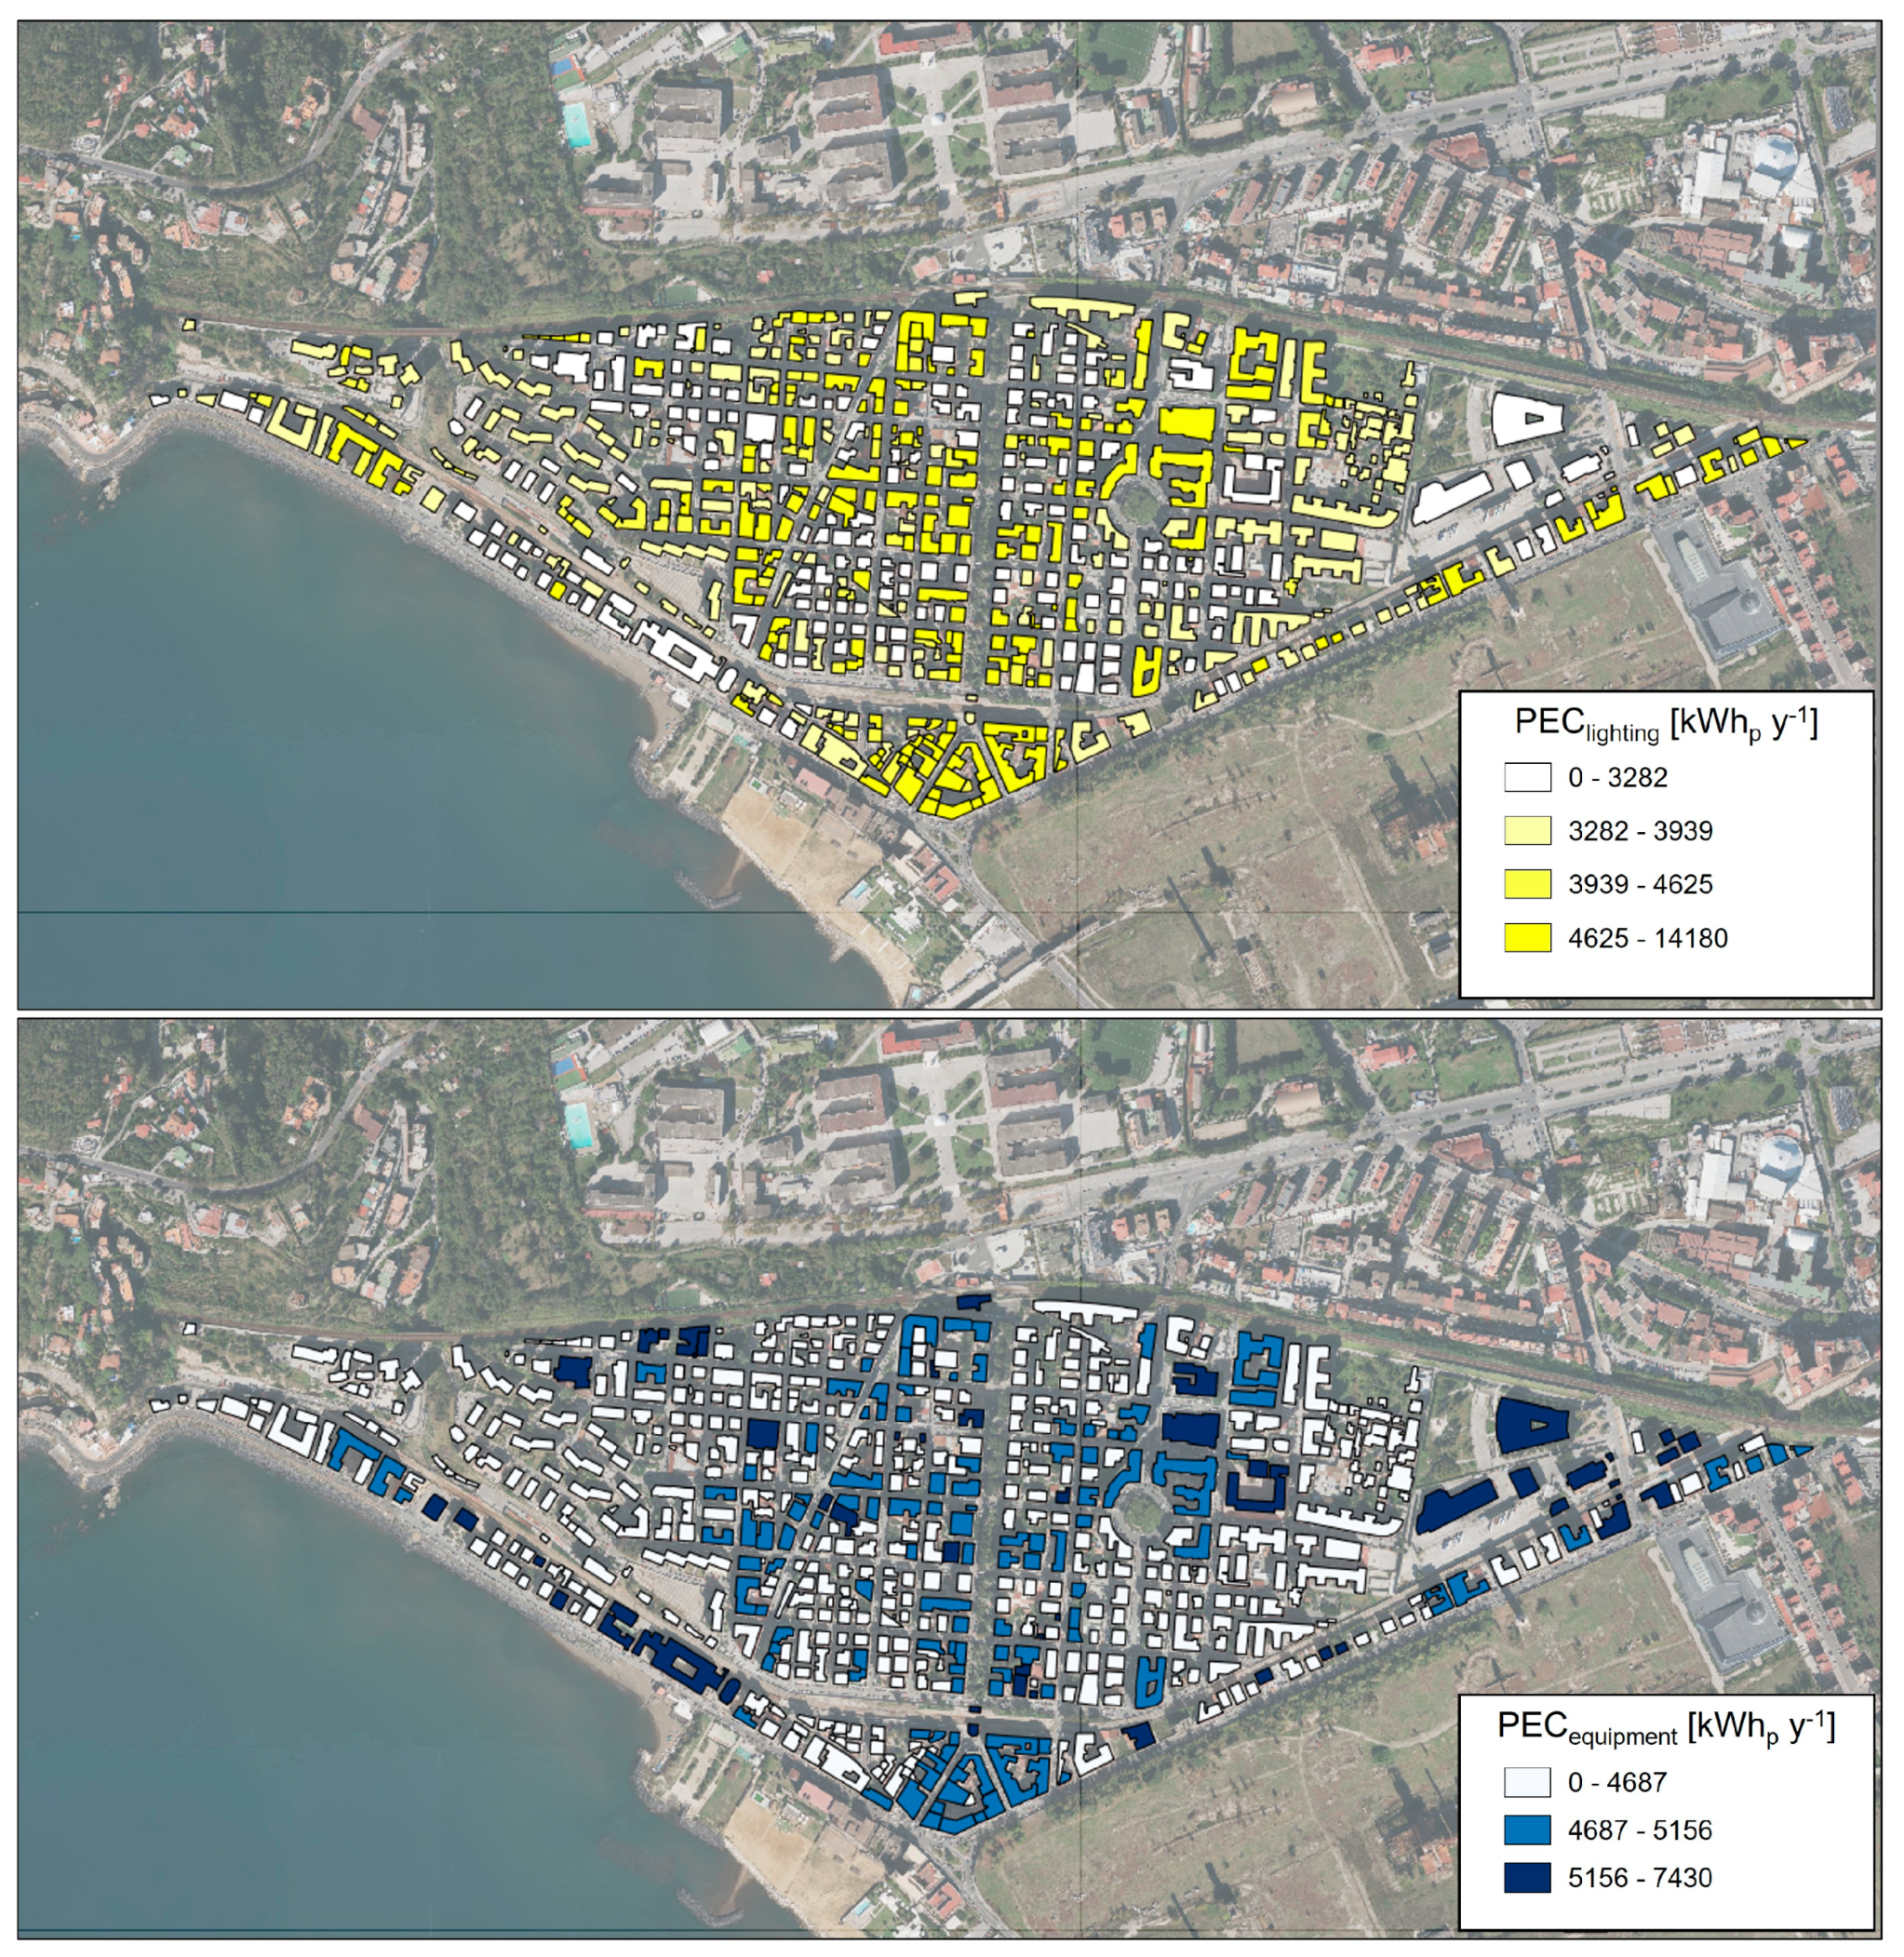
The results can then be imported and then displayed through urban energy maps (UEM), which can be created in the QGIS environment. The objective of these maps is to provide a complete and informative overview of the energy dynamics of an urban area, facilitating energy planning, environmental performance assessment, and the formulation of sustainability strategies. Figure 6, Figure 7 and Figure 8 show the UEMs for the different energy demands. In particular, Figure 6 refers to space heating and space cooling; Figure 7 refers to interior lighting and interior electric equipment; and, finally, Figure 8 refers to the primary energy consumption of the whole building, i.e., the PEC linked to the sum of all the previous energy demands. These energy maps provide a clear understanding of the buildings that have higher energy consumption and, therefore, require a higher amount of energy. UEMs are able to provide immediate visual identification of performance and energy critical issues, support the analysis of current energy quality, and the evaluation of possible improvement actions not limited to the single building but extending to entire city neighborhoods.
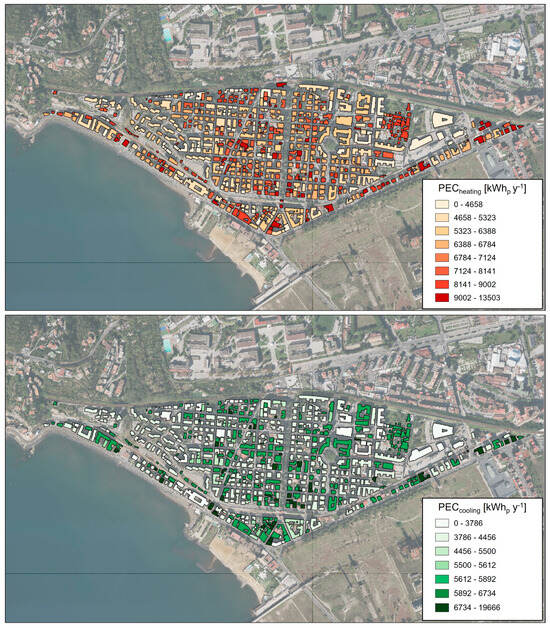
Figure 6.
Heating (up) and cooling (down) Urban Energy Maps for the examined district, QGIS.
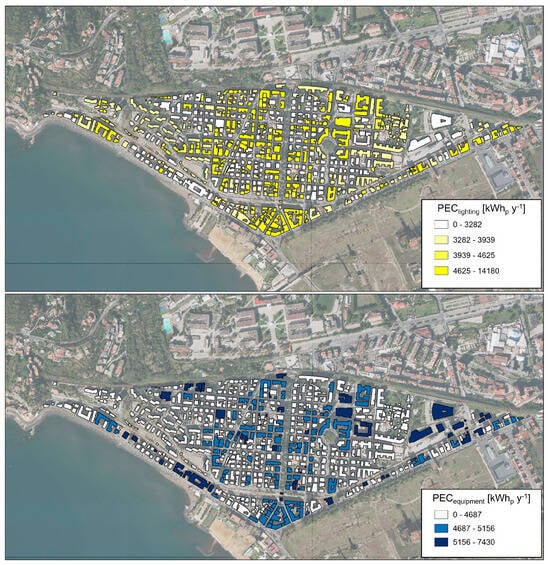
Figure 7.
Interior lighting (up) and equipment (down) Urban Energy Maps for the examined district, QGIS.
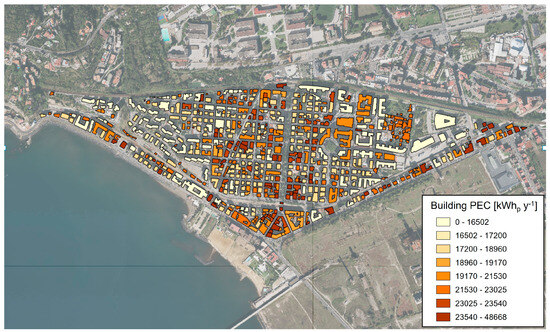
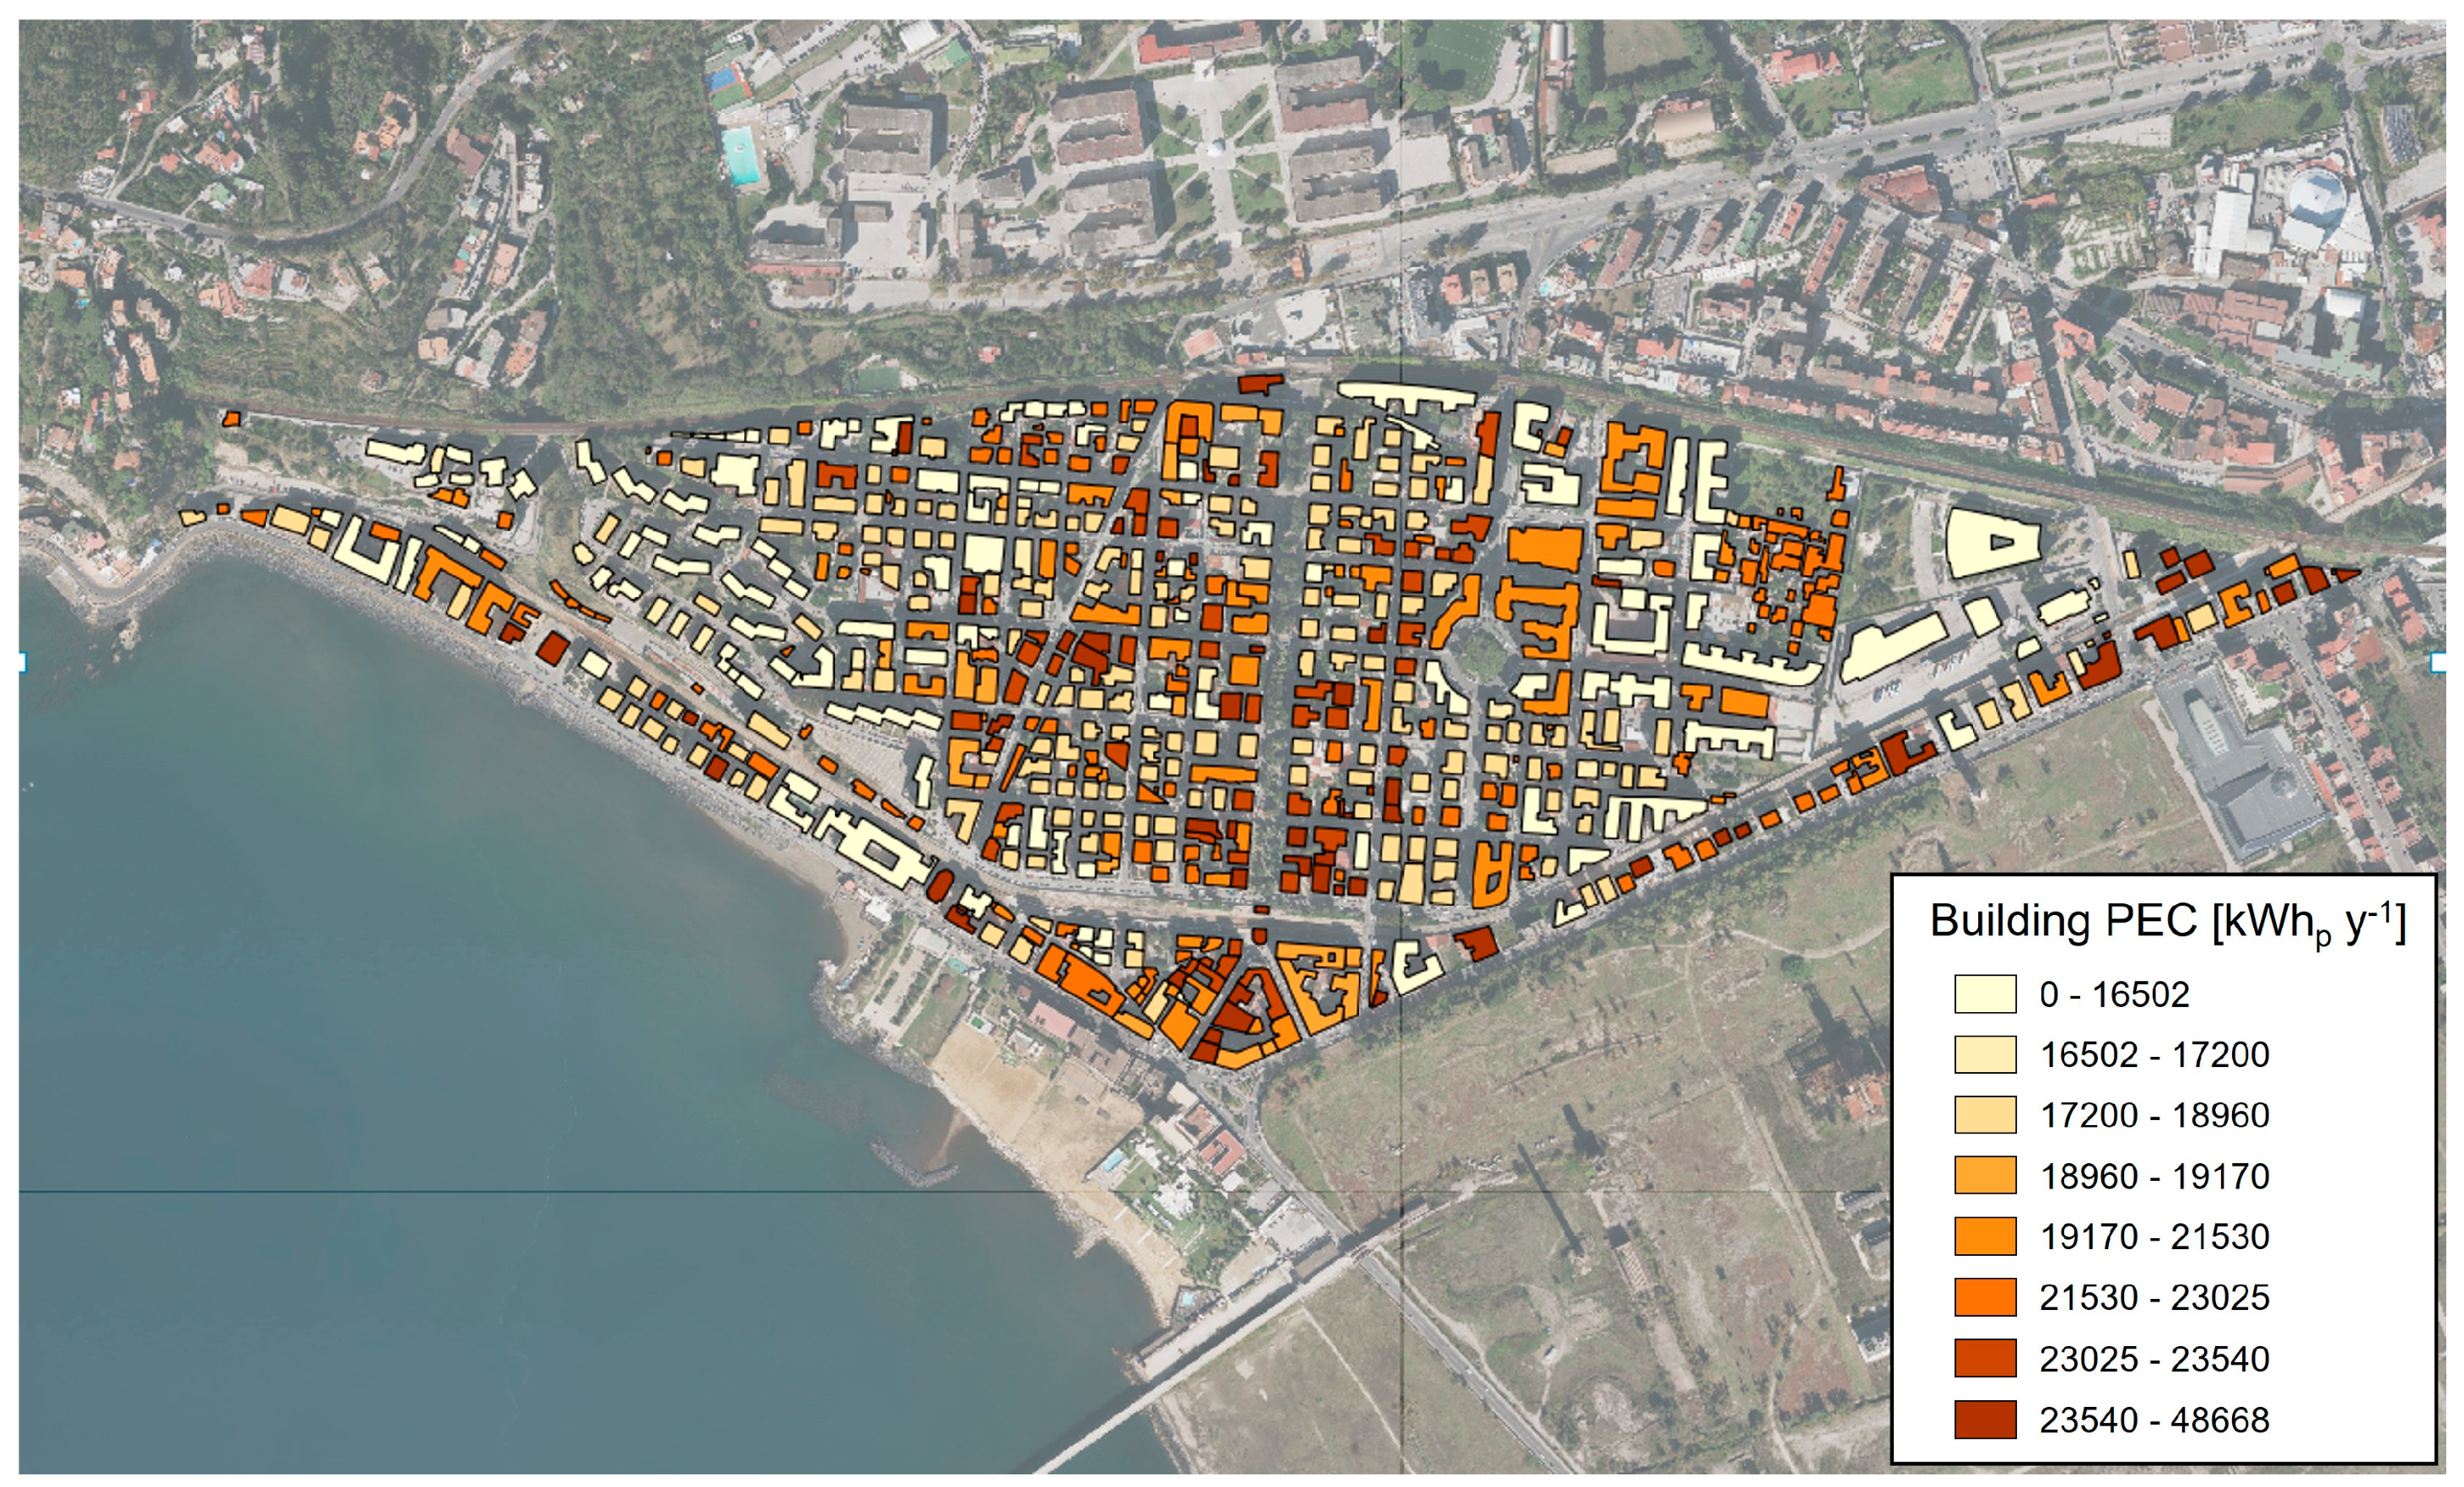
Figure 8.
PEC Urban Energy Map for the examined district, QGIS.
The last step of the procedure consists of a rapid estimation of the energy conversion potential (namely, electricity from photovoltaic) of the roofing surfaces for the analyzed district. This evaluation is possible by considering, through GIS, the covered surface area of buildings and the levels of average exposure to solar radiation.
For the analyzed Bagnoli district, the total floor area is estimated to be around 206,584 m2, while the total roofing area for all buildings is estimated to be 61,154 m2. The PEC of the entire district, considering the total floor area, is approximately 12.89 GWhp/year. This value can be determined starting from the sum of the contributions of each building. The use of GIS software allows energy demands of different types to be defined and, therefore, obtained in a very simple way through UEMs. It is possible also to focus only on the electricity energy requirement, i.e., that linked to the demand for space cooling, lighting, and equipment, and to carry out a feasibility analysis on the potential installation of photovoltaic (PV) panels on the roofs of buildings, considering different percentage of the total roof area for the PV installation. Really, until now, the use of electric systems (boilers and/or heat pumps) for space heating is extremely rare. It is considered the installation of highly energy-efficient monocrystalline silicon photovoltaic panels: 1.6 m2 of the module + 0.6 m2 as necessary spacing around, with a peak power of 0.4 kWel per panel. Considering a slope angle of 5° and the installation of these panels in Bagnoli, Naples (Italy), using the PVGIS software v.5.2, it is possible to obtain, for a single panel, the yearly production of electricity, equivalent to the value of 528.5 kWhel/year. It is important to note that these values are considered at slightly less than optimal conditions to ensure a safety margin.
Concerning the entire roofing area that can be used for the installation of photovoltaic panels, here only a percentage in the range of 20% to 40% has been considered since it is necessary to take into account various issues such as shading, inclination of the panels, and other constraints that can limit their effective use for photovoltaic purposes. By separately analyzing the two conditions, the minimum one (with the net eligible surface equal to 20% of the total) and the maximum one (with the net eligible area equal to 40% of the total), it is possible to have a clear overview of electric energy producibility.
The number of panels that can be totally installed and their producibility can be easily calculated starting from, respectively, Equations (6) and (7), where represents the total roofing area considered usable while is the gross area of a single panel, i.e., 2.2 m2. is the total yearly energy conversion from PV.
Table 4 resumes the buildings’ energy demand and PV energy conversion for the different percentages of the total roofing area considered for the installation. Table 4 also provides how PV can cover the electric energy building demands (in %), considering three different scenarios (only cooling demand, lighting and equipment, and both) and the potential excess electric energy (not usable from the district).
Table 4.
Energy demand and PV energy conversion resume: covered and excess electric energy.
In the minimum condition (i.e., the available surface at 20% of the total), the usable area is equal to 12,230.8 m2 and results in the possible installation of 5559 PV panels for a total electric energy conversion of 2.94 GWhel/year. In this condition, the production of the PVs could cover 68% of the electric energy needs, leaving approximately 1.37 GWhel/year uncovered, which would depend on the electricity grid.
In the maximum condition (surface that can be equipped at 40% of the total), however, the usable surface is equal to 18,346.2 m2, and, therefore, in 8339 PV panels, for a total electric energy conversion of 5.88 GWhel/year. In this case, the producibility of the PV installation would not only potentially cover the entire energy needs of the district, but it would also generate a significant energy surplus for the city. The difference between producible and consumable energy, which is approximately 1.57 GWh/year, could be a precious resource for the city, contributing to greater energy self-sufficiency, the reduction of emissions, and the overall improvement of the quality of the urban environment.
Based on the analysis conducted, the potential convenience of installing photovoltaic panels to reduce environmental impact and to guarantee a sustainable and independent energy supply is evident. The conversion of energy from renewable sources, such as solar energy, would not only support the mitigation of greenhouse gas emissions and air pollution but also reduce the dependence on fossil fuels and promote a cleaner and more sustainable energy future for the city.
Obviously, the estimation made is approximate and requires further investigation through detailed studies and analyses on various aspects, including the intermittency of renewable sources, the shading of the panels, and the impact of climate change. Furthermore, it is necessary to analyze the energy demands on an hourly basis, but it is not easy when moving from a single building to the district level.
In a GIS environment, it is possible to develop and deepen these calculations as it allows for the management and analysis of complex geographical data, including those relating to the distribution of buildings, the topography of the land, and solar radiation. Using detailed geospatial data, it is possible to precisely map the areas covered by buildings and evaluate the solar exposure of each area. GIS allows the combination of this information to calculate photovoltaic energy conversion potential efficiently and accurately. Through spatial analysis, it is possible to determine the areas with the greatest energy production potential. In particular, through the creation of three-dimensional (3D) maps, which add an additional level of understanding and visualization, this environment is able to accurately represent the morphology, including details such as height, surfaces’ slope, and shading. This capability is particularly useful in the analysis of PV energy production as it allows you to precisely evaluate the optimal inclination angle and orientation of the panels on each surface.
Food for Thought: Goals, Perspectives and Limitations
The approach presented in this study is a tool for identifying priorities and energy demands of entire districts, identifying the main criticalities of a district or the best areas according to the energy demands, evaluating the potential energy conversion from renewables, supporting the town, and energy planning.
The main points that emerged from the study are summarized below:
- It is necessary to promote energy efficiency in urban areas. This involves the adoption of advanced technologies, effective design of new buildings, and correct renovation of existing buildings to make them more sustainable. It is, therefore, becoming increasingly necessary to include new regulations and incentives for energy efficiency;
- The use of renewable energy sources is one of the interventions that can significantly contribute to urban sustainability and can reduce dependence on fossil fuels, also improving the resilience of cities to changes in the global energy market;
- Integrated urban planning is needed, involving a wide range of stakeholders, including citizens, companies, or associations, in the design of sustainable cities. This approach could develop strategies and plans that respond to the needs of all sectors of society;
- The approach adopted for the control and planning of the city is of a systemic nature, which conceives the city as a complex system made up of infinite interconnected parts that mutually influence their functioning. Through this approach, urban planners can guarantee that future plans provide for an evolution compatible with the resources available.
- GIS is an important tool that supports territorial planning in the analysis and governance of the urban system, allowing the connection of urban energy maps with alphanumeric data and facilitating the visualization of the inter-relationships between the elements of the urban context.
The implementation of these changes requires a joint commitment between the public and private sectors, with incentives and tax breaks that can stimulate more sustainable investments and behavior. The active involvement of policy-makers is essential to transform the potential solutions identified into concrete actions. The awareness of how energy demand influences urban evolution must translate into innovative urban planning policies and the promotion of projects that demonstrate the effectiveness of sustainable approaches.
Currently, the main limitation is that all results are referred to on an annual basis, while a future deepening should provide hourly energy demands for the development of an effective renewable energy community capable of matching energy demand and energy conversion, using storage, also supporting electric mobility, integrating the energy flows of each building with all the others of the districts. In future development, therefore, the method will be scaled (dynamic-based) to predict energy performance and conversion according to hourly profiles, keeping the same approach, and thus the accurate evaluation of energy demands for reference archetypes buildings, then suitably corrected to refer to any building of the district.
5. Conclusions
This work explores in depth the dynamics existing between the urban systems, complex and dynamic, and the growing energy demand, providing an exhaustive picture of the challenges and opportunities to which contemporary cities are subject. To support this issue, a calculation methodology has been developed to evaluate the energy needs of existing buildings through an algorithm that considers several parameters to determine the energy needs of urban areas, starting from building archetypes. The investigation includes, through the contemporary use of GIS software and the proposed algorithm, the creation of urban energy maps. UEMs are created, for an examined district, showing how it can be an important and immediate visual representation of energy performance and any critical issues for the buildings. Visualizing the UEMs for the analyzed case study, it is possible to highlight the high energy building demand in an area with a high density of buildings, showing the need for interventions to reduce the environmental footprint and ensure long-term sustainability. Urban planning is configured as a necessary tool to prevent, plan and govern the future of cities in a more sustainable way, compatible with the resources available. GIS, as a decision support, analysis, and territorial governance tool, promotes energy-centered urban planning, helping to support a sustainable energy future for the city by offering the possibility of quickly verifying the potentiality and the problems of the different urban areas. In this direction, the integration of the proposed calculation method with GIS represents a fundamental step.
The goal of this study was to develop a scalable calculation approach that could also lead to the creation of a tool for assessing the total and partial energy requirements of buildings within an urban district. This tool, integrated with GIS software, aims to identify potential districts where effective retrofit techniques can be proposed to reduce energy demand and integrate various renewable sources, forming energy communities. The objective was to maximize the potential of the territory while minimizing energy demands as much as possible.
Optimizing urban districts can lead to the creation of energy communities that can not only partially or fully meet the district’s energy needs but also transfer any surplus energy from on-site conversion to surrounding areas.
Author Contributions
Conceptualization, G.A., F.A., R.F. and T.I.; Methodology, G.A., F.A., R.F. and T.I.; Investigation, G.A., F.A., R.F. and T.I.; Writing—original draft, G.A., F.A., R.F. and T.I. All authors have read and agreed to the published version of the manuscript.
Funding
The present work has been developed within the project funded under the National Recovery and Resilience Plan (NRRP), Mission 4 Component 2 Investment 1.3—Call for tender No. 1561 of 11 October 2022 of Ministero dell’Università e della Ricerca (MUR); funded by the European Union—NextGenerationEU. Award Number: Project Code PE0000021, Concession Decree No. 1561 of 11 October 2022 adopted by Ministero dell’Università e della Ricerca (MUR), CUP E63C22002160007, Project title “Network 4 Energy Sustainable Transition—NEST”. This research was also funded by Italian PRIN 2022, Italian Government, project entitled HERITAGE—Holistic Energy Renovation and adaptive reuse of historical buildings and sites for an Inclusive, resilient, and Globally sustainable built Environment, contract n. 20223M4R8B, recipient Fabrizio Ascione.
Institutional Review Board Statement
Not applicable.
Informed Consent Statement
Not applicable.
Data Availability Statement
The data presented in this study are available on request from the corresponding author.
Conflicts of Interest
The authors declare that they have no known competing financial interests or personal relationships that could have appeared to influence the work reported in this paper.
Nomenclature
| Symbols | Greek symbols | ||
| C | cooling demand correction factor [-] | efficiency | |
| E | energy need [kWh y−1] | Subscripts | |
| EER | energy efficiency ratio [-] | c | (referred to) space cooling |
| EP | energy performance indicator [kWhp m−2y−1] | el | electricity |
| EQ | equipment demand correction factor [-] | eq | equipment |
| H | heating demand correction factor [-] | h | space heating |
| L | lighting demand correction factor [-] | l | lighting |
| PEC | primary energy consumption [kWhp y−1] | p | primary energy |
| PEFel | electric primary energy factor [kWhp kWhel−1] | ||
| PEFgas | natural gas primary energy factor [kWhp kWht−1] | ||
| Acronyms | |||
| EC | energy community | ||
| GIS | geographical information software | ||
| PV | photovoltaic | ||
| QGIS | quantum geographical information software | ||
| UED | urban energy district | ||
| UEM | urban energy map | ||
References
- The Global Goals. Available online: https://www.globalgoals.org (accessed on 10 June 2024).
- Commission Launches EU Missions to Tackle Major Challenges. Available online: https://ec.europa.eu/commission/presscorner/detail/en/IP_21_4747 (accessed on 10 June 2024).
- Ten European Cities Awarded with EU Mission Label for Their Plans to Reach Climate-Neutrality by 2030. Available online: https://ec.europa.eu/commission/presscorner/detail/en/IP_23_4879 (accessed on 10 June 2024).
- European Green Capital Award—Previous Winning Cities. Available online: https://environment.ec.europa.eu/topics/urban-environment/european-green-capital-award/winning-cities_en (accessed on 10 June 2024).
- Awards 2019. Available online: https://www.civitas.eu (accessed on 10 June 2024).
- About the City of Stockholm—Climate and Environment. Available online: https://start.stockholm/en/about-the-city-of-stockholm/how-the-city-is-governed/climate-and-environment/#:~:text=As%20one%20of%20Europe’s%20most,to%20water%20and%20green%20areas (accessed on 10 June 2024).
- Esmaeilian, B.; Wang, B.; Lewis, K.; Duarte, F.; Ratti, C.; Behdad, S. The future of waste management in smart and sustainable cities: A review and concept paper. Waste Manag. 2018, 81, 177–195. [Google Scholar] [CrossRef] [PubMed]
- Ismagiloiva, E.; Hughes, L.; Rana, N.; Dwivedi, Y. Role of smart cities in creating sustainable cities and communities: A systematic literature review. In ICT Unbounded, Social Impact of Bright ICT Adoption: IFIP WG 8.6 International Conference on Transfer and Diffusion of IT, TDIT 2019, Accra, Ghana, June 21–22, 2019; Springer International Publishing: Cham, Switzerland, 2019; pp. 311–324. [Google Scholar]
- Alvarez-Risco, A.; Rosen, M.; Del-Aguila-Arcentales, S.; Marinova, D. Building Sustainable Cities; Springer: New York, NY, USA, 2020. [Google Scholar]
- Bai, X.; Surveyer, A.; Elmqvist, T.; Gatzweiler, F.W.; Güneralp, B.; Parnell, S.; Webb, R. Defining and advancing a systems approach for sustainable cities. Curr. Opin. Environ. Sustain. 2016, 23, 69–78. [Google Scholar] [CrossRef]
- MacDonald, A.; Clarke, A.; Ordonez-Ponce, E.; Chai, Z.; Andreasen, J. Sustainability managers: The job roles and competencies of building sustainable cities and communities. Public Perform. Manag. Rev. 2020, 43, 1413–1444. [Google Scholar] [CrossRef]
- Macke, J.; Sarate, J.A.R.; de Atayde Moschen, S. Smart sustainable cities evaluation and sense of community. J. Clean. Prod. 2019, 239, 118103. [Google Scholar] [CrossRef]
- Chel, A.; Kaushik, G. Renewable energy technologies for sustainable development of energy efficient building. Alex. Eng. J. 2018, 57, 655–669. [Google Scholar] [CrossRef]
- Khalil, M.; Dincer, I. Development and assessment of integrated hydrogen and renewable energy systems for a sustainable city. Sustain. Cities Soc. 2023, 98, 104794. [Google Scholar] [CrossRef]
- Mancini, F.; Nastasi, B. Energy retrofitting effects on the energy flexibility of dwellings. Energies 2019, 12, 2788. [Google Scholar] [CrossRef]
- Zuberi, M.J.S.; Chambers, J.; Patel, M.K. Techno-economic comparison of technology options for deep decarbonization and electrification of residential heating. Energy Effic. 2021, 14, 75. [Google Scholar] [CrossRef]
- Borge-Diez, D.; Icaza, D.; Trujillo-Cueva, D.F.; Açıkkalp, E. Renewable energy driven heat pumps decarbonization potential in existing residential buildings: Roadmap and case study of Spain. Energy 2022, 247, 123481. [Google Scholar] [CrossRef]
- Aruta, G.; Ascione, F.; Bianco, N.; Mauro, G.M. Sustainability and energy communities: Assessing the potential of building energy retrofit and renewables to lead the local energy transition. Energy 2023, 282, 128377. [Google Scholar] [CrossRef]
- Aruta, G.; Ascione, F.; Bianco, N.; Iovane, T.; Mastellone, M.; Mauro, G.M. Optimizing the energy transition of social housing to renewable nearly zero-energy community: The goal of sustainability. Energy Build. 2023, 282, 112798. [Google Scholar] [CrossRef]
- Ahad, M.A.; Paiva, S.; Tripathi, G.; Feroz, N. Enabling technologies and sustainable smart cities. Sustain. Cities Soc. 2020, 61, 102301. [Google Scholar] [CrossRef]
- Silva, B.N.; Khan, M.; Han, K. Towards sustainable smart cities: A review of trends, architectures, components, and open challenges in smart cities. Sustain. Cities Soc. 2018, 38, 697–713. [Google Scholar] [CrossRef]
- Raillani, B.; Mezrhab, A.; Amraqui, S.; Moussaoui, M.A.; Mezrhab, A. Regression-based spatial GIS analysis for an accurate assessment of renewable energy potential. Energy Sustain. Dev. 2022, 69, 118–133. [Google Scholar] [CrossRef]
- Bosco, R.; Giacobbe, S.; Losco, S.; Mozingo, L.A.; Valente, R. Environmental Design on Site-Specific Energy Solidary Communities around Public High Schools in the Metropolitan Area of Naples (Italy). Energies 2024, 17, 2247. [Google Scholar] [CrossRef]
- Koster, G.; van Sark, W.; Ricker, B. Solar potential for social benefit: Maps to sustainably address energy poverty utilizing open spatial data in data poor settings. Energy Sustain. Dev. 2024, 80, 101453. [Google Scholar] [CrossRef]
- Mentis, D.; Welsch, M.; Nerini, F.F.; Broad, O.; Howells, M.; Bazilian, M.; Rogner, H. A GIS-based approach for electrification planning—A case study on Nigeria. Energy Sustain. Dev. 2015, 29, 142–150. [Google Scholar] [CrossRef]
- Corigliano, S.; Carnovali, T.; Edeme, D.; Merlo, M. Holistic geospatial data-based procedure for electric network design and least-cost energy strategy. Energy Sustain. Dev. 2020, 58, 1–15. [Google Scholar] [CrossRef]
- Zhong, Y.; Li, Y. Statistical Evaluation of Sustainable Urban Planning: Integrating Renewable Energy Sources, Energy-Efficient Buildings, and Climate Resilience Measures. Sustain. Cities Soc. 2024, 101, 105160. [Google Scholar] [CrossRef]
- Vanhuyse, F.; Piseddu, T.; Jokiaho, J. Climate neutral cities in Sweden: True commitment or hollow statements? Cities 2023, 137, 104267. [Google Scholar] [CrossRef]
- Anand, A.; Deb, C. The potential of remote sensing and GIS in urban building energy modelling. Energy Built Environ. 2024, 5, 957–969. [Google Scholar] [CrossRef]
- Wanguba, B.; Siriba, D.N.; Okumu, B.M. GIS-Based Multi-Criteria Decision Analysis Model for Utility Water Demand: The Case of Lodwar Municipality, Turkana County, Kenya. Heliyon 2024, 10, e102301. [Google Scholar] [CrossRef]
- Yu, H.; Wang, M.; Lin, X.; Guo, H.; Liu, H.; Zhao, Y.; Wang, H.; Li, C.; Jing, R. Prioritizing urban planning factors on community energy performance based on GIS-informed building energy modeling. Energy Build. 2021, 249, 111191. [Google Scholar] [CrossRef]
- Ali, U.; Shamsi, M.H.; Bohacek, M.; Purcell, K.; Hoare, C.; Mangina, E.; O’Donnell, J. A data-driven approach for multi-scale GIS-based building energy modeling for analysis, planning, and support decision making. Appl. Energy 2020, 279, 115834. [Google Scholar] [CrossRef]
- HosseiniHaghighi, S.; de Uribarri, P.M.Á.; Padsala, R.; Eicker, U. Characterizing and structuring urban GIS data for housing stock energy modelling and retrofitting. Energy Build. 2022, 256, 111706. [Google Scholar] [CrossRef]
- Perwez, U.; Yamaguchi, Y.; Ma, T.; Dai, Y.; Shimoda, Y. Multi-scale GIS-synthetic hybrid approach for the development of commercial building stock energy model. Appl. Energy 2022, 323, 119536. [Google Scholar] [CrossRef]
- Cuesta-Fernández, I.; Vargas-Salgado, C.; Alfonso-Solar, D.; Gómez-Navarro, T. The contribution of metropolitan areas to decarbonize the residential stock in Mediterranean cities: A GIS-based assessment of rooftop PV potential in Valencia, Spain. Sustain. Cities Soc. 2023, 97, 104727. [Google Scholar] [CrossRef]
- Hassan, Q.; Algburi, S.; Al-Musawi, T.J.; Viktor, P.; Jaszczur, M.; Barakat, M.; Sameen, A.Z.; Hussein, A.H. GIS-based multi-criteria analysis for solar, wind, and biomass energy potential: A case study of Iraq with implications for climate goals. Results Eng. 2024, 22, 102212. [Google Scholar] [CrossRef]
- Wang, M.; Yu, H.; Liu, Y.; Lin, J.; Zhong, X.; Tang, Y.; Guo, H.; Jing, R. Unlock city-scale energy saving and peak load shaving potential of green roofs by GIS-informed urban building energy modelling. Appl. Energy 2024, 366, 123315. [Google Scholar] [CrossRef]
- Calderón, C.; James, P.; Urquizo, J.; McLoughlin, A. A GIS domestic building framework to estimate energy end-use demand in UK sub-city areas. Energy Build. 2015, 96, 236–250. [Google Scholar] [CrossRef]
- Lai, Z.; He, J.; Li, Y. Potential zones identification for district cooling system: A GIS-based multi-criteria assessment method incorporating cooling demand mapping. Sustain. Cities Soc. 2024, 105, 105327. [Google Scholar] [CrossRef]
- Ascione, F.; Bianco, N.; De Masi, R.F.; Mastellone, M.; Mauro, G.M.; Vanoli, G.P. The role of the occupant behavior in affecting the feasibility of energy refurbishment of residential buildings: Typical effective retrofits compromised by typical wrong habits. Energy Build. 2020, 223, 110217. [Google Scholar] [CrossRef]
- D.M. (Interministerial Decree) 26 Giugno 2015. Available online: https://www.mimit.gov.it/index.php/it/normativa/decreti-interministeriali/decreto-interministeriale-26-giugno-2015-applicazione-delle-metodologie-di-calcolo-delle-prestazioni-energetiche-e-definizione-delle-prescrizioni-e-dei-requisiti-minimi-degli-edifici (accessed on 10 June 2024).
- Fistola, R. GIS: Teoria ed Applicazione per la Pianificazione, la Gestione e la Protezione Della Città; GIS: Napoli, Italy, 2011; pp. 1–210. [Google Scholar]
- DesignBuilder, v7.0.2.006; DesignBuilder Software Ltd.: Gloucestershire, UK, 2013. Available online: https://designbuilder.co.uk/ (accessed on 15 May 2024).
- EnergyPlus Simulation Software, v9.4; U.S. Department of Energy: Washington, DC, USA, 2012. Available online: https://energyplus.net/ (accessed on 15 May 2024).


Disclaimer/Publisher’s Note: The statements, opinions and data contained in all publications are solely those of the individual author(s) and contributor(s) and not of MDPI and/or the editor(s). MDPI and/or the editor(s) disclaim responsibility for any injury to people or property resulting from any ideas, methods, instructions or products referred to in the content. |
© 2024 by the authors. Licensee MDPI, Basel, Switzerland. This article is an open access article distributed under the terms and conditions of the Creative Commons Attribution (CC BY) license (https://creativecommons.org/licenses/by/4.0/).