
Hydrochemical Characteristics, Controlling Factors and Groundwater Sources of Zaozigou Gold Mine

Abstract
:1. Introduction
2. Materials and Methods
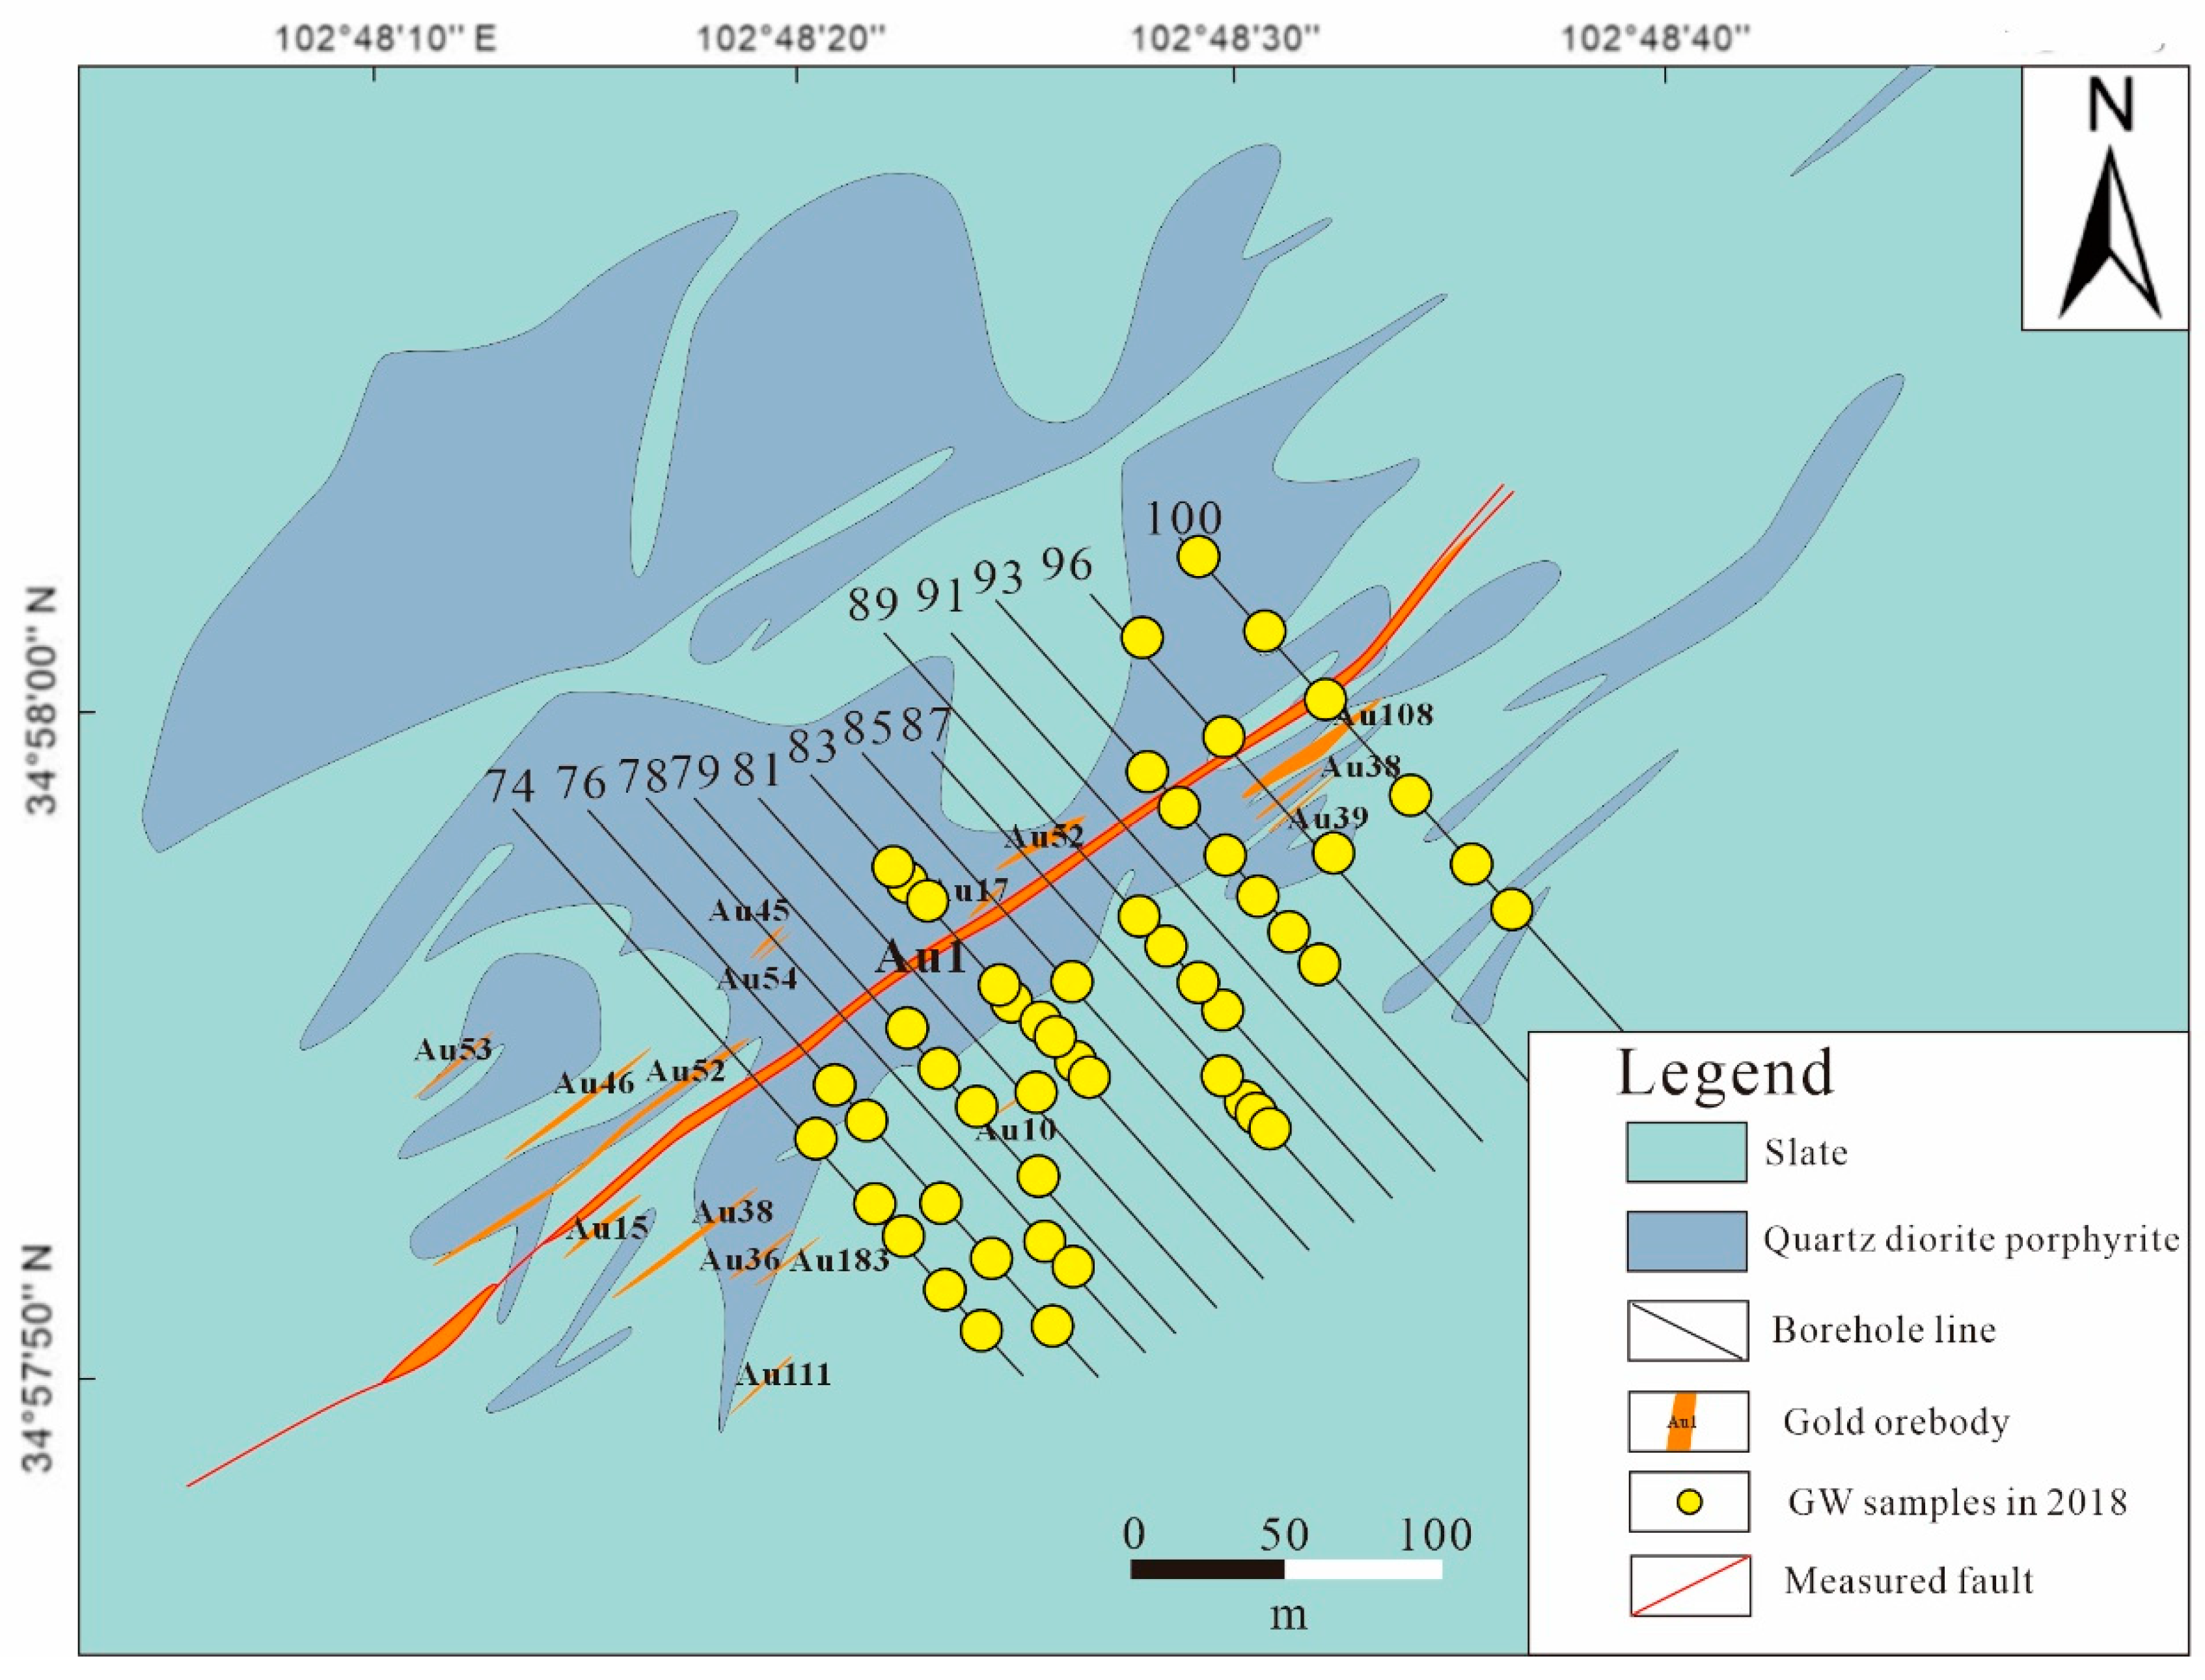
2.1. Study Area
2.2. Sample Collection and Analysis
2.3. Thoughts and Methods
3. Results and Discussion
3.1. Hydrochemical Characteristics
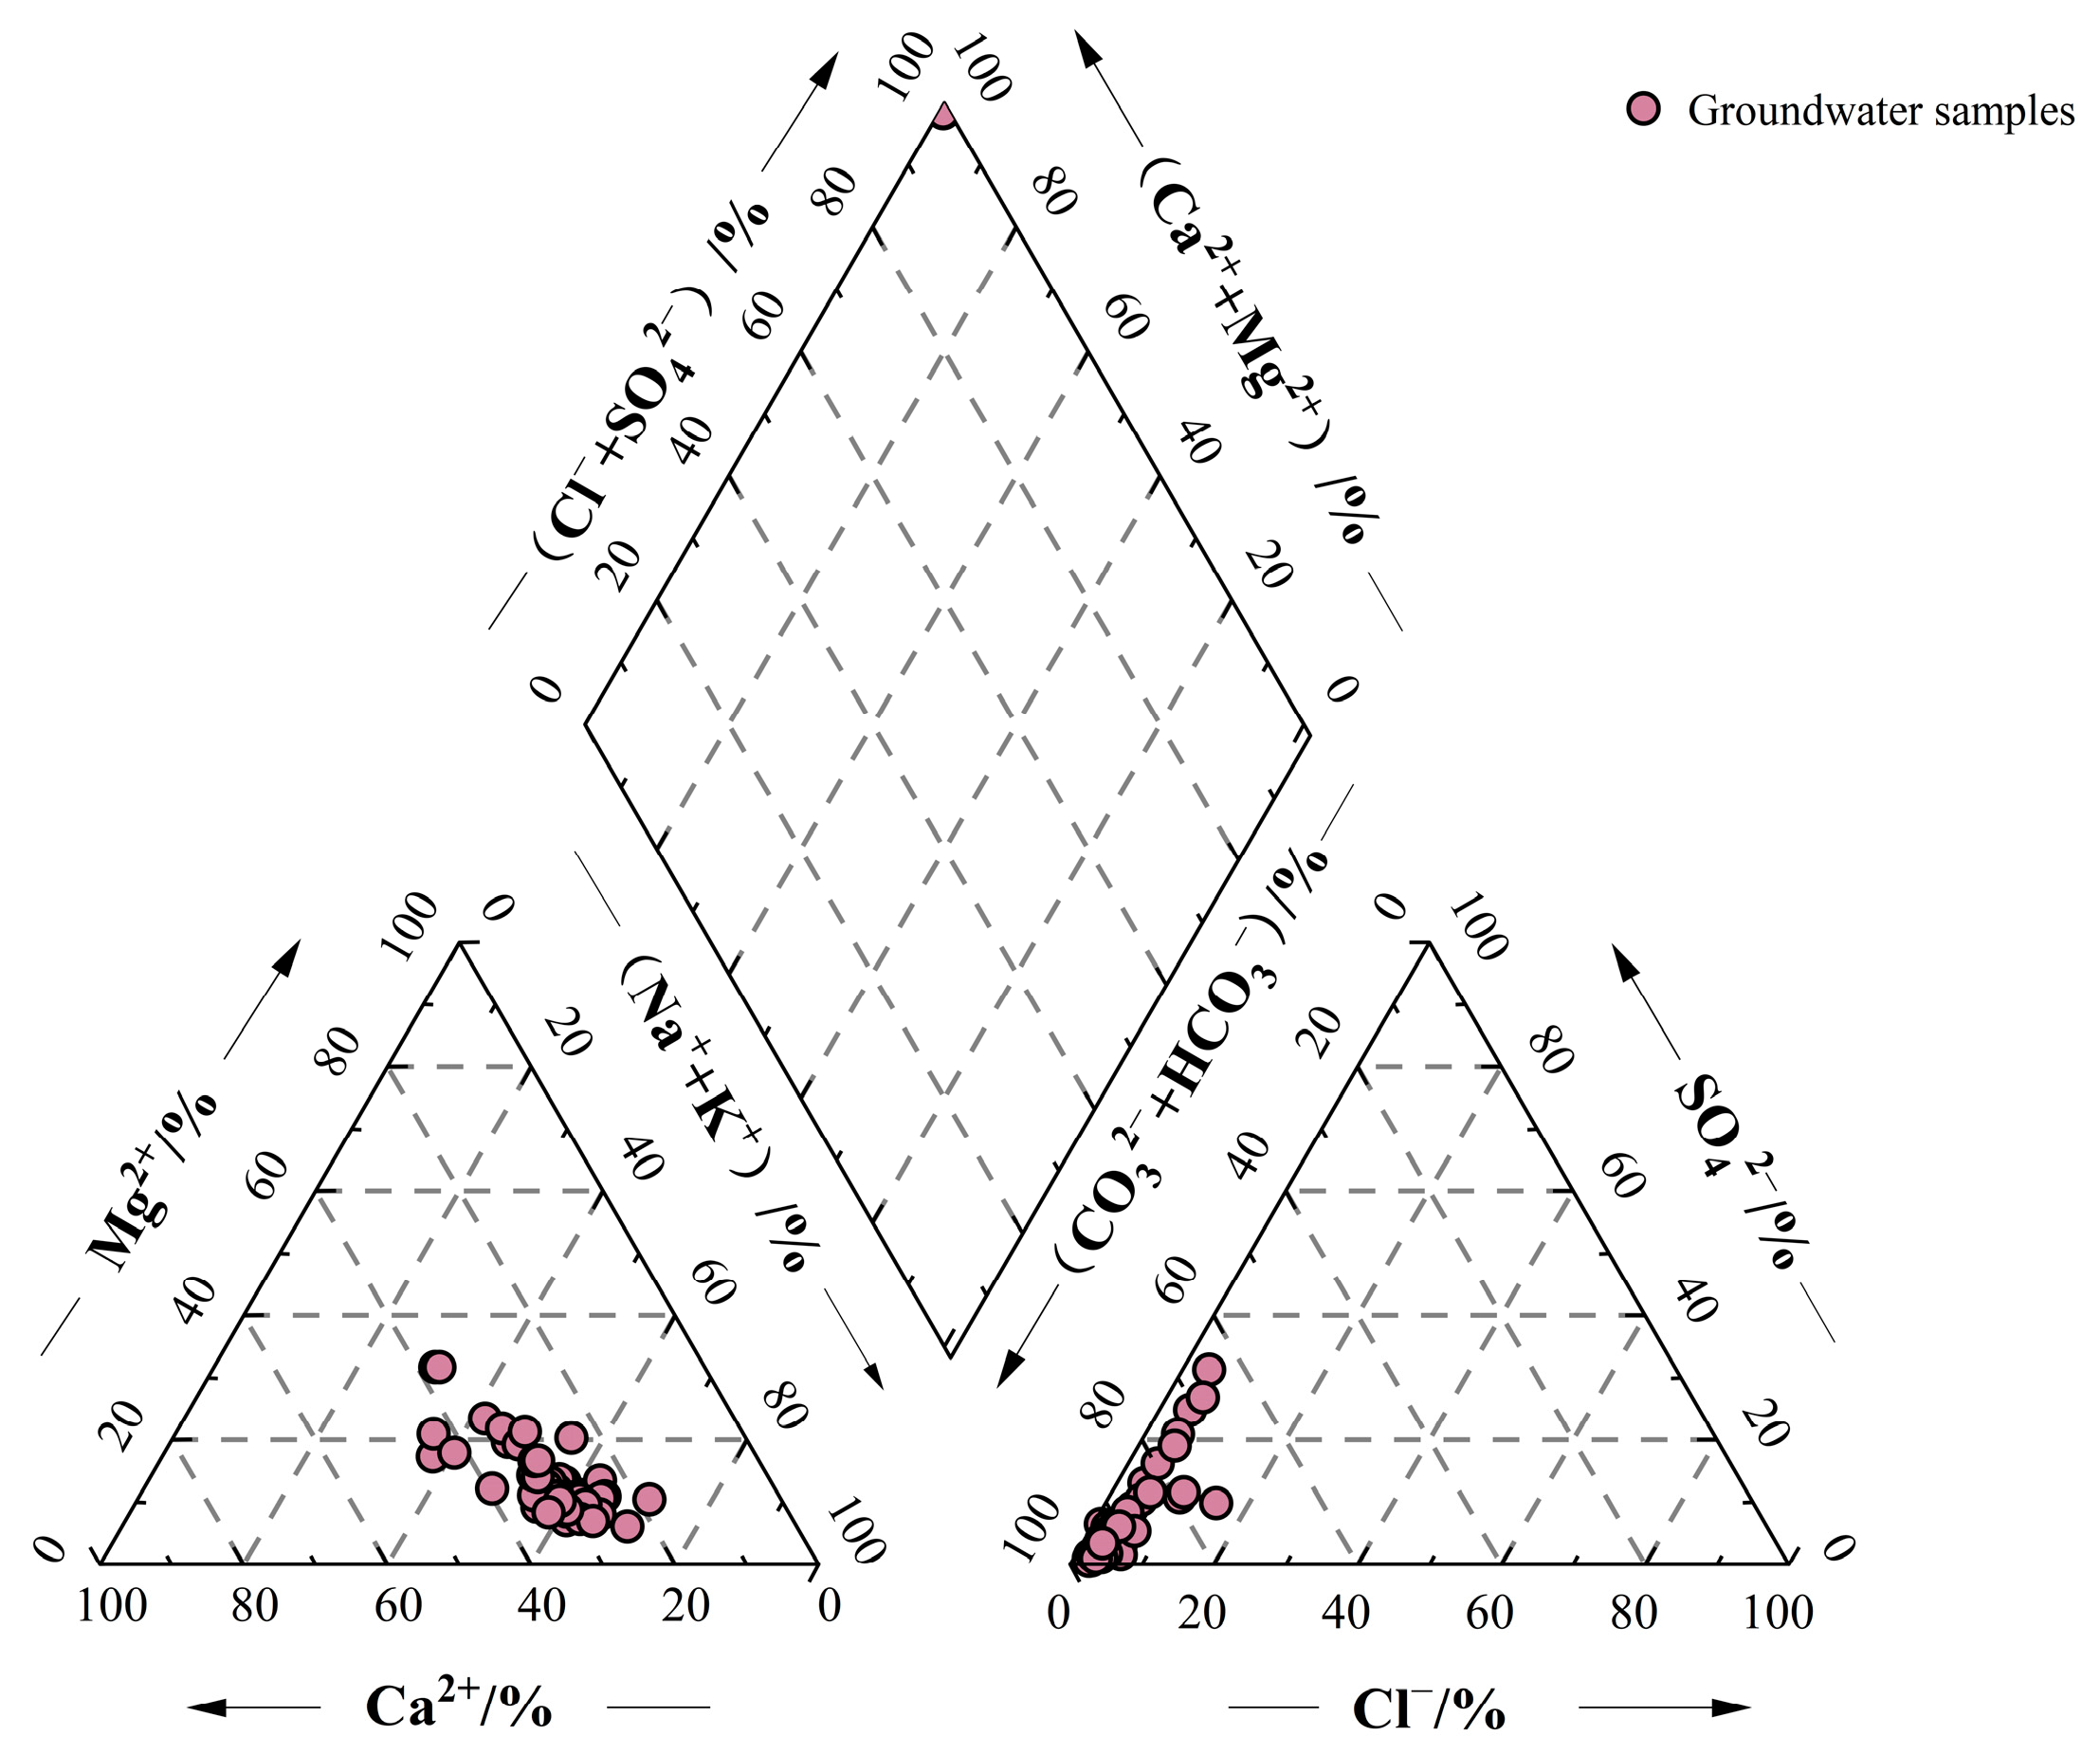
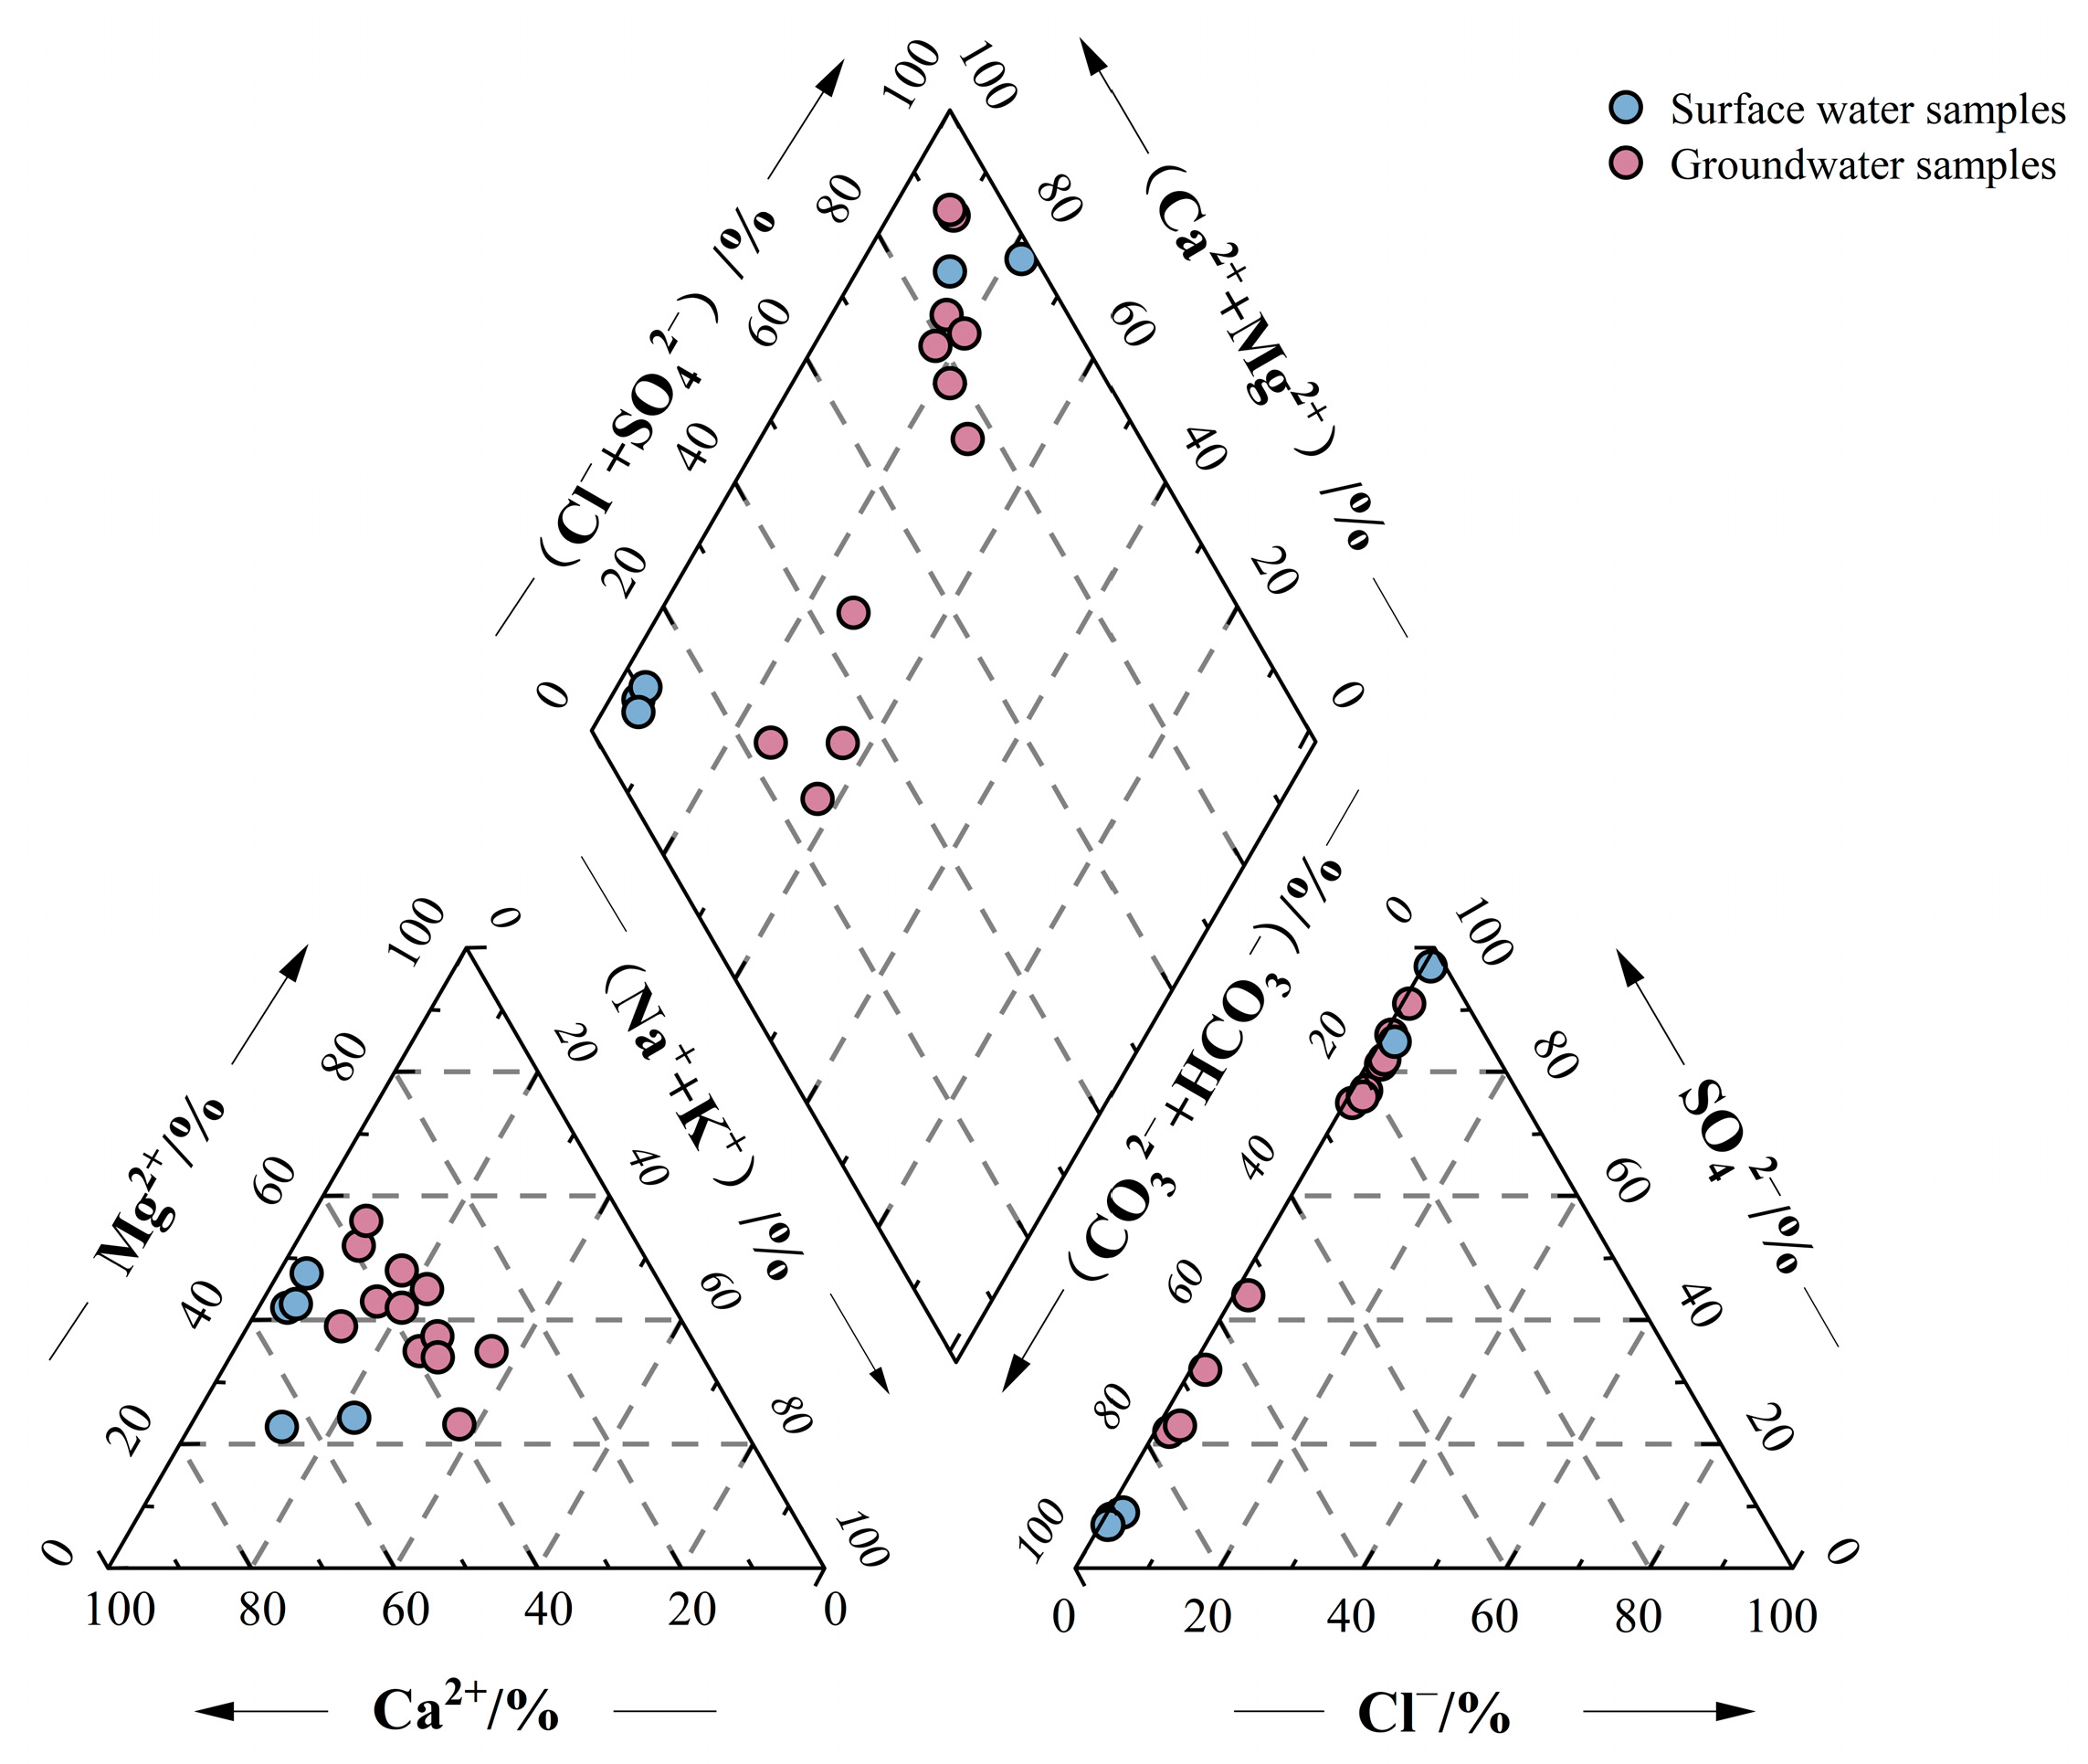
3.1.1. Hydrochemical Composition
3.1.2. Hydrochemical Correlation
3.1.3. Hydrochemical Type
3.2. Control Factors of Groundwater Hydrochemistry
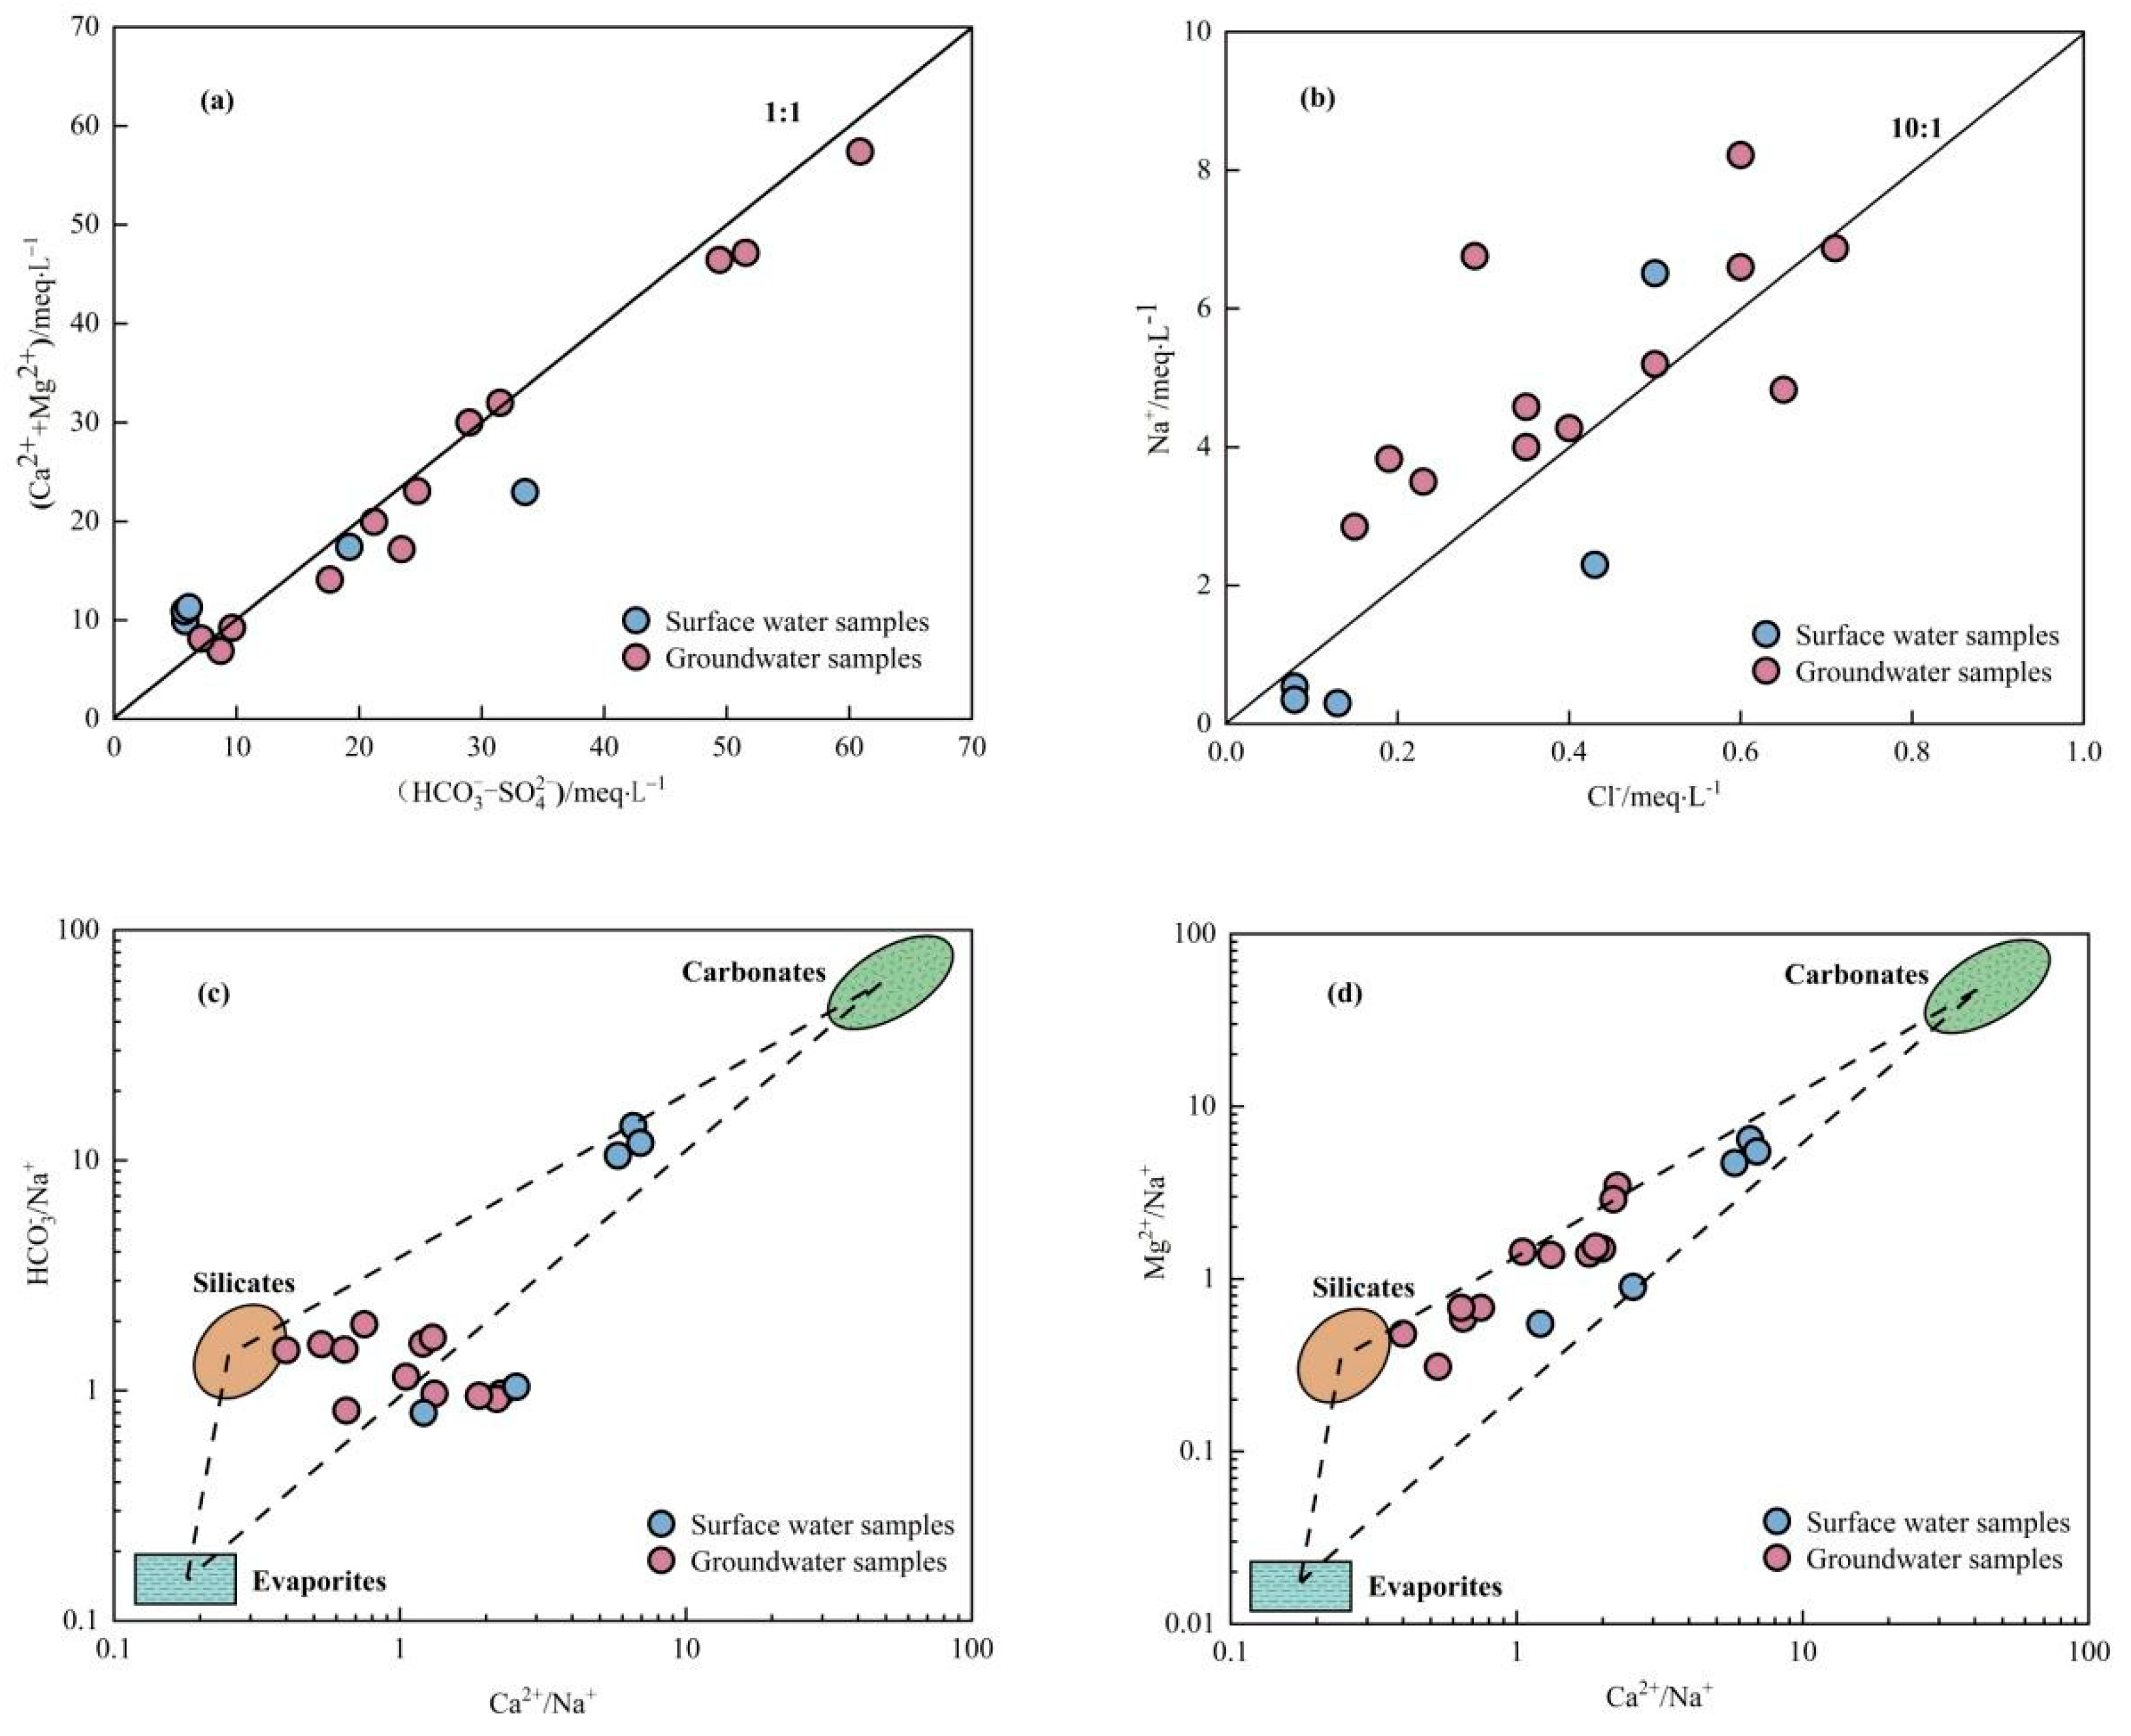
3.2.1. Dissolution of Rock Weathering
3.2.2. Source of Major Ions
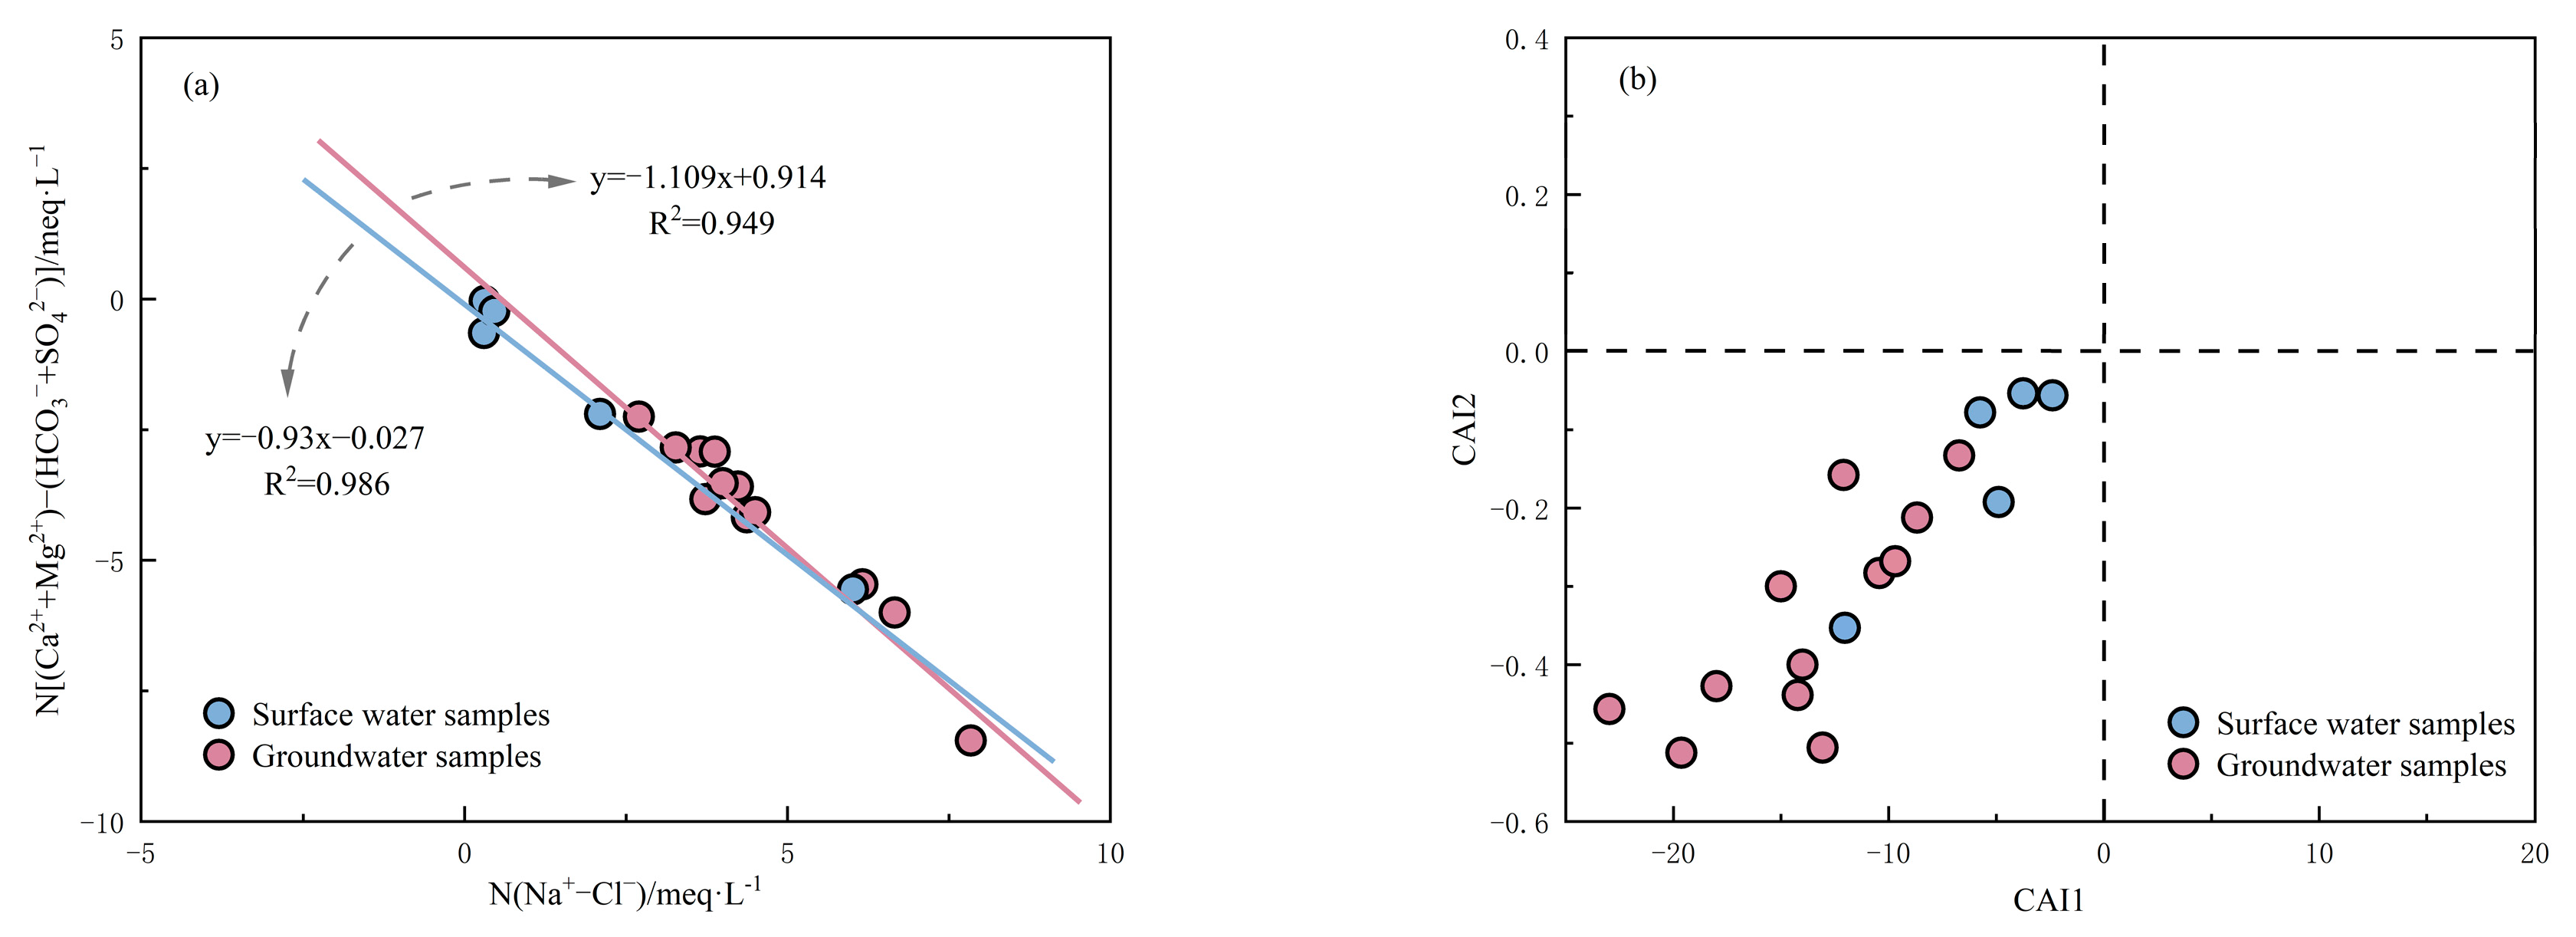
3.2.3. Cation Exchange
3.2.4. Influence of Human Activities
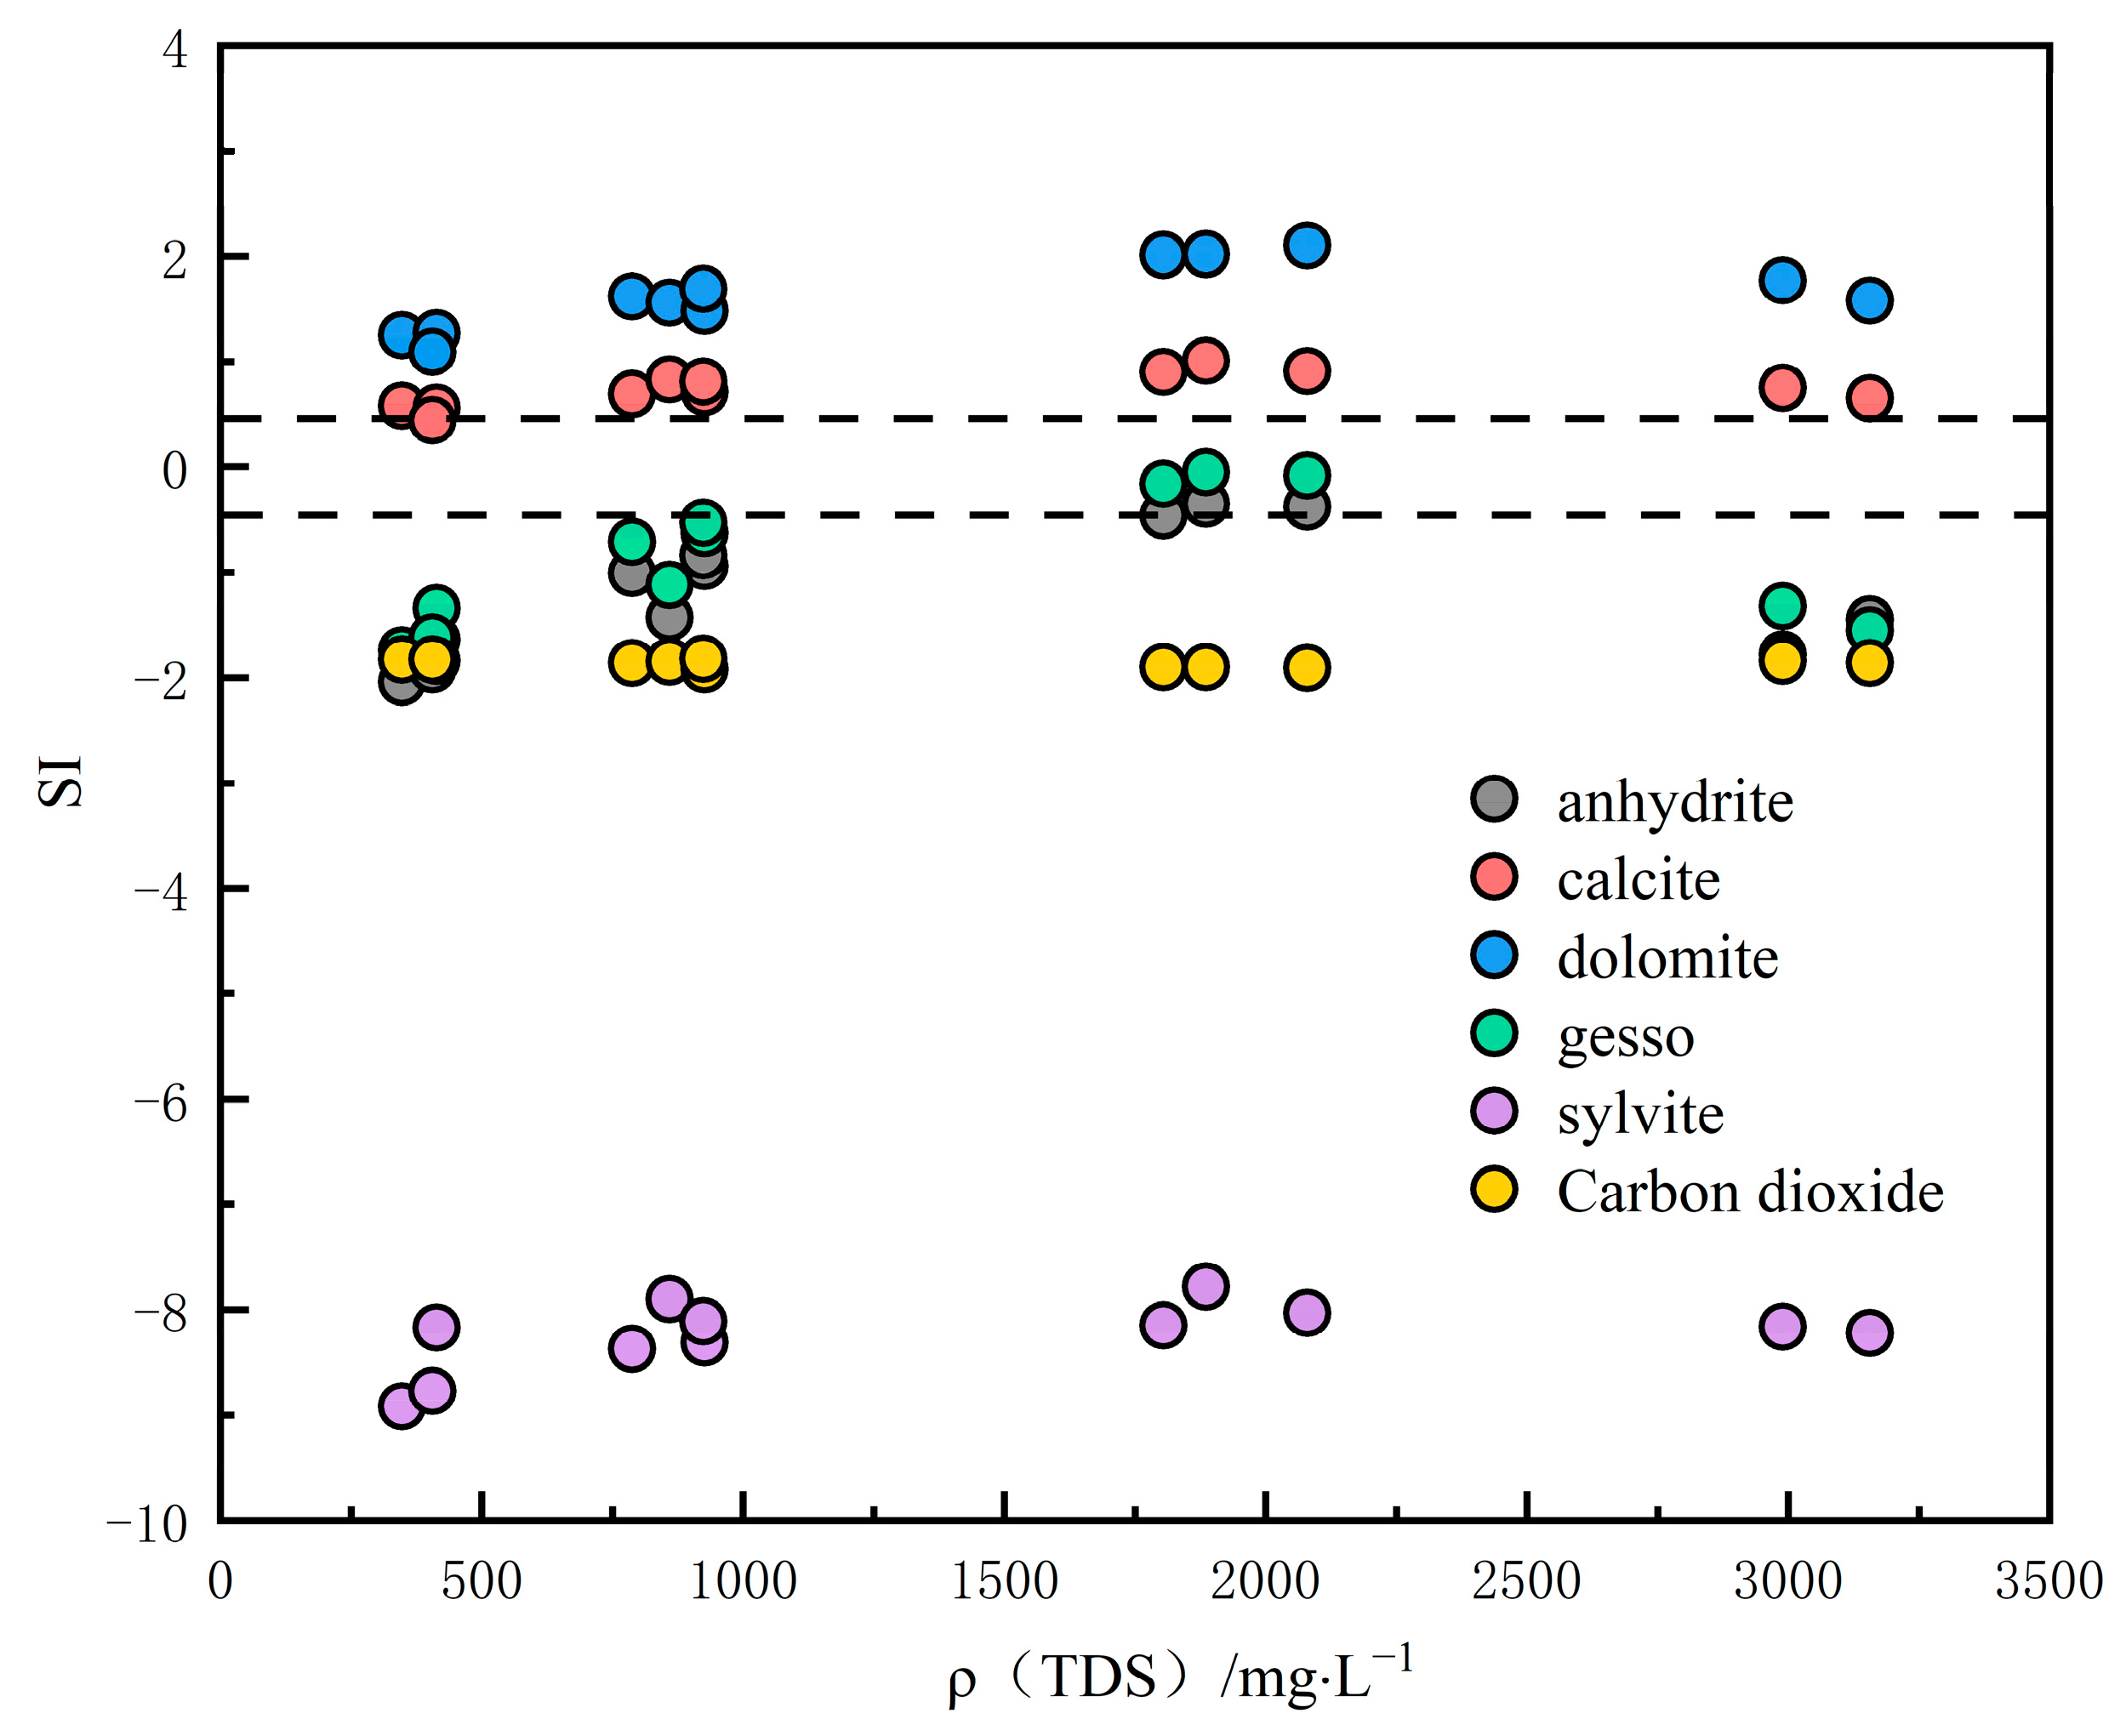
3.2.5. Hydrogeochemical Modeling
3.2.6. Control Factor of Hydrochemistry
3.3. Groundwater Recharge Source
Hydrogen and Oxygen Isotope Characteristics
4. Conclusions
Author Contributions
Funding
Institutional Review Board Statement
Informed Consent Statement
Data Availability Statement
Conflicts of Interest
References
- Li, X.; Tian, T.; Shang, X.; Zhang, R.; Xie, H.; Wang, X.; Wang, H.; Xie, Q.; Chen, J.; Kadokami, K. Occurrence and Health Risks of Organic Micro-Pollutants and Metals in Groundwater of Chinese Rural Areas. Environ. Health Perspect. 2020, 128, 107010. [Google Scholar] [CrossRef] [PubMed]
- Zhou, J.; Xiang, J.; Wang, L.; Zhong, G.; Zhu, G.; Liu, C.; Huang, M.; Feng, W.; Li, Q.; Xue, D.; et al. The impacts of groundwater chemistry on wetland vegetation distribution in the northern qinghai–tibet plateau. Sustainability 2019, 11, 5022. [Google Scholar] [CrossRef]
- Zhao, Y.; Song, J.; Cheng, K.; Liu, Z.; Yang, F. Migration and remediation of typical contaminants in soil and groundwater: A state of art review. Degrad. Dev. 2024, 35, 2700–2715. [Google Scholar] [CrossRef]
- Li, M.; Xiao, C.; Liang, X.; Cao, Y.; Hu, S. Hydrogeochemical evolution under a changing environment: A case study in Jilin, China. Water Supply 2020, 20, 1653–1663. [Google Scholar] [CrossRef]
- Dong, H.; Gao, Z. Theoretical progress of groundwater chemical evolution based on Tóthian theory: A review. Front. Mar. Sci. 2022, 9, 972426. [Google Scholar] [CrossRef]
- Wu, Y.; Wang, L.; Yang, J.; Jiang, X.; Niu, Y. Characteristics of hydrochemical and stable isotopes in the Upper and Middle Reaches of the Yarlung Tsangpo River. J. Environ. Chem. Eng. 2023, 11, 110716. [Google Scholar] [CrossRef]
- Bai, X.; Tian, X.; Li, J.; Wang, X.; Li, Y.; Zhou, Y. Assessment of the Hydrochemical Characteristics and Formation Mechanisms of Groundwater in A Typical Alluvial-Proluvial Plain in China: An Example from Western Yongqing County. Water 2022, 14, 2395. [Google Scholar] [CrossRef]
- Ma, Q.; Ge, W.; Tian, F. Geochemical characteristics and controlling factors of chemical composition of groundwater in a part of the Nanchang section of Ganfu Plain. Sustainability 2022, 14, 7976. [Google Scholar] [CrossRef]
- Mia, Y.; Haque, E.; Islam, A.R.M.T.; Jannat, J.N.; Jion, M.M.M.F.; Islam, S.; Siddique, A.B.; Idris, A.M.; Senapathi, V.; Talukdar, S.; et al. Analysis of self-organizing maps and explainable artificial intelligence to identify hydrochemical factors that drive drinking water quality in Haor region. Sci. Total Environ. 2023, 904, 166927. [Google Scholar] [CrossRef]
- Zainab, S.M.; Junaid, M.; Xu, N.; Malik, R.N. Antibiotics and antibiotic resistant genes (ARGs) in groundwater: A global review on dissemination, sources, interactions, environmental and human health risks. Water Res. 2020, 187, 116455. [Google Scholar] [CrossRef]
- Ye, X.; Zhou, Y.; Lu, Y.; Du, X. Hydrochemical evolution and quality assessment of groundwater in the Sanjiang Plain, China. Water 2020, 14, 1265. [Google Scholar] [CrossRef]
- Yan, J.; Chen, J.; Zhang, W. Impact of land use and cover on shallow groundwater quality in Songyuan city, China: A multivariate statistical analysis. Environ. Pollut. 2022, 307, 119532. [Google Scholar] [CrossRef] [PubMed]
- Sánchez-Murillo, R.; Birkel, C. Groundwater recharge mechanisms inferred from isoscapes in a complex tropical mountainous region. Geophys. Res. Lett. 2016, 43, 5060–5069. [Google Scholar] [CrossRef]
- Qi, H.; Ma, C.; He, Z.; Hu, X.; Gao, L. Lithium and its isotopes as tracers of groundwater salinization: A study in the southern coastal plain of Laizhou Bay, China. Sci. Total Environ. 2019, 650, 878–890. [Google Scholar] [CrossRef]
- Li, J.; Pang, Z.; Kong, Y.; Wang, S.; Bai, G.; Zhao, H.; Zhou, D.; Sun, F.; Yang, Z. Groundwater isotopes biased toward heavy rainfall events and implications on the local meteoric water line. J. Geophys. Res. Atmos. 2018, 123, 6259–6266. [Google Scholar] [CrossRef]
- Zhang, J.; Zhang, J.; Deng, Y.; Wu, C.; Li, H.; Qing, Z.; Li, J.; Zhang, W. Quantitative evaluation of ecological and environmental impacts caused by future mining. Ore Geol. Rev. 2023, 162, 105672. [Google Scholar] [CrossRef]
- Liu, Y. Exotica as prestige technology: The production of luxury gold in Western Han society. Antiquity 2017, 91, 1588–1602. [Google Scholar] [CrossRef]
- Chen, L.; Liu, J.; Zhang, W.; Li, Q.; Hu, Y.; Wang, L.; Hu, G.; Wang, J. Increased ecological and health risks associated with potentially toxic trace elements in agricultural soil adversely affected by gold (Au) mining activities. J. Soils Sediments 2022, 22, 509–521. [Google Scholar] [CrossRef]
- Sui, J.; Li, J.; Jin, X.; Vasconcelos, P.; Zhu, R. 40 Ar/39 Ar and U-Pb constraints on the age of the Zaozigou disseminated gold deposit, Xiahe-Hezuo district, West Qinling orogen, China: Implications for the early Triassic reduced intrusion-related gold metallogeny. Ore Geol. Rev. 2018, 885–899. [Google Scholar] [CrossRef]
- Yu, H.-C.; Guo, C.-A.; Qiu, K.-F.; McIntire, D.; Jiang, G.-P.; Gou, Z.-Y.; Geng, J.-Z.; Pang, Y.; Zhu, R.; Li, N.-B. Geochronological and Geochemical Constraints on the Formation of the Giant Zaozigou Au-Sb Deposit, West Qinling. Minerals 2019, 9, 37. [Google Scholar] [CrossRef]
- Tang, Q.Y.; Di, P.F.; Yu, M.; Bao, J.; Zhao, Y.; Liu, D.; Wang, Y.X. Mineralogy and Geochemistry of Pyrite and Arsenopyrite from the Zaozigou Gold Deposit in West Qinling Orogenic Belt, Central China: Implications for Ore Genesis. Resour. Geol. 2019, 69, 314–332. [Google Scholar] [CrossRef]
- GB/T11615-2010; Geologic Exploration Standard of Geothermal Resources. Chinese Standard Press: Beijing, China, 2011.
- Vinnarasi, F.; Srinivasamoorthy, K.; Saravanan, K.; Kanna, A.R.; Gopinath, S.; Prakash, R.; Ponnumani, G.; Babu, C. Hydrogeochemical characteristics and risk evaluation of potential toxic elements in groundwater from Shanmughanadhi, Tamilnadu, India. Environ. Res. 2022, 204, 112199. [Google Scholar] [CrossRef] [PubMed]
- Mthembu, P.P.; Elumalai, V.; Brindha, K.; Li, P. Hydrogeochemical processes and trace metal contamination in groundwater: Impact on human health in the Maputaland coastal aquifer, South Africa. Expo. Health 2020, 12, 403–426. [Google Scholar] [CrossRef]
- Zhang, Y.; Dai, Y.; Wang, Y.; Huang, X.; Xiao, Y.; Pei, Q. Hydrochemistry, quality and potential health risk appraisal of nitrate enriched groundwater in the Nanchong area, southwestern China. Sci. Total Environ. 2021, 784, 147186. [Google Scholar] [CrossRef]
- Hussain, M.; Ahmed, S.M.; Abderrahman, W. Cluster analysis and quality assessment of logged water at an irrigation project, eastern Saudi Arabia. J. Environ. Manag. 2008, 86, 297–307. [Google Scholar] [CrossRef]
- Xiao, J.; Zhang, F.; Jin, Z. Spatial characteristics and controlling factors of chemical weathering of loess in the dry season in the middle Loess Plateau, China. Hydrol. Process. 2016, 30, 4855–4869. [Google Scholar] [CrossRef]
- Buccianti, A. The FOREGS repository: Modelling variability in stream water on a continental scale revising classical diagrams from CoDA (compositional data analysis) perspective. J. Geochem. Explor. 2015, 154, 94–104. [Google Scholar] [CrossRef]
- Liu, J.; Lou, K.; Gao, Z.; Tan, M. Hydrochemical insights on the signatures and genesis of water resources in a high-altitude city on the Qinghai-Xizang Plateau, South-west China. Front. Environ. Sci. Eng. 2024, 18, 88. [Google Scholar] [CrossRef]
- Edmunds, W.M.; Carrillo-Rivera, J.J.; Cardona, A. Geochemical evolution of groundwater beneath Mexico City. J. Hydrol. 2002, 258, 1–24. [Google Scholar] [CrossRef]
- Zhou, X.; He, S.; Yang, Y.; Wu, P.; Luo, W. Hydrochemical fingerprints of karst underground river systems impacted by urbanization in Guiyang, Southwest China. J. Contam. Hydrol. 2024, 264, 104356. [Google Scholar] [CrossRef]
- Hu, Y.X.; Zhou, R.J.; Song, W.; Yang, Q.H.; Wang, X.R. Analysis on Hydrochemical Evolution of Shallow Groundwater East of Yongding River in Fengtai District, Beijing. Huan Jing Ke Xue= Huanjing Kexue 2024, 45, 2651–2664. [Google Scholar] [CrossRef] [PubMed]
- Kypritidou, Z.; Kelepertzis, E.; Kritikos, I.; Kapaj, E.; Skoulika, I.; Kostakis, M.; Vassilakis, E.; Karavoltsos, S.; Boeckx, P.; Matiatos, I. Geochemistry and origin of inorganic contaminants in soil, river sediment and surface water in a heavily urbanized river basin. Sci. Total Environ. 2024, 927, 172250. [Google Scholar] [CrossRef] [PubMed]
- Athauda, S.; Wang, Y.; Hao, Z.; Indika, S.; Yapabandara, I.; Weragoda, S.K.; Liu, J.; Wei, Y. Geochemical Assessment of the Evolution of Groundwater under the Impact of Seawater Intrusion in the Mannar District of Sri Lanka. Water 2024, 16, 1137. [Google Scholar] [CrossRef]
- Habib, A.; Reza, A.S.; Hasan, I.; Ahsan, A.; Moniruzzaman; Hasan, A.B.; Shofi, S.I.; Hridoy, K.M. Evaluating arsenic contamination in northwestern Bangladesh: A GIS-Based assessment of groundwater vulnerability and human health impacts. Heliyon 2024, 10, e27917. [Google Scholar] [CrossRef]
- Wei, H.; Song, B.; Huan, Q.; Song, C.; Wang, S.; Song, M. Preparation of iron tailings-based porous ceramsite and its application to lead adsorption: Characteristic and mechanism. Sep. Purif. Technol. 2024, 342, 126839. [Google Scholar] [CrossRef]
- Kayhomayoon, Z. The impact of ophiolitic mélanges on the groundwater geochemistry of Naeen aquifer (central Iran). Ofioliti 2024, 49. [Google Scholar]
- Alqarawy, A.M.; Rajmohan, N.; Masoud, M.H.; Niyazi, B.A. Hydrochemical appraisal and sources of contamination in high nitrate aquifer, Saudi Arabia. Arab. J. Chem. 2023, 16, 105041. [Google Scholar] [CrossRef]
- Wu, Y.; Liu, H.; Zhang, H.; Li, Q. Sources and seasonal variations of nitrate in the coastal multiple-aquifer groundwater of Beihai, southern China. J. Contam. Hydrol. 2024, 262, 104308. [Google Scholar] [CrossRef]
- Kumar, S.; Venkatesh, A.S.; Singh, R.; Udayabhanu, G.; Saha, D. Geochemical signatures and isotopic systematics constraining dynamics of fluoride contamination in groundwater across Jamui district, Indo-Gangetic alluvial plains, India. Chemosphere 2018, 205, 493–505. [Google Scholar] [CrossRef]
- Rafenoarisoa, O.E.M.; Sracek, O.; Rahobisoa, J.J.; Čejková, B.; Jačková, I.; Brouyère, S. The origin of high salinity and hydrogeochemical characteristics of groundwater in semi-arid area of the Linta Basin, Southwestern Madagascar. J. Afr. Earth Sci. 2024, 213, 105215. [Google Scholar] [CrossRef]
- Briganti, A.; Voltaggio, M.; Carusi, C.; Rainaldi, E. Radon deficit technique applied to the study of the ageing of a spilled LNAPL in a shallow aquifer. J. Contam. Hydrol. 2024, 263, 104342. [Google Scholar] [CrossRef]
- Helena, B.; Pardo, R.; Vega, M.; Barrado, E.; Fernandez, J.M.; Fernandez, L. Temporal evolution of groundwater composition in an alluvial aquifer (Pisuerga River, Spain) by principal component analysis. Water Res. 2000, 34, 807–816. [Google Scholar] [CrossRef]
- Cloutier, V.; Lefebvre, R.; Therrien, R.; Savard, M.M. Multivariate statistical analysis of geochemical data as indicative of the hydrogeochemical evolution of groundwater in a sedimentary rock aquifer system. J. Hydrol. 2008, 353, 294–313. [Google Scholar] [CrossRef]
- Xiao, J.; Wang, L.; Deng, L.; Jin, Z. Characteristics, sources, water quality and health risk assessment of trace elements in river water and well water in the Chinese Loess Plateau. Sci. Total Environ. 2019, 650, 2004–2012. [Google Scholar] [CrossRef]
- Evaristo, J.; Jasechko, S.; McDonnell, J.J. Global separation of plant transpiration from groundwater and streamflow. Nature 2015, 525, 91–94. [Google Scholar] [CrossRef] [PubMed]
- Adams, S.; Titus, R.; Pietersen, K.; Tredoux, G.; Harris, C. Hydrochemical characteristics of aquifers near Sutherland in the Western Karoo, South Africa. J. Hydrol. 2001, 241, 91–103. [Google Scholar] [CrossRef]
- Williams, D.G.; Ehleringer, J.R. Intra-and interspecific variation for summer precipitation use in pinyon–juniper woodlands. Ecol. Monogr. 2000, 70, 517–537. [Google Scholar] [CrossRef]
- Earman, S.; Campbell, A.R.; Phillips, F.M.; Newman, B.D. Isotopic exchange between snow and atmospheric water vapor: Estimation of the snowmelt component of groundwater recharge in the southwestern United States. J. Geophys. Res. Atmos. 2006, 111, D9. [Google Scholar] [CrossRef]
- Dotsika, E.; Lykoudis, S.; Poutoukis, D. Spatial distribution of the isotopic composition of precipitation and spring water in Greece. Glob. Planet. Chang. 2010, 71, 141–149. [Google Scholar] [CrossRef]
- Affolter, S.; Häuselmann, A.D.; Fleitmann, D.; Häuselmann, P.; Leuenberger, M. Triple isotope (δD, δ17O, δ18O) study on precipitation, drip water and speleothem fluid inclusions for a Western Central European cave (NW Switzerland). Quat. Sci. Rev. 2015, 127, 73–89. [Google Scholar] [CrossRef]
- Wen, X.; Wu, Y.; Su, J.; Zhang, Y.; Liu, F.J.E.G. Hydrochemical characteristics and salinity of groundwater in the Ejina Basin, Northwestern China. Environ. Geol. 2005, 48, 665–675. [Google Scholar] [CrossRef]
- Chae, G.T.; Yun, S.T.; Kim, K.; Mayer, B. Hydrogeochemistry of sodium-bicarbonate type bedrock groundwater in the Pocheon spa area, South Korea: Water–rock interaction and hydrologic mixing. J. Hydrol. 2006, 321, 326–343. [Google Scholar] [CrossRef]


| Time | Sample Type | Altitude/m | Sample Number | Sampling Position |
|---|---|---|---|---|
| 2018 | GW | 2660 | 40 | Exploration boreholes of exploration line 74–100 |
| 2023 | GW | 2660 | 1 | 12 middle section |
| 2610 | 3 | 13 middle section | ||
| 2560 | 5 | 14 middle section | ||
| 2510 | 1 | 15 middle section | ||
| SW | 3100 | 5 | By the Zaozi River |
| Sample Type | Item | pH | TDS | K+ | Na+ | Ca2+ | Mg2+ | Cl− | |||
|---|---|---|---|---|---|---|---|---|---|---|---|
| groundwater | Mean | 8.04 | 1043.8 | 7.46 | 111.6 | 118.8 | 80 | 13.74 | 514 | 367.5 | 1.93 |
| Max | 8.35 | 2080 | 11.8 | 189 | 260 | 212 | 25.1 | 1344 | 820 | 4.61 | |
| Min | 7.42 | 348 | 3.04 | 63.8 | 31.5 | 23.6 | 5.17 | 38.5 | 254 | 0.67 | |
| SD | 0.24 | 647.9 | 3.15 | 40.48 | 82.41 | 65.7 | 6.85 | 485.8 | 165.6 | 1.19 | |
| CV | 3 | 62 | 42 | 36 | 69 | 82 | 50 | 95 | 45 | 62 | |
| Surface water | Mean | 8.19 | 606.2 | 5.2 | 44.72 | 92.12 | 32.3 | 8.5 | 245.2 | 237.2 | 5.35 |
| Max | 8.31 | 1198 | 9.11 | 144 | 158 | 43.8 | 16.9 | 794 | 346 | 9.86 | |
| Min | 7.94 | 276 | 1.36 | 6.89 | 49.9 | 27.6 | 2.72 | 10.9 | 33 | 3.5 | |
| SD | 0.16 | 390.9 | 3.65 | 58.72 | 48.26 | 6.54 | 7 | 349.5 | 136.4 | 3.04 | |
| CV | 2 | 64 | 70 | 131 | 52 | 20 | 82 | 143 | 58 | 57 |
| Time | Sample Type | Altitude/m | Sample Number | Hydrochemical Type |
|---|---|---|---|---|
| 2018 | GW | 2660 | 49 | HCO3-Na·Ca |
| 1 | HCO3-Na·Ca·Mg | |||
| 2023 | GW | 2660 | 3 | SO4-Ca·Mg |
| 2610 | 3 | SO4-Ca·Mg | ||
| 2560 | 5 | SO4-Ca·Mg SO4-Na·Ca·Mg HCO3·SO4-Na·Ca·Mg HCO3-Na·Ca·Mg | ||
| 2510 | 1 | HCO3-Na·Ca | ||
| SW | 3100 | 5 | HCO3-Ca·Mg SO4-Ca |
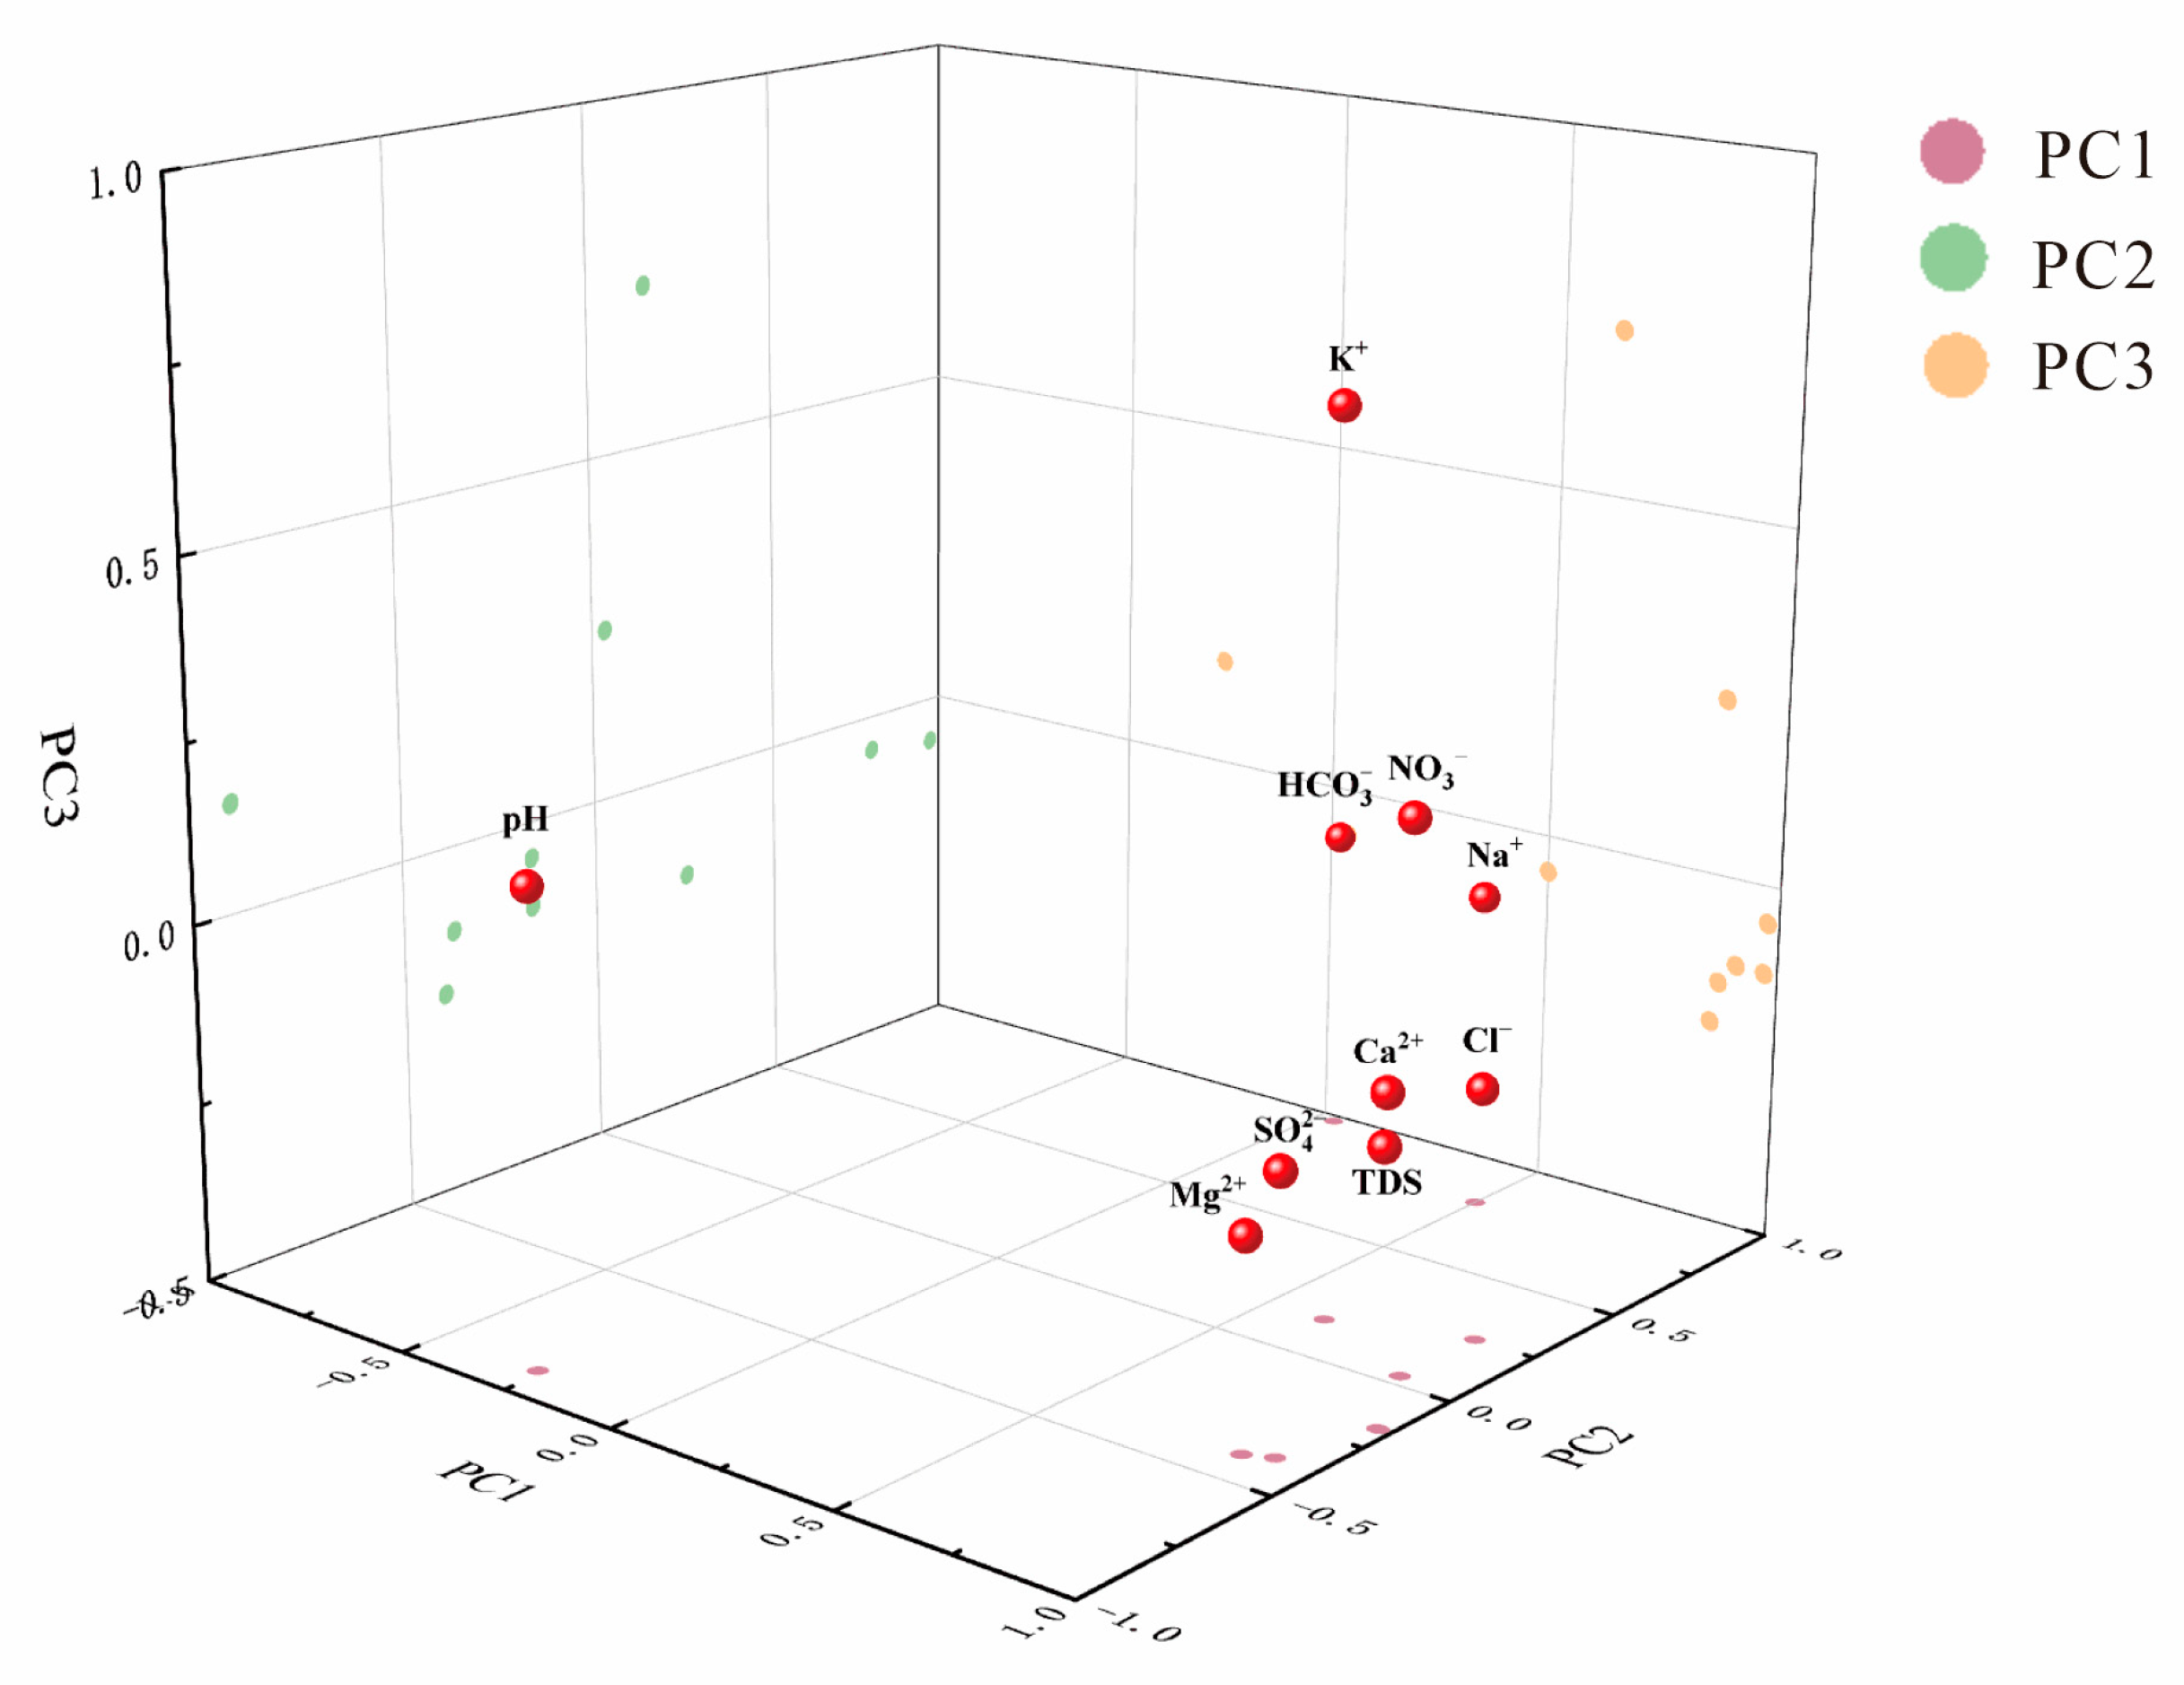
| Variable | Principal Components | ||
|---|---|---|---|
| PC1 | PC2 | PC3 | |
| Ca2+ | 0.976 | −0.171 | −0.053 |
| Mg2+ | 0.863 | −0.4 | −0.211 |
| Na+ | 0.5 | 0.793 | −0.052 |
| K+ | 0.623 | 0.153 | 0.73 |
| Cl− | 0.877 | 0.25 | −0.153 |
| 0.913 | −0.375 | −0.123 | |
| 0.04 | 0.973 | −0.066 | |
| 0.871 | 0.035 | 0.238 | |
| Eigenvalues | 5.715 | 2.841 | 0.727 |
| Variance(%) | 57.1 | 28.4 | 7.3 |
| Cumulative(%) | 57.1 | 85.5 | 92.8 |
Disclaimer/Publisher’s Note: The statements, opinions and data contained in all publications are solely those of the individual author(s) and contributor(s) and not of MDPI and/or the editor(s). MDPI and/or the editor(s) disclaim responsibility for any injury to people or property resulting from any ideas, methods, instructions or products referred to in the content. |
© 2024 by the authors. Licensee MDPI, Basel, Switzerland. This article is an open access article distributed under the terms and conditions of the Creative Commons Attribution (CC BY) license (https://creativecommons.org/licenses/by/4.0/).
Share and Cite
Jiang, W.; Li, B.; Zhang, Z.; Zhang, Y. Hydrochemical Characteristics, Controlling Factors and Groundwater Sources of Zaozigou Gold Mine. Sustainability 2024, 16, 7989. https://doi.org/10.3390/su16187989
Jiang W, Li B, Zhang Z, Zhang Y. Hydrochemical Characteristics, Controlling Factors and Groundwater Sources of Zaozigou Gold Mine. Sustainability. 2024; 16(18):7989. https://doi.org/10.3390/su16187989
Chicago/Turabian StyleJiang, Wenqiang, Baozhu Li, Zhen Zhang, and Ying Zhang. 2024. "Hydrochemical Characteristics, Controlling Factors and Groundwater Sources of Zaozigou Gold Mine" Sustainability 16, no. 18: 7989. https://doi.org/10.3390/su16187989