Article

Identifying Critical Links in Degradable Road Networks Using a Traffic Demand-Based Indicator

1
College of Traffic and Transportation, Chongqing Jiaotong University, Chongqing 400074, China
2
Shenzhen General Integrated Transportation and Municipal Engineering Design & Research Institute Co., Ltd., Shenzhen 518033, China
3
Chongqing Urban Investment Gold Card Information Industry (Group) Co., Ltd., Chongqing 401336, China
*
Author to whom correspondence should be addressed.
Sustainability 2024, 16(18), 8020; https://doi.org/10.3390/su16188020
Submission received: 13 August 2024 / Revised: 5 September 2024 / Accepted: 11 September 2024 / Published: 13 September 2024

Abstract

:
The primary traffic-based indicators for identifying critical links account for travel time, transportation efficiency, and traffic demand. These indicators are seldom applied to scenarios in which link capacity degradation occurs across the entire network. In addition, the commonly used traffic demand-based indicator, known as unsatisfied demand, can only work when there are disconnected origin–destination (OD) pairs in the network. In this context, this study incorporates the concept of a degradable road network to represent such scenarios and introduces a new network-wide traffic demand-based indicator, defined as late arrival demand (LAD), to identify critical links. Specifically, we built a late arrival rate (LAR)-based user equilibrium (UE) model to capture travel behavior and estimate the LAD in degradable road networks. Then, LAD and four other indicators were introduced to identify critical links in the framework of the LAR-based UE model. Finally, the Nguyen–Dupuis and Sioux Falls networks were employed for numerical experiments. The results, under various levels of traffic demand and degradation, demonstrate that LAD is a flexible and effective network-wide traffic demand-based indicator. This new approach provides insights that can help managers assess link criticality in degradable road networks from the perspective of traffic demand.

1. Introduction

The road network plays a crucial role in the functioning of a city, as it forms the fundamental framework that supports various aspects of urban life and development. However, the operation of road networks is vulnerable to various unexpected disasters and incidents such as bad weather, natural disasters, and traffic incidents. These vulnerabilities can lead to significant delays, increased traffic costs, and safety hazards. To reduce these negative impacts, researchers perform vulnerability analyses of the road network to help traffic managers implement measures and design strategies for ensuring efficient and safe mobility within the city [1,2].
One key issue of road network vulnerability analysis is the identification of critical links, the disruption of which will result in severe consequences for the whole network [3,4]. The adoption of appropriate indicators is the basis of identifying critical links. According to Almotahari [5,6], indicators can be divided into two main groups: topological-based indicators and traffic-based indicators. Topological-based indicators mainly consider network structure and connectivity, which include indicators such as network efficiency and betweenness centrality [7,8]. However, they ignore travelers’ behavior and traffic dynamics, which may result in inaccurate assessments of link criticality. Traffic-based indicators address these issues, which are analyzed in the framework of traffic assignment models to capture and predict travelers’ behavior when network topology changes. Commonly used traffic-based indicators include transportation network efficiency [7], network robust index [9], and link importance index [10], which account for the efficiency, travel time, and traffic demand of the network. Compared with topological-based indicators, traffic-based indicators are commonly considered to be more realistic and adaptable to road traffic networks. Thus, we focus on traffic-based indicators in this paper.
To identify critical links in the road network using traffic-based indicators, a common approach is to successively remove single links or multi-links and evaluate the impact of link failures on the road network. However, link removals may lead to the disconnection of certain OD pairs in the road network [11,12]. When such disconnections occur, the traffic assignment model fails to function properly, as there are no feasible paths between disconnected OD pairs to accommodate the traffic demand. Such a problem is known as the disconnectivity issue. To address the disconnectivity issue, the widely used method involves modifying the network structure by adding a virtual path (also a virtual link) to each OD pair in the road network. Since the virtual path is not removed during the process of identifying critical links, it ensures the existence of at least one path between OD pairs, allowing the traffic assignment model to always function. However, this approach will lead to inaccurate estimations of the indicators based on travel time. Thus, researchers always use the transportation network efficiency index (EI) and unsatisfied demand (UD) to overcome the disconnectivity issue [7,10]. EI measures the ratio of path flow and path cost in network-wide systems, while UD only measures unsatisfied traffic demand between disconnected OD pairs, which ignores the impact of link failures on connected OD pairs. Thus, UD is not a network-wide indicator, unlike EI and other indicators, which results in estimation bias. Despite its limitations, UD remains widely used in transportation network vulnerability studies [11,12]. Specifically, UD is particularly well-suited for evaluating the vulnerabilities of metro networks with passenger flow data [13,14,15], as there are few alternative routes in metro systems, making link/node failures likely to cause disconnections for many OD pairs. To improve traffic demand-based indicators to better assess the impact of link failures on the traffic demand of the whole road network, including both connected and disconnected OD pairs, we are motivated to develop a comprehensive network-wide traffic demand-based indictor.
Another issue to be concerned about is that most previous research assumes that the disrupted links would completely lose all their capacity [16,17]. This oversimplifies the problem, as not all disruptions are fatal. In reality, most disruptions only result in a partial reduction of link capacity. The disruption rate introduced by Jin et al. is used to represent the degree of degradation of link capacity [12]. It indicates the remaining capacity rate of links and ranges from 0 to 1, with a lower value indicating more serious disruption. By varying the disruption rate, multi-disruption scenarios can be constructed. The example results from Jin show that link criticality ranking varies by disruption rate, implying that managers should develop road protection measures based on the specific disruption rate. It is noted that, in their research and other similar studies, the capacity degradation is considered only for one, or at most three, links in disruptions, while other links are assumed to maintain full capacity [12,16,18,19]. This approach is well suited to small-scale local disruptions caused by events such as traffic incidents, lane damage, and road maintenance. When natural disasters or bad weather (such as heavy rain and snow) occur, all link capacity in the whole road network will be degraded to varying degrees, and for some vulnerable links, their capacity may be degraded to 0. In such cases, most previous research methods seem to be no longer applicable. The concept of a degradable road network, proposed by Lo et al., can be introduced to describe such cases [20]. In the degradable road network, each link’s capacity is a stochastic value, varying from 0 to its design capacity, due to the uncertain impact caused by bad weather, natural disasters, or other external factors. Because of link capacity degradation, travel time becomes uncertain to travelers. Travelers will spontaneously adjust their travel behavior to cope with this uncertainty. There is much research focusing on travelers’ path choice behavior in uncertain road networks, but as far as we know, only a few studies have been performed on the problem of link criticality identification [4,21]. Identifying critical links in a degradable road network poses two main challenges: one is to model travelers’ responses to link failures, and the other is to develop appropriate indicators to measure link criticality.
Reviewing the previous research, there are two main issues that motivate us to conduct this study, as shown in Figure 1: (1) the current traffic demand-based indicator of unsatisfied demand is not network-wide, (2) the previous research cannot well describe disruption scenarios in which all link capacity degrades. To sum up, this paper aims to develop a new network-wide traffic demand-based indicator in degradable road networks to identify critical links and perform analyses. The main contributions of this paper are as follows:
(1)
A new traffic demand-based indicator called late arrival demand is proposed, which can capture the impact of link disruptions on the traffic demand of both connected and disconnected OD pairs.
(2)
We propose a late arrival rate-based user equilibrium model and design the corresponding algorithm to estimate the late arrival demand in degradable road networks.
(3)
We execute numerical experiments based on two traffic benchmark networks, including the Nguyen–Dupuis network and the Sioux Falls network, to identify critical links by various indicators and perform correlation analyses.
The remainder of the paper is organized as follows. Section 2 introduces the indicator of late arrival demand, how to estimate it in the degradable road network, and how to utilize it and other related indicators to identify critical links. Section 3 presents the experimental results from two benchmark networks. Section 4 presents the conclusions and suggestions for future studies.

2. Problem Statements and Methodology

Inspired by the concept of unsatisfied demand, we develop a network-wide traffic demand-based indicator, defined as late arrival demand (LAD), to capture the impact of link failures on both disconnected and connected OD pairs in this section. To model travelers’ behavior and estimate the LAD in degradable road networks, we built a late arrival rate (LAR)-based user equilibrium (UE) model and designed the corresponding solving algorithm. Based on them, the detailed procedures to identify critical links by various indicators are introduced.

2.1. The Indicator of Late Arrival Demand

Following previous research, we incorporated the concept of travel time budget (TTB) to evaluate late arrival demand, which is defined as the time allowed for travel [22,23,24]. In actual, TTB can be observed by the difference between departure time and desired arrival time. For example, if travelers are requested to arrive by 9:00 am, and they depart from home at 7:30 am, we can infer their TTB is 90 min. According to the relationship between travelers’ TTB and the travel time of the travel path, travelers can be categorized into two groups. If travelers’ TTB is more than their path travel time, then they arrive on time; otherwise, they are late. Consequently, traffic demand can be divided into on-time arrival demand and late arrival demand (LAD), analogous to the concepts of satisfied demand and unsatisfied demand in previous research [9,10]. Herein, we introduce how to calculate the LAD in continuous cases for a simple network with one path p . The travel time budget of n travelers (recorded as T ) and the path travel time (recorded as T p ) are assumed to be two random variables. Then, the late arrival rate and demand can be approximately expressed as:
R = P r T T p < 0
D = n · R
where P r ( . ) is the probability function, and R and D are, respectively, the late arrival rate and demand.
Compared with unsatisfied demand, LAD can capture the impact of link disruptions on both disconnected and connected OD pairs. Figure 2 shows how LAD evaluates the impact of link disruptions. For disconnected OD pairs, the travel time is too large for any travelers to arrive on time, making the LAD equal to the unsatisfied demand, i.e., the total traffic demand of the disconnected OD pairs. On the other hand, link disruptions may result in increased travel time of connected OD pairs; thus, LAD increases in these OD pairs.
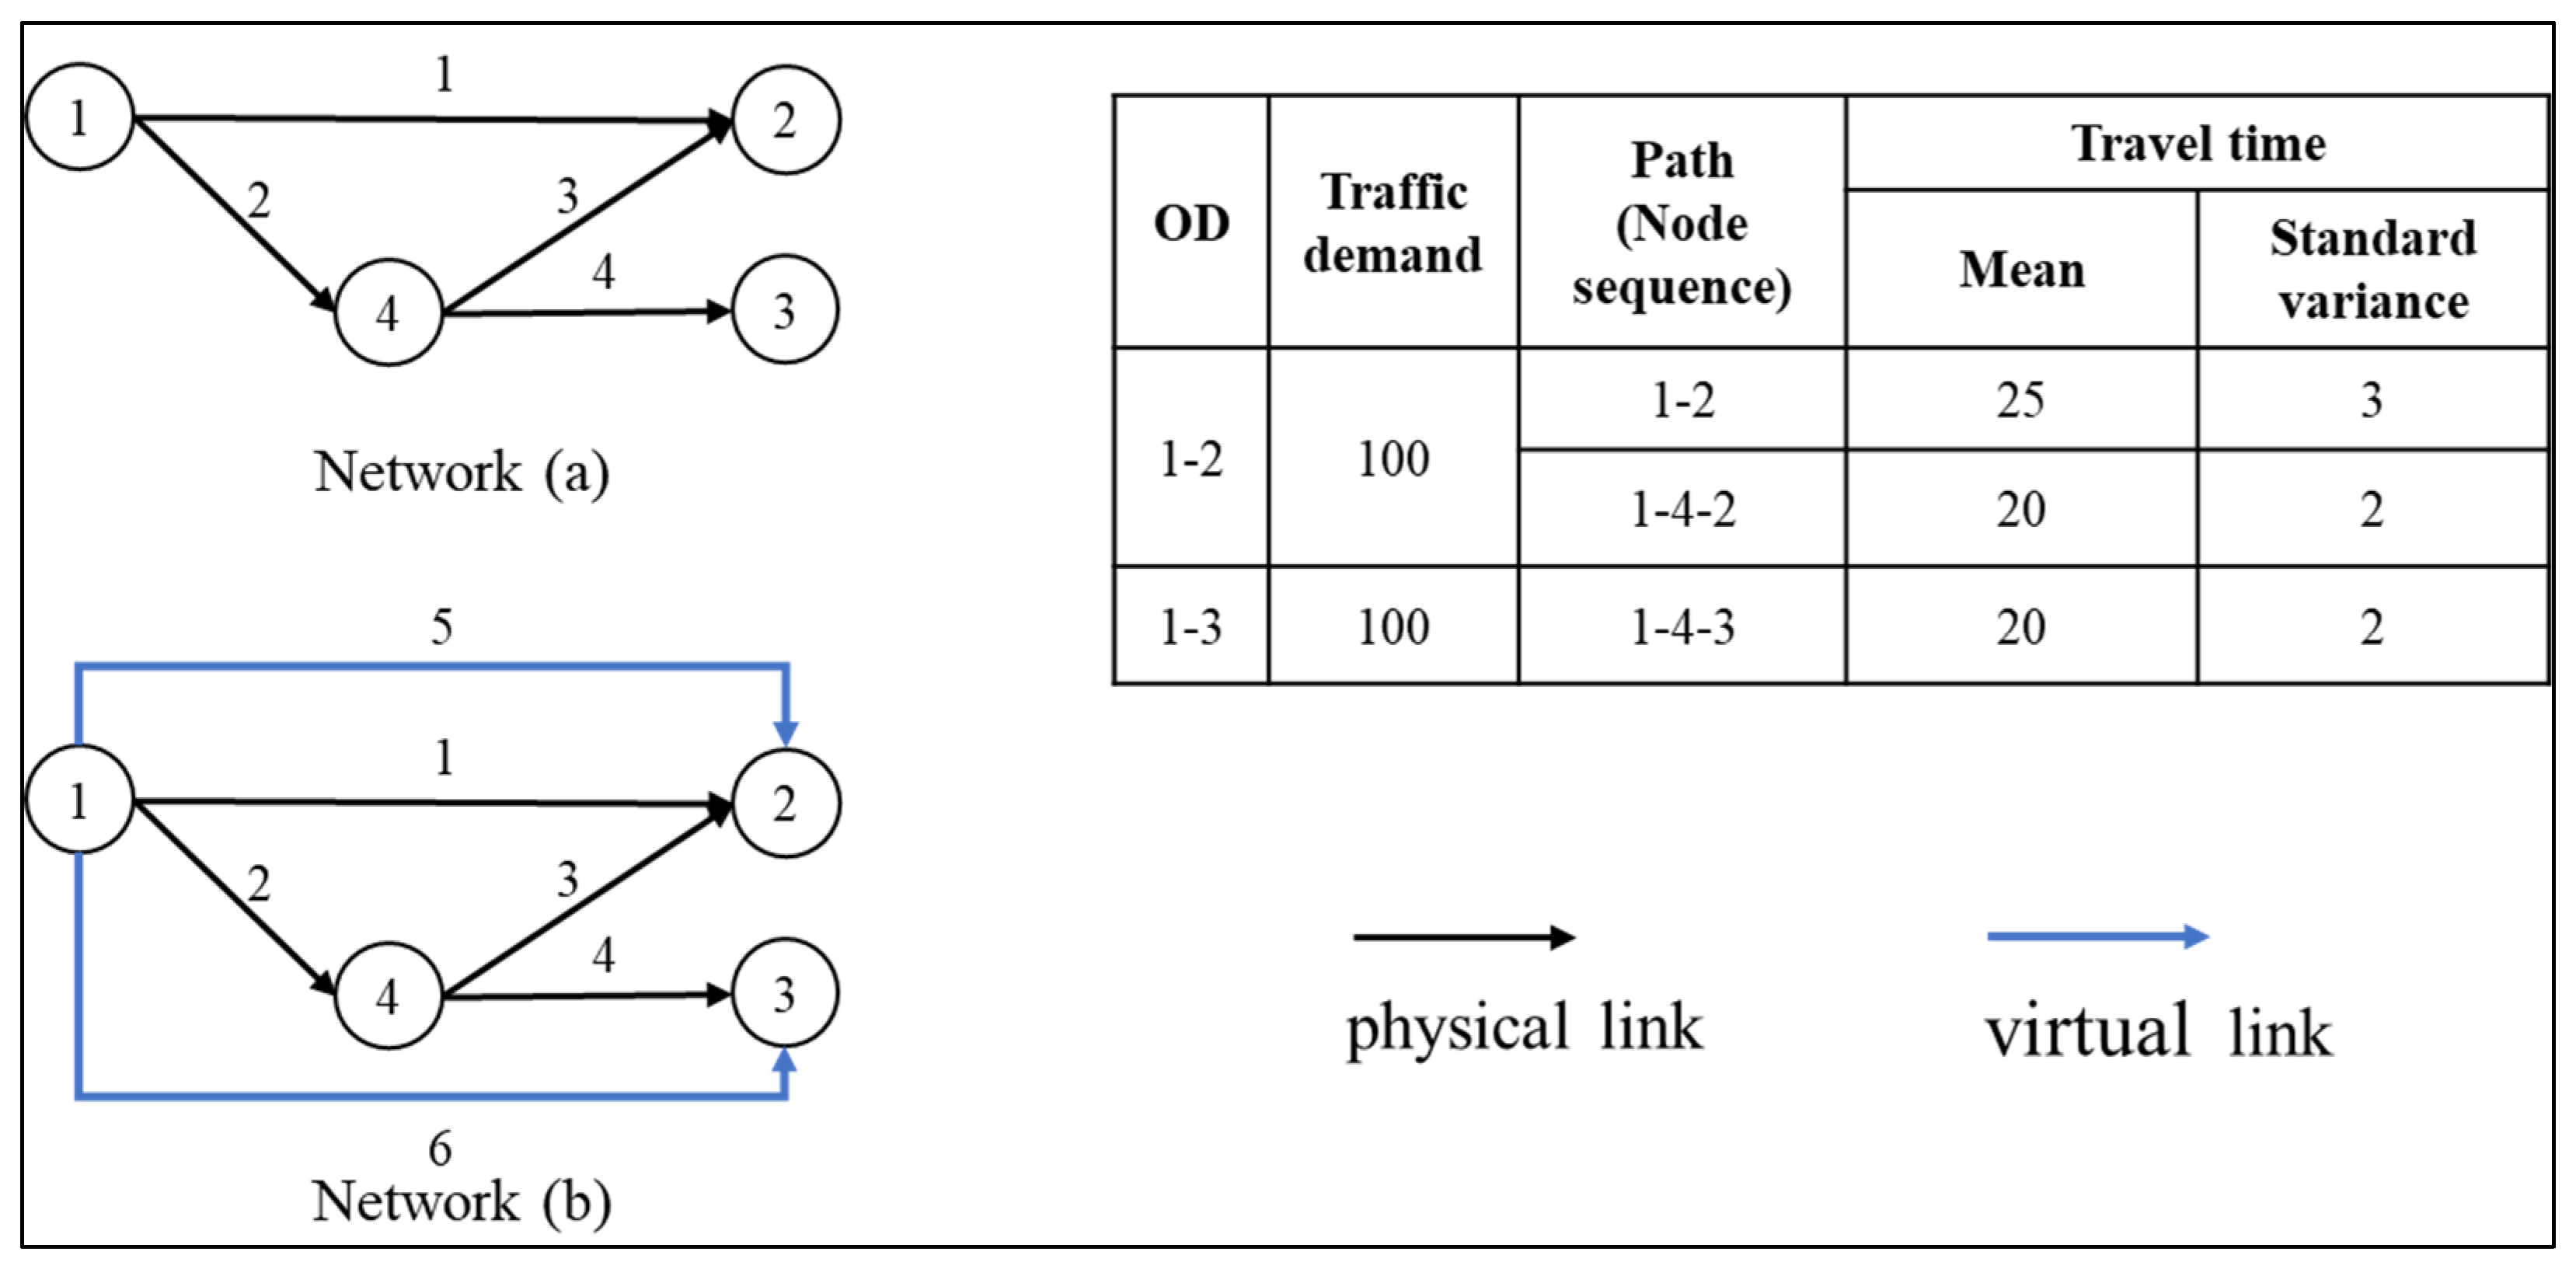
To illustrate our main idea, the small network shown in Figure 3 was employed as an example. Network (a) has two OD pairs and four links. There are 100 traffic demand units for each OD pair. The path travel time is a random variable, which is assumed to follow the normal distribution, and its mean and standard variance are shown in Figure 2. Due to travelers’ heterogeneity, TTB can be represented as a random variable. Generally, the desired arrival time is fixed, so the distribution of TTB is determined by the departure time. Previous research suggests that the distribution of departure time for home-to-work trips can be well-fitted by a normal distribution [25]. In this example, travelers’ TTB is assumed to follow a normal distribution N ( 30,4 ) . However, interested readers can modify it for other calculations.
To prevent link removals from resulting in disconnectivity of OD pairs, we constructed network (b) by adding virtual paths to each OD pair. Links 5 and 6, which serve as virtual paths, have very long travel times, denoted as M . If we only consider the indicator of unsatisfied demand, the criticality ranking of links 2 and 4 may be the same, because their unsatisfied demands are both 100. To further verify the link criticality ranking, other metrics, such as total travel time (TTT) and EI, are needed to assist. TTT and EI can be calculated as follows:
T T T = w p f p w μ p
E I = w p f p w / μ p W
where f p w and μ p are, respectively, the traffic flow and the expected travel time of path p between OD pair w , and W is the number of OD pairs.
Now, we consider taking LAD as the indicator. When there is no link removal, the LAD is 1.27 units for each OD pair. When link 2 is removed, the LAD for OD pair 1–3 is up to 100 units, and that for OD pair 1–2 increases to 15.87 units. When link 4 is removed, the LAD for OD pair 1–3 is up to 100 units, while that for OD pair 1–2 stays the same, at 1.27 units. It is obvious that link 2 is more critical than link 4. The link criticality rankings by various indicators are summarized in Table 1. As it shows, the LAD has the same ranking results as that of TTT and EI, which illustrates the better features of LAD compared with UD.

2.2. The LAR-Based UE Model

In this section, we derive the formulation of the late arrival rate (LAR) after the introduction of the path travel time distribution and travelers’ TTB. Then, taking LAR as the path choice criterion, we build the LAR-based UE model and develop the corresponding solving algorithm.

2.2.1. Path Travel Time Distribution

Let us consider the degradable road network G N , A , where N is the node set and A is the link set. The free-flow travel time and capacity of link a A are respectively denoted as t a 0 and C a . Considering the congestion effect, the link travel time t a is assumed to be monotonically increasing with traffic flow on the link a A . A widely used Bureau of Public Roads (BPR) function is adopted as the link travel time function in this study [26,27]:
t a = t a 0 1 + β f a C a γ
where f a is the traffic flow on link a , and β and γ are two deterministic parameters in the BPR function.
In a degradable road network, the link capacity C a is a random variable, and it is assumed to follow the uniform distribution C a ~ θ a C ¯ a , C ¯ a , where C ¯ a is the design capacity, and θ a 0,1 is the degradation coefficient [16,21]. Then, the mean and standard deviation of the travel time on link a , denoted as μ a and σ a , respectively, can be derived.
μ a = E t a = t a 0 + β t a 0 f a γ 1 θ a 1 γ C ¯ a γ 1 θ a 1 γ
σ a = S D t a = β 2 t a 0 2 f a 2 γ 1 θ a 1 2 γ C ¯ a 2 γ 1 θ a 1 2 γ 1 θ a 1 γ C ¯ a γ 1 θ a 1 γ 2
If we assume link travel times are mutually independent, then the mean and variance of path travel time can be expressed by summing those of link travel time along the path. Letting μ p and σ p be the mean and SD of path travel time of path p , respectively, then we have:
μ p = a A δ a , p μ a
σ p = a A δ a , p σ a 2
where δ a , p is a binary variable, which equals 1 if link a is on the path p , and 0 otherwise.
When a path contains many links in the road network, the path travel time tends to be normally distributed according to the central limit theorem [28,29]. Thus, the path travel time distribution can be expressed as:
T p ~ N μ p , σ p

2.2.2. TTB and LAR

Factors like weather conditions and traffic flow fluctuations directly affect the travel time on the path, which in turn influences travelers’ TTB decisions. In general, travelers plan their TTBs based on the expected travel time between OD pairs, and they will add extra buffer time into TTBs to avoid being late [30,31,32]. Thus, the TTB between OD pair w is usually expressed as the sum of the expected travel time and a buffer time, as follows:
η w = μ w + b w
where η w is the TTB, μ w is the expected travel time, and b w is the buffer time.
Travelers are always seeking the shortest path, and they are aware of the minimum expected travel time between the OD pair. Therefore, we define μ w as μ w = min p P w μ p , in which P w is the path set of OD pair w .
Due to the heterogeneity of travelers in terms of travel habits, risk attitudes, or other factors, b w may be different for travelers. We use a normal distribution to describe the distribution of b w in travelers:
b w ~ N μ b w , σ b w
where μ b w and σ b w are, respectively, the mean and SD of the buffer time.
In general, buffer time tends to increase with the expected travel time. However, there exists an upper limit of the buffer time, as no one can tolerate excessively prolonged traffic delays. Following Sun’s approach [32], the expected buffer time can be estimated as:
μ b w = b m a x 1 1 e x p φ μ w
where b m a x is the upper bound of buffer time, and φ is a parameter representing travelers’ sensitivity to the expected travel time.
The variance of the buffer time is assumed to be linearly correlated with μ b w by a dispersion coefficient ρ , written as:
σ b w 2 = ρ μ b w
Then, the travel time budget also follows a normal distribution, namely η w ~ N μ w + μ b w , σ b w . When travelers travel along the path p P w , the late arrival rate R p w can be calculated as:
R p w = P r η w T p < 0
By assuming that the path travel time and travelers’ TTB are independent, η w T p follows a normal distribution, and its mean and variance are as follows:
E η w T p = μ w + μ b w μ p
V a r η w T p = σ p 2 + σ b w 2
Then, we can rewrite R p w as:
R p w = ϕ μ w + μ b w μ p σ p 2 + σ b w 2
where ϕ · is the cumulative distribution function of standard normal distribution.

2.2.3. LAR-Based UE Model and Solution Algorithm

With the popularity of smart devices, travelers’ path choices rely heavily on advanced navigation systems (ANSs) [33]. We assume that an ANS recommends the path with the lowest LAR as the optimal path for travelers, and all travelers follow such recommendations. In this assumption, travelers are guided to choose appropriate paths to minimize the LAR. Then, the LAR-based UE path choice pattern can be stated as: the LAR on all the used paths between each OD pair is equal to or less than the LAR on any unused paths. Let f p w be the traffic flow of path p P w , R p w be the LAR of path p P w , q w be the traffic demand of OD pair w W , and R w be the lowest LAR among all paths between OD pair w . The LAR-based UE condition can be expressed as:
f p w R w R p w = 0
R w R p w 0
In addition, f p w should satisfy the following constraints:
f p w = q w
f p w 0
The LAR-based UE condition can be converted into an equivalent variational inequality (VI) problem, that is, finding f p w * Ω such that:
w p R p w f p w * f p w < 0
where Ω is the feasible region constructed by constraints (21) and (22), namely Ω = { f p w ( 21 ) ( 22 ) } . Because R p w is continuous with respect to path flows, and the feasible set is compact and convex, the solution of the VI problem exists.
It is noted that R p w is detemined by characteristics of the path, which cannot be calculated by the linear addition of link characteristics. This property of LAR is called a non-additive property. Thus, traditional link-based solution algorithms cannot be applied to solve this problem. The path-based method of successive algorithm (MSA) is an efficient solution algorithm to solve the UE problem [30,34,35], and the detailed steps of path-based MSA to solve the LAR-based UE model are as follows:
Step 0. (Initialization) Set initial iteration number n = 0 , tolerance error e , working path P , and obtain the initial path flow vector f ( 0 ) by all-or-nothing assignment based on free-flow travel time.
Step 1. (Update LAR) Calculate the path travel time distribution using Equations (6)–(10) and travel time budget using Equations (11)–(14), then update LAR using Equation (18).
Step 2. (Calculate the search direction and step size) Based on the current LAR, obtain the auxiliary flow f ( n ) by all-or-nothing assignment and calculate the search direction d ( n ) = f ( n ) f ( n ) and step size λ ( n ) = 1 / n .
Step 3. (Update traffic flow) Update traffic flow by f ( n + 1 ) = f ( n ) + λ ( n ) d ( n ) .
Step 4. (Check convergence) If f ( n + 1 ) f ( n ) / f ( n ) e , f ( n + 1 ) is the solution of the traffic flow pattern, go to step 5. Otherwise, set n = n + 1 and go to step 1.
Step 5. (Output results) Update LAR and calculate the LAD by L A D = w p f p w R p w .

2.3. Identify Critical Links by Different Indicators

Besides the proposed indicator of LAD, we choose four widely used indicators to identify critical links for comparison. They include the network efficiency index (EI), link importance score (IS), travel time weighted betweenness-centrality (TTWBC), and traffic flow weighted betweenness-centrality (TFWBC) [5,8]. All these indicators are calculated in the framework of our proposed LAR-based UE model, and their formulations are summarized in Table 2.
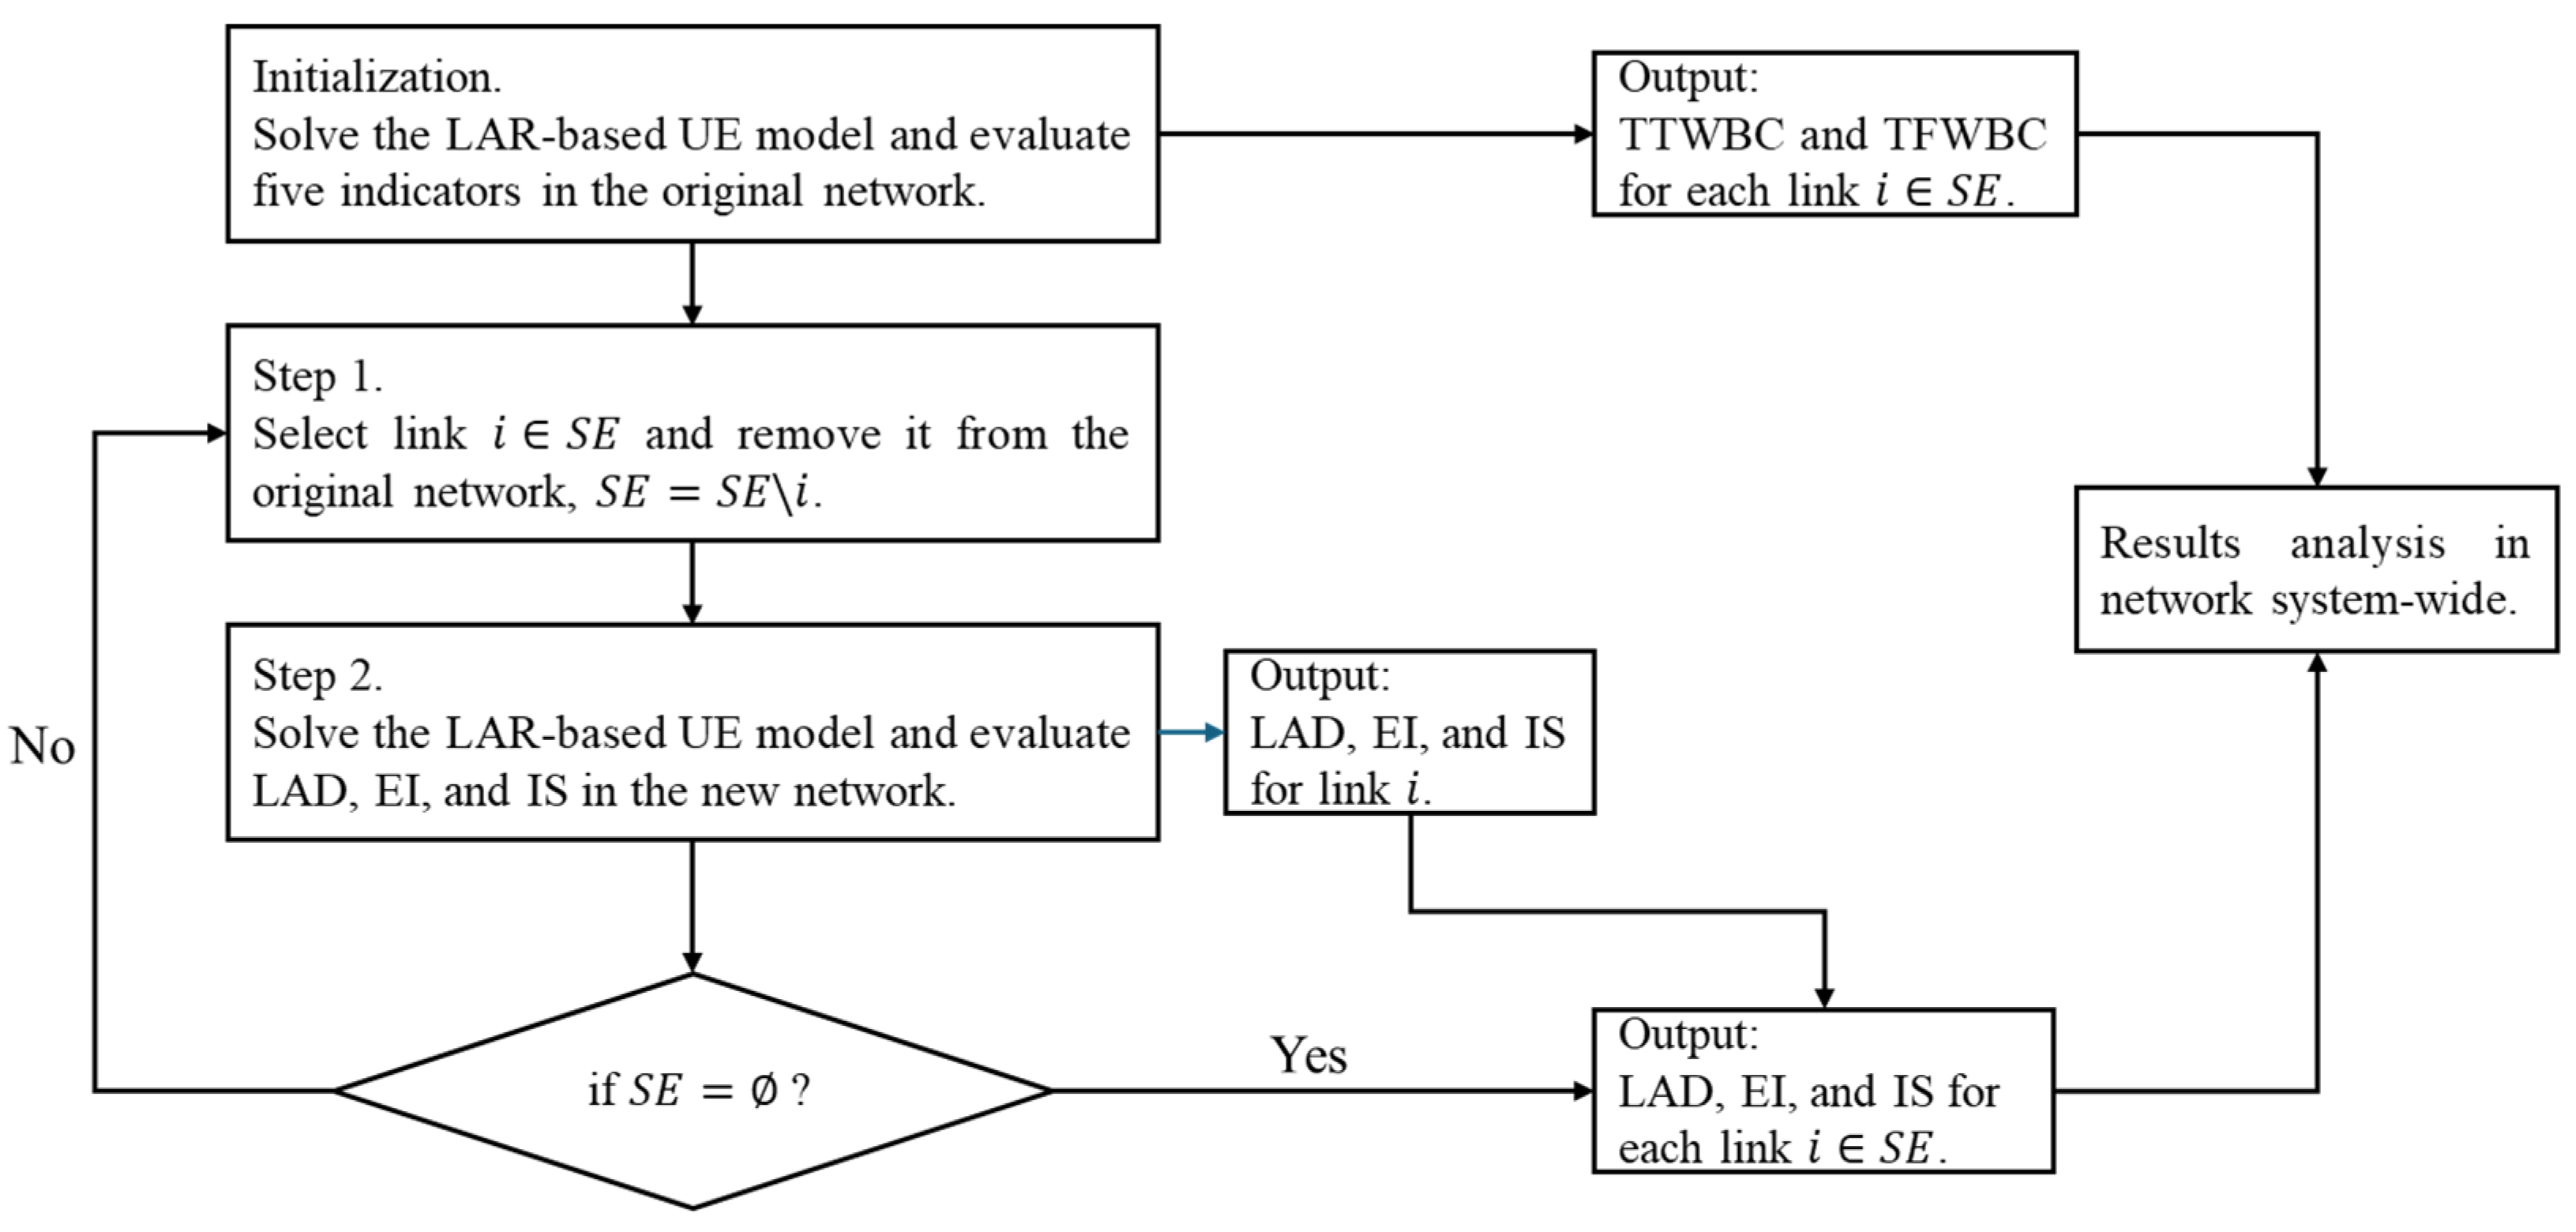
Let S E be the candidate set of critical links. Among the five indicators, LAD, IS, and EI are traffic-based indicators which are calculated by solving the LAR-based UE model S E times, each time removing one link sequentially, while TTWBC and TFWBC are topological-based indicators with traffic characteristic weights which are calculated by solving the LAR-based UE model just once, without removing any links. The detailed procedures for identifying critical links using various indicators are illustrated in Figure 4.

3. Numerical Experiments

Numerical experiments are presented in this section to illustrate our proposed LAR-based UE model and the critical link identification approach based on various indicators. Two well-known traffic networks, including the Nguyen–Dupuis network and Sioux Falls network, are adopted for illustration.

3.1. Nguyen–Dupuis Network

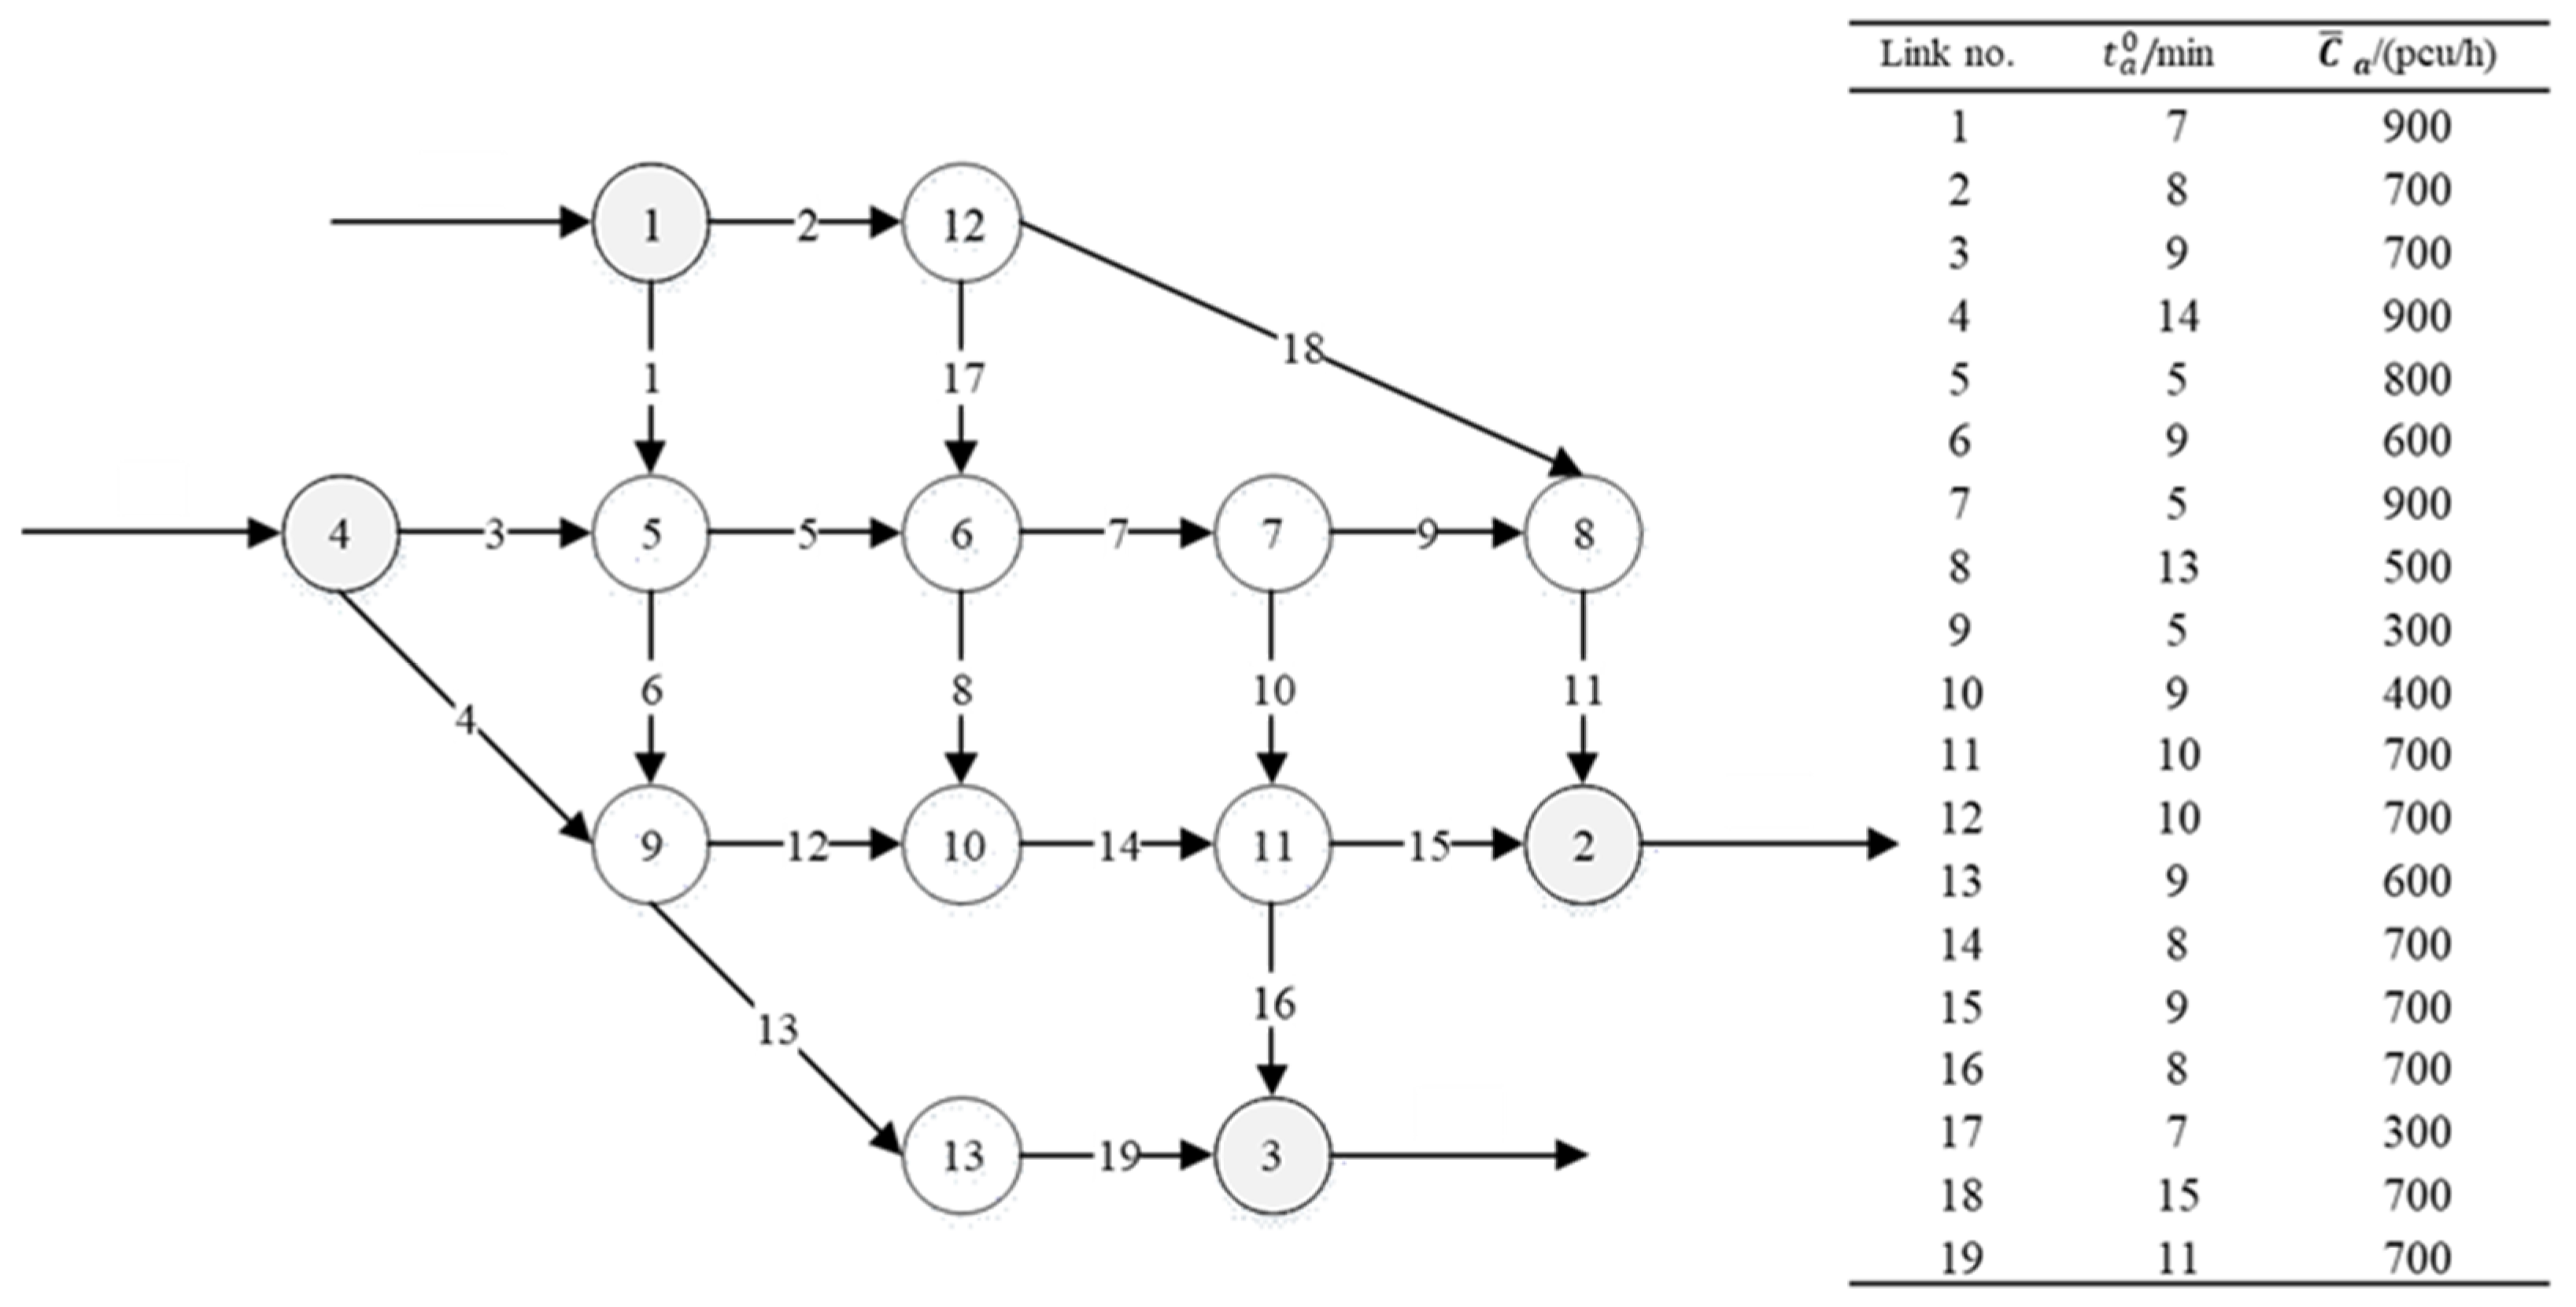
The ND network shown in Figure 5 consists of 13 nodes, 19 links, and 4 OD pairs. The link characteristics of the ND network, including the free flow travel time and design capacity of links, are also displayed in Figure 5. Referring to the literature [26], other parameters in our methodology are set as β = 0.15 , γ = 4 , φ = 0.02 , b m a x = 15 , and ρ = 1 . The levels of OD demand and degradation are considered to be highly sensitive to the results of UE models and link criticality rankings [12,30]. We set three levels for each of them to conduct the sensitivity analysis. The OD demands, assumed to be equal, are respectively set as 200, 400, and 600 for low-level, medium-level, and high-level. Similarly, the degradation coefficients are set as 0.2, 0.5, and 0.8 for the three levels.
(1) The impact on LAR-based UE results
We conducted experiments under nine scenarios by combining “three levels of degradation” with “three levels of OD demand” to analyze the results of the LAR-based UE model. Without loss of generality, we show the equilibrium results of representative OD pairs 1–3 and 4–2 in Table 3. As expected, all travelers between each OD pair only choose the paths with the minimum LAR, which verifies that the MSA algorithm can effectively solve the equilibrium results.
As the demand level increases, the network becomes more congested, prompting travelers to choose more paths to travel. For example, in the case of OD 1–3 under high-level degradation, the numbers of used paths are 2, 5, and 6, corresponding to low, medium, and high levels of OD demand. In addition, we find that a higher degradation level also prompts travelers to choose more paths to travel. For example, in the case of OD 1–3 with high-level OD demand, the numbers of used paths are 2, 4, and 6, corresponding to low, medium, and high levels of degradation. It can be inferred that travelers tend to use new paths that have not been used before to avoid risks caused by congestion and degradation. Remarkably, the relationship between the number of used paths and the levels of demand/degradation is not strictly monotonically increasing, because the factors influencing travelers’ path choices are complex. For example, due to travelers’ bounded rationality, a limited increase in congestion may not lead them to adjust their routes. However, the increase in demand and degradation levels are important factors promoting travelers to choose more paths.
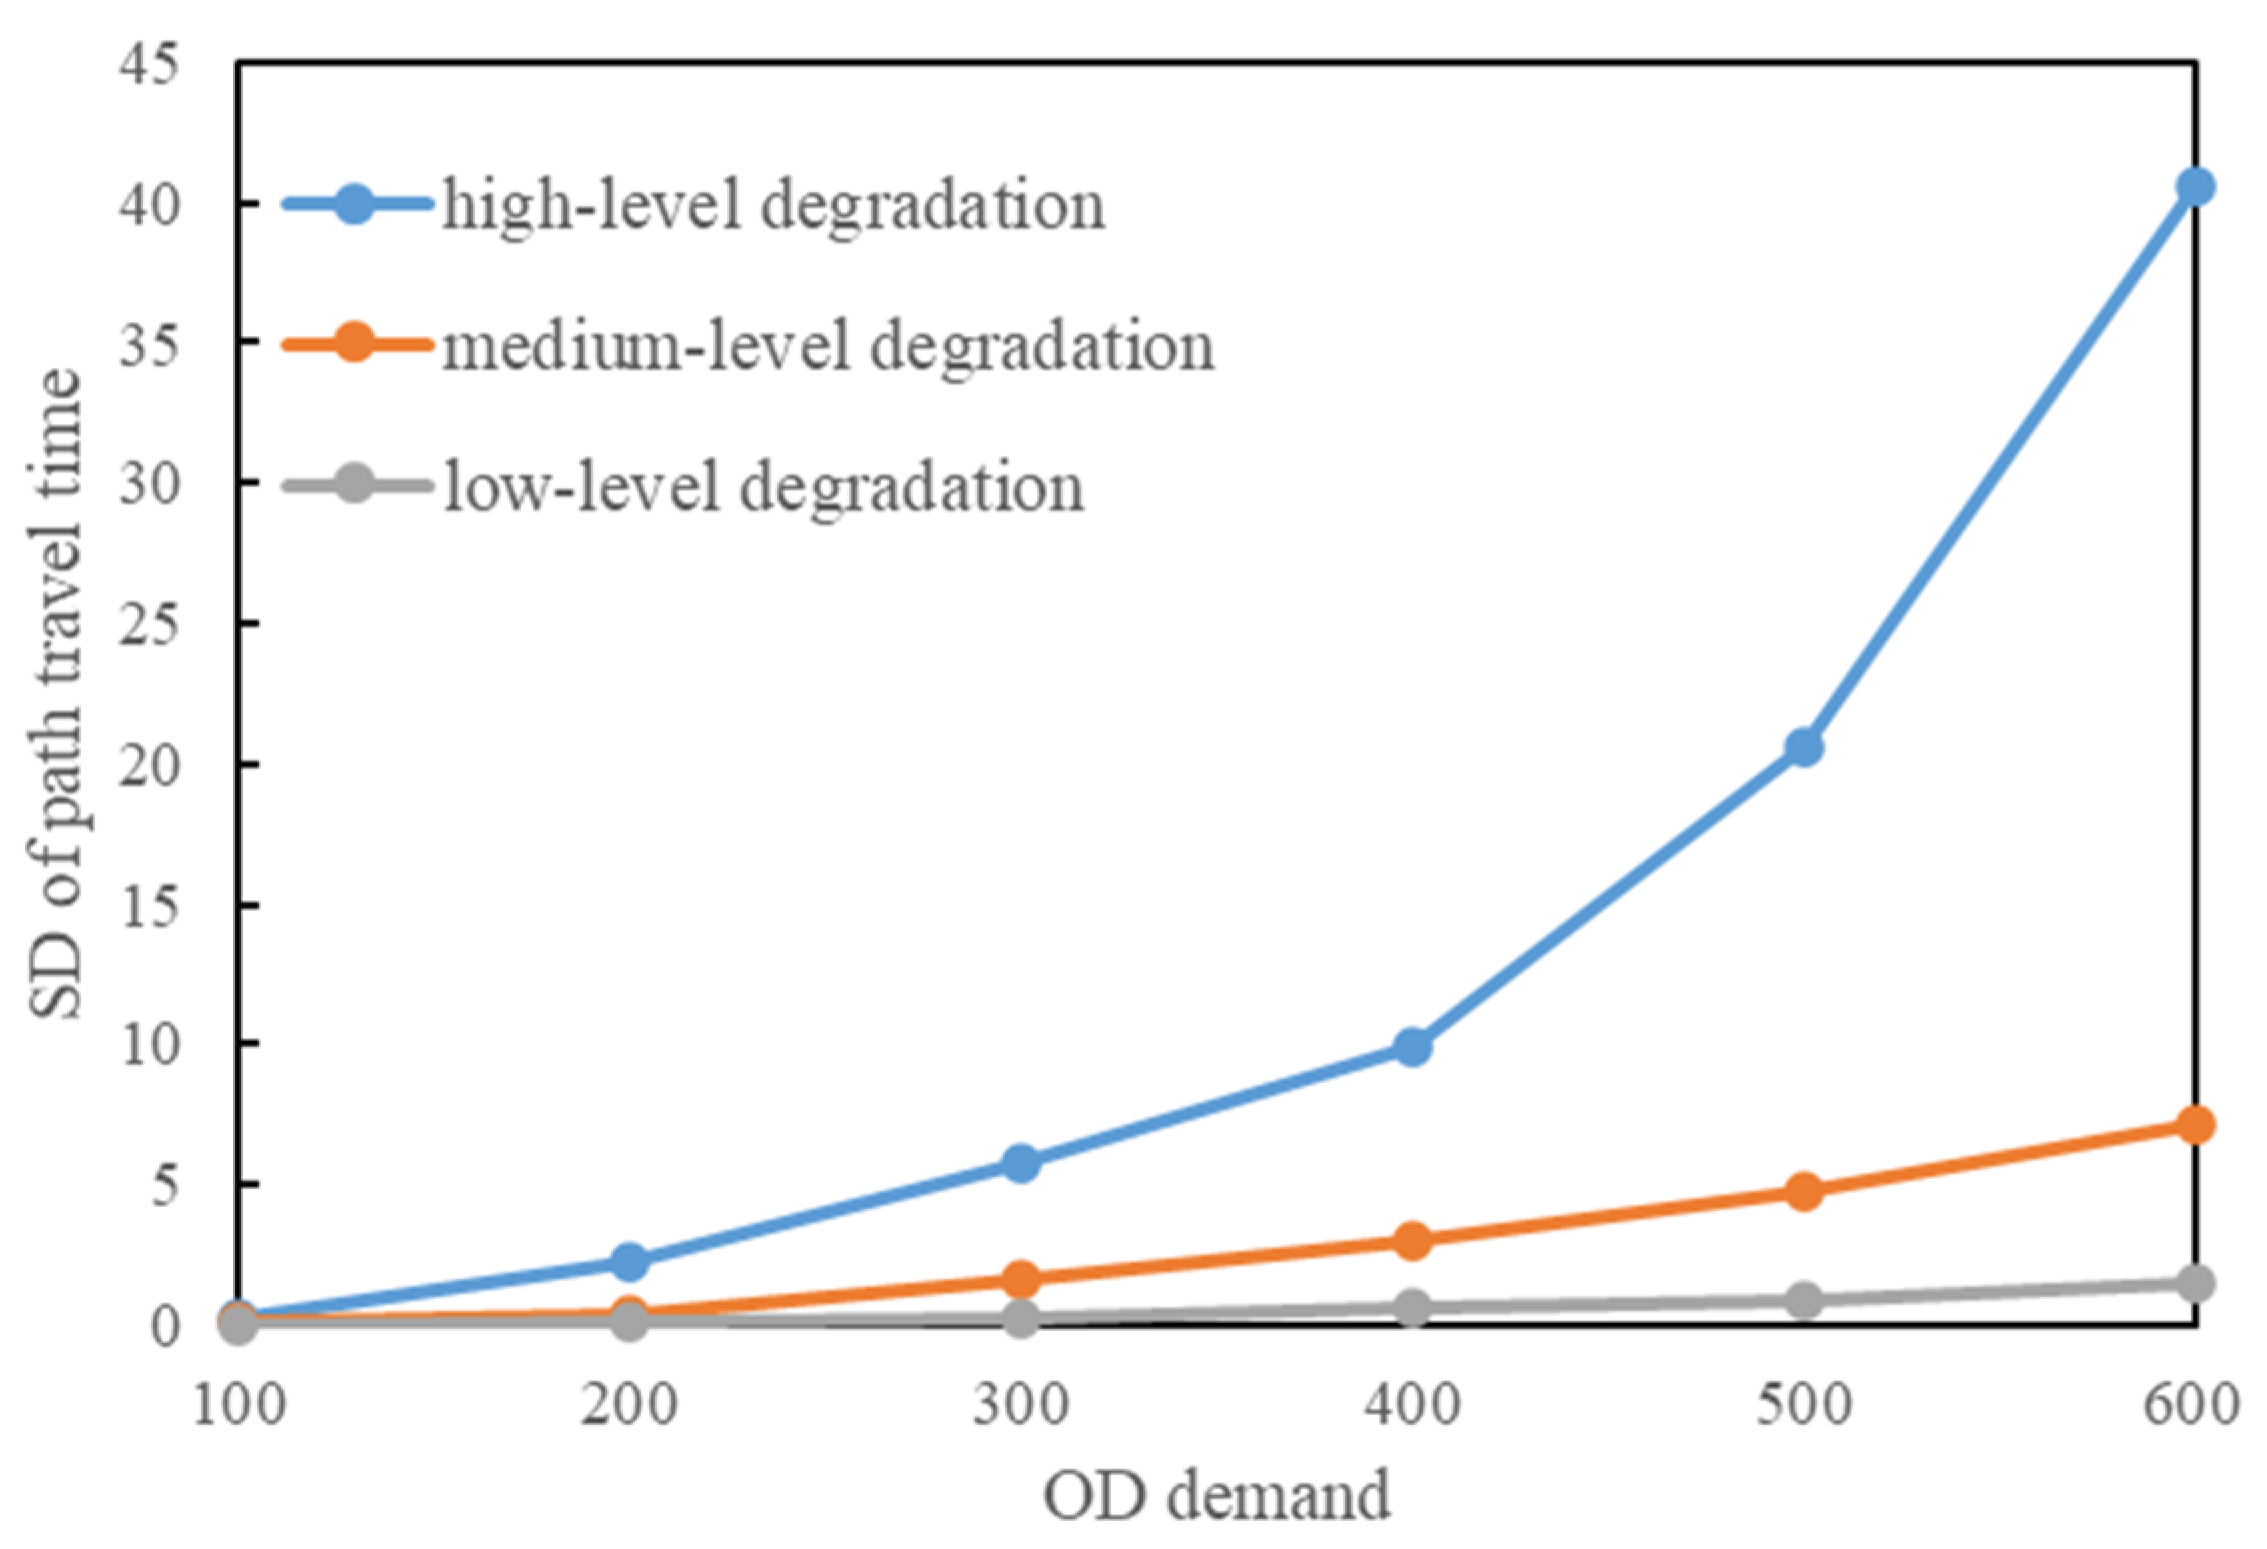
In cases of medium-level and high-level degradation, the results are as expected, in that higher level of OD demand will cause an increase in LAR, while in the case of low-level degradation, there seems to be no obvious correlation between OD demand and LAR. The reason is that travelers’ buffer time and TTB are endogenous, based on the expected path travel time (see Equation (18)) in our proposed UE model. In the case of low-level degradation, the SD of path travel time is very small, and travelers can adjust their TTB to cope with the congestion and low-level uncertainty. But, in cases of medium-level and high-level degradation, the SD of path travel time becomes non-negligible and significantly increases with OD demand; travelers cannot well handle such large uncertainty caused by congestion, so the LAR increase significantly. Taking path 1 as an example, Figure 6 shows how the SD of its travel time increases with OD demand under different degradation levels, which verifies that uncertainty increases sharply with OD demand in the case of high-level degradation.
(2) The impact on link criticality rankings
We take medium-level OD demand as the example and set three degradation levels. Similar to Wang and Jin, only the first five critical links are listed, for illustration purposes [10,12]. As shown in Table 4, the link criticality ranking varies from the indicators and degradation levels. However, it is noted that link 11 is always in the top five (except once for TFWBC), which identifies its criticality.
We define high-frequency critical links as those identified by more than half of the link criticality indicators in each scenario. It is easy to see that LAD identifies high-frequency critical links almost each time (14/15), while EI, IS, TTWBC, and TFWBC identify them respectively 14, 9, 12, and 7 times. Then, we took medium-level degradation as the example and set three levels of OD demand. As shown in Table 5, the LAD indicator captures high-frequency critical links most, reaching 13 times, while EI, IS, TTWBC, and TFWBC capture them respectively 12, 9, 12, and 8 times. Both of these results demonstrate the effectiveness of LAD. The correlation relationship of link criticality rankings based on various indicators will be further discussed in the example of the Sioux Falls network.
Disruptions of two-link combinations are also considered, which can illustrate the disconnectivity issue. Because TTWBC and TFWBC do not apply to combined links, only LAD, EI, and IS were selected as indicators. In this case, some OD pairs may be disconnected because of failures of link combinations, and IS2 should be used to assist. The total number of combined two-links is 171. We take q w = 400 , w and θ a = 0.5 , a as examples and list the results of the top 17 (top 10% of 171) combinations in Table 6 for illustration. With the IS2 indicator, we found that 17 combinations of two-links will result in OD pair disconnections. Here, the values of 800 and 400 in IS2 means failures of link combinations will result in two and one OD pair disconnections, respectively. It is noted that some such combinations may be not intuitive; for example, the combinations of (1,6), (1,17), and (9,15), which only result in one OD pair disconnection, were not identified in some previous research [10]. However, these combinations, which result in disconnections, may be not the top critical combinations. There are no such combinations included in the top 17 combinations identified by LAD, and only (11,15), (13,16), (16,19), and (3,4) are included in the top 17 combinations identified by EI.
The results in Table 6 also show the conclusion that the critical two-links are not simple combinations of the top five critical single-links. For example, links 2 and 5 in the first critical link combination identified by LAD are not included in its top five critical single-links. In addition, one can note that two-link failures can cause shape changes of indicators comparing with single-link failures. Specifically, the LAD increases by about 51%, EI decreases by about 45%, and IS1 increases by about 969%. The results identified by the four indicators seem quite different; for example, there were only four common combinations between LAD and EI in the top 17 critical combinations, however we find the top 17 combinations of LAD are all included in the top 35 of EI.
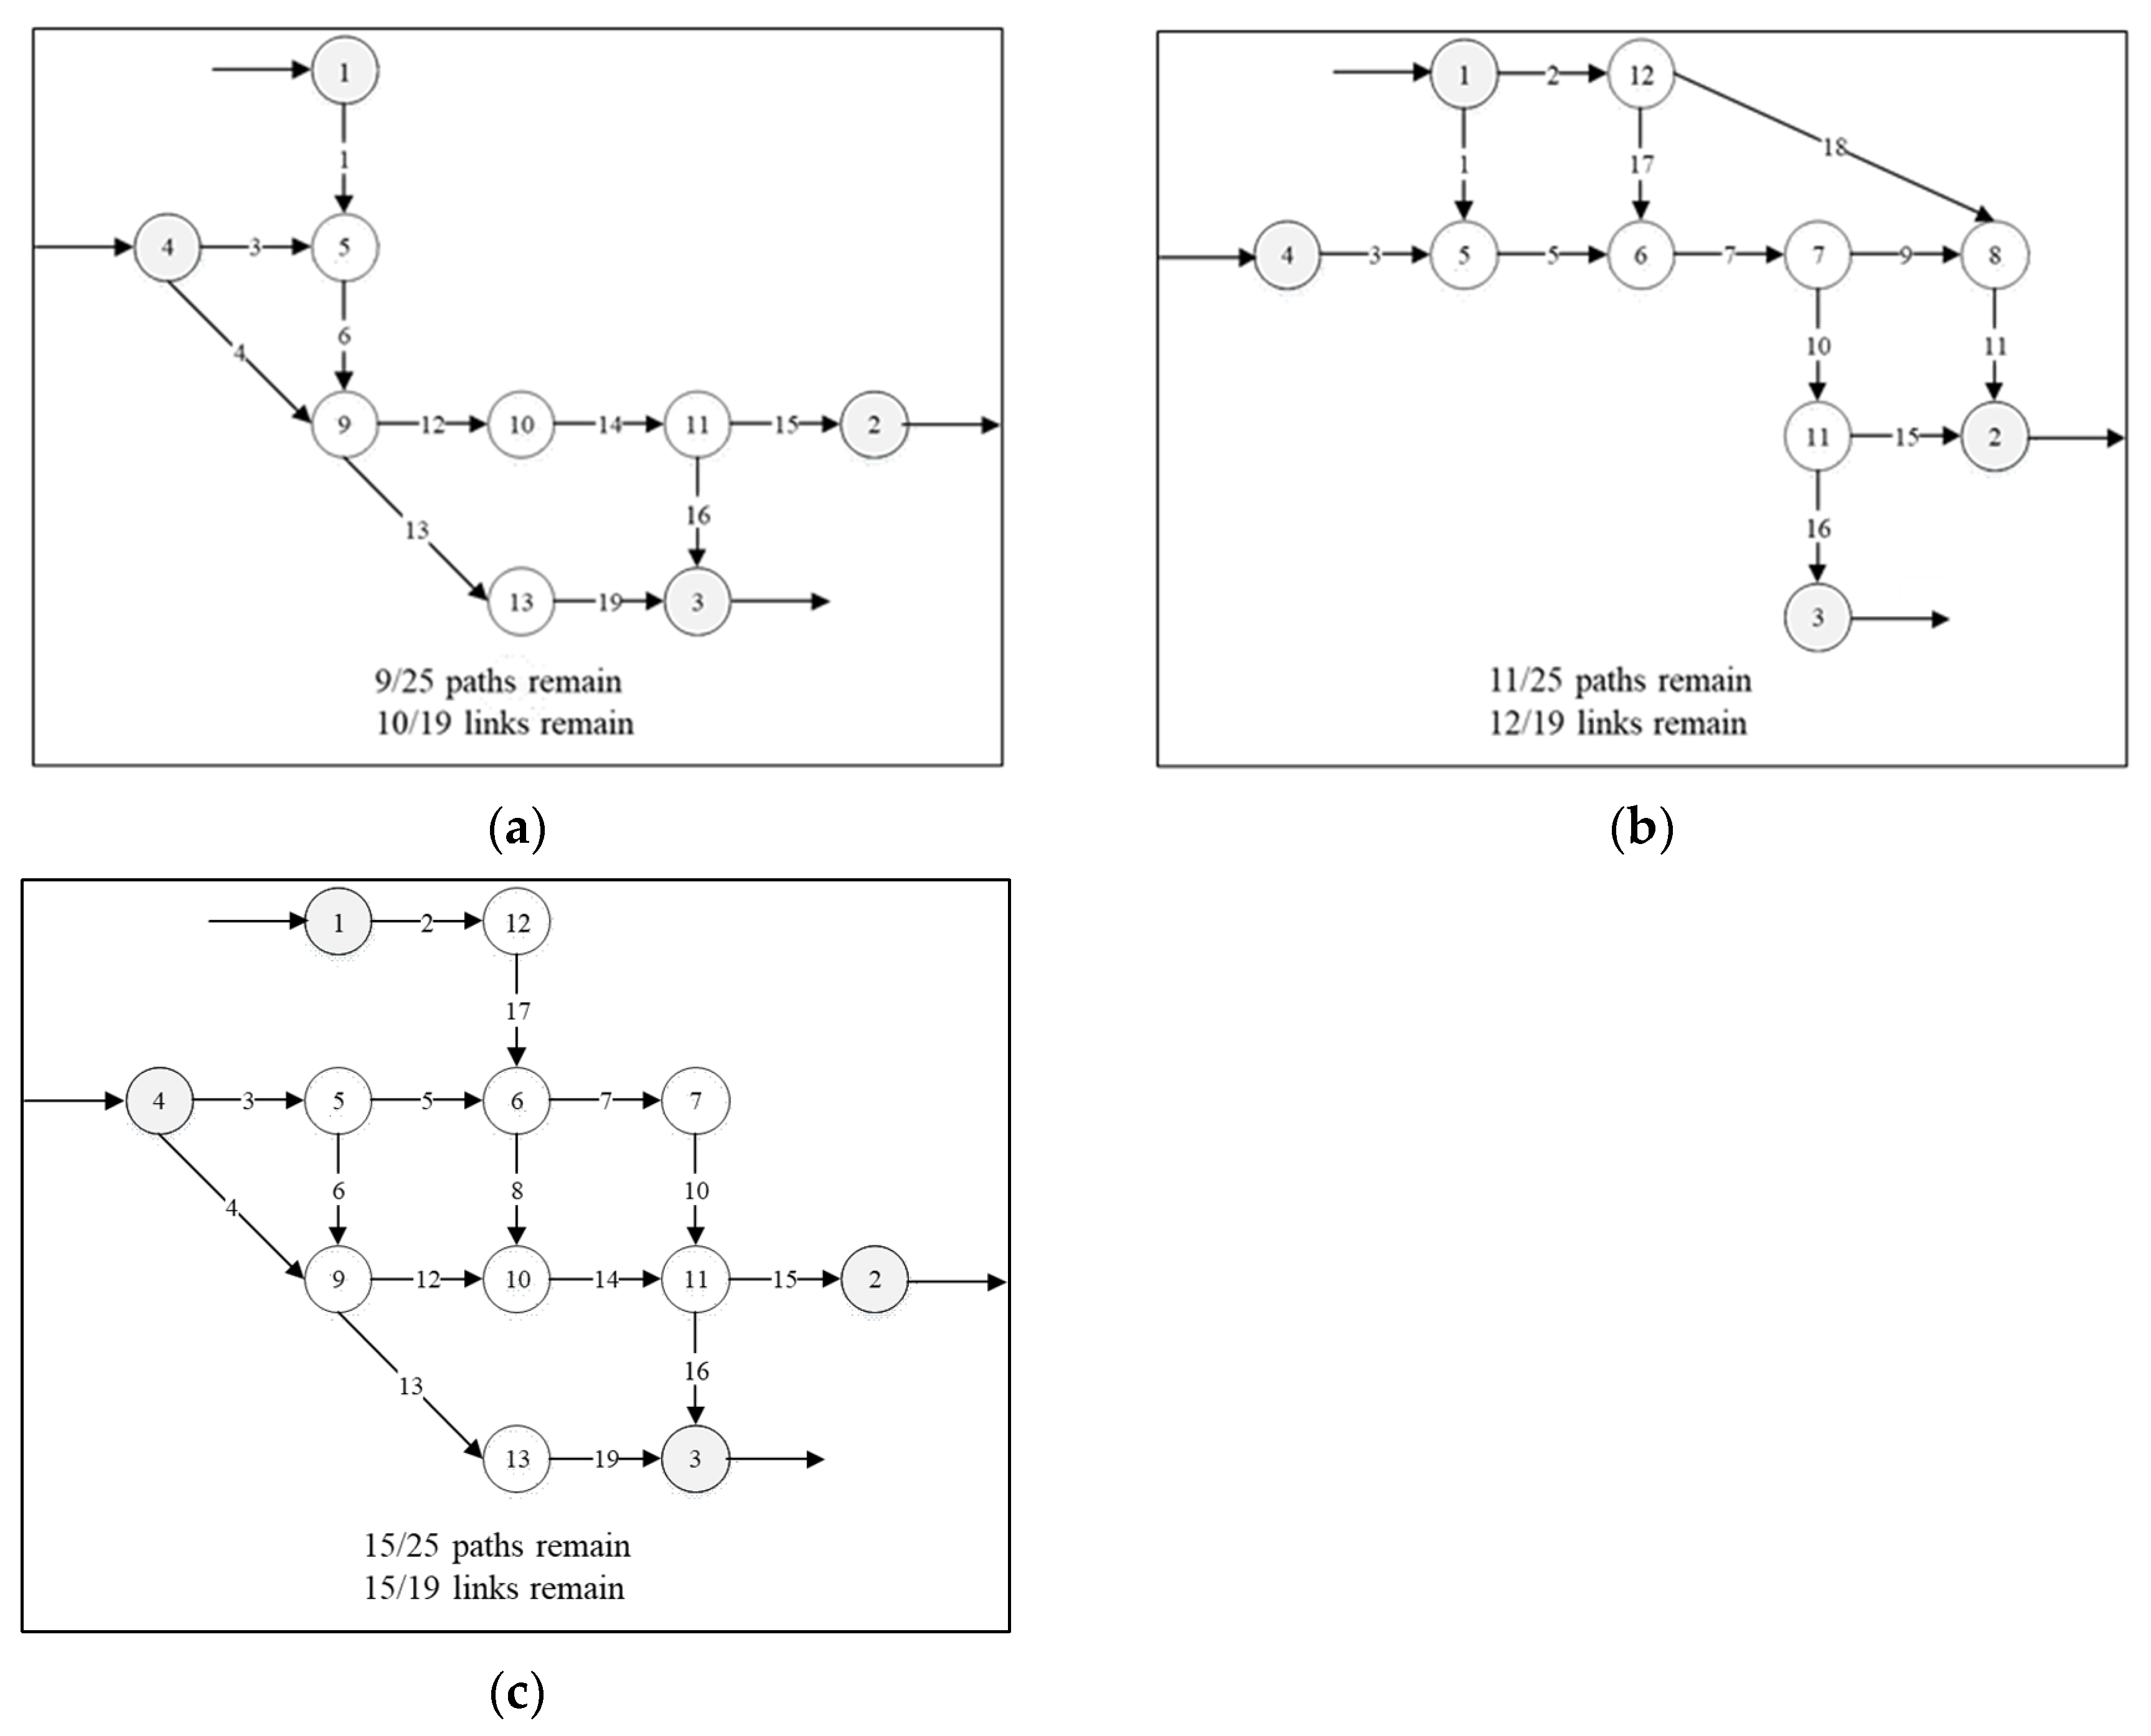
Since the ND network is unidirectional, the impact of link failures on the network topology is particularly severe. For example, the failure of link 2 will result in the failure of subsequent links 17 and 18, and the subsequent failure of link 5 will further cause the failure of links 7, 8, 9, 10, and 11. We show the effective network topology after failures of most critical link combinations identified by LAD, EI, and IS1 in Figure 7. The results present that the combination (2,5), which may be overlooked by EI and IS1, actually causes the most severe disruption to the network topology among the combinations of (2,5), (13,14), and (1,11). Failures of the combination (2,5) result in congestion concentrated around node 9, causing most traffic demand to be late. The indicator of LAD provides us new insights to recognize link criticality.

3.2. Sioux Falls Network

Sioux Falls is the largest city in the U.S. state of South Dakota. The real city network consists of 24 traffic zones and 76 links, as shown in Figure 8. The network data, including OD demand, link characteristics, etc., were obtained from the open website https://github.com/bstabler/TransportationNetworks (accessed on 1 August 2024). Other parameters are set the same as those in the ND network. For sensitivity analysis, we set four conditions for the degradation coefficient, which are 0.2, 0.4, 0.6, and 0.8, respectively.
We used Yen’s k-shortest algorithm to generate five working paths for each OD pair [36], and the path–link incidence matrix can be found in the literature [37]. It takes about 3 h to conduct the process shown in Figure 3 to obtain all five indicators for all links. To quantitatively analyze the correlation relationship of the ranking results from various indicators, the percentage of common critical links (PCCLs) and Spearman’s rank correlation are adopted for illustration in this section. Remarkably, PCCL and Spearman’s rank correlation coefficient do not have a strict minimum sample size requirements, but sample size can significantly affect the reliability and statistical power of the results. Generally, a minimum of 30 samples is suggested to obtain reliable and meaningful results for Spearman’s rank correlation coefficient [38,39]. Though the data from Section 3.1 can be applied to describe the Spearman’s rank correlation, we cannot ensure the reliability and accuracy of the results in such a small-scale network, because there are only 19 links in the ND network. In contrast, there are 76 links in the Sioux Falls network; thus, the Spearman’s rank correlation coefficient’s estimation becomes more reliable and accurate.
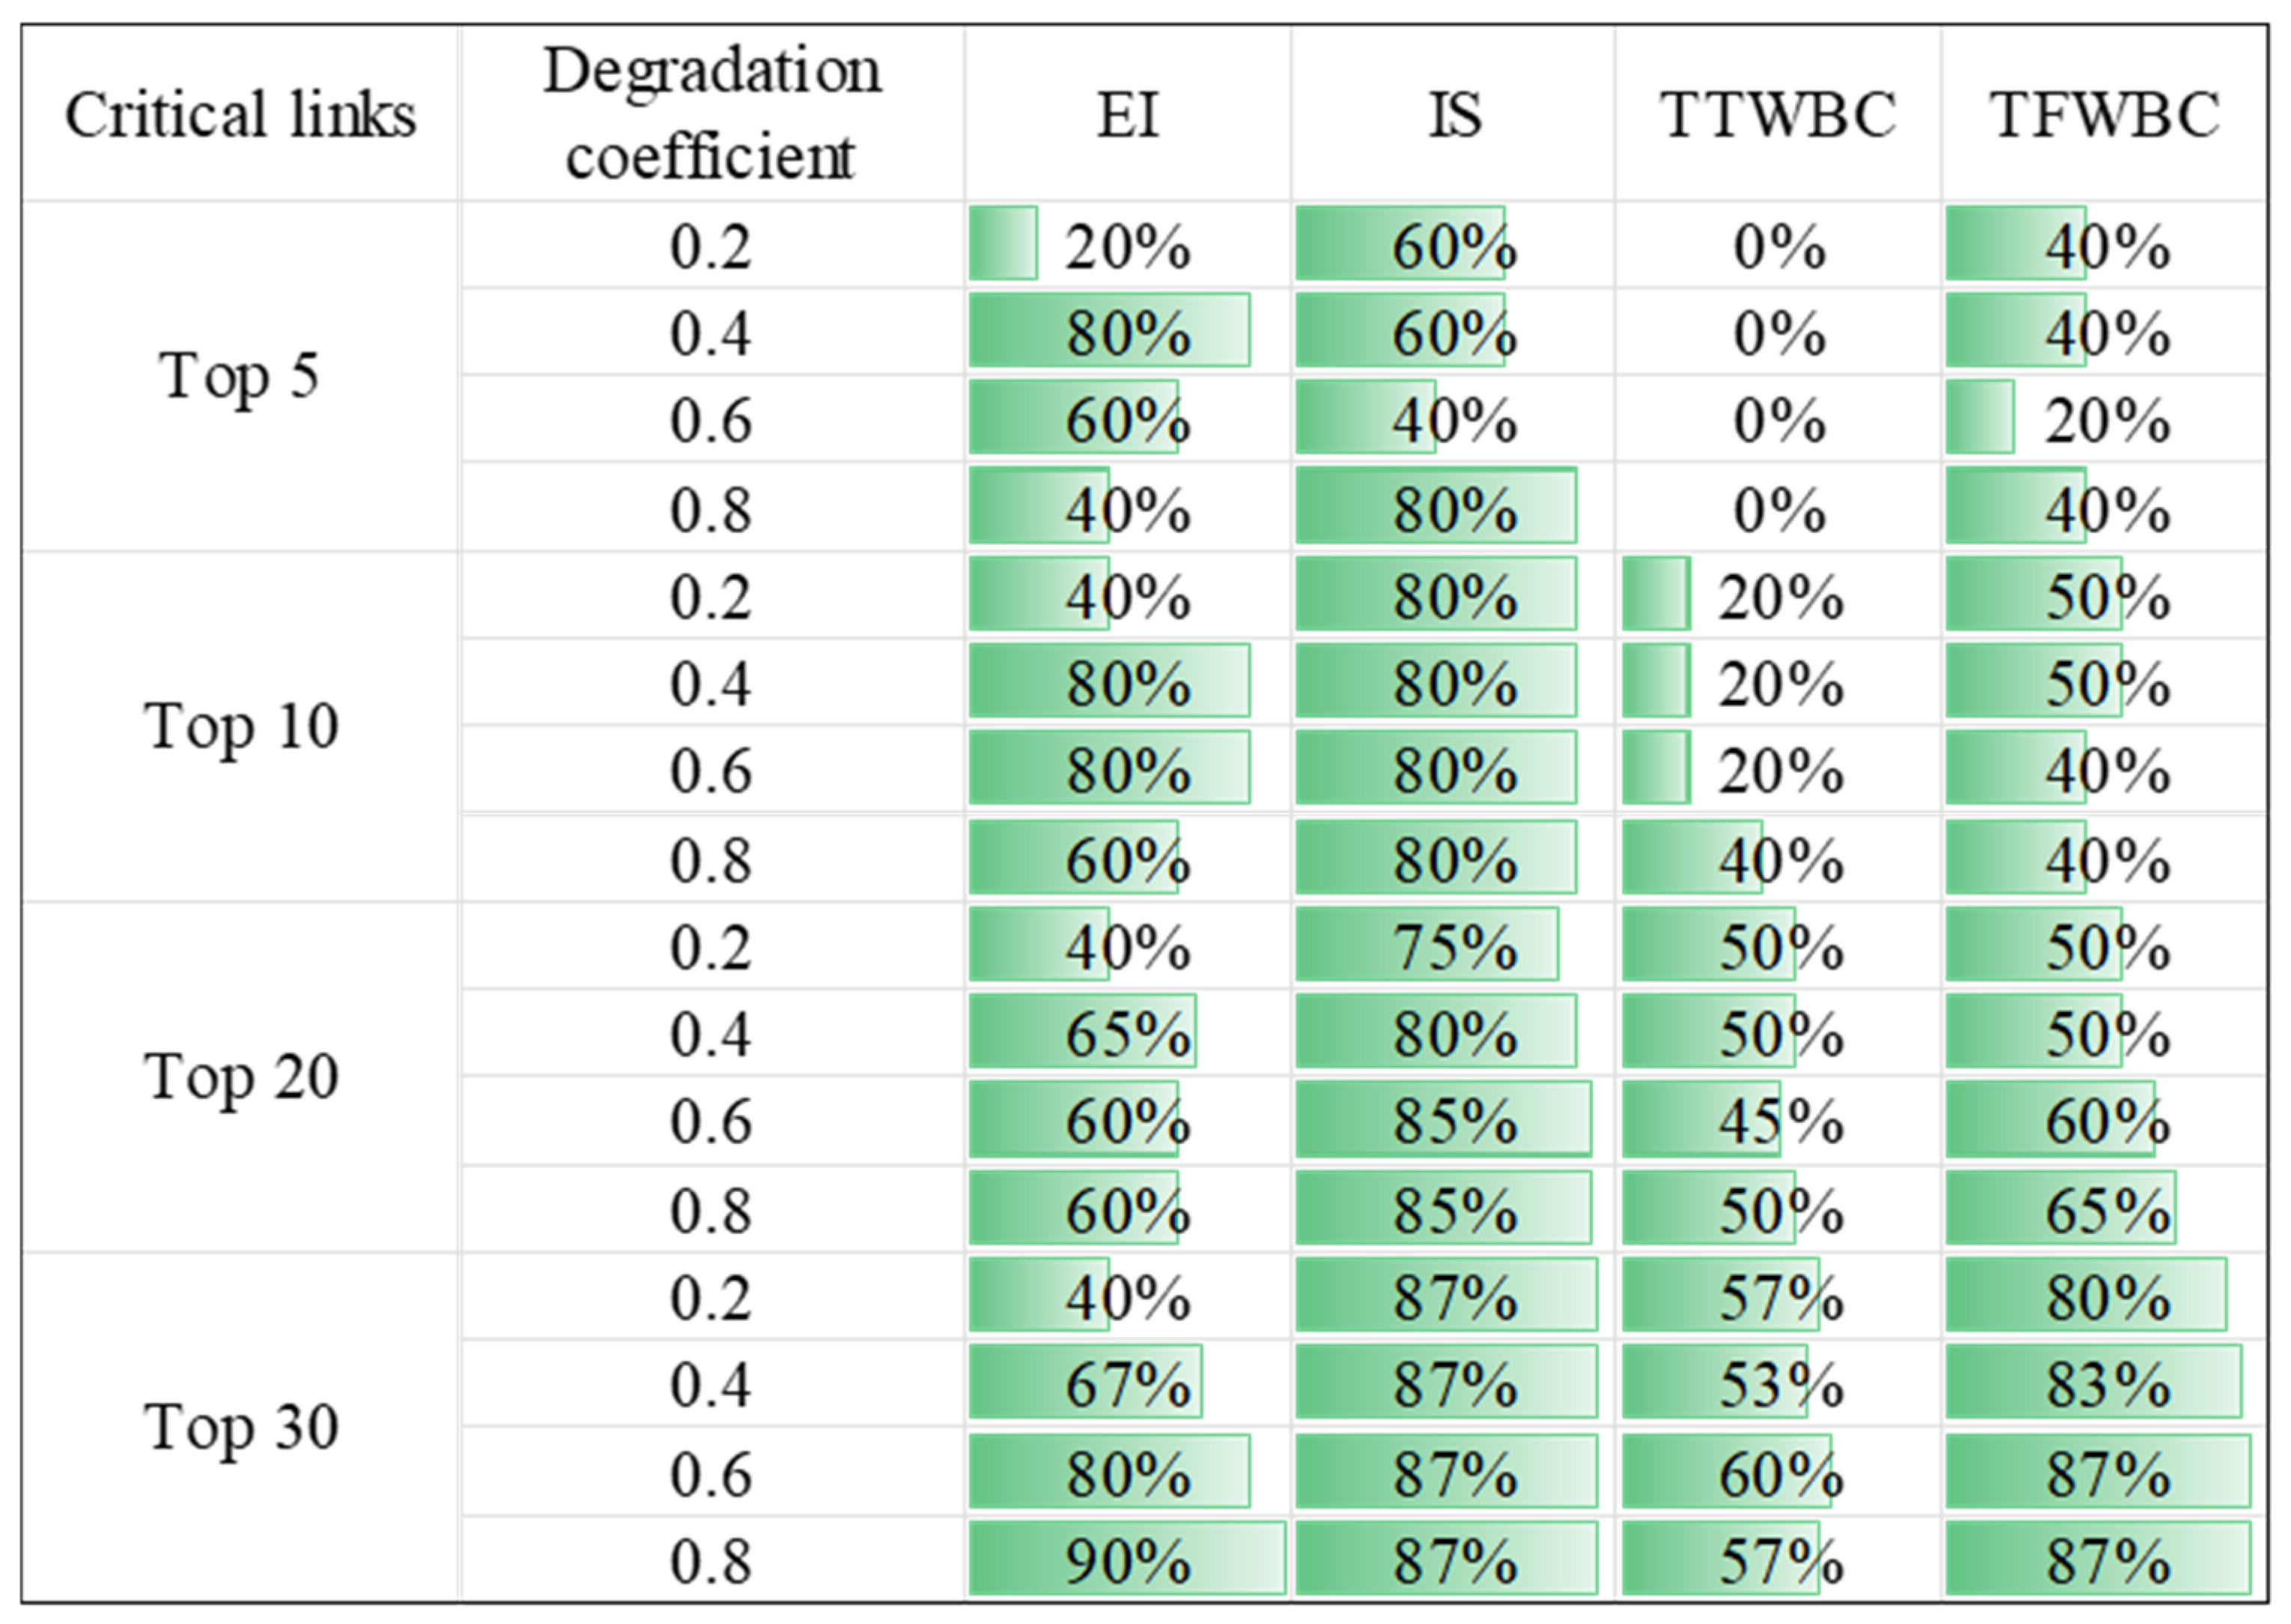
PCCL was used to analyze the percentage of common critical links identified by various indicators in the sets of the top 5, 10, 20, and 30 critical links. Taking LAD as the benchmark, the PCCL results are presented in Figure 9, and the values represent the PCCL between LAD and other listed indicators. For example, 87% of the top 30 critical links identified by LAD are common links to those identified by IS in the case of θ = 0.8 . From the results, it can be easily observed that IS provides the highest PCCL with LAD, followed by EI and TFWBC. The PCCL between LAD and EI seems significantly impacted by the degradation coefficient. For example, even in the top 30 critical links, if θ = 0.2 , the PCCL is only 40%, but when θ = 0.8 , the PCCL is up to 90%. The PCCL between LAD and TFWBC increases with the number of top critical links, reaching more than 80% in the top 30 for any degradation coefficient. In contrast, TTWBC shows low correlation with LAD, and its maximum PCCL is only 60%.
Spearman’s rank correlation coefficient is a statistical measure for assessing monotonic relationships between the elements of two sets, no matter if the relationships are linear or non-linear [40,41]. The function of ‘corr’ in MATLAB is adopted to calculate it for aggregated comparison of link criticality rankings by different indicators. The Spearman’s rank correlation coefficient takes values in the range of 1,1 . Similar to Almotahari and Kurmankhojayev [5,42], the strength of the correlation is categorized as follows: 0 to 0.19 very weak; 0.2 to 0.39 weak; 0.4 to 0.59 moderate; and 0.6 to 0.79 strong; and 0.8 to 1 very strong.
As the results shown in Figure 10, LAD has very strong correlations (0.92 to 0.97) with IS under all four scenarios. The correlations between LAD and other indicators are impacted by the degradation coefficient, especially for EI. For example, LAD shows negative very weak (−0.05) to positive very strong (0.85) correlations with EI, with changes of degradation coefficients from 0.2 to 0.8. Though both TTWBC and TFWBC are topological-based indicators weighted by link characteristics, the identified results are quite different. TTWBC shows very weak or weak correlations (0.14 to 0.35) with LAD and IS, while TFWBC shows strong or very strong correlations (0.69 to 0.86) with LAD and IS. Overall, the results imply that LAD gives a similar ranking to IS (four scenarios), TFWBC (four scenarios), and EI (scenarios with θ = 0.6 and 0.8), which demonstrates the flexibility and effectiveness of LAD.

4. Conclusions

In this study, we extend the problem of link criticality identification to the scenario of degradable road networks, in which link capacity degradation occurs across the entire network. In this scenario, we build a LAR-based UE model to capture travelers’ responses to link failures and estimate various indicators, including LAD, EI, IS, TTWBC, and TFWBC. Among these indicators, LAD is a network-wide traffic demand-based indicator, which overcomes the limitations of previous traffic demand-based indicators that cannot evaluate the impact of link failures on connected OD pairs. To verify the validity of LAD, we conduct numerical experiments on two classical benchmark networks under different levels of traffic demand and degradation. The results show LAD has good features to evaluate the impact of link failures and identify critical links. (1) It identifies high-frequency critical links at most times in the ND network among the five indicators, (2) it can well overcome disconnectivity issues and identify special critical combinations, which are overlooked by other indicators, and (3) it has strong or very strong correlations with IS and TFWBC in the Sioux Falls city network.
Furthermore, the LAD indicator provides new insights to traffic managers and planners to reduce disaster risk. Traditional traffic-based indicators such as TTT, IS, and EI, which are related to travel time, assume that travelers can accurately perceive changes in travel time. However, the theory of bounded rationality suggests that travelers can tolerate fluctuations in travel time within a certain range [43,44]. It is only when these fluctuations exceed a specific threshold that travelers will be affected. The indicator of LAD embodies this concept, suggesting that only delays causing travelers to arrive late have a negative impact on them. As indicated in Figure 6, the results of LAD suggest that delays concentrated around certain nodes have a more negative impact on travelers compared to delays being evenly distributed across the network. Therefore, managers and planners need to weigh the impact of traffic delay distribution comprehensively.
The failure of critical links can significantly impact travel time, efficiency, and demand in the road network. Identifying critical links and developing targeted strategies can help improve the resilience and reliability of the network, reduce congestion, and enhance efficiency, thereby promoting sustainable transportation development. Specifically, it can help optimize resource allocation, such as by formulating more effective road maintenance decisions and prioritizing repairs and upgrades for critical links to reduce the occurrence and impact of traffic accidents [45]. It can also help develop traffic control strategies for critical links within a region to ensure efficient traffic operations [46]. In summary, identifying critical links provides managers with a more scientific understanding of link criticality, directly assisting them in making informed management decisions.
Some limitations of this study deserve further research. First, we only tested the effectiveness of LAD in road networks; multi-modal transportation networks can be considered in the future [47]. Second, the LAD is a traffic-based indicator, and the full-scan method can be only used in the small-scale and medium-scale networks. Three potential approaches can be used to extend the indicators to large-scale networks, including (1) using the “impact area” vulnerability analysis method to select an appropriate impact area for analysis [4]; (2) adopting parallel computing techniques to simultaneously estimate the cost of each OD path and calculate the criticality of each link [48]; and (3) conducting sampling analysis by selecting representative ODs and paths instead of all ODs and paths [49]. Last, we can extend the network-wide traffic-demand indicator to transportation network design problems, which could help planners make road construction plans.

Author Contributions

Conceptualization, Q.T. and H.H.; methodology, Q.T.; software, Q.T.; validation, H.H., X.L. and Z.Z.; formal analysis, H.H. and C.J.; data curation, Q.T. and C.J.; writing—original draft preparation, Q.T.; writing—review and editing, H.H., X.L. and Z.Z.; supervision, Z.Z.; funding acquisition, Q.T. All authors have read and agreed to the published version of the manuscript.

Funding

This research was funded by the Project of Chongqing Social Science Planning (grant number 2022BS082), the Science and Technology Research Program of Chongqing Municipal Education Commission (grant number KJQN202100715), the Annual Research & Development Program of Shenzhen General Integrated Transportation And Municipal Engineering Design & Research Institute Co., Ltd. (TQJG20240108FW0005), and the Project of Chongqing Construction Technology Plan (the management service platform of urban dynamic and static traffic integration).

Institutional Review Board Statement

Not applicable.

Informed Consent Statement

Not applicable.

Data Availability Statement

The data can be shared by request.

Conflicts of Interest

Author H.H. and X.L. were employed by Shenzhen General Integrated Transportation and Municipal Engineering Design & Research Institute Co., Ltd., and C.J. was employed by Chongqing Urban Investment Gold Card Information Industry (Group) Co., Ltd. The remaining authors declare that the research was conducted in the absence of any commercial or financial relationships that could be construed as a potential conflict of interest. The authors declare that this study received funding from Annual Research & Development Program of Shenzhen General Integrated Transportation and Municipal Engineering Design & Research Institute Co., Ltd. (TQJG20240108FW0005) and the Project of Chongqing Construction Technology Plan (the management service platform of urban dynamic and static traffic integration). The funders were not involved in the study design, collection, analysis, interpretation of data, writing of this article, or decision to submit it for publication.

References

  1. Ye, Q.; Kim, H. Assessing Network Vulnerability Using Shortest Path Network Problems. J. Transp. Saf. Secur. 2019, 13, 1–25. [Google Scholar] [CrossRef]
  2. Wang, S.; Chen, C.; Zhang, J.; Gu, X.; Huang, X. Vulnerability Assessment of Urban Road Traffic Systems Based on Traffic Flow. Int. J. Crit. Infrastruct. Prot. 2022, 38, 100536. [Google Scholar] [CrossRef]
  3. Takhtfiroozeh, H.; Golias, M.; Mishra, S. Topological-Based Measures with Flow Attributes to Identify Critical Links in a Transportation Network. Transp. Res. Rec. 2021, 2675, 863–875. [Google Scholar] [CrossRef]
  4. Chen, B.Y.; Lam, W.H.K.; Sumalee, A.; Li, Q.; Li, Z.-C. Vulnerability Analysis for Large-Scale and Congested Road Networks with Demand Uncertainty. Transp. Res. Part A Policy Pract. 2012, 46, 501–516. [Google Scholar] [CrossRef]
  5. Almotahari, A.; Yazici, A. A Computationally Efficient Metric for Identification of Critical Links in Large Transportation Networks. Reliab. Eng. Syst. Saf. 2021, 209, 107458. [Google Scholar] [CrossRef]
  6. Almotahari, A.; Yazici, M.A. A Link Criticality Index Embedded in the Convex Combinations Solution of User Equilibrium Traffic Assignment. Transp. Res. Part A Policy Pract. 2019, 126, 67–82. [Google Scholar] [CrossRef]
  7. Nagurney, A.; Qiang, Q. A Network Efficiency Measure with Application to Critical Infrastructure Networks. J. Glob. Optim. 2008, 40, 261–275. [Google Scholar] [CrossRef]
  8. Li, F.; Jia, H.; Luo, Q.; Li, Y.; Yang, L. Identification of Critical Links in a Large-Scale Road Network Considering the Traffic Flow Betweenness Index. PLoS ONE 2020, 15, e0227474. [Google Scholar] [CrossRef]
  9. Sullivan, J.L.; Novak, D.C.; Aultman-Hall, L.; Scott, D.M. Identifying Critical Road Segments and Measuring System-Wide Robustness in Transportation Networks with Isolating Links: A Link-Based Capacity-Reduction Approach. Transp. Res. Part A Policy Pract. 2010, 44, 323–336. [Google Scholar] [CrossRef]
  10. Jenelius, E.; Petersen, T.; Mattsson, L.-G. Importance and Exposure in Road Network Vulnerability Analysis. Transp. Res. Part A Policy Pract. 2006, 40, 537–560. [Google Scholar] [CrossRef]
  11. Sohouenou, P.Y.R.; Neves, L.A.C.; Christodoulou, A.; Christidis, P.; Lo Presti, D. Using a Hazard-Independent Approach to Understand Road-Network Robustness to Multiple Disruption Scenarios. Transp. Res. Part D Transp. Environ. 2021, 93, 102672. [Google Scholar] [CrossRef]
  12. Jin, K.; Wang, W.; Li, X.; Hua, X.; Chen, S.; Qin, S. Identifying the Critical Road Combination in Urban Roads Network under Multiple Disruption Scenarios. Phys. A Stat. Mech. Its Appl. 2022, 607, 128192. [Google Scholar] [CrossRef]
  13. Xin, C.U.I.; Qingchang, L.U.; Jianyu, L.I. Key Station Identification of Urban Rail Transit Based on Network Redundancy. China Saf. Sci. J. 2022, 32, 158. [Google Scholar] [CrossRef]
  14. Jin, K.; Wang, W.; Li, X.; Chen, S.; Qin, S.; Hua, X. Cascading Failure in Urban Rail Transit Network Considering Demand Variation and Time Delay. Phys. A Stat. Mech. Its Appl. 2023, 630, 129290. [Google Scholar] [CrossRef]
  15. Ou, J.; Sun, J.; Zhu, Y.; Jin, H.; Liu, Y.; Zhang, F.; Huang, J.; Wang, X. STP-TrellisNets+: Spatial-Temporal Parallel TrellisNets for Multi-Step Metro Station Passenger Flow Prediction. IEEE Trans. Knowl. Data Eng. 2022, 35, 7526–7540. [Google Scholar] [CrossRef]
  16. Wang, D.Z.W.; Liu, H.; Szeto, W.Y.; Chow, A.H.F. Identification of Critical Combination of Vulnerable Links in Transportation Networks—A Global Optimisation Approach. Transp. A Transp. Sci. 2016, 12, 346–365. [Google Scholar] [CrossRef]
  17. Gu, Y.; Fu, X.; Liu, Z.; Xu, X.; Chen, A. Performance of Transportation Network under Perturbations: Reliability, Vulnerability, and Resilience. Transp. Res. Part E Logist. Transp. Rev. 2020, 133, 101809. [Google Scholar] [CrossRef]
  18. Wang, A.; Tang, Y.; Mohmand, Y.T.; Xu, P. Modifying Link Capacity to Avoid Braess Paradox Considering Elastic Demand. Phys. A Stat. Mech. Its Appl. 2022, 605, 127951. [Google Scholar] [CrossRef]
  19. Almotahari, A.; Yazici, A. Impact of Topology and Congestion on Link Criticality Rankings in Transportation Networks. Transp. Res. Part D Transp. Environ. 2020, 87, 102529. [Google Scholar] [CrossRef]
  20. Lo, H.K.; Luo, X.W.; Siu, B.W.Y. Degradable Transport Network: Travel Time Budget of Travelers with Heterogeneous Risk Aversion. Transp. Res. Part B Methodol. 2006, 40, 792–806. [Google Scholar] [CrossRef]
  21. Sun, Y.; Wang, S.; Xu, X.; Shen, L. Identification of Critical Links Based on the Optimal Reliable Path in Stochastic Traffic Networks. PLoS ONE 2024, 19, e0301272. [Google Scholar] [CrossRef] [PubMed]
  22. Di, Z.; Yang, L.; Qi, J.; Gao, Z. Transportation Network Design for Maximizing Flow-Based Accessibility. Transp. Res. Part B Methodol. 2018, 110, 209–238. [Google Scholar] [CrossRef]
  23. Zhang, Y.; Khani, A. Identifying Critical Links in Transportation Network Design Problems for Maximizing Network Accessibility. Transp. Res. Rec. 2020, 2674, 237–251. [Google Scholar] [CrossRef]
  24. Song, M.; Cheng, L.; Du, M.; Sun, C.; Ma, J.; Ge, H. Charging Station Location Problem for Maximizing the Space-Time-Electricity Accessibility: A Lagrangian Relaxation-Based Decomposition Scheme. Expert Syst. Appl. 2023, 222, 119801. [Google Scholar] [CrossRef]
  25. Zannat, K.; Choudhury, C.F.; Hess, S. Modeling Departure Time Choice of Car Commuters in Dhaka, Bangladesh. Transp. Res. Rec. 2022, 2676, 247–262. [Google Scholar] [CrossRef]
  26. Gore, N.; Arkatkar, S.; Joshi, G.; Antoniou, C. Modified Bureau of Public Roads Link Function. Transp. Res. Rec. J. Transp. Res. Board 2023, 2677, 966–990. [Google Scholar] [CrossRef]
  27. Ma, J.; Li, D.; Cheng, L.; Lou, X.; Sun, C.; Tang, W. Link Restriction: Methods of Testing and Avoiding Braess Paradox in Networks Considering Traffic Demands. J. Transp. Eng. Part A Syst. 2018, 144, 04017076. [Google Scholar] [CrossRef]
  28. Zhang, R.; Yao, E.; Yang, Y. Degradable Transportation Network with the Addition of Electric Vehicles: Network Equilibrium Analysis. PLoS ONE 2017, 12, e0184693. [Google Scholar] [CrossRef]
  29. Zang, Z.; Xu, X.; Qu, K.; Chen, R.; Chen, A. Travel Time Reliability in Transportation Networks: A Review of Methodological Developments. Transp. Res. Part C Emerg. Technol. 2022, 143, 103866. [Google Scholar] [CrossRef]
  30. Wang, L.; Zhao, L.; Hu, X.; Zhao, X.; Wang, H. A Reliability-Based Traffic Equilibrium Model with Boundedly Rational Travelers Considering Acceptable Arrival Thresholds. Sustainability 2023, 15, 6988. [Google Scholar] [CrossRef]
  31. Wang, D.; Liao, F.; Gao, Z.; Timmermans, H. A Generalized Mean-Variance Metric of Route Choice Model under Travel Time Uncertainty. Transp. A Transp. Sci. 2022, 18, 299–323. [Google Scholar] [CrossRef]
  32. Sun, C.; Cheng, L.; Ma, J. Travel Time Reliability with Boundedly Rational Travelers. Transp. A Transp. Sci. 2018, 14, 210–229. [Google Scholar] [CrossRef]
  33. Tu, Q.; Cheng, L.; Li, D.; Ma, J.; Sun, C. Stochastic Transportation Network Considering ATIS with the Information of Environmental Cost. Sustainability 2018, 10, 3861. [Google Scholar] [CrossRef]
  34. Tu, Q.; Li, M.; Wu, Y. A Reliability-Based Network Equilibrium Model with Electric Vehicles and Gasoline Vehicles. Promet-Traffic Transp. 2024, 36, 83–99. [Google Scholar] [CrossRef]
  35. Tu, Q.; Cheng, L.; Li, D.; Ma, J.; Sun, C. Traffic Paradox Under Different Equilibrium Conditions Considering Elastic Demand. Promet-Traffic Transp. 2019, 31, 1–9. [Google Scholar] [CrossRef]
  36. Yen, J.Y. Finding the K Shortest Loopless Paths in a Network. Manag. Sci. 1971, 17, 712–716. [Google Scholar] [CrossRef]
  37. Ma, J.; Zhu, Y.; Chen, D.; Zhang, C.; Song, M.; Zhang, H.; Chen, J.; Zhang, K. Analysis of Urban Electric Vehicle Adoption Based on Operating Costs in Urban Transportation Network. Systems 2023, 11, 149. [Google Scholar] [CrossRef]
  38. Bonett, D.G.; Wright, T.A. Sample Size Requirements for Estimating Pearson, Kendall and Spearman Correlations. Psychometrika 2000, 65, 23–28. [Google Scholar] [CrossRef]
  39. Schober, P.; Boer, C.; Schwarte, L.A. Correlation Coefficients: Appropriate Use and Interpretation. Anesth. Analg. 2018, 126, 1763. [Google Scholar] [CrossRef]
  40. Spearman, C. The Proof and Measurement of Association between Two Things. In Studies in Individual Differences: The Search for Intelligence; Appleton-Century-Crofts: East Norwalk, CT, USA, 1961; p. 58. [Google Scholar]
  41. Myers, J.L.; Well, A.D.; Lorch, R.F., Jr. Research Design and Statistical Analysis: Third Edition, 3rd ed.; Routledge: New York, NY, USA, 2010; ISBN 978-0-203-72663-1. [Google Scholar]
  42. Kurmankhojayev, D.; Li, G.; Chen, A. Link Criticality Index: Refinement, Framework Extension, and a Case Study. Reliab. Eng. Syst. Safe 2024, 243, 109889. [Google Scholar] [CrossRef]
  43. Di, X.; Liu, H.X. Boundedly Rational Route Choice Behavior: A Review of Models and Methodologies. Transp. Res. Part B Methodol. 2016, 85, 142–179. [Google Scholar] [CrossRef]
  44. Wang, Z.; Ge, H.; Cheng, R. An Extended Macro Model Accounting for the Driver’s Timid and Aggressive Attributions and Bounded Rationality. Phys. A Stat. Mech. Its Appl. 2020, 540, 122988. [Google Scholar] [CrossRef]
  45. Yang, G.; Zhang, Y.; Hang, J.; Feng, X.; Xie, Z.; Zhang, D.; Yang, Y. CARPG: Cross-City Knowledge Transfer for Traffic Accident Prediction via Attentive Region-Level Parameter Generation. In Proceedings of the 32nd ACM International Conference on Information and Knowledge Management, Birmingham, UK, 21–25 October 2023; ACM: New York, NY, USA; pp. 2939–2948. [Google Scholar]
  46. Li, M.; Yu, X.; Fei, J.; Jin, X.; Bai, W.; Yao, Z. Regional Traffic Congestion Coordination Control Based on Critical Links. Phys. A Stat. Mech. Its Appl. 2024, 647, 129913. [Google Scholar] [CrossRef]
  47. Du, M.; Jiang, X.; Chen, A. Identifying Critical Links Using Network Capacity-Based Indicator in Multi-Modal Transportation Networks. Transp. B Transp. Dyn. 2022, 10, 1126–1150. [Google Scholar] [CrossRef]
  48. Chen, X.; Liu, Z.; Zhang, K.; Wang, Z. A Parallel Computing Approach to Solve Traffic Assignment Using Path-Based Gradient Projection Algorithm. Transp. Res. Part C Emerg. Technol. 2020, 120, 102809. [Google Scholar] [CrossRef]
  49. Almotahari, A.; Yazici, A. Practice Friendly Metric for Identification of Critical Links in Road Networks. Transp. Res. Rec. 2020, 2674, 219–229. [Google Scholar] [CrossRef]
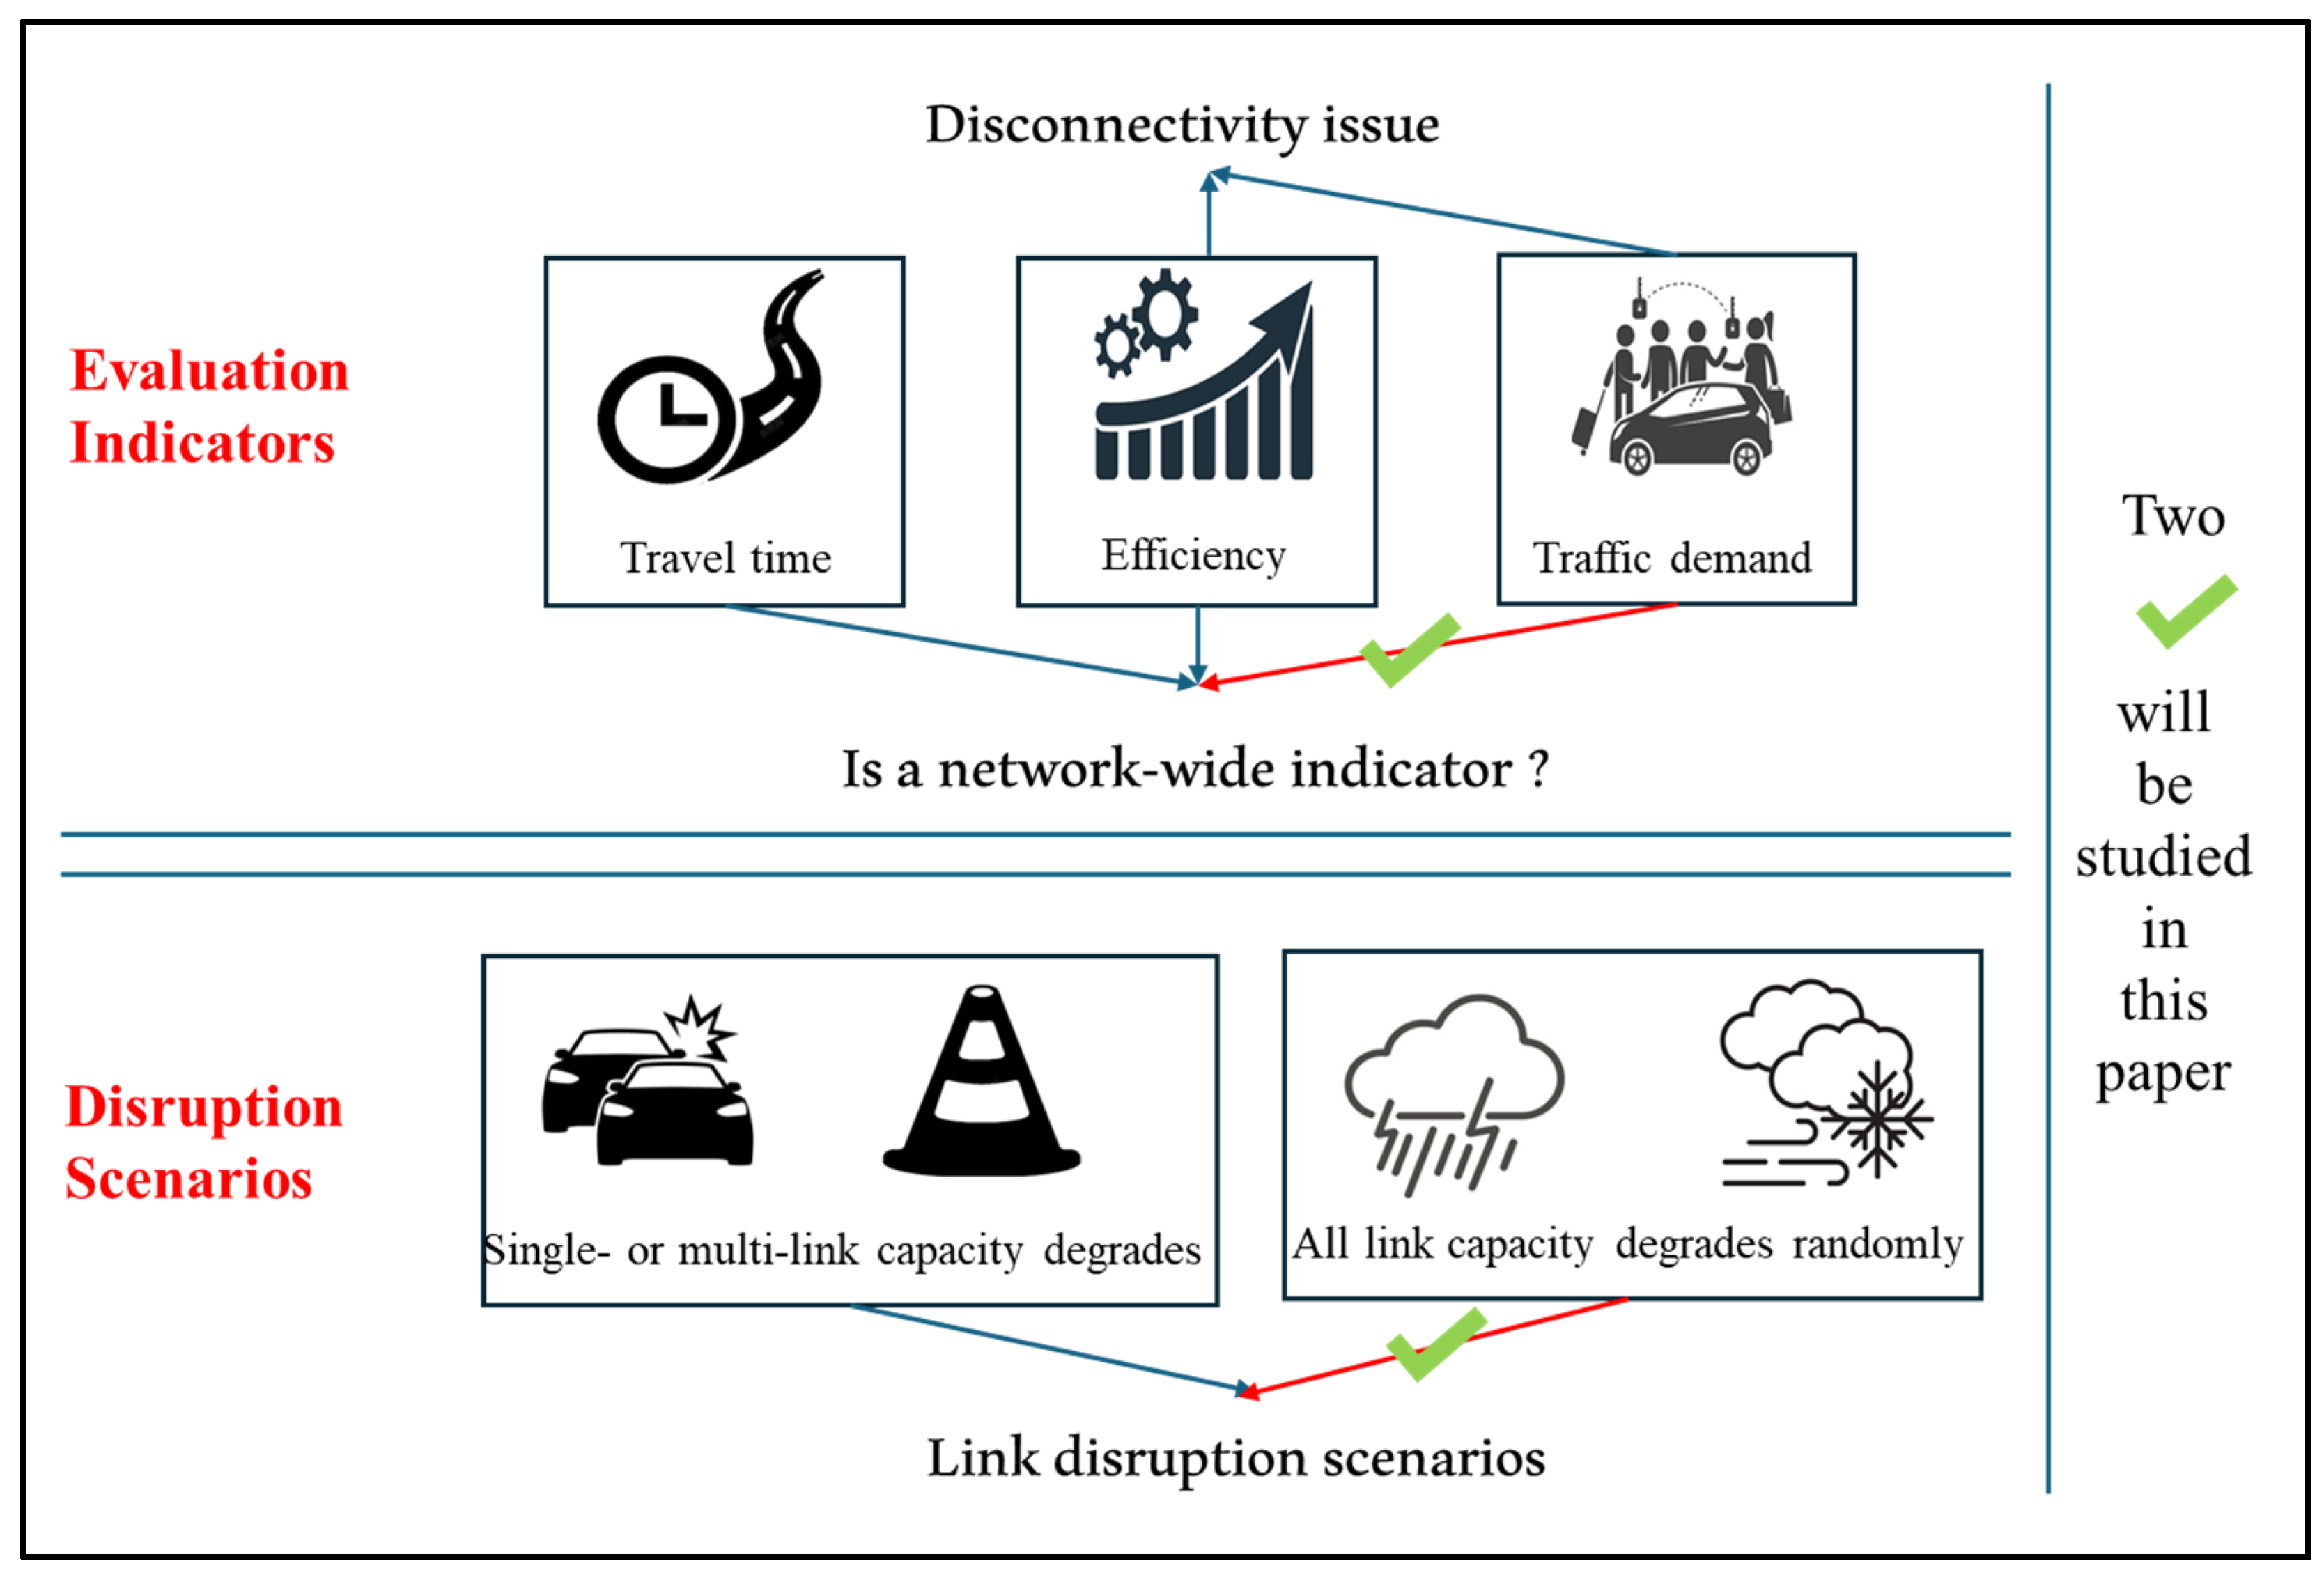
Figure 1. Two main issues motivate this study.
Sustainability 16 08020 g001
Figure 2. How LAD evaluates the impact of link disruptions.
Sustainability 16 08020 g002
Figure 3. The sample network.
Sustainability 16 08020 g003
Figure 4. The flowchart of identifying critical links by various indicators.
Sustainability 16 08020 g004
Figure 5. Nguyen–Dupuis network.
Sustainability 16 08020 g005
Figure 6. SD of path travel time varies with OD demand under different degradation levels.
Sustainability 16 08020 g006
Figure 7. The effective network topology after failures of link combinations: (a) failures of link combination (2,5); (b) failures of link combination (13,14); and (c) failures of link combination (1,11).
Sustainability 16 08020 g007
Figure 8. Sioux Falls city network: (a) real city; (b) road network.
Sustainability 16 08020 g008
Figure 9. Results of PCCL with LAD as a benchmark.
Sustainability 16 08020 g009
Figure 10. Results of Spearman’s rank correlation with different degradation coefficients: (a) θ = 0.2 ; (b) θ = 0.4 ; (c) θ = 0.6 ; and (d) θ = 0.8 .
Sustainability 16 08020 g010
Table 1. Link criticality rankings by various indicators.
UDTTTEILAD
Link RankUD ValueLink RankTTT ValueLink RankEI
Value
Link RankLAD Value
21002 100   M + 2500222115.87
41004 100   M + 200042.54101.27
103450034.5317.14
30140001512.54
Table 2. The formulations of five indicators.
IndicatorFormulationVariable Description
LAD L A D = w p f p w R p w R p w   is   the   late   arrival   rate   of   path   p   for   OD   w ;
f p w   is   the   traffic   flow   of   path   p .
EI E I = w p f p w / μ p W f p w   is   the   traffic   flow   of   path   p ;
μ p   is   the   expected   travel   time   of   path   p ;
W is the number of OD pairs.
IS I S 1 = T C a T C w q w
I S 2 = w W ¯ q w
I S 1   works   when   all   ODs   are   connected ,   I S 2 works when disconnected ODs exist.
T C = a A f a t a is the expected total travel time of the road network.
T C a   is   the   expected   total   travel   time   of   the   road   network   after   removing   link   a .
q w   is   the   traffic   demand   for   OD   w .
W ¯ is the set of disconnected OD pairs.
TTWBC T T W B C = μ a w τ a w τ w μ a   is   the   expected   travel   time   of   link   a ;
τ a w   is   the   number   of   used   paths   ( paths   whose   f p w > 0 )   passing   link   a   for   OD   w ;
τ w   is   the   number   of   used   paths   for   OD   w .
TFWBC T F W B C = f a w τ a w τ w f a   is   the   traffic   flow   of   link   a .
Table 3. Results of the LAR-based UE model with various levels of OD demand and degradation.
Degradation LevelsODPath No.Sequence of LinksLow-Level
Demand
Medium-Level
Demand
High-Level
Demand
LARPath FlowLARPath FlowLARPath Flow
Low-level1–311–5–7–10–160.124 200 0.121 328 0.120 508
21–6–13–190.185 0 0.121 72 0.120 92
32–17–7–10–160.238 0 0.204 0 0.196 0
41–5–8–14–160.458 0 0.310 0 0.134 0
51–6–12–14–160.511 0 0.320 0 0.127 0
62–17–8–14–160.631 0 0.440 0 0.217 0
4–273–5–7–9–110.123 200 0.119 338 0.120 305
83–5–7–10–150.202 0 0.119 62 0.135 0
94–12–14–150.389 0 0.138 0 0.120 295
103–5–8–14–150.579 0 0.298 0 0.150 0
113–6–12–14–150.630 0 0.307 0 0.143 0
Medium-level1–311–5–7–10–160.1242000.1383400.185135
21–6–13–190.17100.138600.18519
32–17–7–10–160.23400.22200.1910
41–5–8–14–160.43600.22700.185123
51–6–12–14–160.48300.22900.185323
62–17–8–14–160.60600.34700.1900
4–273–5–7–9–110.1242000.1502330.203163
83–5–7–10–150.19300.15030.203280
94–12–14–150.35200.1501640.203157
103–5–8–14–150.54500.24300.2050
113–6–12–14–150.59100.24500.2060
High-level1–311–5–7–10–160.178 168 0.384 250 0.468 260
21–6–13–190.178 32 0.384 5 0.468 14
32–17–7–10–160.264 0 0.385 0 0.468 108
41–5–8–14–160.288 0 0.384 75 0.468 184
51–6–12–14–160.300 0 0.384 19 0.468 27
62–17–8–14–160.425 0 0.384 51 0.468 7
4–273–5–7–9–110.209 120 0.390 81 0.466 199
83–5–7–10–150.209 6 0.390 15 0.466 20
94–12–14–150.209 74 0.390 74 0.466 91
103–5–8–14–150.337 0 0.390 3 0.466 33
113–6–12–14–150.350 0 0.390 226 0.466 257
Table 4. Link criticality rankings under different degradation levels.
Degradation LevelsLADEIISTTWBCTFWBC
Link No.ValueLink No.ValueLink No.ValueLink No.ValueLink No.Value
Low-level11720.13 119.02 117.04 1119.42 111107.52
16562.01 139.78 163.99 1917.31 51091.70
1491.76 199.78 13.87 1815.38 71091.70
13457.70 169.81 133.59 1314.73 13708.26
19457.70 19.83 193.59 414.13 19708.26
Medium-level111000.39 117.64 1613.45 420.68 11843.72
4802.32 168.19 1113.17 1119.57 4752.00
13776.76 48.26 49.52 1918.64 13689.20
19776.76 138.36 19.45 1316.75 19689.20
16733.90 198.36 138.54 1816.12 5672.60
High-level111086.35 112.54 16168.18 1327.97 5825.76
131073.83 132.87 11116.52 426.77 1615.09
191073.83 192.87 193.63 1924.52 4568.10
21047.05 143.25 1393.13 1123.28 14538.78
141032.26 43.42 1993.13 1422.19 7528.74
Table 5. Link criticality rankings under different demand levels.
Demand LevelsLADEIISTTWBCTFWBC
Link No.ValueLink No.ValueLink No.ValueLink No.ValueLink No.Value
Low-level11257.72 115.15 114.28 1121.49 51002.06
13200.25 135.38 132.70 414.02 71002.06
19200.25 195.38 192.70 513.05 11799.18
7193.47 75.39 72.65 712.84 1301.85
5174.41 25.45 52.16 1911.05 9301.23
Medium-level111000.39 117.64 1613.45 420.68 11843.72
4802.32 168.19 1113.17 1119.57 4752.00
13776.76 48.26 49.52 1918.64 13689.20
19776.76 138.36 19.45 1316.75 19689.20
16733.90 198.36 138.54 1816.12 5672.60
High-level112006.56 116.32 1676.66 1020.83 51665.17
131920.29 136.95 1153.80 1119.66 71237.17
191920.29 196.95 143.10 418.89 11111.02
141781.56 47.82 1342.79 517.29 16825.57
21763.59 147.99 1942.79 1615.14 11758.70
Table 6. Combined-link criticality rankings under different degradation levels.
RankingLADEIIS1IS2
Two-LinksValueTwo-LinksValueTwo-LinksValueTwo-LinksValue
1(2,5)1511.86(13,14)4.18(1,11)143.87(1,2)800
2(11,13)1425.44(14,19)4.18(1,18)132.85(3,4)800
3(11,19)1425.44(11,14)4.20(13,14)127.22(11,15)800
4(2,7)1415.45(11,13)4.28(14,19)127.22(13,16)800
5(7,11)1415.45(11,19)4.28(2,15)97.20(16,19)800
6(7,18)1415.45(2,5)4.73(15,18)95.72(1,16)400
7(10,11)1415.45(1,11)4.80(11,13)74.59(1,17)400
8(11,14)1393.98(11,15)5.24(11,19)74.59(3,12)400
9(2,13)1339.54(13,16)5.29(11,14)73.38(3,14)400
10(2,19)1339.54(16,19)5.29(7,13)48.53(3,15)400
11(4,11)1332.72(1,2)5.39(7,19)48.53(5,12)400
12(11,16)1286.34(1,18)5.43(2,5)45.69(5,14)400
13(4,6)1262.99(2,15)5.55(4,16)29.27(5,15)400
14(12,13)1262.99(7,13)5.65(4,11)28.31(6,16)400
15(12,19)1262.99(7,19)5.65(2,7)27.85(7,14)400
16(2,4)1261.89(3,4)5.67(7,11)27.85(7,15)400
17(5,13)1261.43(15,18)5.71(7,18)27.85(9,15)400
Disclaimer/Publisher’s Note: The statements, opinions and data contained in all publications are solely those of the individual author(s) and contributor(s) and not of MDPI and/or the editor(s). MDPI and/or the editor(s) disclaim responsibility for any injury to people or property resulting from any ideas, methods, instructions or products referred to in the content.