
Impacts of Land Use Changes on Landscape Patterns and Ecosystem Service Values in Counties (Villages) in Ethnic Regions of China: A Case Study of Jianghua Yao Autonomous County, Hunan Province


 and
and
Abstract
1. Introduction
2. Study Area and Data Sources
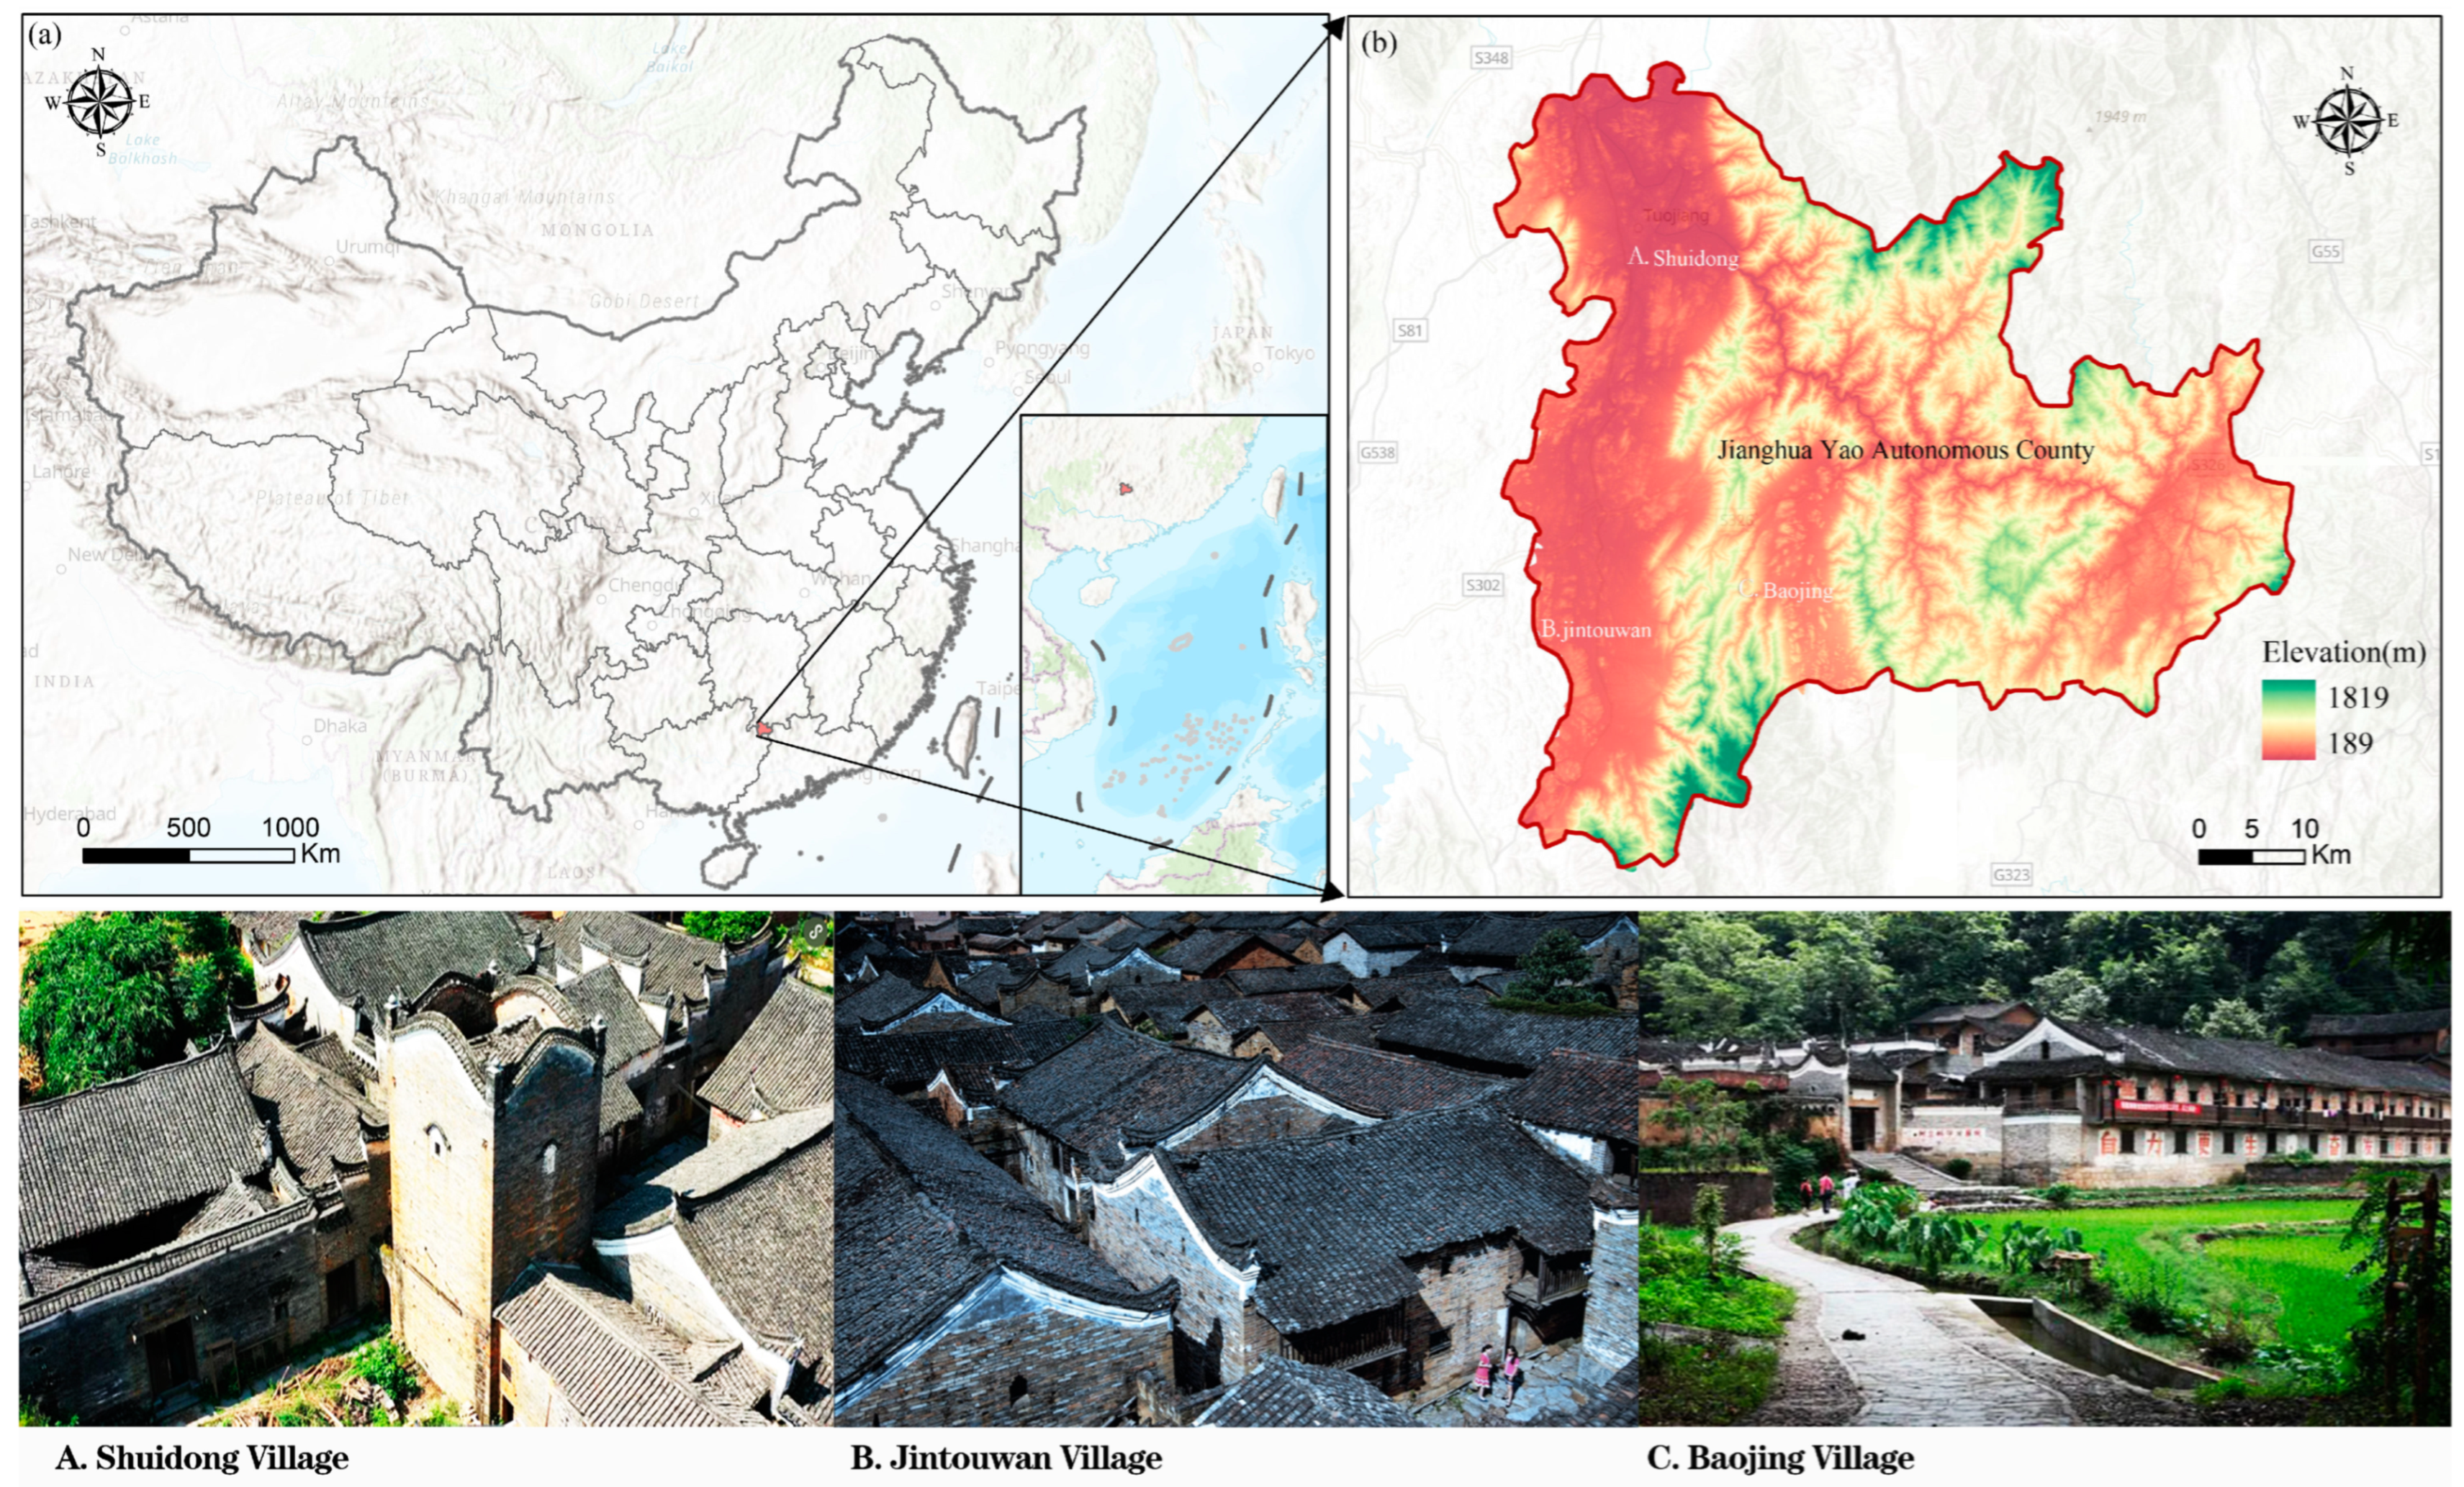
2.1. Overview of the Study Area
2.2. Data Sources and Preprocessing
- Land Use Data: Land cover data from 1985 to 2019 were sourced from open-access data published by Yang Jie et al. at Wuhan University [22], with a spatial resolution of 30 m. These data were used for LUCC monitoring and studies on ecosystem responses.
- Meteorological Data: These data were primarily used for regional land use multi-scenario simulation and prediction, including temperature and precipitation data from the National Earth System Science Data Center (http://www.geodata.cn, accessed on 15 March 2024) for the years 2010 and 2020, with a spatial resolution of 1 km. Precipitation data were measured in 0.1 mm units and temperature data in 0.1 °C units. These were processed into annual averages using ArcGIS.
- Population and GDP Distribution Data: These data were mainly used for regional land use multi-scenario simulation and prediction. Population distribution data were sourced from Popworld (https://www.worldpop.org/, accessed on 15 March 2024) and GDP data from the Resource and Environment Data Center of the Chinese Academy of Sciences (https://www.resdc.cn/, accessed on 16 March 2024). Data for the years 2010 and 2020 were selected, with a spatial resolution of 1 km. Missing values were filled using the raster calculator.
- DEM Data: DEM data were available for the years 2009 and 2020. The 2009 DEM data were sourced from the Geospatial Data Cloud (https://www.gscloud.cn/search, accessed on 5 April 2024) and the 2020 DEM data from NASA (https://lpdaac.usgs.gov/news/release-nasadem-data-products/, accessed on 5 April 2024), both with a spatial resolution of 30 m. These were resampled to 1 km, and slope and aspect data were extracted using ArcGIS.
- Other Data: Distance to various levels of roads and distance to rivers of grade three and above were vector data sourced from the Geospatial Remote Sensing Ecological Network (http://www.gisrs.cn/, accessed on 17 March 2024). These were converted to raster data using the Euclidean distance method in ArcGIS.
3. Analysis Methods
3.1. Land Use Scenario Prediction
- (1)
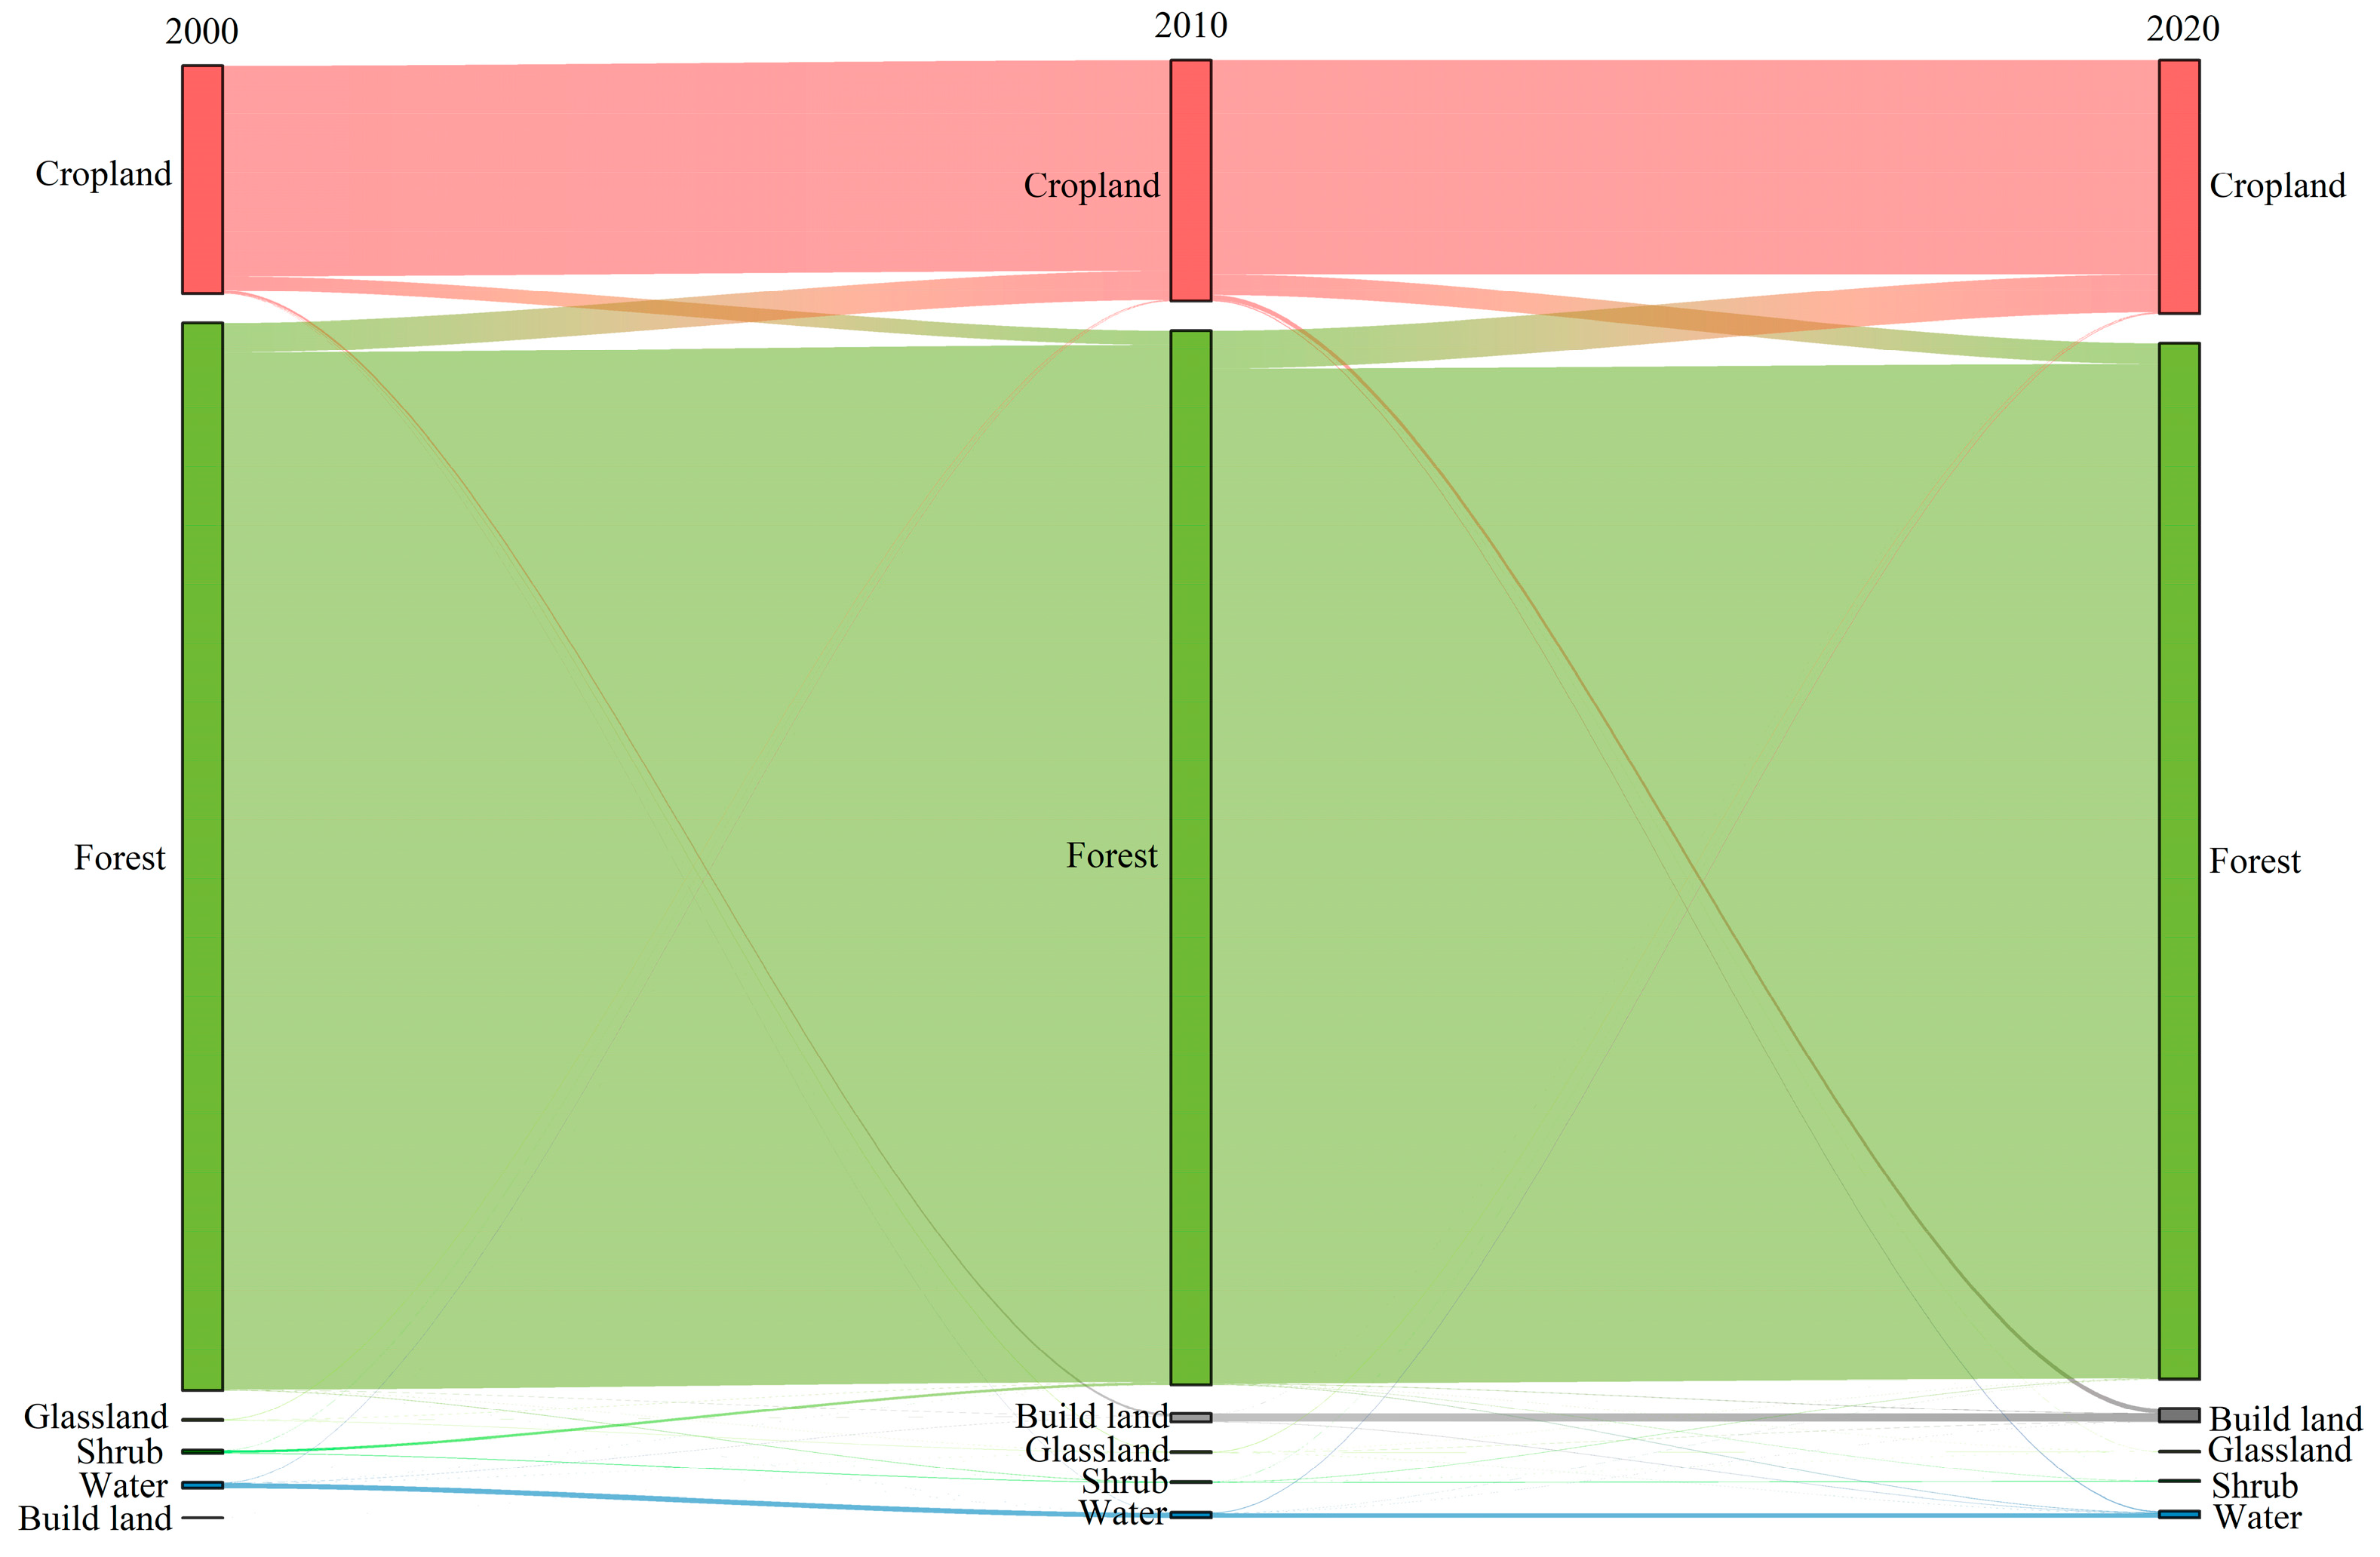
- Historical Data Analysis and Modeling: We analyzed land use data from 2000, 2010, and 2020 to construct a land use transition matrix using the Markov model. This matrix quantified the conversion relationships among different land use types and provided transition probabilities across years. These probabilities allowed us to estimate the future changes in land use types for the year 2030 under a natural development scenario.
- (2)
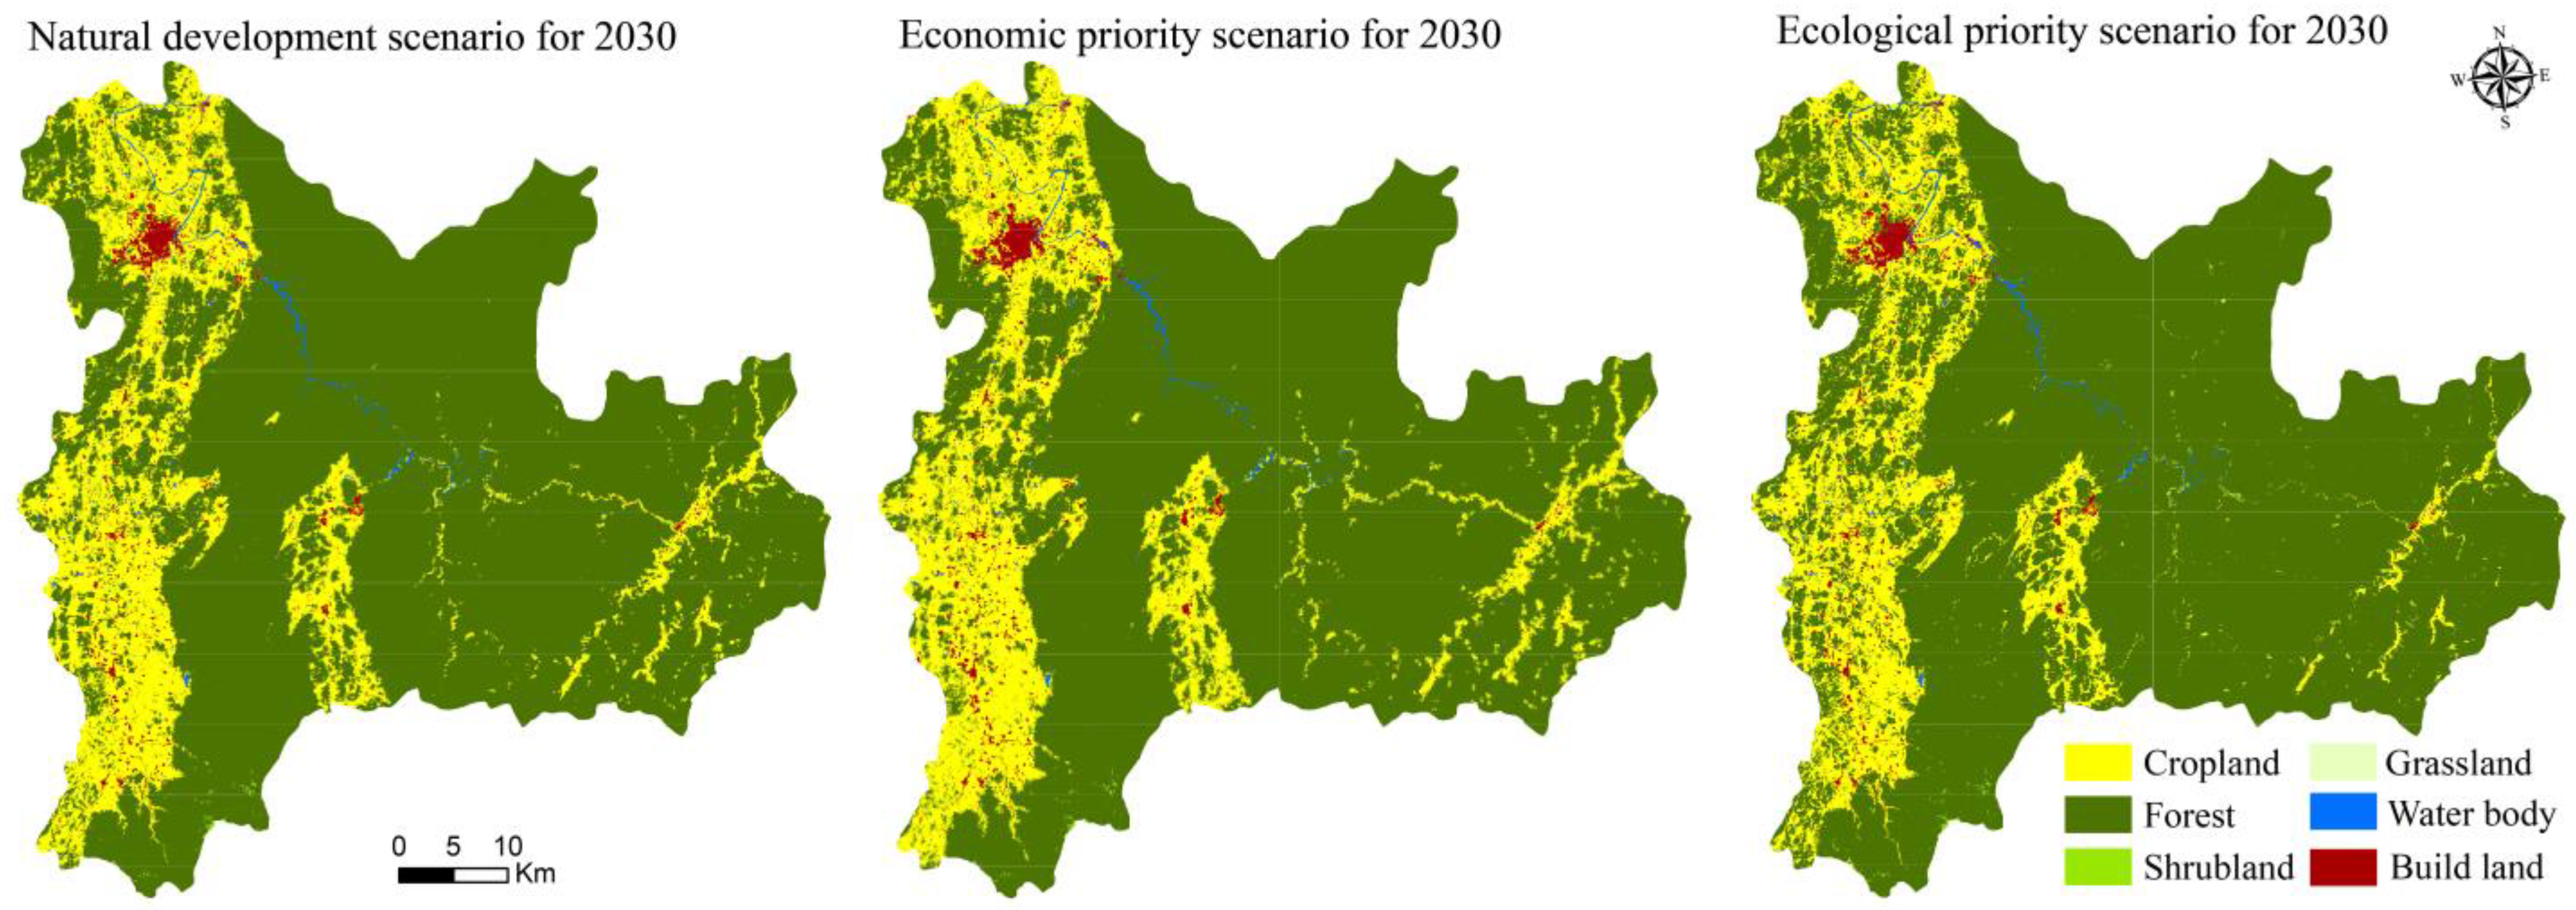
- Setting Future Pixel Numbers: For the natural development scenario, the FLUS model was used to predict the future pixel numbers for each land use type in 2030 based on historical spatial trends and transition probabilities. For the economic development priority and ecological protection priority scenarios, the future pixel numbers were adjusted according to different policy directions. Specifically, in the economic development priority scenario, the future pixel numbers for arable land and built-up areas were increased, while those for forests and grasslands were decreased. Conversely, in the ecological protection priority scenario, future pixel numbers for forests and water bodies were increased, with a corresponding reduction in arable land and built-up areas.
- (3)
- Scenario Simulation and Adjustment: After setting the initial future pixel numbers, we iteratively adjusted the simulation results to ensure that the total land use amounts were reasonable for each scenario. For example, in the economic development priority scenario, we prioritized the demand for arable land and built-up areas while maintaining minimal protection areas for forests and grasslands. In the ecological protection priority scenario, although arable land expansion was minimized, we ensured that the minimum required arable land for regional food security was preserved.
- (4)
- Relation Between Future Pixel Numbers and Land Use Change Amounts: The total land use change amounts presented were directly derived from the FLUS model’s simulation results of future pixel numbers. These pixel numbers reflect spatial changes in land area for each land use type. For instance, reductions in grasslands and increases in arable land were achieved through adjustments in future pixel numbers, considering both spatial distribution and policy directions for each scenario. This approach ensured that the land use change amounts in each scenario were scientifically justified and accurately represented the projected changes.
3.2. Calculation of Landscape Pattern Indices
3.3. Ecosystem Services Valuation
4. Results and Analysis
4.1. Characteristics of Landscape Pattern Evolution
4.1.1. Characteristics of Landscape Area Change
4.1.2. Characteristics of Landscape Pattern Changes
- (1)
- Landscape Level Index Analysis
- (2)
- Landscape Type Level Index Analysis
4.2. Evolution of Ecosystem Service Value
4.2.1. Changes in Ecosystem Service Value
4.2.2. Ecosystem Service Functions and Values
4.3. Correlation Analysis between Landscape Pattern Indices and ESV
5. Strategies for Landscape Pattern Optimization Based on ESV Enhancement
- Overall Strategy: To achieve an overall increase in ESV, it is essential to balance ecological protection with economic development needs. Land use planning should adopt various measures to improve land use efficiency while protecting and restoring forests and water bodies and controlling the expansion rate and scale of urban and cropland areas [3]. Special attention should be given to protecting grasslands and shrubs to prevent encroachment by other land use types, thereby maintaining their ecological functions. Additionally, rational urban land layout planning, optimizing agricultural land structure, and promoting ecological agricultural technologies will help reduce environmental impacts and enhance the overall service functions of the regional ecosystem [30].
- Provisioning and Regulation Services: Expanding water areas through activities such as water sports or hot spring tourism can fully utilize the ESV of water bodies. Constructing ecological corridors [31], such as river corridors, green belts, and parks, can connect isolated ecological patches to form a complete ecological network, thereby enhancing the ecosystem’s regulatory capacity.
- Support Services: Protecting existing forests, restoring degraded ecosystems, and increasing green and shrub cover are crucial. Optimizing land use structure to improve landscape connectivity and stability will enhance the regional ecosystem service value. Additionally, developing agricultural experiences or rural tourism products unique to the Yao Autonomous County will help maintain landscape and natural environment diversity, supporting the core resources of tourism.
- Cultural Services: Attractive landscapes are the foundation for the development of tourism in the study area. Constructing aesthetically valuable hydrological and forest landscapes and integrating fragmented landscapes will enhance the overall beauty of Yao Autonomous County, thereby promoting tourism development.
6. Discussion and Conclusions
Author Contributions
Funding
Institutional Review Board Statement
Informed Consent Statement
Data Availability Statement
Acknowledgments
Conflicts of Interest
References
- Guiding Opinions of the State Ethnic Affairs Commission on Further Strengthening and Regulating the Protection and Development of Ethnic Minority Characteristic Villages and Towns in the New Era. Available online: https://www.neac.gov.cn/seac/xxgk/202012/1143669.shtml (accessed on 1 December 2018).
- Jia, Y.Y.; Tang, X.L.; Yang, Y.; Zhang, Z.R. Landscape Pattern Changes and Ecological Service Values in Wuhu Section Along the Yangtze River. J. Northwest For. Univ. 2019, 6, 249–258. [Google Scholar]
- Sun, R.H.; Sun, L.; Su, X.K.; Che, L.X. Coupling Research on Landscape Pattern and Ecological Process: Inheritance and Innovation. Acta Ecol. Sin. 2021, 41, 415–421. [Google Scholar]
- Killeen, T.J.; Calderon, V.; Soria, L.; Quezada, B.; Steininger, M.K.; Harper, G.; Solórzano, L.A.; Tucker, C.J.; Tian, Y.J.; Ma, G.X. Thirsty years of land-cover change in Bolivia. AMBIO A J. Hum. Environ. 2007, 7, 600–606. [Google Scholar] [CrossRef]
- Alphan, H.; Celik, N. Mapping spatial variation of land cover in a Coastal landscape using pattern metrics. Procedia Soc. Behavio. Sci. 2014, 120, 23–30. [Google Scholar] [CrossRef]
- Su, S.; Xiao, R.; Jiang, Z.; Zhang, Y. Characterizing landscape pattern and ecosystem service value changes for urbanization impacts at an eco-regional scale. Appl. Geogr. 2012, 34, 295–305. [Google Scholar] [CrossRef]
- Gu, J.W.; Guo, C.X.; Zhu, H.N.; Tan, Y.K.; Chen, H.Y. Landscape Pattern Evolution and Driving Forces Analysis of the Fengxi Provincial Nature Reserve in Guangdong Province. Ecol. Environ. Sci. 2024, 33, 222–230. [Google Scholar]
- Daily, G.C. Nature’s Services: Societal Dependence on Natural Ecosystem; Island Press: Washington, DC, USA; United Nations: Washington, DC, USA, 1997. [Google Scholar]
- Costanza, R.; d’Arge, R.; De Groot, R.; Farber, S.; Grasso, M.; Hannon, B.; Limburg, K.; Naeem, S.; O’Neill, R.V.; Paruelo, J.; et al. The value of the world’s ecosystem services and natural capital. Nature 1997, 387, 253–260. [Google Scholar] [CrossRef]
- Loomes, R.; O’Neill, K. Nature’s services: Societal dependence on natural ecosystems. Pac. Conserv. Biol. 2000, 6, 274. [Google Scholar] [CrossRef]
- Holmes, T.P.; Bergstrom, J.C.; Huszar, E.; Kask, S.B.; Orr, F., III. Contingent valuation, net marginal benefits, and the scale of riparian ecosystem restoration. Ecol. Econ. 2004, 49, 19–30. [Google Scholar] [CrossRef]
- Xie, G.D.; Zhen, L.; Lu, C.X.; Xiao, Y.; Chen, C. Expert Knowledge Based Valuation Method of Ecosystem Services in China. J. Nat. Resour. 2008, 5, 911–919. [Google Scholar]
- Xie, G.D.; Lu, C.X.; Leng, Y.F.; Zheng, D.; Li, S.C. Ecological assets valuation of the Tibetan Plateau. J. Nat. Resour. 2003, 5, 189–196. [Google Scholar]
- Yang, J.; Gao, F.; Xu, H.L.; Liu, K.; Han, F.H. Spatial and Temporal Evolution of Ecosystem Service Value and Its Driving Factors in the Aksu River Basin. Environ. Sci. 2024, 45, 3297–3307. [Google Scholar]
- Zhang, B.T.; Li, Z.X.; Feng, Q.; Lu, Z.X.; Zhang, B.J. Evolution of ecosystem service values in Qilian Mountains based on land-use change from 1990 to 2020. Acta Ecol. Sin. 2024, 10, 187–4202. [Google Scholar]
- Xie, G.D.; Zhang, C.X.; Zhang, L.M.; Chen, W.H.; Li, S.M. Improvement of the Evaluation Method for Ecosystem Service Value Based on Per Unit Area. J. Nat. Resour. 2015, 8, 1243–1254. [Google Scholar]
- Richardson, L.; Loomis, J.; Kroeger, T.; Casey, F. The role of benefit transfer in ecosystem service valuation. Ecol. Econ. 2015, 115, 51–58. [Google Scholar] [CrossRef]
- Cao, L.; Li, J.; Ye, M.; Pu, R.; Liu, Y.; Guo, Q.; Feng, B.; Song, X. Changes of ecosystem service value in a coastal zone of Zhejiang Province, China, during rapid urbanization. Int. J. Environ. Res. Public Health 2018, 7, 1301. [Google Scholar] [CrossRef]
- Hou, L.; Wu, F.Q.; Xie, X.L. The spatial characteristics and relationships between landscape pattern and ecosystem service value along an urban-rural gradient in Xi’an city, China. Ecol. Indic. 2020, 108, 105720. [Google Scholar] [CrossRef]
- Yu, S.J.; Zhang, F.; Yu, H.Y.; Kung, H.T. Quantifying the spatial correlations between landscape pattern and ecosystem service value: A case study in Ebinur Lake Basin, Xinjiang, China. Ecol. Eng. 2018, 113, 94–104. [Google Scholar]
- Chen, S.T.; Fu, H.; Fu, G.; Chen, J. Spatial and Temporal Evolution of Wetland Ecosystem Service Value and Its Response to Landscape Pattern Changes in Haikou. J. Northwest For. Univ. 2023, 6, 236–242. [Google Scholar]
- Yang, J.; Huang, X. The 30 m annual land cover dataset and its dynamics in China from 1990 to 2019. Earth Syst. Sci. Data 2021, 13, 3907–3925. [Google Scholar] [CrossRef]
- Liu, R.; Zhu, D.L. Methods for Detecting Land Use Changes Based on the Land Use Transition Matrix. Resour. Sci. 2010, 8, 1544–1550. [Google Scholar]
- Liu, X.; Liang, X.; Li, X.; Xu, X.; Ou, J.; Chen, Y.; Li, S.; Wang, S.; Pei, F. A future land use simulation model (FLUS) for simulating multiple land use scenarios by coupling human and natural effects. Landsc. Urban Plan. 2017, 168, 94–116. [Google Scholar] [CrossRef]
- Xie, G.D.; Zhang, C.X.; Zhang, C.S.; Xiao, Y.; Lu, C.X. The value of ecosystem services in China. Resour. Sci. 2015, 9, 1740–1746. [Google Scholar]
- Zhu, K.; Cheng, Y.; Zang, W.; Zhou, Q.; El Archi, Y.; Mousazadeh, H.; Kabil, M.; Csobán, K.; Dávid, L.D. Multiscenario Simulation of Land-Use Change in Hubei Province, China Based on the Markov-FLUS Model. Land 2023, 4, 744. [Google Scholar] [CrossRef]
- Liang, X.; Liu, X.; Li, X.; Chen, Y.; Tian, H.; Yao, Y. Delineating multi-scenario urban growth boundaries with a CA-based FLUS model and morphological method. Landsc. Urban Plan. 2018, 177, 47–63. [Google Scholar] [CrossRef]
- Xie, G.D.; Xiao, Y.; Zhen, L.; Lu, C.X. Study on ecosystem services value of food production in China. Chin. J. Eco-Agric. 2005, 3, 10–13. [Google Scholar]
- Li, T.; Gan, D.X.; Yang, Z.J. Spatial-temporal evolvement of ecosystem service value of Dongting Lake area influenced by changes of land use. Chin. J. Appl. Ecol. 2016, 12, 3787–3796. [Google Scholar]
- Tittonell, P.; Giller, K.E. Resilience of agricultural systems to environmental variability: Evidence from Kenya. Agric. Syst. 2013, 116, 34–44. [Google Scholar]
- Tischer, A.; Fahrig, L.; Boucher, Y. Connectivity Conservation Management: A Global Guide; Cambridge University Press: Cambridge, UK, 2013. [Google Scholar]

| Landscape Index | Definition |
|---|---|
| Number of patches, NP | The number of patches reflecting different land use types typically indicates an increase in landscape fragmentation, as an increase in the number of patches usually signifies heightened landscape fragmentation. |
| Patch density, PD | The number of patches per unit area reflects the spatial distribution density of the landscape. |
| Largest patch index, LPI | The proportion of the area of the largest patch within the landscape measures the degree of landscape concentration. |
| Landscape shape index, LSI | The complexity of the shape of landscape patches is described, with higher values indicating more complex shapes. |
| Cohesion index, COHESION | The connectivity of landscape patches is reflected by this value; a higher value indicates stronger connectivity between patches. |
| Ecosystem Services | Individual Service Function | Farmland | Forestland | Grassland | Water Bodies |
|---|---|---|---|---|---|
| Provisioning services | Food production | 3852.20 | 1271.23 | 1656.45 | 2041.67 |
| Raw material production | 1502.36 | 11,479.55 | 1386.79 | 1348.27 | |
| Regulating services | Gas regulation | 2773.58 | 16,641.50 | 5778.30 | 1964.62 |
| Climate regulation | 3736.63 | 15,678.45 | 6009.43 | 7935.53 | |
| Water conservation | 2966.19 | 15,755.50 | 5855.34 | 72,305.78 | |
| Supporting services | Waste treatment | 5354.56 | 6625.78 | 5084.90 | 57,205.16 |
| Soil formation and retention | 5662.73 | 15,485.84 | 8628.93 | 1579.40 | |
| Biodiversity protection | 3929.24 | 17,373.42 | 7203.61 | 13,213.04 | |
| Cultural services | Recreation and leisure | 654.87 | 8012.57 | 3351.41 | 17,103.77 |
| Total | 30,432.38 | 108,323.85 | 44,955.17 | 174,697.25 |
| Year and Proportion | Landscape Type Area (hm2) | |||||
|---|---|---|---|---|---|---|
| Grassland | Urban Areas | Farmland | Shrubland | Forest | Water Bodies | |
| 2000 | 306.45 | 1399.32 | 55,726.92 | 881.19 | 261,197.91 | 1425.6 |
| Proportion % | 0.10% | 0.44% | 17.36% | 0.27% | 81.39% | 0.44% |
| 2010 | 286.56 | 2081.52 | 58,980.06 | 309.69 | 257,939.19 | 1340.37 |
| Proportion % | 0.09% | 0.65% | 18.38% | 0.10% | 80.37% | 0.42% |
| 2020 | 105.75 | 3357.9 | 62,049.78 | 231.66 | 253,532.25 | 1660.05 |
| Proportion % | 0.03% | 1.05% | 19.33% | 0.07% | 79.00% | 0.52% |
| 2030 natural development scenario | 86.85 | 4593.96 | 64,554.84 | 190.26 | 249,851.43 | 1660.05 |
| Proportion % | 0.03% | 1.43% | 20.11% | 0.06% | 77.85% | 0.52% |
| Change rate % | −71.66% | 228.30% | 15.84% | −78.41% | −4.34% | 16.45% |
| Average proportion % | 0.06% | 0.89% | 18.80% | 0.13% | 79.65% | 0.47% |
| Year | NP | FRAC_AM | PLADJ | SHDI | SHEI | AI |
|---|---|---|---|---|---|---|
| 2000 | 12,631 | 1.2589 | 96.1315 | 0.5422 | 0.3026 | 96.2055 |
| 2010 | 11,669 | 1.2667 | 96.1643 | 0.5555 | 0.3100 | 96.2385 |
| 2020 | 12,026 | 1.2721 | 95.7207 | 0.5868 | 0.3275 | 95.7955 |
| 2030 economic development priority scenario | 18,449 | 1.3206 | 94.3247 | 0.642 | 0.3583 | 94.4000 |
| 2030 ecological protection scenario | 11,137 | 1.2753 | 95.7119 | 0.5788 | 0.3230 | 95.7867 |
| 2030 natural development scenario | 14,988 | 1.3038 | 94.9943 | 0.6121 | 0.3416 | 95.0693 |
| Index | Year | Grassland | Urban Areas | Farmland | Shrubland | Forestland | Water Bodies |
|---|---|---|---|---|---|---|---|
| NP | 2000 | 888 | 2088 | 4422 | 1176 | 3388 | 669 |
| 2010 | 665 | 2268 | 4422 | 540 | 3084 | 690 | |
| 2020 | 398 | 2505 | 4671 | 352 | 3274 | 826 | |
| 2030 natural development scenario | 348 | 2236 | 5497 | 321 | 5760 | 826 | |
| PD | 2000 | 0.2767 | 0.6506 | 1.3778 | 0.3664 | 1.0557 | 0.2085 |
| 2010 | 0.2072 | 0.7067 | 1.3778 | 0.1683 | 0.9609 | 0.215 | |
| 2020 | 0.124 | 0.7805 | 1.4554 | 0.1097 | 1.0201 | 0.2574 | |
| 2030 natural development scenario | 0.1084 | 0.6967 | 1.7128 | 0.1 | 1.7947 | 0.2574 | |
| LPI | 2000 | 0.0091 | 0.0775 | 13.0452 | 0.0076 | 70.0895 | 0.0692 |
| 2010 | 0.0088 | 0.1177 | 14.1049 | 0.0067 | 71.1536 | 0.0686 | |
| 2020 | 0.0013 | 0.2657 | 14.6248 | 0.005 | 68.4098 | 0.0786 | |
| 2030 natural development scenario | 0.0012 | 0.4169 | 14.9926 | 0.005 | 69.7612 | 0.0786 | |
| LSI | 2000 | 31.6239 | 47.936 | 77.5222 | 39.9444 | 35.8148 | 32.6587 |
| 2010 | 28.6372 | 50.6951 | 77.992 | 25 | 34.6858 | 33.1347 | |
| 2020 | 21.7826 | 55.0362 | 85.3576 | 21.5392 | 38.1984 | 37.4522 | |
| 2030 natural development scenario | 20.1111 | 58.3739 | 98.6724 | 20.8043 | 45.0351 | 37.4522 | |
| COHESION | 2000 | 68.0901 | 85.7866 | 99.8203 | 78.5607 | 99.8851 | 94.1009 |
| 2010 | 74.3591 | 88.1808 | 99.8298 | 76.8146 | 99.9049 | 93.5513 | |
| 2020 | 55.7652 | 94.1187 | 99.8302 | 75.8122 | 99.8978 | 92.775 | |
| 2030 natural development scenario | 53.8298 | 94.8722 | 99.8247 | 75.133 | 99.9253 | 92.775 |
| Year | Farmland (hm2) | Forestland (hm2) | Shrubland (hm2) | Grassland (hm2) | Water Bodies (hm2) | Total ESV (CNY Billion) |
|---|---|---|---|---|---|---|
| 2000 | 55,726.92 | 261,197.91 | 881.19 | 306.45 | 1425.6 | 3029.23 |
| 2010 | 58,980.06 | 257,939.19 | 309.69 | 286.56 | 1340.37 | 2999.68 |
| 2020 | 62,049.78 | 253,532.25 | 231.66 | 105.75 | 1660.05 | 2965.71 |
| 2030 nature growth scenario | 64,554.84 | 249,851.43 | 190.26 | 86.85 | 1660.05 | 2933.19 |
| 2030 economic development priority scenario | 70,244.91 | 243,540.54 | 188.37 | 69.93 | 1518.57 | 2879.59 |
| 2030 sustainable development scenario | 57,578.22 | 256,988.79 | 155.61 | 85.95 | 1660.05 | 2989.11 |
| Years | Provisioning Services | Regulation Services | Support Services | Cultural Services | Total ESV |
|---|---|---|---|---|---|
| 2000 | 363.73 | 1534.01 | 915.72 | 215.77 | 3029.23 |
| 2010 | 361.11 | 1518.47 | 907.07 | 213.03 | 2999.68 |
| 2020 | 357.16 | 1502.79 | 895.60 | 210.16 | 2965.71 |
| 2030 nature growth scenario | 353.79 | 1486.23 | 885.81 | 207.35 | 2933.19 |
| 2030 economic development priority scenario | 348.74 | 1458.13 | 870.29 | 202.42 | 2879.59 |
| 2030 sustainable development scenario | 359.15 | 1514.85 | 902.51 | 212.60 | 2989.11 |
| Landscape Pattern Index | Provisioning Services | Regulation Services | Support Services | Cultural Services | Total ESV | |||||
|---|---|---|---|---|---|---|---|---|---|---|
| R | p | R | p | R | p | R | p | R | p | |
| NP | −0.672 | 0.328 | −0.653 | 0.347 | −0.655 | 0.345 | −0.645 | 0.355 | −0.655 | 0.345 |
| FRAC_AM | −0.922 | 0.078 | −0.923 | 0.077 | −0.917 | 0.083 | −0.918 | 0.082 | −0.921 | 0.079 |
| PLADJ | 0.934 | 0.066 | 0.920 | 0.080 | 0.925 | 0.075 | 0.917 | 0.083 | 0.923 | 0.077 |
| SHDI | −0.997 * | 0.003 | −0.990 * | 0.010 | −0.995 * | 0.005 | −0.990 * | 0.010 | −0.993 * | 0.007 |
| SHEI | −0.997 * | 0.003 | −0.990 * | 0.010 | −0.995 * | 0.005 | −0.990 * | 0.010 | −0.993 * | 0.007 |
| AI | 0.934 | 0.066 | 0.920 | 0.080 | 0.925 | 0.075 | 0.916 | 0.084 | 0.923 | 0.077 |
Disclaimer/Publisher’s Note: The statements, opinions and data contained in all publications are solely those of the individual author(s) and contributor(s) and not of MDPI and/or the editor(s). MDPI and/or the editor(s) disclaim responsibility for any injury to people or property resulting from any ideas, methods, instructions or products referred to in the content. |
© 2024 by the authors. Licensee MDPI, Basel, Switzerland. This article is an open access article distributed under the terms and conditions of the Creative Commons Attribution (CC BY) license (https://creativecommons.org/licenses/by/4.0/).
Share and Cite
Shen, S.; Zhu, L.; Xie, Z.; Fang, T.; Zhao, H.; Fang, Z. Impacts of Land Use Changes on Landscape Patterns and Ecosystem Service Values in Counties (Villages) in Ethnic Regions of China: A Case Study of Jianghua Yao Autonomous County, Hunan Province. Sustainability 2024, 16, 8050. https://doi.org/10.3390/su16188050
Shen S, Zhu L, Xie Z, Fang T, Zhao H, Fang Z. Impacts of Land Use Changes on Landscape Patterns and Ecosystem Service Values in Counties (Villages) in Ethnic Regions of China: A Case Study of Jianghua Yao Autonomous County, Hunan Province. Sustainability. 2024; 16(18):8050. https://doi.org/10.3390/su16188050
Chicago/Turabian StyleShen, Shiming, Liuyan Zhu, Zhengying Xie, Ting Fang, Haoxiang Zhao, and Zhengtao Fang. 2024. "Impacts of Land Use Changes on Landscape Patterns and Ecosystem Service Values in Counties (Villages) in Ethnic Regions of China: A Case Study of Jianghua Yao Autonomous County, Hunan Province" Sustainability 16, no. 18: 8050. https://doi.org/10.3390/su16188050
APA StyleShen, S., Zhu, L., Xie, Z., Fang, T., Zhao, H., & Fang, Z. (2024). Impacts of Land Use Changes on Landscape Patterns and Ecosystem Service Values in Counties (Villages) in Ethnic Regions of China: A Case Study of Jianghua Yao Autonomous County, Hunan Province. Sustainability, 16(18), 8050. https://doi.org/10.3390/su16188050