Abstract
The next decade will see severe environmental and technological risks, pushing our adaptive capacity to its limits. The EPBD Case Green directive, to counter this phenomenon, emphasizes accelerating building renovations, reducing GHG emissions and energy consumption, and promoting renewable energy installations. Additionally, it calls for deadlines to phase out fossil fuels and mandates solar system installations. This research provides a comprehensive perspective on the opportunities for and challenges of incorporating renewable energy into the built environment. It focuses on the 2961 residential buildings on Procida, a small island located south of Italy, to efficiently utilize energy resources and lay the groundwork for sustainability. Beginning with an analysis of the territorial, urban, historical–conservation, structural, and geological context, in addition to environmental assessments, the research develops a classification and archetypalization system using in-house software. This system aggregates data on the island’s residential buildings, analyzes their current state, and formulates various intervention scenarios. These scenarios demonstrate how integrating technological–environmental design interventions, such as upgrading the building envelope and enhancing bioclimatic behavior, with energy retrofitting measures, such as replacing mechanical systems and installing solar panels, can improve the overall performance of the existing building stock and achieve energy self-sufficiency.
1. Introduction
The next decade will bring significant environmental and technological risks, which will become dominant global concerns [1]. While nations are committed to a 2 °C reduction under the Paris Agreement, the global economy must cut emissions by 45% within the next seven years to avoid catastrophic climate impacts [2,3]. The built environment plays a key role in exceeding net-zero targets, potentially achieving nature-positive outcomes that enhance climate resilience [4,5]. The built environment is crucial in addressing the climate crisis, and it is fundamental to sustainability efforts. Achieving net zero in the building sector requires more than just efficient design; it necessitates the integration of renewable energy supply and distribution [6,7]. Buildings should drive the energy transition to renewable energy in order to effectively transition the whole built environment toward net zero [8,9].
The buildings and construction sector contributes significantly to global climate change, accounting for about 21% of global greenhouse gas emissions. In 2022, buildings were responsible for 34% of global energy demand and 37% of energy- and process-related CO2 emissions. Despite a 3.5% reduction in energy intensity, the overall energy demand and emissions increased by around 1% from 2021 [10]. This highlights the need to accelerate the green transition, particularly in harder-to-abate sectors [11]. Both in Italy and in the EU, the use of renewable energy is projected to increase, with global renewable power capacity growing by 36% in 2023, reaching 473 GW—a record for the 22nd consecutive year [12]. Europe plays a key role in Italy’s ecological transition, as outlined in the Green Deal [13,14]. These actions include key objectives, such as a 55% reduction in greenhouse gas emissions by 2030 and increasing the share of electricity from renewable sources to 40% (in Italy, this share was just over 22% in 2020). Two main Italian instruments driving this transformation are the National Integrated Energy and Climate Plan 2030 (PNIEC) [15], which aligns with European guidelines on emissions reduction, energy savings, renewable energy development, and infrastructure interconnectivity [16,17], and the National Recovery and Resilience Plan (PNRR) [18].
The National Integrated Energy and Climate Plan sets Italy’s 2030 targets for energy efficiency, renewable energy, and CO2 emission reduction [19], while also addressing energy security, interconnections, market competitiveness, sustainable development, and mobility. For each area, it details specific measures to ensure these goals are met [20].
Historically, the construction sector focused on energy consumption, but efforts have shifted towards reducing emissions, necessitating a transition from fossil fuels to renewable energy [21]. Key focus areas now include the electrification of HVAC systems and building management systems, along with enhancing building envelope efficiency to lower energy demand [22]. These actions are guided by the Energy Efficiency Directive (Directive 2012/27/EU) [23] and the Energy Performance of Buildings Directive (Directive 2018/844/EU) [24], which set the framework for meeting the climate targets for 2030 and 2050.
The transition from fossil fuels to renewable sources must be accompanied by strategies to reduce energy consumption and demand, as emphasized by Italian and community reports [25]. Achieving significant greenhouse gas reductions requires a shift towards a smart, locally generated energy production and distribution system based on renewable sources [26,27].
In the urban context, the energy transition also necessarily involves the process of the deep energy renovation of the existing built environment [28,29], which enhances the material and energy resources embedded in it, and through the comprehensive rehabilitation of spaces, envelopes, and systems, leads it towards zero emissions [30,31]. Such strategies for improving the energy efficiency of the building stock must be combined with an increasing reliance on entirely renewable energy production that is integrated into architecture and the city [32], as a strategic resource to be reinterpreted in light of the energy transition [33] and circular economy goals [34].
The Italian building stock is highly inefficient, with over 65% of buildings constructed without energy-saving measures [35,36]. This inefficiency leads to homes with energy demands that are 2.5 times higher than those built between 2016 and 2021, causing the building sector to account for nearly half of the final energy consumption and 19% of direct emissions.
The Energy Performance of Buildings Directive (EPBD), part of the “Fit For 55” package [37], aims to accelerate building renovations, reduce greenhouse gas emissions and energy consumption, and promote renewable energy installations. It introduces higher energy standards for new buildings, transitioning from “nearly zero-energy buildings” (NZEB) to “zero-emission buildings” (ZEB) by 2028, and sets deadlines for phasing out fossil fuels and mandating solar installations [38,39]. Photovoltaic (PV) solar energy is identified as the most efficient and cost-effective renewable option in Italy [40,41].
However, there are places that are remote and disconnected, geographically and otherwise, from the pulsating heart of human activities, which often remain excluded and marginalized from the aforementioned Italian goals and strategies [42,43]. This is the case with islands, whose distance from the mainland renders them physiologically fragile and difficult to manage, particularly in terms of energy supply [44].
The fragility of islands, combined with abundant natural resources, like solar and wind energy, makes them ideal for testing self-sufficient energy systems based on renewable resources [45,46]. The need to find alternatives to environmentally damaging and costly imported fossil fuels has led to experimental research on islands. Procida Island, located in southern Italy [47,48], is particularly well-suited for this purpose due to its geomorphological, climatic, and demographic characteristics. Consequently, this research focuses on integrating technological and environmental design with energy interventions in Procida’s residential buildings, using the island as a pilot case for testing innovative systems aimed at environmental and energy sustainability [49].
The specific problem addressed by this study is the lack of comprehensive, localized strategies for effectively integrating renewable energy systems and energy-efficient retrofitting measures into the built environment of small, historically and geographically unique areas. This research aims to bridge the gap in understanding how to effectively integrate renewable energy systems and energy-efficient retrofitting measures into the built environment, particularly in the context of small, historically and geographically unique areas, like the island of Procida. While the Energy Performance of Buildings Directive EPBD Case Green directive outlines general goals for reducing greenhouse gases emissions and promoting renewable energy in the building sector, there is a lack of comprehensive, localized studies that consider the specific challenges of and opportunities for implementing these directives in diverse urban and environmental contexts. To address this gap, this research not only develops a detailed classification and archetypalization system for Procida’s residential buildings, analyzing their current conditions and proposing tailored intervention scenarios, but also introduces an innovative approach through the application of aggregated data and archetypal analysis to large-scale territorial assessments. By leveraging a custom-developed software system, this study systematically consolidates and analyzes data across 2961 residential buildings on Procida, providing a comprehensive understanding of the island’s diverse architectural and environmental conditions. These scenarios not only align with the directive’s goals, but also demonstrate the potential for achieving energy self-sufficiency while respecting the island’s unique historical and conservation needs, all while advancing the methodological framework for sustainable building design.
This approach allows for a comprehensive understanding of diverse architectural and environmental conditions within the island’s built environment. Aggregated data analysis facilitates the identification of patterns and correlations that might not be evident through individual assessments. This macro-level perspective enables more effective and scalable solutions for energy efficiency and sustainability. The archetypalization process further refines this by categorizing buildings into representative types or archetypes based on their structural and environmental characteristics. This classification aids in the development of targeted intervention strategies that address the specific needs and conditions of different building types.
The integration of aggregated data and archetypal analysis not only enhances the accuracy of performance evaluations, but also supports the creation of tailored, context-sensitive retrofitting scenarios. This methodological innovation significantly advances the field of sustainable building design by providing a robust framework for optimizing energy use and achieving self-sufficiency at a broader scale. The findings are particularly valuable for urban planners, engineers, architects, and sustainability researchers seeking to implement effective and adaptable solutions in residential environments.
2. Materials and Methods
The research methodology is divided into three main phases: the analytical–interpretative phase, which ensures an accurate analysis of the context in question; the instrumental–applicative phase, which enables the systematization of the collected data; and finally, the synthetic–evaluative phase, which facilitates the formulation of a series of appropriate intervention scenarios for redevelopment.
As reported in Figure 1, below, the three main phases are further subdivided.
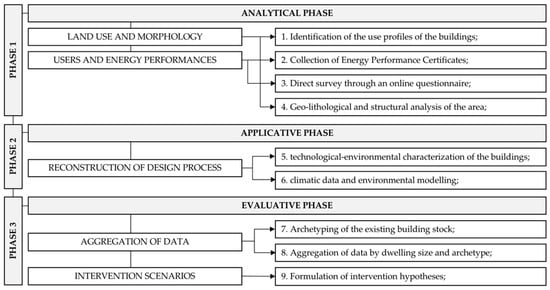
Figure 1.
Framework of the research methodology.
2.1. Analytical Phase
The first phase involved identifying the usage profiles of the properties, which are necessary for classifying the examined buildings according to certain fundamental characteristics (specifically, residential buildings are the focus). These were derived both from a direct survey targeting the population via an online questionnaire designed to develop the profile of a dwelling’s energy consumption [50], based on the information required by in-houe-developed calculation code based on a simplified dynamic simulation [51].
The questionnaire was developed in an Excel environment, utilizing macros and functions programmed in Visual Basic for Applications (VBA) to simulate energy consumption in real time based on user-provided inputs. It was validated by comparing its results with those obtained from established software such as TRNSYS 18 and EnergyPlus 8.3.0.
Simulated energy consumption was immediately compared to the actual data input by the user [52,53] and against calculated benchmarks. These benchmarks were derived from reports issued by the Italian Regulatory Authority for Energy, Networks, and Environment [54].
When discrepancies between simulated and actual consumption data are identified, the system generates warnings and suggests possible corrective actions. This comparison is necessary due to the general lack of awareness users have regarding their own consumption habits [55,56].
Particular attention in formulating the questions was given to information regarding the users, the architectural and morphological characteristics of the residence, the characteristics of the existing system installations, the features of the appliances within the dwellings, and energy consumption and expenses.
The details of the information requested in the questionnaire are provided in Table A1 in Appendix A.
After this phase, the analysis focused on the geo-lithological and structural framework of the pilot area, utilizing maps and information available in municipal archives and local scientific reports [57,58].
2.2. Applicative Phase
After the analysis of the geolithological and structural framework, particular attention was given to reconstructing the design process through the geometric creation of models for geographical contextualization and technological–environmental characterization of the buildings.
This was preparatory to studying the environmental context through the collection of climatic data over the past 20 years and solar analyses conducted using Ecotect Analysis 1.0, a type of modeling and solar analysis software. This allowed for in-depth analyses of the buildings’ energy performance and climate integration, which are essential for providing recommendations, directions, and guidelines for the sustainable development of the project.
2.3. Evaluative Phase
Upon completion of the analysis of the context and the examined buildings, the third synthetic–evaluative phase involved archetyping the existing building stock based on similar characteristics. Specifically, three archetype categories were identified, grouping the various buildings according to the following parameters: building type, year of construction, construction technique, size, and zoning area.
After determining the archetypes, the data were aggregated according to two different parameters:
Dwelling size: Based on data collected from the population questionnaires. These data were entered into the in-house developed calculation code, which outlined the consumption profiles and suggested interventions to improve the energy performance of the dwellings, thereby enabling the projection of intervention scenarios aimed at achieving significant savings in primary energy and costs.
Archetype: The same data from the questionnaires were also aggregated according to the identified archetypes. This second type of data aggregation allows for extrapolating the frequency percentages with which the in-house calculation code recommends specific interventions.
The statistical investigations conducted from the data aggregation by dwelling size and by archetype led to the formulation of intervention scenarios. These were divided into technological–environmental interventions on the building envelope (such as thermal insulation of vertical opaque closures, horizontal opaque closures, vertical transparent closures) and replacement of system components (mainly focused on the installation of heat pumps associated with photovoltaic systems and of solar thermal systems).
3. Results and Discussion
3.1. Application of the Research Method to the Pilot Case of Procida Island
The pilot case selected for validating the established research method is the small island of Procida.
The small island, located in Campania, in the Gulf of Naples, covers 4.26 km2, and it has a population of 10,434 and a population density of 2449.3 inhabitants per km2, with 2961 dwellings in Procida [59]. The first settlements, dating back to the 8th century BC, were founded by Greek colonists from Cumae on Terra Murata, 90 m above sea level. Coastal villages, Corricella and Marina di Sancio Cattolico, developed in the 15th century, although the island remained rural until a construction boom in the 1960s.
This research focuses on Marina di Sancio Cattolico and Corricella. Marina di Sancio Cattolico, located on a strategic inlet, has limited sunlight and features adaptations like minimal overhangs and solid walls. The buildings are made from local tuff, with load-bearing vertical structures [57]. Corricella, which developed between the 16th and 17th centuries, has terraced architecture with southern exposure, benefiting from sunlight and heat [57].
The 2002 Color Plan [58] preserves historical facades, prohibiting non-original materials and limiting visible renewable energy installations to 30% of roof surfaces. The 1960s building boom introduced rural-style homes, while the 1985 General Town Plan (PRG) led to denser semi-detached villas with better insulation.
As mentioned above, in Procida, there is a total of 2961 dwellings [59]. To develop a comprehensive energy retrofit intervention, it was necessary to classify and aggregate these dwellings based on several key characteristics. The information for this process was obtained from various sources, including direct interviews with the population via a Google Docs questionnaire [50] designed based on the requirements of the in-house software.
The graph in Figure 2 allows for the observation and quantification of the aforementioned points. Until 1900, Procida had 692 dwellings. In the decade between 1960 and 1970 alone, 1038 dwellings were constructed.
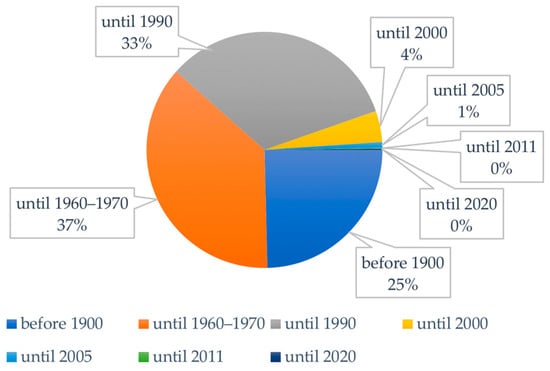
Figure 2.
Number of dwellings divided into building construction period.
The building trend remained high until the 1990s, followed by a sharp decline in the early 2000s. Currently, the development of new buildings on the island has nearly ceased.
Regarding the average size of residential buildings, there are no official statistical data available. Therefore, an average and a proportion were calculated based on the questionnaires administered to the island’s inhabitants. The most common size is between 45 and 65 sqm.
Figure 3 reflects the recent phenomenon of subdivision in the historical buildings. The historical constructions from the feudal period were indeed very large, making them difficult to manage in contemporary times.
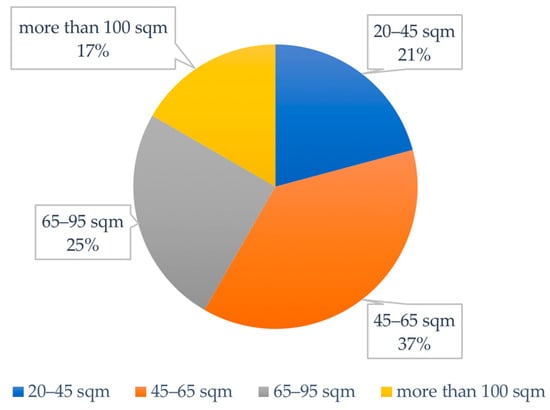
Figure 3.
Number of residential buildings divided by average size.
As shown in Figure 4, the majority of the dwellings (54%) are single-storey.
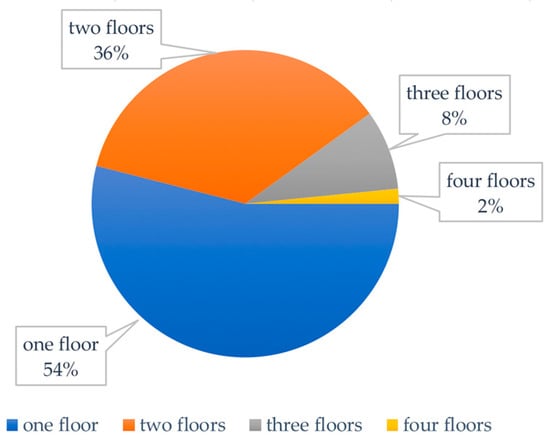
Figure 4.
Number of residential buildings divided into number of floors above ground level.
This is explained by the fact that most of the construction occurred in the 1960s and 1970s, following the single-family villa type.
More recently, the landscape protection regulation imposed in 2004 allowed construction up to a maximum height of only 4 m above ground level. The dwellings that rise to four stories are very few, and they are mainly located in Marina di Sancio Cattolico and along the historic Via Principe Umberto.
Subsequently, the usage profile of the properties in Procida was outlined.
This research aims primarily to implement a widespread retrofit of residential buildings, and the island proved to be particularly suitable, since it does not host industrial complexes or large infrastructures, making the building stock almost entirely residential.
Of the 2003 habitable residences, 1543 are occupied year-round, with the remainder used only seasonally, as shown in the following graph, in Figure 5.
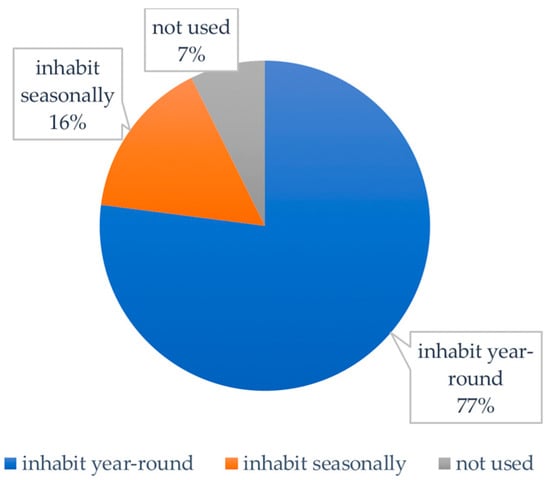
Figure 5.
Occupancy of residential buildings.
It is notable that in Procida, only 30% of the dwellings are connected to the national gas network, with the remainder using gas purchased and stored in personal storage devices (tanks) located in gardens or inside the dwellings.
The following graphs in Figure 6 show that despite this, the most common heating system (found in 79% of the dwellings) is the traditional natural gas boiler.
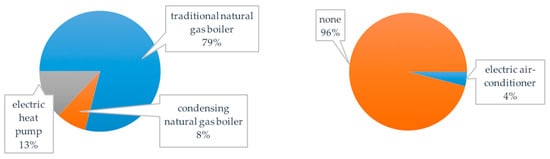
Figure 6.
(left) Typology of heating systems; (right) cooling systems.
Cooling systems (air conditioners, splits), on the other hand, are much less common, being present in only 4% of the dwellings [59].
These data reflect the national trend, which still shows a low prevalence of such devices.
As far as the production of domestic hot water (DHW) is concerned, 58% is entrusted to electric water heaters. The presence of heat pumps, albeit small, is noted in 8% of cases (Figure 7).
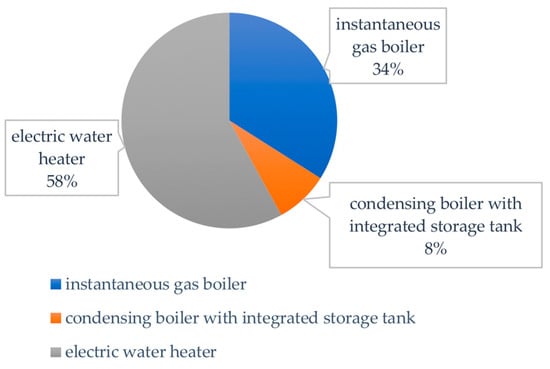
Figure 7.
Typology of domestic hot water production systems.
Procida, part of the historic Terra di Lavoro, is geologically notable for its Campanian gray and Neapolitan yellow tuff, which are likely sourced from Roccamonfina or the Campi Flegrei volcanoes. Two primary masonry techniques are used on the island: the “a cantieri” method (on the left in Figure 8), found in older areas, like Terra Murata, featuring rough-hewn stones with horizontal gaps filled with mortar; and the “a blocchetti” method (on the right in Figure 8), which is commonly used in post-17th century buildings in the historic center, using ashlar blocks with minimal mortar joints [60].
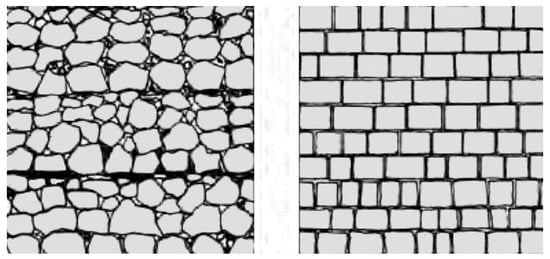
Figure 8.
Tuff used in masonry according to two main techniques: the so-called “a cantieri” technique (on the left); and the so-called “a blocchetti” technique (on the right).
The following are the analyses of the masonry samples surveyed on the island. For each of the masonry samples surveyed on the island, a detailed photographic survey was conducted, and the dimensions of each layer were studied. The thermal transmittance (U-value) was calculated using the unit W/m2K to estimate the average heat flux passing per square meter of rooms with different temperature, and then compared with the limit values specified by the relevant Italian regulations.
The photographic surveys and the stratigraphy are presented for the first two examples of masonry. For the third and the fourth samples, only the results of the simulations are reported. The tuff masonry on the island is almost exclusively present in the historic centre. In the inland areas and on the more recently developed coastlines, this material is present, but only in non-structural inserts (e.g., boundary walls).
The dimensions of the masonry range from a minimum of 60 cm to a maximum of 1 m. A sample of the irregular masonry with periodic horizontal courses, “a cantieri”, is reported in Figure 9.
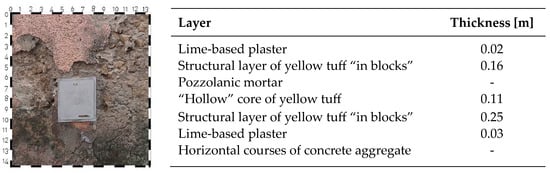
Figure 9.
(left) Example of masonry with “a cantieri” construction; (right) stratigraphy of the masonry from the exterior to the interior.
The U-value of this wall is 1.818 W/m2K. The described masonry package has a U-value that is 4.5 times higher than the value stipulated by regulations for vertical opaque walls, which mandate a maximum of 0.4 W/m2K. Therefore, it is necessary to take action to modify this value.
The second sample of the masonry with cut stones, or “a blocchetti”, is reported in Figure 10. The U-value of this wall is 1.630 W/m2K.
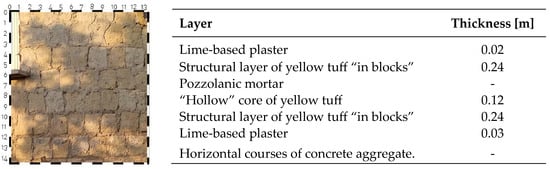
Figure 10.
(left) Example of masonry with “a blocchetti” construction; (right) stratigraphy of the masonry from the exterior to the interior.
As can be seen in Figure 10, this type of masonry is slightly more efficient. This is due to the fact that the more regular blocks require less mortar for installation. Since mortar has a higher conductivity compared to tuff, it allows heat to pass through more readily. This masonry package also exhibits a U-value significantly higher than the value stipulated by regulations for vertical opaque walls, which requires a maximum of 0.4 W/m2K. Therefore, it is necessary to take action to improve the wall’s performance.
The third sample of the masonry is extremely simple and equally widespread on the island, with perforated bricks measuring 30 × 30 cm. Its thickness ranges from 30 to 40 cm.
The U-value of this wall is 0.949 W/m2K. It is 2.3 times higher than the maximum established value. Therefore, it is necessary to take action to modify this value.
The fourth sample of masonry has double perforated bricks and an air gap (1975–1985). This type of masonry is less common on the island and is of more recent construction. It comes in two variants: one with an air gap and one with interposed insulation.
The average thickness of this type of masonry is approximately 30 cm and the U-value of this wall is 1.389 W/m2K.
As noted, this value is 3.4 times higher than the maximum established limit. Therefore, it is necessary to take action to modify this value.
The 150 houses built after the 1990s do not require intervention as they are already equipped with thermal insulation.
The island has 1088 degree-days. Regarding sunlight, it is observed that Procida experiences significantly fewer cloudy days compared to sunny or partially cloudy days, with a maximum of 10 cloudy days in December and January.
Furthermore, Procida benefits from many hours of sunshine each day.
On 21 June, the sun rises before 5 a.m. and sets after 7 p.m. On 21 December, the sun rises shortly before 8 a.m. and sets after 4 p.m. These observations lead to the conclusion that using solar energy as the primary renewable energy source is particularly suitable. Procida is located in the Mediterranean basin, within a gulf, protected by the mainland to the north and the island of Ischia to the west. Consequently, the winds on the island are relatively slow (approximately 3 m/s) and primarily come from the peninsula, specifically from the Vesuvius area to the north/northeast, and from the south/southwest, i.e., from the Mediterranean basin. Subsequently, the shading conditions of the island areas that appeared most problematic were evaluated.
In Figure 11 (below), we present the analysis conducted for the Marina di Sancio district, which, of all the areas studied, presents the most significant issues. This area has a northern exposure, resulting in its seaward facades being perpetually in shadow.
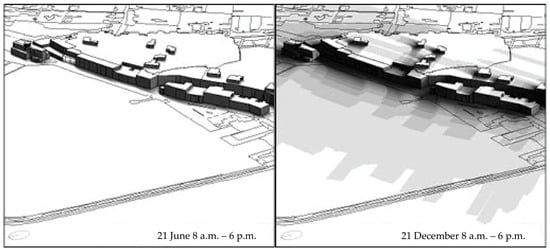
Figure 11.
(left) Shading of the area on 21 June; (right) shading of the area on 21 December.
Additionally, there is no solar gain from the south either, as the buildings are entirely adjoined to a rocky wall, specifically composed of tuff.
The simulation presented in Figure 12 (below) depicts the buildings from the 1960s–1970s, illustrating the area near Silurenza Beach. Here, to the northwest of the island, there is a dispersed development with one-to-two-storey houses surrounded by their own gardens. The vegetation is not of considerable height, since the land is predominantly used for agricultural purposes. The distance between the buildings prevents them from casting shadows on one another.
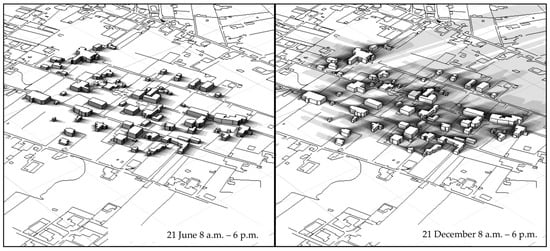
Figure 12.
(left) Shading of the area on 21 June; (right) shading of the area on 21 December.
The simulation in Figure 13 (below) illustrates the building model from the 1980s to 2000, located near Ciraccio Beach. Its northwest orientation results in the seaward facades being almost entirely shaded throughout the day. At the rear, most of the examined buildings are surrounded by low vegetation, which allows for sunlight exposure on the rear facades.
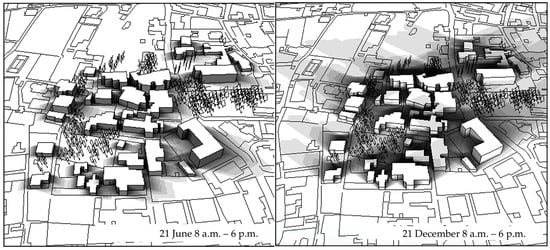
Figure 13.
(left) Shading of the area on 21 June; (right) shading of the area on 21 December.
The intention to undertake an energy retrofit on such a large scale necessitates the aggregation of the building stock according to its similar characteristics. According to the research presented so far, three categories, termed archetypes, have been identified to group the various buildings based on the following parameters: building type, year of construction, construction technique, size, and zoning of the island. Specifically, for size, the classification was performed in the following size ranges: (1) 20–45 m2; (2) 45–65 m2; (3) 65–90 m2; (4) 100 m2 and above.
Archetype A (blue in Figure 14) includes all buildings constructed before 1919, with tuff masonry ranging from 60 cm to 1 m in thickness. These represent 24.6% of the island’s dwellings, totaling 696 buildings. The analyzed samples have areas ranging from 20 to 145 m2, distributed fairly evenly across the size categories.
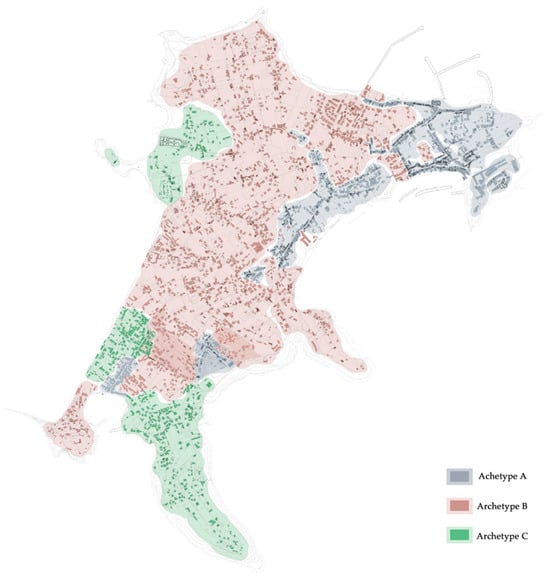
Figure 14.
Identification of archetypes on the island plan.
Archetype B (pink in Figure 14) groups all the buildings constructed between the post-World War II era and 1971, featuring masonry made of perforated brick blocks joined with pozzolanic mortar and sand, with an average thickness of 32 cm. This is the largest archetype, encompassing 62.8% of the building stock, totaling 1658 buildings. Of these, 11.1% fall into category 1, 44.4% fall into category 2, 23.2% fall into category 3, and 22.2% fall into category 4.
Archetype C (green in Figure 14) includes buildings constructed between 1985 and the present, featuring perforated brick masonry with an air gap or insulation, with an average thickness of 32 cm. This archetype accounts for 12.6% of Procida’s building stock, totaling 457 buildings. Of these, 16.6% fall into category 1, 33.3% fall into category 2, 33.2% fall into category 3, and 16.7% fall into category 4. Specifically, the following 12 buildings from Archetype A, nine buildings from Archetype B, and four buildings from Archetype C were analyzed.
All the collected data were first aggregated by dwelling size and then entered into the calculation software [51], which mapped the consumption profile and suggested interventions to improve the energy performance of the buildings, thereby enabling significant savings in primary energy and costs.
It is important to note that the suggestion to replace household appliances (such as refrigerators, washing machines, etc.) was omitted, as this type of intervention is more challenging to implement due to its reliance on individual family choices.
In total, 25 housing samples from Procida were examined and analyzed using the software. Looking at the graph in Figure 15, below, it can be observed that, in general, the most frequently suggested interventions are those related to the insulation of the building envelope (walls and ceiling).
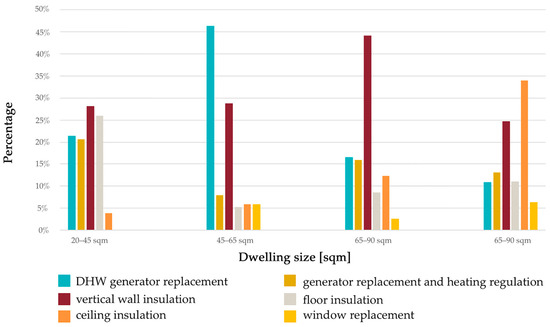
Figure 15.
Frequency of suggested interventions in percentages for the different size categories for reducing primary energy consumption.
For size categories 1 (20–45 m2) and 3 (65–90 m2), wall insulation is the most frequently recommended intervention for achieving the highest primary energy savings. In both categories, over 50% of effective interventions target the building envelope, while system interventions are also common, accounting for 42% in category 1 and about 31% in category 3, with both suggested system interventions being nearly equally effective. Five housing samples were analyzed for category 1, and seven were analyzed for category 3.
In size category 2 (45–65 m2), the replacement of the domestic hot water (DHW) generator is the most common intervention, followed by wall insulation, at 28.71%, with other interventions being much less frequent (about 6%). Nine housing samples were analyzed for this category.
For sizes equal to or greater than 100 m2, ceiling insulation is the most frequently recommended intervention, with over 50% of effective interventions focusing on the building envelope. System interventions account for about 21%, with both options being equally effective. Four housing samples were analyzed for this category.
The same data were subsequently aggregated according to the different identified archetypes. The following graph compares the frequency percentages at which the software suggested specific interventions (Figure 16).
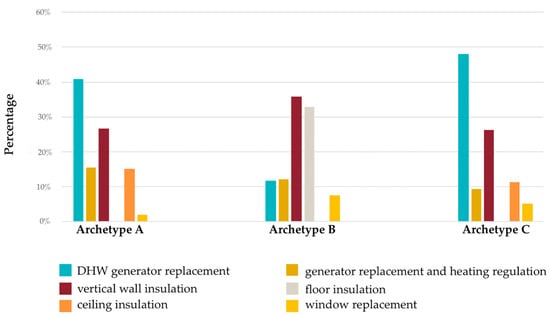
Figure 16.
Frequency of suggested interventions in percentages for the different archetypes for primary energy reduction.
For both Archetype A (buildings constructed before 1919) and Archetype C (buildings constructed between the 1980s and 2000), the most frequently recommended intervention for achieving the highest primary energy savings is the replacement of the domestic hot water (DHW) generator, followed by wall insulation, with a significant gap between the two.
In Archetype A, interventions on the envelope are less common due to the thick historical walls, which partially compensate for the lack of insulation. For Archetype C, the more modern construction technology includes better envelope insulation, although there is still room for improvement. Twelve housing samples were analyzed for Archetype A, and four were analyzed for Archetype C.
In contrast, for Archetype B (buildings constructed during the 1960s and 1970s), the most frequently recommended interventions focus overwhelmingly on the building envelope, due to the less insulated and thinner construction masonry of the period, particularly in isolated villas of up to two stories. Among system interventions, the replacement of the heating system generator is slightly preferred over the DHW generator. Nine housing samples were analyzed for this archetype.
Aggregating the data from the 25 samples studied, without distinguishing by archetype or size, it is observed in the graph Figure 17 that the most frequently recommended intervention for primary energy savings is the replacement of the domestic hot water generator (37%), followed by wall insulation (33%). The third most frequently recommended intervention is the replacement and adjustment of the heating system (14%). In conclusion, there is a clear need to address both the building envelope and the systems, as both would lead to significant primary energy savings.
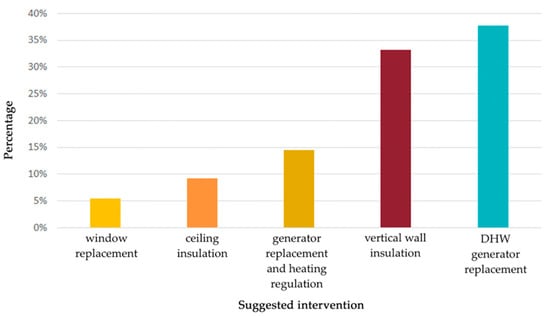
Figure 17.
Frequency of suggestion of interventions in total percentages for primary energy reduction.
In conclusion, the overall results are similar to those of category 2, primarily because this category comprises the largest number of analyzed samples.
Once the analytical phase was completed, hypotheses for the interventions on the building envelope were formulated, integrating technological–environmental design solutions, as well as assessing the challenges and strengths of potential solutions, as suggested in [44], for small islands.
The first hypothesis consists in the insulation of the building envelope through the thermal insulation of vertical opaque closures. One of the interventions most frequently suggested by the software is the insulation of walls and roofs. Given the extreme differentiation of the island’s building heritage, various technologies were considered for the proposed intervention.
The historical and landscape constraints imposed on Archetype A prevent the implementation of external wall insulation. Therefore, insulating materials suitable for internal use, which are thin to avoid significantly reducing the volume of the houses, were evaluated.
The selection of insulation materials for the building envelopes involved evaluating the thermal performance (based on thermal conductivity values), compatibility with historic masonry, and the thickness requirements relative to the dimensional constraints. Cost considerations were also important, with a preference for materials offering the best performance for their cost. The market survey identified long-fiber basalt insulation as the most advantageous. This material, made from 100% natural, non-combustible basalt fibers, features a panel construction with thin layers mechanically “sewn” together. It can be applied externally and internally on walls, ceilings, floors, and roofs without anchors. The benefits include reduced energy costs, acoustic insulation, improved environmental conditions, and the prevention of mold on exposed perimeter walls. It also integrates well with historic buildings, preserving their aesthetic integrity.
The same procedure of evaluation was followed for selecting the insulators for the houses belonging to Archetype B, which, not having any constraints or valuable plasterwork, allowed for the implementation of external wall insulation. The choice fell on a cork insulation panel.
For the houses in Archetype C, which have an air cavity, the possibilities of cavity wall insulation were evaluated. Additionally, in this case, a market survey was conducted and, once again, long-fiber basalt insulation was chosen. Once the insulating material was selected, the intervention for each Archetype was developed.
For Archetype A, the changes in the stratigraphy of the vertical opaque closures and the verification are reported below. It is noted that the initial U-value for the first sample was 1.818 W/m2K. By inserting a long-fiber basalt insulation with a thickness of 5 cm, the final transmittance is 0.388 W/m2K, which complies with the regulatory limits. For the second sample of the tuff masonry, a similar intervention was hypothesized, resulting in a new U-value of 0.376 W/m2K. Based on the number of houses per size range and the associated dispersing surface area, the total is 96,907.8 m2.
For Archetype B, the changes in the stratigraphy and the verification are also reported below. It is noted that the initial U-value for the third sample was 0.949 W/m2K. By installing a 6-centimeter-thick cork insulation panel, the final transmittance is 0.358 W/m2K, which complies with the regulatory limits. Based on the number of houses per size range and the associated dispersing surface area, the total is 264,134 m2.
Finally, for Archetype C, the same procedure was followed. It is noted that the initial U-value for the fourth sample was 1.389 W/m2K. By implementing a wood fiber cavity insulation of 10 cm, the final transmittance is 0.313 W/m2K, which complies with the regulatory limits. Based on the number of houses per size range and the associated dispersing surface area, the total is 10,828.3 m2.
The second hypothesis consists in the insulation of the building envelope through the thermal insulation of horizontal opaque closures. Regarding horizontal partitions, only the roofs were considered for the refurbishment. The study essentially identified two types of roofs: the historic type, with load-bearing vaulted tuff masonry, and the more recently constructed type, made of reinforced concrete with hollow bricks.
The historic roofs in question are vaulted and predominantly constructed from tuff, with some tile shard reinforcements. They are typically extradossed, creating a “lamia”, which is common in Campania, making them non-walkable. Despite their age, the gutter system is efficient and well-integrated into the building structure [49]. For insulating these vaulted roofs, an internal insulation layer consistent with that of the vertical opaque closures is proposed. This involves using a 5-centimeter-thick long-fiber basalt insulation, which makes it possible to achieve a final U-value of 0.379 W/m2K, compared to an estimated initial value of 1.606 W/m2K.
For the simpler reinforced concrete slabs, an external wall insulation system was chosen, which is consistent with that used for the vertical opaque closures. This involves using a 5-centimeter-thick cork insulation, which makes it possible to achieve a U-value of 0.374 W/m2K, compared to an estimated initial value of 0.865 W/m2K. Given that the maximum allowable transmittance for roofs in climate zone C is 0.38 W/m2K, this intervention ensures compliance with the regulatory limit.
The intervention also aimed to make previously non-walkable roofs accessible, facilitating the installation of photovoltaic systems and/or solar thermal collectors.
The third hypothesis consists in the insulation of the building envelope through the thermal insulation of horizontal transparent closures. The replacement of windows in the historic residences of Procida has proven to be both necessary and challenging due to several constraints, as follows:
- The lack of modification of openings: existing openings cannot be enlarged or reduced in size;
- Material restrictions: frame materials are restricted to wood only, and aluminum and PVC are not permitted;
- Paint requirements: wood frames must be paintable and painted in colors specified by the Color Plan (Piano Colori);
- Glass specifications: any thickness of smooth glass or crystal can be used.
Despite these constraints, the urgency is high because the historic windows are characterized by solid wood frames and single-pane glass, resulting in very high levels of U-value.
For Archetype A, transparent closures vary in shape, arrangement, and size. Therefore, any replacement must be custom-made. The most frequently encountered types were selected for analysis, revealing that all have U-values exceeding 4 W/m2K.
This is well above the regulatory limit for transparent closures, which is 1.75 W/m2K.
The choice fell on windows with solid wood frames from various hardwoods, ensuring particularly low U-values. The selected wood species was ash, as it most closely matches the color of the currently existing windows. The project includes two different variants for the glass, as follows:
- Historic center: the chosen solution is double glazing with low-emissivity coating and an argon-filled cavity (90% filled);
- Marina di Sancio Cattolico: the selected option is triple glazing, also with low-emissivity coating and argon-filled cavities (90% filled).
This differentiation is due to the specific conditions in Marina di Sancio Cattolico, which is perpetually shaded due to its northern exposure and is subjected to one of the coldest prevailing sea winds in Procida, coming from the north-west.
The new window system has a U-value of approximately 1.3 W/m2K for Variant 1 and 0.9 W/m2K for Variant 2.
Subsequently, the windows of buildings constructed between the post-war period and the 1970s (Archetype B) were analyzed.
These often feature wooden frames with single glazing, although PVC windows also appear in some cases. The analysis considered the small percentage of buildings that have already undergone window replacement and focused on the remaining buildings. The window types for this archetype are much less varied, being more rectangular and regular.
Moreover, there are no restrictions on these buildings, allowing for greater freedom in choosing replacement windows. For the replacement of these windows, PVC windows was selected. These are more economical, thus offering a shorter payback period, and are highly efficient and recyclable. Since this segment of the building stock is not subject to restrictions, any type of window can be installed. The chosen glass is double glazing with a low-emissivity coating and an argon-filled cavity (90% filled). This type of glass, also used in the previous intervention, is less expensive while fully meeting the current regulatory performance standards. The buildings receiving this type of window are mostly located inland on the island, and being single-family homes, the transparent closures can be on any facade. The new window system has a U-value of approximately 1.2 W/m2K, which complies with the regulations.
The windows for Archetype C were not addressed as they are already more efficient due to their more recent construction.
Once all the hypotheses for the interventions on the building envelope were defined, the next step was to define the hypotheses for the interventions on the energy systems, which in this case, involved assessing the challenges of energy management, as shown in [46], for small islands.
Starting from the research objective of designing a photovoltaic surface on the island that could produce as much electricity as possible, after considering the interventions carried out on the building envelopes, the replacement of heating and domestic hot water systems was also taken into account, without neglecting the cooking utilities, which, transformed into electrics, allowed the average annual electricity consumption to be calculated accordingly.
The first hypothesis consists in the electrification of the building stock through heat pump insertion.
In the effort to electrify the island’s building stock, the replacement of existing systems was designed to eliminate the need for gas for both winter heating and domestic hot water production, an action that was, moreover, corroborated in light of the need to integrate the island of Procida into policy frameworks reported in [42,43].
The replacement will be achieved through the installation of heat pumps. The appropriate size and efficiency of the heat pump can be determined to meet the specific heating and hot water needs of the buildings on the island.
The design was carried out for each archetype and, within them, for each size range. As the distribution subsystem, a split system was chosen, which aligns well with the heat pump’s ability to function both as a heating and as a cooling system.
The second hypothesis consists in the electrification of the building stock through the use of the heat pump as a water heater for domestic hot water production. In this case, the design was more straightforward, and an 80 L heat pump water heater was selected, which is adequate to meet the needs of the island’s households, which average 2.3 people per unit.
The third hypothesis consists in the electrification of the building stock through the photovoltaic system, as also suggested by the information presented in [48,49]. These two heat pump systems will be powered by a widespread photovoltaic system, sized according to the peak power requirements of the examined buildings, calculated using in-house software for each size category, regardless of the archetype.
The combination of these two technologies is particularly efficient, as the heat pumps can be almost entirely supplied by the photovoltaic panels.
The selected panel is a monocrystalline silicon panel with half-cells, which allows it to function even when partially shaded. The photovoltaic panel has an efficiency of 19.9%. A high-performance panel was chosen because, for historic buildings, only 30% of the roof area can be covered by photovoltaic panels, so this type of panel produces more energy from a smaller solar surface.
3.2. Discussion of the Results
This research aims to illustrate how combining technological–environmental design strategies, such as upgrading building envelopes and improving bioclimatic behavior, with energy retrofitting measures, like replacing mechanical systems and installing solar panels, can enhance building performance, achieve energy self-sufficiency, and help to assess the potential for electrification on the island of Procida.
The final step involves evaluating the various interventions from the perspective of primary energy demand, energy savings percentages, and the changes in energy class resulting from each intervention.
According to Italian regulations [61,62], the energy classification is a fundamental element for assessing the energy efficiency of a building. It indicates the building’s level of energy performance, which is evaluated based on the consumption of non-renewable primary energy for heating, cooling, domestic hot water production, and lighting. The energy classification, expressed in letters from A to G, represents a scale of values indicating the building’s efficiency, where Class A represents the highest level of energy efficiency and Class G represents the lowest. Understanding a building’s energy classification is crucial for evaluating its energy consumption and identifying potential improvements to reduce energy use and, consequently, CO2 emissions. There are eight energy classes, which are assigned based on the primary energy demand required to heat each square meter of surface area. The most efficient energy classes are A4, A3, A2, and A1, with higher values assigned, followed by classes B, C, D, E, F, and, finally, Class G, with the lowest score.
All the evaluations were conducted for samples divided by archetype and, within each archetype, by size range. The following terminology will be used:
- Scenario #1: wall and roof insulation;
- Scenario #2: wall and roof insulation + window replacement;
- Scenario #3: wall and roof insulation + window replacement + system replacement;
- Scenario #4: wall and roof insulation + window replacement + system replacement + photovoltaic system installation.
Below is an analysis of the main results obtained from the combination of interventions aimed at the integration of technological–environmental design and energy interventions in the residential building stock in the pilot case of the small island Procida.
A comprehensive analysis of the proposed interventions, aimed at assessing the impacts of the proposed energy transition for the island following the statements reported in [45], reveals several key findings regarding their impact on energy performance and efficiency across different building archetypes on Procida Island.
Initially, all buildings, particularly those of Archetype A, exhibit very low energy classes, as also revealed by [47]. This is indicative of a significant need for improvement to meet modern energy standards. Larger homes, however, tend to have better energy classes compared to smaller ones, suggesting that building size influences energy performance, in line with what was also reported by [48].
The figures below graphically present the results obtained from the application of the four intervention scenarios on the small island of Procida in terms of energy demand and associated CO2 emissions. The comparison of the results is divided by dwelling size (Figure 18) and by archetype (Figure 19).
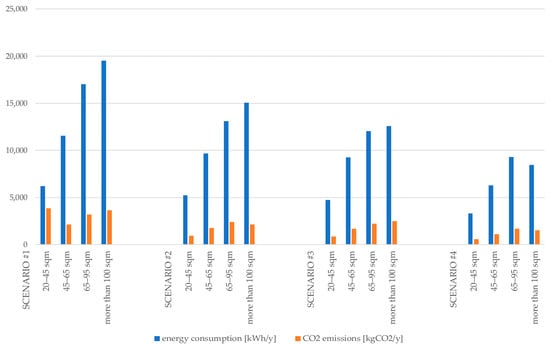
Figure 18.
Comparative evaluation of intervention scenarios in terms of energy demand and associated CO2 emissions divided by dwelling size.
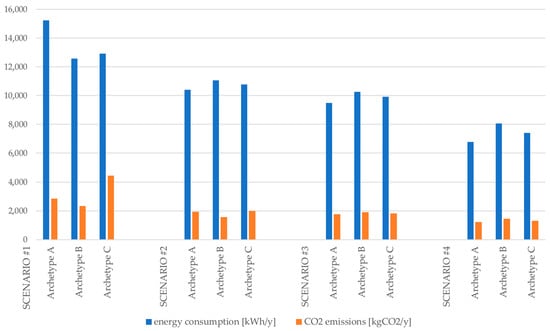
Figure 19.
Comparative evaluation of intervention scenarios in terms of energy demand and associated CO2 emissions divided by archetype.
Scenario #1, which focuses on insulating walls and roofs, demonstrates varying degrees of effectiveness across different archetypes. For Archetype A, the complexity of the technologies involved in this scenario enables a substantial improvement in energy class, moving from G/F (characterized by an Epgl,n_ren (the primary energy requirement for non-renewable energy sources) of 188.51 kW/m2 per year. This class is typically associated with low comfort levels and high utility bills) to D/C (with an average non-renewable energy consumption of approximately 119.09 kWh/m2 per year, these buildings have a medium level of energy efficiency, with adequate insulation systems and equipment in place to reduce consumption).
In contrast, for archetype B, the intervention results in a more modest energy class upgrade from E/D (with an average energy consumption of approximately 131.58 kWh/m2 per year. While they fall within a moderate range of non-renewable energy consumption, these buildings could benefit from improvements in insulation systems and the efficiency of their equipment) to C/B (with an average energy consumption of approximately 89.05 kWh/m2 per year, these buildings feature good thermal insulation and efficient systems, which significantly contribute to reducing energy costs). Archetype C achieves an upgrade from E/D to D/C, which is similar to archetype A.
Scenario #2 adds the replacement of windows to the previous insulation efforts. Energy class improvements are evident only for larger homes (categories 3 and 4), as there is no significant change for the smaller size categories, 1 and 2.
Scenario #3 includes insulation, window replacement, and the replacement of heating systems with heat pumps. The energy savings are most pronounced in Archetype A, followed by Archetype C, with Archetype B showing the least savings. The energy classes after this intervention are improved to A2 for smaller categories (with an average non-renewable energy consumption of approximately 88.58 kWh/m2 per year, these buildings are equipped with advanced thermal insulation, highly efficient windows, and high-performance heating and cooling systems) and A3 for larger ones (with an average non-renewable energy consumption of approximately 66.27 kWh/m2 per year, these buildings feature excellent thermal integrity and utilize renewable energy sources for heating and cooling), with no differences among the archetypes.
Scenario #4 incorporates all the previous measures, along with the installation of photovoltaic panels. This comprehensive intervention standardizes the energy class to A4 for all buildings (characterized by an average non-renewable energy consumption of approximately 54.51 kWh/m2 per year, these buildings are constructed with highly insulating materials and high-efficiency systems, ensuring significant energy savings and a high level of thermal comfort), regardless of archetype or size.
Comparing the results obtained in the simulation of the different scenarios with each other, in terms of effectiveness, Scenario #1 significantly improves energy efficiency by focusing on insulation. It is particularly effective for older buildings (Archetype A), where the addition of insulation leads to a notable upgrade in energy class. For newer buildings (Archetypes B and C), the improvements are more modest due to their existing insulation levels. This scenario provides a solid foundation for energy savings but does not address system inefficiencies. Building on Scenario #1, Scenario #2 adds window replacement to the insulation measures. This combination shows enhanced effectiveness, especially in larger homes (categories 3 and 4), where window replacement contributes substantially to energy savings. However, for smaller homes (categories 1 and 2), the benefits are less pronounced, indicating that window replacement has a more significant impact in larger spaces. Scenario #3 offers the most pronounced energy savings across all the archetypes. By including insulation, window replacement, and modern heating systems (heat pumps), it addresses both envelope and system inefficiencies. It achieves the highest energy class upgrades of all the archetypes, with Archetype A seeing the greatest benefit due to its older construction and need for comprehensive improvements. Scenario #4, the most comprehensive scenario, integrates all the previous measures with the addition of photovoltaic panels. This approach standardizes the energy class to A4 for all buildings, regardless of archetype or size, representing the pinnacle of energy efficiency and sustainability. It ensures substantial energy savings and high levels of thermal comfort across the board.
Further analyzing the best archetype for each scenario shows that in Scenario #1, Archetype A benefits the most from insulation alone, achieving a substantial improvement in energy class due to the significant increase in energy efficiency. Scenario #2 shows the greatest improvements in larger homes due to the additional benefits of window replacement when combined with insulation. Scenario #3 results in the most significant energy savings for Archetype A, thanks to comprehensive upgrades including insulation, window replacement, and heat pumps. However, it also provides considerable benefits to Archetypes B and C. Finally, Scenario #4 achieves the highest energy efficiency uniformly across all archetypes and sizes by combining all interventions with photovoltaic panels.
Synthesizing the results obtained by conducting a summary comparison, Scenarios #1 and #2 provide foundational improvements, with #2 enhancing effectiveness through window replacement, particularly in larger homes. Scenario #3 offers a significant step forward by addressing both envelope and system inefficiencies, achieving notable energy class upgrades across all archetypes. Scenario #4 stands out as the most comprehensive and effective approach, achieving the highest energy class universally by integrating all the previous measures and adding photovoltaic panels, although it is also the most complex and costly.
This research addresses a critical gap in sustainable building design by focusing on localized, data-driven strategies for integrating renewable energy and energy-efficient retrofitting into the built environment. The analysis highlights the effectiveness of comprehensive energy retrofits in enhancing energy performance and achieving significant savings, emphasizing the following innovative aspects of this research:
- This research introduces an innovative approach through the use of aggregated data and archetypal analysis for large-scale territorial evaluations, improving precision and scalability in energy efficiency interventions;
- A custom software system was developed to consolidate and analyze data from 2961 residential buildings on Procida, providing insights into the island’s diverse architectural and environmental contexts;
- An aggregated data analysis identified patterns and correlations that individual assessments may have overlooked, offering a macro-level perspective crucial for scalable, urban-wide solutions;
- The archetypal analysis groups buildings into representative types based on their structural and environmental features, enabling tailored and targeted energy intervention strategies;
- These approaches establish a strong framework for optimizing energy consumption and fostering energy self-sufficiency on a larger scale, particularly in residential settings;
- The proposed solutions are context-specific and scalable, contributing to broader environmental sustainability goals.
4. Conclusions
This research shows that the most significant reduction in primary energy demand is achieved through the accumulation of interventions, particularly with the integration of renewable energy systems, like photovoltaics. The key findings include the following:
- A significant performance improvement is observed with the replacement of building systems;
- The annual reduction in local emissions, which is closely linked to primary energy demand reduction, is slightly higher for the first two interventions;
- The largest improvements come from installing photovoltaic systems and integrating renewable energies;
- Combined interventions lead to a 67% reduction in local emissions, promoting environmental sustainability;
- Primary interventions include thermal insulation and system replacement;
- Secondary interventions involve photovoltaic systems and energy storage;
- A holistic approach to building redevelopment, integrating technological and environmental solutions, is crucial for energy efficiency.
- The future research directions proposed are as follows:
- Advancements in renewable energy integration could impact costs, returns on investments, and savings;
- Innovations in building materials and energy systems may lower initial costs, with economies of scale and better financial models optimizing returns on investments;
- Future studies should quantify savings from advanced retrofitting techniques and emerging technologies, like smart grids;
- Environmental impact studies should further assess reductions in energy demand and emissions;
- The longitudinal monitoring of energy performance will help to assess long-term intervention effectiveness and sustainability;
- Research should also explore the economic and social impacts on property values, local economies, and quality of life;
- The integration of advanced building materials and smart energy systems should be further explored;
- Aligning energy efficiency initiatives with urban planning strategies could lead to comprehensive sustainability outcomes.
Exploring these future research directions will significantly refine and expand the findings of this study. By investigating technological advancements, cost analyses, and energy efficiency, researchers can further optimize residential buildings for sustainability, contributing to the development of more energy-efficient, economically viable, and resilient built environments, ultimately advancing the field of sustainable architecture and urban planning.
Author Contributions
Conceptualization, F.M. and G.R.; methodology, F.M. and G.R.; software, F.M. and G.R.; validation, F.M. and S.B.; writing—original draft preparation, G.R., S.B. and F.M.; writing—review and editing, G.R.; visualization, G.R.; supervision, F.M. and S.B.; project administration, F.M. All authors have read and agreed to the published version of the manuscript.
Funding
This research received no external funding.
Institutional Review Board Statement
Not applicable.
Informed Consent Statement
Not applicable.
Data Availability Statement
The original contributions presented in the study are included in the article, further inquiries can be directed to the corresponding author.
Acknowledgments
This contribution is the result of a collective reflection by the authors; it belongs to the recent and ongoing research activities led by the authors within the Department of Planning, Design, Technology of Architecture, Faculty of Architecture, Sapienza University of Rome, on the PNRR project “PE 2: Extended partnership NEST—Network 4 Energy Sustainable Transition | thematic area 2 “Green revolution and ecological transition—2.a. Green energies of the future” | SPOKE 8: Final use optimization, sustainability & resilience in supply chain | WP 8.3 “Low (Zero) carbon technologies for the reduction of energy demand, electrification, and efficiency of final uses”, whose P.I. is Fabrizio Tucci.
Conflicts of Interest
The authors declare no conflicts of interest.
Appendix A

Table A1.
Data requested in the online questionnaire in the direct survey of the population.
Table A1.
Data requested in the online questionnaire in the direct survey of the population.
| User-Related Information | |
|---|---|
| number of occupants in the house: | number of occupants in the house in the morning (8 a.m.–1 p.m.); |
| number of occupants in the house in the afternoon (1 p.m.–7 p.m.); | |
| number of occupants in the house in the evening (7 p.m.–midnght); | |
| number of occupants in the house at night (midnight–8 a.m.). | |
| Architectural–morphological characteristics of the house | |
| year of construction of the building; | |
| number of floors in the building in which the dwelling is located; | |
| average height of floors; | |
| number of rooms (including hallways and corridors); | |
| number of windows; | |
| prevailing color of vertical external walls; | |
| prevailing color of the upper closure (roof or terraced surface); | |
| approximate morphological plan typology of the dwelling; | |
| exposure with respect to the cardinal points (locating north); | |
| sides bordering the outside; | |
| sides bordering other flats or other buildings; | |
| possible presence of other flats above or below; | |
| total surface area of the dwelling; | |
| net area (without perimeter walls) of the dwelling; | |
| presence or absence of thermal insulation of horizontal and vertical opaque closures; | if present, percentage of thermal insulation; |
| characteristics of windows (whether original or replaced); | in case of replacement, number of windows replaced. |
| Characteristics of the plant system | |
| type of winter air-conditioning system (autonomous or centralised): | type of heat generator; |
| type of heat distribution terminal; | |
| regulation system for the winter air-conditioning system (manual thermostat, programmable thermostat, thermostat value on each terminal); | |
| energy class of the dwelling; | |
| presence of summer air-conditioning system: | if present, in which and how many rooms; |
| energy class of summer air-conditioning terminals; | |
| presence of other summer air-conditioning appliances; | |
| type of plant for DHW production; | |
| presence of solar thermal system (for DHW production): | if any, how many panels, orientation, slope and tilt angles; |
| Presence of PV system (for electricity production): | if any, how many panels, orientation, slope and tilt angles; |
| if present, specify the power, the capacity of the system, and whether there is a storage tank; | |
| Characteristics of the appliances in the house | |
| appliances in the kitchen: | hours of daily use of each appliance; |
| type of fridge and volume in litres: | energy class of the appliance; |
| washing clothes (washing machine and/or tumble dryer): | load capacity and number of washes per week performed; |
| energy class of the appliance; | |
| presence of other appliances: | total daily usage in minutes; |
| type of lighting system; | |
| presence and number of TVs: | size of each TV; |
| energy class of the TV; | |
| total daily hours of use; | |
| other electrical devices: | total daily hours of use; |
| presence and number of PCs: | total daily hours of use; |
| type of Internet connection for surfing the Internet; | |
| presence and type of printer: | average number of prints per day; |
| type of personal care appliances: | total daily usage minutes; |
| Energy consumption and costs | |
| usual or seasonal residence; | |
| electricity: | type of contract (free or captive market); |
| actual consumption for various months in kW/h; | |
| actual expenses of the various months in euros; | |
| gas: | type of contract (free or captive market); |
| actual consumption for various months in Sm3; | |
| actual expenses of the various months in EUR; | |
References
- World Economic Forum. The Global Risks Report 2024—19th Edition—Insight Report. Cologne. 2024. Available online: https://www3.weforum.org/docs/WEF_The_Global_Risks_Report_2024.pdf (accessed on 3 August 2024).
- United Nations Environment Programme. Emissions Gap Report 2022: The Closing Window—Climate Crisis Calls for Rapid Transformation of Societies. Nairobi. 2022. Available online: https://www.unep.org/emissions-gap-report-2022 (accessed on 3 August 2024).
- World Green Building Council. Global Policy Principles for a Sustainable Built Environment. London. 2023. Available online: https://worldgbc.org/wp-content/uploads/2023/04/WorldGBC-Global-Policy-Principles_FINAL.pdf (accessed on 3 August 2024).
- World Economic Forum. The Building Sector Is Key to the Fight Against Climate Change; World Economic Forum: Cologny, Switzerland, 2024. [Google Scholar]
- Ashrafuzzaman, M.; Furini, G.L. Climate change and human health linkages in the context of globalization: An overview from global to southwestern coastal region of Bangladesh. Environ. Int. 2019, 127, 402–411. [Google Scholar] [CrossRef] [PubMed]
- Zhang, Y.; Wang, C.H.; Davies, H.A. Net-zero energy buildings: The integration of renewable energy sources and efficient design strategies. Renew. Energy 2021, 164, 1131–1145. [Google Scholar]
- Albadry, S.; Tarabieh, K.; Sewilam, H. Achieving Net Zero-Energy Buildings through Retrofitting Existing Residential Buildings Using PV Panels. Energy Procedia 2017, 115, 195–204. [Google Scholar] [CrossRef]
- World Green Building Council. Beyond Buildings. Why An Integrated Approach to Buildings and Infrastructure Is Essential for Climate Action and Sustainable Development. London. 2021. Available online: https://worldgbc.s3.eu-west-2.amazonaws.com/wp-content/uploads/2022/08/10190455/Beyond-Buildings_reduced_compressed.pdf (accessed on 3 August 2024).
- Romano, G.; Mancini, F. Transformation of a historical building into a Nearly Zero Energy Building (nZEB). J. Phys. Conf. Ser. 2022, 2385, 012008. [Google Scholar] [CrossRef]
- United Nations Environment Programme. Global Status Report for Buildings and Construction: Beyond Foundations: Mainstreaming Sustainable Solutions to Cut Emissions from the Buildings Sector. Nairobi. 2024. Available online: https://www.unep.org/resources/report/global-status-report-buildings-and-construction (accessed on 3 August 2024).
- Zhang, R.; Yin, L.; Jia, J.; Yin, Y. Application of ATS-GWIFBM Operator Based on Improved Time Entropy in Green Building Projects. Adv. Civ. Eng. 2019, 2019, 3519195. [Google Scholar] [CrossRef]
- REN21. Renewables 2024 Global Status Report. 2024. Available online: https://www.lerenovaveis.org/contents/lerpublication/2024_abr_ren21_renewables-2024--global-status-report.pdf (accessed on 3 August 2024).
- EC; Communication from the Commission to the European Parliament; the European Council; the Council; the European Economic and Social Committee; the Committee of the Regions. The European Green Deal. COM(2019) 640 Final, Bruxelles. 2019. Available online: https://eur-lex.europa.eu/resource.html?uri=cellar:b828d165-1c22-11ea-8c1f-01aa75ed71a1.0006.02/DOC_1&format=PDF (accessed on 3 August 2024).
- Haas, R.; Rainer, K.R.; Kecskés, H.R.B. Achieving 2030 targets: The role of national energy and climate plans in EU member states. Energy Rep. 2022, 8, 109–124. [Google Scholar]
- MiSE; MATTM; MIT. Piano Nazionale Integrato per l’Energia e il Clima, Roma. 2020. Available online: https://www.mimit.gov.it/images/stories/documenti/PNIEC_finale_17012020.pdf (accessed on 3 August 2024).
- Baroni, G.; Manzolini, M.; Gattari, V. Piano Nazionale Integrato per l’Energia e il Clima: Analisi delle misure per la sostenibilità energetica e ambientale in Italia. Riv. Ital. Energ. 2020, 37, 112–129. [Google Scholar]
- Civita, M.; Giacobazzi, L.D.; Bolognini, T. Le Politiche Energetiche Italiane Verso il 2030: Un’analisi del PNIEC e dei Suoi Impatti. 2022. Available online: https://www.fondazionesvilupposostenibile.org/wp-content/uploads/dlm_uploads/PNIEC-analisi-preliminare-Stakeholder-Forum-I4C-20-luglio.pdf (accessed on 3 August 2024).
- Camera dei Deputati Servizio Studi XVIII Legislatura. Il Piano Nazionale di Ripresa e Resilienza (PNRR), Roma. 2022. Available online: https://www.governo.it/sites/governo.it/files/PNRR.pdf (accessed on 3 August 2024).
- Sartori, I.; Sechi, P.L.; Castaldi, G. Il Piano Nazionale Integrato per l’Energia e il Clima: Obiettivi e Misure per il 2030 in Italia. 2021. Available online: https://www.efficienzaenergetica.enea.it/glossario-efficienza-energetica/lettera-p/piano-nazionale-integrato-per-l-energia-e-il-clima-2030-pniec.html (accessed on 3 August 2024).
- López, A.; Pardo, F. National Integrated Energy and Climate Plans: An analysis of European Union member states’ strategies. Renew. Sustain. Energy Rev. 2020, 127, 109847. [Google Scholar]
- Moschetti, R.; Brattebø, H. Sustainable Business Models for Deep Energy Retrofitting of Buildings: State-of-the-art and Methodological Approach. Energy Procedia 2016, 96, 435–445. [Google Scholar] [CrossRef]
- Ge, J.; Wang, Y.; Zhou, D.; Gu, Z.; Meng, X. Effects of urban vegetation on microclimate and building energy demand in winter—An evaluation using coupled simulations. Sustain. Cities Soc. 2024, 102, 105199. [Google Scholar] [CrossRef]
- OJEU. Directive (EU) 2018/844 of the European Parliament and of the Council of 30 May 2018 Amending Directive 2010/31/EU on the Energy Performance of Buildings and Directive 2012/27/EU on Energy Efficiency—L 156/75 of 19.6.2018. 2018. Available online: https://eur-lex.europa.eu/legal-content/EN/TXT/PDF/?uri=CELEX:32018L0844 (accessed on 3 August 2024).
- OJEU. Directive (EU) 2018/2002 of the European Parliament and of the Council of 11 December 2018 Amending Directive 2012/27/EU on Energy Efficiency—L 328/210 of 21.12.2018. 2018. Available online: https://eur-lex.europa.eu/legal-content/EN/TXT/PDF/?uri=CELEX:32018L2002 (accessed on 3 August 2024).
- IEA. Net Zero by 2050 A Roadmap for the Global Energy Sector. 2021. Available online: https://iea.blob.core.windows.net/assets/deebef5d-0c34-4539-9d0c-10b13d840027/NetZeroby2050-ARoadmapfortheGlobalEnergySector_CORR.pdf (accessed on 3 August 2024).
- Georgakopoulos, D.; Schuster, H.; Baker, D.; Cichocki, A. Managing escalation of collaboration processes in crisis mitigation situations. In Proceedings of the 16th International Conference on Data Engineering (Cat. No.00CB37073), San Diego, CA, USA, 29 February–3 March 2000; pp. 45–56. [Google Scholar]
- Mousazadeh, H.; Sadeghi, M.M.; Ahmed, R.S. Advancements in smart grid technologies and their impact on local renewable energy adoption and emissions reduction. J. Clean. Prod. 2022, 335, 130261. [Google Scholar]
- Sovacool, B.K.; Baum, C.M.; Low, S.; Roberts, C.; Steinhauser, J. Climate policy for a net-zero future: Ten recommendations for Direct Air Capture. Environ. Res. Lett. 2022, 17, 074014. [Google Scholar] [CrossRef]
- Hesslerová, P.; Pokorný, J.; Huryna, H.; Seják, J.; Jirka, V. The impacts of greenery on urban climate and the options for use of thermal data in urban areas. Prog. Plan. 2022, 159, 100545. [Google Scholar] [CrossRef]
- Madushika, U.G.D.; Ramachandra, T.; Karunasena, G.; Udakara, P.A.D.S. Energy retrofitting technologies of buildings: A review-based assessment. Energies 2023, 16, 4924. [Google Scholar] [CrossRef]
- Miller, W.; Thornton, P.T. Comprehensive renovation strategies for existing buildings: From energy efficiency to zero emissions. J. Build. Perform. 2021, 12, 66–81. [Google Scholar]
- Tucci, F.; Altamura, P.; Cecafosso, V.; Turchetti, G.; Giampaoletti, M.; Nava, F.; Pani, M.M.; Romano, G.; Tulelli, V.; Dalsasso, C.; et al. Rapporto “Verso la Neutralità Climatica Delle Green City: Approcci, Indirizzi, Strategie e Azioni”, Sapienza Università di Roma, Roma. 2021. Available online: https://www.greencitynetwork.it/wp-content/uploads/stati_generali_green_economy_La_neutralita_climatica_delle_citta.pdf (accessed on 3 August 2024).
- Ma, K.; Yu, Y.; Yang, B.; Yang, J. Demand-Side Energy Management Considering Price Oscillations for Residential Building Heating and Ventilation Systems. IEEE Trans. Ind. Inform. 2019, 15, 4742–4752. [Google Scholar] [CrossRef]
- Baiani, S.; Altamura, P.; Turchetti, G.; Romano, G. Transizione Energetica e Circolare del Patrimonio Industriale. Il Caso Dell’ex SNIA a Roma/Energy and Circular Transition of the Industrial Heritage. The Ex SNIA case in Rome. Agathón 2024, 15, 190–203. [Google Scholar]
- Cappelletti, F.; Dalla Mora, T.; Peron, F.; Romagnoni, P.; Ruggeri, P. Building renovation: Which kind of guidelines could be proposed for policy makers and professional owners? Energy Procedia 2015, 78, 2366–2371. [Google Scholar] [CrossRef]
- Centro Ricerche Economiche, Sociologiche e di Mercato nell’Edilizia (CRESME). Incentivi e Riduzione del Rischio Sismico in Italia, Cosa Fare, Come Fare. 2018. Available online: https://www.cresme.it/wp-content/uploads/2023/04/Italia_Antisismica_abstract.pdf (accessed on 3 August 2024).
- OJEU. Communication from the Commission to the European Parliament, The Council, The European Economic and Social Committee and the Committee of the Regions ‘Fit for 55’: Delivering the EU’s 2030 Climate Target on the Way to Climate Neutrality—COM(2021) 550 Final, Bruxelles. 2021. Available online: https://eur-lex.europa.eu/legal-content/EN/TXT/HTML/?uri=CELEX%3A52021DC0550 (accessed on 3 August 2024).
- OJEU (2024), Directive (EU) 2024/1275 of the European Parliament and of the Council of 24 April 2024 on the Energy Performance of Buildings (Recast), 2024/1275. Bruxelles. Available online: https://eur-lex.europa.eu/legal-content/EN/TXT/PDF/?uri=OJ:L_202401275 (accessed on 3 August 2024).
- Bellocchi, S.; De Falco, M.; Gambini, M.; Manno, M.; Stilo, T.; Vellini, M. Opportunities for power-to-Gas and Power-to-liquid in CO2-reduced energy scenarios: The Italian case. Energy 2019, 175, 847–861. [Google Scholar] [CrossRef]
- MITE. Dipartimento Energia—Direzione Generale Infrastrutture E Sicurezza—La situazione energetica nazionale nel 2021, Roma. Available online: https://dgsaie.mise.gov.it/pub/sen/relazioni/relazione_annuale_situazione_energetica _nazionale_dati _2021.pdf (accessed on 3 August 2024).
- REN21. Renewables 2022 Global Status Report. REN21 Secretariat c/o UN Environment Programme, Paris. 2022. Available online: https://www.ren21.net/wp-content/uploads/2019/05/GSR2022_Full_Report.pdf (accessed on 3 August 2024).
- King, R.; Vullnetari, J. From shortage economy to second economy. J. Rural. Stud. 2016, 44, 198–207. [Google Scholar] [CrossRef][Green Version]
- Gonzalez Benson, O.; Smith, R.; Song, C. Resettlement cities: A mixture model analysis of the dispersion and placement strategy. Cities 2022, 126, 103698. [Google Scholar] [CrossRef]
- Ahmed, S.; Ali, A.; D’Angola, A. A Review of Renewable Energy Communities: Concepts, Scope, Progress, Challenges, and Recommendations. Sustainability 2024, 16, 1749. [Google Scholar] [CrossRef]
- Genave, A.; Blancard, S.; Garabedian, S. An assessment of energy vulnerability in Small Island Developing States. Ecol. Econ. 2020, 171, 106595. [Google Scholar] [CrossRef]
- Elahee, K. Energy Management Challenges in a Small Island Economy. Energy Environ. 2010, 21, 803–813. [Google Scholar] [CrossRef]
- Battistelli, F.; Messina, A.; Tomassetti, L.; Montiroli, C.; Manzo, E.; Torre, M.; Tratzi, P.; Segreto, M.; Chu, C.-Y.; Paolini, V.; et al. Assessment of Energy, Mobility, Waste, and Water Management on Italian Small Islands. Sustainability 2023, 15, 11490. [Google Scholar] [CrossRef]
- Corsini, A.; Delibra, G.; Pizzuti, I.; Tajalli-Ardekani, E. Challenges of renewable energy communities on small Mediterranean islands: A case study on Ponza island. Renew. Energy 2023, 215, 118986. [Google Scholar] [CrossRef]
- Leal Filho, W.; Balogun, A.-L.; Surroop, D.; Salvia, A.L.; Narula, K.; Li, C.; Hunt, J.D.; Gatto, A.; Sharifi, A.; Feng, H.; et al. Realising the Potential of Renewable Energy as a Tool for Energy Security in Small Island Developing States. Sustainability 2022, 14, 4965. [Google Scholar] [CrossRef]
- Romano, G.; Baiani, S.; Mancini, F. Energy Consumption Profile. Profilo di Consumo Energetico. Google Docs. Available online: https://docs.google.com/forms/d/e/1FAIpQLSeNhaE08Z8wVL_k9eWVmwAouT39VQ5qMabEJ_sk0CkUuTDKiQ/viewform (accessed on 3 August 2024).
- Mancini, F.; Romano, S.; Lo Basso, G.; Cimaglia, J.; De Santoli, L. How the Italian Residential Sector Could Contribute to Load Flexibility in Demand Response Activities: A Methodology for Residential Clustering and Developing a Flexibility Strategy. Energies 2020, 13, 3359. [Google Scholar] [CrossRef]
- Suomalainen, K.; Eyers, D.; Ford, R.; Stephenson, J.; Anderson, B.; Jack, M. Detailed comparison of energy-related time-use diaries and monitored residential electricity demand. Energy Build. 2019, 183, 418–427. [Google Scholar] [CrossRef]
- Soto, A.M.; Jentsch, M.F. Comparison of prediction models for determining energy demand in the residential sector of a country. Energy Build. 2016, 128, 38–55. [Google Scholar] [CrossRef]
- ARERA. Analisi dei Dati dei Clienti Domestici. Milano. 2022. Available online: https://www.arera.it/dati-e-statistiche/dettaglio/analisi-dei-consumi-dei-clienti-domestici (accessed on 3 August 2024).
- Schweiker, M.; Shukuya, M. Comparison of theoretical and statistical models of air-conditioning-unit usage behaviour in a residential setting under Japanese climatic conditions. Build. Environ. 2009, 44, 2137–2149. [Google Scholar] [CrossRef]
- Ren, X.; Yan, D.; Wang, C. Air-conditioning usage conditional probability model for residential buildings. Build. Environ. 2014, 81, 172–182. [Google Scholar] [CrossRef]
- Cosenza, G. Gli Spazi Dell’architettura di Procida, 1st ed.; N. 8698 BIS.; Edizioni Scientifiche Italiane: Napoli, Italy, 1968. [Google Scholar]
- Muro, G.; Muro, V.; Ridda, L. Piano del Colore dei Centri Storici Dell’isola di Procida di Primo Ambito; Procida: Napoli, Italy, 2002. [Google Scholar]
- Fellella, F.; Ambrosino, R.; Perrella, S.; Rossello, C.; Stasi, A.; Squillante, R.; Massarotti, N.; Vanoli, L.; De Luca, G.; Fabozzi, S. Piano D’azione Per L’energia Sostenibile (PAES)—Comune di Procida (NA). 2015. Available online: https://www.paesitalia.it/azioni/?r=4 (accessed on 3 August 2024).
- Miraglia, F. Atlante delle Tecniche Costruttive di Terra di Lavoro Murature in Tufo Grigio (XIII-XV); Armando Caramanica Editore: Marina di Minturno, Italy, 2018; ISBN 978-88-7425-110-0. [Google Scholar]
- GURI. DECRETO LEGISLATIVO 19 Agosto 2005, n. 192|Attuazione della Direttiva 2002/91/CE Relativa al Rendimento Energetico Nell’edilizia. (GU Serie Generale n.222 del 23-09-2005—Suppl. Ordinario n. 158). 2005. Available online: https://www.gazzettaufficiale.it/eli/id/2005/09/23/005G0219/sg (accessed on 3 August 2024).
- Regione Campania. Rapporto Annuale Sulle Attestazioni di Prestazione Energetica (APE)|Indice di Prestazione Energetica Globale non Rinnovabile (EPgl,n_ren) Medio. 2023. Available online: https://www.regione.campania.it/regione/it/tematiche/certificazione-energetica-edifici-ape/rapporto-annuale-sulle-attestazioni-di-prestazione-energetica-ape?page=1 (accessed on 3 August 2024).


Disclaimer/Publisher’s Note: The statements, opinions and data contained in all publications are solely those of the individual author(s) and contributor(s) and not of MDPI and/or the editor(s). MDPI and/or the editor(s) disclaim responsibility for any injury to people or property resulting from any ideas, methods, instructions or products referred to in the content. |
© 2024 by the authors. Licensee MDPI, Basel, Switzerland. This article is an open access article distributed under the terms and conditions of the Creative Commons Attribution (CC BY) license (https://creativecommons.org/licenses/by/4.0/).