Article

Spatial Influence of Digital Economy on Carbon Emission Efficiency of the Logistics Industry across 30 Provinces in China

1
School of Economics and Management, China University of Mining and Technology, Xuzhou 221116, China
2
Business School, Suzhou University, Suzhou 234000, China
*
Author to whom correspondence should be addressed.
Sustainability 2024, 16(18), 8086; https://doi.org/10.3390/su16188086
Submission received: 28 July 2024 / Revised: 12 September 2024 / Accepted: 14 September 2024 / Published: 16 September 2024

Abstract

:
The logistics industry (LI) is a key pillar of the global economy, and its carbon emission efficiency (CEE) is crucial for achieving carbon neutrality. The rapid development of the digital economy (DE) has had a profound impact on the LI, but the spatial impact on its CEE is currently unclear and requires further research. Firstly, based on the collection of relevant data, we use the entropy weight method and linear weighted sum method to measure the level of development of the DE. Secondly, the SBM model is used to measure the CEE level of the LI. Using Moran’s I index model and OLS and GWR models, we analyze the impact and spatial distribution characteristics of the DE on the CEE of the LI and propose development strategies. The article uses statistical data from 30 provinces in China from 2013 to 2022 as an example to demonstrate the implementation process of the method. The results show that the DE has a positive impact on the CEE of the LI, and there are spatial differences. Based on this, this article proposes policy recommendations for the development of green and low-carbon logistics and digital logistics that are tailored to local conditions, providing theoretical and methodological support for low-carbon research in the LI, and providing reference for other countries and regions to explore the path of green and low-carbon transformation.

1. Introduction

Global attention is now focused on carbon emissions and the related climate challenges [1]. The China Carbon Accounting Database states that in 2022, China’s total carbon emissions made up 28.87% of the world’s total. China, a significant source of worldwide carbon emissions, has made a commitment to actively reduce carbon emissions, aiming to reach carbon neutrality by 2060 and a carbon peak by 2030 [2,3]. It is crucial for China to advocate for a high-quality economic development model, create a new environmentally friendly and low-carbon growth pattern, and achieve the “dual carbon” goals [3,4,5]. Economic progress is greatly aided by the logistics sector. Its development influences direct energy consumption-related carbon emissions along with indirect operational carbon emissions [6,7]. Improving carbon emission efficiency (CEE) and achieving low-carbon transformation in the logistics industry (LI) are crucial components of China’s “dual carbon” goals, which encourage superior economic development [8]. The digital economy (DE) is a crucial force that drives economic transformation and a new type of economy. China’s DE is at a stage of rapid development. The Global DE White Paper 2023 indicated that China’s DE has a compound annual growth rate of 14.2%, which is 1.6-fold the overall compound annual growth rate of the DE of the United States, China, Germany, Japan, and South Korea during the same period; this rapid growth is gradually influencing various fields [9]. The DE serves as a crucial element in fostering the development of an ecological civilization, acting as a novel catalyst for economic expansion [10]. In the process of achieving the “dual carbon” goal, emphasizing the development of novel technologies and promoting the digitization and advancement of heritage industries is conducive to improving energy utilization efficiency [11,12]. The development of the DE has significantly improved resource utilization, thereby reducing energy consumption, which is advantageous for reducing carbon emissions and improving CEE [13,14,15]. Researching how the DE may encourage carbon reduction in the LI is important from a practical standpoint [11,16]. Therefore, elucidating the influence of the DE on LI’s CEE and determining whether there are any regional differences is crucial. The measurement of scientific and objective carbon emission data in LI provides strong support for the government to formulate policies. How the DE affects the CEE of China’s LI is worthy of in-depth exploration by various departments in their upcoming strategies. Studying the impact of the DE development on the LI’s CEE can help achieve carbon reduction and encourage the growth of an economy characterized by excellence and sustainable prosperity. Therefore, this endeavor has become a focus in academia and government departments.
First, research on LI’s CEE is rich in content and diverse from a research perspective. CEE is currently a popular research topic in LI. LI achieves CEE by reducing carbon emissions, which leads to higher economic output [8]. Therefore, scholars have proposed various evaluation indicators and methods for CEE using different models to calculate LI’s CEE [8,17,18,19]. Simultaneously, certain scholars have begun to consider the factors influencing LI’s CEE [20] and the specific regional LI’s CEE, including provincial and urban levels [21]. In addition, researchers have studied the geographical evolution features of the CEE in LI [22]. Based on a series of studies, we propose strategies to improve LI’s CEE [20,21,22].
Second, studies have been undertaken to explore the correlation existing between the DE and CEE. Han et al. (2022) indicated that the DE has promoting effects on CEE levels and carbon reduction [14,15,16]. According to other academics, it is unclear how DE and carbon emissions are related [23]. Research has been conducted on the role of the DE in CEE from different perspectives, such as the impact of the DE on CEE in Chinese cities [24], the marine carbon emission rate [25], industrial CEE [26], and carbon emission performance [27]. The primary research methods used include Tobit regression and the least squares regression model [23,24,25,26,27], and to learn more about how the DE affects the CEE of the provincial LI, more research is required.
Third, relevant scholars have also conducted research on the factors influencing CEE in LI. While clarifying the concept of carbon emission efficiency, scholars point out that population, technology, spatial agglomeration [7], industrial structure [9,15], environmental regulations [20], LI development level and economic development level [20,21], optimization of the DE and energy structure, technological innovation, and application [10,11,13,14,15,16,22,28,29] are the main factors affecting CEE of LI, emphasizing that the DE may reduce carbon emissions by improving CEE [22,28].
Finally, research on the logistics industry’s CEE and the construction of a DE indicator system should be conducted. The majority of academics hold the view that capital, labor force, and utilization of energy are the most crucial input production factors in efficiency measurement [12,30,31] and that each province is aiming to maximize its output and minimize carbon emissions. Therefore, the total output value of LI and carbon dioxide emissions were selected as the expected and unexpected output indicators [21,28]. Regarding the measurement index system of the DE, Liu and Wang (2022) measured the evolution of the rate of internet penetration, the number of workers, production connected to the internet, and the advancement of digital inclusive finance [24]. Three factors were used by Liao et al. to create indicators: digital economic innovation, digital economic development, and digital economic infrastructure [31]. Four factors were taken into consideration when Wei et al. (2022) created indicators: data value, industrial digitization, digital governance, and digital industrialization [32]. Yu et al. (2023) constructed indicator systems from four aspects: digital infrastructure, digital industrialization, digital technology innovation, and industrial digitization [28,33,34]. This study provides a reference and guidance for the establishment of a CEE and DE indicator system for LI.
Research on CEE and DE by domestic and foreign scholars has provided crucial references for exploring the effect of the DE on LI’s CEE. However, certain shortcomings remain. Specifically, although the role of the DE in CEE has been studied, most research has only considered the impact of the DE on urban and provincial carbon emissions or efficiency, as well as its impact on industrial CEE. Overall, further exploration is required to elucidate the impact of the DE on LI’s CEE and spatial distribution characteristics.
  • CEE of LI and DE are two intricate industrial systems that encompass various dimensions, multiple source elements, and multiple indicators. Therefore, accurately measuring and evaluating the CEE of LI and DE systems is a crucial prerequisite for conducting research on the effect of the DE on LI’s CEE.
  • Several factors must be considered when studying the effect of the DE on LI’s CEE. Therefore, it is necessary to scientifically perform data processing and model construction to provide a quantitative basis for proposing targeted policy recommendations on LI’s CEE and the development of the DE.
  • Considering regional resource endowments, LI, and the level of DE development, it is necessary to formulate tailored policies for the digital and low-carbon transformation development of LI, as well as DE development strategies.
To overcome these difficulties, this study draws and conducts research based on the research ideas of Wang et al. [24,27,28,30,33]. This study is more systematic and comprehensive in the construction of indicator systems than existing studies [9,21,28,33]. We measure from the perspective of all factors, comprehensively considering the expected capital output, manpower, energy consumption, output value, and unexpected output of CO2 emissions in LI. In addition, we comprehensively consider the infrastructure construction of DE, digital industries, industrial digitization, and innovative development to construct a DE indicator system. We put forward a novel methodology intended to address measuring, evaluating, and analyzing the impact of the DE on LI’s CEE. This method is applied to 30 provinces in China to verify its effectiveness. Then, depending on the evaluation results, we make recommendations and targeted countermeasures. To fortify professionals and policymakers within the logistics and DE industries, our methodology provides a numerical basis for policy recommendations.
Therefore, the framework structure of this article is as follows: Section 2 is Materials and Methods, which introduces data collection and processing, data models, and applications. Section 3 is a case study, taking 30 provinces in China (due to the lack of data in Xizang, Taiwan, Hong Kong, and Macao, the sample is not considered) as an example, to measure, evaluate, and analyze the impact of the digital economy on the carbon emission efficiency of the logistics industry. Section 4 is discussion. Section 5 conclusion, policy implications and directions for future research.

2. Materials and Methods

2.1. Research Framework

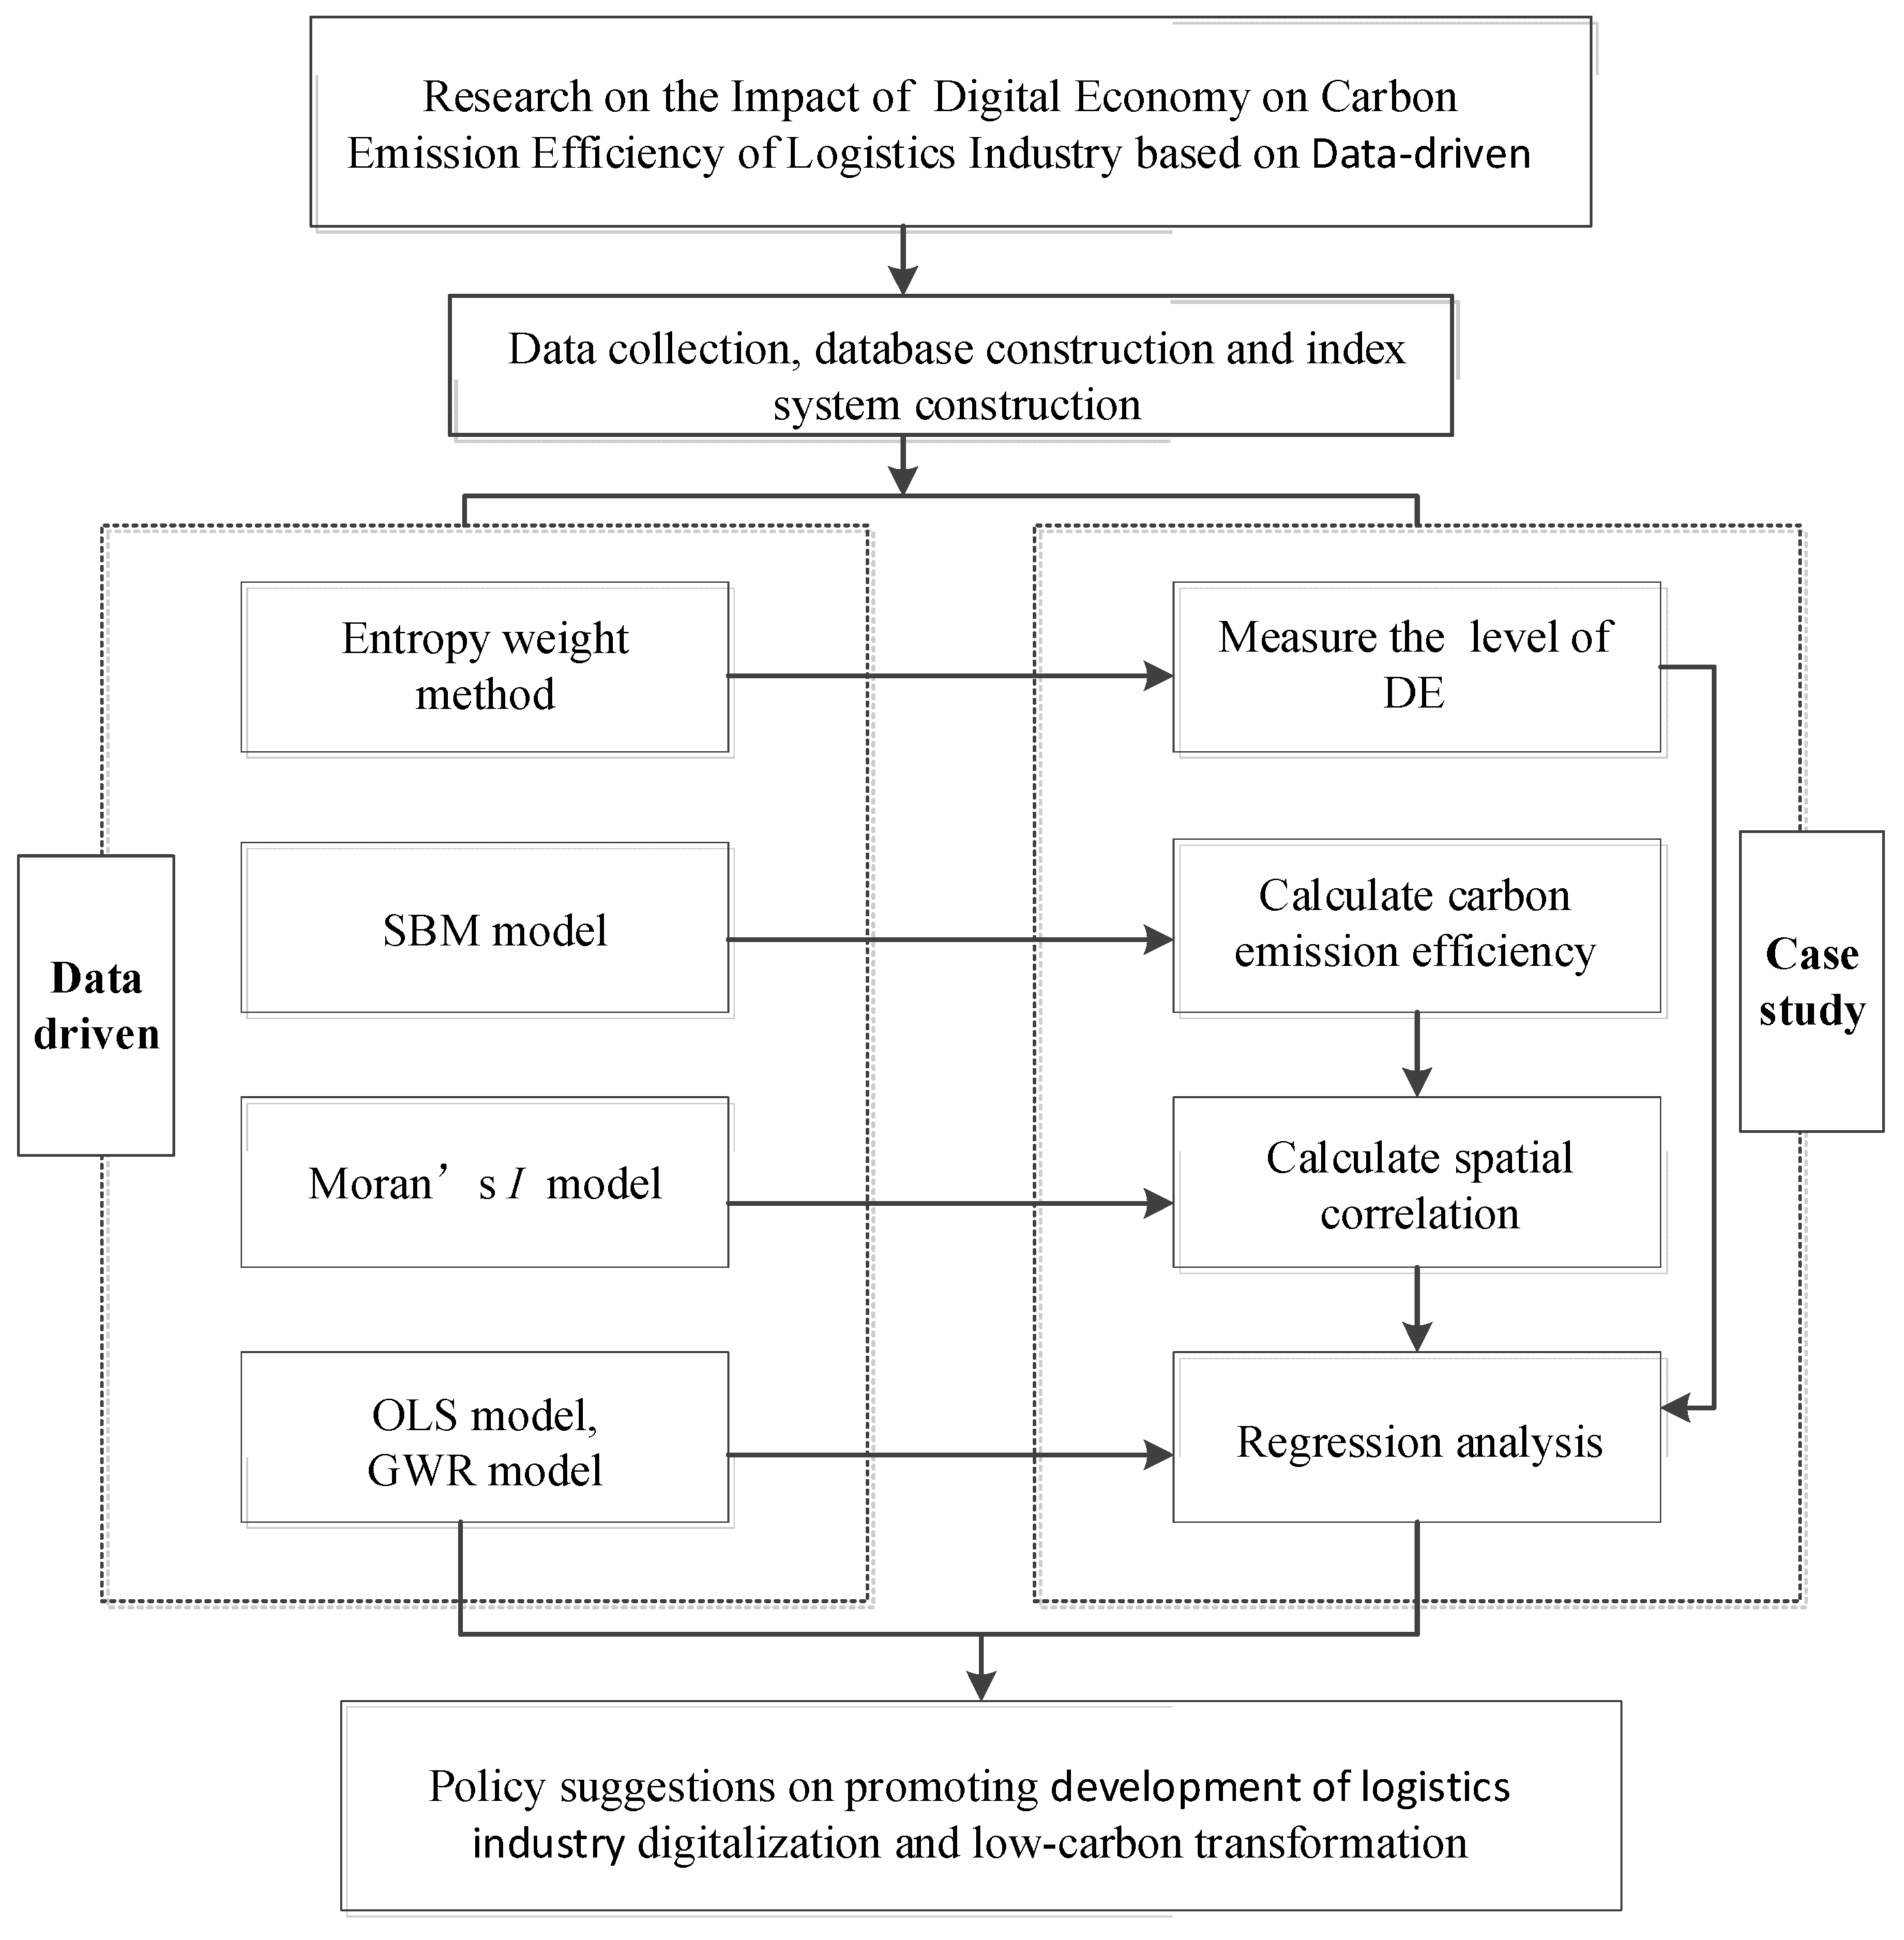
This study collects and processes data related to CEE in the DE system and LI, embeds them into appropriate models for calculation and evaluation, applies the results to real-life scenarios, and proposes targeted policy recommendations.
This research implements the slacks-based measure (SBM) model with unexpected outputs to measure LI’s CEE to better reflect objective facts. The entropy weight and linear weighted sum methods were used to assign weight and measure the level of DE development, eliminating errors caused by inconsistent indicator dimensions. We created geographically weighted regression (GWR) and ordinary least squares (OLS) models to simulate regression and compared them after assessing the spatial correlation of CEE in the logistics sector using Moran’s I model. We visualized the spatial distribution characteristics of the regression coefficients for the impact of DE on CEE in LI. Based on this, countermeasures and suggestions were proposed to promote digital and low-carbon transformation and the development of LI. The process of this method is illustrated in Figure 1.

2.2. Index System

This study was based on research results on CEE in LI [6,7,8,9,10,20,21,22] and on the connotation and measurement of the DE [28,29,32,33,34]. The indicators were selected based on scientific and quantifiable principles. We constructed LI’s CEE and DE indicator system which includes two systems and twenty-six indicators and conducted research to gauge the system’s development status.
CEE system indicators for LI were built from the input and output perspectives. In contrast to earlier research indicators [6,7,8,9,20,21,22], in the input indicators of this study, capital represents the fixed assets investment amount of LI, labor indicates LI employees, and energy reflects the energy consumption of LI; in the output indicators, the expected output represents the output value of LI, and the expected output is the measurement of carbon dioxide emissions. This indicator system is more scientific compared to those of the other studies. The indicator system of the DE system integrates existing research [28,29,32,33,34,35,36]. The approach is made more comprehensive by adding a digital inclusive finance index and taking into account the building of infrastructure, the digital industry, digital innovation, and the industrial digitalization level (Table 1).
Digital infrastructure, the industrialization of digital technology, digital innovation, and the level of digitalization within industries are direct influences on the development of the DE. The integration of digital technology with LI intervenes in the industry’s carbon emissions and economic output. The application of digital technology and platforms, while predicated on a certain energy consumption [36], provides essential support for intelligent distribution systems and supply chain management within LI. The widespread adoption and application of digital technology can reduce LI’s empty driving rate and carbon emissions, achieving cost reduction and efficiency enhancement [37]. It can break through the constraints of time and space, match supply with demand, and promote the intelligent and green, low-carbon development of LI, thereby reducing carbon emissions [20,38,39]. The economic output of the LI is increased by the popularization and application of digital technology. For instance, the higher the level of digital infrastructure such as mobile phone penetration, the more accurate the prediction of logistics demand and supply, leading to higher service satisfaction and, consequently, higher economic benefits. Therefore, Hypothesis 1 is proposed: the DE has a promoting effect on CEE of LI. Additionally, considering the different development levels of the DE in various provinces [40,41,42], the impact on CEE of the LI may also vary. Hence, Hypothesis 2 is proposed: the promoting effect of the DE on the CEE of LI exhibits spatial heterogeneity.
Drawing on existing research findings [8,22,31,32,33,34], we constructed a variable indicator system that includes the impact of the DE on LI’s CEE, as shown in Table 2. The LI’s CEE was the dependent variable, and the level of DE development was the explanatory variable. First, LI’s level of development directly impacts its CEE. Second, economic development both raises the carbon emissions of LI and offers institutional, financial, and technical support for reducing carbon emissions. Third, optimizing and upgrading industrial structures can promote the development of green, environmentally friendly, and high-tech industries. Industrial linkages can promote the green and environmentally friendly transformation of LI and reduce carbon emissions. The fourth is to increase environmental supervision efforts, promote green and clean energy to replace fossil fuels, and force the logistics sector to shift towards green and environmentally friendly development. Finally, integrating with the outside world can expand the boundaries of the logistics market; it is advantageous for LI, optimizing resource allocation and reducing carbon emissions within a larger market scope.

2.3. Data Source and Processing

We selected 30 provinces nationwide as samples (Xizang, Hong Kong, Macao, and Taiwan were not involved in this study due to data availability and other reasons). Divided by economy, the analysis was conducted in four regions: western, eastern, central, and northeastern regions. The data on CEE in LI and DE systems were obtained from the China Statistical Yearbook, China Internet Development Report, China Information Industry Yearbook, and China Energy Yearbook from 2014 to 2023. Data for individual indicators were unavailable for 2020, and the missing value processing method such as interpolation and averaging were adopted to ensure completion [43]. To avoid the price impact caused by inflation, the GDP and other indicators were adjusted to be at constant prices based on 2012 data. We searched for fossil fuel conversion and carbon emission coefficients using the International Panel on Climate Change (IPCC) National Greenhouse Gas Emission Inventory Guidelines (IPCC 2018) [43], and to calculate the energy consumption [7] and carbon emissions of the LI (Equation (1)).

2.3.1. Calculation of Carbon Emissions

In most countries, 70% of carbon emissions originate from conventional energy consumption, and the increase in greenhouse gases is primarily due to the combustion of fossil fuels. The consumption of raw coal, kerosene, coke, crude oil, gasoline, diesel, and natural gas in LI was included in LI’s overall energy usage according to the standard [44], referring to the carbon emissions calculation method and parameters published by the IPCC in 2006. The equivalent carbon dioxide emissions of the logistics sector were calculated using the formula for computing carbon emissions from energy consumption. The equation used was as follows:
C i = j = 1 8 X i j × B j
where C i is the carbon dioxide emissions from the LI in the i-th province (city) in 10,000 tons, j = 1, 2 … 8, is the type of energy, X i j symbolizes the energy source’s consumption (the j-th), and B j symbolizes carbon emission coefficient (the j-th energy source) in the LI.

2.3.2. Calculating the Weights of DE System Indicators

To increase the precision of the evaluation results for the development level of the DE and eliminate the bias of subjective weights and other factors, weights were assigned to each indicator using the entropy weighting approach [41]. The following were the precise stages in the calculation:
Step 1: We used the range normalization method to perform dimensionless standardization on the raw DE data. For the positive and negative indications, which have different interpretations, separate algorithms were used, as shown in (2) and (3):
Positive   index : Y t j = a t j m i n j m a x j m i n j
Negative   indicator :   Y t j = m a x j a t j m a x j m i n j
where a t j an Y t j represent the values of the t-th year and j-th indicator data (t = 1, 2, 3 …, n; j = 1, 2, 3 …, m), respectively, of the DE subsystem before and after dimensionless standardization. The m a x j representative in this study is 1.01-fold the MAX value in the j-th indicator data of the DE system throughout the time spent studying. The m i n j symbolizes 0.99-fold the minimum value of the j-th indicator data in the DE system during the study period. This indicates that m a x j = 1.01 m a x   a t j ; m i n j = 0.99 m i n   a t j .
Step 2: we determined the j-th indicator’s proportion in year t, as shown in (4):
P t j = Y t j Y t j
Step 3: we calculated e j of index j, as shown in (5):
e j = k P t j ln P t j
In Equation (5), k > 0 , k = 1 ln n , n refers to the year, e j 0 .
Step 4: we calculated the information entropy redundancy g j of index j,
g j = 1 e j
Step 5: we calculated the weight w j of indicator j, as shown in (7):
w j = g j / g j
where w j represents the weight of the j-th indicator; the larger the weight, the smaller the entropy value and the less information it carries.

2.4. Data Model

2.4.1. Model of Development Level

Utilizing a multi-objective linear weighting approach, the comprehensive development level of the DE was determined. The specific Equation (8) is as follows:
F i = j = 1 m w j Y t j
In Equation (8), the higher the value of F i , the higher the level of comprehensive development of the DE. Among them, the weight of the j-th indicator in the DE indicator system calculated in formula (7), Y t j represents the standardized value of the jth DE system indicator in the t-th year.

2.4.2. SBM Model for Unexpected Output

Tone’s (2001) proposition introduced the SBM model to address the oversight of slack variables in radial efficiency models. Additionally, the model’s attributes of being non-radial, non-angular, and non-dimensional mitigate biases stemming from indicator dimensions and angle-related choices [45]. Therefore, we adopted an unexpected output SBM model to measure the LI’s CEE, with the basic formula as follows:
m i n   θ = 1 1 m i = 1 m s i _ x i k 1 + 1 q 1 + q 2 ( r = 1 q 1 s r g y r k g + r = 1 q 2 s r b y r k b ) s . t . X λ + s = x k Y g λ s g = y k g Y b λ + s b = y k b s , s g , s b , λ 0
where θ is the LI’s CEE value. An efficiency value of one signifies that the optimal performance threshold has been achieved. The super-efficiency model, in contrast to traditional DEA, enables the identification of efficient decision-making units (DMUs) with efficiency scores exceeding unity. Efficiency ( θ ) escalates as the parameters K, ranging from 1 to n—where n is the aggregate of DMUs—alongside m,   q 1 , and q 2 denote the quantities of inputs, expected, and unexpected outputs for each unit. x i k , y r k g , and y r k b indicate the input vector, expected output vector, and unexpected output vector of the decision-making unit; X, Y g , and Y b indicate the input, expected output, and unexpected output matrices, respectively; λ is a column vector; s , s g , a n d   s b are relaxation variables for the input, expected output, and unexpected output, respectively.

2.4.3. Moran’s Index Model

The spatial dependence of LI’s CEE was analyzed using the global Moran’s I index [46], and the calculation formula is as follows:
I = i = 1 n j = 1 n w i j θ i θ ¯ θ j θ ¯ S 2 i = 1 n j = 1 n w i j
where S 2 = i = 1 n e i e ¯ /n is the variance, and w i j is the weight correlation coefficient of the LI’s CEE between the i-th and j-th provinces ( i j ); the range of values I is [−1,1], and when it is greater than zero, it indicates that the CEE of the inter-provincial LI is positively correlated in space; which is to say, the high-value areas of the inter-provincial LI’s CEE are adjacent to the high-value areas, or the low-value areas are adjacent to the low-value areas. When the value of I is zero, it indicates that the CEE of the inter-provincial LI is randomly distributed in space and has no correlation. When it is less than zero, it indicates that the CEE of the inter-provincial LI is negatively correlated in space; that is, high-value areas of the inter-provincial LI’s CEE are adjacent to low-value areas.

2.4.4. OLS Model

The OLS model is the most fundamental form of regression analysis that requires the least number of model conditions to minimize the sum of the squared distances from all observations on the scatter plot to the regression line [47].
y = β 0 + β 1 x 1 + β 2 x 2 + β n x n + ε
where y is the dependent variable, β 1 , β 2 β n is the regression coefficient, x 1 , x 2 x n is the explanatory variable, and ε is the random error/residual term.

2.4.5. GWR Model

We explored spatial heterogeneity by constructing a GWR surface model. This local regression model utilizes the different spatial positions of each element for calculations, which can solve the problem of spatial non-stationarity and express the spatial dependence between variables [48]. Its model is
y i = β 0 μ i , v i + k = 1 n β k μ i , v i x i k + ε i
where y i is the dependent variable, x is the explanatory variable, β 0 μ i , v i is the spatial coordinate of data i , and ε i is the random error/residual term.

2.5. Data Application

DE has gradually become a crucial engine for high-quality economic development, and digital transformation will also become an inevitable trend for digital transformation and high-quality development in various industries. However, in the DE era, the digitalization, low-carbon transformation, and high-quality development of the LI still face challenges. Therefore, studying the effect of the DE on LI’s CEE has crucial practical significance. Based on a comprehensive consideration of the CEE of the DE and LI, this study constructed an indicator system consisting of two subsystems. Because the two systems have multiple sources of data, involve a wide range, and contain a large amount of data, this study adopted a data-driven approach. This research leveraged data-centric techniques to precisely gauge, assess, and pinpoint the influence of the DE on LI’s carbon efficiency and emissions (CEE). Drawing from the empirical evaluation, strategic policy insights were formulated to furnish a foundation for decision-making among professionals and executives in the realms of the DE and LI. Specific applications are shown in Figure 2.

3. Case Study

3.1. Background of the Case Study

Utilizing the methodological models, this paper selects 30 provinces (excluding Tibet and Hong Kong, Macau, and Taiwan due to data availability and other reasons) as the sample. By 2023, the value added by China’s core DE industries has already reached 10% of the Gross Domestic Product (GDP), achieving the target set in the “14th Five-Year Plan for DE Development” for the year 2025 ahead of schedule. China’s logistics market has been the largest in the world for seven consecutive years, with the total social logistics value reaching CNY 347.6 trillion in 2022, and the total revenue of the LI being CNY 12.7 trillion. However, behind the rapid growth of China’s LI lies a significant amount of energy consumption, and the emissions of CO2 and pollutants have been increasing annually. The development of the DE can promote the digital transformation of LI, breaking the traditional economic growth model characterized by high energy consumption and high pollution through the input of multiple factors into the development of LI, and advancing the green development of the economy. Therefore, this paper measures the development level of China’s DE and CEE of LI, analyzes the spatial impact of China’s DE on CEE of LI, and puts forward countermeasures and suggestions tailored to local conditions. This is of great significance for promoting the sustainable development of China’s and the world’s DE and LI.

3.2. Results

3.2.1. Analysis of the Development Level of DE

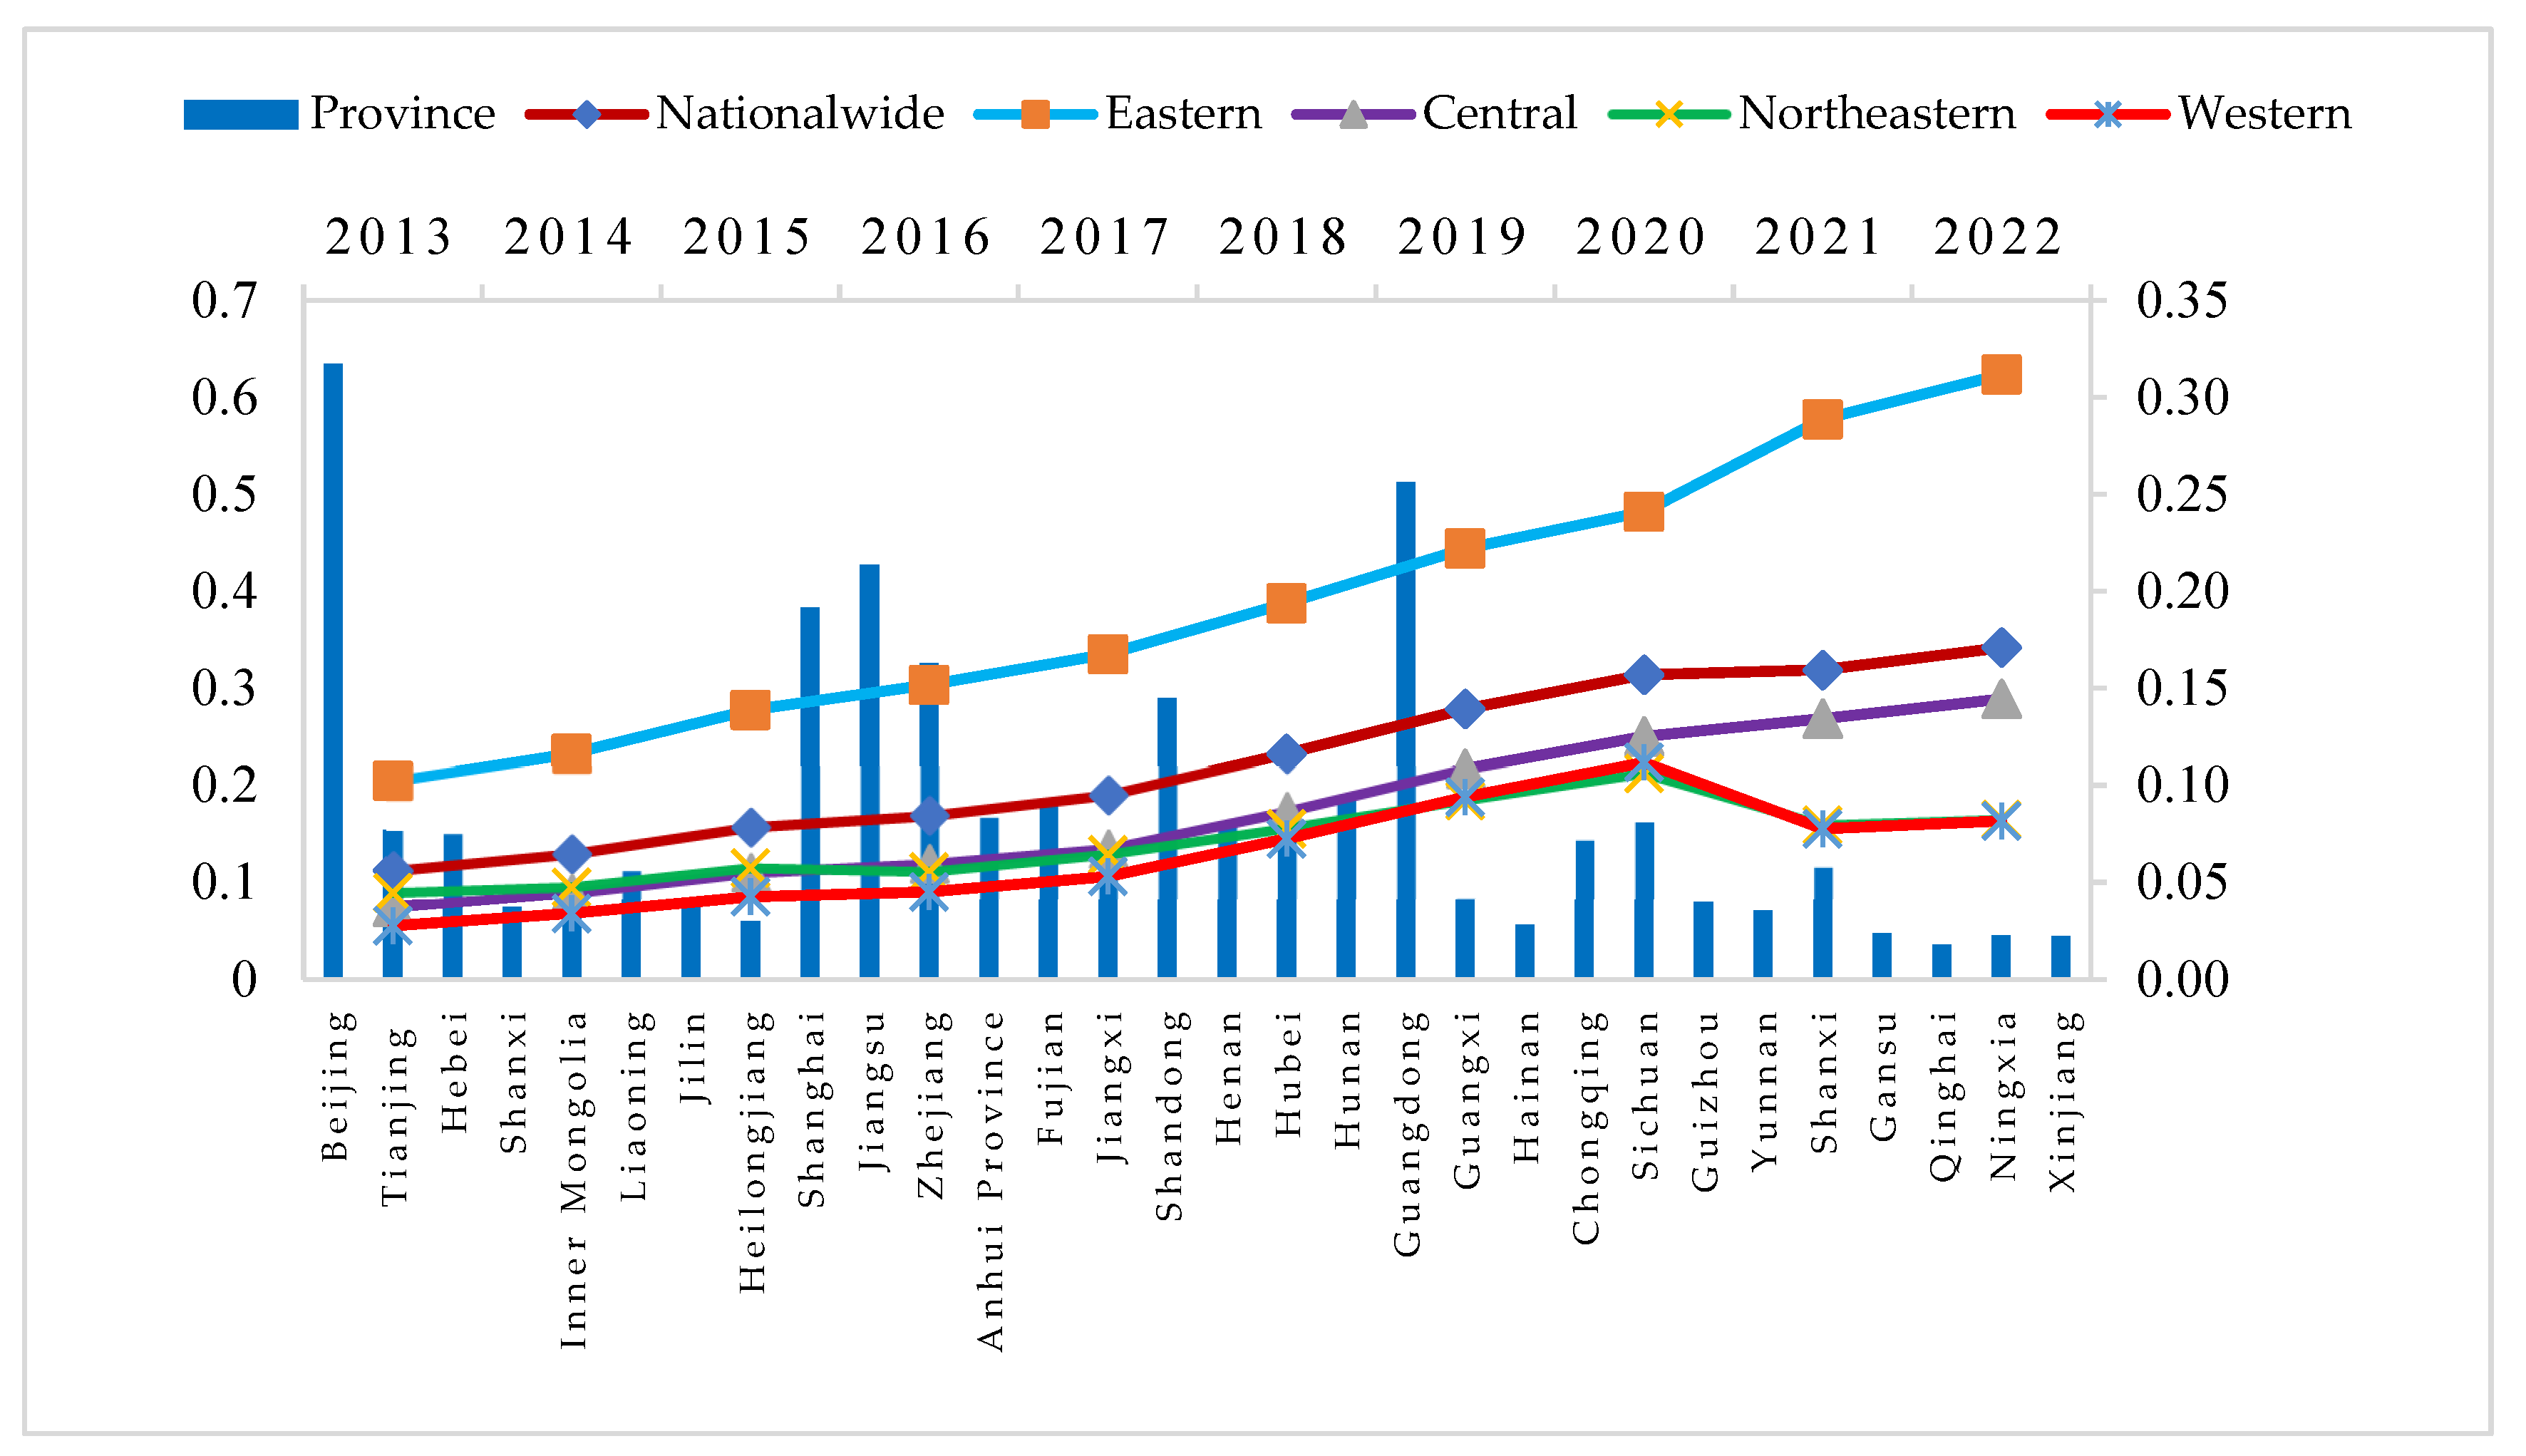
From 2013 to 2022, the development level of China’s DE has generally shown an upward trend, with an accelerated growth rate after 2017. This is related to the 2016 Hangzhou Summit, which proposed the development of DE as the primary path for China’s innovative growth, as well as the strategic plan proposed in 2017 to accelerate the construction of a digital China. This study analyzed four regions based on economic division: western, eastern, central, and northeastern regions. From a regional perspective, there were significant differences between the eastern, central, and western regions. With the central region being stronger than the northeast region and the western region being the least, the eastern region had a significantly higher level of digital economic development than the other regions. At the provincial level, the 30 provinces in China exhibited a spatial development pattern of “high in the southeast, low in the northwest, and balanced in the central region”. During this period, the development of China’s DE has shown significant regional differences, with the eastern coastal areas standing out. Provinces and cities such as Beijing, Guangdong, Jiangsu, Shanghai, and Zhejiang, due to their strong economic foundation, robust innovation capabilities, favorable policy environment, and vast market potential, have ranked at the forefront of the country in terms of digital economic development, as shown in Figure 3.

3.2.2. Analysis of the Logistic Industry’s CEE

CEE of China’s LI in 30 provinces was calculated using the Slacks-Based Measure (SBM) model based on the collected data, as shown in Table 3. It is observed that the CEE of LI in most provinces and cities has been growing amidst fluctuations, with the overall trend being relatively stable.
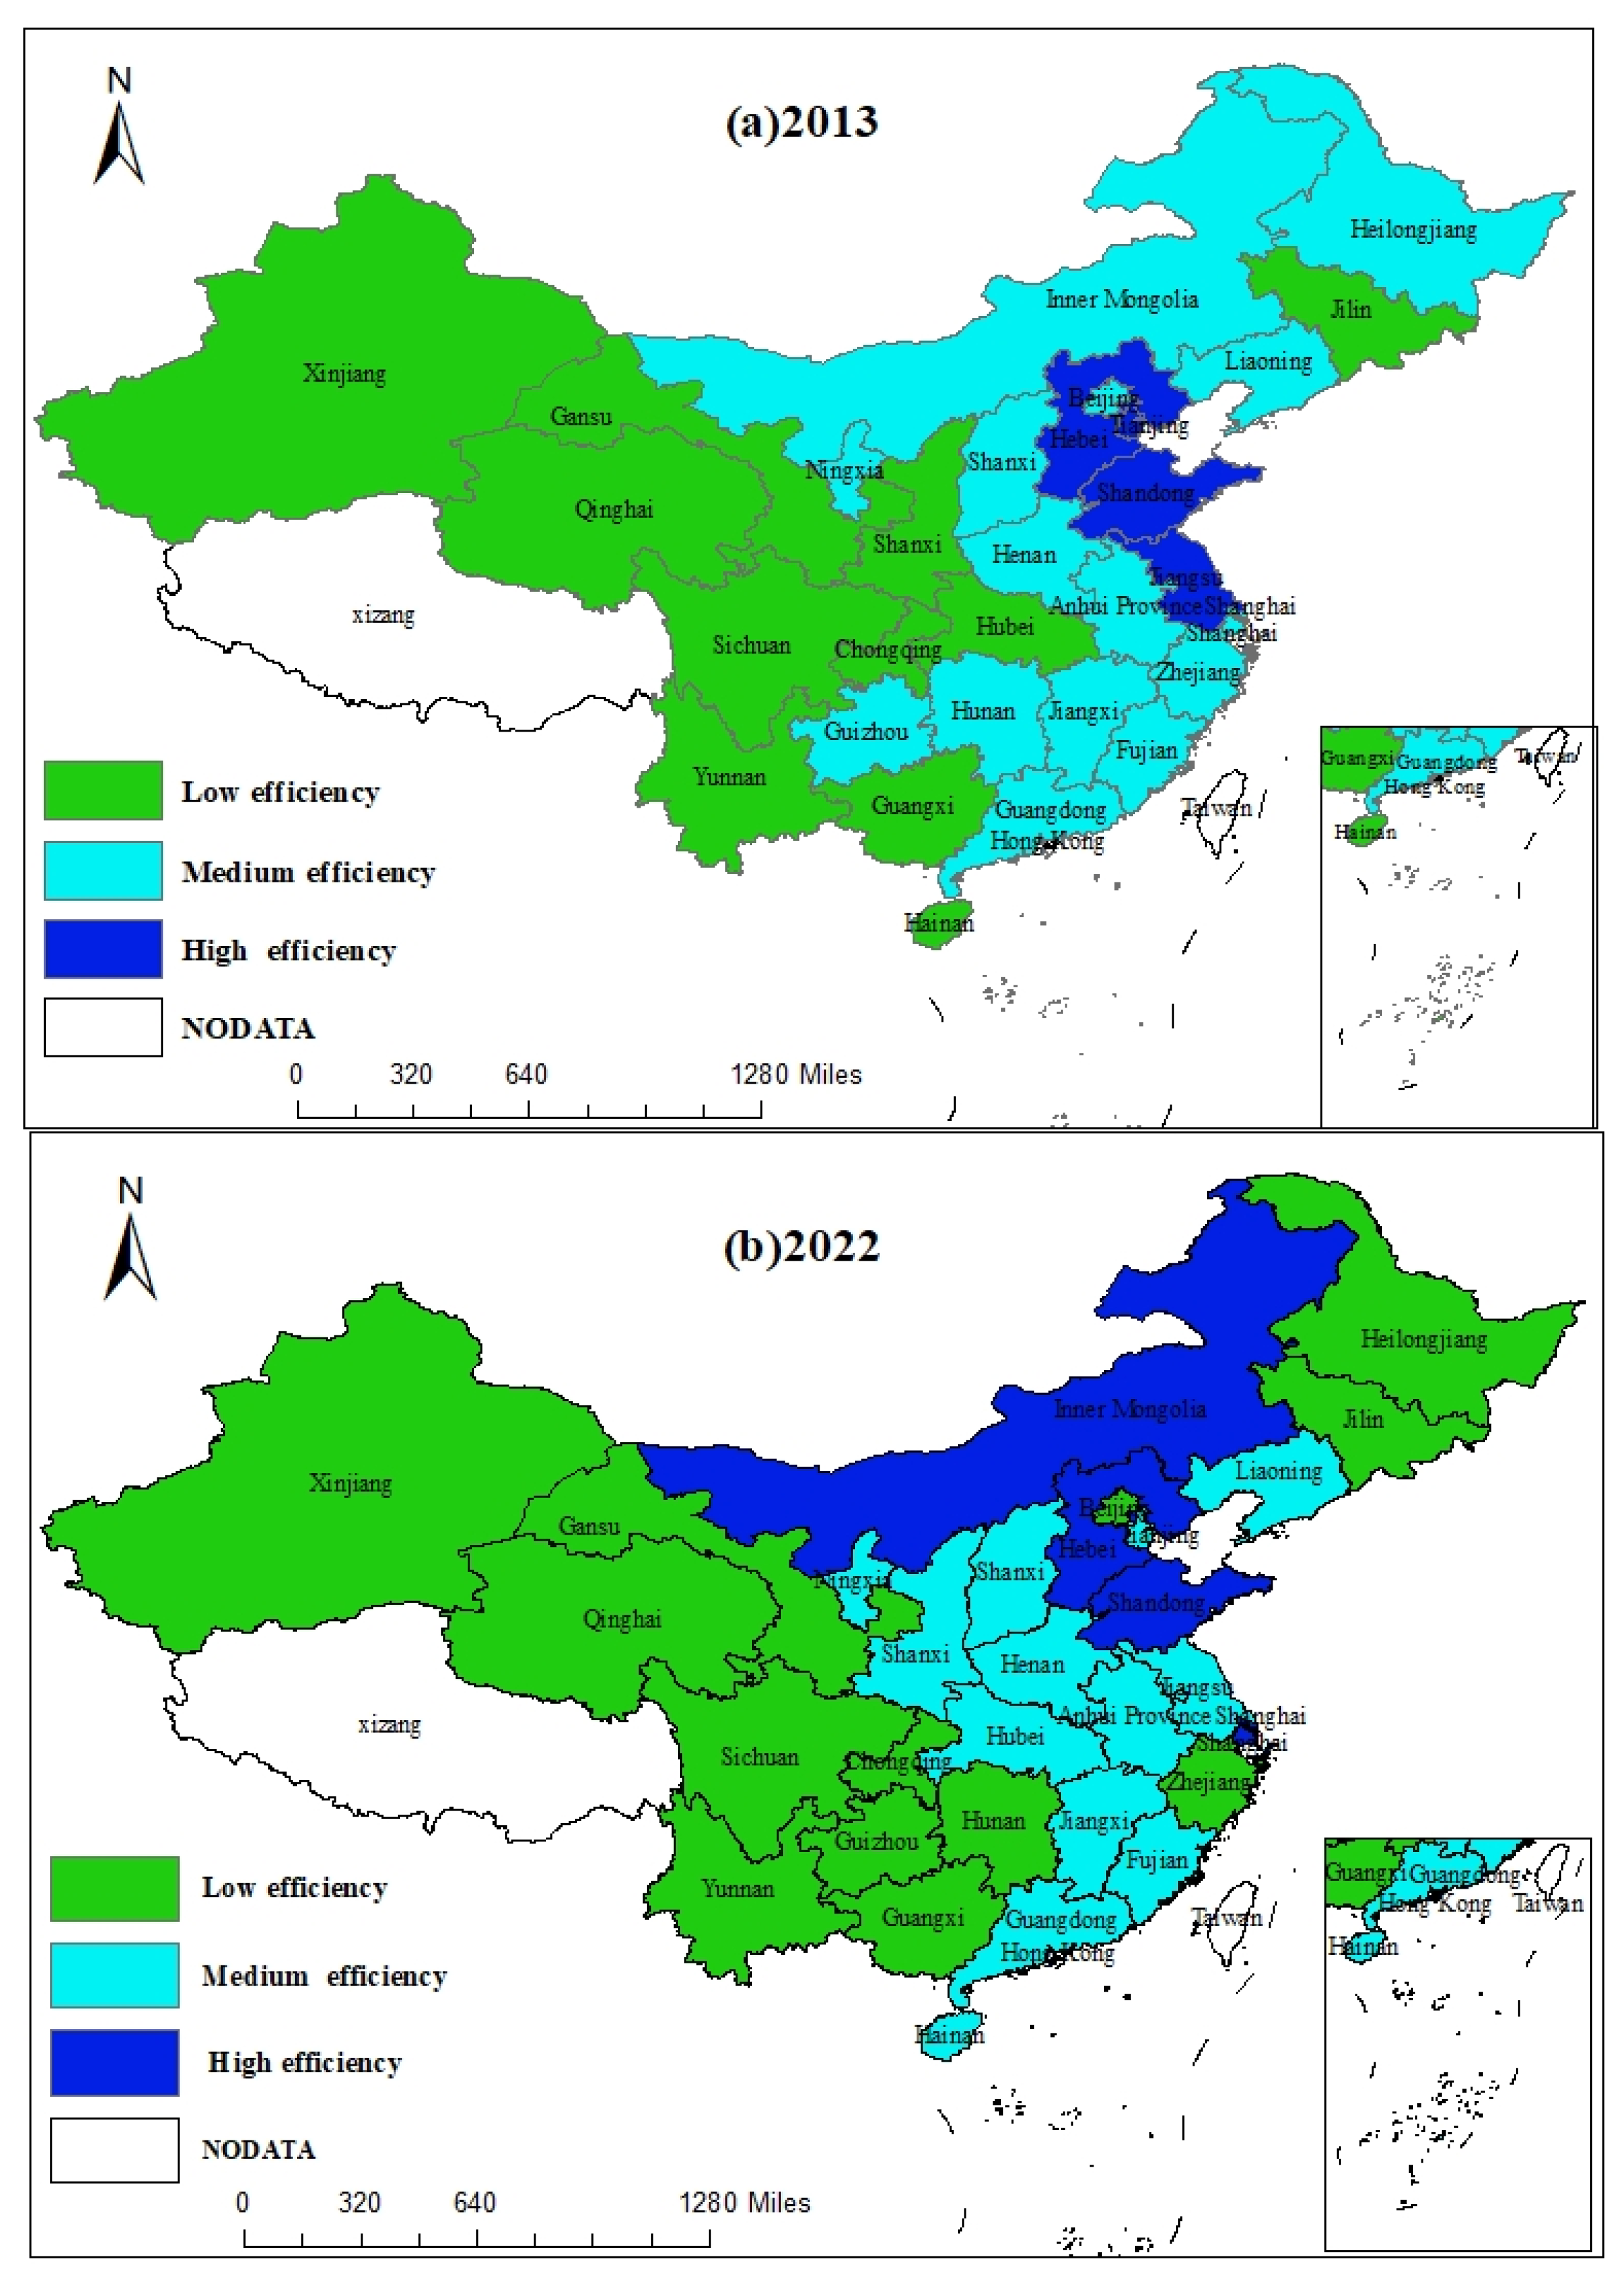
We have converted the CEE of the two-time series in Table 3, 2013 and 2022, into a map graph, as shown in Figure 4. The spatial development trend of CEE in the LI is characterized by “high efficiency changing and stabilizing, medium efficiency gradually improving and stabilizing, and low efficiency relatively stable”.
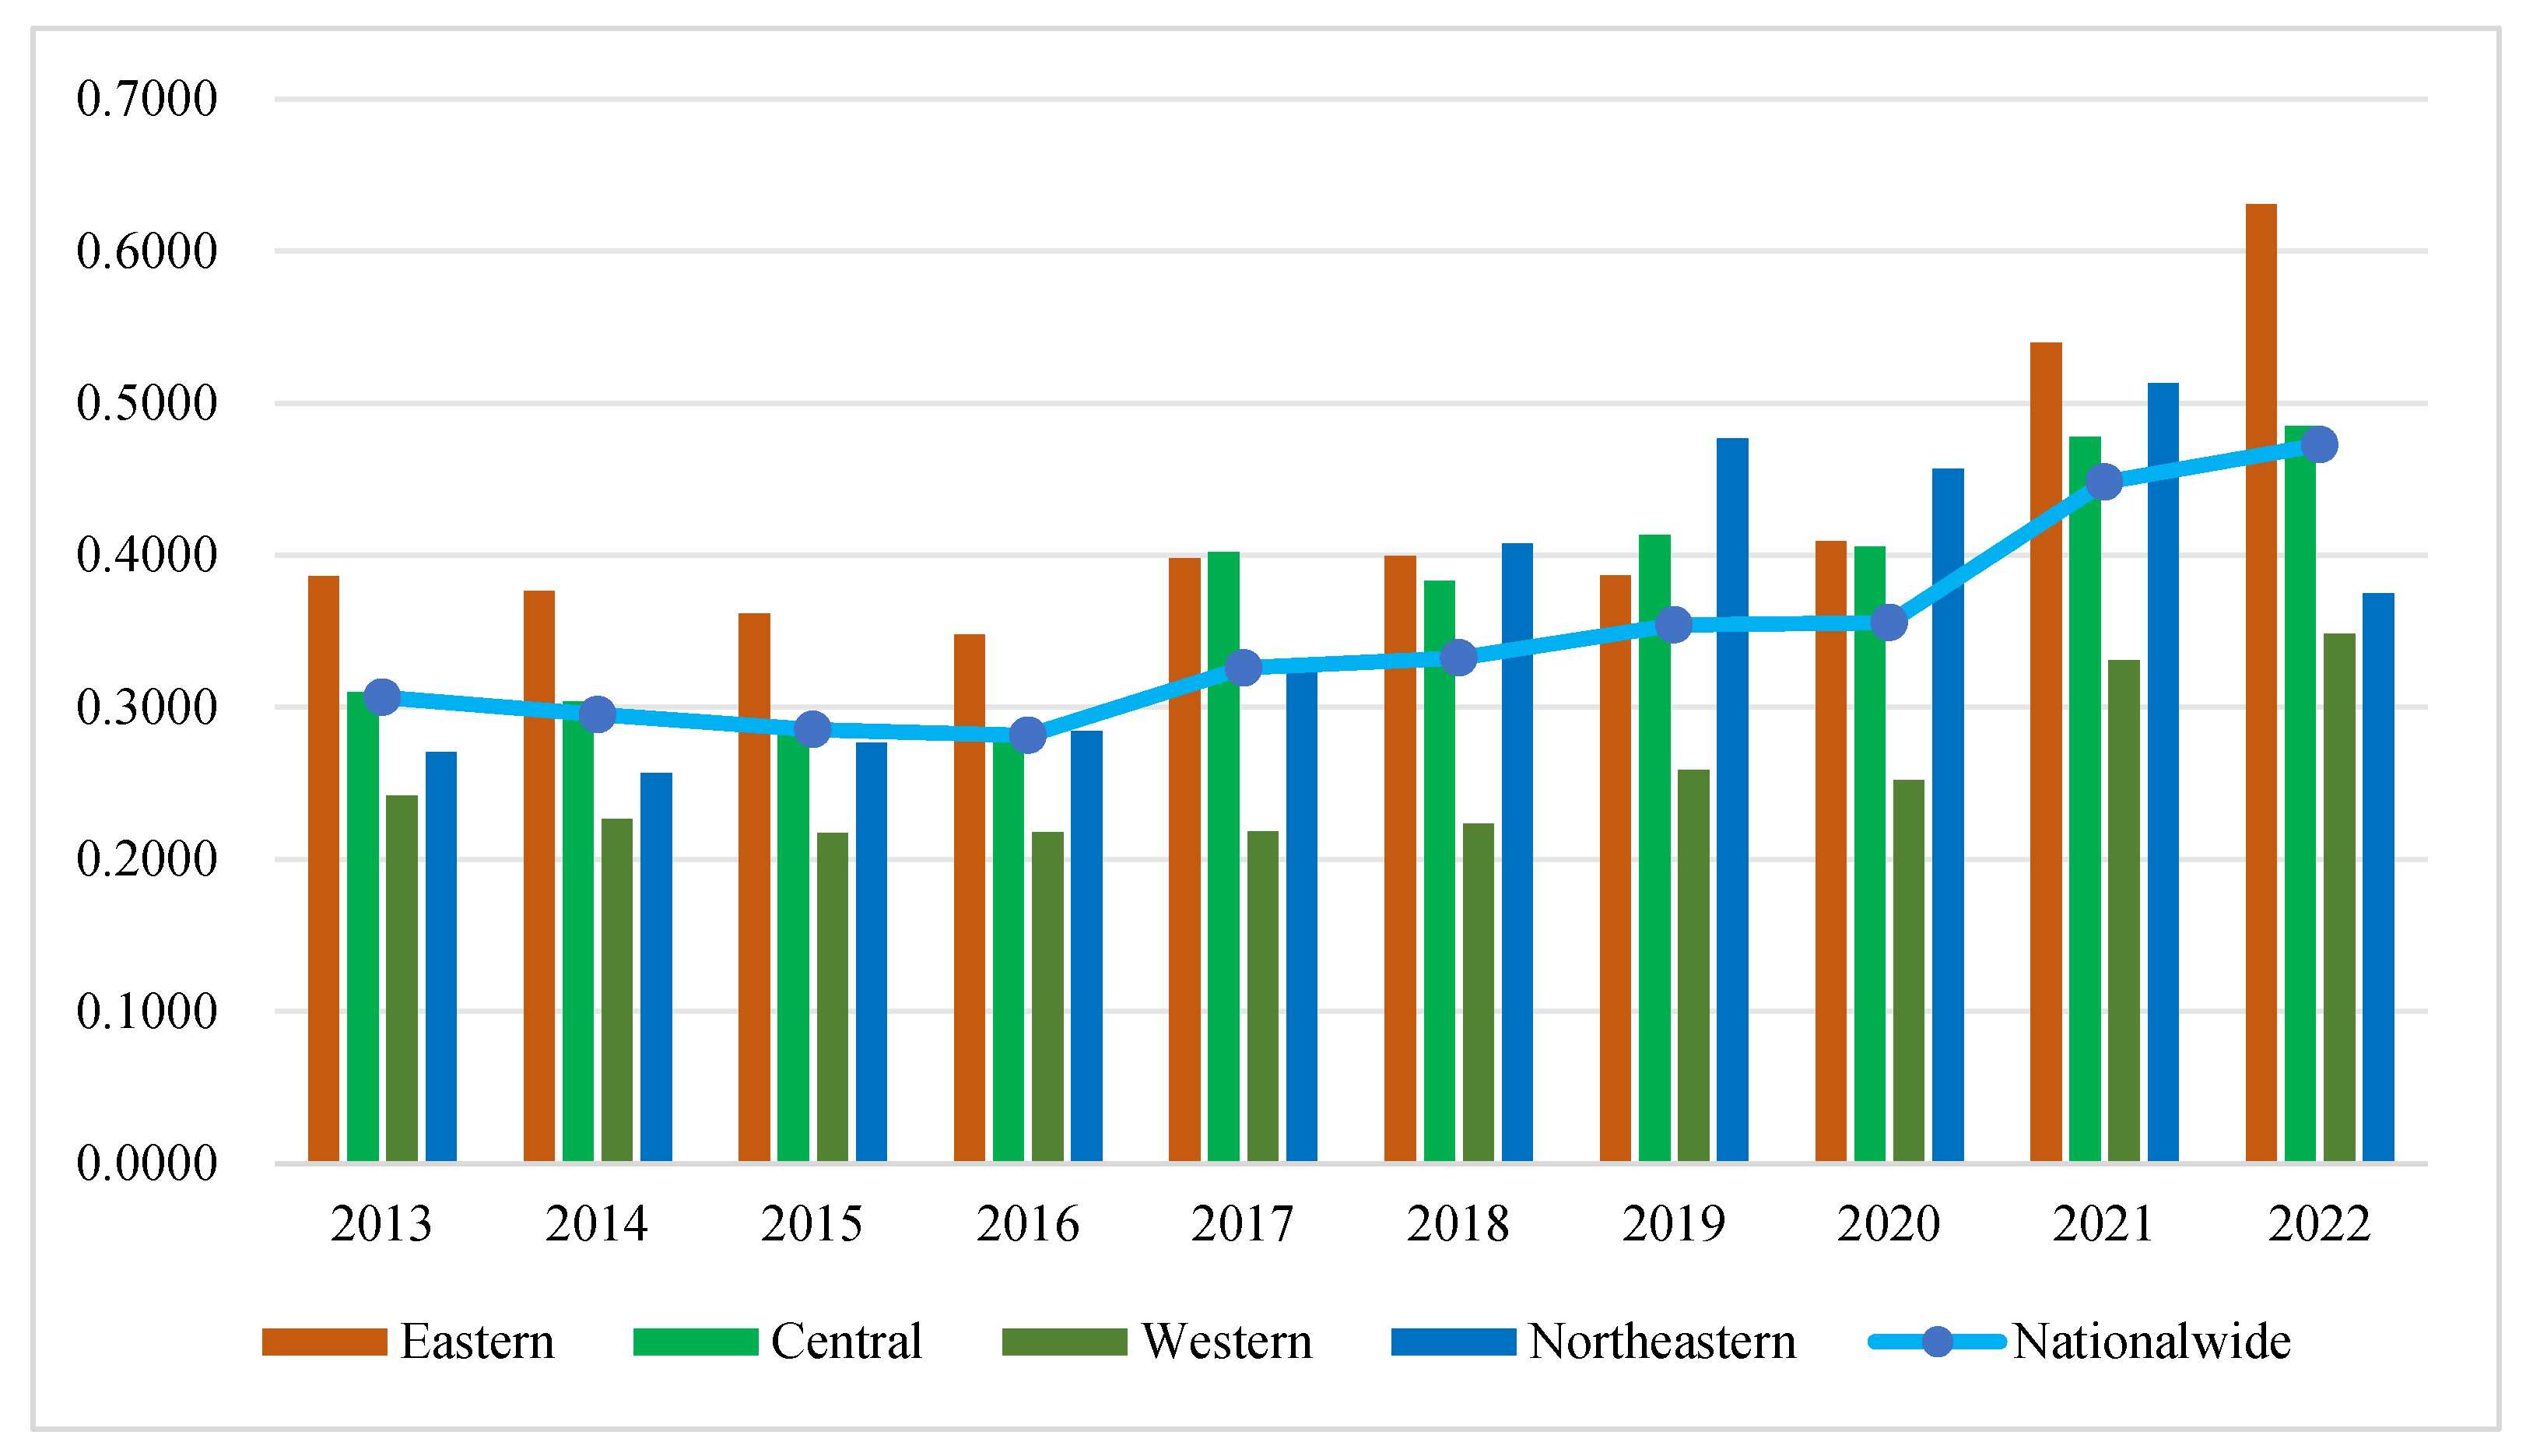
Analyzing from the perspective of the four major economic regions, as can be seen in Figure 5, the CEE of China’s LI has shown a fluctuating upward trend from 2013 to 2022, reaching its peak at 0.4726 in 2022. Spatially, there is a general pattern of “the east being higher than the west”, indicating significant regional disparities, with the eastern region having a relatively better economic foundation and higher CEE in the LI. Integrating Table 4 and Figure 5, specifically, Xinjiang, Gansu, Qinghai, Guangxi, Sichuan, Yunnan, and Heilongjiang have consistently been in the low-efficiency area. The high-efficiency areas have evolved from Tianjin, Hebei, Jiangsu, Shanghai, and Shandong in 2013 to Tianjin, Hebei, Inner Mongolia, Liaoning, Jiangsu, and Shanghai in 2022.

3.2.3. Spatial Autocorrelation Analysis of the Logistic Industry’s CEE

According to Equation (10), we examined the regional dependence and autocorrelation of the CEE in the LI, and the results are listed in Table 4. A significant positive spatial correlation between the LI’s CEE during the sample period was observed, indicating that the LI’s overall CEE is relatively clustered. From a temporal perspective, the Moran’s I value for the CEE of the LI showed an increasing trend amidst fluctuations from 2013 to 2021, but in 2022, they were lower than in the previous two years. When considering geographical factors, there is spatial instability in the CEE of the LI, further GWR analysis is required.

3.2.4. Analysis of Regression Results

To learn more about how DE affects CEE in the logistics sector, we conducted an estimation analysis using OLS and GWR models on sample data from 2013, 2016, 2019, and 2022. To eliminate the interference of collinearity, collinearity tests were conducted on each explanatory variable. The variance inflation factor values were less than 7.5 [35] (Table 5), indicating an absence of multicollinearity.
The fitting index is shown in Table 6 based on the calculation of the OLS and GWR models. The comparison of the fitting degrees between the two models showed that the R values were slightly higher in the GWR: the higher the fitting degree, the better the model performance.
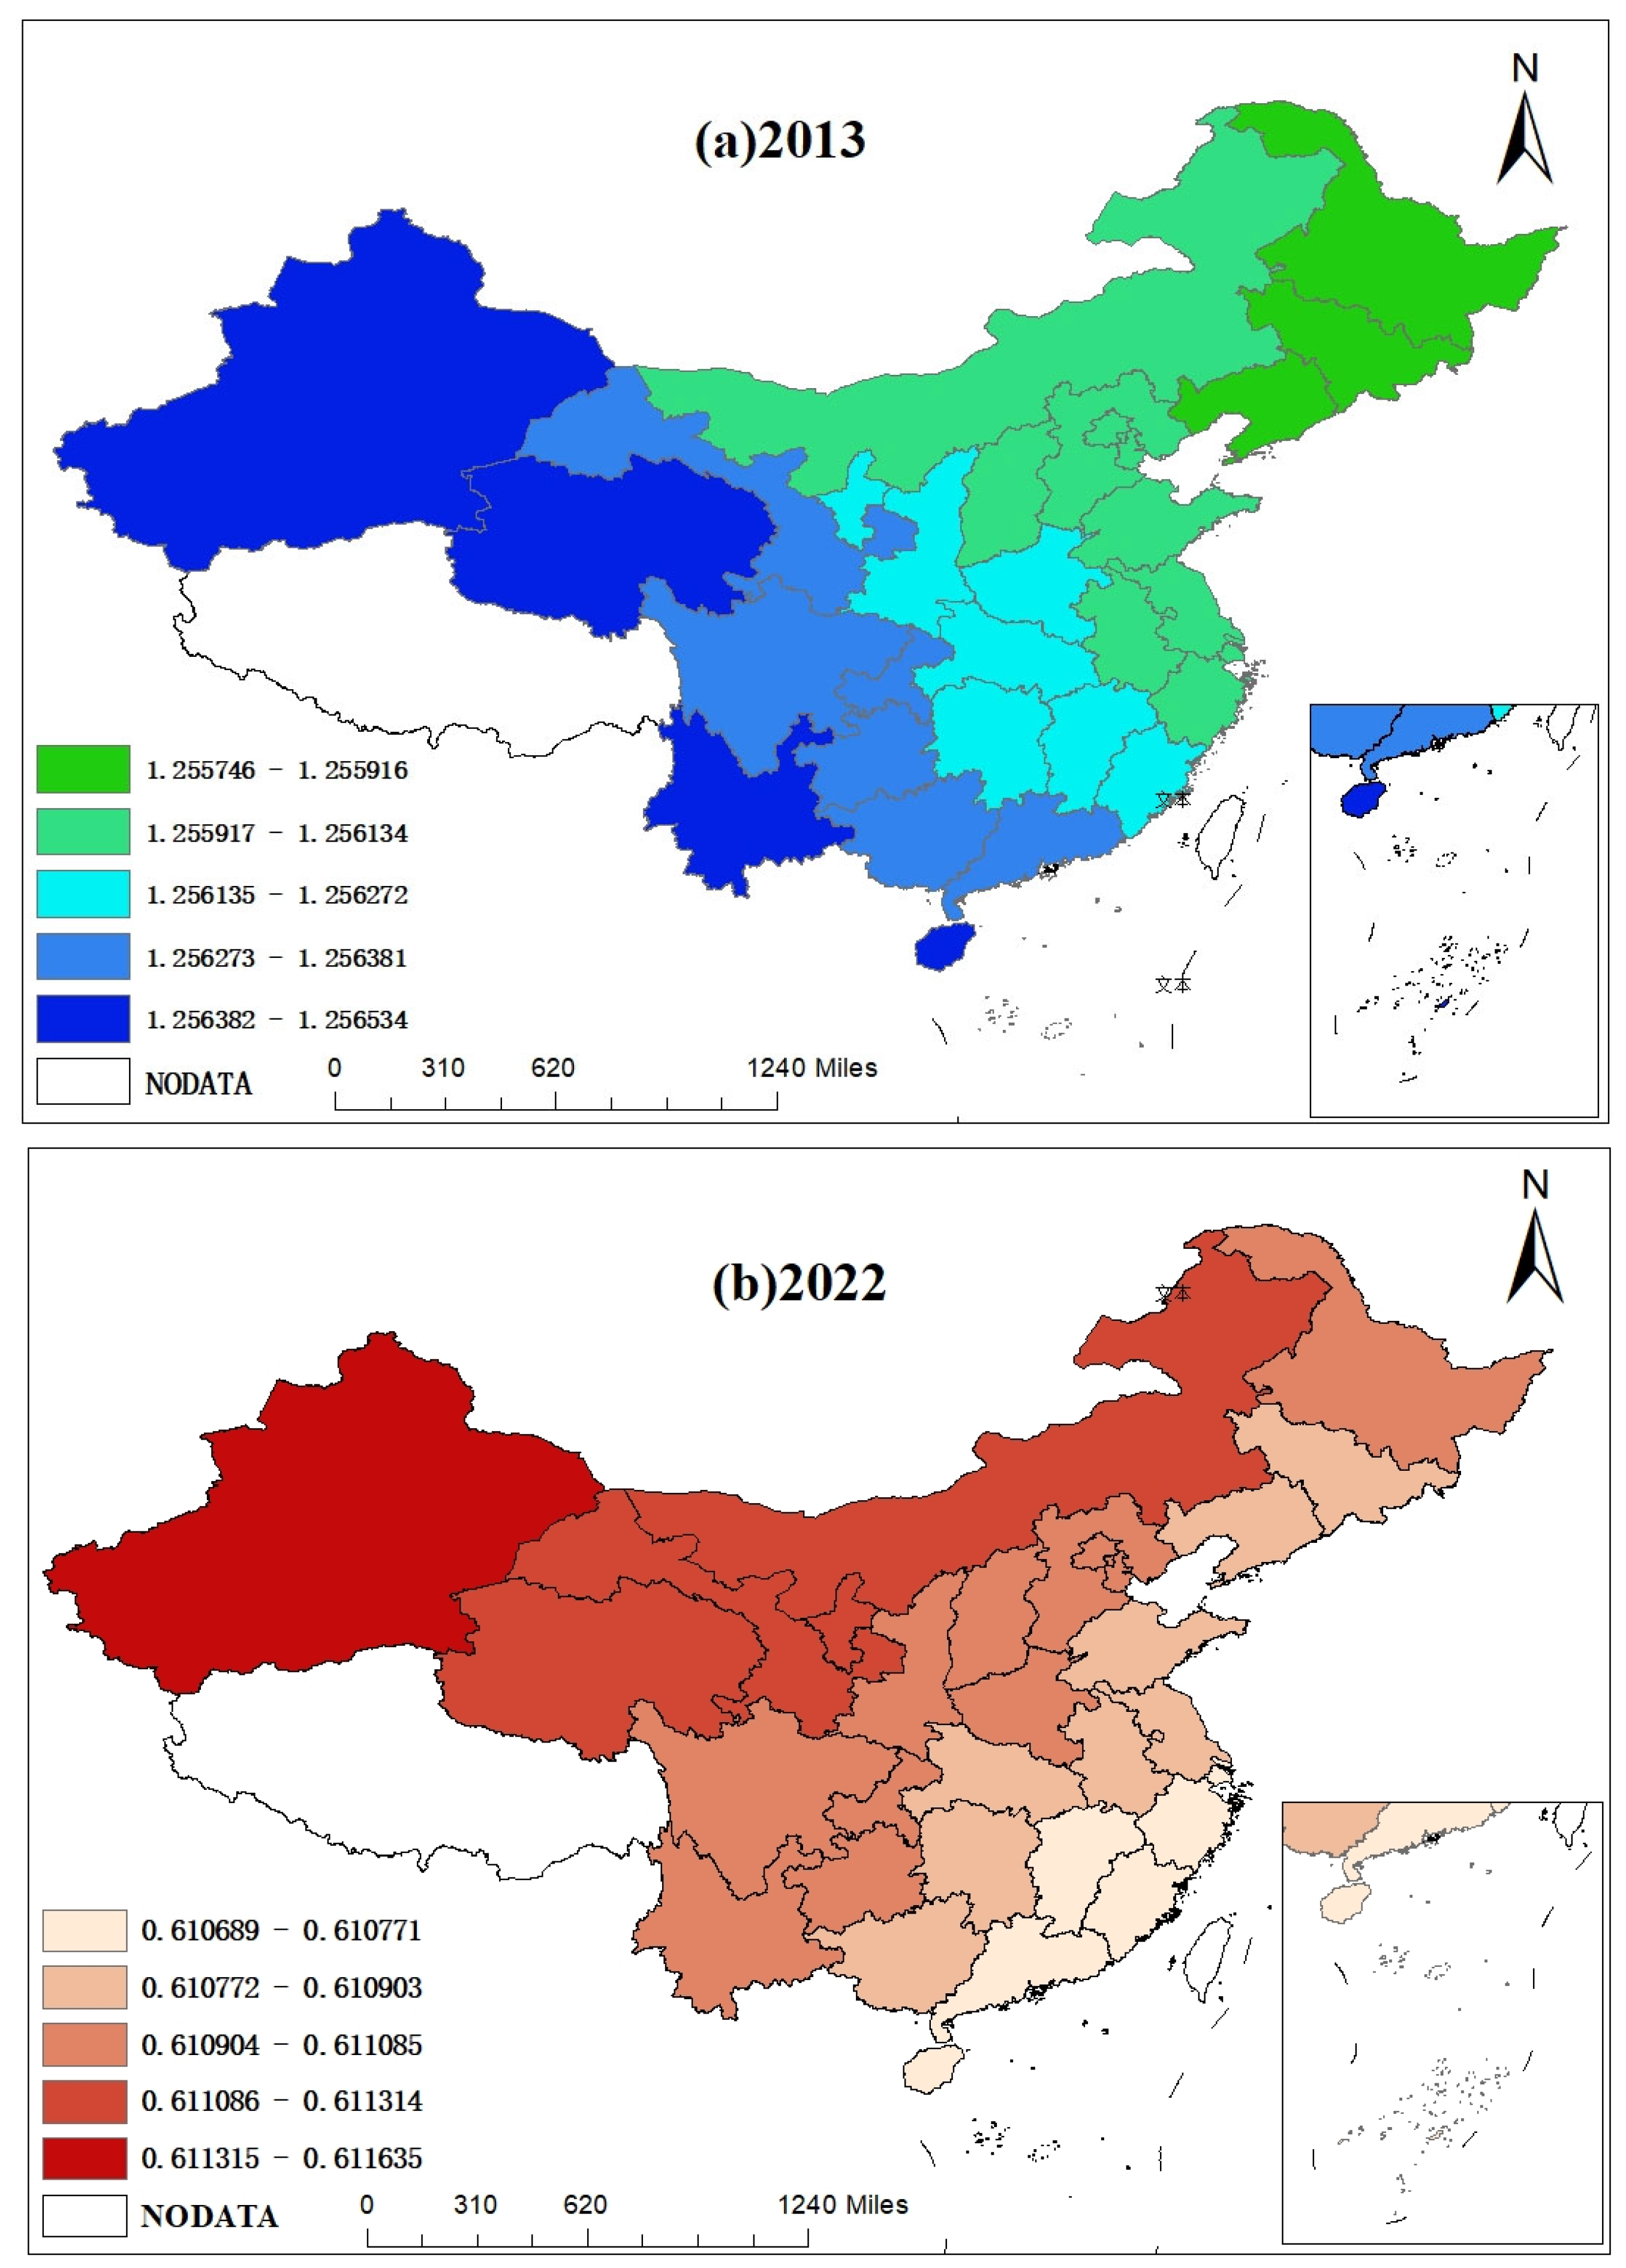
The OLS model only estimates the global regression situation and cannot explore the spatial regression conditions by region. Considering this, the article employs the Geographically Weighted Regression (GWR) to further investigate the spatial distribution characteristics of the impact of the DE on the CEE of the LI. From 2013 to 2022, due to the impact of factors such as the epidemic in the middle years, we only show the spatial distribution changes in the impact of the DE on the CEE of the LI from the beginning to the end of the period. The regression coefficients for the beginning year of the study period, 2013, and the end year, 2022, are presented here, as shown in Table 7. The DE has played a role in promoting the improvement of CEE in the LI during these two years, suggesting the possibility of the validity of Hypothesis 1. Additionally, it can be observed that the development level of the LI, the industrial structure, and the economic development level are also positively correlated with the CEE of the LI during these two years.
We have chosen to visualize the regression coefficients of the DE for the years 2013 and 2022, which allows for an intuitive observation of the spatial impact evolution of the DE on the CEE of the LI, as depicted in Figure 6. The DE has a decreasing impact on the CEE of the LI, with a trend of decreasing from northwest to southeast in 2013 and gradually decreasing from west to east in 2022. This may be mainly related to the longer wintertime in the north, which leads to an increase in energy consumption input costs for the LI. Other conditions remaining unchanged, the DE has a greater impact on the CEE of the LI in the northwest and central regions with lower levels of digital economic development. It can also be seen that there is a certain spatial difference in the role of the DE in improving the CEE of the LI, and Hypothesis 2 is also valid. However, from Table 6 and Figure 6, it can be seen that the spatial differences in this impact are very small, indicating that there are spatial differences in the impact of the DE on the CEE of the LI in different regions in the same year, but they are very small. The DE is important for the low-carbon and digital transformation of the LI in various regions. The regression coefficient of the DE on the CEE of the LI in 2022 is smaller than that in 2013, possibly because by 2022, the development level and economic development level of the LI in the eastern region have already been relatively high, the industrial structure is more reasonable, and the agglomeration effect of the LI has become more widespread. The adoption and application of digital technology have become more widespread, and the impact of the DE on the eastern region is smaller than that on the northwest region. The pursuit of a better environment by people in developed regions or the situation of opening to the outside world may have a greater impact on the CEE of the LI.

4. Discussion

The rapid expansion of global digital economies (DEs) has brought the digital transformation of traditional industries [49], particularly the logistics industry (LI), to a critical juncture. As many nations intensify efforts to promote sustainable development through energy conservation and emission reduction initiatives, understanding the impact of the DE on the carbon emission efficiency (CEE) of the logistics sector becomes essential. Given its status as a key driver of economic growth and a significant source of carbon emissions, the LI’s transformation is fundamental to achieving sustainable regional development and long-term carbon-reduction targets [50].
The findings of this study demonstrate that the DE positively influences the CEE of the LI. However, there are notable regional disparities in its impact. Eastern regions, with higher levels of digital development, exhibit more significant improvements in carbon efficiency compared to the central and western regions. These spatial imbalances highlight the importance of targeted policy interventions that address regional gaps in digital infrastructure and economic development. The spatial analysis, which utilized Moran’s I model and geographically weighted regression (GWR), confirmed that regional proximity and the level of digital infrastructure are crucial in determining the effectiveness of DE on CEE in the logistics sector. Regions with more advanced digital capabilities show markedly higher carbon efficiencies.

5. Conclusions, Policy Implications, and Directions for Future Research

This study provides important contributions to the existing literature by integrating the CEE of DE and LI into a unified analytical framework. Through the application of a slacks-based measure (SBM) model and advanced spatial econometric methods, this study systematically evaluates the spatial dynamics between DE and the logistics industry’s carbon efficiency. By comparing ordinary least squares (OLS) and geographically weighted regression (GWR) models, the analysis identifies the most suitable approach for capturing regional variations, offering a scientific foundation for targeted policy recommendations.
Despite these valuable contributions, this study acknowledges certain limitations. The indicator system used, while encompassing multidimensional data, requires further refinement to enhance its comprehensiveness. Furthermore, data constraints, particularly the lack of complete data for 2023, indicate that future research should prioritize timeliness and accuracy in data collection. The mechanisms driving the spatial impact of the DE on the CEE of the logistics industry also warrant further exploration. Investigating the role of mediating variables and other region-specific factors could offer deeper insights into this relationship.

5.1. Policy Implications

Addressing regional disparities in the development of DE is critical for promoting a more balanced and sustainable transformation of the logistics industry. Targeted investments in digital infrastructure, particularly in the central and western regions, are necessary to bridge the development gap with more advanced eastern regions. Enhancing regional cooperation and facilitating the sharing of digital resources will improve the efficiency of digital infrastructure utilization and contribute to the overall enhancement of CEE in the logistics sector.
Promoting the digital transformation of logistics enterprises is also a key policy priority. Policymakers should support the adoption of digital technologies such as smart logistics and green logistics, while incentivizing logistics companies to embrace digitalization. Leading enterprises, such as China Ocean Shipping Group Co., Ltd., headquartered in Shanghai and SF Holding Co., Ltd., headquartered in Shenzhen, China. can play a critical role in setting industry standards and demonstrating the benefits of digitalization in improving operational efficiency and reducing carbon emissions. Additionally, the development of digital platforms to optimize logistics supply and demand matching will further enhance the sector’s carbon emission efficiency [51].
Finally, regional coordination for green development is vital. Policymakers must take into account the economic, industrial, and environmental specificities of different regions when formulating strategies to reduce carbon emissions in logistics activities. Integrating the logistics industry with other sectors and promoting the use of renewable energy will support high-quality, low-carbon development within the industry. Such efforts will not only help reduce carbon emissions but also contribute to broader national and global objectives of achieving carbon neutrality and sustainable economic growth.

5.2. Future Research Directions

This study opens several avenues for future research. First, the mechanisms underlying the spatial impact of DE on CEE deserve further investigation. The potential role of mediating variables and region-specific factors influencing the relationship between DE and CEE should be explored to provide a more comprehensive understanding of this dynamic. Additionally, improvements in data collection, particularly for more recent years, are essential to ensure the timeliness and accuracy of future analyses.
By continuing to investigate the spatial effects of DE on CEE, future research can offer more precise policy recommendations that address regional disparities and promote sustainable growth across all regions. This research is essential for advancing the green transformation of the logistics industry in a way that aligns with national and global sustainability goals.

Author Contributions

Conceptualization, Y.G. and H.D.; methodology, X.W.; software, Z.T.; validation, Y.G., H.D., and Z.T.; formal analysis, Y.G. and X.W.; investigation, Y.G., H.D., and Z.T.; resources, H.D.; data curation, Z.T.; writing—original draft preparation, Y.G.; writing—review and editing, Y.G.; visualization, X.W.; supervision, X.W.; funding acquisition, Z.T. All authors have read and agreed to the published version of the manuscript.

Funding

This research was funded by the Anhui Province Social Science Innovation and Development Research Project (NO. 2023CX055; NO. 2022CX061; NO. 2022CX062); Anhui Provincial Department of Education Philosophy and Social Science Major Project (NO. 2022AH040204); Suzhou University Doctoral Research Initiation Fund Project (NO. 2022BSK014; NO. 2023BSK031; 2023BSK066; 2023BSK068). Anhui University Humanities and Social Sciences Research Major Project: (NO. SK2021ZD0092); non-financial funding project of Suzhou University (NO. 2024xhx128).

Institutional Review Board Statement

Not applicable.

Informed Consent Statement

Not applicable.

Data Availability Statement

Data are contained within the article.

Acknowledgments

The authors thank the editor and reviewer for their comments regarding manuscript improvement.

Conflicts of Interest

The authors declare no conflicts of interest.

References

  1. Chen, J.; Lian, X.; Su, H.; Zhang, Z.; Ma, X.; Chang, B. Analysis of China’s carbon emission driving factors based on the perspectives of eight major economic regions. Environ. Sci. Pollut. Res. 2021, 28, 8181–8204. [Google Scholar] [CrossRef] [PubMed]
  2. Cheng, Z.; Li, L.; Liu, J.; Zhang, H. Total-factor carbon emission efficiency of China’s provincial industrial sector and its dynamic evolution. Renew. Sustain. Energy Rev. 2018, 94, 330–339. [Google Scholar] [CrossRef]
  3. Shi, X.; Zheng, Y.; Lei, Y.; Xue, W.; Yan, G.; Liu, X.; Cai, B.; Tong, D.; Wang, J. Air quality benefits of achieving carbon neutrality in China. Sci. Total. Environ. 2021, 795, 148784. [Google Scholar] [CrossRef] [PubMed]
  4. Zhang, R.; Hanaoka, T. Deployment of electric vehicles in China to meet the carbon neutral target by 2060: Provincial disparities in energy systems, CO2 emissions, and cost effectiveness. Resour. Conserv. Recycl. 2021, 170, 105622. [Google Scholar] [CrossRef]
  5. Gao, P.; Yue, S.; Chen, H. Carbon emission efficiency of China’s industry sectors: From the perspective of embodied carbon emissions. J. Clean. Prod. 2021, 283, 124655. [Google Scholar] [CrossRef]
  6. Yang, J.; Tang, L.; Mi, Z.; Liu, S.; Li, L.; Zheng, J. Carbon emissions performance in logistics at the city level. J. Clean. Prod. 2019, 231, 1258–1266. [Google Scholar] [CrossRef]
  7. Guo, X.; Wang, D. Analysis of the spatial relevance and influencing factors of carbon emissions in the logistics industry from China. Environ. Sci. Pollut. Res. Int. 2022, 29, 2672–2684. [Google Scholar] [CrossRef]
  8. Wang, J.; Lim, M.K.; Tseng, M.-L.; Yang, Y. Promoting low carbon agenda in the urban logistics network distribution system. J. Clean. Prod. 2019, 211, 146–160. [Google Scholar] [CrossRef]
  9. Li, Z.; Wang, J. The Dynamic Impact of Digital Economy on Carbon Emission Reduction: Evidence City-level Empirical Data in China. J. Clean. Prod. 2022, 351, 131570. [Google Scholar] [CrossRef]
  10. Wang, X.; Zhong, M. Can digital economy reduce carbon emission intensity? Empirical evidence from China’s smart city pilot policies. Environ. Sci. Pollut. Res. Int. 2023, 30, 51749–51769. [Google Scholar] [CrossRef]
  11. Li, Y.; Yang, X.; Ran, Q.; Wu, H.; Irfan, M.; Ahmad, M. Energy structure, digital economy, and carbon emissions: Evidence from China. Environ. Sci. Pollut. Res. Int. 2021, 28, 64606–64629. [Google Scholar] [CrossRef] [PubMed]
  12. Chen, J.; Gui, W.; Huang, Y. The impact of the establishment of carbon emission trade exchange on carbon emission efficiency. Environ. Sci. Pollut. Res. Int. 2022, 30, 19845–19859. [Google Scholar] [CrossRef] [PubMed]
  13. Cheng, S.; Qu, G. Research on the Effect of Digital Economy on Carbon Emissions under the Background of “Double Carbon”. Int. J. Environ. Res. Public 2023, 20, 4931. [Google Scholar] [CrossRef] [PubMed]
  14. Han, D.; Ding, Y.; Shi, Z.; He, Y. The impact of digital economy on total factor carbon productivity: The threshold effect of technology accumulation. Environ. Sci. Pollut. Res. Int. 2022, 29, 55691–55706. [Google Scholar] [CrossRef]
  15. Zhang, L.; Mu, R.; Zhan, Y.; Yu, J.; Liu, L.; Yu, Y.; Zhang, J. Digital economy, energy efficiency, and carbon emissions: Evidence from provincial panel data in China. Sci. Total. Environ. 2022, 852, 158403. [Google Scholar] [CrossRef]
  16. Xu, Q.; Zhong, M.; Cao, M. Does digital investment affect carbon efficiency? Spatial effect and mechanism discussion. Sci. Total. Environ. 2022, 827, 154321. [Google Scholar] [CrossRef]
  17. Quan, C.; Cheng, X.; Yu, S.; Ye, X. Analysis on the influencing factors of carbon emission in China’s logistics industry based on LMDI method. Sci. Total. Environ. 2020, 734, 138473. [Google Scholar] [CrossRef]
  18. Deng, F.; Xu, L.; Fang, Y.; Gong, Q.; Li, Z. PCA-DEA-tobit regression assessment with carbon emission constraints of China’s logistics industry. J. Clean. Prod. 2020, 271, 122548. [Google Scholar] [CrossRef]
  19. Xu, B.; Xu, R. Assessing the role of environmental regulations in improving energy efficiency and reducing CO2 emissions: Evidence from the logistics industry. EIA Rev. 2022, 9, 106831. [Google Scholar] [CrossRef]
  20. Li, M.J.; Wang, J. Spatial-temporal evolution and influencing factors of total factor productivity in China’s logistics industry under low-carbon constraints. Environ. Sci. Pollut. Res. Int. 2021, 29, 883–900. [Google Scholar] [CrossRef]
  21. Tang, Y.; Yang, Z.; Yao, J.; Li, X.; Chen, X. Carbon emission efficiency and spatially linked network structure of China’s logistics industry. Front. Environ. Sci. 2022, 30, 166–200. [Google Scholar] [CrossRef]
  22. Zhong, W.; Yang, J.; Zheng, M.; Dong, J.; Yan, Z. The impact and transmission mechanism of China’s urban digital economy on carbon emissions in the logistics industry. China Environ. Sci. 2024, 44, 427–437. [Google Scholar] [CrossRef]
  23. Wang, H.; Li, Y.; Lin, W.; Wei, W. How does digital technology promote carbon emission reduction? Empirical evidence based on e-commerce pilot city policy in China. J. Environ. Manag. 2023, 325, 116524. [Google Scholar] [CrossRef] [PubMed]
  24. Liu, W.; Wang, Y. Effect and mechanism of digital economy empowering urban green and high-quality development. South China J. Econ. 2022, 8, 73–91. [Google Scholar] [CrossRef]
  25. Wang, Q.; Ge, Y.; Li, R. Evolution and driving factors of ocean carbon emission efficiency: A novel perspective on regional differences. Mar. Pollut. Bull. 2023, 194 Pt A, 115219. [Google Scholar] [CrossRef]
  26. Xie, N.-Y.; Zhang, Y. The Impact of Digital Economy on Industrial Carbon Emission Efficiency: Evidence from Chinese Provincial Data. Math. Probl. Eng. 2022, 2022, 6583809. [Google Scholar] [CrossRef]
  27. Zhang, W.; Liu, X.; Wang, D.; Zhou, J. Digital economy and carbon emission performance: Evidence at China’s city level. Energy Policy 2022, 165, 112927. [Google Scholar] [CrossRef]
  28. Ran, Q.; Yang, X.; Yan, H.; Xu, Y.; Cao, J. Natural resource consumption and industrial green transformation: Does the digital economy matter? Resour. Policy 2023, 5, 103396. [Google Scholar] [CrossRef]
  29. Liao, X.; Yang, Z. Effect Measurement and realization path of transformation and upgrading of digital economy enabling manufacturing industry in the Yangtze River Delta. East China Econ. Manag. 2021, 35, 22–30. [Google Scholar] [CrossRef]
  30. Wang, Z.; Xu, X.; Zhu, Y.; Gan, T. Evaluation of carbon emission efficiency in China’s airlines. J. Clean. Prod. 2019, 243, 118500. [Google Scholar] [CrossRef]
  31. Cai, B.; Guo, H.; Ma, Z.; Wang, Z.; Dhakal, S.; Cao, L. Benchmarking carbon emissions efficiency in Chinese cities: A comparative study based on high-resolution gridded data. Appl. Energy 2019, 242, 994–1009. [Google Scholar] [CrossRef]
  32. Wei, L.; Hou, Y. Research on the Impact of China’s Digital Economy on Urban Green Development. J. Quant. Tech. Econ. 2022, 39, 60–79. [Google Scholar] [CrossRef]
  33. Guo, Y.; Mao, H.; Ding, H.; Wu, X.; Liu, Y.; Liu, H.; Zhou, S. Data-Driven Coordinated Development of the Digital Economy and Logistics Industry. Sustainability 2022, 14, 8963. [Google Scholar] [CrossRef]
  34. Yu, H.; Wang, J.; Xu, J. Assessing the role of digital economy agglomeration in energy conservation and emission reduction: Evidence from China. Energy 2023, 284, 128667. [Google Scholar] [CrossRef]
  35. Zheng, Y.H.; Guo, L. Impact of the digital economy on the carbon efficiency of the tourism industry and its threshold effect. China Popul. Resour. Environ. 2023, 33, 69–79. [Google Scholar] [CrossRef]
  36. Salahuddin, M.; Alam, K. Internet usage, electricity consumption and economic growth in Australia: A time series evidence. Telematics Informatics 2015, 32, 862–878. [Google Scholar] [CrossRef]
  37. Kristoffersen, E.; Blomsma, F.; Mikalef, P.; Li, J. The smart circular economy: A digital-enabled circular strategies framework for manufacturing companies. J. Bus. Res. 2020, 120, 241–261. [Google Scholar] [CrossRef]
  38. Popkova, E.G.; Sergi, B.S. A Digital Economy to Develop Policy Related to Transport and Logistics. Predictive Lessons from Russia. Land Use Policy 2020, 99, 105083. [Google Scholar] [CrossRef]
  39. Wang, L.; Chen, L.; Li, Y. Digital economy and urban low-carbon sustainable development: The role of innovation factor mobility in China. Environ. Sci. Pollut. Res. 2022, 29, 48539–48557. [Google Scholar] [CrossRef]
  40. Ma, D.; Zhu, Q. Innovation in emerging economies: Research on the digital economy driving high-quality green development. J. Bus. Res. 2022, 145, 801–813. [Google Scholar] [CrossRef]
  41. Wang, J.; Dong, K.; Dong, X.; Taghizadeh-Hesary, F. Assessing the digital economy and its carbon-mitigation effects: The case of China. Energy Econ. 2022, 113, 106198. [Google Scholar] [CrossRef]
  42. Jiang, Y.; Lan, T.; Wu, L. A Comparison Study of Missing Value Processing Methods in Time Series Data Mining. In Proceedings of the International Conference on Computational Intelligence & Software Engineering, Wuhan, China, 11–13 December 2009; Volume 12. [Google Scholar] [CrossRef]
  43. IPCC. Global Warming of 1.5 °C. An IPCC Special Report on the Impacts of Global Warming of 1.5 °C Above Pre-Industrial Levels and Related Global Greenhouse Gas Emission Pathways, in the Context of Strengthening the Global Response to the Threat of Climate Change, Sustainable Development, and Efforts to Eradicate Poverty. 2018. Available online: https://www.ipcc.ch/sr15/ (accessed on 4 August 2023).
  44. Zhang, C.; Zhang, Z. Agglomeration effect and radiation effect of Carbon emission intensity at Provincial level in China. J. Environ. Sci. 2017, 37, 1178–1184. [Google Scholar]
  45. Tone, K. A slacks-based measure of efficiency in data envelopment analysis. Eur. J. Oper. Res. 2001, 130, 498–509. [Google Scholar] [CrossRef]
  46. Zhang, Y.; Liu, Y.; Zhang, Y.; Liu, Y.; Zhang, G.; Chen, Y. On the spatial relationship between ecosystem services and urbanization: A case study in Wuhan, China. Sci. Total Environ. 2018, 10, 780–790. [Google Scholar] [CrossRef]
  47. Kleiber, C. Finite sample efficiency of OLS in linear regression models with long-memory disturbances. Econ. Lett. 2001, 72, 131–136. [Google Scholar] [CrossRef]
  48. Chao, L.; Zhang, K.; Li, Z.; Zhu, Y.; Wang, J.; Yu, Z. Geographically weighted regression based methods for merging satellite and gauge precipitation. J. Hydrol. 2018, 558, 275–289. [Google Scholar] [CrossRef]
  49. Dong, F.; Hu, M.; Gao, Y.; Liu, Y.; Zhu, J.; Pan, Y. How does digital economy affect carbon emissions? Evidence from global 60 countries. Sci. Total. Environ. 2022, 852, 158401. [Google Scholar] [CrossRef]
  50. Ding, H.; Liu, Y.; Zhang, Y.; Wang, S.; Guo, Y.; Zhou, S.; Liu, C. Data-driven evaluation and optimization of the sustainable development of the logistics industry: Case study of the Yangtze River Delta in China. Environ. Sci. Pollut. Res. 2022, 29, 68815–68829. [Google Scholar] [CrossRef]
  51. Xie, X.; Wang, J. Study on the impact of industrial digitization on carbon emissions: Evidence from China’s Logistics Industry. Environ. Res. Commun. 2023, 5, 105008. [Google Scholar] [CrossRef]
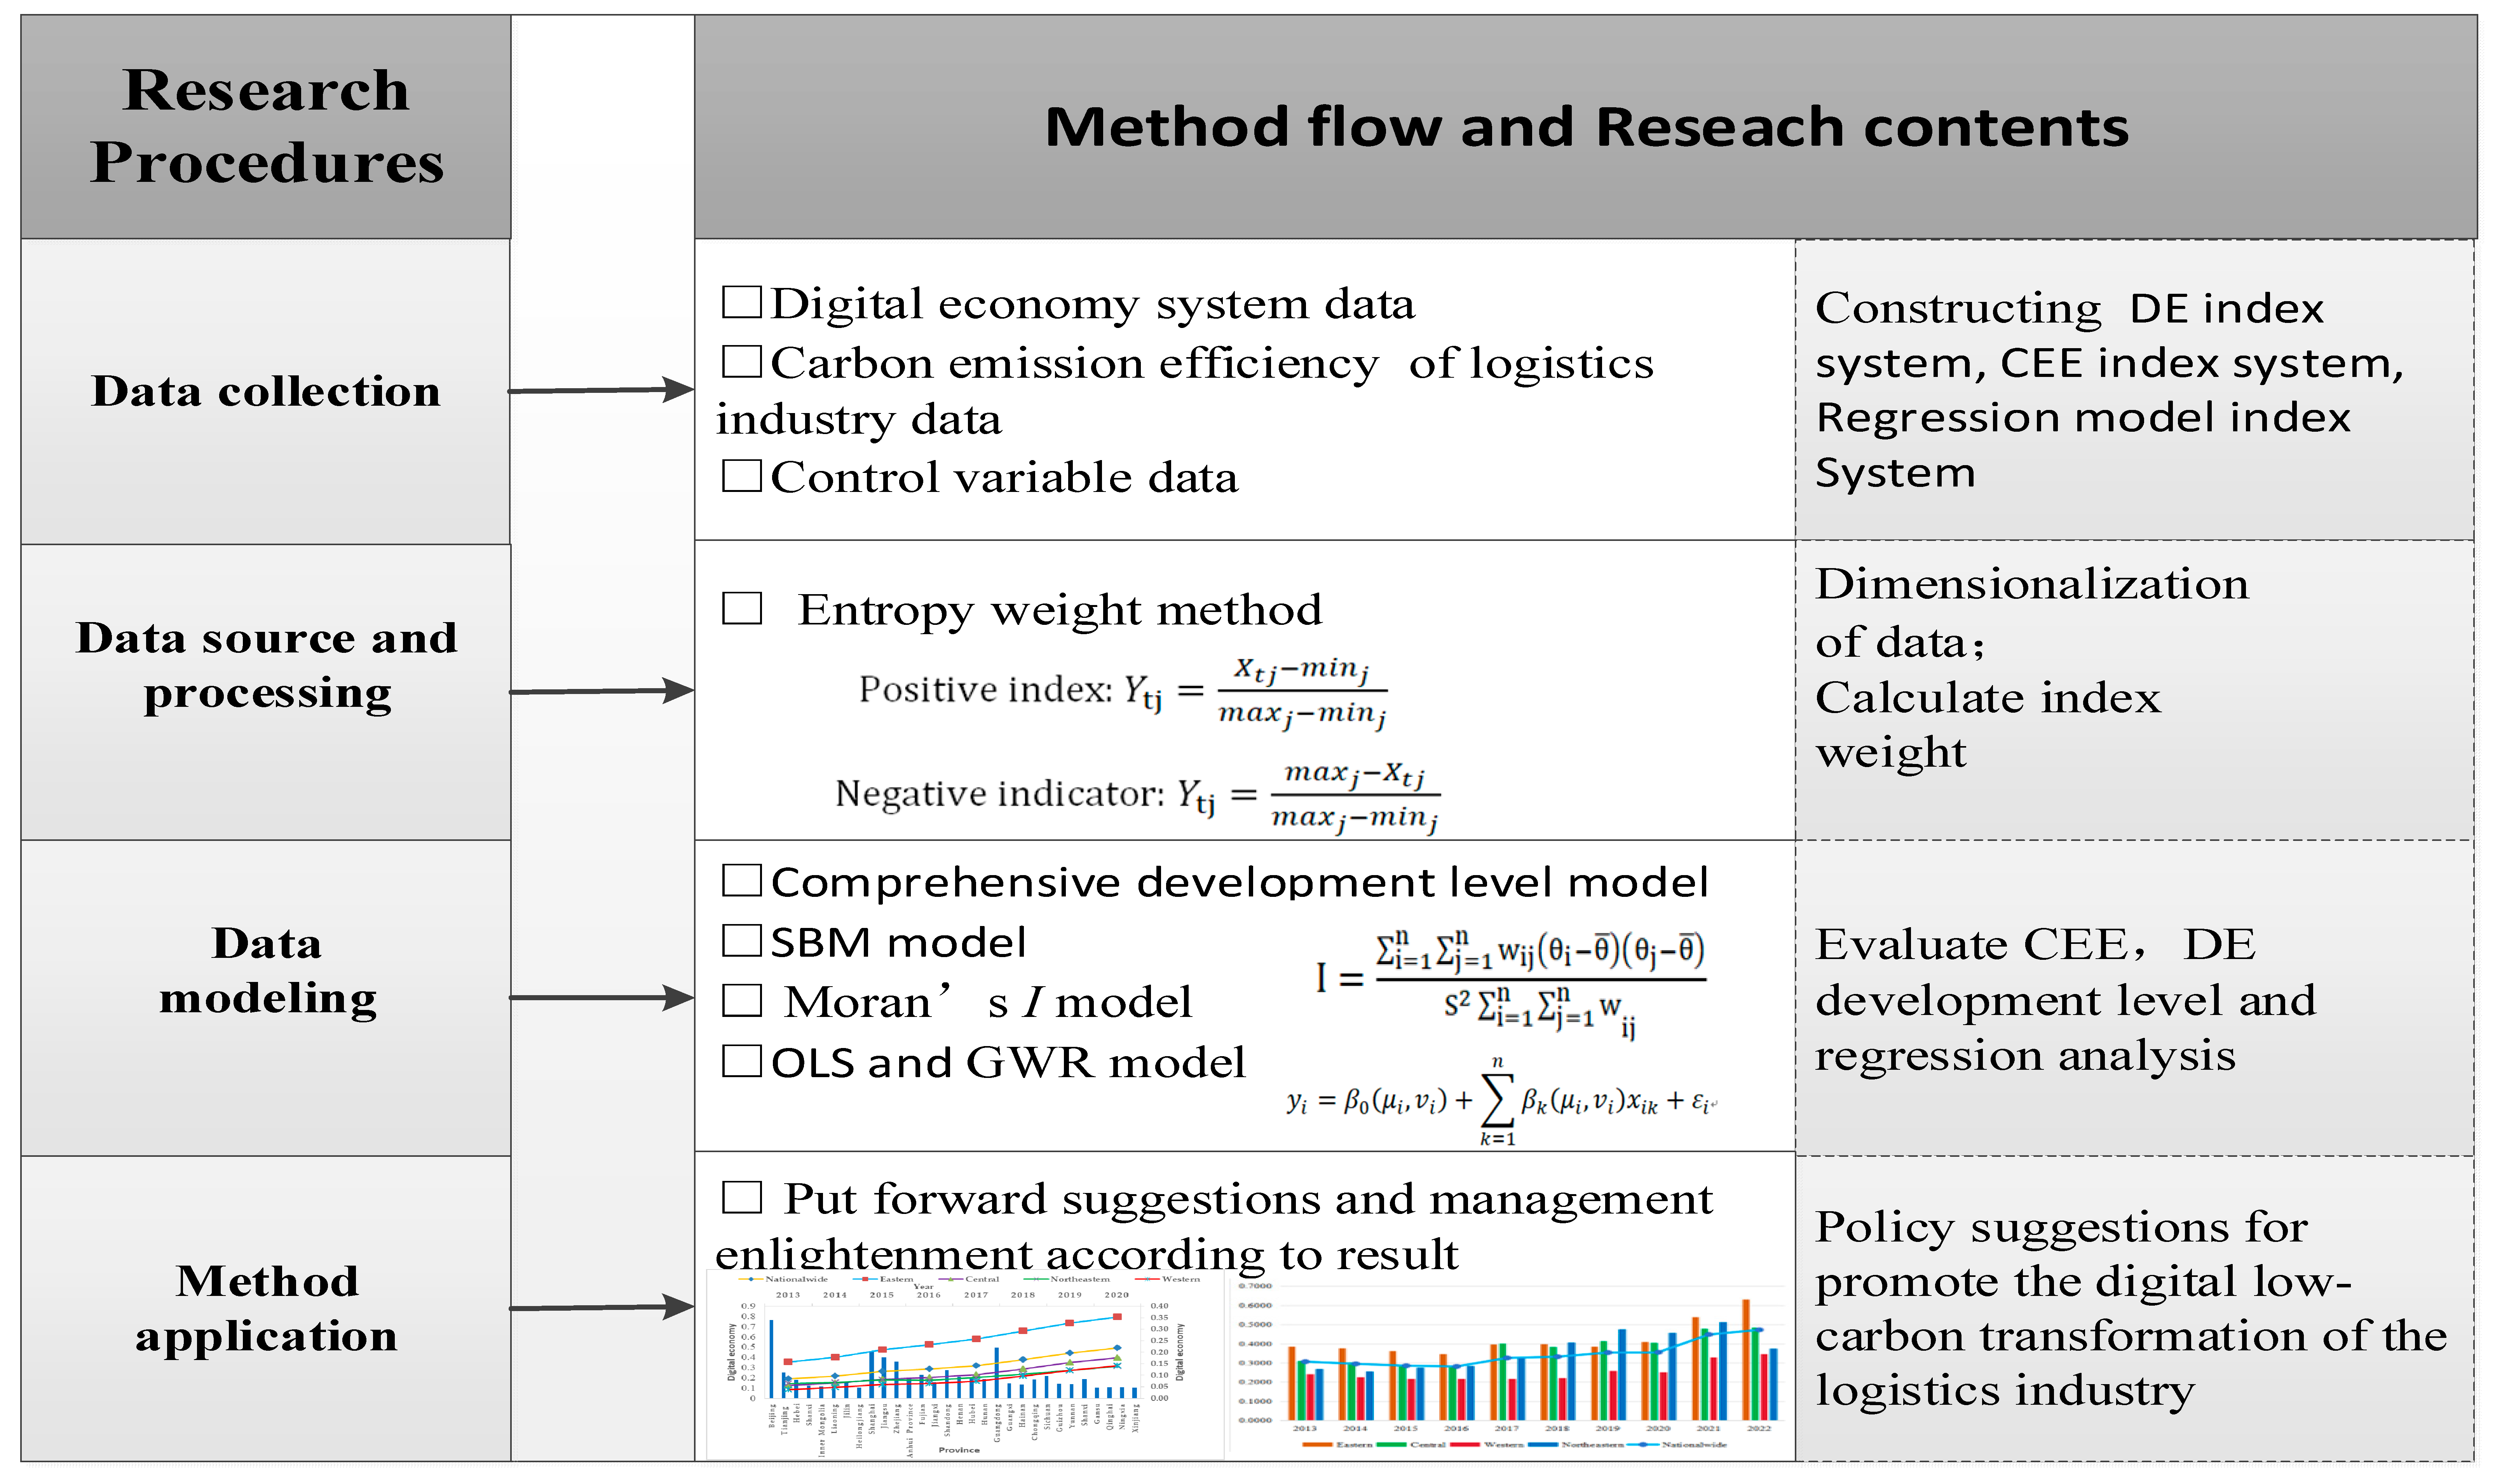
Figure 1. Method application flow.
Sustainability 16 08086 g001
Figure 2. Data application process.
Sustainability 16 08086 g002
Figure 3. Level of development of China’s DE.
Sustainability 16 08086 g003
Figure 4. Years 2013 and 2022 CEE of LI.
Sustainability 16 08086 g004
Figure 5. The CEE values of the LI in the four major regions.
Sustainability 16 08086 g005
Figure 6. Spatial distribution characteristics of regression coefficients in DE.
Sustainability 16 08086 g006
Table 1. Measurement index system for CEE in the LI and DE.
Target LayerPrimary IndicatorsSecondary IndicatorsSymbol Direction
CEE of the LI
(LCE)
Input indicators(Capital investment) fixed assets investment (CNY 100 million) x 1 k +
(Labor input) LI employees (10,000 people) x 2 k +
(Energy input) energy consumption of the LI (10,000 tons of standard coal) x 3 k
Output indicators(Expected output) total output value of the LI (CNY 100 million) y r k g +
(Unexpected output) CO2 emissions from the LI (10,000 tons) y r k b
Development level of DE
(DE)
Digital infrastructureMobile phone penetration rate (unit/100 individuals) a 11 +
Fiber-optic cable line density (km/km2) a 12 +
No. of domain names per person (pieces) a 13 +
No. of web pages per person (pieces) a 14 +
Digital industrializationProportion of software business revenue to the GDP a 15 +
Per capita total telecommunications business (CNY 100 million) a 16 +
Fixed assets investment in the information service industry (CNY 100 million) a 17 +
No. of employees in the information transmission, software, and information technology service industries (10,000 individuals) a 18 +
Digital innovationEmployment in scientific research and technology services industries (10,000 individuals) a 19 +
Research and experimental development expenditure (CNY 100 million) a 20 +
Total No. of undergraduate talents (individuals) a 21 +
No. of patent applications per 10,000 people (pieces/10,000 individuals) a 22 +
Industrial digitizationNo. of websites owned by each hundred enterprises (pieces) a 23 +
E-commerce transaction volume (sales revenue: CNY 100 million) a 24 +
No. of enterprise e-commerce situations (including e-commerce enterprises/total No. of enterprises) a 25 +
Digital Inclusive Finance Index a 26 +
Table 2. Variable indicator system.
Variable TypeVariable NameMeasurement IndicatorsSymbol
Dependent variableCEE of the LISBM calculation resultLCE
Explanatory variablesDevelopment level of DELinear weighting method composite indexDE
Control variablesDevelopment level of the LIProportion of the LI’s output value to GDPLDL
Economic development levelPer capita GDPRJGDP
Integrity with the outside world levelPercentage of GDP that comes from all imports and exportsOPEN
Industrial structurePercentage of GDP attributable to the secondary industry’s output valueIS
Rules pertaining to the environmentPercentage of industrial added value from completed investments in pollution controlER
Table 3. Years 2013–2022 CEE of the LI.
Province2013201420152016201720182019202020212022Mean
1Beijing0.3219 0.3064 0.3340 0.3443 0.2934 0.1656 0.2511 0.2407 0.2938 0.3150 0.2866
2Tianjin 0.4569 0.3743 0.3992 0.4006 0.5516 1.0498 0.4592 0.4279 0.4889 0.6339 0.5242
3Hebei0.5972 0.6342 0.6194 0.5750 0.6697 0.6493 0.6705 0.7791 1.0398 1.0167 0.7251
4Shanxi0.3085 0.2976 0.3143 0.3291 0.8991 0.6602 0.4686 0.4897 0.5681 0.4942 0.4829
5Inner Mongolia0.3846 0.3837 0.3272 0.3429 0.3455 0.5799 0.4780 0.5255 0.8741 0.8428 0.5084
6Liaoning0.2822 0.2806 0.4029 0.4317 0.5422 0.6880 1.0306 0.9331 1.0225 0.6181 0.6232
7Jilin0.2483 0.2285 0.2082 0.2038 0.2177 0.2883 0.2322 0.2742 0.3297 0.3214 0.2552
8Heilongjiang0.2814 0.2606 0.2189 0.2175 0.2232 0.2462 0.1674 0.1634 0.1871 0.1847 0.2150
9Shanghai0.3435 0.4503 0.3112 0.3007 0.3216 0.2922 0.4054 0.5159 0.7422 1.0159 0.4699
10Jiangsu0.5337 0.4231 0.4149 0.4232 0.4359 0.4030 0.4168 0.4678 0.6469 0.5706 0.4736
11Zhejiang0.3163 0.3315 0.3109 0.3253 0.3337 0.2843 0.3123 0.2894 0.3404 0.3902 0.3234
12Anhui Province0.2681 0.2532 0.2294 0.2174 0.2213 0.3493 0.4995 0.5108 0.5770 0.5621 0.3688
13Fujian0.3288 0.3468 0.3711 0.3914 0.4168 0.2474 0.3157 0.3498 0.4491 0.5079 0.3725
14Jiangxi0.3965 0.3270 0.3035 0.3034 0.3801 0.3599 0.4155 0.3961 0.4728 0.5209 0.3876
15Shandong0.4754 0.3766 0.3640 0.3782 0.4027 0.4367 0.4225 0.4553 0.6239 1.0043 0.4940
16Henan0.3246 0.3850 0.3418 0.3636 0.3653 0.3882 0.4572 0.4379 0.5456 0.5935 0.4203
17Hubei0.2304 0.2365 0.2259 0.2031 0.2190 0.2482 0.3392 0.2965 0.3703 0.4104 0.2780
18Hunan0.3320 0.3248 0.3048 0.3028 0.3275 0.2930 0.3003 0.3022 0.3345 0.3303 0.3152
19Guangdong0.3172 0.3183 0.3116 0.1630 0.3321 0.2680 0.3011 0.2877 0.3669 0.4114 0.3077
20Guangxi0.2398 0.2306 0.2364 0.2355 0.2533 0.1843 0.2125 0.2183 0.2557 0.2662 0.2333
21Hainan0.1705 0.2052 0.1794 0.1786 0.2217 0.1984 0.3121 0.2795 0.4046 0.4452 0.2595
22Chongqing0.1929 0.2199 0.2084 0.2176 0.2210 0.1959 0.2390 0.2289 0.2886 0.3205 0.2333
23Sichuan0.1669 0.1837 0.2082 0.2103 0.2161 0.1592 0.1972 0.1922 0.2230 0.2230 0.1980
24Guizhou0.3670 0.3575 0.3608 0.3618 0.3820 0.1844 0.2227 0.2235 0.2861 0.2908 0.3037
25Yunnan0.0920 0.0836 0.0834 0.0825 0.0801 0.1617 0.2368 0.2361 0.2866 0.3204 0.1663
26Shanxi0.2373 0.2250 0.1982 0.2052 0.2036 0.2187 0.2469 0.2778 0.3933 0.4128 0.2619
27Gansu0.2374 0.1398 0.1366 0.1197 0.1341 0.1956 0.2048 0.1842 0.2287 0.2769 0.1858
28Qinghai0.1100 0.1084 0.1165 0.1064 0.1025 0.1069 0.1375 0.1272 0.1619 0.1737 0.1251
29Ningxia0.4174 0.3552 0.3211 0.2875 0.2830 0.2628 0.3395 0.3617 0.4137 0.4134 0.3455
30Xinjiang0.2172 0.2069 0.1954 0.2258 0.1821 0.2061 0.3318 0.1977 0.2259 0.2912 0.2280
Table 4. Moran value test results.
YearMoran’s IZ-Scorep-Value
20130.35223.19250.0014 ***
20140.37963.50190.0005 ***
20150.41153.77670.0002 ***
20160.39253.51430.0004 ***
20170.25022.42640.0153 **
20180.25992.52500.0116 **
20190.30143.09660.0020 ***
20200.39513.67660.0002 ***
20210.40773.67320.0002 ***
20220.34293.12960.0017 ***
Note: ** p ˂ 0.05, *** p ˂ 0.01.
Table 5. VIF values of OLS results from 2013, 2016, 2019, and 2022.
VariableDE2013LGL2013IS2013OPEN2013ER2013RJGDP2013
VIF value6.63931.56991.70357.15161.94782.7402
VariableDE2016LGL2016IS2016OPEN2016ER2016RJGDP2016
VIF value4.25371.14271.32313.94861.08792.9018
VariableDE2019LGL2019IS2019OPEN2019ER2019RJGDP2019
VIF value5.66511.81291.15516.23531.66086.7596
VariableDE2022LGL2022IS2022OPEN2022ER2022RJGDP2022
VIF value4.91261.35091.47697.39281.101535.0314
Table 6. Comparison of GWR and OLS model parameters.
Model Parameters2013201620192022
GWROLSGWROLSGWROLSGWROLS
R0.63740.63730.66200.66180.39130.39090.70710.7069
Table 7. GWR regression coefficient descriptive statistics.
VariableDELGLISOPENERRJGDP
Year201320222013202220132022201320222013202220132022
Max1.2565 0.6116 5.1633 18.4101 0.4468 0.1732 −0.0741 −0.0337 −3.3099 11.7346 0.0148 0.0250
Median1.2562 0.6109 5.1623 18.4083 0.4466 0.1728 −0.0741 −0.0338 −3.3193 11.7017 0.0148 0.0250
Min1.2557 0.6107 5.1614 18.4065 0.4465 0.1721 −0.0742 −0.0340 −3.3276 11.6218 0.0148 0.0249
Disclaimer/Publisher’s Note: The statements, opinions and data contained in all publications are solely those of the individual author(s) and contributor(s) and not of MDPI and/or the editor(s). MDPI and/or the editor(s) disclaim responsibility for any injury to people or property resulting from any ideas, methods, instructions or products referred to in the content.