Abstract
The pivotal aspects of enhancing regional ecosystem services and augmenting socioeconomic growth lie in optimizing the land-space development and protection strategies, coupled with the establishment of a robust ecological network (EN). This article examines the Poyang Lake area and employs the MOP model, NSGA-II, and PLUS model to determine the best sustainable land use strategy. Subsequently, the MSPA, InVEST model, circuit theory, complex network, and others are employed to construct and analyze the land-space EN across three time periods. Ultimately, the EN is optimized based on spatial protection priority, ecological obstacle areas, and ecological nodes. The results show the following: (1) From 2005 to 2035, more construction land will be developed around the Greater Nanchang area and other urban centers. In the BAU scenario, construction land will expand faster, while cultivated land, forest, grassland, and bare land will continue to decline. In the SD scenario, the alteration to comparable land is minimal, the growth rate of construction land will slow, cultivated land, forest, grassland, and bare land will all decline little, and the water area will increase slightly; (2) While the area of ecological sources is decreased and ecological corridors become longer and narrower in the BAU scenario, the spatial distribution of ENs in different periods is small, and the quantitative structure and spatial distribution of ecological sources and corridors are essentially unchanged in the SD scenario; (3) Based on the topological structure of ENs, it is found that the clustering of nodes in the SD scenario is more obvious, the importance of ecological sources is enhanced, the efficiency of information transmission is improved, and the radiation range is wider and more stable; (4) The greatest priority ecological sources in each period are concentrated around Poyang Lake. In the SD scenario, the priority of ecological sources improves, and 7025 km2 of ecological obstacle restoration area is identified, with 41, 31, and 36 ecological breakpoints in the first, second, and third levels. The study’s findings can assist and shape theoretical and practical approaches to land governance and sustainable development in great lake areas.
1. Introduction
The most striking aspect of global land use change in the contemporary era is urban expansion [1], and it is also a prominent stage that China is experiencing at present [2]. According to the United Nations, it is projected that by 2050, the proportion of the urban population worldwide will reach 68%, which means that most residents will live in cities [3]. With the ongoing extrapolation of urban boundaries and the increasing intensity of construction, development, and utilization, natural surfaces such as forests, grasslands, and farmland are eroded [4,5], which leads to heavy losses of ecological functions, especially the loss of biodiversity and habitat fragmentation [6,7]. These losses pose a significant challenge to ecological security, which in turn makes it harder for the sustainable development path of human society [8,9,10]. In this context, China’s major challenges in achieving the sustainable goals are to optimize land-space development and utilization patterns, as well as to strengthen ecological civilization construction [11,12,13]. By optimizing and adjusting the land use structure and layout, reconciling the contradiction between land-space planning and ecological protection [14], especially solving the coupling problem, and optimizing the management strategies of urban land expansion and ecological protection in space–time [15,16,17], it has become the key to achieve the goal of sustainable development (SDG).
There are roughly three principal avenues through which the optimization of land-space layout may be achieved [18,19,20]. Firstly, a comprehensive consideration of the natural resource endowment, socioeconomic conditions, and location conditions is required, with an evaluation of land suitability conducted through multi-criteria superposition [21,22] and spatial supply–demand coupling [23,24]. A second approach to be considered is that of exploring multi-objective optimization of land use through multiple-objective programming (MOP) [18,25,26], multi-objective genetic algorithm [27,28], multi-agent particle swarm optimization algorithm [29,30,31], and ordered weighted average algorithm [32,33]. Thirdly, linear programming [28,34,35], Markov model [28,36], system dynamics [37,38], cellular automata [28,36,38], and other methods are employed to simulate and predict the optimization of land quantity structure and spatial allocation. The approach to these models can be abstracted into top-down and bottom-up models. There are many common models that are constantly improving, such as SLEUTH, CLUE-S, CA-Markov, GeoSOS, FLUS, OS-CA, and so on [18,26,39]. The PLUS model developed by Liang et al. [40] is the most recent achievement in this domain. It is a cellular automata (CA) model for analyzing raster-scale data, which can dynamically simulate the creation and changes of different land patches over time and space, and explore the mechanism of land use change in the simulation process.
Currently, the national land-space planning is oriented by ecological priority [41], so it is an important measure to construct ecological security patterns to realize the SDGs. As an eco-spatial system with high connectivity and staggered structure, ecological networks (ENs) are significant to alleviate the fragmentation of the urban ecological landscape and balance the relationship between urban development and ecological protection [42,43,44]. Many scholars have conducted a lot of empirical research by combining it with landscape and land use planning [37,38]. Gao et al. [38] simulated the land use pattern of Wuhan urban agglomeration, as well as utilized the landscape mapping method to evaluate the spatial protection priority of ENs in a dynamic landscape, providing new insights for habitat and biodiversity protection due to human activity and climate change. The EN has conformed to the paradigm of “source area-resistance surface-corridor” [45,46,47], which is spatially and structurally connected through the integration of points, lines, and surfaces. The existing literature on identifying ecological sources includes morphological spatial pattern analysis (MSPA) [48,49], particle size inversion extrapolation [50,51], ecosystem service importance assessment [37,49,52], habitat sensitivity assessment [53,54], and landscape connectivity analysis [52,55]. Human activities affect biological fluxes; thus, resistance factors and correction coefficients are chosen accordingly to construct the resistance surface [37,38]. Furthermore, it is a common method to construct the ecological security index through spatial principal component analysis (SPCA) from the background characteristics and potential threats of the ecological environment [56]. In order to enhance landscape connectivity, the minimum cumulative resistance model (MCR) [48,49], the gravity model [49,56], and circuit theory [38,55,56] have also been widely applied in identifying ecological corridors. The identification of EN elements and the analysis of the overall network structure have reached a point of maturity.
Due to the layout flexibility of ENs [57,58], the different priorities of construction projects [38,59], the dynamics of socioeconomic development, and the uncertainty of decision-makers’ behavior [30,31,60], there is a complex nonlinear interaction between construction land expansion and ecological networks. Most of the existing studies on the realization of SDGs are to explore and optimize land use structure and layout, or to build ENs according to land use analysis, and few of them are coupled [38,61,62]. In addition, the construction of ENs is mostly based on the current and historical static land use situation, and rarely takes future conditions and temporal dynamic analysis into account [63,64]. As a multi-factor composite system, EN is rarely analyzed in the existing research on its landscape elements and network structure [38,55,65]. Furthermore, its construction and specific realization path are a very complicated and expensive process, so it is a flawed approach to plan and develop programs only from the macro level. In the specific implementation of ecological management and restoration projects, it may be preferable to analyze elements’ importance and network structure, reveal the dynamic differences of landscape patterns in time and space, and identify the key areas of ecological restoration.
Poyang Lake is the largest freshwater lake in China, and the area around Poyang Lake is a typical great lake area in China [66,67]. The water, soil, environment, and biological resources in its basin provide a guarantee for the reproduction and diversity of organisms. It is an important ecological function protection area in China, and an invaluable production base for various crops and fish, which makes it of great significance in ecological environment protection and coordinated economic development. Considering the shortcomings of the existing research, this study starts with SDGs, focusing on the space–time coupling and optimal control of land-space layout optimization and ecological environment protection. The specific objectives are as follows: (1) Explore the best scheme of land use structure and layout under the SDG around Poyang Lake in 2035; (2) Construct preliminary multi-period ENs, and comparatively analyze their differences in different periods and scenarios under the control of history and the present situation, natural development, and planning; (3) Analyze the differences in landscape elements and network structure of ENs in different periods, and identify critical areas for ecological protection; (4) Optimize the EN of the research area based on the preliminary ENs, ecological protection priority, ecological obstacle restoration area, and so on, to enhance the achievement of the SDG. This study aims to furnish a management framework and hands-on insights for land-space governance, as well as ecological civilization construction in great lake areas. It endeavors to guarantee the balanced progression of socioeconomic advancement and ecological environment protection in these areas, thus establishing a model for harmonious coexistence between humans and nature in the new era.
2. Materials and Methods
2.1. Overview of the Study Area
The area surrounding Poyang Lake is located at the confluence of the middle and lower reaches of the Yangtze River, in the northern region of Jiangxi Province. The five water systems of Gan, Xin, Fu, Rao, and Xiu are interconnected, as are the external systems with the Yangtze River mainstream [68,69]. This configuration contributes to the formation of a relatively autonomous, stable, and comprehensive natural ecosystem. Its jurisdiction covers some counties of Nanchang, Jiujiang, Jingdezhen, Fuzhou, Shangrao, Yingtan, and Yichun, with a total of 42 counties (districts), including the whole Poyang Lake, with a total land area of about 6.99 × 10⁴ km2, accounting for 41.86% of the total provincial area. Based on the “lake effect” [70], the whole study area can be divided into three layers: lakeshore, near lake area, and far lake area, which have their own characteristics and are interrelated (Figure 1). The regional landscape types are distinguished by a high degree of complexity and diversity, encompassing a range of ecosystems with rainy monsoon, dense river networks, and rich vegetation types. It is home to a vast array of species, including 139 species of fish and 310 species of birds [71]. More than 90% of the world’s whooping cranes winter at Poyang Lake, which is the largest wintering habitat for migratory birds and the largest wild population of porpoises in Asia, providing a good ecological environment for wild animals and plants, and ecological function status is critical. Concurrently, as the most developed area in Jiangxi Province, the study area is adjacent to internationally developed areas such as the Yangtze River Delta and the Pearl River Delta. Additionally, it is a pivotal region for the advancement of the “Belt and Road” initiative in China. Therefore, how to rationally plan the region, build the ecological space of livable cities and towns, and carry out the ecological protection and restoration of “mountains, water, forests, fields, lakes and grasses” is significant to promoting the sustainable development of the region and even the whole country.
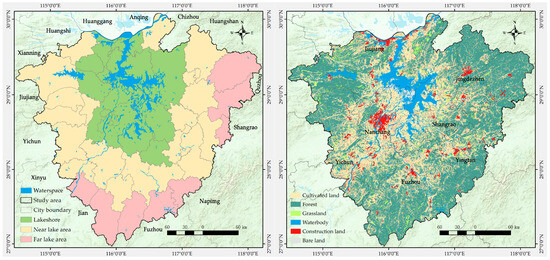
Figure 1.
Location map around Poyang Lake area.
2.2. Data Sources and Processing
The data involved in this study include remote sensing images, land use cover, road traffic, water system, digital elevation model (DEM), slope, net primary productivity (NPP), population density grid, gross domestic product (GDP) grid, residential area, temperature grid, precipitation grid, and socioeconomic statistics. The remote sensing images were obtained from Landsat 5 TM and 8 OLI in Google Earth Engine (https://developers.google.cn/earth-engine/, accessed on 5 November 2023), with a cloud cover of less than 5% and a resolution of 30 m in 2005 and 2020. Land use data are extracted by the random forest method and visual interpretation, which are divided into six types: cultivated land, forest, grassland, water body, construction land, and bare land. To validate the accuracy of the interpretation results, the confusion matrix tool was used in conjunction with historical pictures from Google Maps and field sampling visits. The results showed that the total classification accuracy of the two remote sensing photos was over 90%, and the Kappa coefficient exceeded 85%, which meets the study’s standards. Other essential socioeconomic raster data are certified for comparison, primarily through the official release of statistical yearbooks.
A detailed account of the specific data sources, data processing, and uses can be found in Table 1.

Table 1.
The source and usage of data.
2.3. Research Methodology
The general idea of this study is as follows (Figure 2). Firstly, the simulation results of land use optimization under the SDG are realized by using the MOP model, NSGA-II, and PLUS model. Secondly, based on multi-period land use patterns and through the application of the MSPA, InVEST model, circuit theory, and others, preliminary multi-time series of ENs for the study area are constructed. Thirdly, a complex network model is utilized to analyze the topological characteristics of ENs and to identify the node (source) priority. Ultimately, the EN is refined in accordance with the network structure characteristics and ecological obstacle areas.
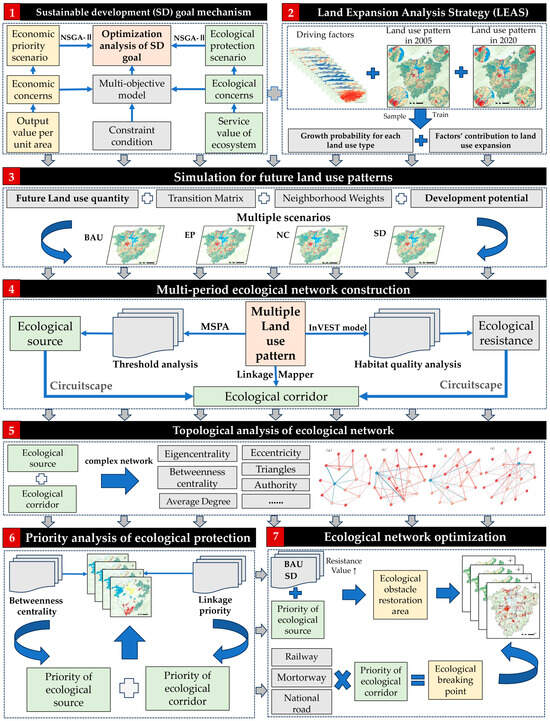
Figure 2.
The Technical Route and Image Summary.
2.3.1. SDG Realization Mechanism
- (1)
- MOP model
The multi-objective programming (MOP) model is based on the scientific analysis of objective laws and the accurate grasp of constraints, so as to achieve the maximum optimization of one or more preset goals [18]. It is one of the important models for the optimal allocation of land resources. The model consists of three parts: objective function, decision variables, and constraint condition. The specific formula is as follows:
where represents the objective function; represents the coefficient of the i-th decision variable; is the i-th decision variable; r is the number of objective functions; represents the coefficient of the i-th decision variable in the j-th constraint condition; represents the constraint value of the i-th decision variable.
- (2)
- Development scenario setting
The selection of a simulated target year is an important part of scenario research, and the year 2035 is the strategic node of China’s land spatial planning, which plays a crucial part in the realization of the SDGs [41]. In consideration of the adaptation to the top-level design, this paper establishes 2035 as the target year for scenario research, delineating four development scenarios from disparate perspectives: (1) Business as usual (BAU). In this scenario, regardless of any external policy factors, land use will continue to evolve according to the pattern and speed under the background of historical trends; (2) Economic Development scenario (ED). Taking the maximization of economic benefits as the priority goal, that is, bare land has been developed on a large scale, and the likelihood of cultivated land, forest, grassland, and water bodies being converted to construction land has been greatly increased. The objective is to accelerate the integrated development of urban and rural areas, thereby promoting a further increase in the urbanization rate; (3) Nature Conservation scenario (NC). Maximizing ecological benefits as the development goal, that is, the probability of transferring forest land, grassland, and water bodies to cultivated land and construction land is significantly reduced. Strengthen ecological land protection and strictly control the spatial urban and rural construction expansion; (4) Sustainable Development scenario (SD). In accordance with the stipulations of macro-policy control, it is imperative to guarantee that the red line of cultivated land and key ecological space are not occupied. This must be carried out while considering the socioeconomic benefits and ecological protection. As the social benefits are challenging to quantify, this study primarily achieves the SDG through the optimal model that strikes a balance between ecological and economic benefits.
- (3)
- Objective function
The economic benefits are mainly reflected in the economic output potential of each land type. Specifically, the economic benefit coefficients of cultivated land, forest, grassland, construction land, and water bodies are reflected by the output values of planting, forestry, animal husbandry, secondary and tertiary industries, and fishery, respectively. Since there is almost no economic activity in the bare land, the economic output benefit coefficient of bare land is set at 0.001. Through the statistical yearbook of Jiangxi Province over the years, the land economic benefit coefficient of 2035 is predicted by using the GM (1,1) model (Table 2).
Table 2.
The coefficient of economic and ecological benefits per unit area of different land types around the Poyang Lake area (104 CNY·hm−2).
The ecological benefits are mainly quantified by evaluating the ecosystem service value. This study obtained the ecological benefit coefficients by combining the actual situation of the study area with the grain yield per unit area, and by applying the NPP and GDP in comparison with the national average [73] and correcting the equivalent factor for the value of China’s terrestrial ecosystem services proposed by Xie et al. [74] (Table 2).
- (4)
- Constraints
In order to gain insight into the limitations of socioeconomic development, relevant land use planning, and policies around Poyang Lake area, it is necessary to consider a number of key documents. These include the Land Space Planning of Jiangxi Province (2021–2035), the National Land Planning Outline for 2016–2030 (Land Planning Outline), the Ecological Urban Agglomeration Around Poyang Lake Plan (2015–2030), the Outline of the Fourteenth Five-Year Plan and Visionary Targets for National Economic and Social Development of Jiangxi Province, and numerous other policy documents set forth the following conditional constraints (Table 3) to guarantee the scientific rigor and precision of the study.
Table 3.
Constraints on the optimization of land use structures around Poyang Lake area.
- (5)
- NSGA-II
When multiple objectives act synergistically, a solution is sought that satisfies all conditions and achieves optimality, known as the Pareto solution set. When solving multi-objective function problems, a common practice is to assign different weights to each objective function, such as through linear weighting, and then convert the multi-objective into a single-objective problem for solving. However, this method is often limited by subjective judgment. In contrast, the most popular multi-objective, NSGA-II, searches for multiple non-inferior solutions, effectively addressing conflicts and trade-offs between multiple objective functions. Additionally, it maintains the diversity and distribution of solution sets during the search process, overcoming the subjectivity associated with traditional methods.
NSGA-II is widely used with land use multi-objective optimization problems, the core of which lies in the construction of a collection of non-dominated solutions by calculating the crowding distances of individuals, that is, the Pareto frontier [27,28]. A non-dominated solution is one that excels in all objective function values compared to any other solution in the population. This optimal retention strategy ensures that the best individuals are kept in each iteration, greatly enhancing the algorithm’s global convergence and increasing its efficiency in solving complex problems. The parameters of the algorithm are determined by using MATLAB R2022a, and after several adjustments and tests, the parameters of the algorithm are as follows: the initial population is set to 200 to ensure the diversity of samples, the crossover ratio is 0.7, the Pareto set ratio is 0.35 to retain the best solution, and the constraint tolerance is 0.001 to strictly control the conditions. Since the algorithm is designed to find the minimum value, the economic and ecological benefit objectives are taken as negative to suit the algorithm’s needs.
2.3.2. Simulation of Land Use Pattern
- (1)
- PLUS model
The PLUS model integrates the land expansion analysis strategy (LEAS) and CA model based on multiple types of random patch seeds (CARS). The LEAS module analyzes land use changes and identifies the expansion probability and main driving forces by the random forest algorithm. The CARS module then makes adaptive adjustments based on the difference between the expected demand of the land classes and the number of the existing land classes through continuous iterations to make the number of land classes reach the expectation.
- (2)
- Analysis of driving mechanism
By referring to a predecessor’s research, 12 factors such as elevation, slope, precipitation, temperature, population, GDP, nighttime lighting, and distance from various road types are selected. Due to the elimination of discrepancies in the scale of different data, they are normalized (between 0 and 1) to obtain their spatial distribution results [38] (Figure 3), which are input into the PLUS model to produce the development probability and driving factor contribution of various land types.
- (3)
- Land use pattern simulation
This paper first uses land use data from 2005 to 2020 to obtain the development probability of regional expansion, and then fills in the land use cost matrix and neighborhood weight to simulate the future land use pattern through software calculation. Referring to the previous research experience [39], the water area is regarded as the restricted conversion area. The land use cost matrix represents the conversion rules, which are used to reflect whether the categories can be converted to each other (Table 4). The value of 0 signifies that the item in question is not convertible, whereas the value of 1 signifies that the item is convertible.
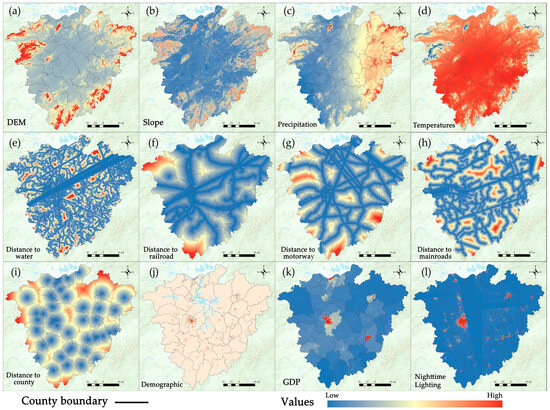
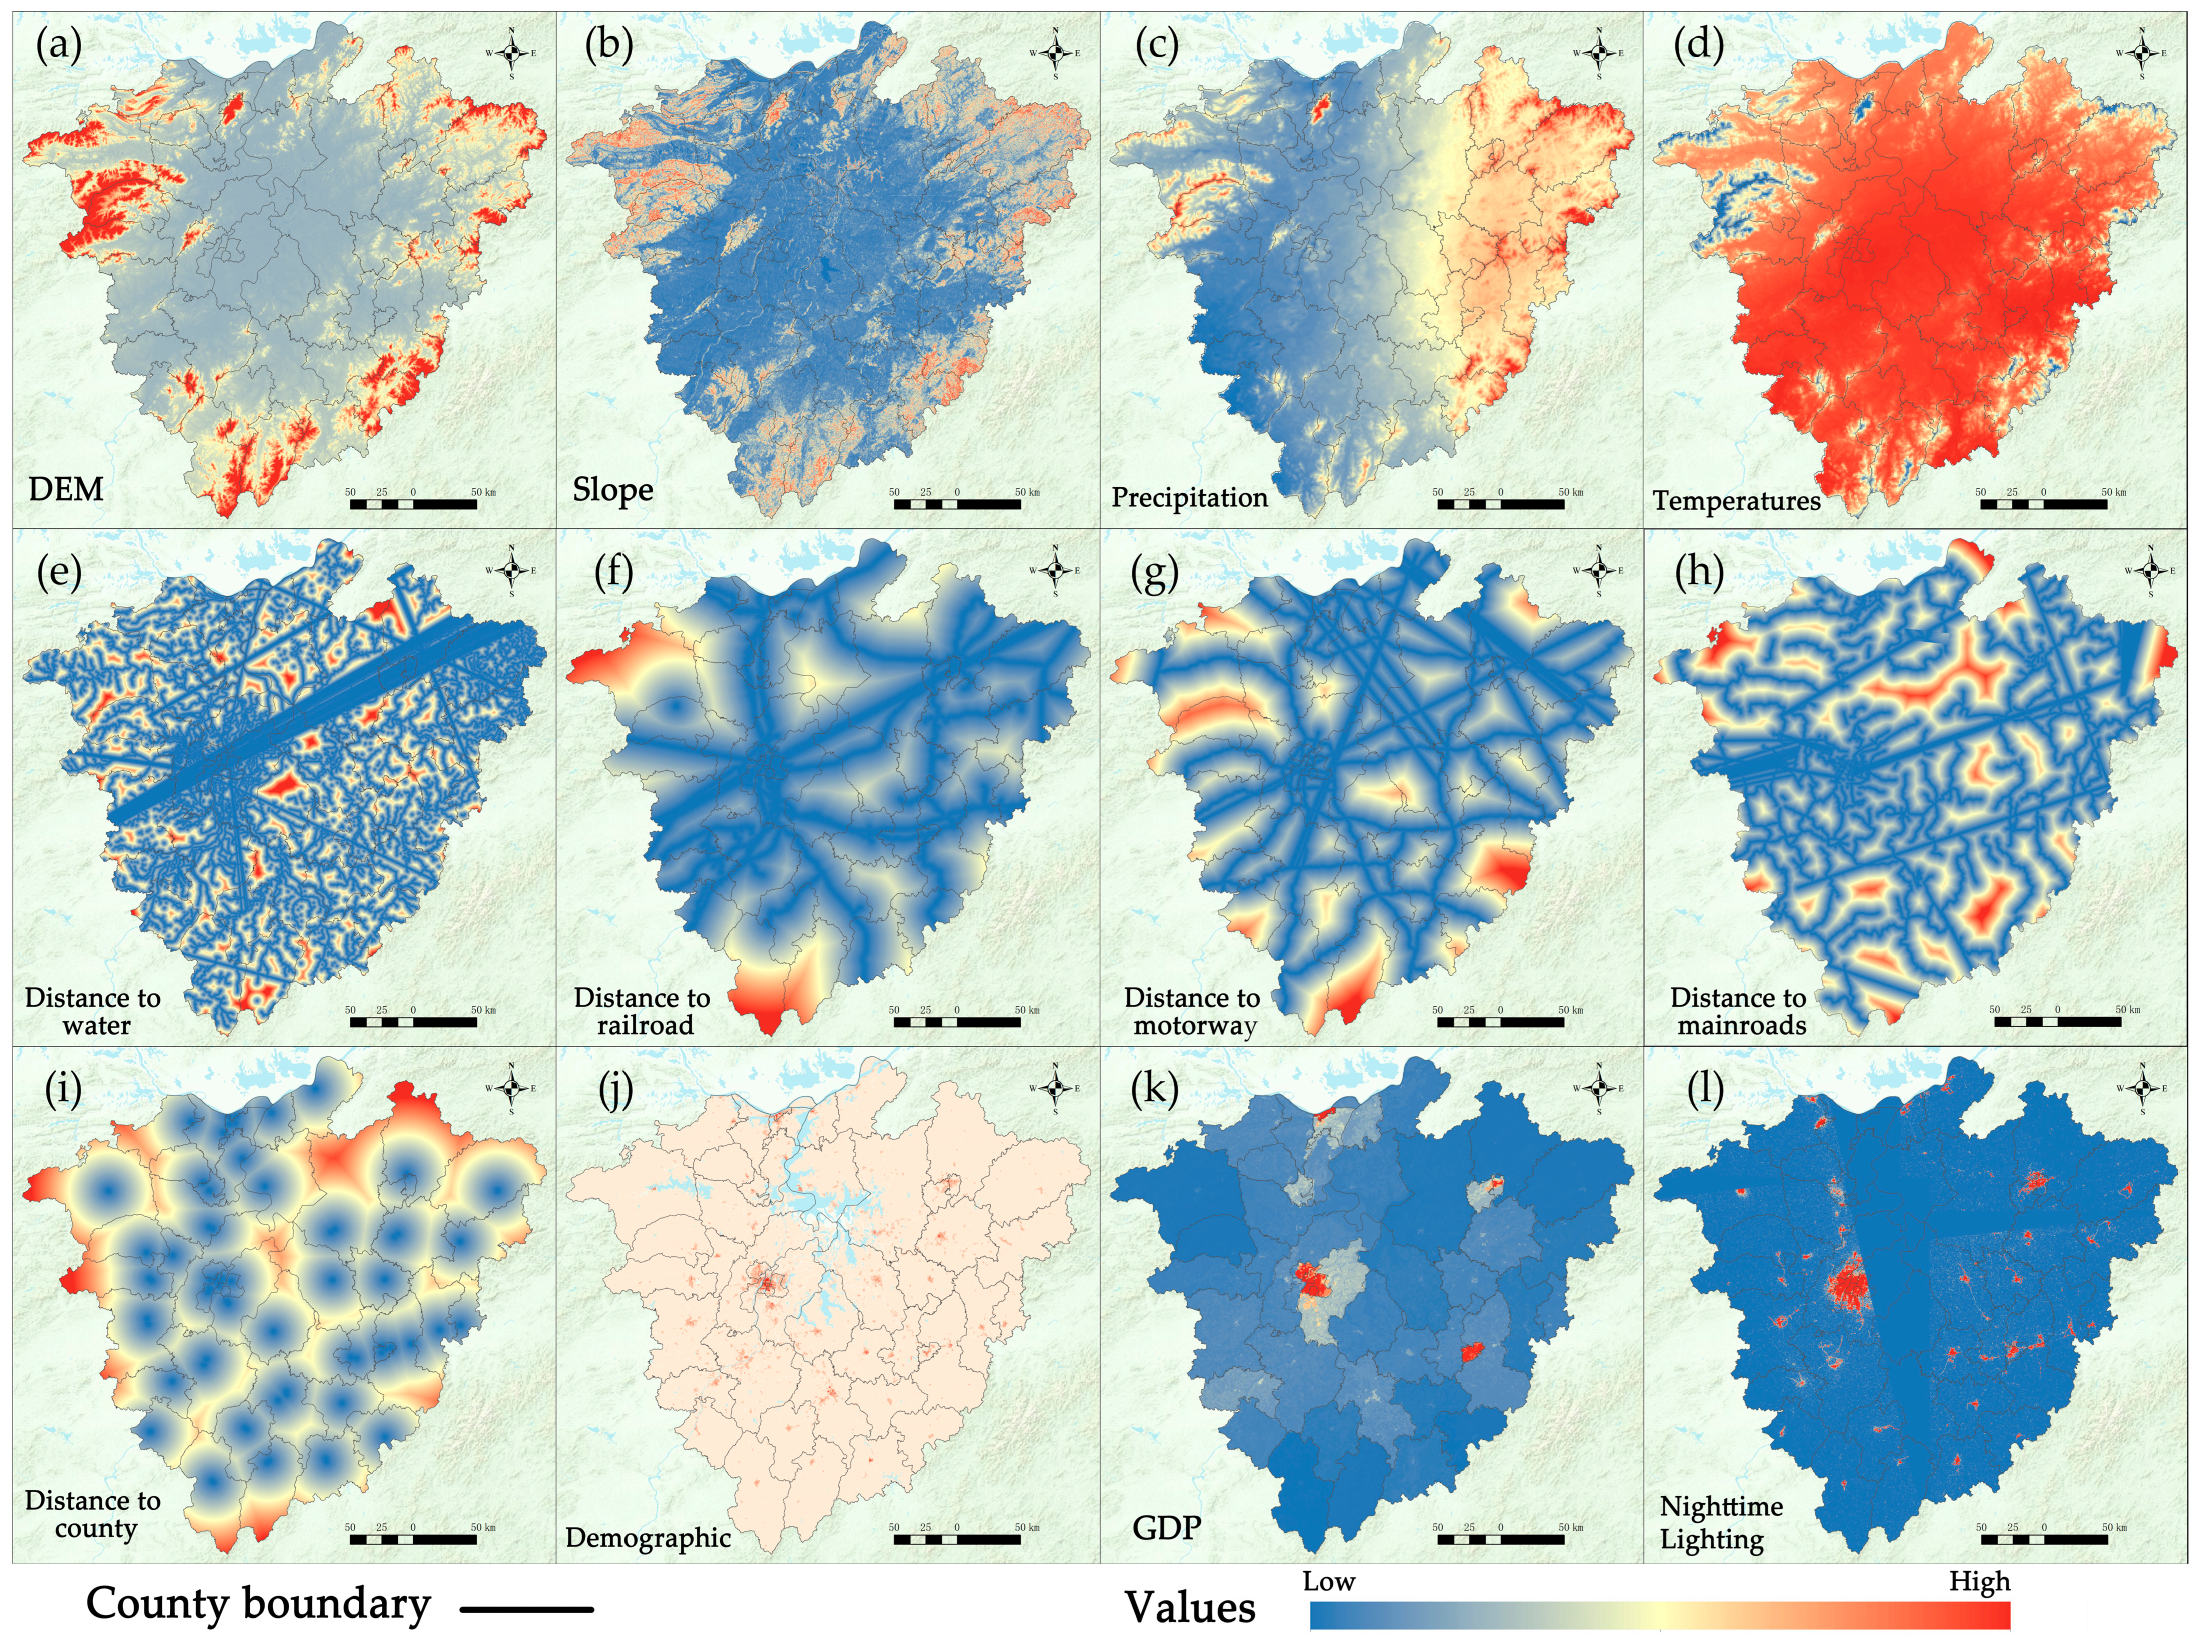
Figure 3.
Spatial distribution maps of potential driving factors of land expansion around Poyang Lake area. (a) DEM; (b) Slope; (c) Precipitation; (d) Temperatures; (e) Distance to water; (f) Distance to railroad; (g) Distance to motorway; (h) Distance to main roads; (i) Distance to county; (j) Demographic; (k) GDP; (l) Nighttime Lighting.
Table 4.
The land use cost matrix under different scenarios around Poyang Lake area.
Neighborhood weight is an index that measures the growth intensity of various land use types, revealing the expansion potential and actual expansion ability of all forms of land under the action of spatial driving variables.
Neighborhood weight is an index to measure the growth intensity of different land use types, which reveals the expansion potential and actual expansion ability of all kinds of land under spatial driving factors, and the calculation formula is as follows:
where is the domain weight parameter; represents the variation of land use type i; and are the maximum and minimum variation, respectively, of land use type i. The calculation indicates that the neighborhood weights of cultivated land, forest, grassland, water body, construction land, and bare land are 0.27, 0.21, 0.04, 0.12, 0.34, and 0.02, respectively.
A comparison between the 2020 simulation results and the real land use pattern was conducted to verify the accuracy of the model. The Kappa coefficient reached 0.86, with an overall accuracy of 0.91 and an FOM value of 0.177. These findings showcase the model’s reliable simulation accuracy, which demonstrates its suitability for simulating the land use pattern in 2035 and meeting the research requirements.
2.3.3. Preliminary Construction of ENs
MSPA, as an image processing method, allows for measuring, identifying, and segmenting the spatial pattern of raster images [48,49], which is accomplished through using mathematical morphological principles, such as erosion, expansion, opening, and closing [75,76]. The process begins by identifying and isolating individual pixels, which are then analyzed for connectivity between patches. The land (forest land, grassland, and water area) affected by ecology is taken as the foreground, and others are taken as the background. The FG connectivity was set to the eight-neighborhood analysis method. The transition was set to 2, which resulted in a greater frequency of bridge and loop zones. Given the accuracy of the raster data, the edge width was set to 3. The intext was set to 1 to divide the landscape types into internal and external. Seven landscape types are obtained after being processed by the GuidosToolbox platform, and the core is used as the candidate for ecological source selection. The existence of a greater number of smaller core areas means a higher degree of fragmentation. For the purpose of reducing the degree of habitat fragmentation, the minimum patch area of ecological source was threshold analyzed by the moving search method according to the quality of habitat, and finally the minimum patch area was determined to be 2 km2.
Previous studies on ecological resistance surface often select vegetation coverage, landscape types, topography, elevation, and so on to build an evaluation system of resistance factors, and then determine the weight by the Delphi method or analytic hierarchy process. This method is subjective in both factor selection and weights, and it cannot show well the internal differences of land use types [47]. By using the PLUS model and setting the reciprocal of habitat quality as the ecological resistance value, human subjectivity can be well reduced. The habitat quality depends on the intensity of land use by nearby humans, and the habitat quality decreases with the increase in land use intensity. The specific calculation formula is as follows:
where is the habitat suitability of land use type j; represents the habitat stress level of grid x in land use type j; K is the semi-saturation constant; z is the scale factor.
The circuit theory model replicates a single species’ migration and diffusion in the landscape by utilizing the random traveling properties in a circuit. The passing landscape is treated as a resistive surface, and response resistance ratings are assigned to different landscapes based on whether they are favorable to certain biological processes. Ecological corridors are crucial channels for species migration and information transfer between ecological sources, and they also have the least resistance [65]. To facilitate the flow of migratory birds and predominantly primate and bird species, a corridor threshold of 1.5 km was established for promoting biological flows from selected ecological sources. Based on the identified ecological sources and resistance surfaces, potential ecological corridors were identified by using the Linkage Mapper tool.
2.3.4. Topological Characteristics Analysis of ENs
A complex network can be defined as a specific type of network structure that emerges from the abstraction of complex systems. It comprises two fundamental elements: nodes and edges. Nodes represent the basic units of the network, while edges indicate the relationships between nodes, signifying the influence that one node exerts on another. An EN is a type of complex network. The ecological source, which can be considered the geological heart of the network, is represented by nodes, while the ecological corridor is represented by edges. These are used to construct an undirected topological network.
The node characteristics of ENs, as well as the structural characteristics of the entire network, are comparatively analyzed by selecting eight topological indicators, including average degree, authority degree, eigenvector centrality, average path length, clustering coefficient, graph density, number of triangles, and eccentricity distance.
In graph theory and network analysis, centrality is a way to assess the importance of nodes within a network. This includes point degree centrality, eigenvector centrality, closeness centrality, and betweenness centrality. There are numerous interpretations of node importance, and the indicators used to determine centrality under different interpretations vary. In this study, betweenness centrality is employed to evaluate the priority of ecological sources, whereby previous studies on the importance of nodes in ecological sources are referenced [38].
2.3.5. Optimization of the EN
An important aspect of EN optimization is the identification and dynamics assessment of important ecological spaces to further prioritize spatial ecological protection in a multi-temporal context. Based on the topological characteristics of ENs, the ecological source priority is identified based on the betweenness centrality. The ecological corridor priority is realized by adopting the Linkage priority tool of Linkage Mapper through circuit theory.
Based on future land use simulation results, the areas with increasing resistance values in both the BAU scenario and SD scenario were identified according to Circuitscape, and for the high-resistance areas distributed near the important ecological spaces, they are the key areas for ecological restoration. Therefore, by identifying the high-resistance areas around the areas with a high priority level of ecological sources, they are set as ecological barrier restoration areas, which need to be valued and restored to enhance the overall landscape function and connectivity.
Ecological nodes are relatively weak but ecologically critical areas that play the role of “stepping stones” along the EN. Artificial landscapes, especially road networks, run through different landscape types and have a direct impact on ecological processes, and there are differences in the disturbance of ecosystems that varies among different levels of roads [77]. In this research, three types of roads, including railways, motorways, and national highways, were superimposed on potential corridors to identify ecological breaks, which were categorized into three levels according to the priority of the ecological corridors. The higher the level, the more attention is needed [78].
3. Results
3.1. Land Use Simulation and Spatio-Temporal Evolution Analysis
3.1.1. Detection of Driving Factors of Land Expansion
The contribution of each driving factor is obtained by using the LEAS module of the PLUS model (Table 5 and Figure 4). For cultivated land, the influence of each factor is not much different, the biggest influence is GDP and distance to county (government), and the smaller influence is the distance from railways and water systems. DEM has the greatest impact on forest, grassland, and water bodies, while nighttime lighting has the least impact on these three land use types. For construction land, population factors, nighttime lighting, and distance to county (government) have a great influence, while slope and distance to water system have little influence. Population factors and DEM have the greatest impact on bare land, while nighttime lighting has the least impact.
Table 5.
Contribution of driving factors of land expansion around Poyang Lake area.
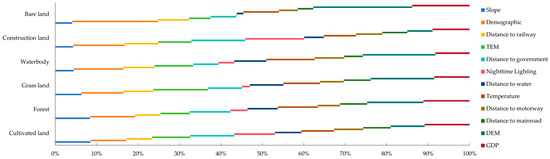
Figure 4.
Contribution of driving factors of land expansion around Poyang Lake area.
3.1.2. Simulation and Dynamic Change of Land Use Structure
As an important ecological space and major grain-producing area in Jiangxi Province, cultivated land and forest accounted for more than 80% of the whole area in three periods (Table 6 and Figure 5). During the period of 2005–2020, the cultivated land and forest land decreased by 0.68% and 0.53%, while the water body increased slightly and the construction land increased by 1.57%. The cultivated land, forest, and grassland in the BAU scenario decreased by 0.58%, 0.54%, and 0.24, respectively, compared with 2020, while water body and bare land changed little. Notably, the construction land increased by 1.33%. By coupling the MOP model and multi-objective genetic algorithm, a solution with outstanding economic and ecological benefits was selected from many solution sets as the optimization scheme of land use structure in the SD scenario. In terms of land use structure, the overall layout is between the ED scenario and NC scenario by comprehensively considering the balance between economic and ecological benefits. Under the ED scenario, the construction land increased significantly, with a 1.44% growth compared with 2020. As the main body of economic benefit increases, this kind of land has significantly improved the regional economic situation. Cultivated land, forest, grassland, and water body account for the largest proportion in the NC scenario, and the preservation of ecological land is remarkable. In the SD scenario, compared with 2020, cultivated land, forest, grassland, and bare land decreased slightly by 0.42%, 0.59%, 0.04%, and 0.25%, respectively, while water body and construction land increased by 0.06% and 1.30%. Compared with the other three scenarios, the change range of various land use types in the SD scenario was smaller.
Table 6.
Simulation and dynamic change of land use structure around Poyang Lake area from 2005 to 2035 (hm2).
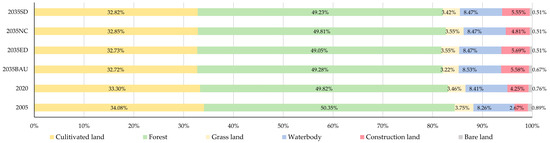
Figure 5.
Dynamic changes of area ratio of various land types around Poyang Lake area from 2005 to 2035.
3.1.3. Simulation and Dynamic Change of Land Use Pattern
Through the coupled MOP–PLUS model, the land use pattern around Poyang Lake area under different time series and the BAU and SD scenarios in 2035 is obtained (Figure 6). There is a large amount of forest in the periphery of the study area, a large area of water of Poyang Lake in its center, grassland mainly in the periphery of Poyang Lake, and a considerable area of cultivated land interspersed between the water and the forest. The construction land is primarily concentrated in the south-western part of Poyang Lake, situated within the metropolitan area of Nanchang and the prefectural-level cities and counties. During the period of 2005–2020, the construction land expanded in a large area (Figure 6a,b), encompassing the provincial capital of Nanchang’s Xinjian District in the center, Jiujiang’s Lianxi District in the north-west, Jingdezhen’s Changjiang District in the north-east, and Fuzhou’s Linchuan District in the south-east. The area of forest and grassland showed a slight decline in general, while the cultivated land showed a large-scale decline. On the other hand, the water area rose slightly, mainly transferred from the bare land (Figure 7a). It is predicted that during the period of 2020–2035, under the BAU scenario without planning control, the construction land will continue to expand outward with each prefecture-level city and county as the center, and the distribution of cultivated land, forest, and grassland will continue to decrease (Figure 6c). Under the SD scenario of the SDGs, the change range of each land type will slow down (Figure 6d), and the bare land will show a large-scale downward trend, mainly turning into cultivated land, forest, and water body (Figure 7c). During the 30-year period from 2005 to 2035, it is expected that under the SD scenario, the overall changes in various types of land use tend to level off, with the exception of the extensive expansion of construction land and the massive reduction of bare land, while the overall changes in cultivated land, forest, grassland, and water body are relatively small.
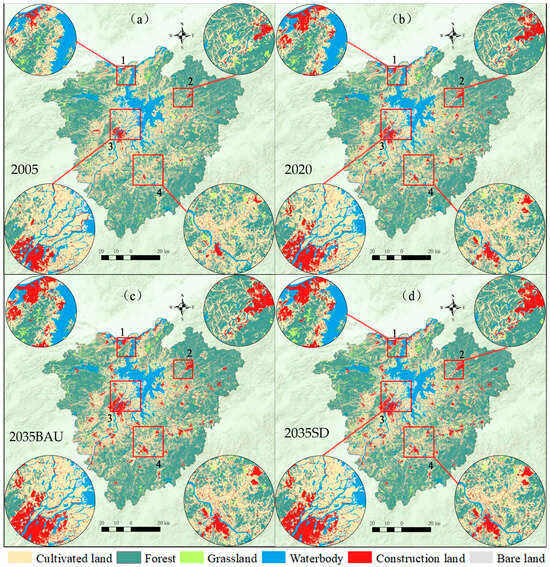
Figure 6.
Spatial distribution map of land use around Poyang Lake area from 2005 to 2035. (a) 2005; (b) 2020; (c) 2035 BAU; (d) 2035 SD.
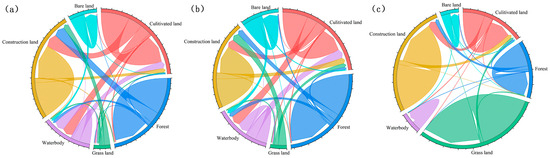
Figure 7.
The chord map of land use transfer around Poyang Lake area from 2005 to 2035. (a) 2005–2020; (b) 2020–2035 SD; (c) 2005–2035 SD.
3.2. Preliminary Construction of ENs
Based on the land use pattern of each period, ENs of the study area in different periods are preliminarily identified through the MSP model, InVEST model, and circuit theory (Figure 8). There is little difference in the distribution of ecological sources in different periods, which are mainly distributed in the Jing’an and Wuning counties in the northwest, duchang county, Poyang, and yugan county around Poyang Lake in the middle, Wuyuan and Fuliang counties in the northeast, and Zixi and Yihuang counties in the southeast. From 2005 to 2020, the number and space of ecological sources have not changed much, but the area has decreased. Compared with 2020, it is predicted that in 2035, the ecological source area in the BAU scenario will decrease obviously (Figure 8 region 2), while in the SD scenario, the ecological source area will remain basically unchanged. In 2035, there was not much spatial difference in the resistance values under the SD scenario, but under the BAU scenario, the resistance values in the northern region of Poyang Lake showed an obvious upward trend (Figure 8, region 1). The spatial distribution difference of ecological corridors between 2005 and 2020 is mainly in the north-eastern and eastern parts of the study area, and the length of ecological corridors has increased. In the BAU scenario, the ecological corridors become longer, while in the SD scenario, the quantitative structure and spatial distribution of ecological corridors are little different from those in 2020.
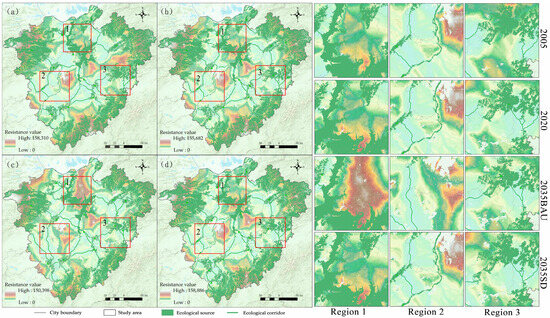
Figure 8.
The ENs around Poyang Lake area in 2005–2035. (a) 2005; (b) 2020; (c) 2035 BAU; (d) 2035 SD.
3.3. Topological Characteristics Analysis of ENs
Through the complex network analysis method, the centroid of ecological source is abstracted as points, and the ecological corridor is abstracted as edges to construct an undirected topological structure (Figure 9). Compared with the scenarios in 2005, 2020, and BAU, the eigencentrality in the SD scenario is significantly improved, which shows that the importance of adjacent ecological sources to ecological functions has been enhanced. Compared with the BAU scenario, the authority of the SD scenario is increased, which shows that each ecological source’s importance to the whole EN is enhanced. The average clustering coefficient and graph density in the SD scenario are the highest, while the average path length is the smallest, which shows that the clustering of nodes (ecological sources) is more obvious and more closely related. Compared with the BAU scenario, the eccentricity in the SD scenario is reduced, which shows that the efficiency of transmitting information from each node to each EN is improved. The number of triangles in the SD scenario is significantly higher than that in the past and BAU scenario, which shows that the radiation range of the EN is wider and more stable. The average degree increases with time, indicating that the number of nodes (sources) that are connected increases, indicating that compared with 2005, ecological sources’ importance in 2020 and in the future becomes more critical.

Figure 9.
Statistical indicators of ENs’ topology structure around Poyang Lake area from 2005 to 2035.
The structural information of the ecological source and corridor are input into Gephi in order to obtain the spatial topological structure diagram of ENs. This is achieved through the use of the Fruchterman Reingold layout, which determines the betweenness centrality of each node (Figure 10). The structure of the EN was the simplest in 2005, and the nodes were loosely connected with a more balanced spatial distribution. Node 4, which is the most important structural node, is closely connected to its surrounding nodes 6, 7, and 14, maintaining the stability of EN structure and function (Figure 10a). However, in 2020, the layout of the EN will become obviously crowded, with increased inter-network connectivity, especially between node 4 and its surrounding multiple nodes, and a more uneven distribution, indicating the phenomenon of ecological fragmentation to a certain extent (Figure 10b). Compared with the scenarios in 2005, 2020, and SD, the most important node in the BAU scenario changed from node 4 to node 6, indicating that the structures of the EN changed significantly and the stability of the EN weakened (Figure 10c). Compared with the BAU scenario, the clustering of each node in the SD scenario is more obvious and more evenly connected, and the centrality of all nodes apart from node 4 is significantly increased, indicating a more stable structure of the EN (Figure 10d).
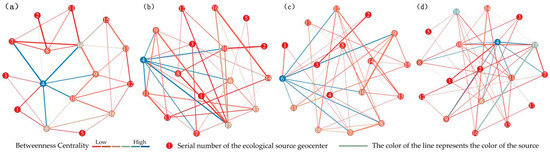
Figure 10.
Spatial topological structure diagram of ENs based on the Fruchterman Reingold layout. (a) 2005; (b) 2020; (c) 2035BAU; (d) 2035SD.
3.4. Optimization Results of the EN
3.4.1. Priority of Ecological Space Protection
The priorities of ecological sources and ecological corridors for each period were obtained based on the betweenness centrality of the complex network analysis and Linkage Mapper tool of circuit theory, respectively (Figure 11). It can be observed that the ecological source around Poyang Lake is of the utmost importance in any period and scenario. From 2005 to 2020, the spatial distribution differences of ecological sources were largely reflected in Wannian County and Ge Yang County of Shangrao City, with the priority of ecological sources slightly reduced, while the length and number of ecological corridors expanded (Figure 11a,b). In the BAU scenario, the priority of ecological sources was significantly reduced, particularly in the vicinity of Le’an County and Yihuang County in the southern region of the study area. However, the ecological corridors became longer and narrower, particularly in the vicinity of Zhangshu City and Gao’an City in the southwestern region, which increases the ecological risk to a certain extent (Figure 11c). In the SD scenario, the significance of ecological sources in Fuzhou, situated in the southeast, was considerably elevated. The number of ecological corridors was enhanced, although their length was diminished. Landscape connectivity was augmented, and the interconnection between ecological sources became more straightforward (Figure 11d).
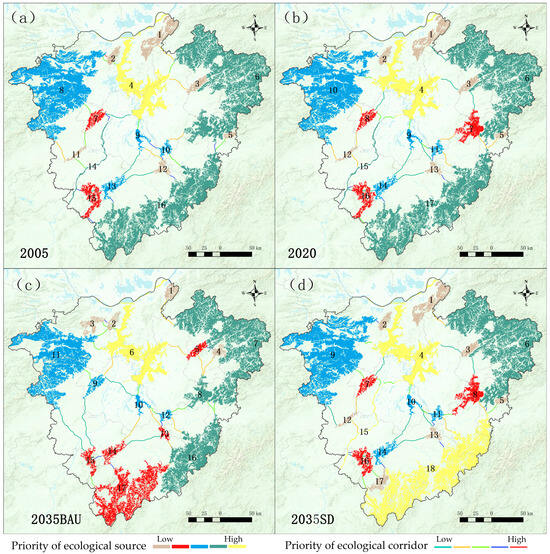
Figure 11.
Priority distribution map of ecological space protection around Poyang Lake area from 2005 to 2035. (Note: The specific ecological source serial numbers correspond to the serial numbers in Figure 10). (a) 2005; (b) 2020; (c) 2035BAU; (d) 2035SD.
3.4.2. Critical Areas for Ecological Restoration
In this section, we divided the study area into a grid of 5 km × 5 km, and identified the areas where the resistance value increases in both the BAU and SD scenarios. The ecological functions of these areas are expected to decrease greatly, which will also significantly affect the overall landscape connectivity. By overlaying the planned development boundaries of cities and counties with the areas where ecological functions are expected to decline, it is found that the development boundaries of cities and counties all fall within these areas, which fully proves that urban development and construction have ecological resistance and a negative impact on ecological functions and landscape connectivity (Figure 12a). These high-resistance areas, as ecologically weak areas, exert a more pronounced influence on the habitat and migration of species in the surrounding source areas. By identifying the high-resistance grid of 1 km around the ecological source areas, a total of about 7025 km2 of ecological obstacle restoration areas are identified. These areas are close to the urban space and distributed around the Poyang Lake wetland and forest system, causing the destruction of original ecological vegetation and aquatic habitats. It is recommended that the relevant departments leverage the city’s ecological resources and landscape pattern to facilitate connectivity between urban and rural spaces, integrate diverse city clusters within the city, incorporate ecological buffer zones such as parks and greenspaces, and prioritize the enhancement of the city’s greenway to align with the distinctive characteristics of the lakeshore area of Poyang Lake, Meiling Scenic Area, and other notable locations. The construction of a network of nature reserves, comprising national parks as the primary component, the establishment of additional artificial forests, and the implementation of ecological green corridors, and other strategies to facilitate the effective interconnection and coherence of diverse types of nature reserves are key measures to promote species migration, material circulation, and enhanced regional landscape connectivity.
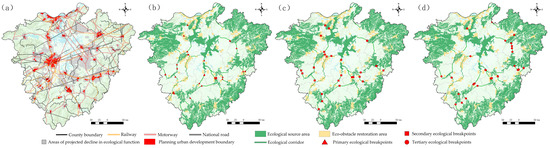
Figure 12.
Identification of critical areas of ecological restoration and optimization of the EN around Poyang Lake area. (a) Main ecological obstacle areas and passages; (b) Primary ecological breakpoints; (c) Secondary ecological breakpoints; (d) Tertiary ecological breakpoints.
The intersections of railways, expressways, national highways, and potential ecological corridors are identified. These ecological nodes are areas with relatively weak ecology but key ecological functions, and they play the role of stepping stones for the EN. According to the priority of ecological corridors, the first, second, and third ecological breakpoints are divided. A total of 41 primary ecological breakpoints, 31 secondary ecological breakpoints, and 36 tertiary ecological breakpoints were respectively identified (Figure 12b–d). The higher the level, the more important the ecological function is. These breakpoints are mainly distributed in the periphery of Poyang Lake, including Nanchang City and the areas bordering other prefecture-level cities. The road network density and traffic in these areas are developed, and some even cross major ecological nature reserves, which has caused great damage to the migration of species, habitat quality, and landscape connectivity around them.
By identifying the spatial positions and different protection levels of these ecological breakpoints, this can provide specific directions for the protection and restoration of the regional ecosystem. In light of the significant ecological fracture areas with a considerable impact at the highest level, it is imperative to reinforce the construction of the fundamental ecosystem network. This can be achieved by the establishment of underground corridors, cross-border tunnels, and ecological overpasses, which facilitate the unimpeded circulation of materials, energy, and information. It is recommended that the regional ecological network be optimized and that landscape connectivity be restored and maintained. This may be achieved by focusing on the construction of ecological buffer zones, such as urban countryside greens, and by undertaking supplementary restoration of bird migration corridors and inner- and outer-city point habitats. This is in order to better guide the rational distribution of ecology, production, and living space, and promote the stable and sustainable development of social ecology and economy.
4. Discussion
4.1. Land-Space Structure and Layout Optimization for Sustainable Development
By analyzing the LEAS based on the random forest algorithm [40], the main drivers of various land expansions are identified (Table 5 and Figure 4). For cultivated land, GDP and distance to county government have the greatest impact, but the contribution of each driving factor is not much different. One possible reason is that the influencing factors of cultivated land expansion are complex and diverse, and all the influencing factors are interrelated and influential [4,60]. For instance, terrain and climate are natural elements that have a direct impact on land suitability and agricultural productivity. Socioeconomic factors then have an impact on farmers’ inclination to plant and the amount of input they use. Similarly, changes in policies and institutions will indirectly affect natural and market factors by affecting farmers’ income expectations and resource allocation decisions. The interaction and joint action of these factors determine the trend and characteristics of cultivated land expansion [60]. Therefore, when formulating the policy of cultivated land utilization and protection, it is essential to comprehensively consider the impact of various factors in order to ensure that agricultural production develops in a sustainable way [10,21].
The core of land-space planning lies in adjusting and optimizing the structure and pattern of land use to support regional sustainable development strategies [12]. This paper achieved the SDG from the optimal balance between ecological and economic benefits, which found that when the weight distribution between economic development and ecological protection is roughly maintained at a ratio of 4:6, it can effectively promote the dual sustainability of ecology and economy (Table 6). It demonstrates that by moderately reducing the rate of economic development and accepting certain economic benefits, the ecological benefits may be greatly improved while guaranteeing that the overall benefits of land resources remain efficient and stable [17,18]. This finding not only reflects the positive trend that, as society’s awareness of ecological protection grows, the pressure of economic development on the natural environment gradually eases; however, it also warns us that excessive ecological protection measures may become shackles to economic development if they are not scientifically planned [9,10]. Therefore, exploring and establishing the golden balance between development and protection has become an indispensable and crucial core mission in regional land-space planning and management [18]. The conclusion of this study not only provides valuable reference and inspiration for the development of land use strategies around the Poyang Lake area, but also for the whole country and other great lake areas in the world. It emphasizes the possibility and necessity of achieving a win-win situation between economic development and ecological protection through scientific planning and rational management.
4.2. The Land-Space Ecological Security Pattern in Great Lake Areas
As a representative eco-economic zone [66,67], the sustainable development research of Poyang Lake is of great significance for the development and protection of related great lake areas. In the past fifteen years, local governments and natural-resources-related departments have implemented a multitude of protective measures for Poyang Lake basin. Green agricultural production bases based on wetland, forestry, and agricultural ecosystems, as well as garden construction, pollution prevention, construction of nature reserves, and other measures for the integrated management of land ecology in watersheds have been widely implemented. The comprehensive management of mountains, water, forests, fields, and grasses of Poyang Lake has achieved initial results. Therefore, although the past few decades have been the fastest time in China’s urbanization process, the current water area around Poyang Lake has increased by about 105 km2 instead of decreasing (Table 6). Of course, the reason for the increase in water area is not only its remarkable ecological value, but also its economic value. There are 33 spawning grounds for carp and crucian carp in Poyang Lake, with an average annual spawning capacity of nearly 4 billion, which brings a lot of fishery output value income. It is thus imperative to harmonize the interrelationship between the socioeconomic and ecological subsystems within great lake areas through the strategic organization of industrial activities. This approach will ensure the fulfillment of human needs for land, water resources, and other ecological services [70].
Although the water area of Poyang Lake has been protected to a certain extent, many studies have found that it is greatly affected by the surrounding environment, with poor pollutant deposition and water quality [68,69]. Compared with 2005, the overall spatial difference of ecological sources in 2020 is small, but the area has decreased slightly. To some extent, it also shows that the damage of the urbanization process to the ecological environment and landscape connectivity is inevitable. It is found that in the BAU scenario without planning intervention, it is expected that the area of ecological source will be greatly decreased and the ecological corridor will become long and narrow in 2035, which will hinder the landscape connectivity and increase the ecological risk to some extent (Figure 8). However, under the SD scenario of comprehensively weighing ecological and economic benefits, the quantitative structure and spatial distribution of ecological sources and ecological corridors remain largely unchanged from the existing status quo. Additionally, the clustering of ecological source areas is more pronounced, and the EN exhibits a broader radiating range and a more stable structure (Figure 9). In the context of simulation and planning control, the ecological network structure is observed to be more optimal under equivalent conditions. This conclusion serves to substantiate the necessity and urgency of promoting synergistic development between the ecological and economic spheres in accordance with the overarching SDG [36].
This study develops a land-space EN in great lake areas, which spans a large area and involves many counties and cities. In addition, the structure of the EN is intricate, underscoring the necessity for a strategic approach to ecological restoration and protection at the regional level. Therefore, prioritizing the protection and construction of habitats and ecological corridors of greater significance is essential for the long-term sustainability of the region’s ecological systems [38]. Based on the characteristics of the spatial topological structure of ENs, the spatial protection priority of ecological source is identified, and it is found that the ecological function of Poyang Lake is of the utmost priority and importance in any period (Figure 11). However, the study also found that there are large areas of high resistance around Poyang Lake area and important ecological sources, which significantly affected the landscape connectivity and habitat quality (Figure 8). Some artificial passages such as railways, highways, and national highways even cross nature reserves such as national forest parks, geological parks, and drinking water source protection sites in large numbers, which hinders ecological corridors and causes habitat fragmentation (Figure 12). This study identifies these potential ecological breakpoints according to the priority of ecological corridors and grades them for primary and secondary control. This provides the basis and support for relevant departments to carry out the land-space restoration, including the restoration project of the buffer zone along the shoreline of Poyang Lake, the project of linking up the urban and rural ecological corridors, and the project of the protection and restoration of the aquatic ecology of the Ganjiang River Basin.
4.3. Enlightenment and Deficiency of Research
Poyang Lake, as a representative great lake area in China and the “home of migratory birds” in the world, plays a pivotal role in integrated watershed management and regional ecological security patterns [71]. In the process of land-space development, utilization, and governance, one should seek the coordination between populations, resources, economy, and society. This coordination should be promoted in order to achieve the sustainable management goal of “ecology-economy-society”, which entails the sustainability of ecosystems, land use, ecological economy, and watershed management [66]. In view of this, relevant management departments must prioritize key ecological areas, systematically plan and implement ecological restoration measures such as mine ecological restoration, polluted water remediation, soil and water conservation construction, degraded land regeneration, and construction of city green space. The goal is to optimize the spatial allocation of the country, enhance the resilience of the EN, and comprehensively promote the restoration and comprehensive management of the “landscape, forest, field, lake and grass” life community. At the same time, according to the guiding spirit of the United Nations Millennium Ecosystem Assessment Report [79], the protection of natural heritage needs to gather the efforts of the government, business circles, and international organizations. In light of the necessity for the sustainable management of lake–basin systems, it is imperative to construct a multi-dimensional, comprehensive management system encompassing a multitude of facets, including but not limited to legal and regulatory frameworks, institutional structures, and decision-making processes, scientific and technological innovations, collaborative frameworks, fundraising strategies, and more. This approach will facilitate effective collaboration across disciplines and departments, as well as extensive social participation. In addition, it is urgent to establish the supervision and management mechanisms of ecological restoration projects. It is necessary to accelerate the construction of the ecological risk assessment and monitoring and early warning mechanism of Poyang Lake, regularly evaluate the ecological restoration effect, and build the ecological security bottom line of Poyang Lake with the ecological red line.
Previous studies have constructed ENs mostly under static conditions, with less consideration of the temporal and spatial differences caused by dynamic land use cover in different periods and different scenarios. This study employs an innovative approach to analyze and compare the similarities and differences in the quantitative structure and spatial layout of land use cover, ecological sources, ecological resistance surfaces, and ecological corridors under two scenarios: the BAU scenario, which does not include any planning interventions, and the SD scenario, which considers the economic and ecological benefits from the standpoint of SDGs. The study employs the latest landscape-driven patch-based CA model and multi-objective genetic algorithms to simulate and identify potential ecological security patterns under dynamic landscapes. Furthermore, it couples the differences in the spatial topology of ENs, identifies the key areas of ecological restoration from multiple perspectives, and optimizes the construction of the land-space EN. This reflects the scientific, systematic, and multi-objective nature of the research.
Despite the systematic, scientific, and rigorous empirical analysis in this study, certain limitations remain. For example, the core of the SDG is not only sustainable with the ecological economy, but also with social benefits and humans. However, this study did not consider these aspects due to the inherent challenges in quantifying the relevant indicators. In addition, the study employs a multitude of methodologies and models, particularly the CA model of landscape-driven patches, which is contingent upon parameter settings during the land use simulation. While this study has considered geographical characteristics to a significant extent, the methods and models under examination may be applicable only to the particular areas or, potentially, to great lake areas. Furthermore, the construction of an EN is a process including functional importance, landscape connectivity, system stability, and so on. This study focuses on the comparative analysis of the dynamic changes of ENs and the identification of key areas of ecological restoration. Therefore, in the future, we will consider the supplementation and improvement of the construction method of ENs, so as to promote the construction of regional ecological security patterns.
5. Conclusions
This study employs the MOP model, NSGA-II, PLUS model, MSPA, InVEST model, and circuit theory to innovatively simulate the optimization of land use structure and layout from the SDG, which provides a regional land use adjustment program that can be used as a reference. By analyzing land use change in multiple periods, this paper examines the construction of dynamic ENs across different periods. Furthermore, we analyze the differences and similarities in the topology structure of ENs by introducing complex network analysis. Ultimately, the ecological security pattern is optimized based on the identification of EN structures, spatial protection priority, ecological obstacle areas, and ecological nodes. This provides a reference for the implementation of land-space planning and ecological protection and restoration.
It is found that in order to achieve the SDG, the structure and weight of economic and environmental advantages must be properly allocated. It is predicted that during the period of 2005–2035, the construction land will continue to expand outward around the Greater Nanchang metropolitan area in the southwest of Poyang Lake and the central areas of prefecture-level cities and counties. In the BAU scenario, construction land expansion will increase while the distribution of cultivated land, forest, and grassland decreases. In the SD scenario, the growth rate of construction land will slow, but the overall change in other land types will be minimal. There is little difference in the spatial distribution of ecological networks in different periods. Based on the analysis of the topological structure of ENs, it is found that the importance of ecological sources to ecological functions is enhanced, the clustering of nodes is more obvious, the efficiency of information transmission is improved, and the radiation range is wider and more stable. The highest priority of ecological sources in three periods was distributed around Poyang Lake, and the priority of ecological sources was improved in the SD scenario. Based on the spatial protection priority, high-resistance area, and road traffic network, the eco-obstacle restoration area was 7025 km2, and there were 41, 31, and 36 ecological breakpoints in the first, second, and third levels.
Author Contributions
Conceptualization, Z.L. and X.Y.; methodology, X.Y.; software, X.Y.; validation, Z.L., X.Y. and S.L.; formal analysis, X.Y.; investigation, X.Y. and S.L.; resources, Z.L.; data curation, Z.L. and X.Y.; writing—original draft preparation, Z.L. and X.Y.; writing—review and editing, Z.L. and X.Y.; visualization, X.Y.; supervision, Z.L.; funding acquisition, Z.L. All authors have read and agreed to the published version of the manuscript.
Funding
This research was supported by the Humanities and Social Sciences Research Planning Foundation of the Ministry of Education of China “Research on Spatial Coupling and Optimization Control of Urban Land Expansion and Ecological Network Protection Based on Game theory” (Grant No. 19YJAZH061), and by the National Natural Science Foundation of China “Research on Spatio-temporal Coupling and Optimization Control of Urban Expansion and Ecological Network Protection Based on Game theory” (Grant No. 41961042), and by the Humanities and Social Sciences Research Project in Universities of Jiangxi Province (Grant No. GL21140).
Institutional Review Board Statement
Not applicable.
Informed Consent Statement
Not applicable.
Data Availability Statement
Please contact the correspondent for details of the data.
Conflicts of Interest
The authors declare no conflicts of interest.
References
- Wu, J.; Jenerette, G.D.; Buyantuyev, A.; Redman, C.L. Quantifying spatiotemporal patterns of urbanization: The case of the two fastest growing metropolitan regions in the United States. Ecol. Complex. 2011, 8, 1–8. [Google Scholar] [CrossRef]
- Tan, Y.; Xu, H.; Zhang, X. Sustainable urbanization in China: A comprehensive literature review. Cities 2016, 55, 82–93. [Google Scholar] [CrossRef]
- Simkin, R.D.; Seto, K.C.; McDonald, R.I.; Jetz, W. Biodiversity impacts and conservation implications of urban land expansion projected to 2050. Proc. Natl. Acad. Sci. USA 2022, 119, e2117297119. [Google Scholar] [CrossRef] [PubMed]
- Meimei, W.; Zizhen, J.; Tengbiao, L.; Yongchun, Y.; Zhuo, J. Analysis on absolute conflict and relative conflict of land use in Xining metropolitan area under different scenarios in 2030 by PLUS and PFCI. Cities 2023, 137, 104314. [Google Scholar] [CrossRef]
- Yang, Y.; Liu, Y.; Li, Y.; Du, G. Quantifying spatio-temporal patterns of urban expansion in Beijing during 1985–2013 with rural-urban development transformation. Land Use Policy 2018, 74, 220–230. [Google Scholar] [CrossRef]
- Fletcher Jr, R.J.; Didham, R.K.; Banks-Leite, C.; Barlow, J.; Ewers, R.M.; Rosindell, J.; Holt, R.D.; Gonzalez, A.; Pardini, R.; Damschen, E.I. Is habitat fragmentation good for biodiversity? Biol. Conserv. 2018, 226, 9–15. [Google Scholar] [CrossRef]
- Haddad, N.M.; Brudvig, L.A.; Clobert, J.; Davies, K.F.; Gonzalez, A.; Holt, R.D.; Lovejoy, T.E.; Sexton, J.O.; Austin, M.P.; Collins, C.D. Habitat fragmentation and its lasting impact on Earth’s ecosystems. Sci. Adv. 2015, 1, e1500052. [Google Scholar] [CrossRef]
- Long, X.; Yu, H.; Sun, M.; Wang, X.; Klemeš, J.J.; Xie, W.; Wang, C.; Li, W.; Wang, Y. Sustainability evaluation based on the Three-dimensional Ecological Footprint and Human Development Index: A case study on the four island regions in China. J. Environ. Manag. 2020, 265, 110509. [Google Scholar] [CrossRef]
- Ullah, A.; Ahmed, M.; Raza, S.A.; Ali, S. A threshold approach to sustainable development: Nonlinear relationship between renewable energy consumption, natural resource rent, and ecological footprint. J. Environ. Manag. 2021, 295, 113073. [Google Scholar] [CrossRef]
- Ruggerio, C.A. Sustainability and sustainable development: A review of principles and definitions. Sci. Total Environ. 2021, 786, 147481. [Google Scholar] [CrossRef]
- Wang, J.; Liu, J.; Zhai, T.; Li, Z. Geographical Cognition of Transitional Zone of Pan-Hu Huanyong Line and Construction of Land Development, Utilization and Preservation Strategies. Econ. Geogr. 2022, 42, 22–32. [Google Scholar]
- Fan, J.; Zhou, K.; Chen, D. Innovation and Practice of Economie Geography for Optimizing Spatial Development Pattern in Construction of Eeological Civilization. Econ. Geogr. 2013, 33, 1–8. [Google Scholar]
- Meng, P.; Wang, Q.; Lang, H.; Jiang, R. Analysis of the Challenges and Reform Orientation of Territorial Spatial Planning System in China Under the Background of Spatial Governance System Modernization: Reviews from the Serial Research of Territorial Spatial Governance. Chin. Land. Sci. 2019, 33, 8–14. [Google Scholar]
- Fang, C.; Bao, C.; Huang, J.; Li, G. Contribution, Responsibility and Mission of Geographyon China’s Urbanization Development. Scientia Geogr. Sin. 2018, 38, 321–331. [Google Scholar]
- Zheng, T.; Chen, S.; Zhang, T.; Xu, L.T.; Ma, L.Y. Research on driving mechanism of ecological land lossbased on Bayesian network. J. Nat. Resour. 2020, 35, 2980–2994. [Google Scholar]
- Zhou, L.; Tang, J.; Liu, X.; Dang, X.; Mu, H. Effects of urban expansion on habitat quality in densely populated areas on the Loess Plateau: A case study of Lanzhou, Xi’an-Xianyang and Taiyuan, China. Chin. J. Appl. Ecol. 2021, 32, 261–270. [Google Scholar]
- Dang, X.; Zhou, L.; Hu, F.; Yuan, B.; Tang, J. The multi-seale direct and indirect effects of urban expansion of Guanzhong Plain Urban Agglomeration on ecological land. Acta Ecol. Sin. 2022, 42, 3020–3032. [Google Scholar]
- Zhu, C.; Yuan, C.; Yang, L. Spatial optimization ofland use pattern and trade-off analysis inHangzhou City by coupling MOP and FLUS model. Trans. Chin. Soc. Agric. Eng. 2023, 39, 235–244. [Google Scholar]
- Tian, F.; Li, M.; Han, X.; Liu, H.; Mo, B. A production–living–ecological space model for land-use optimisation: A case study of the core Tumen River region in China. Ecol. Model. 2020, 437, 109310. [Google Scholar] [CrossRef]
- Inceyol, Y.; Cay, T. Comparison of traditional method and genetic algorithm optimization in the land reallocation stage of land consolidation. Land Use Policy 2022, 115, 105989. [Google Scholar] [CrossRef]
- Fang, C.; Jia, K.; Li, G.; Wang, Y. Theoretical analysis of the index system and calculation model of carrying capacity of land ecological-production-living spaces from county scale. Acta Ecol. Sin. 2017, 37, 5198–5209. [Google Scholar]
- Liu, X.; Shu, J.; Zhang, L. Research on applying minimal cumulative resistance model in urban land ecological suitability assessment: As an example of Xiamen City. Acta Ecol. Sin. 2010, 30, 421–428. [Google Scholar]
- Wang, L.; Xia, M.; Zhou, W. Ecological conservation and restoration zoning of county-level agricultural spatial ecology coupled with ecological service supply and demand: A case study of Yixing. J. Nat. Resour. 2024, 39, 858–877. [Google Scholar] [CrossRef]
- Li, J.; Yang, D.; Yang, F.; Zhang, Y.; Wang, H. Influence of landscape pattern on ecosystem service supply-demand mismatch in Tianjin within the context of urbanization. Acta Ecol. Sin. 2024, 44, 4987–5002. [Google Scholar]
- Chang, Y.; Ko, T. An interactive dynamic multi-objective programming model to support better land use planning. Land Use Policy 2014, 36, 13–22. [Google Scholar] [CrossRef]
- Guo, P.; Wang, H.; Qin, F.; Miao, C.; Zhang, F. Coupled MOP and PLUS-SA model research on land use scenario simulations in zhengzhou metropolitan area, Central China. Remote Sens. 2023, 15, 3762. [Google Scholar] [CrossRef]
- Liang, C.; Zhang, R.; Zeng, J. Optimizing ecological and economic benefits in areas with complex land-use evolution based on spatial subdivisions. Landsc. Urban Plan. 2023, 236, 104782. [Google Scholar] [CrossRef]
- Shi, Q.; Gu, C.; Xiao, C. Multiple scenarios analysis on land use simulation by coupling socioeconomic and ecological sustainability in Shanghai, China. Sustain. Cities Soc. 2023, 95, 104578. [Google Scholar] [CrossRef]
- Song, G.; Wang, Y.; Liu, X. Optimization Model of Land Use Pattern in High Altitude Area of Songnen Plain. Econ. Geogr. 2019, 39, 191–197. [Google Scholar]
- Jiang, X.; Li, B.; Zhao, H.; Zhang, Q.; Song, X.; Zhang, H. Examining the spatial simulation and land-use reorganisation mechanism of agricultural suburban settlements using a cellular-automata and agent-based model: Six settlements in China. Land Use Policy 2022, 120, 106304. [Google Scholar] [CrossRef]
- Li, Y.; Cai, Y.; Fu, Q.; Zhang, X.; Wan, H.; Yang, Z. Dynamics of Land Use/Land Cover Considering Ecosystem Services for a Dense-Population Watershed Based on a Hybrid Dual-Subject Agent and Cellular Automaton Modeling Approach. Engineering 2024, 37, 182–195. [Google Scholar] [CrossRef]
- Jing, P.; Zhang, D.; Ai, Z.; Guo, B. Natural landscape ecological risk assessment based on the three-dimensiona framework of pattern-process ecological adaptability cycle: A case in Loess Plateau. Acta Ecol. Sin. 2021, 41, 7026–7036. [Google Scholar]
- Liu, Y.; Peng, J.; Sun, M.; Yang, Y. Delimitation of urban growth boundary based on ecological suitability and risk control: A case of Taibai Lake New District in Jining City, Shandong, China. Chin. J. Appl. Ecol. 2016, 27, 2605–2613. [Google Scholar]
- Oléron-Evans, T.P.; Salhab, M. Optimal land use allocation for the Heathrow opportunity area using multi-objective linear programming. Land Use Policy 2021, 105, 105353. [Google Scholar] [CrossRef]
- Rahman, M.M.; Szabó, G. Multi-objective urban land use optimization using spatial data: A systematic review. Sustain. Cities Soc. 2021, 74, 103214. [Google Scholar] [CrossRef]
- Wang, Z.; Gao, Y.; Wang, X.; Lin, Q.; Li, L. A new approach to land use optimization and simulation considering urban development sustainability: A case study of Bortala, China. Sustain. Cities Soc. 2022, 87, 104135. [Google Scholar] [CrossRef]
- Cai, G.; Xiong, J.; Wen, L.; Weng, A.; Lin, Y.; Li, B. Predicting the ecosystem service values and constructing ecological security patterns in future changing land use patterns. Ecol. Indic. 2023, 154, 110787. [Google Scholar] [CrossRef]
- Gao, J.; Gong, J.; Li, Y.; Yang, J.; Liang, X. Ecological network assessment in dynamic landscapes: Multi-scenario simulation and conservation priority analysis. Land Use Policy 2024, 139, 107059. [Google Scholar] [CrossRef]
- Yu, Z.; Gao, Y.; Wang, T.; Zhao, Z.; Wang, S. Spatio-temporal Evolution and Prediction of Carbon Storage in Huaibei City Based on InVEST-PLUS Model. Huan Jing Ke Xue 2024, 45, 3270–3283. [Google Scholar]
- Liang, X.; Guan, Q.; Clarke, K.C.; Liu, S.; Wang, B.; Yao, Y. Understanding the drivers of sustainable land expansion using a patch-generating land use simulation (PLUS) model: A case study in Wuhan, China. Comput. Environ. Urban Syst. 2021, 85, 101569. [Google Scholar] [CrossRef]
- Chen, M.; Liang, L.; Wang, Z.; Zhang, W.; Yu, J.; Liang, Y. Geographical thoughts on the relationship between ‘Beautiful China’and land spatial planning. J. Geogr. Sci. 2020, 30, 705–723. [Google Scholar] [CrossRef]
- Montoya, J.M.; Pimm, S.L.; Solé, R.V. Ecological networks and their fragility. Nature 2006, 442, 259–264. [Google Scholar] [CrossRef]
- Fath, B.D.; Scharler, U.M.; Ulanowicz, R.E.; Hannon, B. Ecological network analysis: Network construction. Ecol. Model. 2007, 208, 49–55. [Google Scholar] [CrossRef]
- Cao, J.; Li, T. Analysis of spatiotemporal changes in cultural heritage protected cities and their influencing factors: Evidence from China. Ecol. Indic. 2023, 151, 110327. [Google Scholar] [CrossRef]
- Cui, L.; Wang, J.; Sun, L.; Lv, C. Construction and optimization of green space ecological networks in urban fringe areas: A case study with the urban fringe area of Tongzhou district in Beijing. J. Clean. Prod. 2020, 276, 124266. [Google Scholar] [CrossRef]
- An, Y.; Liu, S.; Sun, Y.; Shi, F.; Beazley, R. Construction and optimization of an ecological network based on morphological spatial pattern analysis and circuit theory. Landsc. Ecol. 2021, 36, 2059–2076. [Google Scholar] [CrossRef]
- Yang, X.; Luo, Z. Construction of Territorial Spatial Ecological NetworkOriented to Residents’ Ecological Well-being: Take Nanchang City as an Example. Acta Agric. Univ. Jiangxiensis 2023, 45, 1297–1310. [Google Scholar]
- Hu, C.; Wang, Z.; Wang, Y.; Sun, D.; Zhang, J. Combining MSPA-MCR model to evaluate the ecological network in Wuhan, China. Land 2022, 11, 213. [Google Scholar] [CrossRef]
- Wei, Q.; Halike, A.; Yao, K.; Chen, L.; Balati, M. Construction and optimization of ecological security pattern in Ebinur Lake Basin based on MSPA-MCR models. Ecol. Indic. 2022, 138, 108857. [Google Scholar] [CrossRef]
- Guan, D.; Jiang, Y.; Cheng, L. How can the landscape ecological security pattern be quantitatively optimized and effectively evaluated? An integrated analysis with the granularity inverse method and landscape indicators. Environ. Sci. Pollut. R 2022, 29, 41590–41616. [Google Scholar] [CrossRef]
- Qian, M.; Huang, Y.; Cao, Y.; Wu, J.; Xiong, Y. Ecological network construction and optimization in Guangzhou from the perspective of biodiversity conservation. J. Environ. Manag. 2023, 336, 117692. [Google Scholar] [CrossRef] [PubMed]
- Chen, H.; Yan, W.; Li, Z.; Wende, W.; Xiao, S. A framework for integrating ecosystem service provision and connectivity in ecological spatial networks: A case study of the Shanghai metropolitan area. Sustain. Cities Soc. 2024, 100, 105018. [Google Scholar] [CrossRef]
- Nematollahi, S.; Fakheran, S.; Kienast, F.; Jafari, A. Application of InVEST habitat quality module in spatially vulnerability assessment of natural habitats (case study: Chaharmahal and Bakhtiari province, Iran). Environ. Monit. Assess. 2020, 192, 487. [Google Scholar] [CrossRef] [PubMed]
- Su, X.; Zhou, Y.; Li, Q. Designing ecological security patterns based on the framework of ecological quality and ecological sensitivity: A case study of Jianghan Plain, China. Int. J. Env. Res. Public Health 2021, 18, 8383. [Google Scholar] [CrossRef] [PubMed]
- Shen, Z.; Yin, H.; Kong, F.; Wu, W.; Sun, H.; Su, J.; Tian, S. Enhancing ecological network establishment with explicit species information and spatially coordinated optimization for supporting urban landscape planning and management. Landsc. Urban Plan. 2024, 248, 105079. [Google Scholar] [CrossRef]
- Li, Q.; Zhou, Y.; Yi, S. An integrated approach to constructing ecological security patterns and identifying ecological restoration and protection areas: A case study of Jingmen, China. Ecol. Indic. 2022, 137, 108723. [Google Scholar] [CrossRef]
- Cai, A.; Wang, J.; MacLachlan, I.; Zhu, L. Modeling the trade-offs between urban development and ecological process based on landscape multi-functionality and regional ecological networks. J. Environ. Plan. Manag. 2020, 63, 2357–2379. [Google Scholar] [CrossRef]
- Wang, T.; Li, H.; Huang, Y. The complex ecological network’s resilience of the Wuhan metropolitan area. Ecol. Indic. 2021, 130, 108101. [Google Scholar] [CrossRef]
- Huang, L.; Wang, J.; Fang, Y.; Zhai, T.; Cheng, H. An integrated approach towards spatial identification of restored and conserved priority areas of ecological network for implementation planning in metropolitan region. Sustain. Cities Soc. 2021, 69, 102865. [Google Scholar] [CrossRef]
- Gao, X.; Shen, J.; He, W.; Sun, F.; Zhang, Z.; Guo, W.; Zhang, X.; Kong, Y. An evolutionary game analysis of governments’ decision-making behaviors and factors influencing watershed ecological compensation in China. J. Environ. Manag. 2019, 251, 109592. [Google Scholar] [CrossRef]
- Zhao, Y.; He, L.; Bai, W.; He, Z.; Luo, F.; Wang, Z. Prediction of ecological security patterns based on urban expansion: A case study of Chengdu. Ecol. Indic. 2024, 158, 111467. [Google Scholar] [CrossRef]
- Li, C.; Huang, L.; Xu, Q.; Cao, Z. Synergistic ecological network approach for sustainable development of highly urbanized area in the Bay Bottom region: A study in Chengyang District, Qingdao. Ecol. Indic. 2024, 158, 111443. [Google Scholar] [CrossRef]
- Long, H.; Qu, Y.; Tu, S.; Zhang, Y.; Jiang, Y. Development of land use transitions research in China. J. Geogr. Sci. 2020, 30, 1195–1214. [Google Scholar] [CrossRef]
- Wang, J.; Bretz, M.; Dewan, M.A.A.; Delavar, M.A. Machine learning in modelling land-use and land cover-change (LULCC): Current status, challenges and prospects. Sci. Total Environ. 2022, 822, 153559. [Google Scholar] [CrossRef] [PubMed]
- Huang, K.; Peng, L.; Wang, X.; Deng, W.; Liu, Y. Incorporating circuit theory, complex networks, and carbon offsets into the multi-objective optimization of ecological networks: A case study on karst regions in China. J. Clean. Prod. 2023, 383, 135512. [Google Scholar] [CrossRef]
- Cai, H.; Zhang, X.; Huang, H. The Theories and Methods of Lake watershed Land Ecological Management. J. Nat. Resour. 2010, 25, 1049–1058. [Google Scholar]
- Ran, F.; Luo, Z.; Wu, J.; Qi, S.; Cao, L.; Cai, Z.; Chen, Y. Spatiotemporal patterns of the trade-off and synergy relationship among ecosystem services in Poyang Lake Region, China. Chin. J. Appl. Ecol. 2019, 30, 995–1004. [Google Scholar]
- Zhai, C.; Wang, S. Spatio-temporal difference evolution and scenario simulation of multi-dimensional well-being in Poyang Lake area based on system dynamics. Acta Ecol. Sin. 2021, 41, 2954–2967. [Google Scholar]
- Wei, G.; Liu, Y.; Li, R.; Li, S.; Luo, K.; Liu, C. Pattern transformation and spatial heterogeneity mechanism of production-living ecological spaces in Poyang Lake area in last 40 years. Acta Ecol. Sin. 2024, 44, 2308–2322. [Google Scholar]
- Liu, Y.; Wang, X.; Liu, L. The Spatial Distribution Model ofUrban Economic Potential Zonesand Its Application Based on the Hypothesis of “Lake Effect” The Area Around Poyang Lake as a Case. Scientia Geogr. Sin. 2012, 32, 680–685. [Google Scholar]
- Qi, S.; Zhang, Q.; Jiang, F.; Liao, F. Study on the Effects on the Landscape Spatial Pattern of the Wintering Birds’Habitat from Lake Level in Poyang Lake Wetland. J. Nat. Resour. 2014, 29, 1345–1355. [Google Scholar]
- Chen, J.; Gao, M.; Cheng, S.; Hou, W.; Song, M.; Liu, X.; Liu, Y. Global 1 km × 1 km gridded revised real gross domestic product and electricity consumption during 1992–2019 based on calibrated nighttime light data. Sci. Data 2022, 9, 202. [Google Scholar] [CrossRef] [PubMed]
- Luo, Z.; Yang, X. Interrelationships between Urbanization and Ecosystem Services in the Urban Agglomeration around Poyang Lake and Its Zoning Management at an Integrated Multi-Scale. Sustainability 2024, 16, 5128. [Google Scholar] [CrossRef]
- Xie, G.; Zhang, C.; Zhang, L.; Chen, W.; Li, S. Improvement of the Evaluation Method for Ecosystem Service Value Based on Per Unit Area. J. Nat. Resour. 2015, 30, 1243–1254. [Google Scholar]
- Lin, J.; Zhang, W.; Wen, Y.; Qiu, S. Evaluating the association between morphological characteristics of urban land and pluvial floods using machine learning methods. Sustain. Cities Soc. 2023, 99, 104891. [Google Scholar] [CrossRef]
- Xiong, S.; Yang, F.; Zhang, J.; Tang, Y. An integrated model chain for diagnosing and predicting conflicts between production-living-ecological space in lake network regions: A case of the Dongting Lake region, China. Ecol. Indic. 2024, 166, 112237. [Google Scholar] [CrossRef]
- Liu, S.; Wen, M.; Cui, B.; Dong, S. Effects of road networks on reqional ecosystems in Southwest mountain area: A case study in Jinhong of Lonqitudinal Range-Gorge Region. Acta Ecol. Sin. 2006, 26, 3018–3024. [Google Scholar]
- Shi, F.; Liu, S.; An, Y.; Sun, Y. Biodiversity conservation of mountains-rivers-forests-farmlands-lakes-grasslands using an ecological network: A case study on the Zuoyoujiang river basin in Guangxi Province, China. Acta Ecol. Sin. 2019, 39, 8930–8938. [Google Scholar]
- Millennium Ecosystem Assessment. Ecosystems; Cranfield University: Bedford, UK, 2003. [Google Scholar]
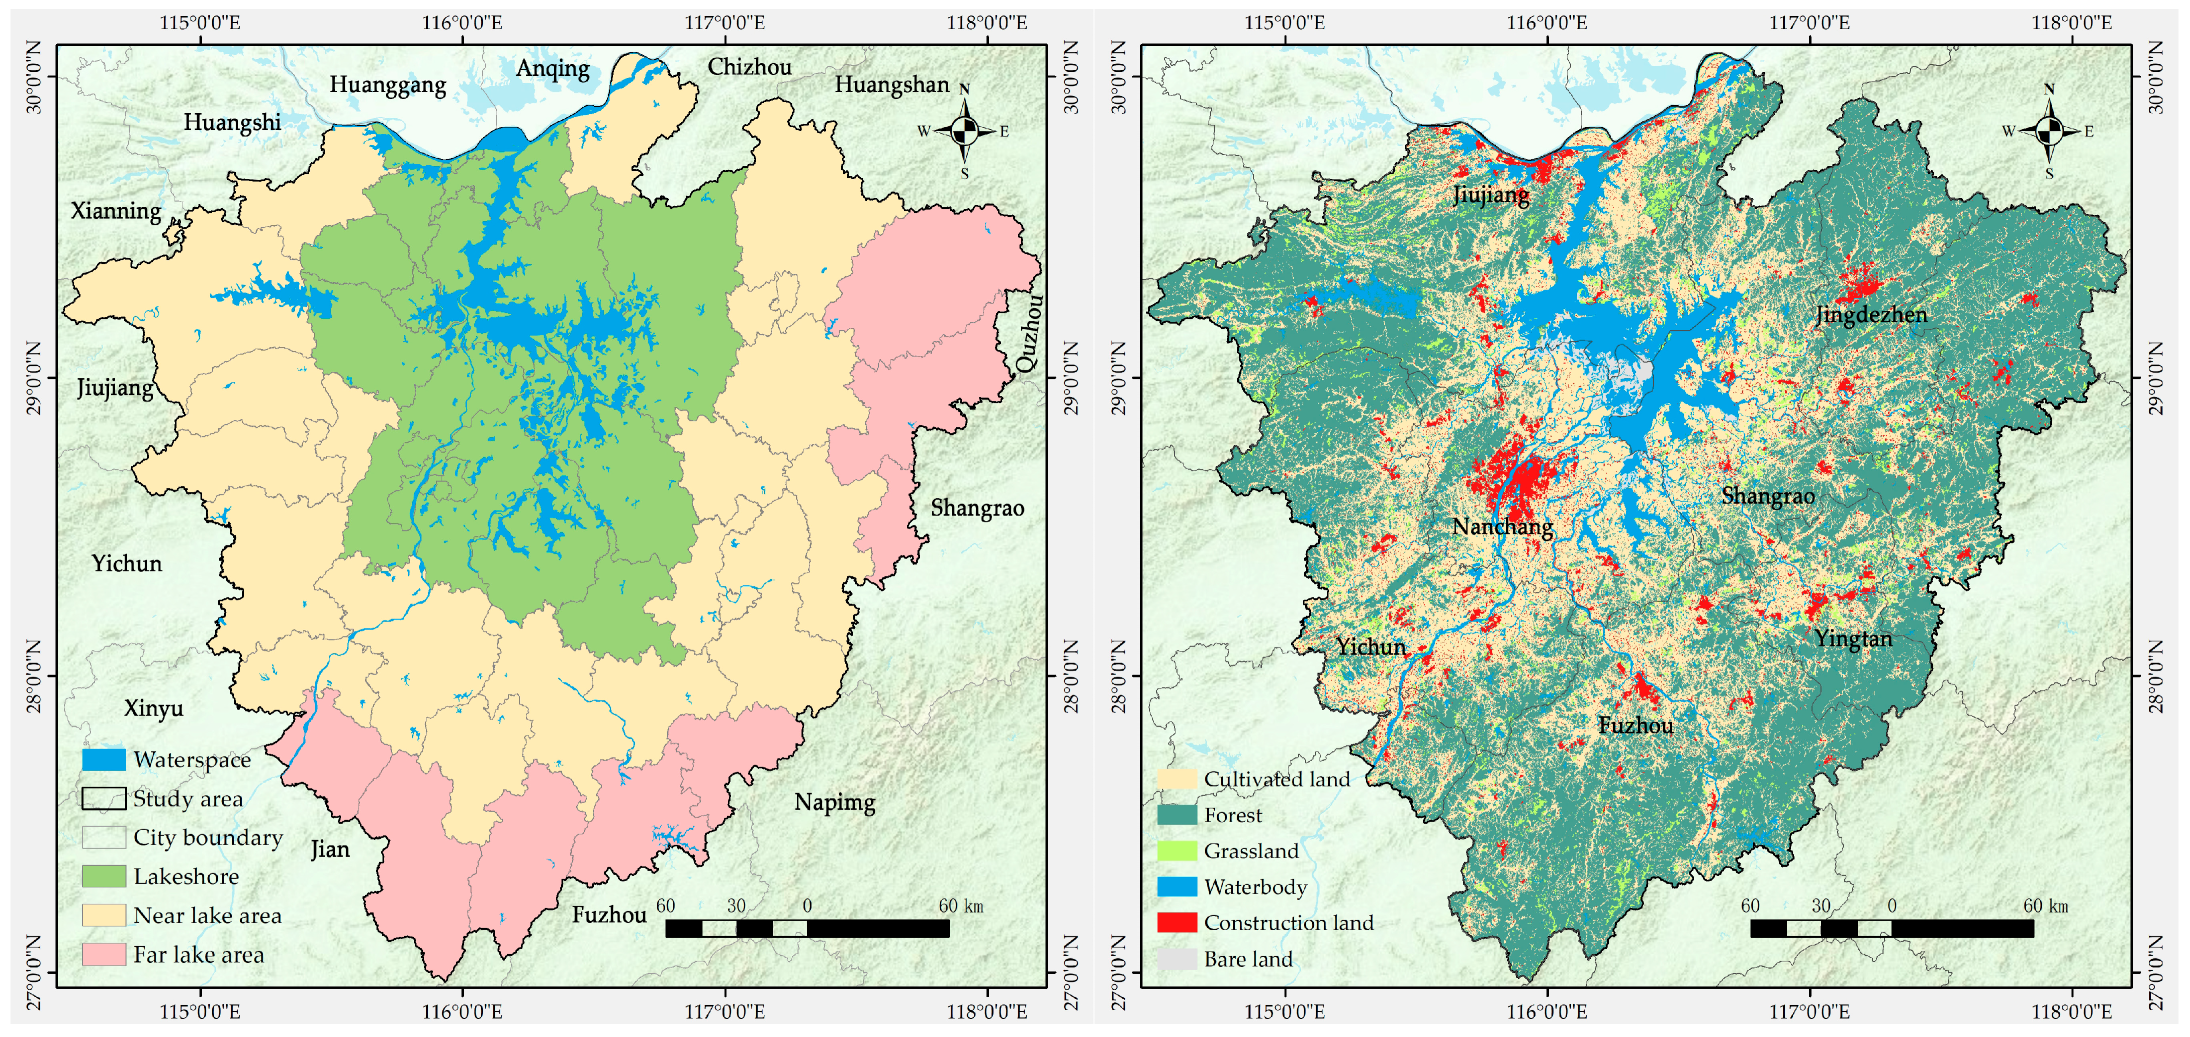
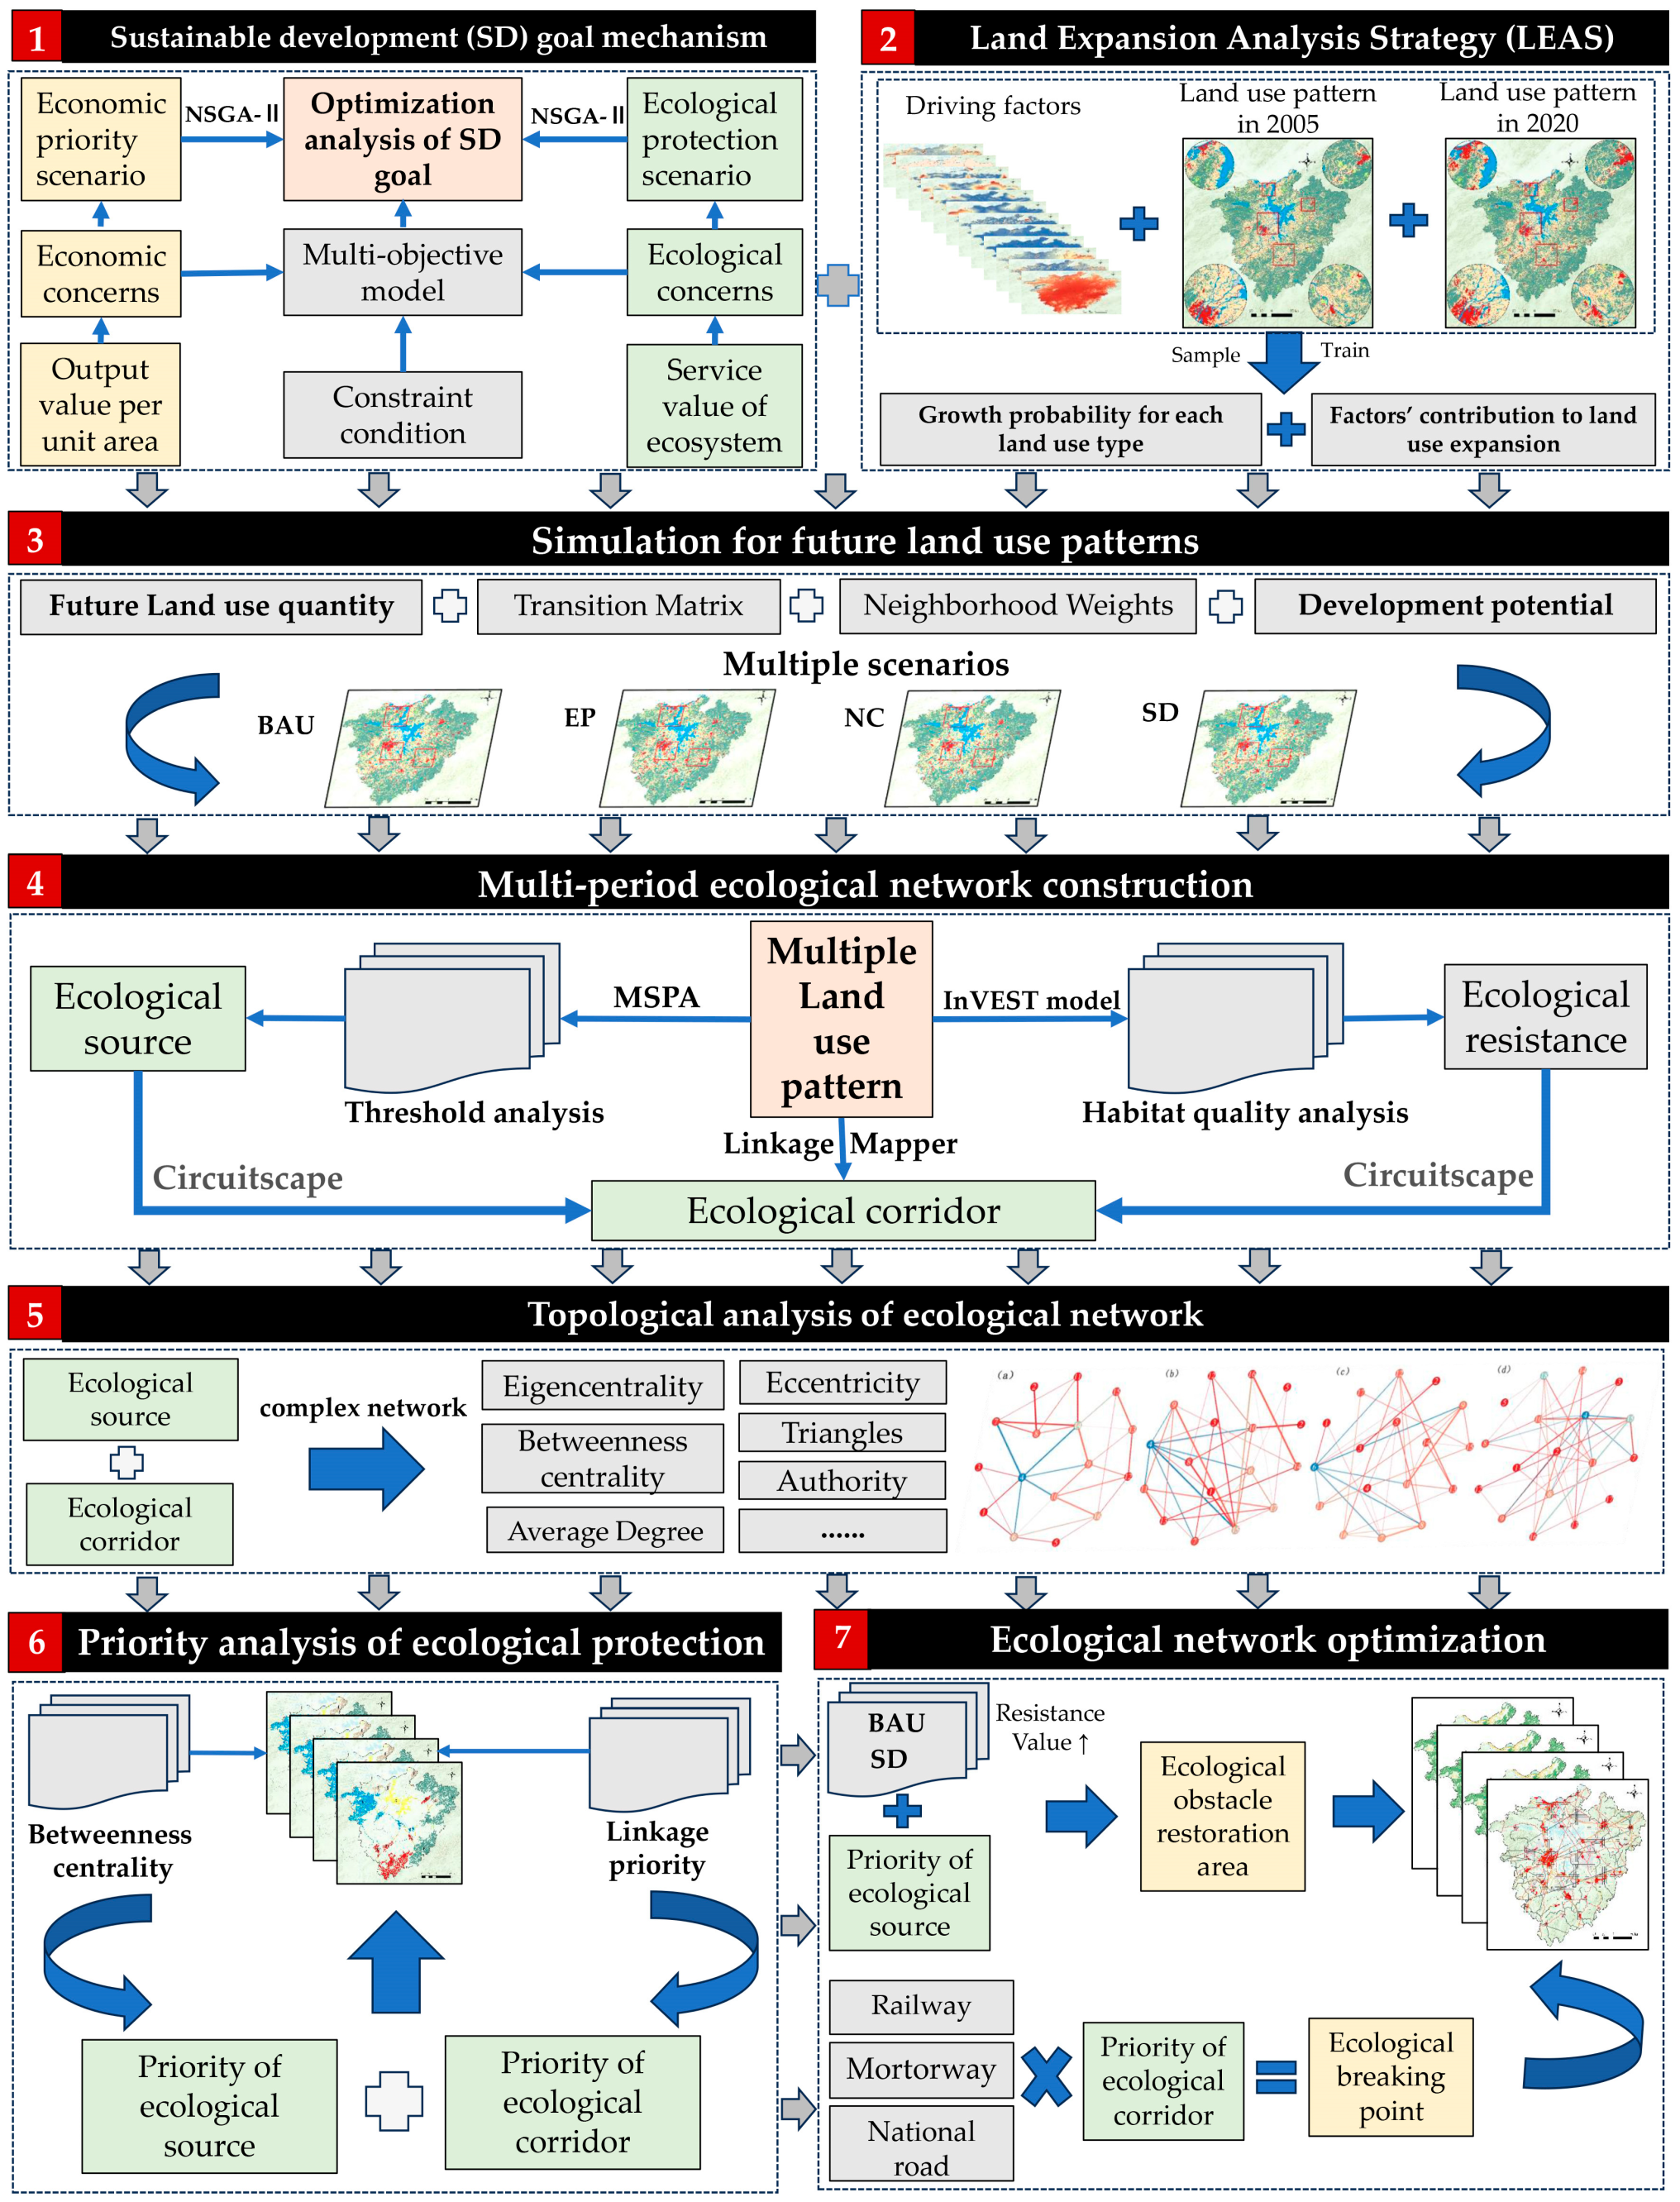
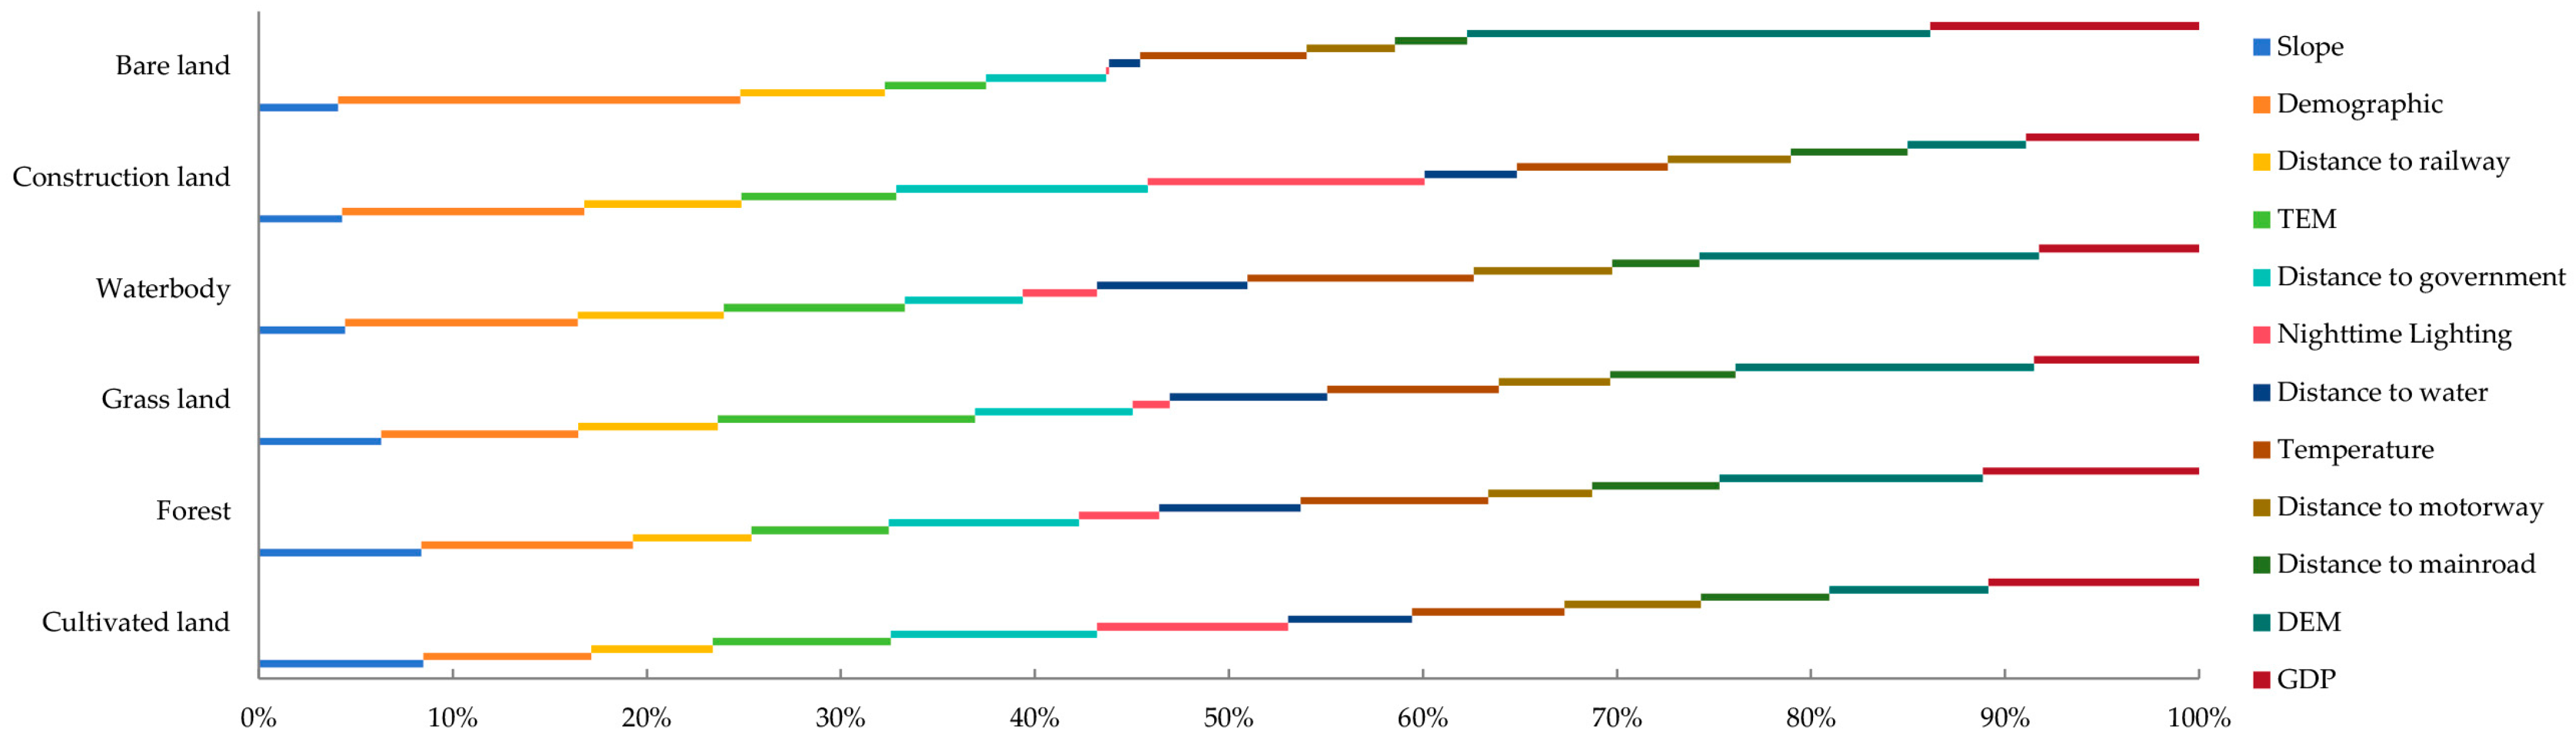
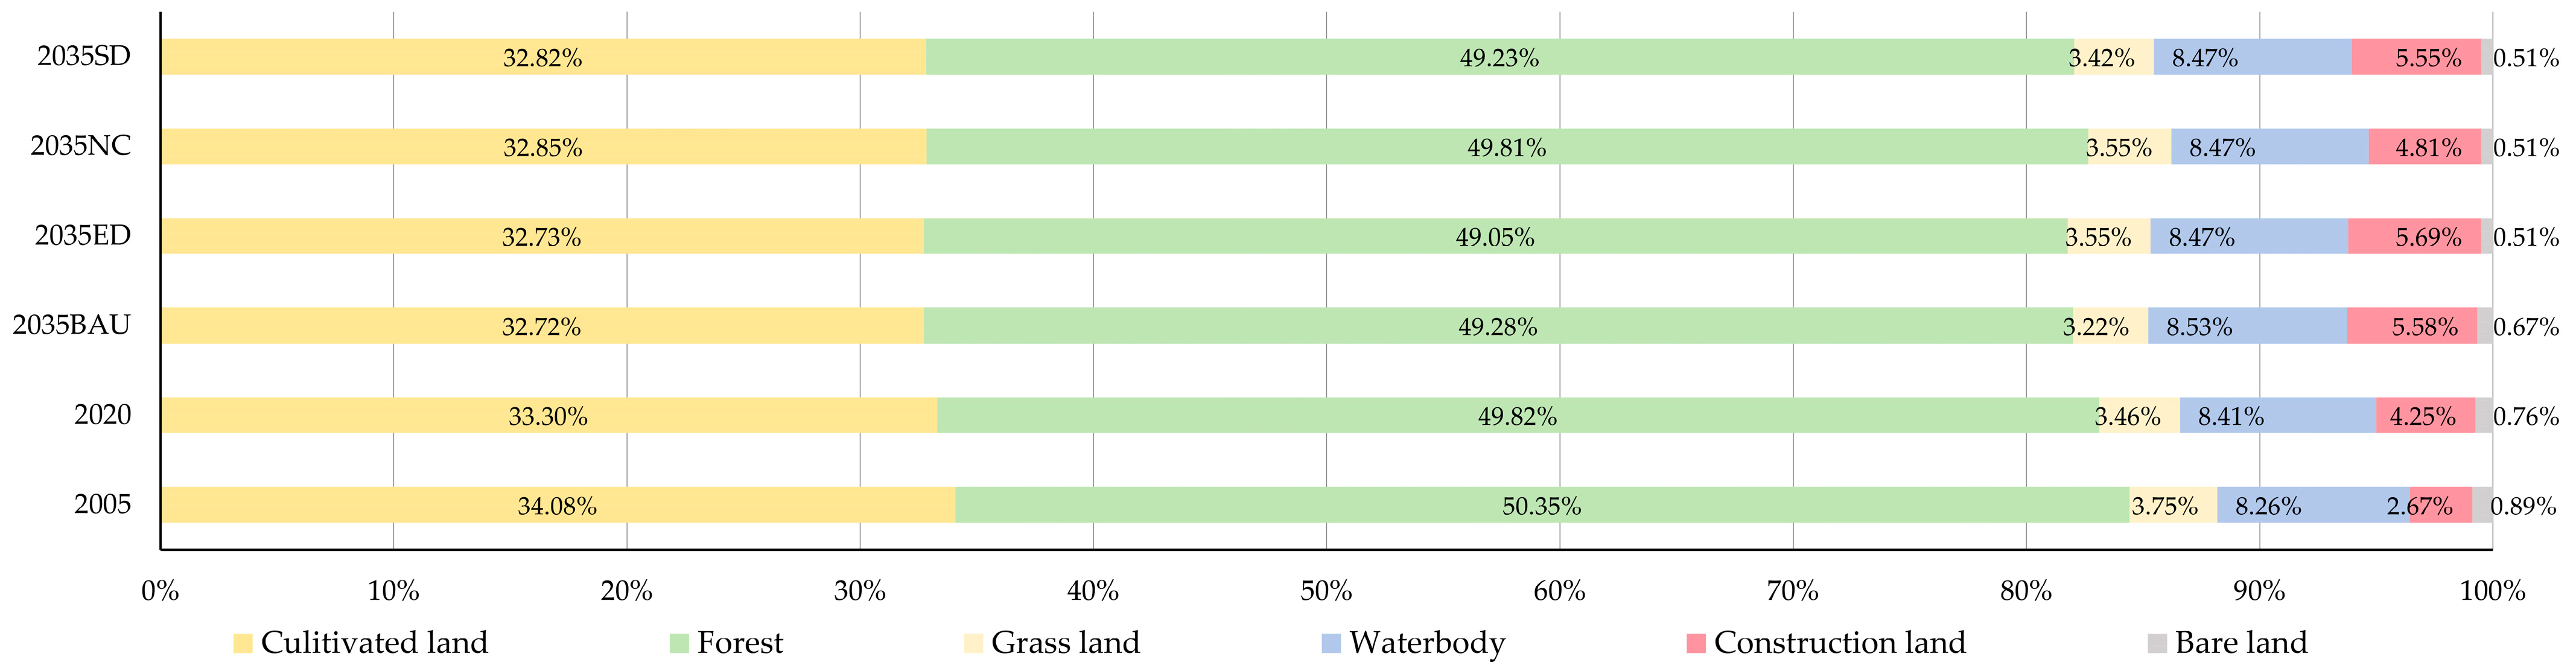
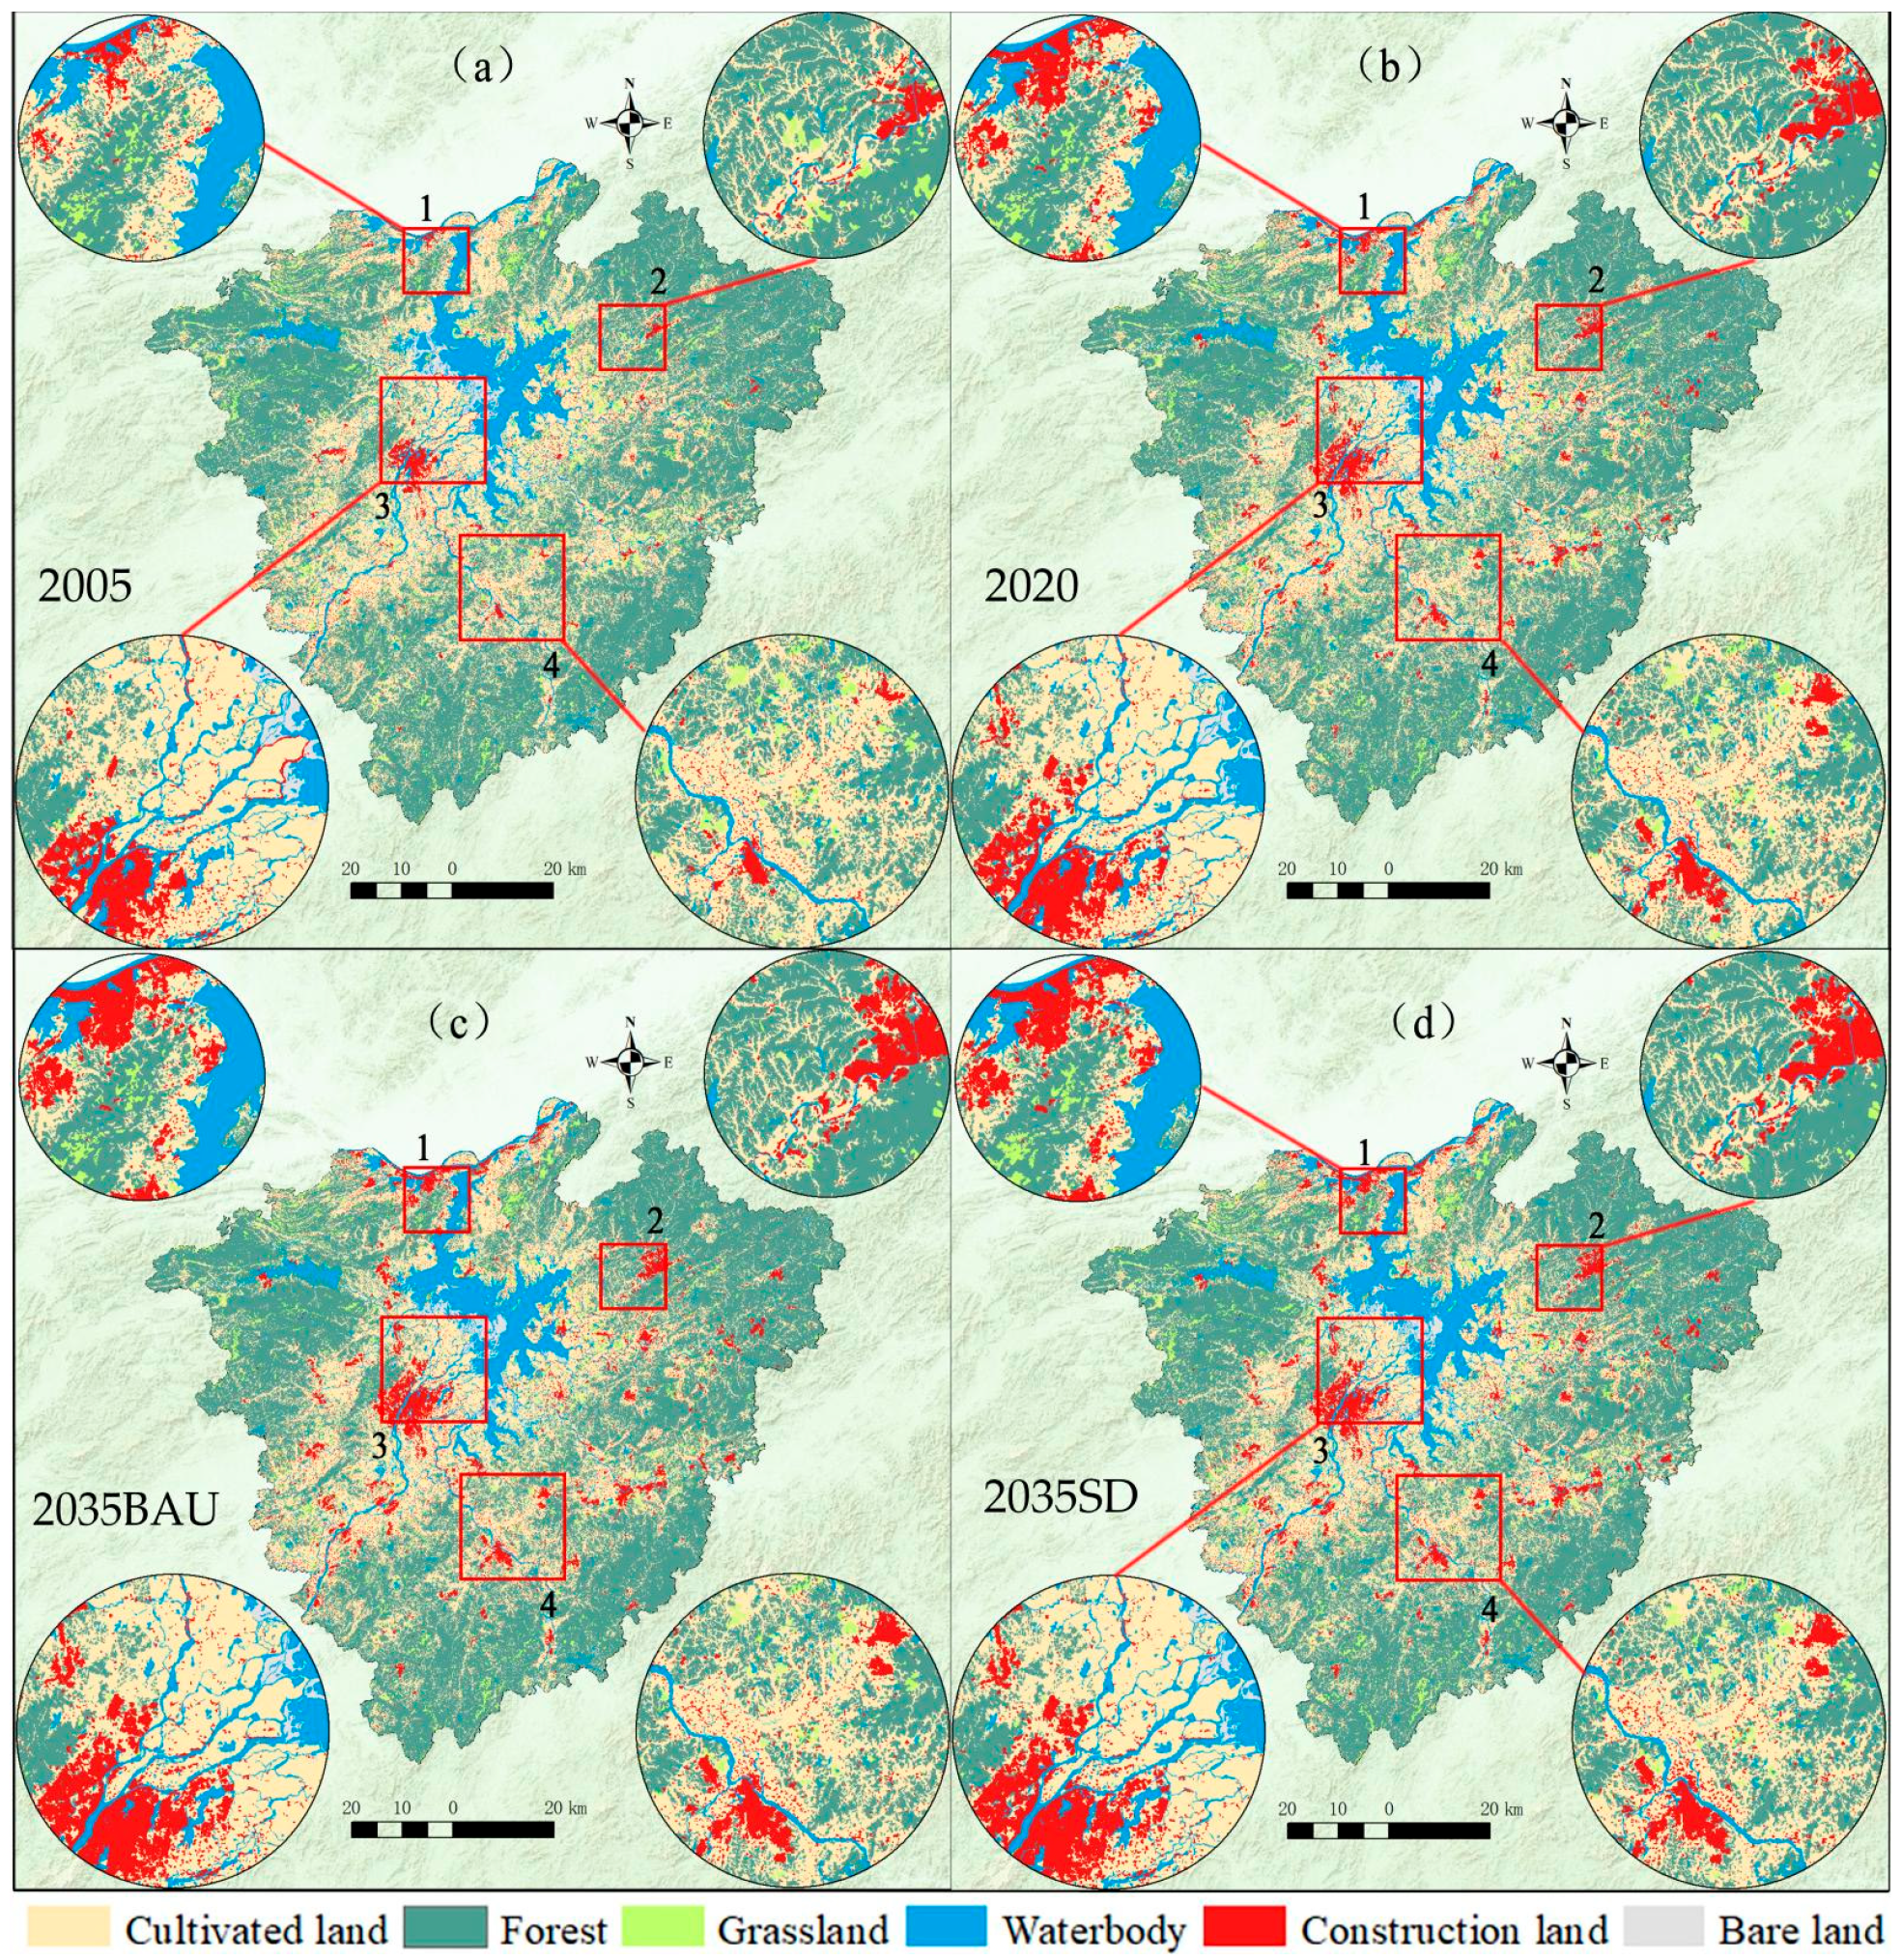
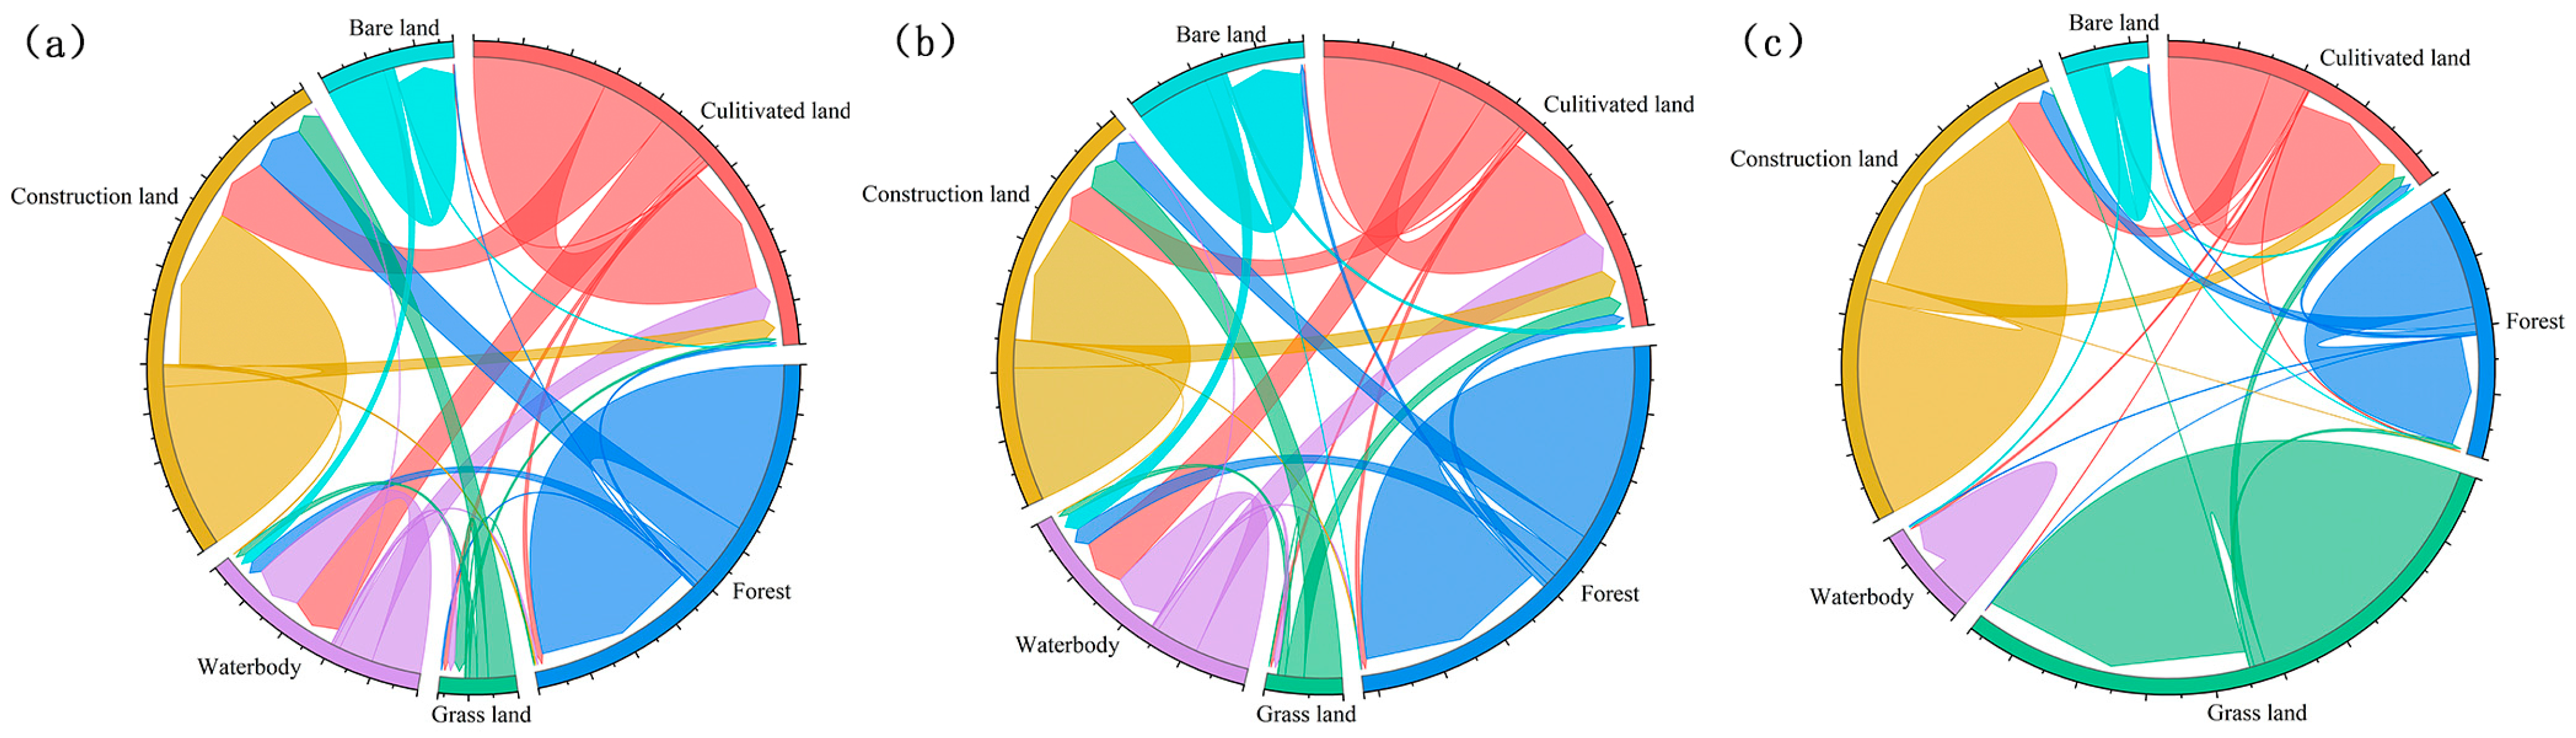
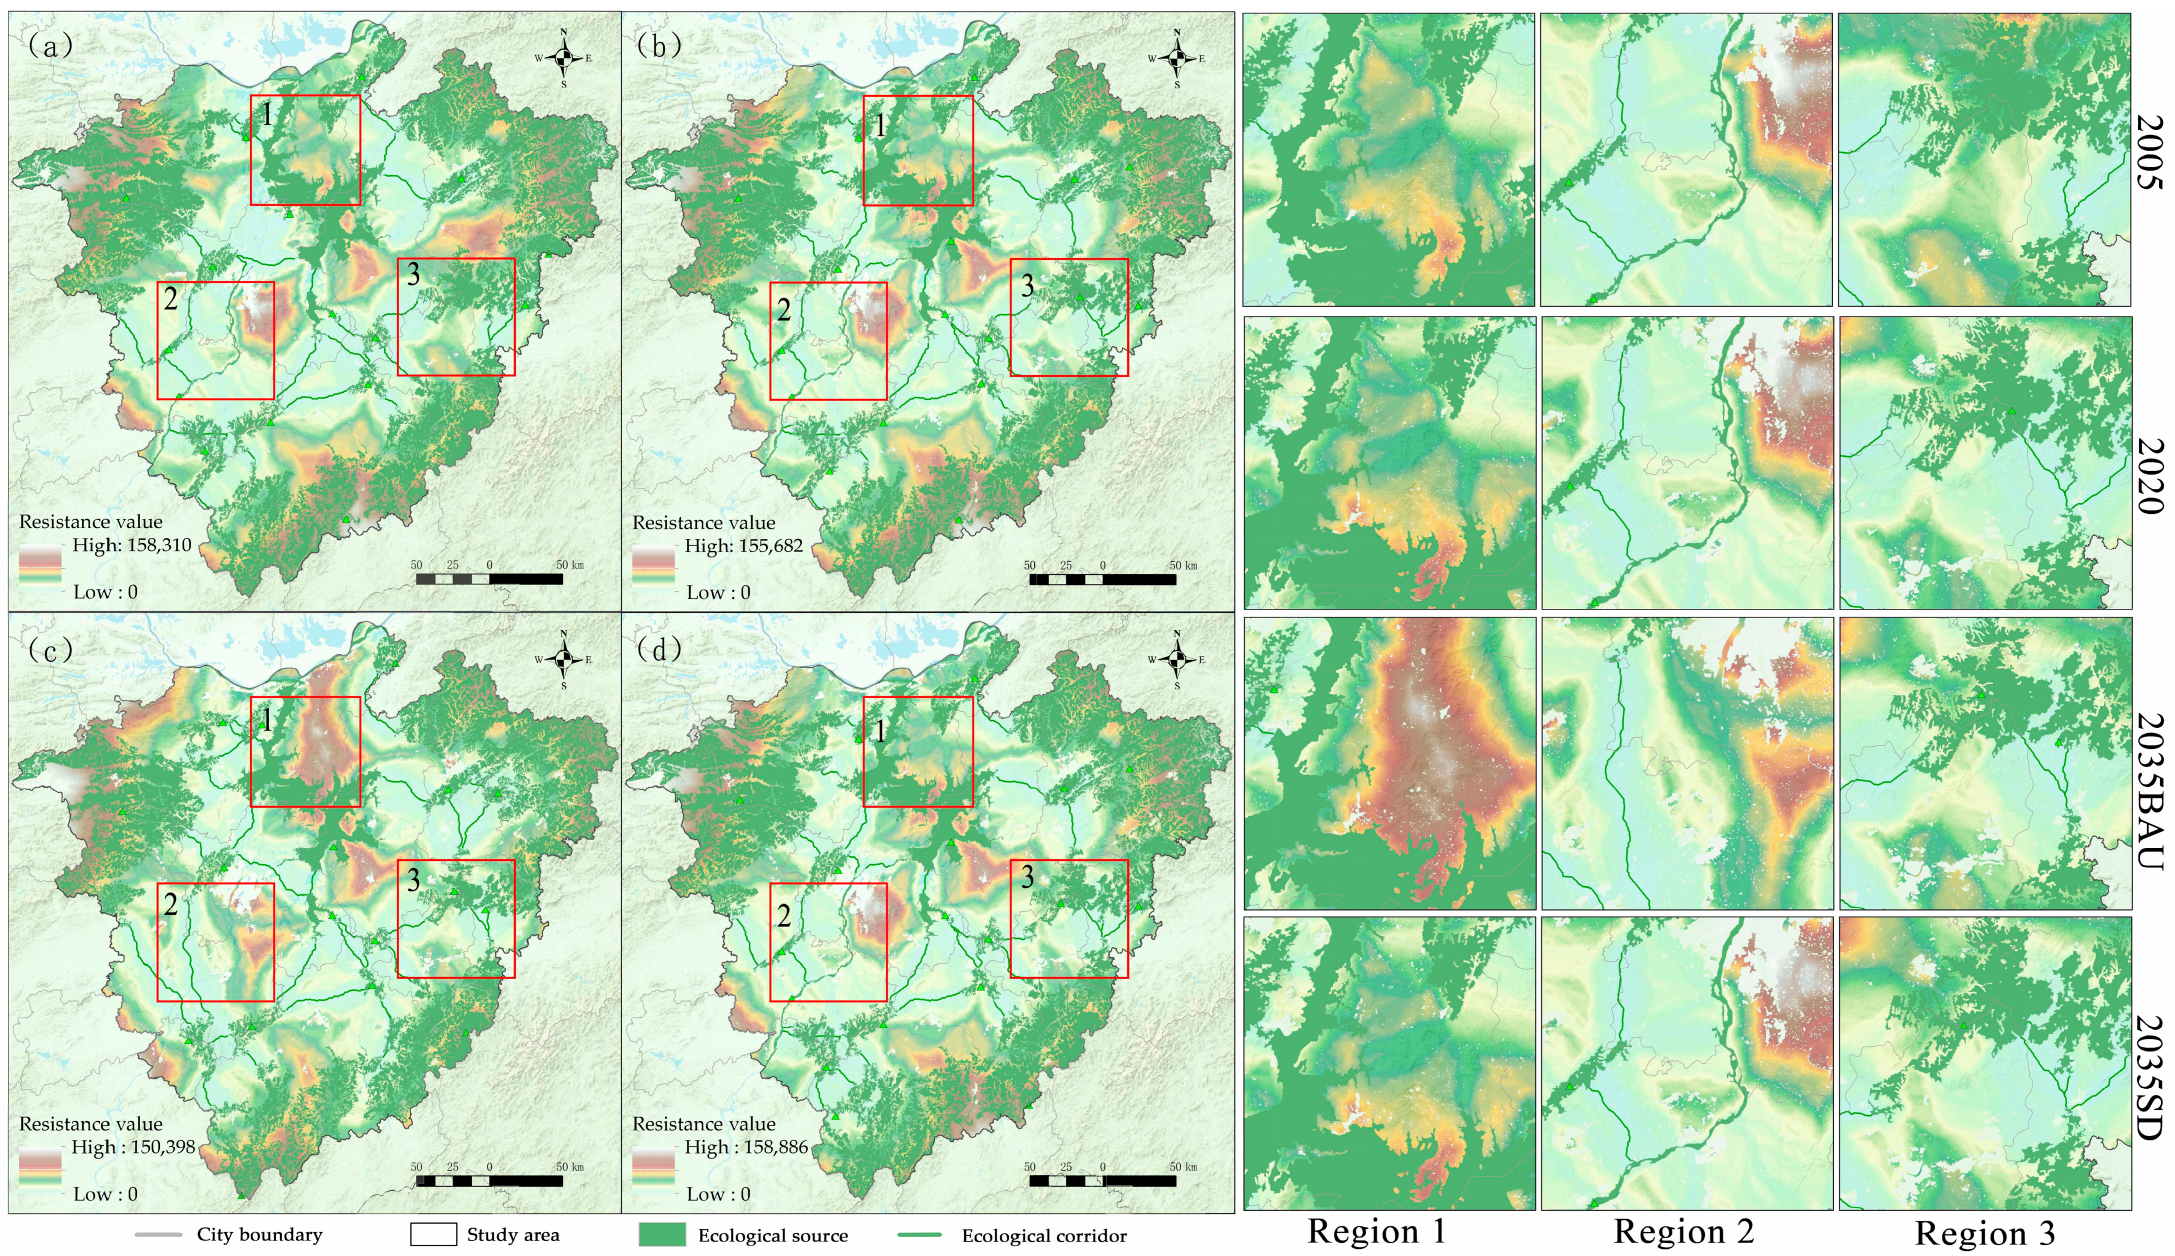
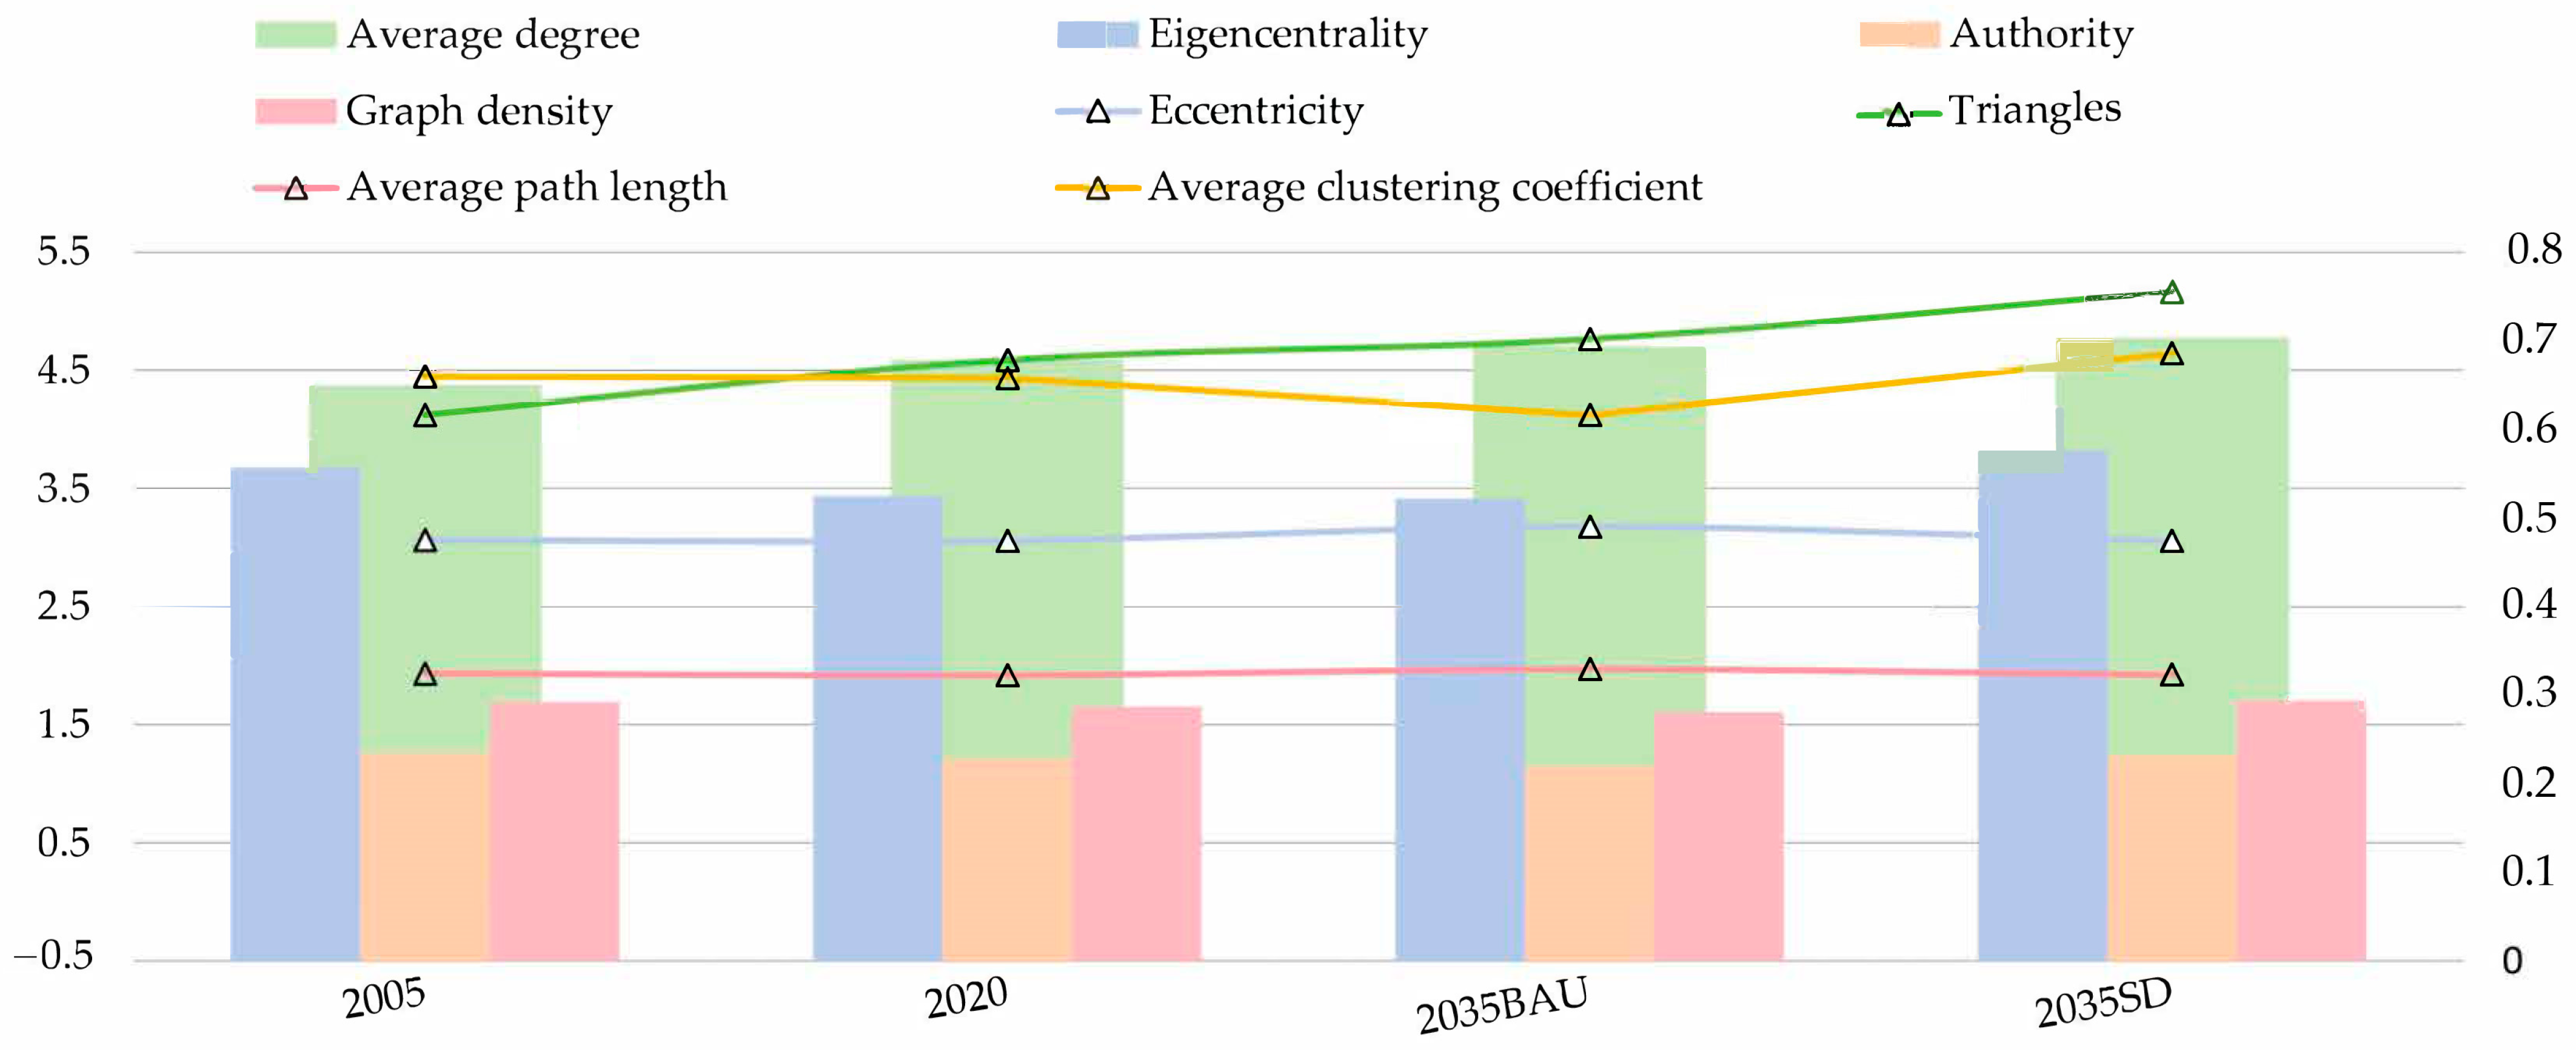
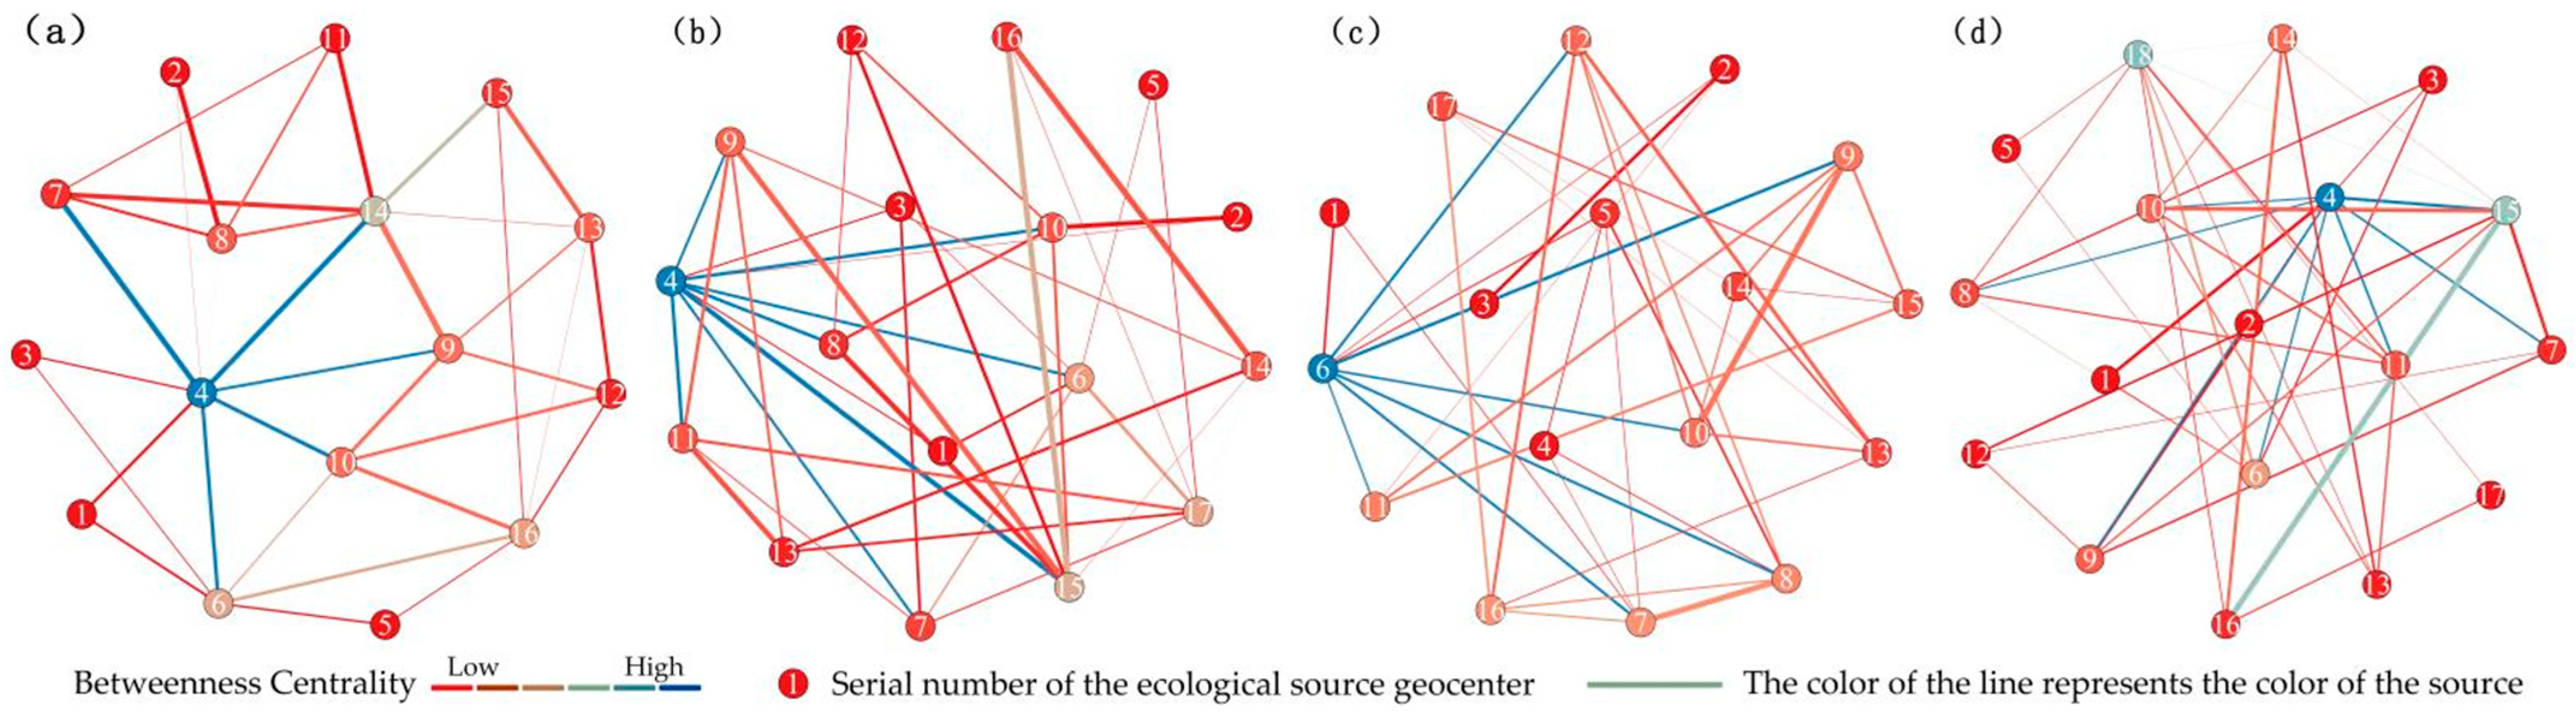
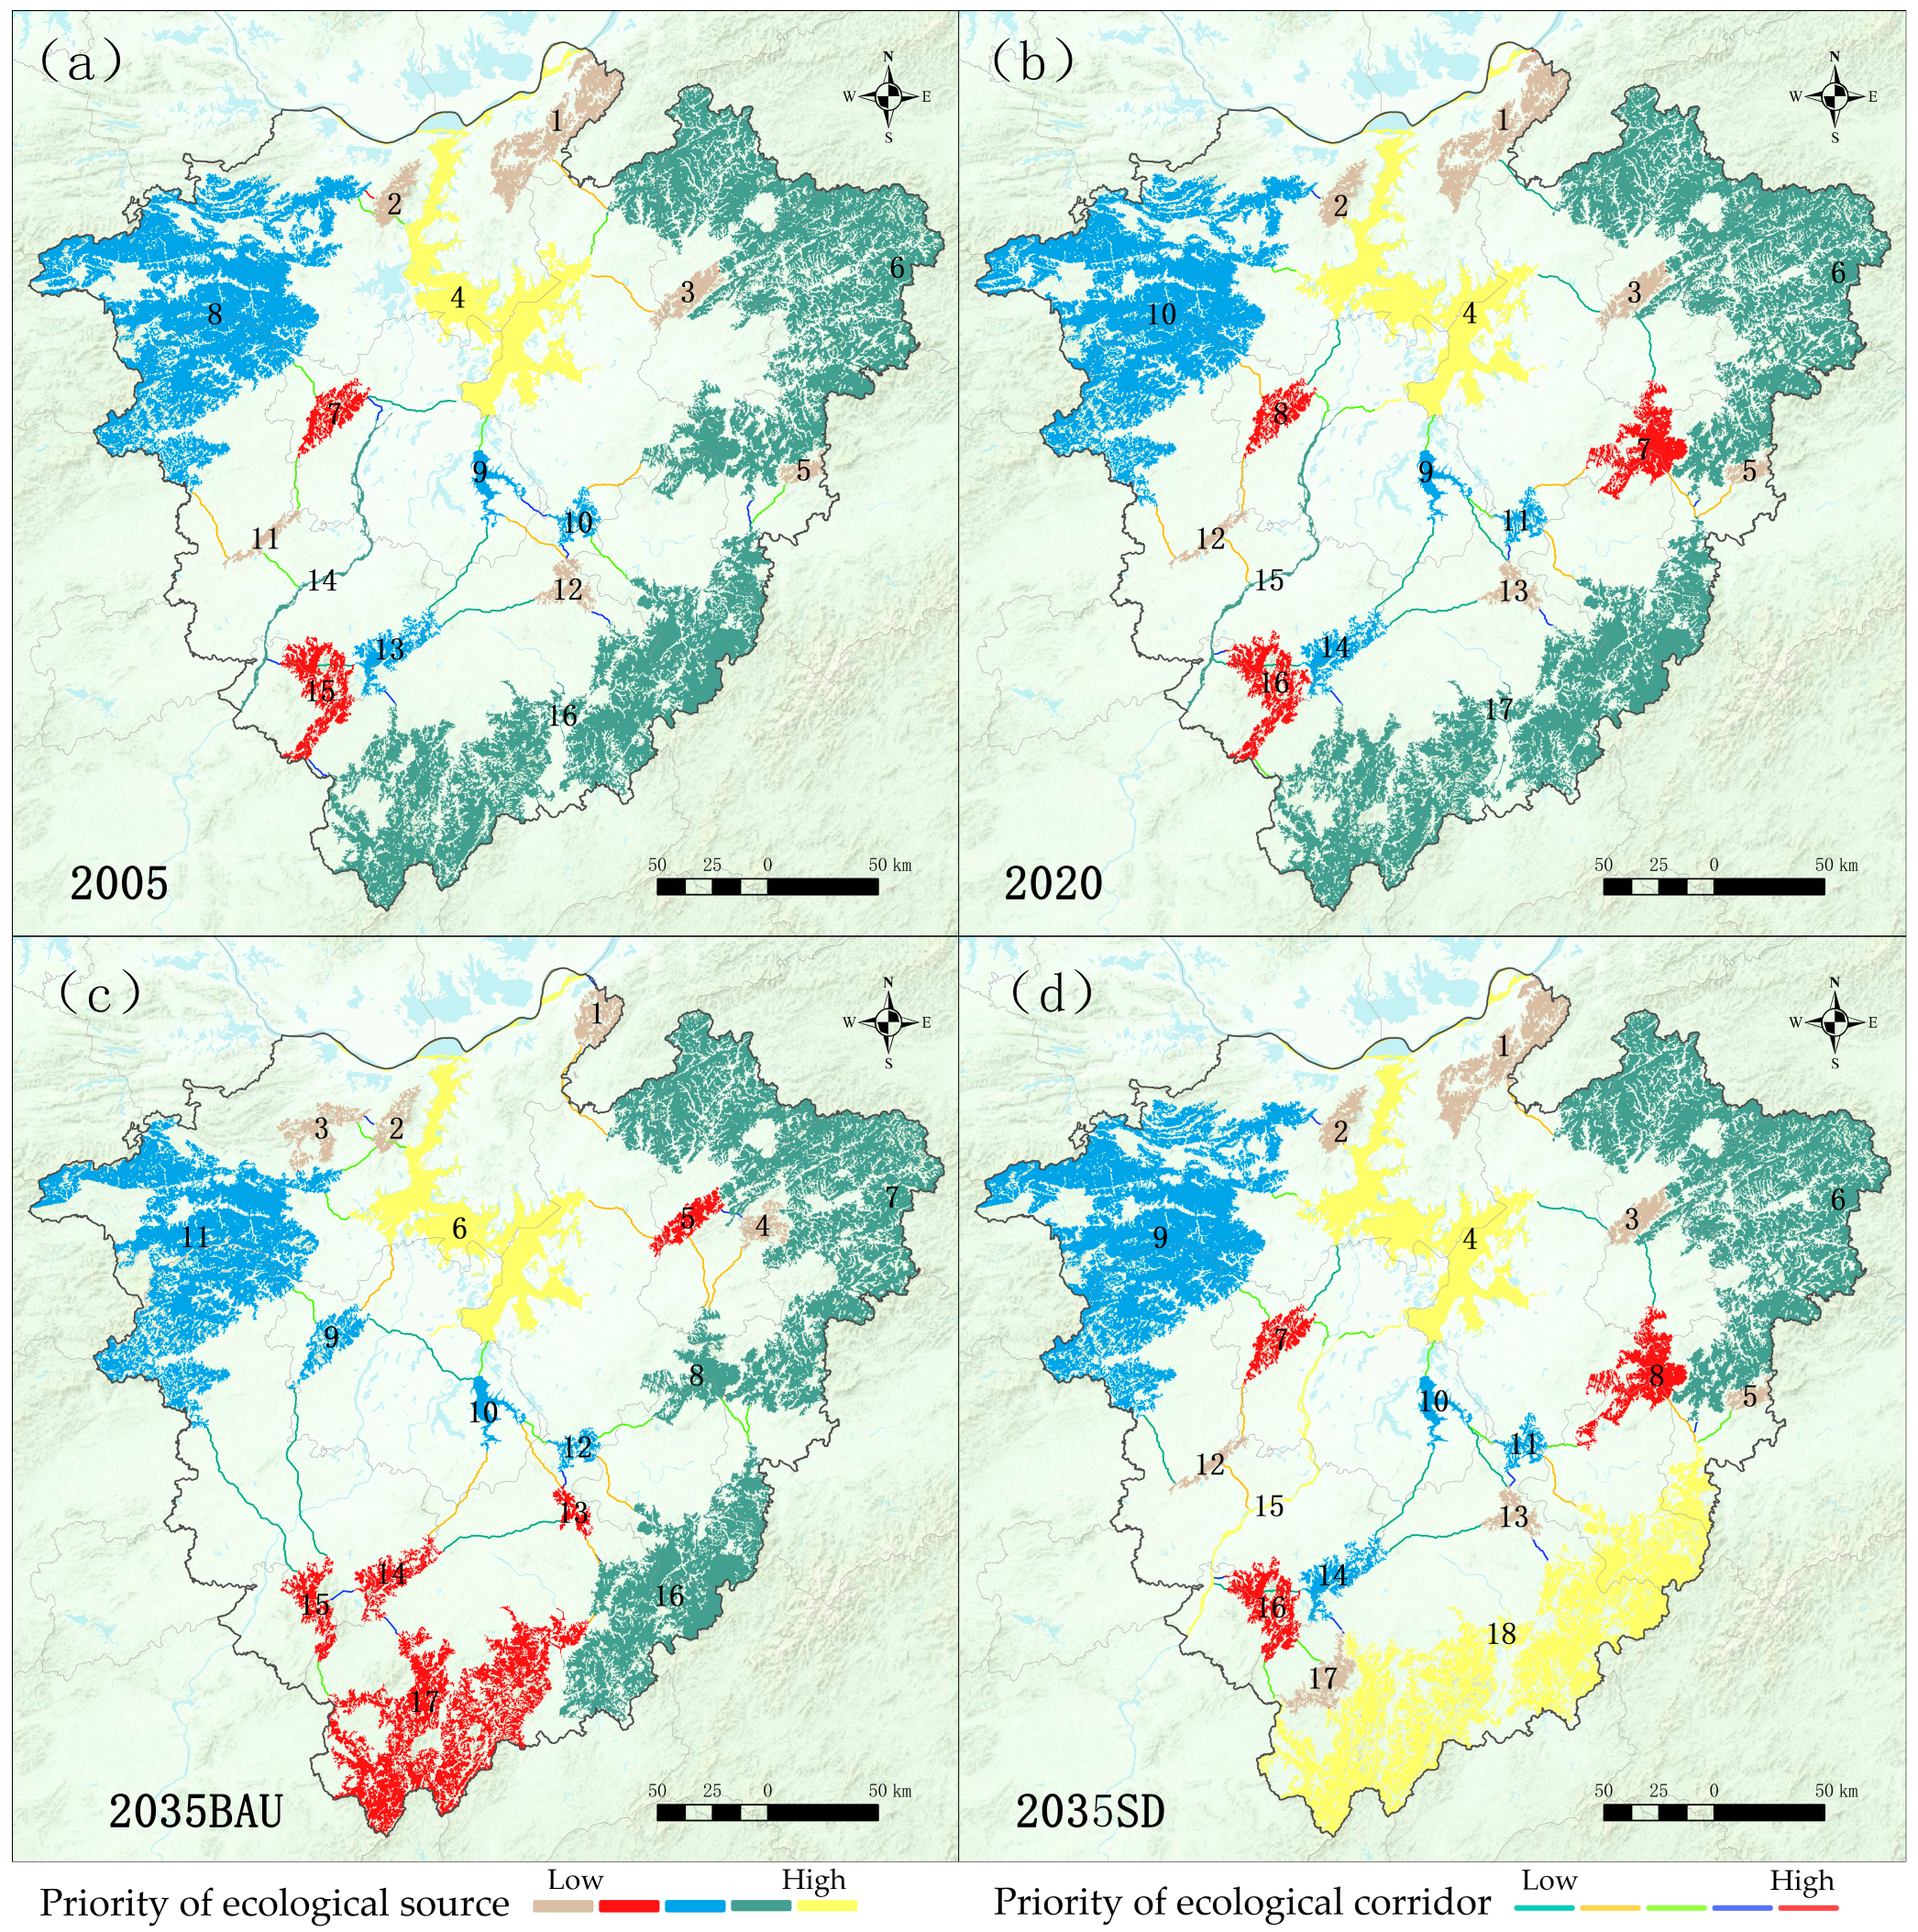
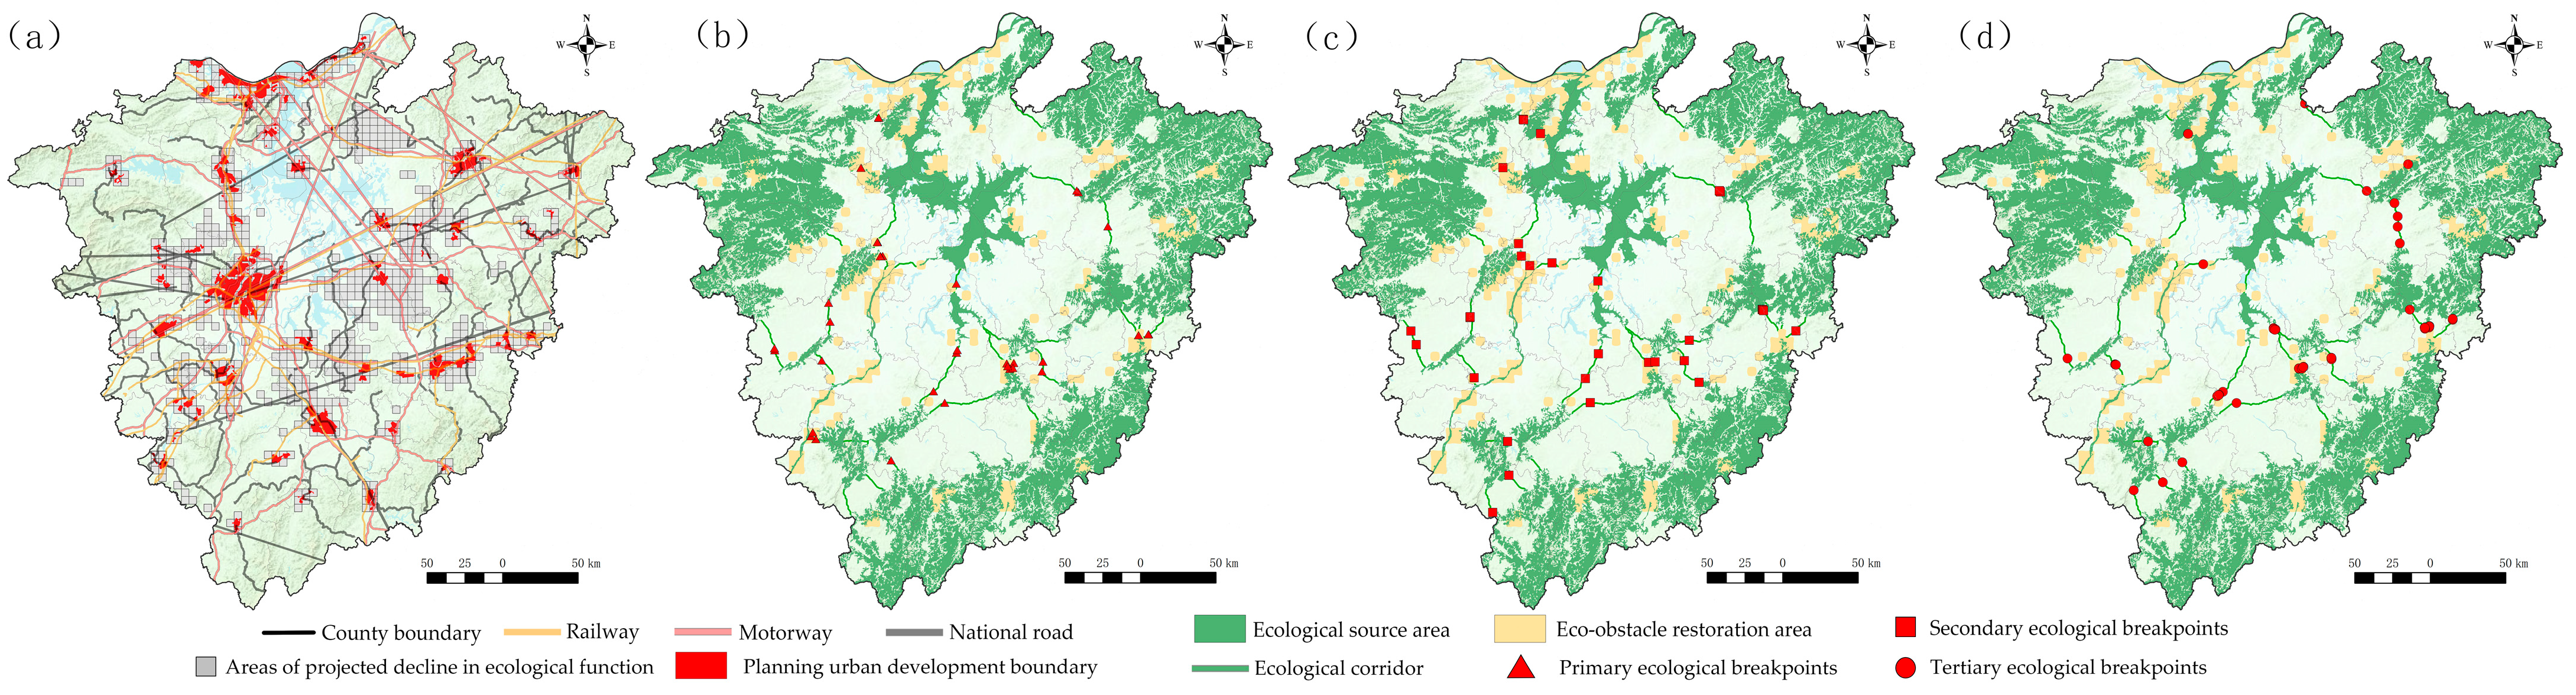
Disclaimer/Publisher’s Note: The statements, opinions and data contained in all publications are solely those of the individual author(s) and contributor(s) and not of MDPI and/or the editor(s). MDPI and/or the editor(s) disclaim responsibility for any injury to people or property resulting from any ideas, methods, instructions or products referred to in the content. |
© 2024 by the authors. Licensee MDPI, Basel, Switzerland. This article is an open access article distributed under the terms and conditions of the Creative Commons Attribution (CC BY) license (https://creativecommons.org/licenses/by/4.0/).