Abstract
The textile industry, a substantial component of the global economy, holds significant importance due to its environmental impacts. Particularly, the use of water and chemicals during dyeing processes raises concerns in the context of climate change and environmental sustainability. Hence, it is crucial from both environmental and economic standpoints for textile factories to adopt green industry standards, particularly in their dyeing operations. Adapting to the green industry aims to reduce water and energy consumption in textile dyeing processes, minimize waste, and decrease the carbon footprint. This approach has become crucial in achieving sustainability in textiles following the signing of the Paris Climate Agreement. Important elements of this transformation include the reuse of washing waters used in the dyeing process, the recycling of wastewater, and the enhancement of energy efficiency through necessary methodological and equipment changes. This study analyzes the energy, labor, production, and consumption data since 2011 for a textile factories with four branches located in the Adana Organized Industrial Zone. Among these factories, the one designated as UT1, which has the highest average energy and water consumption compared to the other three branches, is selected. In recent years, the use of artificial intelligence and machine learning technologies in predicting industrial processes has been increasingly observed. The data are analyzed using LSTM (Long Short-Term Memory) and ANN (Artificial Neural Networks) forecasting methods. Particularly, the LSTM algorithms, which provided the most accurate results, have enabled advanced forecasting of electricity consumption in dyeing processes for future years. In 2020, electricity consumption was recorded as 3,717,224 kWh and this consumption was reflected in the total energy cost as TRY 1,916,032. Electricity consumption accounts for 22.34% of total energy consumption, while the share of this energy type in the cost is 43.25%. In the light of these data, the MAPE value for energy consumption forecasts using the LSTM model was 0.45%, which shows that the model is able to forecast with high accuracy. As a result, a solar power plant was installed to optimize energy consumption, and in 2023 60% energy savings were achieved in summer and 25% in winter. The electricity consumption forecasting results have been an essential guide in planning strategic initiatives to enhance factory efficiency. Following improvement efforts aimed at reducing energy consumption and lowering the carbon footprint, significant optimizations in processes and layouts have been made at specific bottleneck points within the facility. These improvements have led to savings in labor, time, and space, and have reduced unit production costs.
1. Introduction
The textile industry is the sixth most-affected sector by climate change. It influences both production processes and supply chains. The effects of climate change are particularly evident in areas such as raw material production, energy consumption, and waste management. For instance, the production of natural fibers like cotton is dependent on water resources and specific climatic conditions. Droughts and extreme weather events caused by climate change negatively impact the production of these fibers, consequently affecting supply chains. This can lead to fluctuations in raw material prices and issues in supply reliability. Additionally, rising temperatures due to climate change can reduce the quality of fibers, thereby decreasing the overall quality of textile products. The textile sector is known for its intensive energy and water usage. Climate change, by reducing water availability and increasing energy costs, escalates production costs.
In recent years, lots of article have been mentioned which focus on sustainability, digitalization and the green revolution of the textile industry. Sabır et al. [1] aim to increase process efficiency in the PES/VIS/LYC fabric production line of a textile finishing plant through the application of a method study. Varadarajan and Venkatachalam [2] state that wastewater in textile dyehouses, characterized by high chemical oxygen demand (COD), biological oxygen demand (BOD), total dissolved solids (TDSs), pH, and color, causes serious environmental problems. Öztürk et al. [3] focuses on cleaner production assessment in a textile finishing plant, in line with the Integrated Pollution Prevention and Control and Industrial Emissions Directive in Denizli, Turkey. Toprak and Aniş [4] emphasize the pressure on the textile industry to produce environmentally friendly products due to increasing societal awareness and public concern for the environment. Desore and Narula [5] highlights the significant contribution of the textile industry to environmental pollution compared to other industries, causing various ecological problems like water pollution, waste generation, and air pollution. Toksöz [6] examines sustainability practices in the textile sector and their environmental impacts. Türemen et al. [7] address the increasing consumption of textile products with the rapidly developing fashion industry and the resultant growing need for recycling. Kayışkan et al. [8] aim to restructure and improve the supply processes of a dye industry company according to process management techniques, analyzing improvements in supply activities. Piribauer and Bartl [9] present a mini review addressing the global increase in fiber production and the rising amount of textile waste. Khattab et al. [10] investigate the environmental impacts of the textile dyeing industry and ways to mitigate these impacts. Ahmad et al. [11] investigate the role of Business Intelligence Systems (BIS) in the textile and apparel (T&A) industry during the era of Industry 4.0 and how these systems can solve sustainability issues.
Indrayani and Triwiswara [12] address the application of green industry standards in textile manufacturing and products. They emphasize the importance of industries transitioning from traditional production processes to green industries, which consider economic growth along with environmental sustainability. Roy et al. [13], in their study, emphasize the necessity of identifying Critical Environmentally Conscious Manufacturing Indicators (CECMIs) for formulating environmental strategies in textile manufacturing due to the significant environmental harms caused by various textile manufacturing processes. Tandoğan [14] examines how advancements in production methods contribute to efficiency in the textile sector. In global competitive conditions, businesses manage and strengthen their complex structures to achieve advantageous positions. Sabır [15] explores the complex and challenging process of product development occurring before production initiation, during order receipt, or at the collection preparation stages. Tuna [16] aims to examine production problems encountered in the terry towel section of a textile enterprise operating in Denizli. It has been noted that the garment sector faces numerous issues due to product diversity, lack of standard workflows, and variability in raw materials and semi-finished products. Metlioğlu et al. [17] focus on the development of the concept of sustainability in the textile industry, particularly examining the sustainability strategies of brands such as H&M and ZARA, operating in the fast fashion sector. Coşkun and Doğan [18] evaluate the carbon footprint amounts resulting from the annual production activities in the garment, fabric dyeing, printing, and yarn dyeing sections of a textile factory in 2018. When comparing the carbon footprint amounts among the produced sections, Yüksel [19] produced woven fabrics using recycled polyester (r-PET) and cotton (r-CO) fibers and evaluated these fabrics from a sustainability perspective. Seven different blends of yarns were used in the study. Okai-Mensah et al. [20] present rich empirical evidence on circularity solutions adopted by major companies in the fast fashion industry. The sustainability reports of six global players were analyzed using a value-chain circular model that encompasses eleven stages, from product design to recycled materials. The article by Şener Fidan [21] highlights the sustainability issues in the denim industry and the importance of research in this area. It discusses the development of the concept of sustainability and its integration into the textile industry. The article by Kurtoğlu [22] emphasizes the importance of transitioning to a circular economy in the textile sector. It specifically points out the steps taken by the European Union in this regard, and highlights the fact that misconceptions about the circular economy concept are a significant issue. The article presents the advantages, disadvantages, and recommendations for the sector’s transition to a circular economy, comprehensively addressing the challenges and opportunities faced by the Turkish textile and ready-to-wear sector in this transition, and emphasizing its significance. The article by Elibüyük et al. [23] examines efficiency improvement efforts conducted in the dyeing section of a textile enterprise. Due to increasing population and global warming, diminishing water resources have increased restrictions on water usage, paving the way for more environmentally friendly and sustainable production processes. In this context, the company’s dyeing section, especially in Piece Dyeing, Pad Batch, and HT dyeing processes, aims to reduce energy, water, and chemical usage. Ağraş et al. [24] examined the environmental sensitivity and sustainability policies of textile companies in Turkey. The research evaluates the policies of 89 textile companies that produce in different areas and are among the top 500 industrial enterprises announced annually by the Istanbul Chamber of Industry, using the document analysis technique. Başoğul et al. [25] focus on the evaluation of the carbon footprint of a textile factory operating in Adıyaman. Kluczek and Buczacki [26] extensively examine processes in a dairy processing plant for energy sustainability assessment. Discussions include strategic-, tactical-, and operational-level implementations related to energy efficiency, change management, and Industry 4.0 technologies. Román-Collado et al. [27], in relation to the European Union, in line with the ‘European Green Deal’, have identified the textile and clothing industry as one of the significant targets for achieving carbon neutrality by 2050. The research aims to analyze the determinants of changes in greenhouse gas emissions in this industry across the EU’s 27 member states from 2008 to 2018 and the extent to which economic growth and emissions are decoupled. Chinnathai et al. [28] address a digital lifecycle management framework supporting sustainable smart manufacturing for energy-intensive industries (EIIs). The article summarizes the current state of digitalization in such industries and frameworks related to sustainable EIIs, and includes a literature review. Coşgun [29] calculates and analyzes the carbon footprint of a textile company operating in the Bursa Organized Industrial Zone, based on the year 2019. The analysis includes direct and indirect greenhouse gas emissions. The total emission amount for 2019 is determined to be 44.71973 tons CO2 equivalent. Işık [30] focuses on the increase in natural resource consumption, energy needs, and fossil fuel usage, alongside the growing global population, and their adverse effects on the natural life cycle. Demirdelen [31] aims to invest in a “cradle-to-customer plus waste” life cycle assessment (LCA), which is conducted to evaluate the environmental impacts of two products in the textile sector.
Considering these factors, global environmental regulations aimed to combating climate change are increasing, together with the necessity for the industry, including textiles, to shift towards more sustainable production methods and materials.
The primary objective of this study is to forecast future electricity consumption using LSTM and ANN methods. In the subsequent phase, efficiency measures are implemented within the factory to optimize electricity usage, thereby promoting the more efficient use of limited energy resources. Specific projects are initiated to reduce the electricity consumption per kilogram of yarn. Consequently, these efforts aim to mitigate the adverse effects of climate change by reducing the consumption of limited energy and water resources [32].
2. Materials and Methods
2.1. UT 1 Dyeing Processes
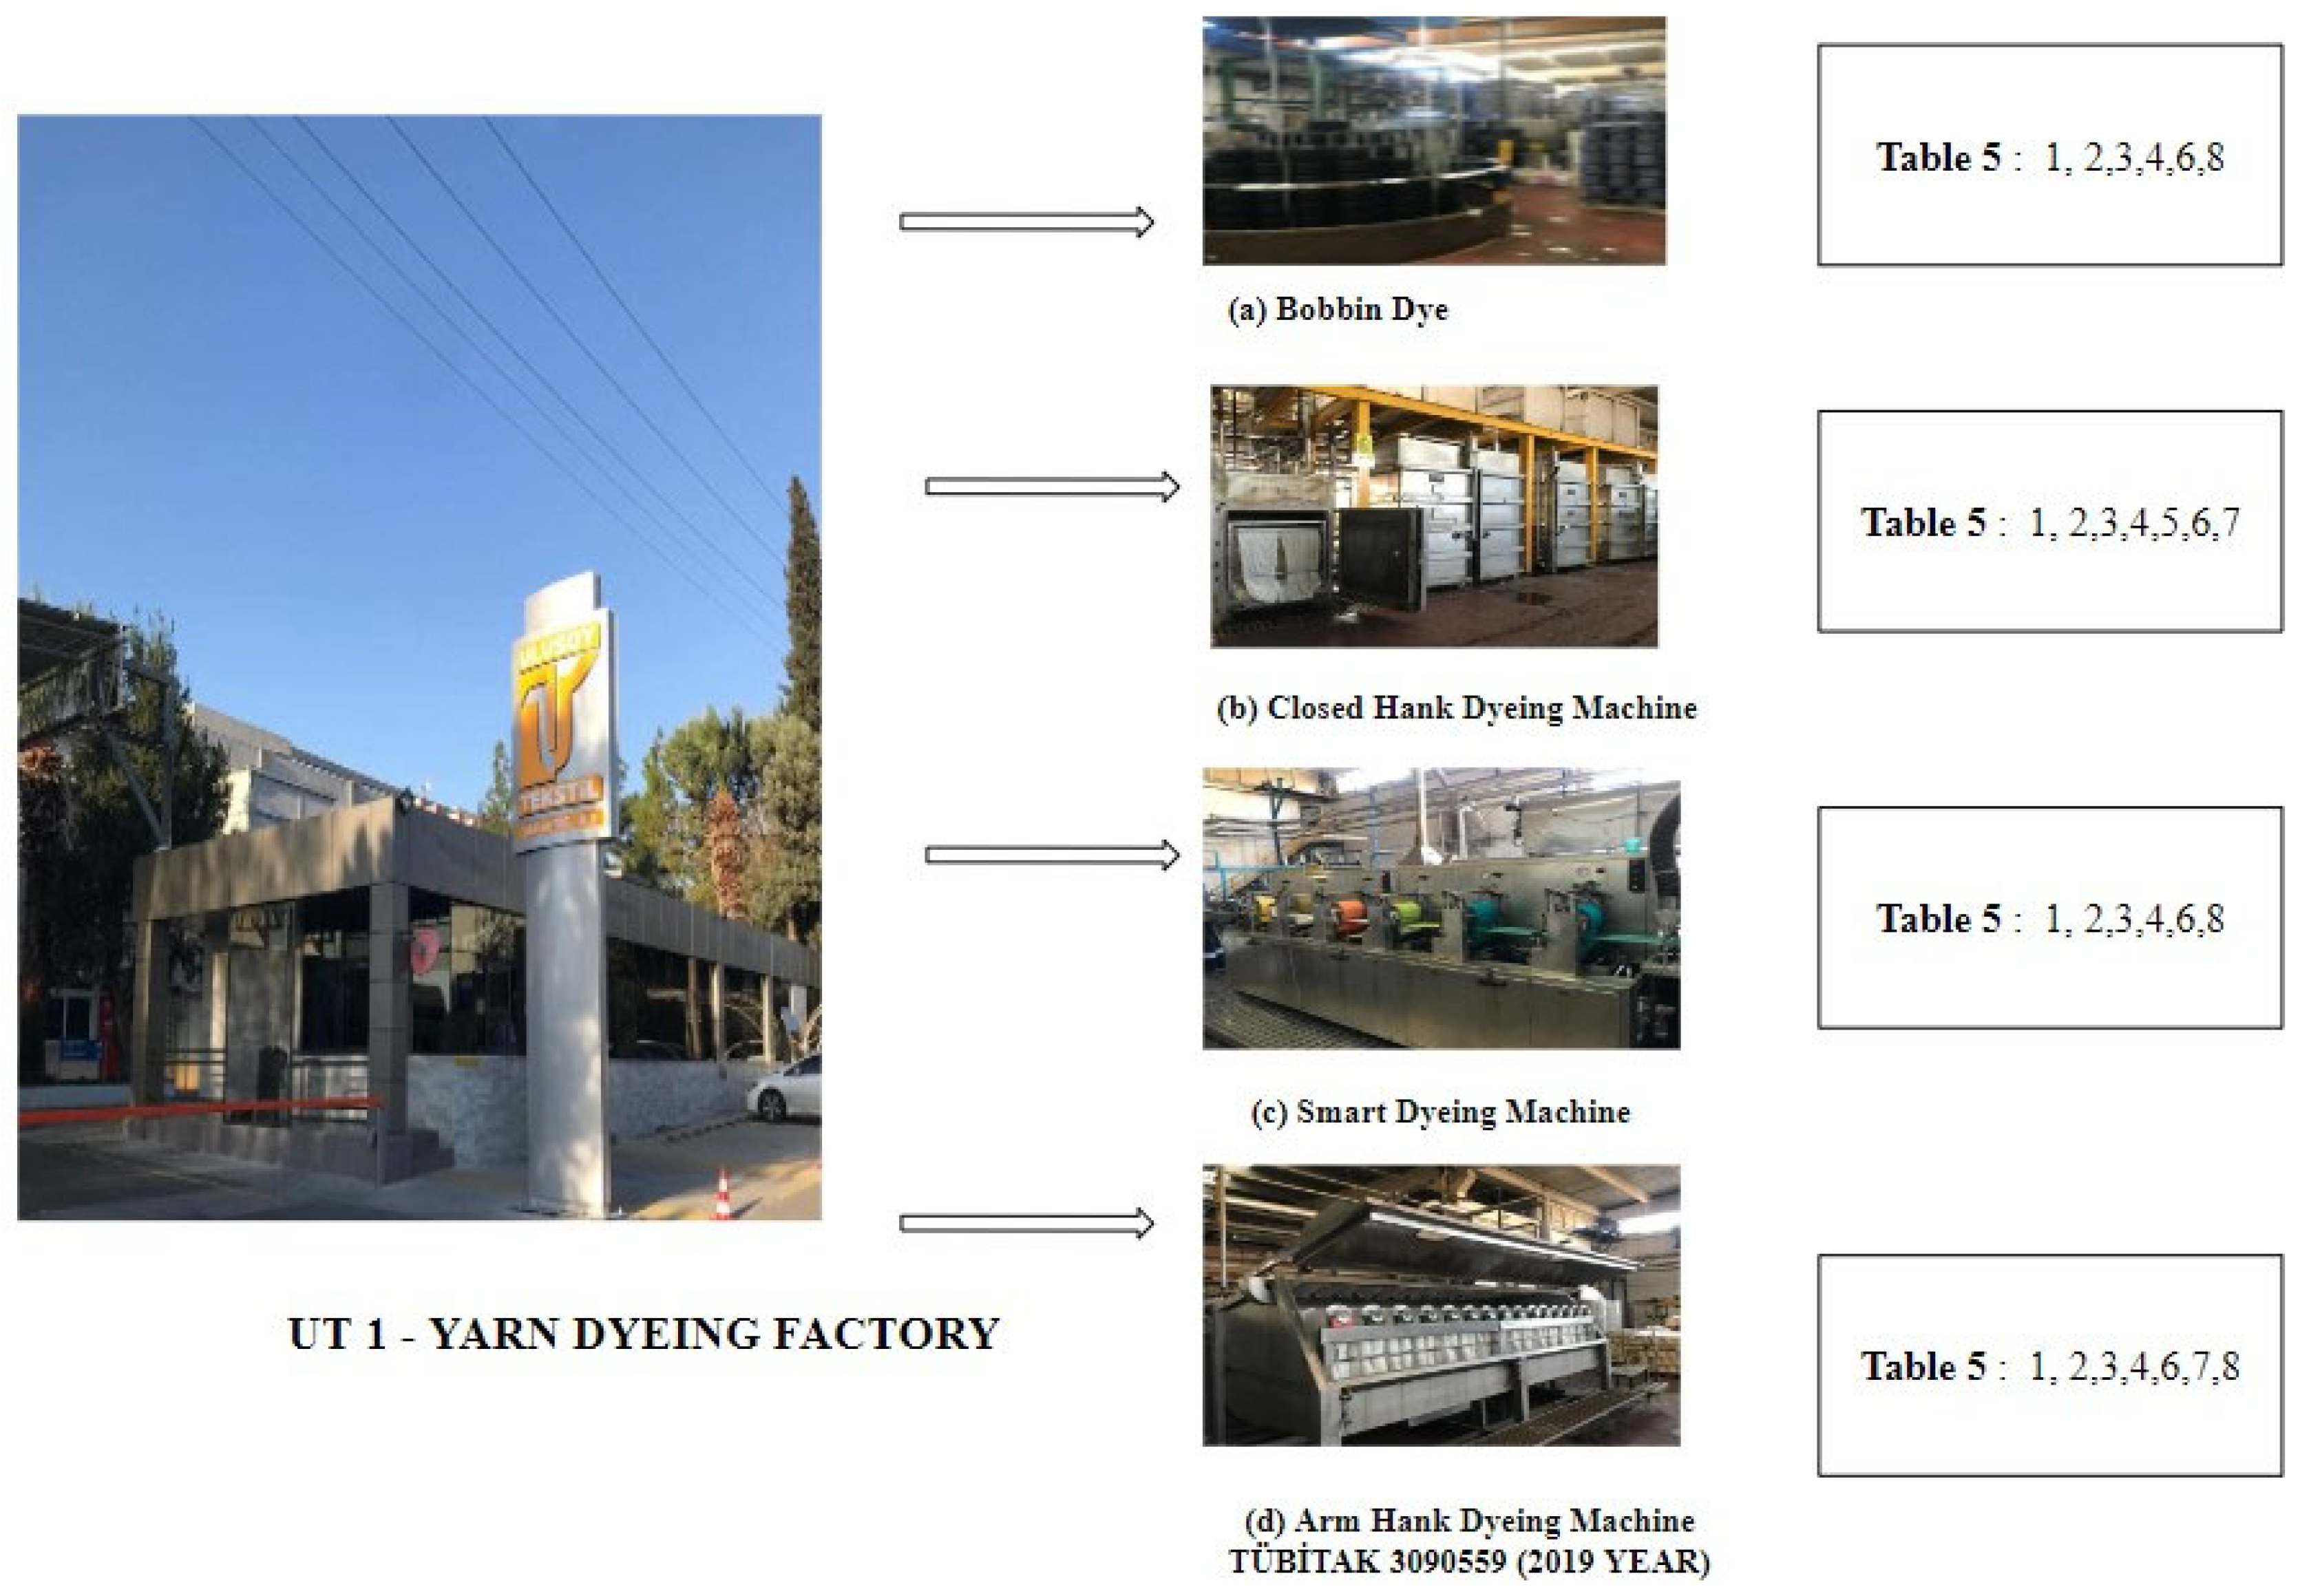
Ulusoy Textile, located in the Adana Organized Industrial Zone and engaged in the production and dyeing of fancy yarns, holds a significant position in the textile industry, with its domestic and international sales. To keep pace with the evolving and changing world, stay ahead of competitors, meet customer demands, fulfill the requirements of necessary brands, and gain a competitive edge, Ulusoy Textile is obliged to execute process improvements and innovative projects in the areas of energy, water, and labor. For this purpose, the UT1 Dyeing Plant, the most intensive in terms of energy, labor, chemicals, and dye consumption among its four production facilities, has been focused on. The UT1 facility specializes in dyeing yarn and fiber in bobbin, hank, and gradient dyeing states. The dyeing plant, established about 35 years ago, has changed machinery and production balance in response to shifting demands.
Four different dyeing methods are shown in Figure 1. The dyeing techniques described in Figure 1 are performed in pressurized or non-pressurized environments using chemicals and dyes, according to the color requested by customers. These methods are the following: bobbin dyeing, as seen in Figure 1a, enclosed skein dyeing as seen in Figure 1b, smart dyeing as seen in Figure 1c, and arm skein dyeing, as seen in Figure 1d:

Figure 1.
UT 1 dyeing processes.
- Bobbin Dyeing (Package Dyeing): Initially, the yarns are gently wound onto perforated bobbins. Each bobbin is wound to the same diameter and placed in the dyeing machine. The dyeing process is carried out under pressure and at a specified temperature. This method is suitable for dyeing fine and less-elastic yarns evenly. It is not preferred for delicate and fancy yarns.
- Closed Hank Dyeing (Skein Dyeing): The yarns, arranged in hank form, are freely hung on the machine’s apparatus for dyeing. This is an old and traditional method, ensuring that the natural structure of the yarn is preserved. Generally, dyeing is performed at low pressure and temperature. Hank dyeing is typically used for thick or elastic yarns.
- Smart Dyeing: Multiple colors are applied simultaneously, side by side. This method is ideal for creating multicolored and patterned yarns. It can be performed using techniques such as print dyeing or spray dyeing. Smart dyeing is used for special effects and intricate patterns.
- Arm Hank Dyeing: This dyeing method is the same as hank dyeing. It is a machine developed by Ulusoy Textile in collaboration with a TÜBİTAK project, with the only difference being that it uses approximately 50% less chemicals and water for the dyeing process.
The types of dyeing performed at the UT1 Dyeing Plant are shown in Figure 1. The electrical improvements that can be made in the plant and their results are presented in Table 5. Figure 1 shows which areas of the plant these improvements will affect.
The need for a process and layout improvement in the factory is essential for maximizing production with the existing equipment and space. Detailed records of energy, labor, chemical, and dye consumption have been meticulously kept since 2011, with the analysis of approximately 4500 data sets over 13 years.
2.2. Data Characteristics
Ulusoy Textile operates four different facilities within the Adana Organized Industrial Zone, with all dyeing processes conducted at the UT1 facility. As shown in Table 1 and Table 2, the energy and water consumption results indicate that the dyeing facility has higher consumption levels compared to the other facilities. Considering an equally distributed site-machinery setup, the UT1 facility exhibits a higher carbon footprint and water footprint than the other three factories. Notably, in terms of electricity consumption, the UT1 branch alone exceeds the 1000 TOE (Tons of Oil Equivalent) threshold. This necessitates the appointment of an energy manager within the factory. Since 2011, the electricity, water, and natural gas bills, along with the quantities consumed, have been recorded monthly for the yarn dyeing factory.

Table 1.
UT1 2011–2023 data set part 1.
Table 2.
UT1 2011–2023 data set part 2.
Against these consumption data, information such as the amount of dyed yarn, reprocessed quantities, consumed chemicals and dyes, and packaged quantities were available. Data on the number of workers employed in that month and the number of days the steam boiler operated were also included. The cost in dollars per 100 kg of yarn produced for energy and labor consumed is specified. The unit costs and consumption quantities of electricity, water, and natural gas used for dyeing 1 kg of yarn for the specified month are also entered. Data on air temperature, one of the most critical parameters affecting production, are available. All these data are easily obtained through invoices and the MRP (Manufacturing Resource Planning, Leo Textile 2.4.7.4 version) software used in the operation. Invoices arrive in the second week of the following month for each month. The accuracy of the data is ensured by checking the invoices archived in accounting. Leo Textile is used as the MRP software, where daily work orders, planned Gantt charts for production, and monthly, and annual production reports are located. These data are maintained by the person responsible for production. In addition to all these data, the hourly and monthly costs of an employee can be calculated with the maintained energy, water, and production data.
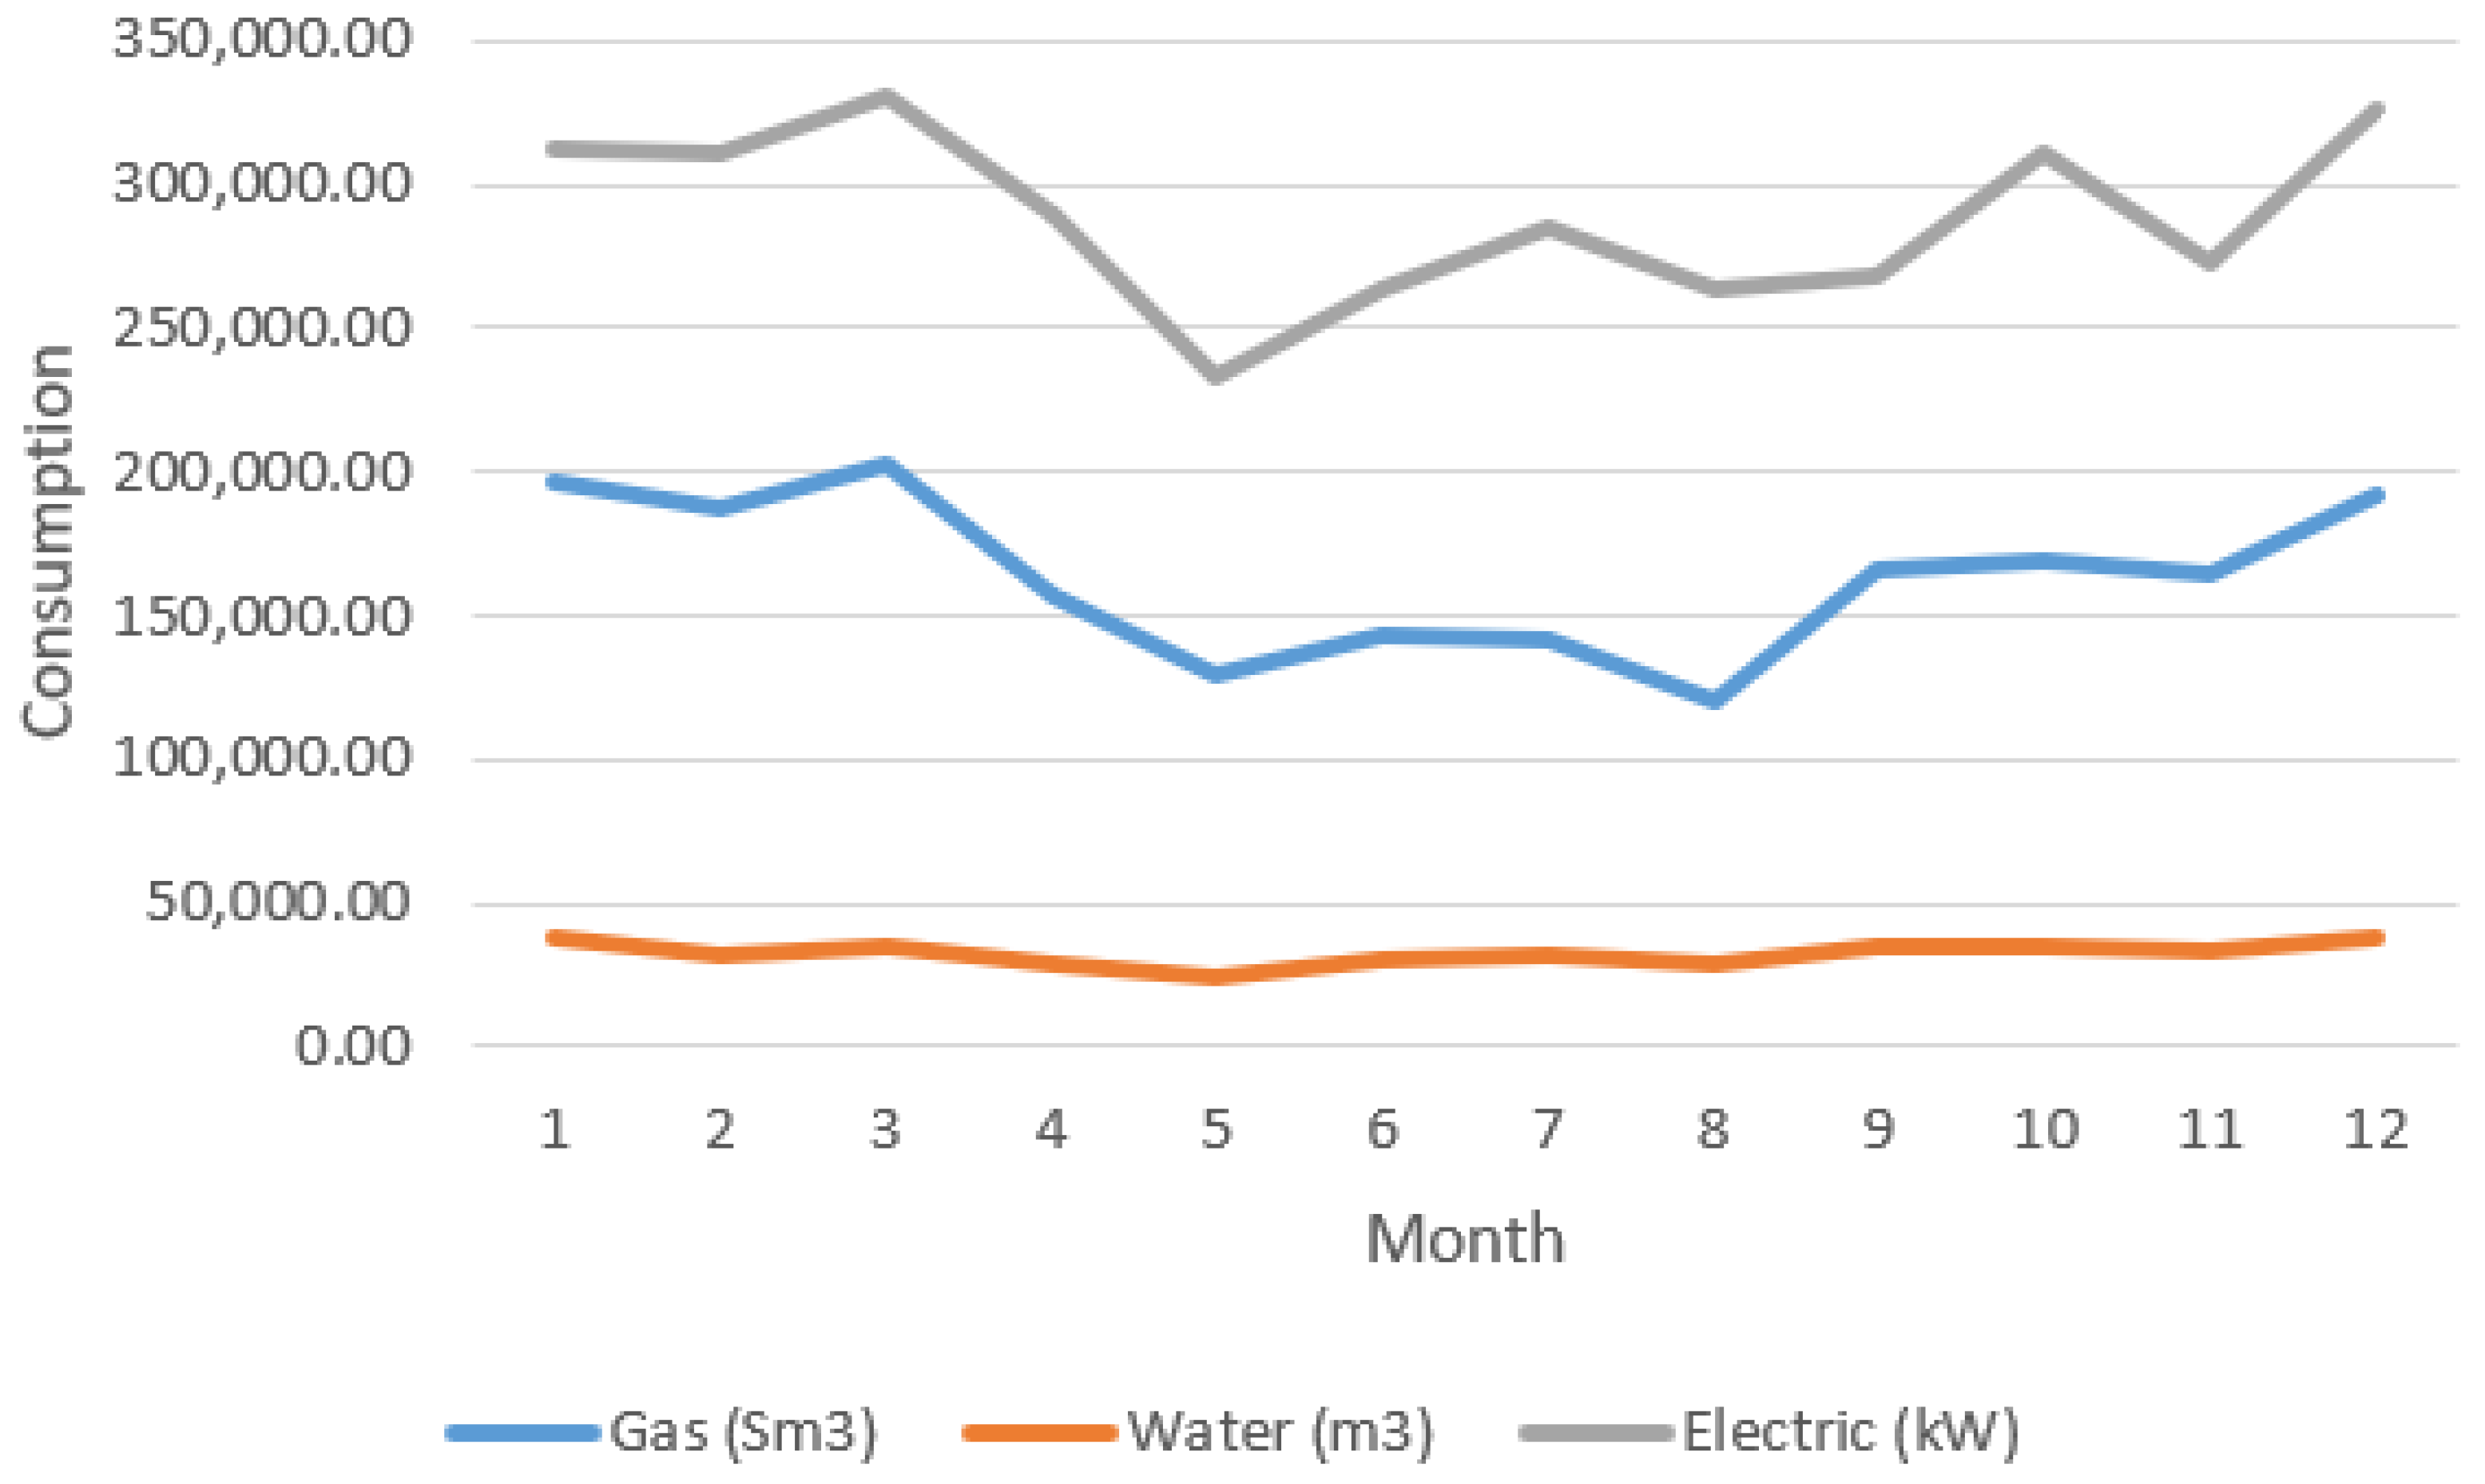
An energy data log is vital for analyzing which textile factories to prioritize through data recording, followed by production monitoring and consumption data. Essential efficiency-enhancing measures are implemented on the outcome of the latter. Exclusive examples of data for 2011 are presented in Table 1 and Table 2. The graphs of consumption values in Table 1 and Table 2 are given in Figure 2 and Figure 3.

Figure 2.
Consumption values in Table 1.

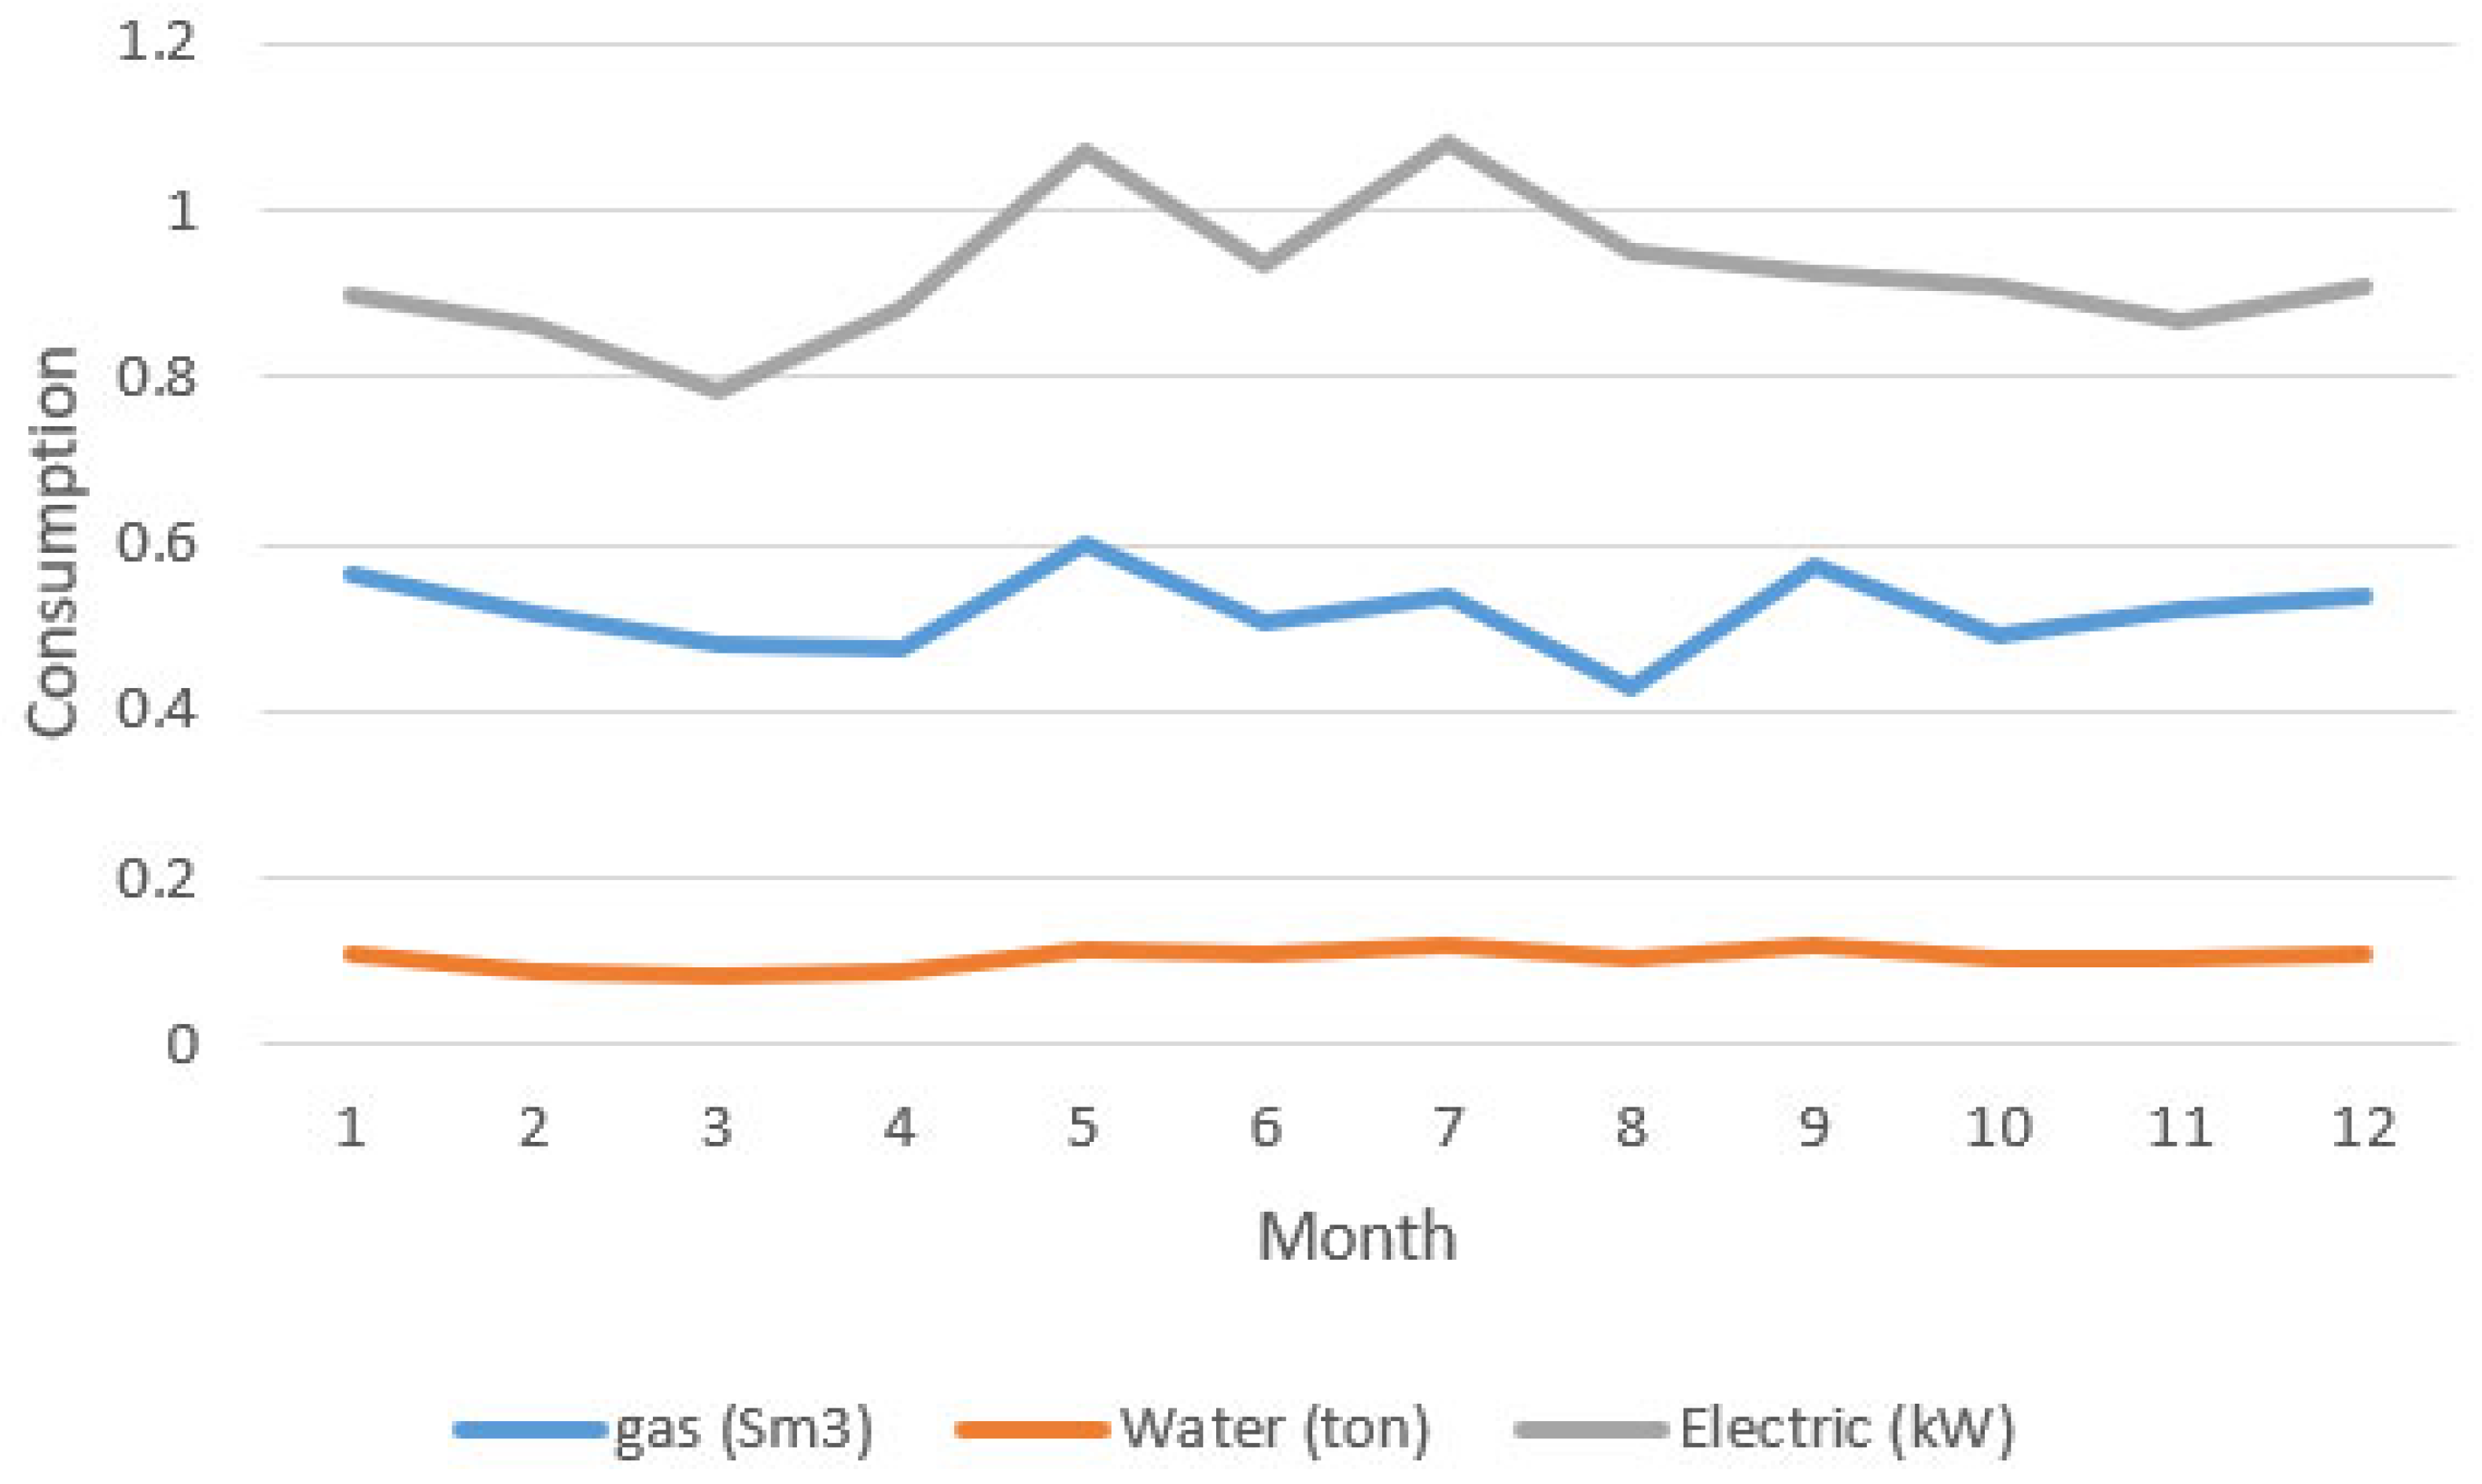
Figure 3.
Consumption values in Table 2.
2.3. Analysis of Data Using the ANN Method
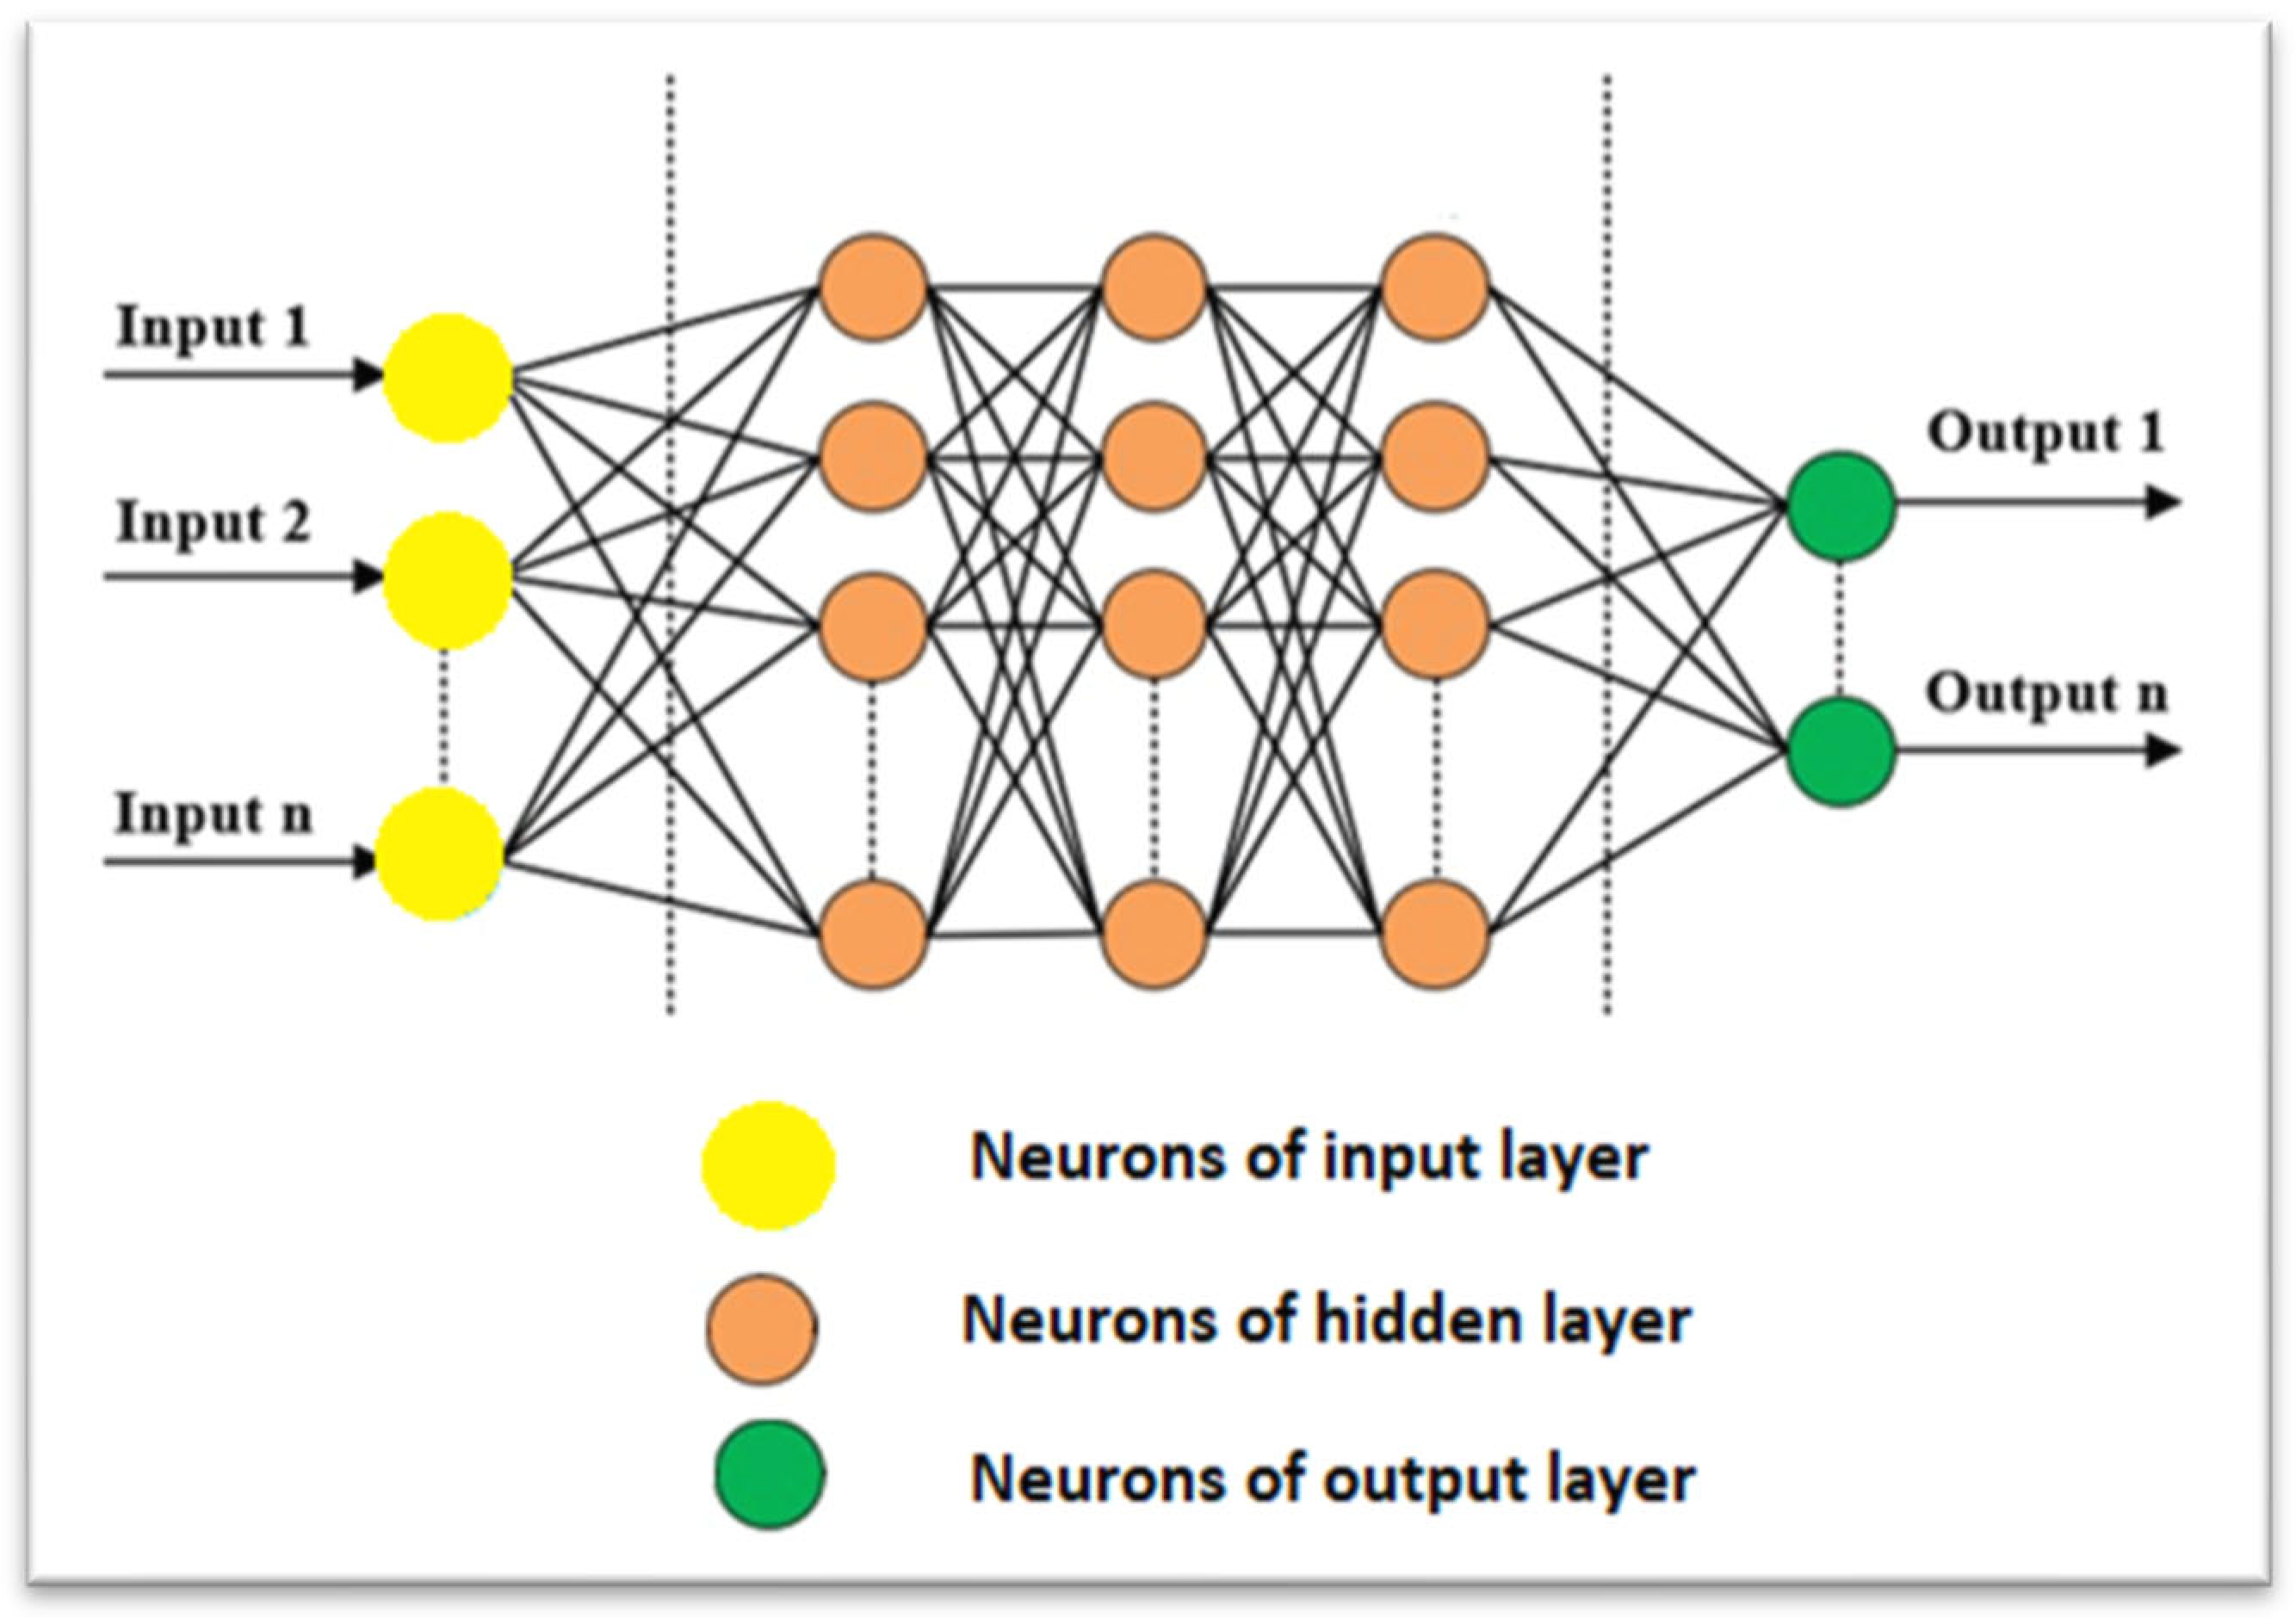
Artificial Neural Networks (ANNs) are machine learning models that mimic the neural functioning of the human brain, capable of learning complex patterns and data relationships. Fundamentally developed as an analogy of how neurons in the brain interact with each other, in recent years, scientists, researchers and decision makers have used ANN methods to predict the amount of electricity consumption in order to contribute to a cleaner environment and sustainability [33,34,35]. ANNs consist of inputs, outputs and one or more hidden layers in between, as shown in Figure 4. The input layer provides external data to the ANN, which are then transmitted to one or more hidden layers. These hidden layers perform various transformations and calculations on the data, serving the functions of feature extraction and pattern recognition. Each neuron processes the incoming data with weights and a bias value. These weights are continuously adjusted and optimized during the training process. The outputs of the neurons are generally processed by an activation function, ensuring that the output falls within a specific range. The output layer receives processed information from the hidden layers to generate final predictions or classifications. During the training process of ANNs, the weights are updated to minimize the difference between the network’s predictions and the actual values. At the end of the training process, the ANN has learned the data relationships for a specific problem and becomes capable of making predictions.

Figure 4.
The structure of an artificial neural network.
2.4. Analysis of Data Using the LSTM Method
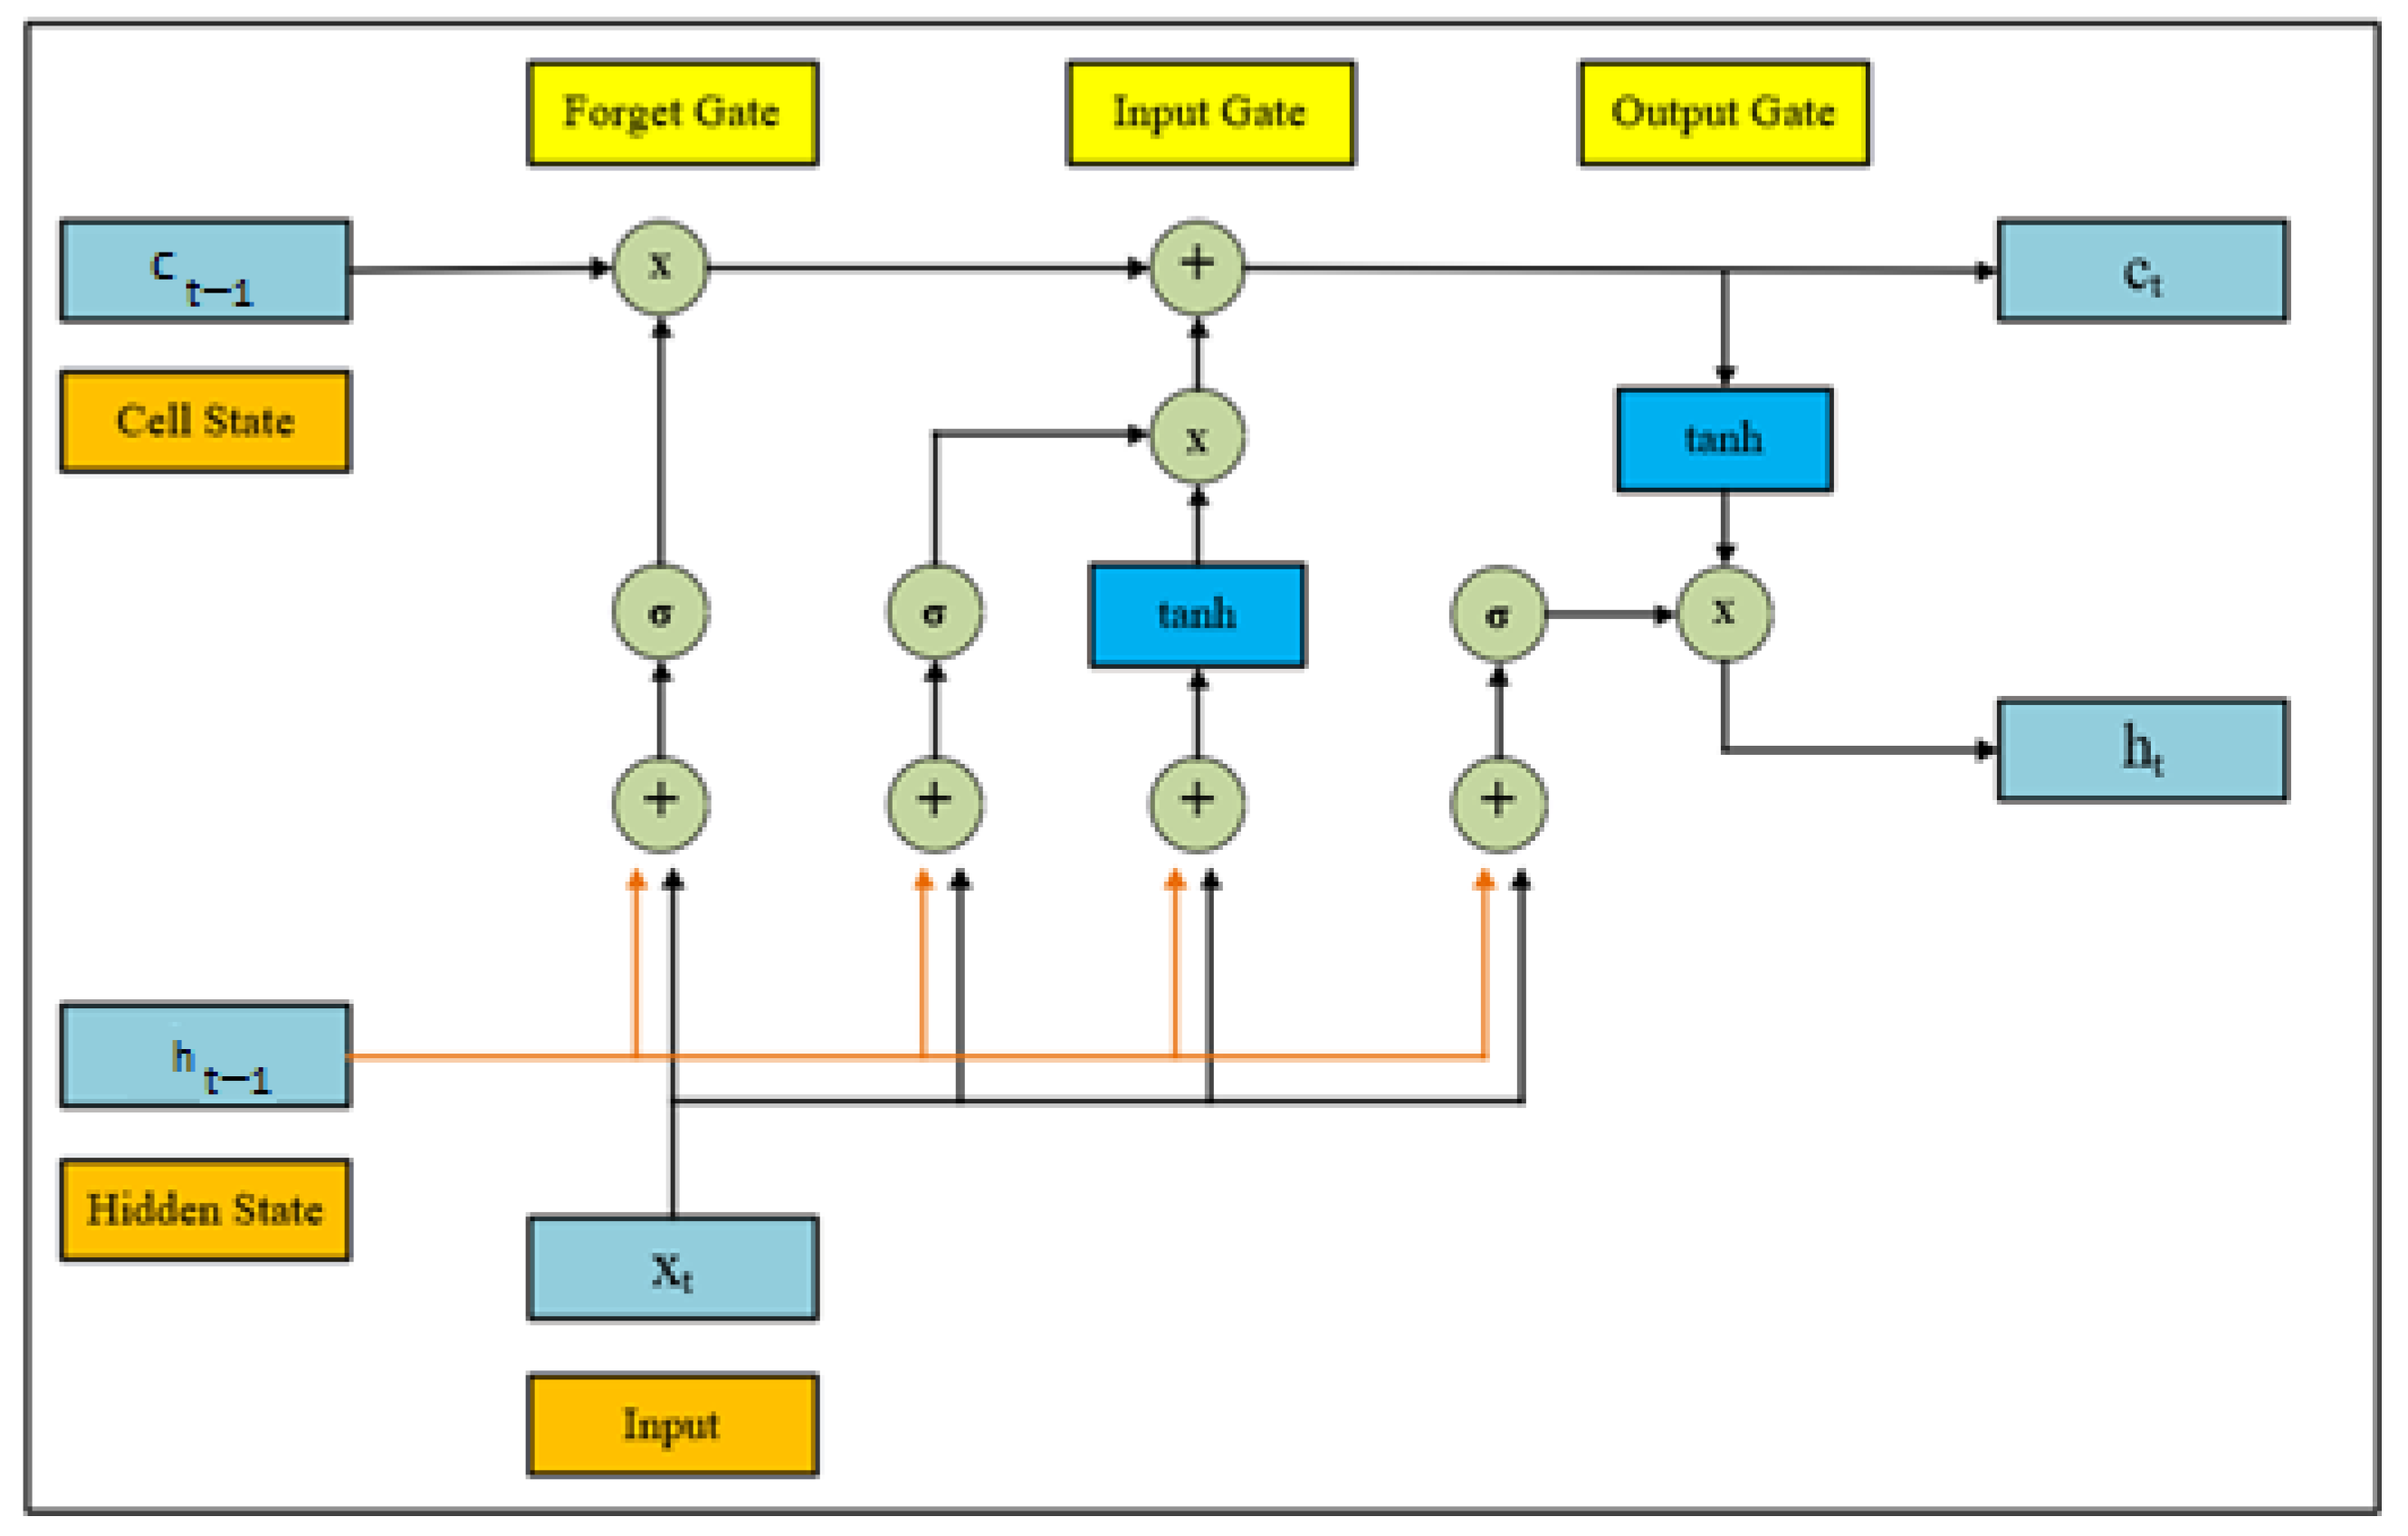
LSTM, proposed by Hochreiter and Schmid Huber for modeling time series, is a member of the Recurrent Neural Networks (RNNs) family and is specifically designed for processing sequential data. While the backpropagation mechanism used by RNN structures during computation can cause problems in error backflow, the LSTM method provides long-range dependencies. LSTMs are distinguished by their capacity to learn long-term dependencies within sequential data. This means that LSTM is particularly effective in areas like time-series data, natural language processing, and speech recognition. The LSTM appears to do well in studies using time-dependent data because of its memory for long-term dependencies [36,37,38]. The fundamental idea of LSTM is that the network can retain necessary information for a long time and forget unnecessary information. This feature solves the short-term memory problem encountered by traditional RNNs. LSTM achieves this functionality through its unique cell structure and three different gate mechanisms: the forget gate, the input gate, and the output gate.
Forget Gate: This gate determines which information from the cell’s previous state should be forgotten. This is accomplished using a sigmoid function, producing a value between 0 and 1, where 0 means completely forgetting and 1 means completely remembering.
Input Gate: This gate decides which new information needs to be added to the cell state. The new information is generated by a tanh layer and then multiplied by a sigmoid gate, which determines the degree of this information which should be added to the cell state.
Output Gate: This gate determines the output to be passed to the next layer. It involves passing the cell state through a tanh function and then through a sigmoid gate, which decides the degree of this output which should be transmitted.
The training of LSTMs is usually carried out through backpropagation, using the gradient descent algorithm. LSTMs are critical in many modern machine-learning applications, due to their ability to learn complex features of time-series data and model long-term dependencies in sequential data. Furthermore, LSTMs have an internal memory unit and gate structure to overcome RNN training challenges such as vanishing and exploding gradients. Calculating specific values is critical for the architecture to function. Let us assume the presence of variables ft for the forget gate, S for the candidate internal state, it for the input gate, ht for the memory cell state, ot for the output gate, and Ct for the internal memory of the unit. Figure 5 illustrates the structure of the LSTM Network method.

Figure 5.
The structure of the LSTM network method.
In this situation, recursive equations of the LSTM method are defined as follows: ct−1
Here:
- and are the activation functions,
- is the memory cell’s input vector at time t,
- Wi, Wc, Wo, Wf, Uc, Ui, Uf, Uo, and Vo are weights of the neural network.
- bf, bc, bi, and bo are biases.
In addition,
The equations for the gates that enable the LSTM to remember historical features for deep learning, especially when working with time-series or sequential data, are given in Equations (1)–(7). Equation (1) is the signal from the forget gate, Equation (3) is the signal from the input gate and Equation (6) is the signal from the output gate. Equation (4) shows the cell state. As seen above, the LSTM and ANN methods share many common areas of application. The advantages of the (LSTM) method over (ANN) become particularly evident when working with sequential and time-series data. These advantages demonstrate that LSTM is superior, particularly in processing complex sequential data sets and modeling time-varying dynamics, compared to ANNs. However, both methods have their application areas and advantages, and the choice depends on the specific problem definition and data structure.
3. Results and Discussion
The yarn dyeing process affects both quality and competitiveness, and the optimization of processes and layouts in facilities plays a significant role. Layout and process optimization in yarn dyeing facilities involve several factors. Firstly, the physical arrangement of the facility should be considered. Different machines and equipment are used during yarn dyeing, bobbin dyeing, and hank dyeing processes. Proper placement of these machines and equipment speeds up the processes and optimizes energy use. Worker safety and ergonomics must also be considered, as a comfortable working environment can increase productivity.
Another critical aspect of layout and process optimization in yarn dyeing facilities is the management of material flow. How yarns are transported before and after dyeing can greatly impact the design of the facility. If material flow is not optimized, processes can be disrupted, and production efficiency can decrease. Additionally, layout and process optimization in yarn dyeing facilities include creating the necessary infrastructure for workers to work effectively. An appropriate arrangement is required for workers to easily access yarns and effectively communicate with machines. This allows operators to perform their jobs more efficiently. Layout optimization also has the potential to save costs. More efficient material flow and energy usage reduce operating costs while increasing worker productivity, thereby reducing labor costs [39].
Proper layout and material flow management improve production processes and reduce costs. It also allows for the production of higher-quality products by increasing worker efficiency. Therefore, layout optimization should be given significant importance in the design and operation of yarn dyeing facilities. Considering these reasons, a dyeing facility of a factory producing for the four critical markets of the textile sector—carpet, home textiles, knitwear, and hand knitting—has been examined. In this facility, yarns are dyed in bobbin, vat hank, arm hank, and gradient dyeing styles, and the workflow is created depending on the order and process. The workflow diagram that has been created lays the foundation for analyzing the production operations and material flow process of the enterprise. Following the creation of the workflow diagram to enhance efficiency through optimizing the layout plan, the current machine layout plan has been drafted as shown in Figure 6.

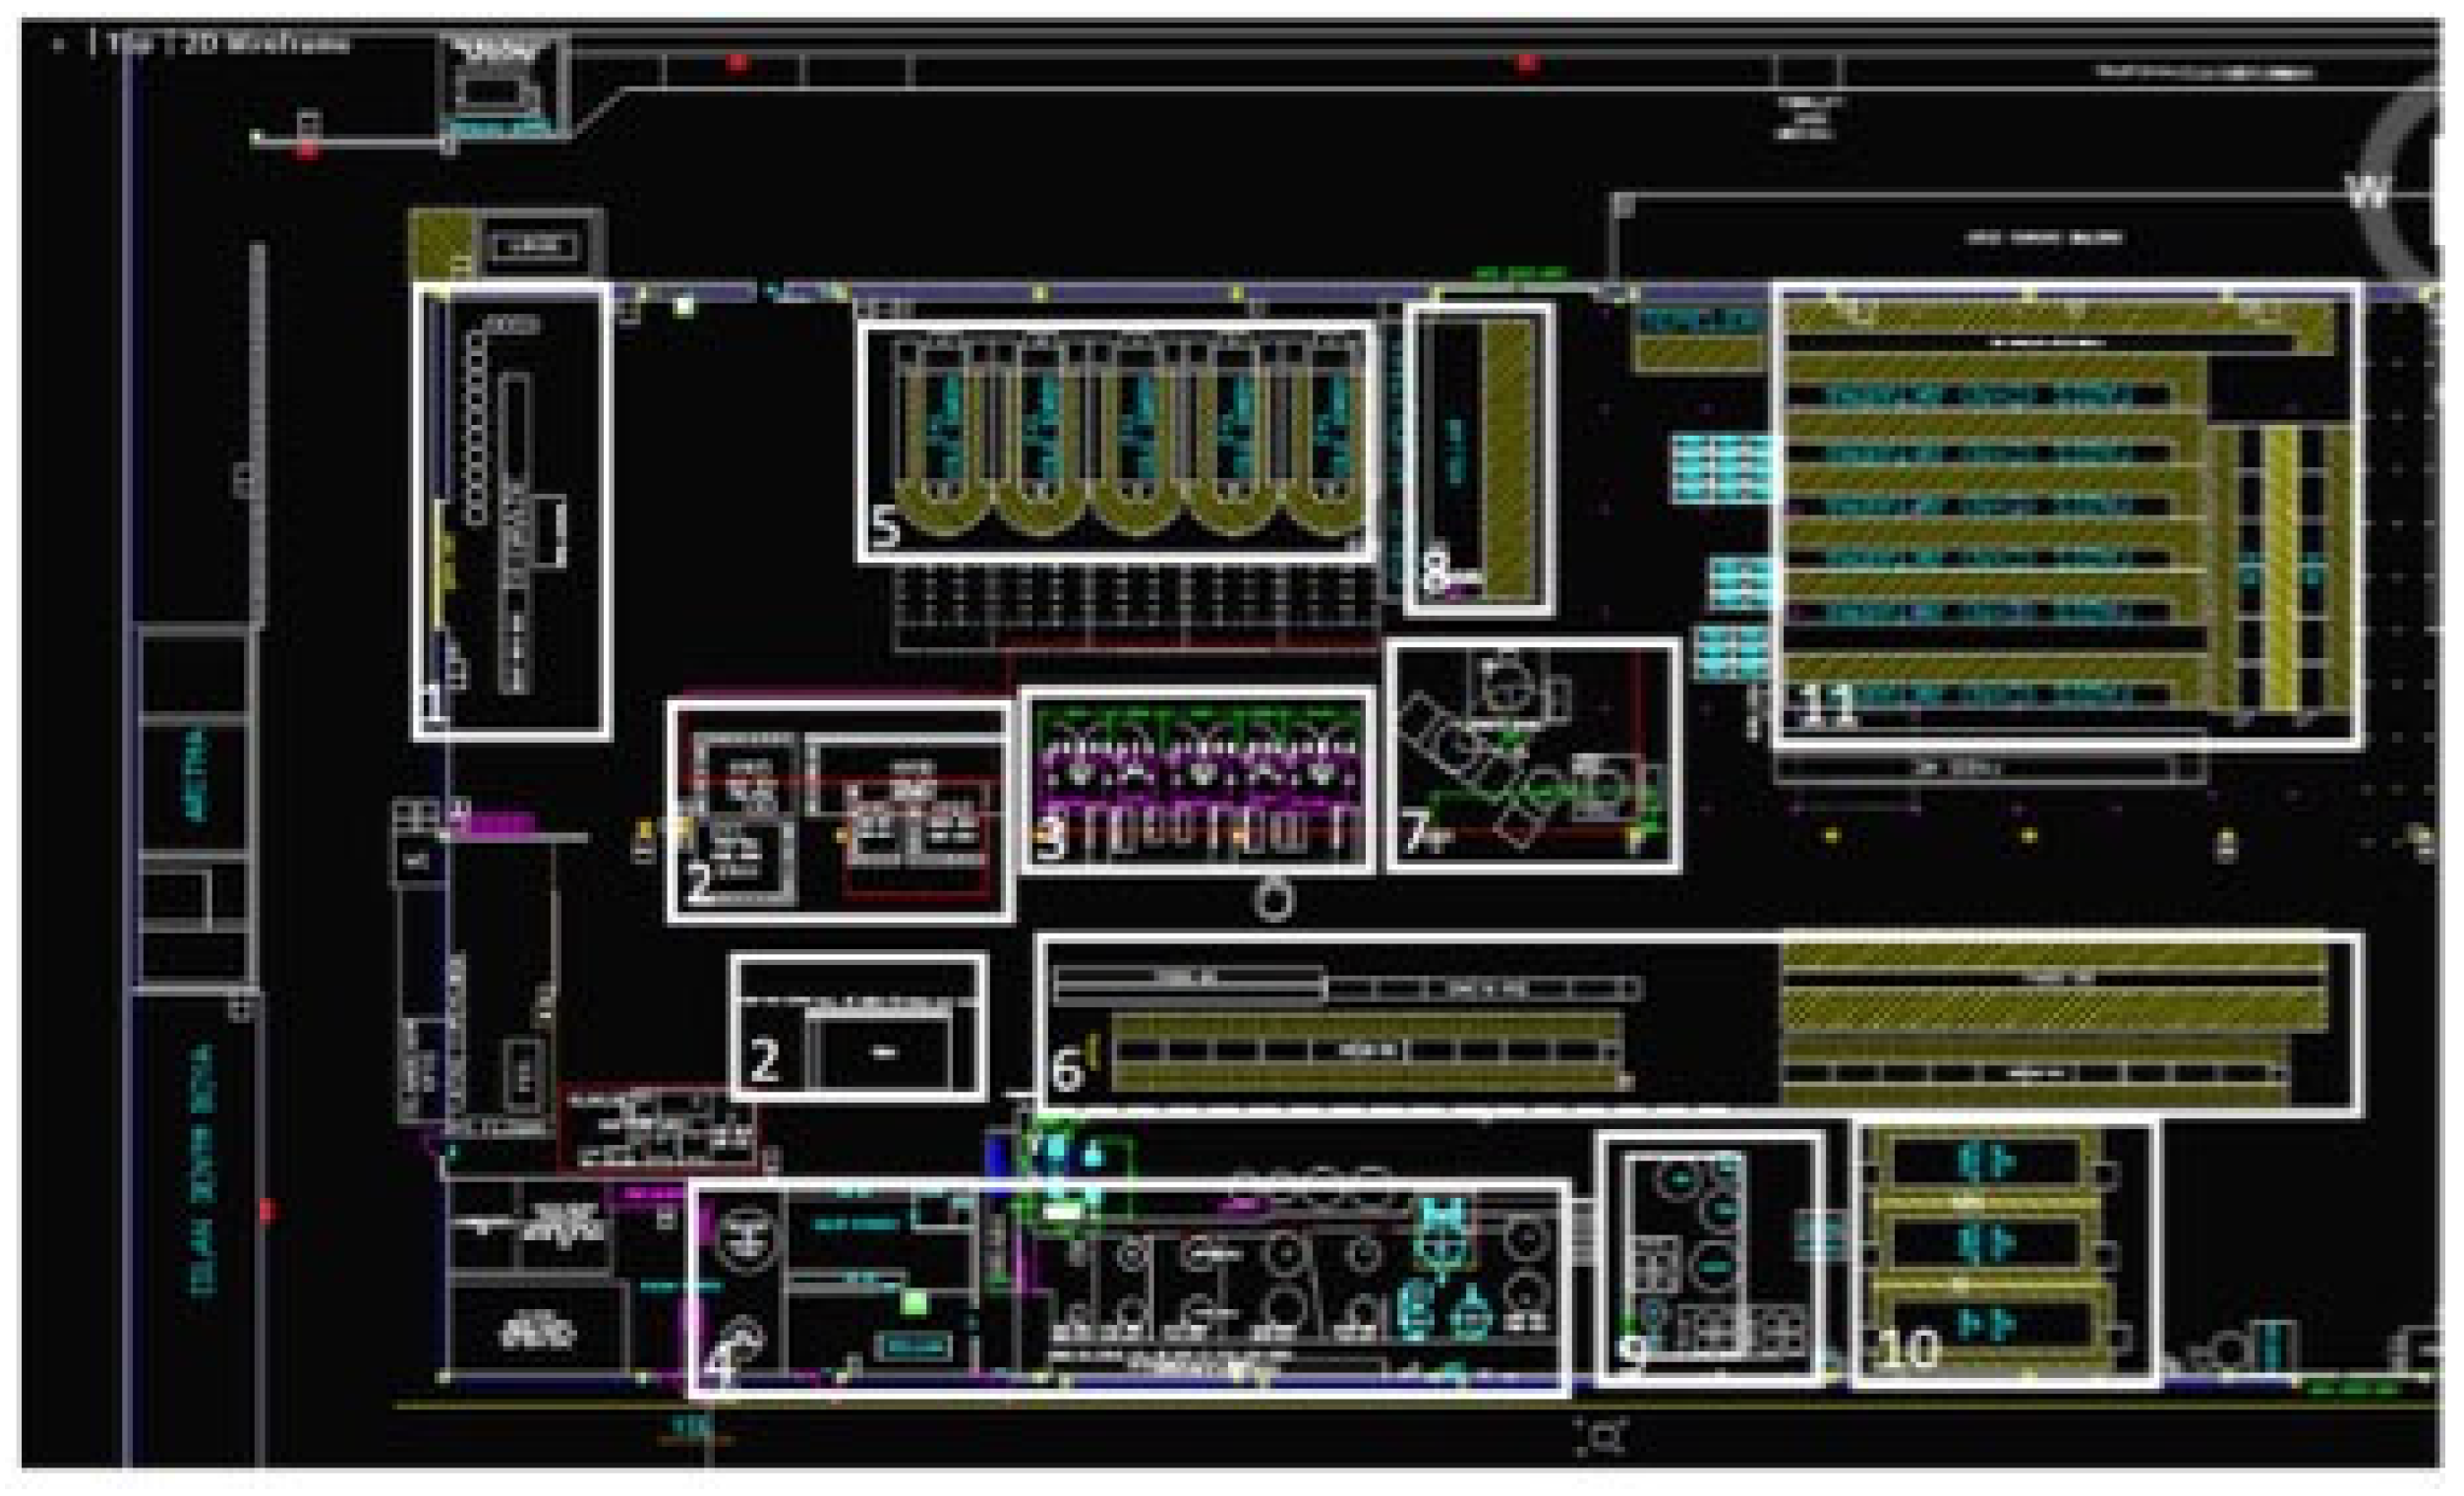
Figure 6.
UT1 current layout plan.
The created workflow diagram provides a basis for analyzing the production operations and material flow process of the enterprise. Following the workflow diagram to increase efficiency, the current machine layout is designed as shown in Figure 6. An abbreviation table is also presented in Table 3, to increase the understandability of Figure 6.
Table 3.
Descriptions of the regions given in Figure 6.
Since the company has the machines produced according to its own needs on a project basis, it determines the names itself (such as KM5, KM10). Detailed explanations about these devices, and information about which diagram they are in in Figure 6, are given in Table 4.
Table 4.
An abbreviation table for the devices in Figure 6.
In the layout plan, we see the gradient dyeing machine, arm hank dyeing machines, vat hank dyeing machines, bobbin dyeing vats, hank reeling machines, soft winders, hank extractors excess-water extractor, hank drying machines, bobbin extractors excess-water extractor, bobbin drying machines, and commercial winders.
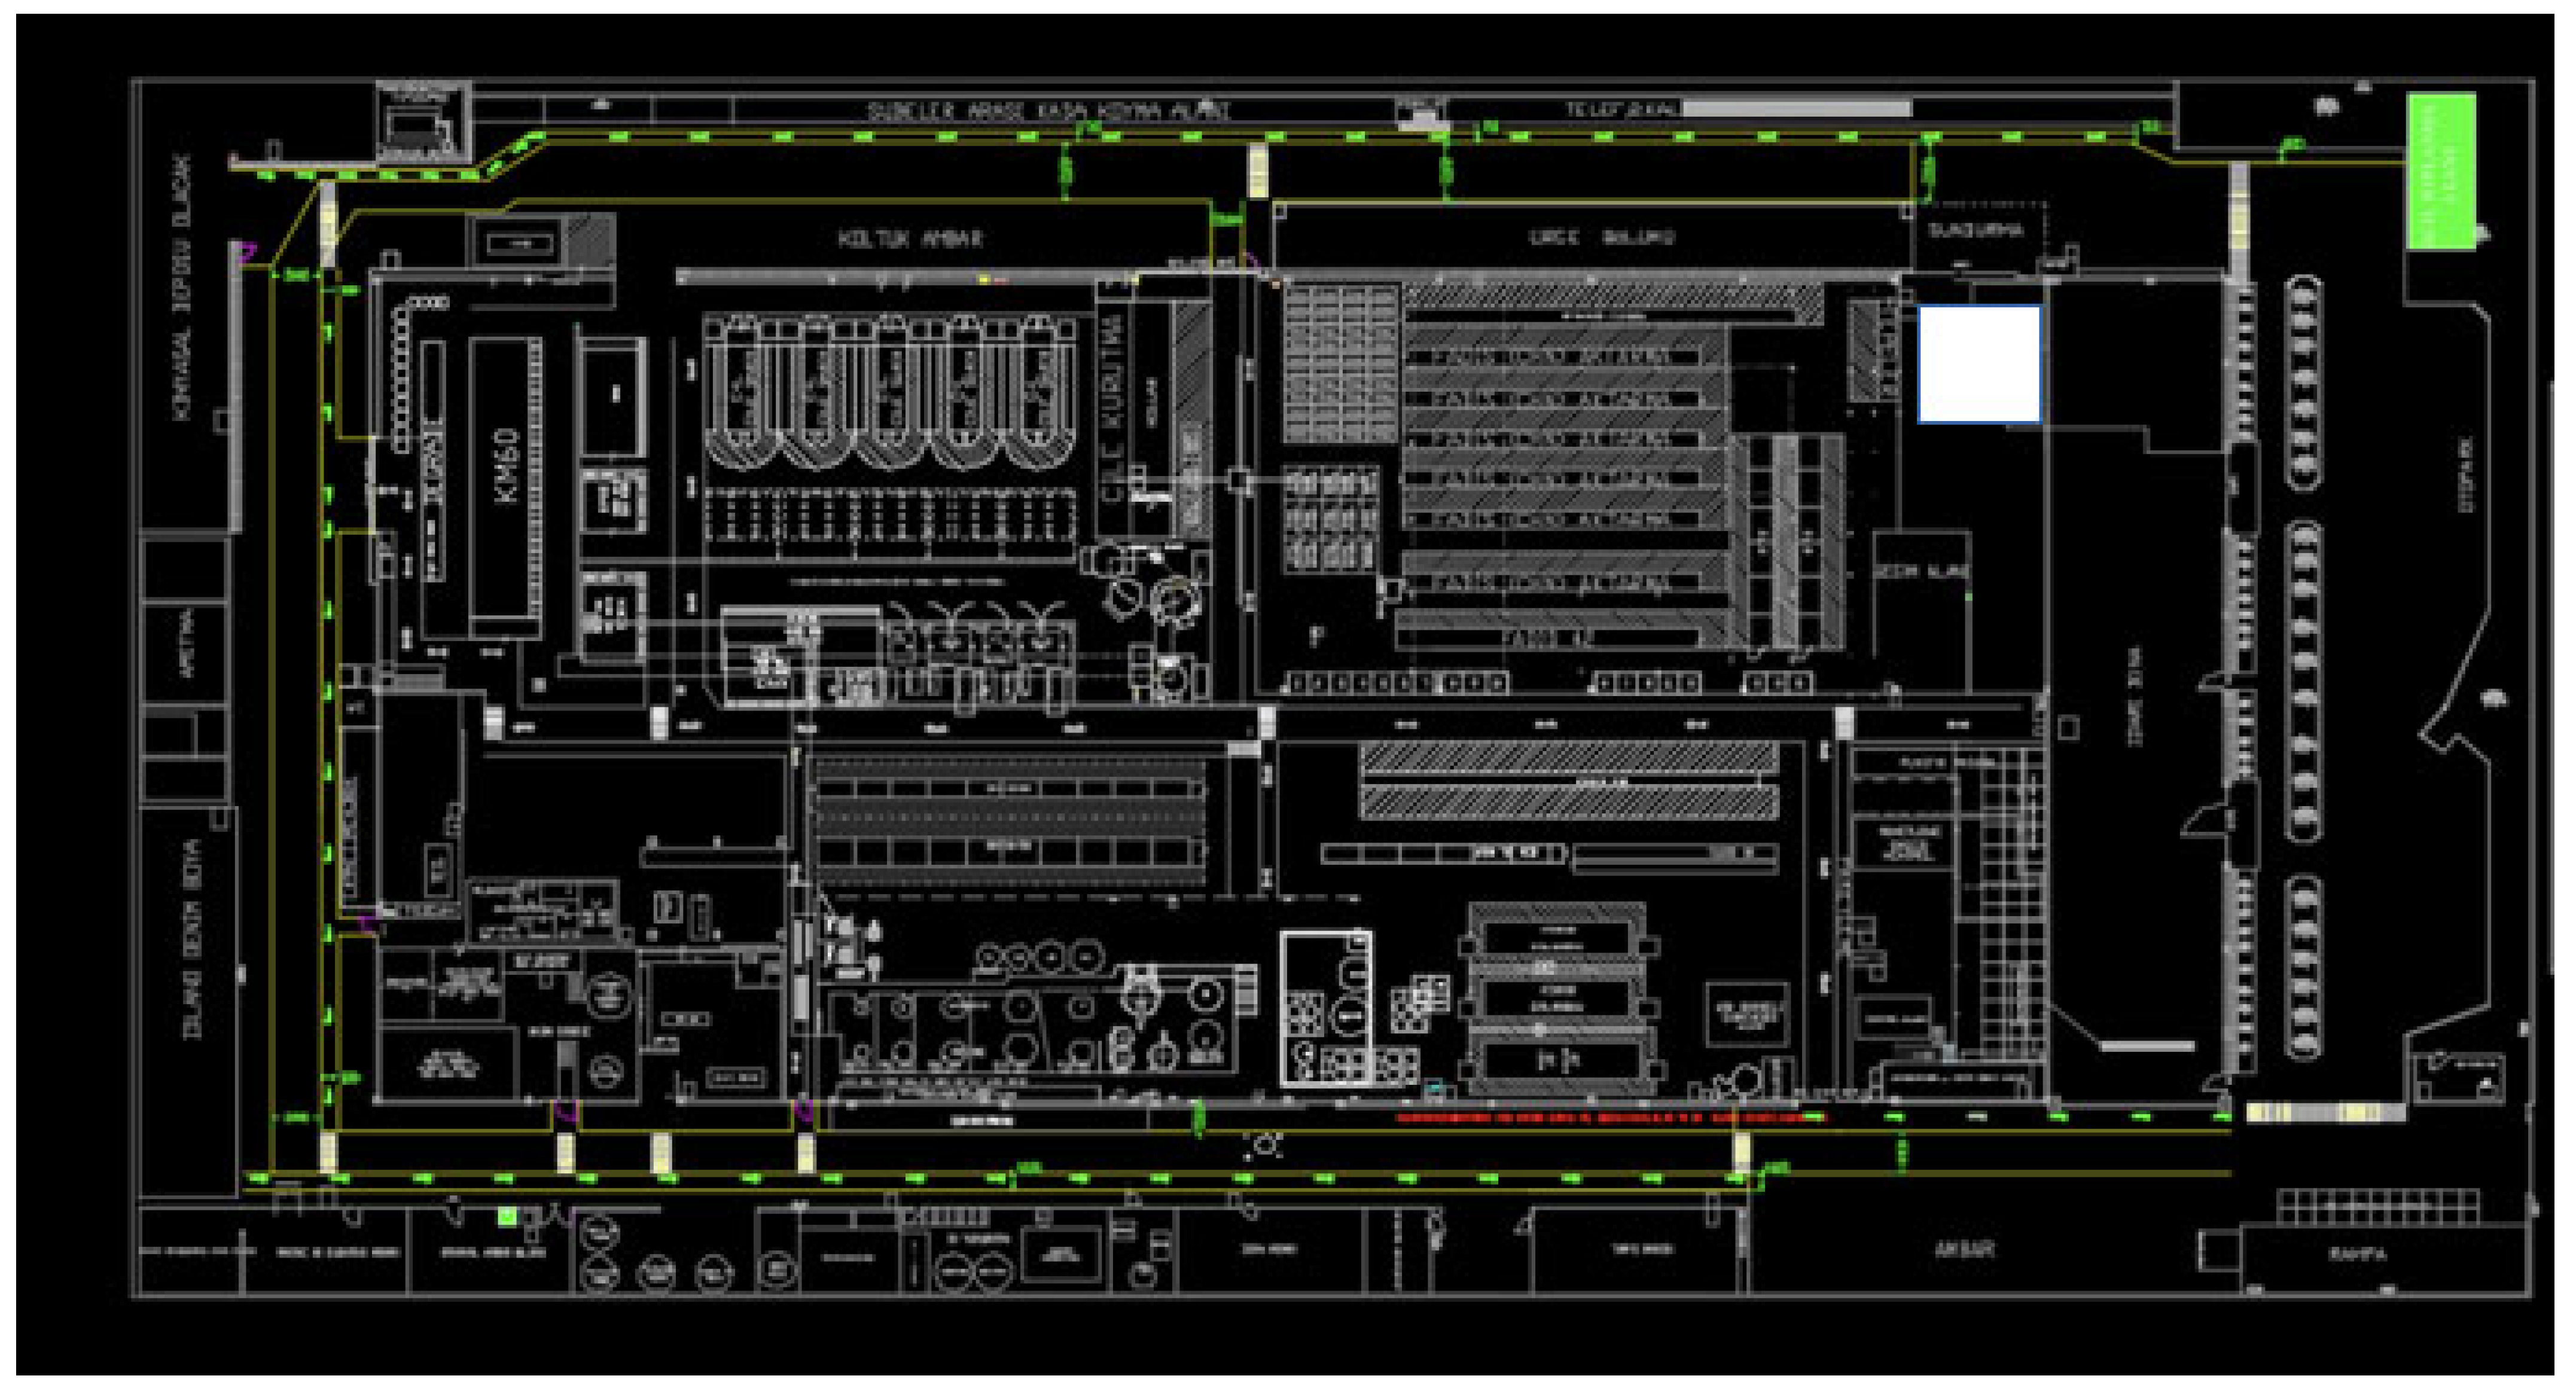
As depicted in Figure 7, a process-oriented Spaghetti diagram was generated through the development of a machine layout plan. This diagram serves to visualize procedures and movements, conduct process analysis, optimize routes, and conceptualize the placement of workers and equipment. The arm hank machines KM10, KM15, and KM20 have been installed parallel to the KM60 machine, consolidating the arm dyeing line in a single area. This has shortened the distance traveled by machine operators, along with hank carriers. Space has been made available by relocating the KM20 machine, either for a new machine or for storage purposes. Following the spaghetti diagram, a new machine, the KM60 arm hank dyeing machine, has been suitably placed in the production line, and the production quantity of arm hank machines has been increased by 70% with the new machine. The hank excess-water extractors have been repositioned closer to the hank dyeing line and aligned to ensure continuous and uninterrupted emergency exits. The soft winding machines forming the soft winding line have been placed parallel to each other for more effective use. Additionally, the diagram and studies conducted have identified bottlenecks causing delays and extended lead times in the production line. One such bottleneck, the bobbin-squeezing line, has been addressed by acquiring a new machine and increasing the number of squeezing arms from 108 to 172, appropriately integrating it into the production line. In Figure 6, the condition of the enterprise before the correction is shown and, in the boxes, there is information about which machinery and equipment are located in the areas. In Figure 7, after the improvement made from the same machinery and equipment, only the changed ones are changed in the drawing, and the aim is to show the areas gained. In Figure 8, the aim is to indicate that after the layout revision, the equipment that creates problems in the emergency escape points and routes in the enterprise has been removed, and the external escape routes are easily provided. Gained spaces are indicated by the white box in Figure 7 and Figure 8.

Figure 7.
UT1 new layout plan.

Figure 8.
UT1 production outer-ring-road plan.
Taking into consideration the production conditions and the working areas of the staff, a layout plan has been developed that includes internal routes directly leading to emergency exits. Additionally, as shown in Figure 8, external perimeter routes have been established to facilitate the safe evacuation of personnel to the emergency assembly areas marked in green. Storage areas have also been delineated and restricted. Furthermore, as part of the project, a needs assessment was carried out for the packaging section. A platform capable of holding up to 48 pallets, with a stacking capacity of up to 3 m, was designed and installed. This setup allows the packaging unit’s supplies to be conveniently placed in the current location, reducing personnel movement. Additionally, a storage space for supplies was established, resulting in a 60% increase in capacity.
Considering these factors, the rapid changes in electricity consumption, the high unit cost of electricity, and our partial dependence on external sources for electricity production have made electricity the most significant factor affecting competitive strength in the market. When examining the cost per kilogram of yarn, the primary factor in reducing costs has been identified as electricity. Upon calculating the randomly selected peak data from the year 2020 in the factory, the electricity and natural gas consumption amounts and their costs are as stated above. The electricity consumption constitutes 22.34%, while natural gas consumption accounts for 77.66%. In terms of cost, electricity represents 43.25% and natural gas comprises 56.75%.
Similarly, when looking at the Table 5 average values for the years 2018–2020, electricity accounts for 24%, while natural gas is 76%. In terms of cost, the figures are 43% for electricity and 57% for natural gas. As can be seen, in terms of factory costs, electricity is a more significant factor, compared to natural gas. As is evident in the literature, the importance of climate change and the carbon footprint is increasingly recognized, especially in the industrial sector, where energy consumption is most intense. Necessary studies should be conducted in this area. Firms should engage in research and development, execute national and international projects, and collaborate within the university–industry framework, aiming to reduce the per-unit electricity consumption. In the textile industry, while purchasing decisions were based on product price and quality in previous years, nowadays the capability to produce within the framework of social compliance is prioritized. One of the most important aspects of this approach is reducing the amount of energy and water consumed per unit. Additionally, with the signing of the Paris Agreement, the management of the climate change regime and the significance of the carbon footprint have become even more crucial. In our country, as of 1 October 2023, necessary limitations and tax liabilities have been introduced for companies in iron steel, cement, electricity, and hydrogen production. Similar restrictions and tax liabilities are expected in the textile sector in the coming years. Considering all these results, analyzing and forecasting electricity data and conducting improvement studies based on these forecasts are of great importance. In this paper, ANN (Artificial Neural Network) and LSTM (Long Short-Term Memory) models implemented using MATLAB are used. Therefore, the use of MATLAB, ANN, and LSTM methods was applied where electricity consumption data from 2015 to 2021 were used as the training set, and the data for 2022 were used as the test set [40].
Table 5.
Energy consumption and cost information in 2020.
The data have been analyzed to estimate electricity usage in kWh, which is influenced by production-related increases and affects carbon emission values. This estimation was conducted using the LSTM method, and the results have been compared using the ANN method. The employed Artificial Neural Network architecture is a three-input, one-output forward-fed model. The inputs used are total dyeing quantity, chemical and dyestuff amount, and the quantity of water used per kilogram of yarn. These values were utilized to generate an estimate of electricity usage at the output. The estimated electricity consumption will inform future consumption data and potential improvement projects that can be implemented.
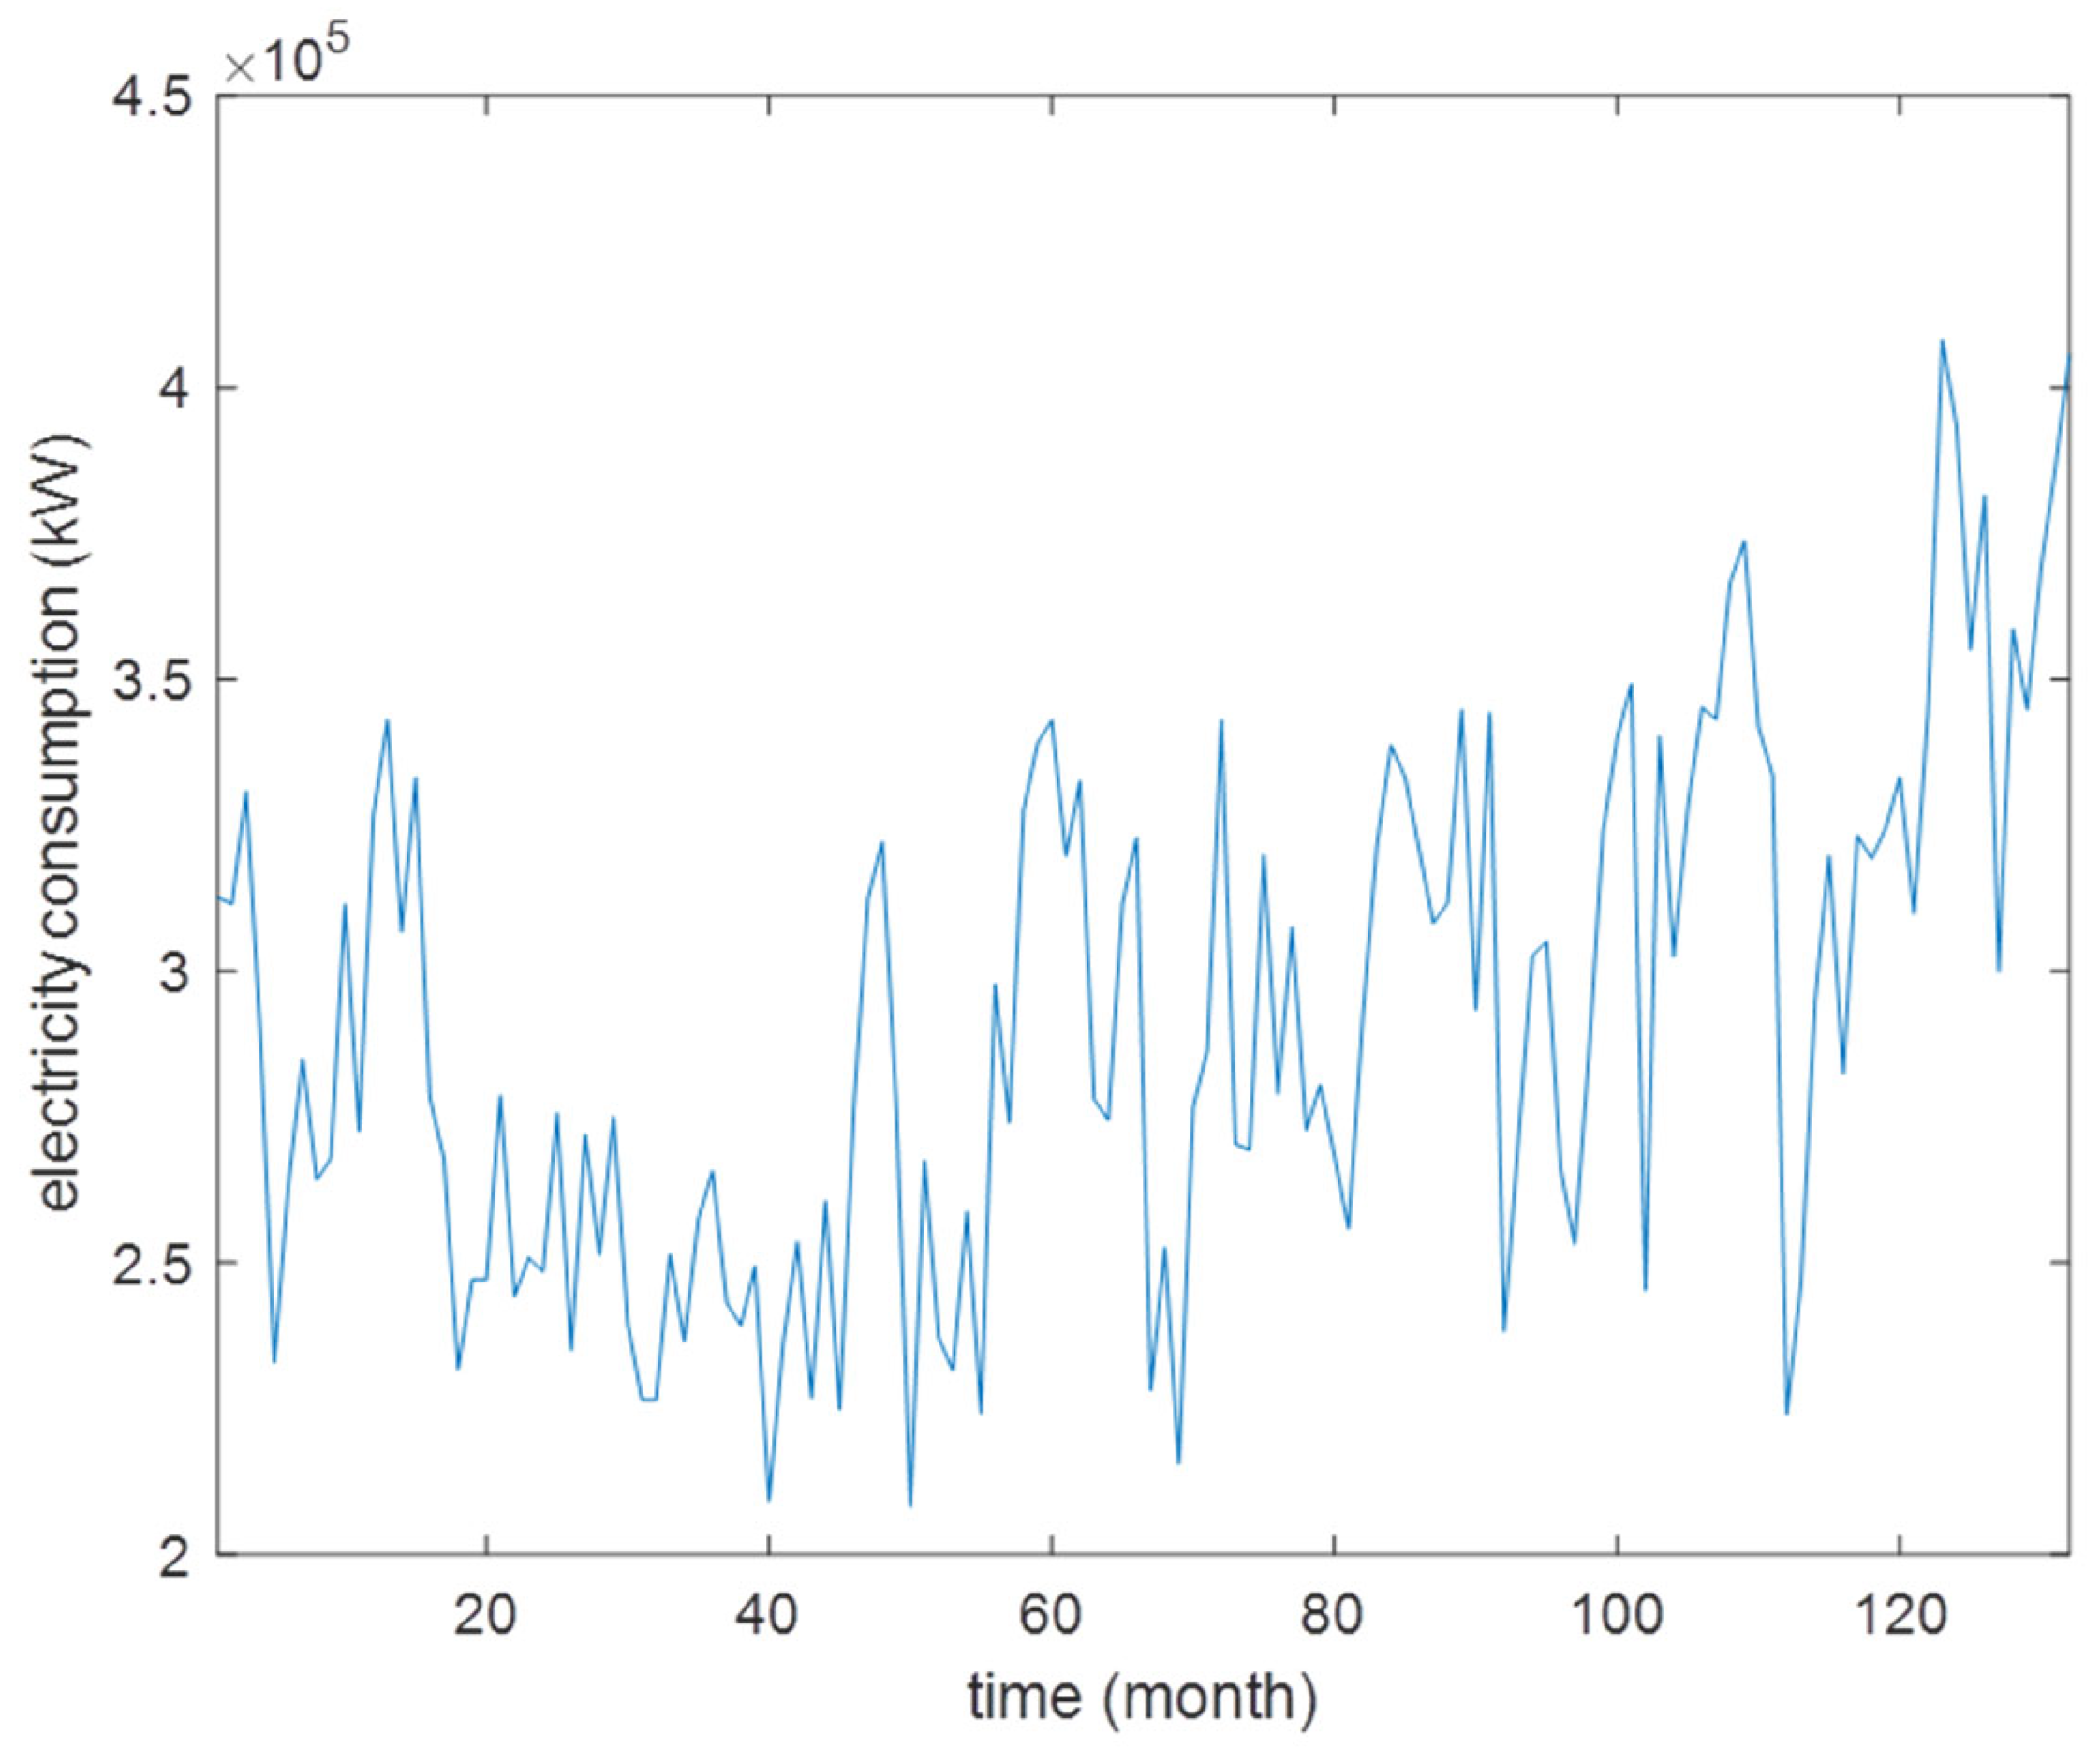
The data used in the training phase are presented in Figure 9. The data illustrated in this diagram have been commonly used in both ANN and LSTM methods. The graph contains monthly electricity consumption data for a period of 120 months. These data are obtained from invoices and have been verified for accuracy.
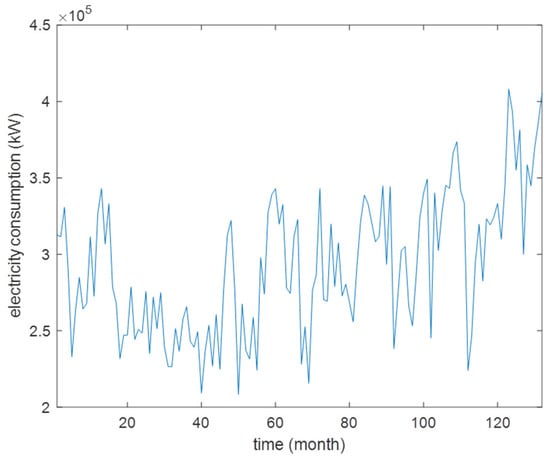
Figure 9.
Electricity consumption data used in the training phase of forecasting methods (2015–2021).
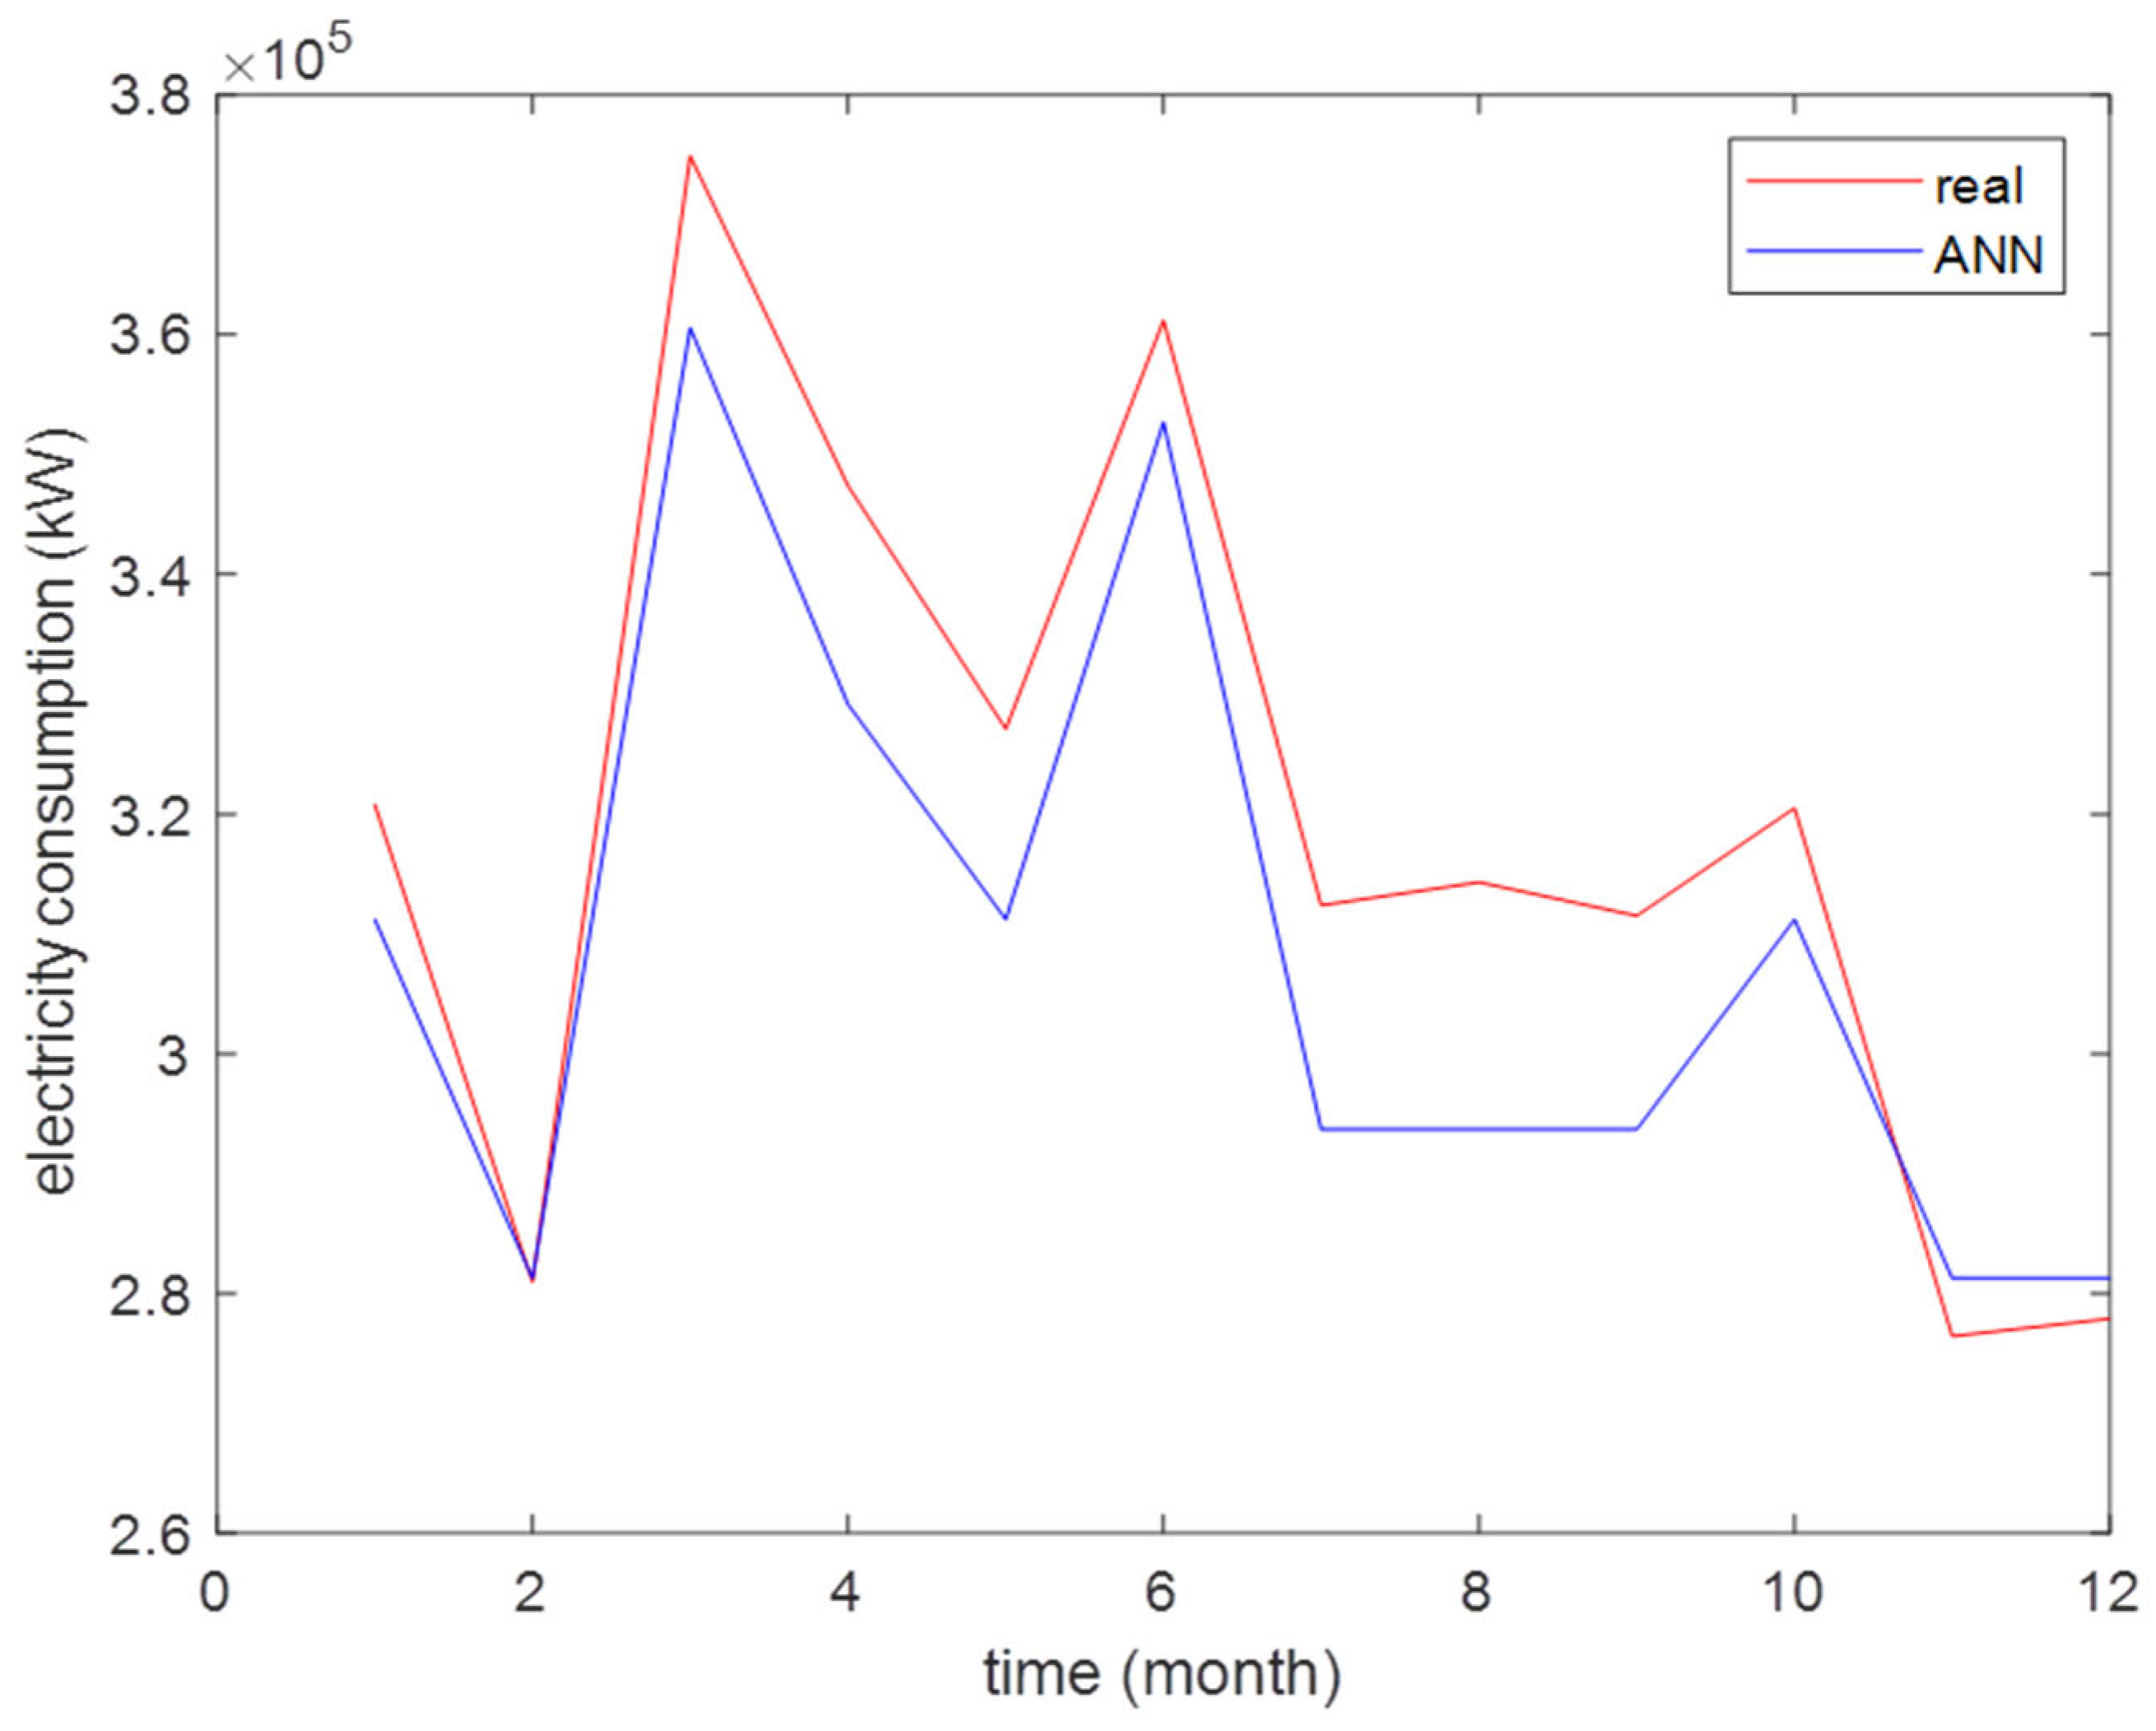
The results obtained from the ANN method are shown in Figure 10. In the graph, the curve represented in red indicates the actual consumption values for the year 2022. The curve depicted in blue represents the predicted values for 2022 as forecasted by the ANN method. Upon examining the results, it is observed that, despite the high error value in the first curve, there is a tendency to capture the actual value at peak points.
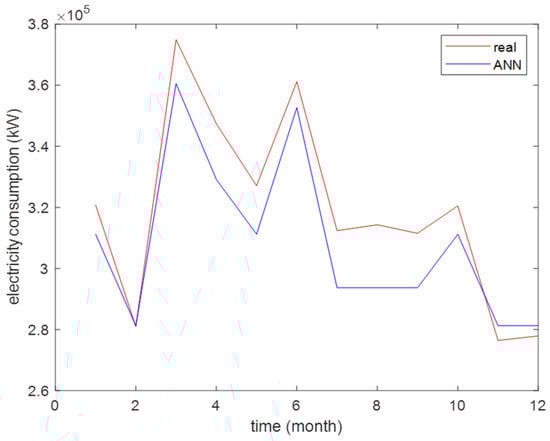
Figure 10.
ANN prediction on the testing data set.
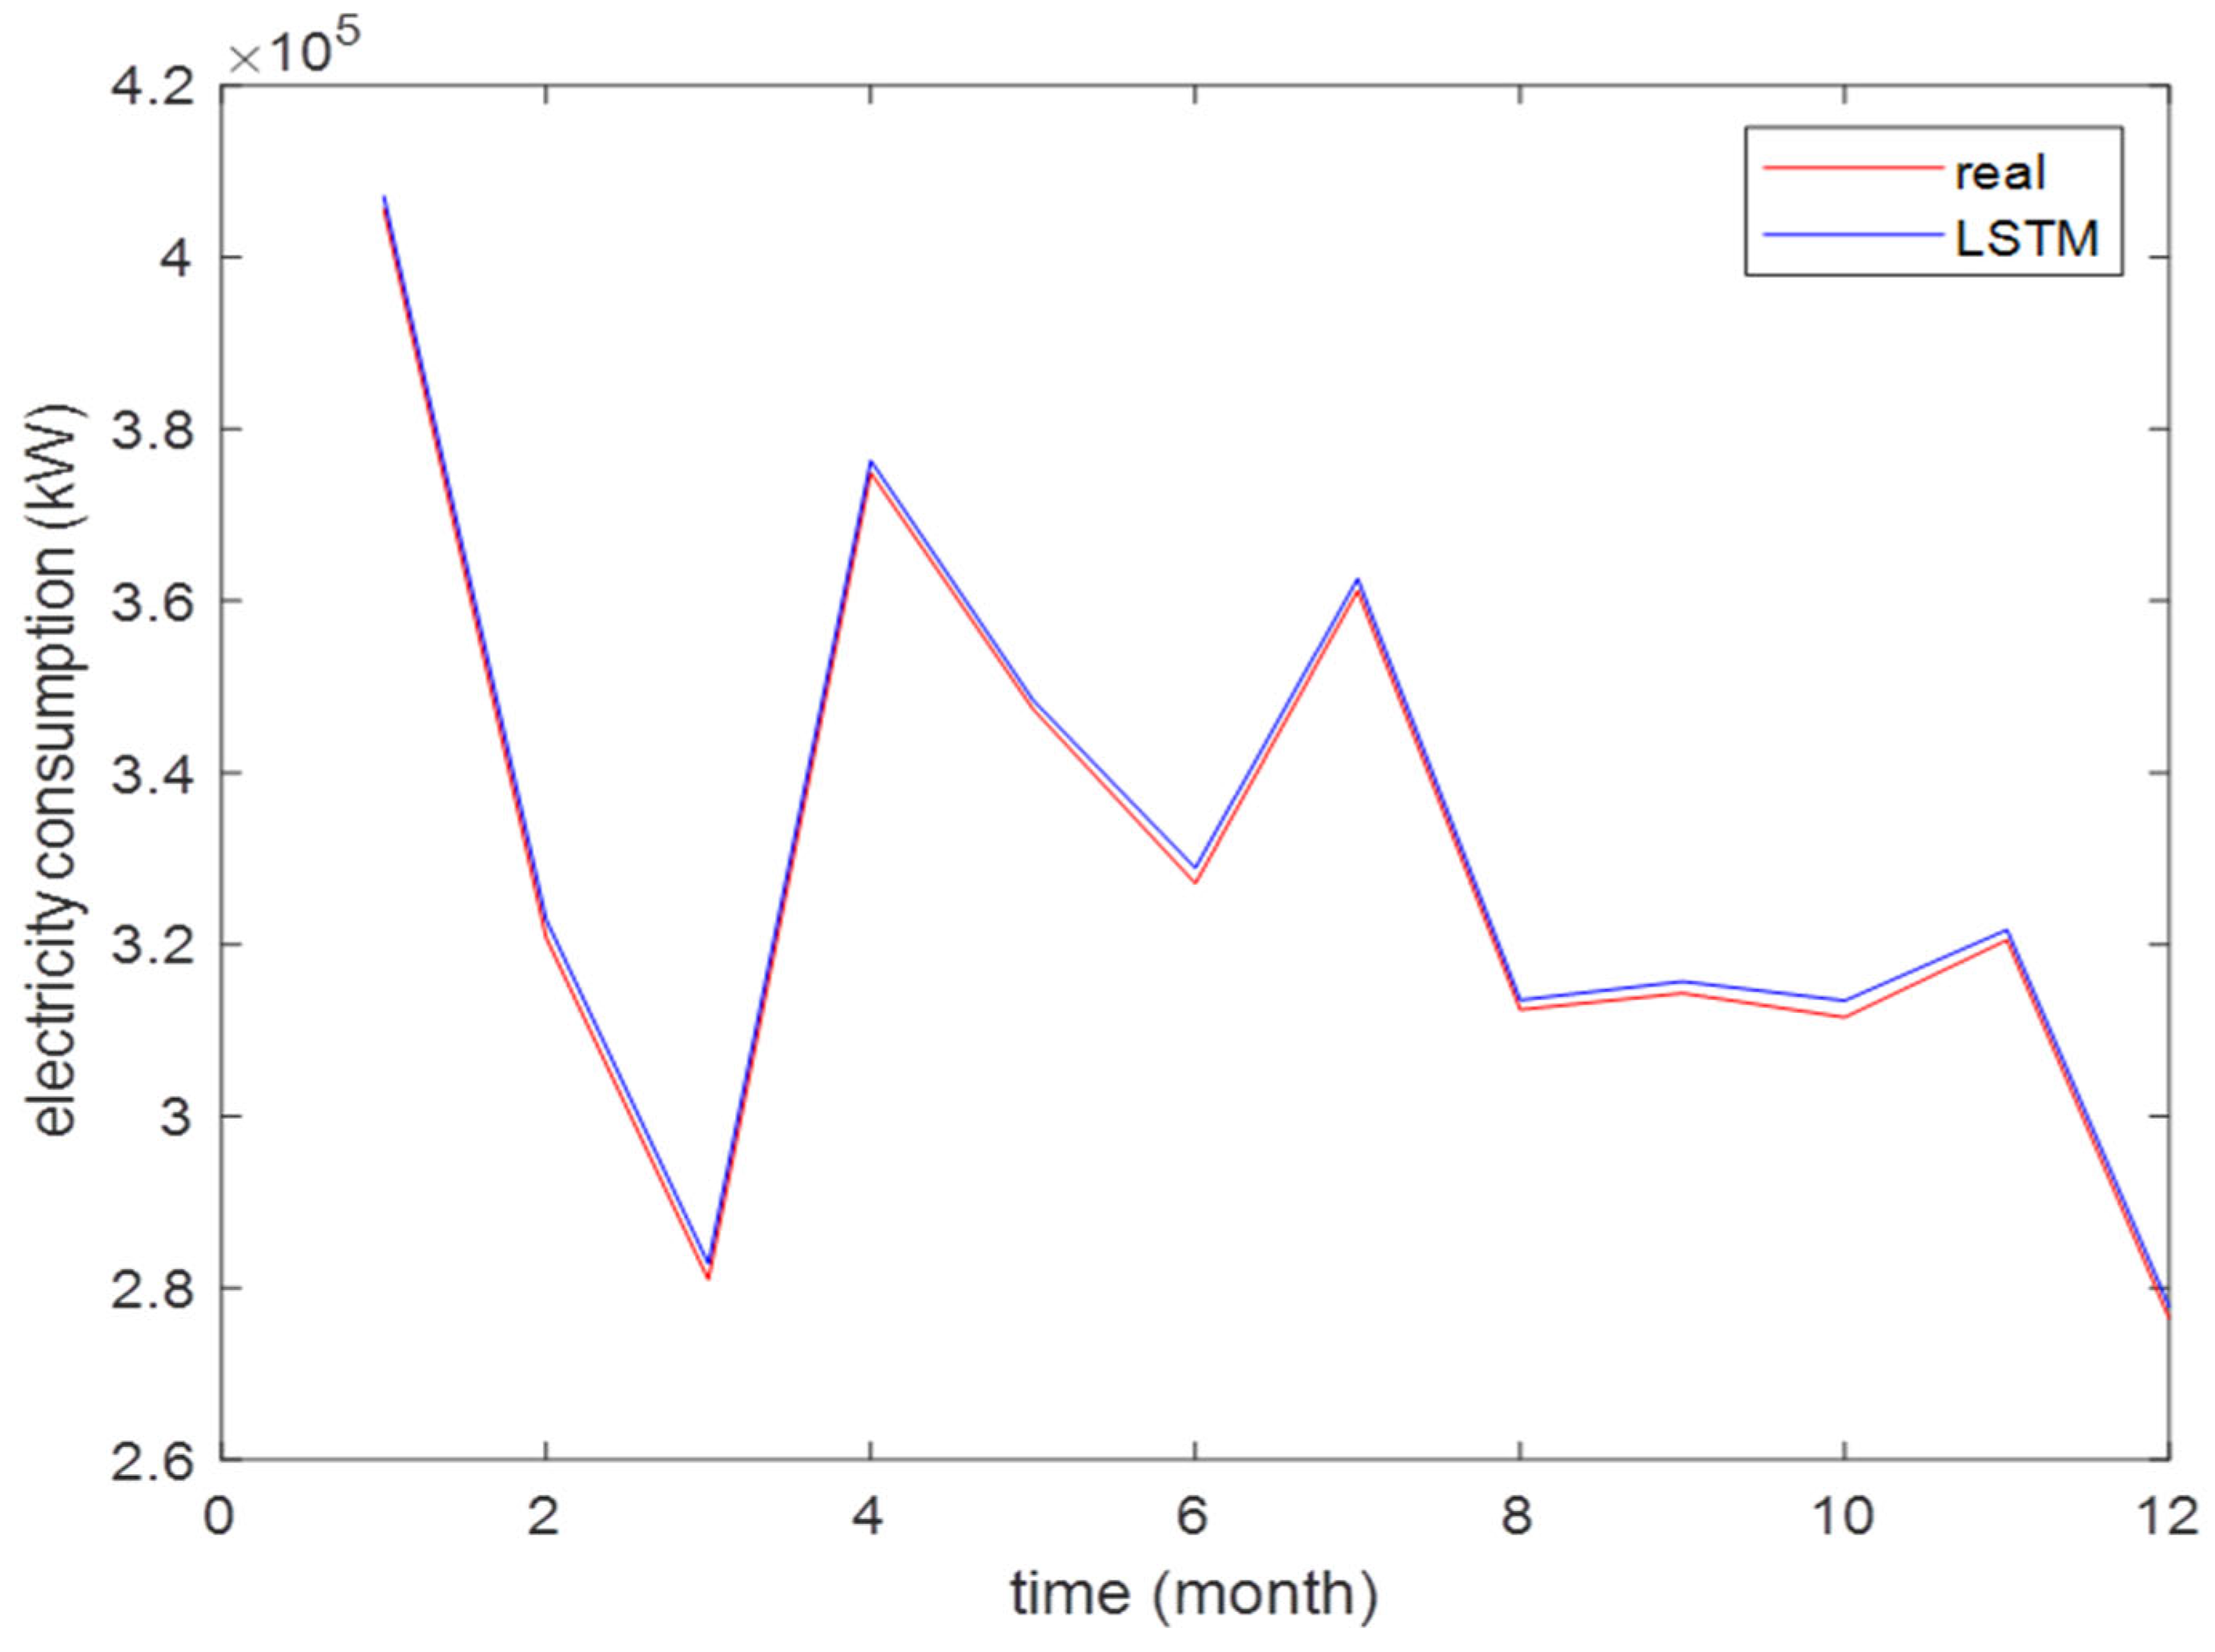
The graph above displays the results obtained from the LSTM model, Figure 11. The curve in red represents the actual values, while the curve in blue illustrates the predicted outcomes. It is evident here that the predictions closely approximate to the actual data.
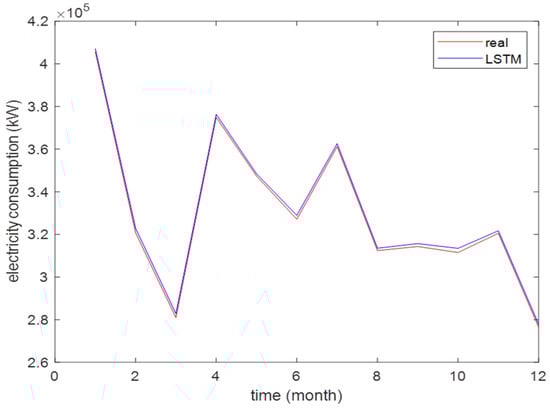
Figure 11.
LSTM prediction on the testing data set.
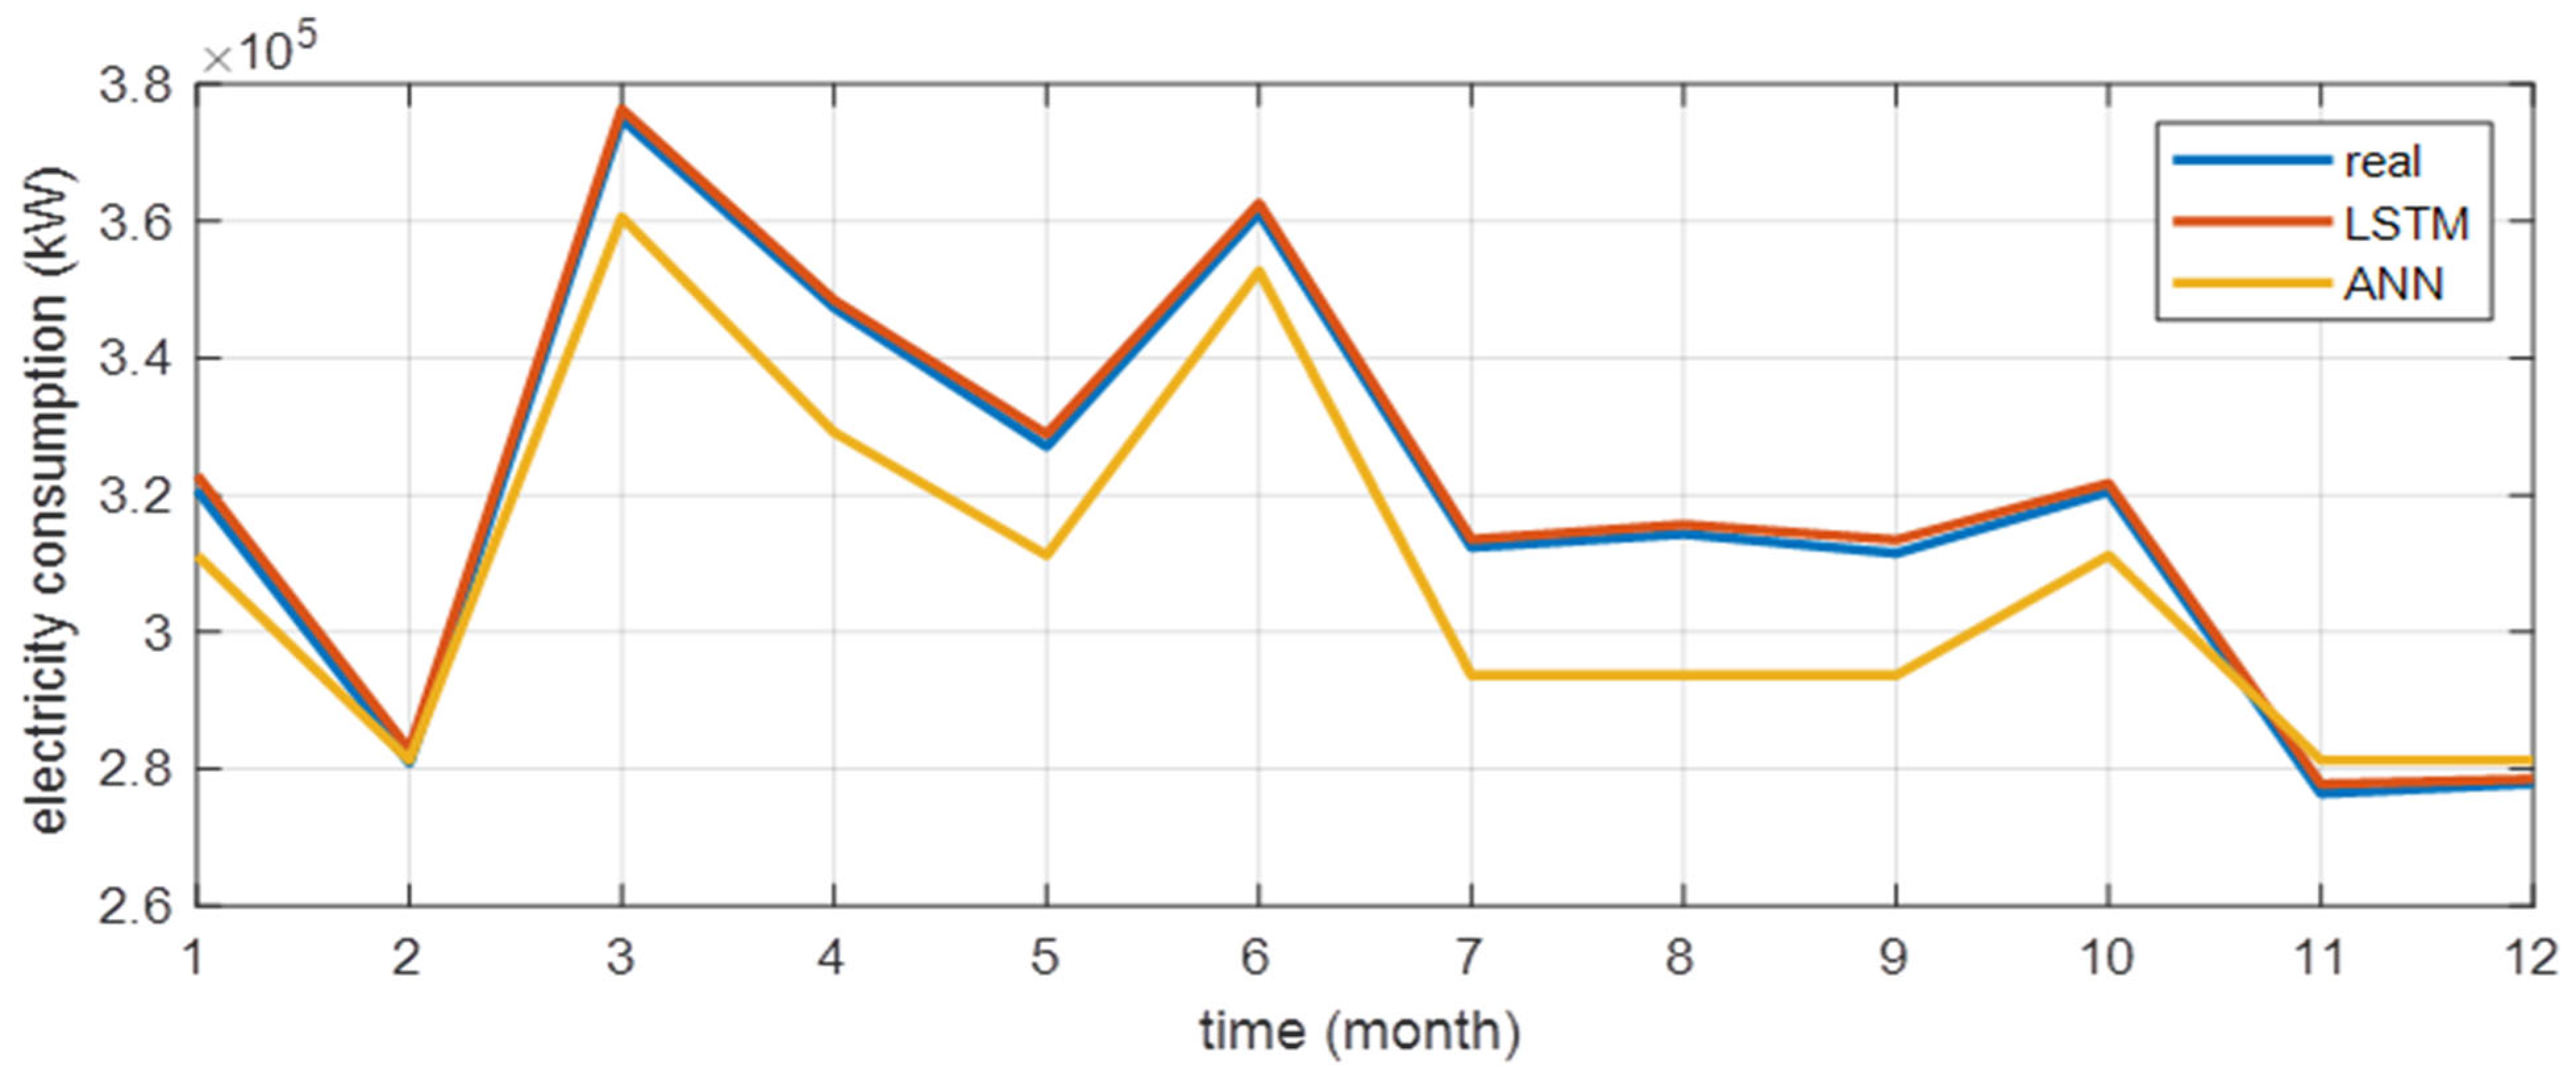
Figure 12 presents a comparison of the actual data with the prediction results obtained from both the LSTM and ANN models on the same graph. Among the two methods utilized for electricity consumption forecasting, the LSTM has yielded results that are closer to the actual figures.

Figure 12.
Performance comparison of the LSTM and ANN prediction models.
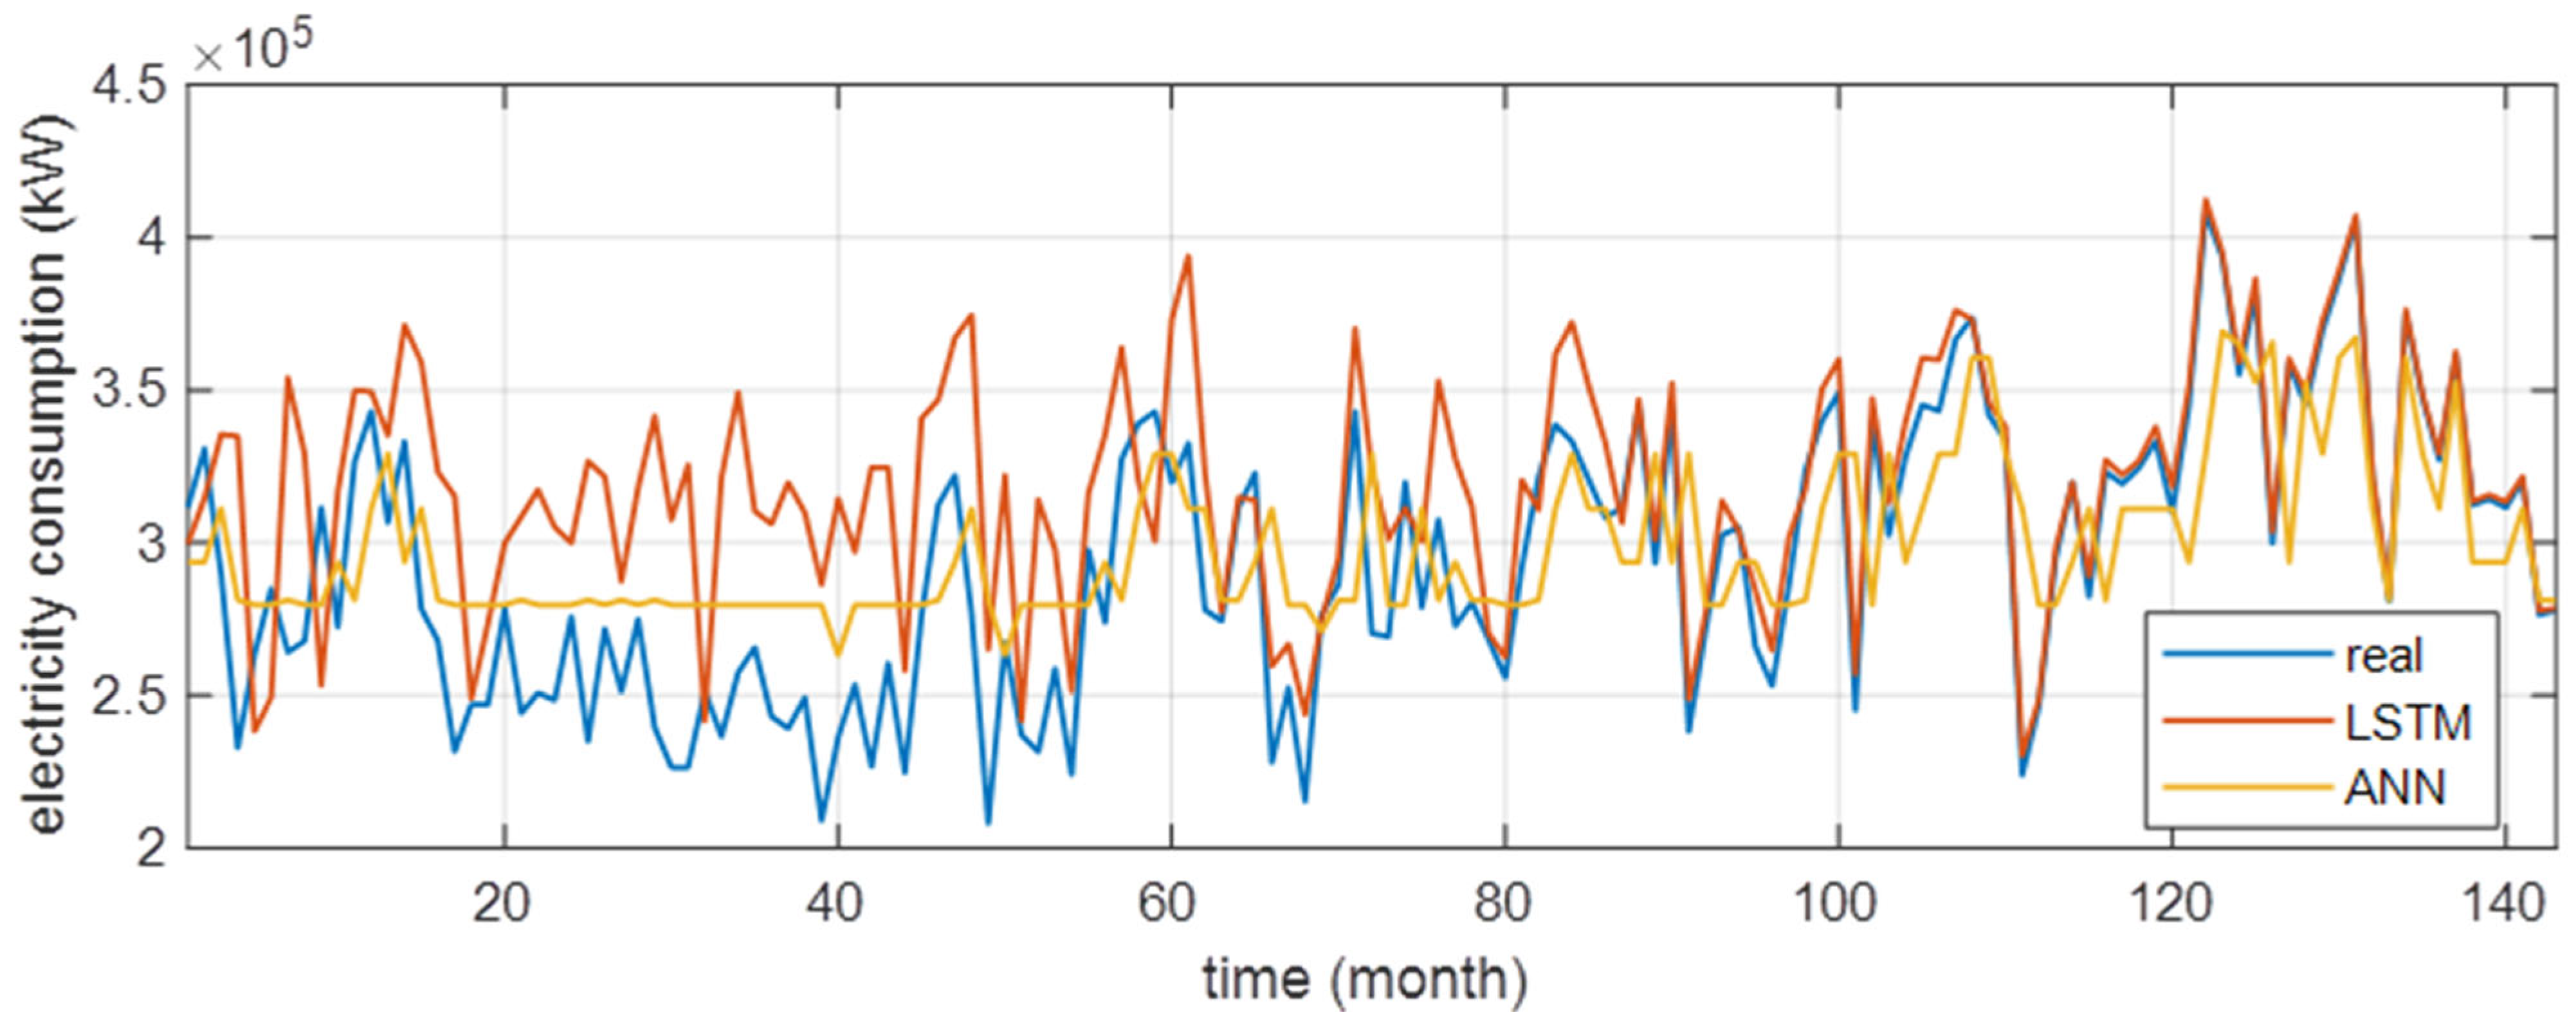
Figure 13 shows the results obtained from the prediction models at the end of the training and testing phases. As can be seen from the figure, the results obtained with LSTM are more successful in both training and testing phases.

Figure 13.
Training/Testing graphs of the ANN and LSTM models.
Predictions are conducted using a Long Short-Term Memory (LSTM) Neural Network, utilizing 84 months of data during the training phase and 12 months of data in the testing phase. To demonstrate the accuracy of the time-series data model, a comparison is made with the Artificial Neural Network (ANN) method. At the end of the study, three distinct error criteria are employed to compare the outcomes derived from both methods. These error criteria are Root Mean Square Error (RMSE), Mean Absolute Percentage Error (MAPE), and Theil’s Inequality Coefficient (TIC), and are given as follows:
Here, n is the number of samples, and xr and xp represent the measured and predicted output values, respectively. Table 6 presents the results of the ANN and LSTM algorithms using error criteria.
Table 6.
Performance results of LSTM and ANN methods.
MAPE measures the difference of the predicted values from the actual values in percentage terms. A lower MAPE value indicates that the model’s predictions are closer to the actual values, typically signaling better model performance. Particularly for LSTM and ANN models, the MAPE value is used to assess the overall accuracy of the models. RMSE is the square root of the average of the squares of the prediction errors and measures how much deviation there is in the model’s predictions from the actual values. A lower RMSE value indicates that the predictions are closer to the actual values, thereby suggesting a more accurate model. In LSTM and ANN models, RMSE indicates how well the model captures the variance in the dataset. TIC is a statistic that measures how dispersed the model’s predictions are with respect to the actual values. As the TIC value approaches zero, the model’s predictions become closer to the actual values. This coefficient is particularly useful for comparing data of different scales.
For LSTM and ANN models, these error metrics are utilized to evaluate the prediction performance of the models. Generally, lower values of these three-error metrics indicate high accuracy of the model. Comparative analysis of these metrics plays a significant role in determining which model (LSTM or ANN) is more suitable for a specific dataset. If one model’s MAPE and RMSE values are significantly lower than the others, it is concluded that this model’s predictions are more accurate.
The results of electricity consumption predictions are presented in Figure 13. As can be seen in Figure 13 and Table 6, the estimation results obtained with LSTM are more consistent with the actual values. Upon examining the results, it is observed that there is a more successful approach with the LSTM method, especially at the peak point [41].
All these results, along with possible electrical improvements in the factory based on energy audit outcomes, annual savings, and R.O.I. amounts, are given in Table 7.
Table 7.
Energy audit results and improvement points.
Following energy audits, the investment budgets of businesses must be considered regarding the projects and recommendations that emerge. Financial models and support should be utilized in implementing these projects. Energy Performance Models and the Efficiency Enhancing Project (EEP) support contribute financially to the feasibility of these projects for businesses. If no action is taken following energy audits (such as implementing projects or preventing losses and leakages), it will not be possible for businesses to reduce their energy intensity, nor will the energy audits achieve their real objectives.
Our country aims to increase efficiency in all processes from the production to the final consumption of energy by efficiently and environmentally consciously utilizing energy resources. This has been emphasized in the National Energy Efficiency Action Plan, setting action plans to reduce energy intensity in each industrial sub-sector by at least 10%. The Energy Efficiency Law, which came into effect on 2 May 2007, was the first step in energy efficiency in our country, followed by the Regulation on Increasing Efficiency in the Use of Energy Resources and Energy, which came into force on 27 October 2011, and was last updated on 25 January 2020. Under this regulation:
- Industrial establishments with an annual total energy consumption of 1000 TOE and above are required to conduct an energy audit every four years.
- Buildings in the service sector with a total construction area over 20,000 square meters are required to conduct an energy audit every seven years.
As shown in Table 8, there are many points of electricity savings in the factory, such as air leakage, replacing compressors with more efficient ones, condensate traps after dryers, replacing dryers with more efficient ones, changing to LED fixtures, implementing speed drives on cooling-tower fan motors, and replacing compensation panels with harmonic reactor panels. The table includes investment costs, payback periods, and CO2 reduction amounts. Based on these results and the budget, necessary applications have been started in the factory. In the study conducted at Ulusoy Textile Dyeing Plant, the aim was to identify existing energy efficiency potentials. The projects identified in the audits conducted at the facility will achieve approximately 342,518 kWh/year of electricity savings and about TRY 318,542 in savings annually. This is the average gain in the SPP in 2023 and until mid-2024, as shown in Table 8.
Table 8.
2023 monthly solar power-plant gain table.
The integration of solar power plants (SPPs) as a renewable energy source in factory environments offers many benefits, in line with environmental sustainability and economic efficiency. Firstly, adopting solar energy significantly reduces the carbon footprint of production operations, contributing to global efforts to combat climate change. This transition to renewable sources not only aligns with environmental regulations and green initiatives, but also enhances the ecological reputation of the factory among stakeholders. Economically, solar power plants offer a cost-effective energy solution in the long term. Despite the initial investment, the subsequent reduction in energy costs leads to significant savings, making it a financially viable option for factories aiming to minimize operational expenses. Additionally, solar energy provides reliability and energy security, reduces dependency on traditional energy grids, and decreases sensitivity to fluctuations in energy prices. The use of solar energy is also in line with corporate social responsibility strategies, demonstrating a commitment to sustainable practices. This not only appeals to an environmentally conscious consumer base, but also positions the factory as a forward-thinking institution in an increasingly eco-aware market. Furthermore, in some regions, factories can benefit from government incentives or subsidies for using renewable energy sources, further enhancing the economic appeal of adopting solar energy.
As shown in Table 9, a profit is observed for the UT1 dyeing factory after the completion of the Solar Power Plant (SPP) project. The gain is around 60% during the summer months, while it decreases to about 25% in the winter months. This profit is achieved with 1914 panels, each with a capacity of 545 watts. The setup includes one transformer and eight inverter panels for a single SPP.
Table 9.
2023 carbon footprint.
Textile factories constitute a significant component of the global carbon footprint, as these facilities often use substantial amounts of electricity and natural gas for energy-intensive processes [42]. As seen in Table 9, the use of electricity and natural gas, primarily sourced from the combustion of fossil fuels, contributes to the increase in carbon dioxide (CO2) emissions released into the atmosphere, thus exacerbating global warming and climate change. Consumption amounts for 2024 are given in Table 10.
Table 10.
Consumption amounts for 2024.
The meteorological data of the factory located in Adana are monitored monthly at https://www.worldweatheronline.com/yakapinar-weather-averages/adana/tr.aspx (accessed on 2 July 2024). It is recorded that the average temperature in summer is around 32–33 degrees Celsius. Solar panels with inverter rooms were installed on the roof of the factory. There is a total of 1914 solar panels, each with a capacity of 545 watts, one transformer and eight inverters. These panels were installed on the roof of the factory as shown in Figure 14. Weekly inspections are carried out by the maintenance department. The average SPP utilization rate of the enterprise is given in Table 8.
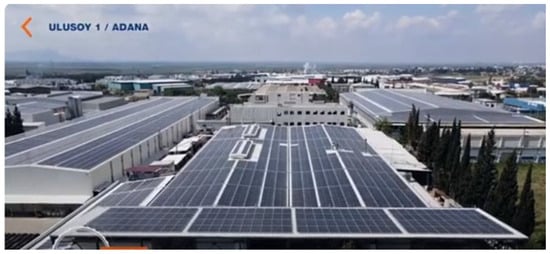
Figure 14.
Solar panels on the company’s roof.
The energy needs of textile production, especially in processes such as heating, drying, dyeing, and printing, are substantial. Since a major portion of the energy used in these processes is derived from fossil fuels, the carbon footprint of the textile sector is considerable. This situation is concerning from an environmental sustainability perspective, necessitating the textile sector to enhance energy efficiency and transition to renewable energy sources as part of the fight against climate change. Moreover, this shift will be beneficial in reducing environmental impact and providing long-term cost savings. Therefore, efforts to reduce the carbon footprint of textile factories contribute not only to environmental, but also to economic and social, sustainability [43].
Through all the improvement efforts and the implementation of solar power plants (SPPs), significant savings in electricity consumption per unit have been achieved. These results will serve as a guiding manual for many textile factories.
4. Conclusions
Many harmful natural events globally stem from carbon emission-driven climate change. The intensified consumption of fossil fuels to meet increasing energy needs is augmenting the carbon burden on nature. Energy plays a critical role in the sustainability of both the environment and societal living. The rise in greenhouse gas emissions due to human activities and the alterations in natural greenhouse gas levels have turned climate change into a grave issue. Global warming is recognized as the main source of a range of problems, from melting glaciers to changes in climate zones, droughts, and ecosystem alterations.
Recently, carbon-emission mitigation mechanisms, such as carbon-border adjustment mechanisms, have gained attention [44]. Within the scope of the carbon border assessment, evaluations and regulations regarding carbon emissions between countries are examined. Carbon border assessment is a system that aims to encourage more sustainable production and consumption models on a global scale. Companies aim to reduce carbon emissions through this system. Investing in environmentally friendly technologies and processes contributes to environmental sustainability in the long term.
Industrialists trading with the EU are particularly focused on this matter. When carbon-based methods are used in production, they may face certain restrictions during export. This situation leads companies to seek alternative, greener, and more environmentally friendly ways to meet their energy needs. Therefore, textile businesses need to analyze their current situation, and carry out the necessary layout and process optimizations, to become more competitive. The accuracy of electricity consumption data predictions using ANN and LSTM methods has been demonstrated, with LSTM showing results very close to actual data.
The outcomes obtained with this method will be used by the company during production planning, indicating promising results for future year predictions. Key improvement points for electricity consumption, the most crucial energy source, have been identified, and savings items have been highlighted. Furthermore, layout optimization, involving the physical arrangement of an existing or proposed facility within a business, has enlarged storage areas, identified bottlenecks, and necessitated the acquisition and relocation of equipment and machinery, thereby reducing worker movement in the process. These layout optimization decisions have directly impacted employee efficiency. Walking paths and fire paths have been redrawn so that they always remain clear, reducing the risk of work accidents.
Optimization and forecasting have contributed to significant improvements and productivity increases in production processes, together with existing work, downtime, and bottleneck reduction, and shortening material handling times. Optimization and process-improvement activities in the textile sector increase energy efficiency, reducing both costs and environmental impact. Electricity consumption prediction models based on LSTM have accurately analyzed the complex patterns of energy demand in the sector, contributing to the development of energy management strategies. The amalgamation of these approaches plays a critical role in enhancing the sustainability and competitive strength of the textile industry.
Author Contributions
Conceptualization, K.Y. and M.G.; methodology, K.Y. and M.G.; software, K.Y., M.G. and İ.Ö.A.; validation, K.Y., M.G. and İ.Ö.A.; formal analysis, K.Y., T.D. and M.G.; investigation, K.Y., T.D. and M.G.; resources, K.Y. and T.D.; data curation, K.Y. and T.D.; writing—original draft preparation, K.Y., M.G., T.D. and İ.Ö.A.; writing—review and editing, K.Y., M.G., T.D. and İ.Ö.A.; visualization, K.Y., M.G., T.D. and İ.Ö.A.; supervision, K.Y., M.G., T.D. and İ.Ö.A.; project administration, K.Y., T.D. and M.G.; funding acquisition, K.Y. and T.D. All authors have read and agreed to the published version of the manuscript.
Funding
This research was supported by the Ulusoy Textile Industry and Commerce Incorporated Company Research and Developing Center Project Number: 2021/003.
Institutional Review Board Statement
Not applicable.
Informed Consent Statement
Not applicable.
Data Availability Statement
Data are contained within the article.
Acknowledgments
The authors would like to acknowledge the Ulusoy Textile R&D Center for full financial support and the data process.
Conflicts of Interest
The authors declare no conflicts of interest.
References
- Sabır, E.C.; Bebekli, M.; Zenbilci, A. Work Study in Textile Finishing Mill Depending on the Work Flow Chart. Çukurova Univ. J. Fac. Eng. Archit. 2014, 29, 81–88. [Google Scholar]
- Varadarajan, G.; Venkatachalam, P. Sustainable Textile Dyeing Processes. Environ. Chem. Lett. 2016, 14, 113–122. [Google Scholar] [CrossRef]
- Öztürk, E.; Koseoglu, H.; Karaboyaci, M.; Yigit, N.O.; Yetis, U.; Kitis, M. Sustainable Textile Production: Cleaner Production Assessment/Eco-Efficiency Analysis Study in a Textile Mill. J. Clean. Prod. 2016, 138, 248–263. [Google Scholar] [CrossRef]
- Toprak, T.; Anis, P. Textile Industry’s Environmental Effects and Approaching Cleaner Production and Sustainability, an Overview. J. Text. Eng. Fash. Technol. 2017, 2, 429–442. [Google Scholar] [CrossRef]
- Desore, A.; Narula, S.A. An Overview on Corporate Response towards Sustainability Issues in Textile Industry. Environ. Dev. Sustain. 2018, 20, 1439–1459. [Google Scholar] [CrossRef]
- Toksöz, M. Sustainability Concept and Life Cycle Analysis in Textile Sector. Master’s Thesis, Çukurova University, Adana, Turkey, 2018. [Google Scholar]
- Türemen, M.; Demir, A.; Özdoğan, E. Recycling and Importance for Textile Industry. Pamukkale Univ. J. Eng. Sci. 2019, 25, 805–809. [Google Scholar] [CrossRef]
- Kayışkan, D.; Aşan, H.; Özveri, O. Improving Process Management of Supply Management Activities in Painting Sector. J. Mehmet Akif Ersoy Univ. Econ. Adm. Sci. Fac. 2018, 5, 913–924. [Google Scholar]
- Piribauer, B.; Bartl, A. Textile Recycling Processes, State of the Art and Current Developments: A Mini Review. Waste Manag. Res. 2019, 37, 112–119. [Google Scholar] [CrossRef]
- Khattab, T.A.; Abdelrahman, M.S.; Rehan, M. Textile Dyeing Industry: Environmental Impacts and Remediation. Environ. Sci. Pollut. Res. 2020, 27, 3803–3818. [Google Scholar] [CrossRef]
- Ahmad, S.; Miskon, S.; Alabdan, R.; Tlili, I. Towards Sustainable Textile and Apparel Industry: Exploring the Role of Business Intelligence Systems in the Era of Industry 4.0. Sustainability 2020, 12, 2632. [Google Scholar] [CrossRef]
- Indrayani, L.; Triwiswara, M. Implementation Green Industry Standard at Textile Industry and Textile Product. In Proceedings of the IOP Conference Series: Earth and Environmental Science; IOP Publishing: Bristol, UK, 2020; Volume 456, p. 012049. [Google Scholar]
- Roy, M.; Sen, P.; Pal, P. An Integrated Green Management Model to Improve Environmental Performance of Textile Industry towards Sustainability. J. Clean. Prod. 2020, 271, 122656. [Google Scholar] [CrossRef]
- Tandoğan, M.E. The Contribution of Production Method Improvements to Efficiency in the Textile Sector: A Business Analysis. Master’s Thesis, Bilecik Şeyh Edebali University, Bilecik, Turkey, 2020. [Google Scholar]
- Sabır, E.C. Simulation Modeling of Product Development Process in Textile Dyeing-Finishing Mills-Model Design. Çukurova Univ. J. Fac. Eng. Archit. 2020, 35, 913–924. [Google Scholar]
- Tuna, S.A. A Model Proposal and Application in the Development of Production Process Based on Data Analysis. Master’s Thesis, Pamukkale University, Denizli, Turkey, 2021. [Google Scholar]
- Metlioğlu, H.H.; Yakin, V. Sustainability in Textiles: Sustainability Strategies of Fast Fashion Brands. OPUS Int. J. Soc. Res. 2021, 18, 1883–1908. [Google Scholar]
- Coşkun, S.; Doğan, N. Determination of Carbon Footprint in Textile Industry. Süleyman Demirel Univ. J. Nat. Appl. Sci. 2021, 25, 28–35. [Google Scholar]
- Yüksel, E.Y. Fabric Production and Life Cycle Analysis from Recycled Fibers and Blends Within the Scope of Sustainability. Ph.D. Dissertation, Kahramanmaraş Sütçü İmam University, Kahramanmaraş, Turkey, 2022. [Google Scholar]
- Okai-Mensah, C.K.; Howard, E.K.; Okai-Mensah, K. Sustainable Practices of the Large-Scale Textile Firms in Ghana. Clean. Circ. Bioeconomy 2022, 2, 100020. [Google Scholar] [CrossRef]
- Şener Fidan, F.; Kızılkaya Aydoğan, E.; Uzal, N. The Impact of Organic Cotton Use and Consumer Habits in the Sustainability of Jean Production Using the LCA Approach. Environ. Sci. Pollut. Res. 2023, 30, 8853–8867. [Google Scholar] [CrossRef] [PubMed]
- Kurtoğlu, S.A. Transition Toward a Circular Economy in Turkish Textile and Clothing Companies- A Brief Evaluation. J. Eng. Sci. Des. 2022, 10, 1107–1116. [Google Scholar]
- Elibüyük, S.A.; Yumru, Ş.; Çörekciȯğlu, M. Investigation of the Productivity Studies Made in the Dye Shop Department of a Textile Enterprise. J. Sustain. Eng. Appl. Technol. Dev. 2022, 5, 138–150. [Google Scholar]
- Ağraş, S.; Çetinkaya, F. A Content Analysis of Environmental Sensitivity and Sustainability Policies in Textile Industry. Equinox 2023, 10, 26–48. [Google Scholar]
- Başoğul, Y.; Göksu, T.T.; Baran, M.F. A Case Study on the Assessment of Carbon Footprint of a Textile Factory. Eur. J. Sci. Technol. 2021, 31, 146–150. [Google Scholar]
- Kluczek, A.; Buczacki, A. Smart Energy Sustainability Hub in Light of Industry 4.0. Energy Rep. 2023, 10, 3835–3846. [Google Scholar] [CrossRef]
- Román-Collado, R.; Sanz-Díaz, M.T.; Blanco, L.Y. Key Drivers of the Textile and Clothing Industry Decarbonisation within the EU-27. J. Environ. Manag. 2023, 334, 117438. [Google Scholar] [CrossRef] [PubMed]
- Chinnathai, M.K.; Alkan, B. A Digital Life-Cycle Management Framework for Sustainable Smart Manufacturing in Energy Intensive Industries. J. Clean. Prod. 2023, 419, 138259. [Google Scholar] [CrossRef]
- Coşgun, G. Carbon Footprint Calculation and Analysis in the Textile Industry. Master’s Thesis, Bursa Uludağ University, Bursa, Turkey, 2023. [Google Scholar]
- Işık, S. Calculation of Carbon Footprint in Textile Industry. Master’s Thesis, Pamukkale University, Denizli, Turkey, 2023. [Google Scholar]
- Demirdelen, T.; Aksu, İ.Ö.; Yilmaz, K.; Koç, D.D.; Arikan, M.; Şener, A. Investigation of the Carbon Footprint of the Textile Industry: PES-and PP-Based Products with Monte Carlo Uncertainty Analysis. Sustainability 2023, 15, 14237. [Google Scholar] [CrossRef]
- Isinkaralar, O.; Isinkaralar, K.; Sevik, H.; Küçük, Ö. Spatial modeling the climate change risk of river basins via climate classifcation: A scenario based prediction approach for Türkiye. Nat. Hazards 2024, 120, 511–528. [Google Scholar] [CrossRef]
- Li, K.; Hu, C.; Liu, G.; Xue, W. Building’s Electricity Consumption Prediction Using Optimized Artificial Neural Networks and Principal Component Analysis. Energy Build. 2015, 108, 106–113. [Google Scholar] [CrossRef]
- Escrivá, G.; Álvarez-Bel, C.; Roldán-Blay, C.; Alcázar-Ortega, M. New Artificial Neural Network Prediction Method for Electrical Consumption Forecasting Based on Building End-Uses. Energy Build. 2011, 43, 3112–3119. [Google Scholar] [CrossRef]
- Verma, A.; Prakash, S.; Kumar, A. ANN -based Energy Consumption Prediction Model up to 2050 for a Residential Buil-ding: Towards Sustainable Decision Making. Env. Prog. Sustain. Energy 2021, 40, e13544. [Google Scholar] [CrossRef]
- Zhao, Z.; Chen, W.; Wu, X.; Chen, P.C.Y.; Liu, J. LSTM Network: A Deep Learning Approach for Short-term Traffic Forecast. IET Intell. Transp. Syst. 2017, 11, 68–75. [Google Scholar] [CrossRef]
- Akbari Asanjan, A.; Yang, T.; Hsu, K.; Sorooshian, S.; Lin, J.; Peng, Q. Short-Term Precipitation Forecast Based on the PERSIANN System and LSTM Recurrent Neural Networks. J. Geophys. Res. Atmos. 2018, 123, 12543–12563. [Google Scholar] [CrossRef]
- Xie, T.; Dai, Z.; Zhu, X.; Chen, B.; Ran, C. LSTM-Based Short-Term Ionospheric TEC Forecast Model and Positioning Ac-curacy Analysis. GPS Solut. 2023, 27, 66. [Google Scholar] [CrossRef]
- Sundaramoorthy, S.; Kamath, D.; Nimbalkar, S.; Price, C.; Wenning, T.; Cresko, J. Energy efficiency as a foun-dational technology pillar for industrial decarbonization. Sustainability 2023, 15, 9487. [Google Scholar] [CrossRef]
- Hu, Z.; Gao, Y.; Ji, S.; Mae, M.; Imaizumi, T. Improved multistep ahead photovoltaic power prediction model based on LSTM and self-attention with weather forecast data. Appl. Energy 2024, 359, 122709. [Google Scholar] [CrossRef]
- Shafiei, E.; Zhang, X. Flexural exploration of hybrid glass/carbon textile-reinforced laminates for yacht hull structure: Experimental validations and analytical prediction. Ocean. Eng. 2024, 303, 117770. [Google Scholar] [CrossRef]
- Filho1, W.F.; Dinis, M.A.P.; Liakh, O.; Paco, A.; Dennis, K.; Shollo, F.; Sidsaph, H. Reducing the carbon footprint of the textile sector: An overview of impacts and solution. Text. Res. J. 2024, 94, 1798–1814. [Google Scholar] [CrossRef]
- Hossain, M.T.; Shahid, M.A.; Limon, M.G.M. Hossain I, Techniques, applications, and challenges in textiles for a sustainable future. J. Open Innov. Technol. Mark. Complex. 2024, 10, 100230. [Google Scholar] [CrossRef]
- Tian, B.; Zheng, M.; Liu, W.; Gu, Y.; Xing, Y.; Pan, C. Impacts of Carbon Border Adjustment Mechanism on the Development of Chinese Steel Enterprises and Government Management Decisions: A Tripartite Evolutionary Game Analysis. Sustainability 2024, 16, 3113. [Google Scholar] [CrossRef]


Disclaimer/Publisher’s Note: The statements, opinions and data contained in all publications are solely those of the individual author(s) and contributor(s) and not of MDPI and/or the editor(s). MDPI and/or the editor(s) disclaim responsibility for any injury to people or property resulting from any ideas, methods, instructions or products referred to in the content. |
© 2024 by the authors. Licensee MDPI, Basel, Switzerland. This article is an open access article distributed under the terms and conditions of the Creative Commons Attribution (CC BY) license (https://creativecommons.org/licenses/by/4.0/).