

Spatial-Temporal Evaluation and Prediction of Water Resources Carrying Capacity in the Xiangjiang River Basin Using County Units and Entropy Weight TOPSIS-BP Neural Network

 and
and
Abstract
:1. Introduction
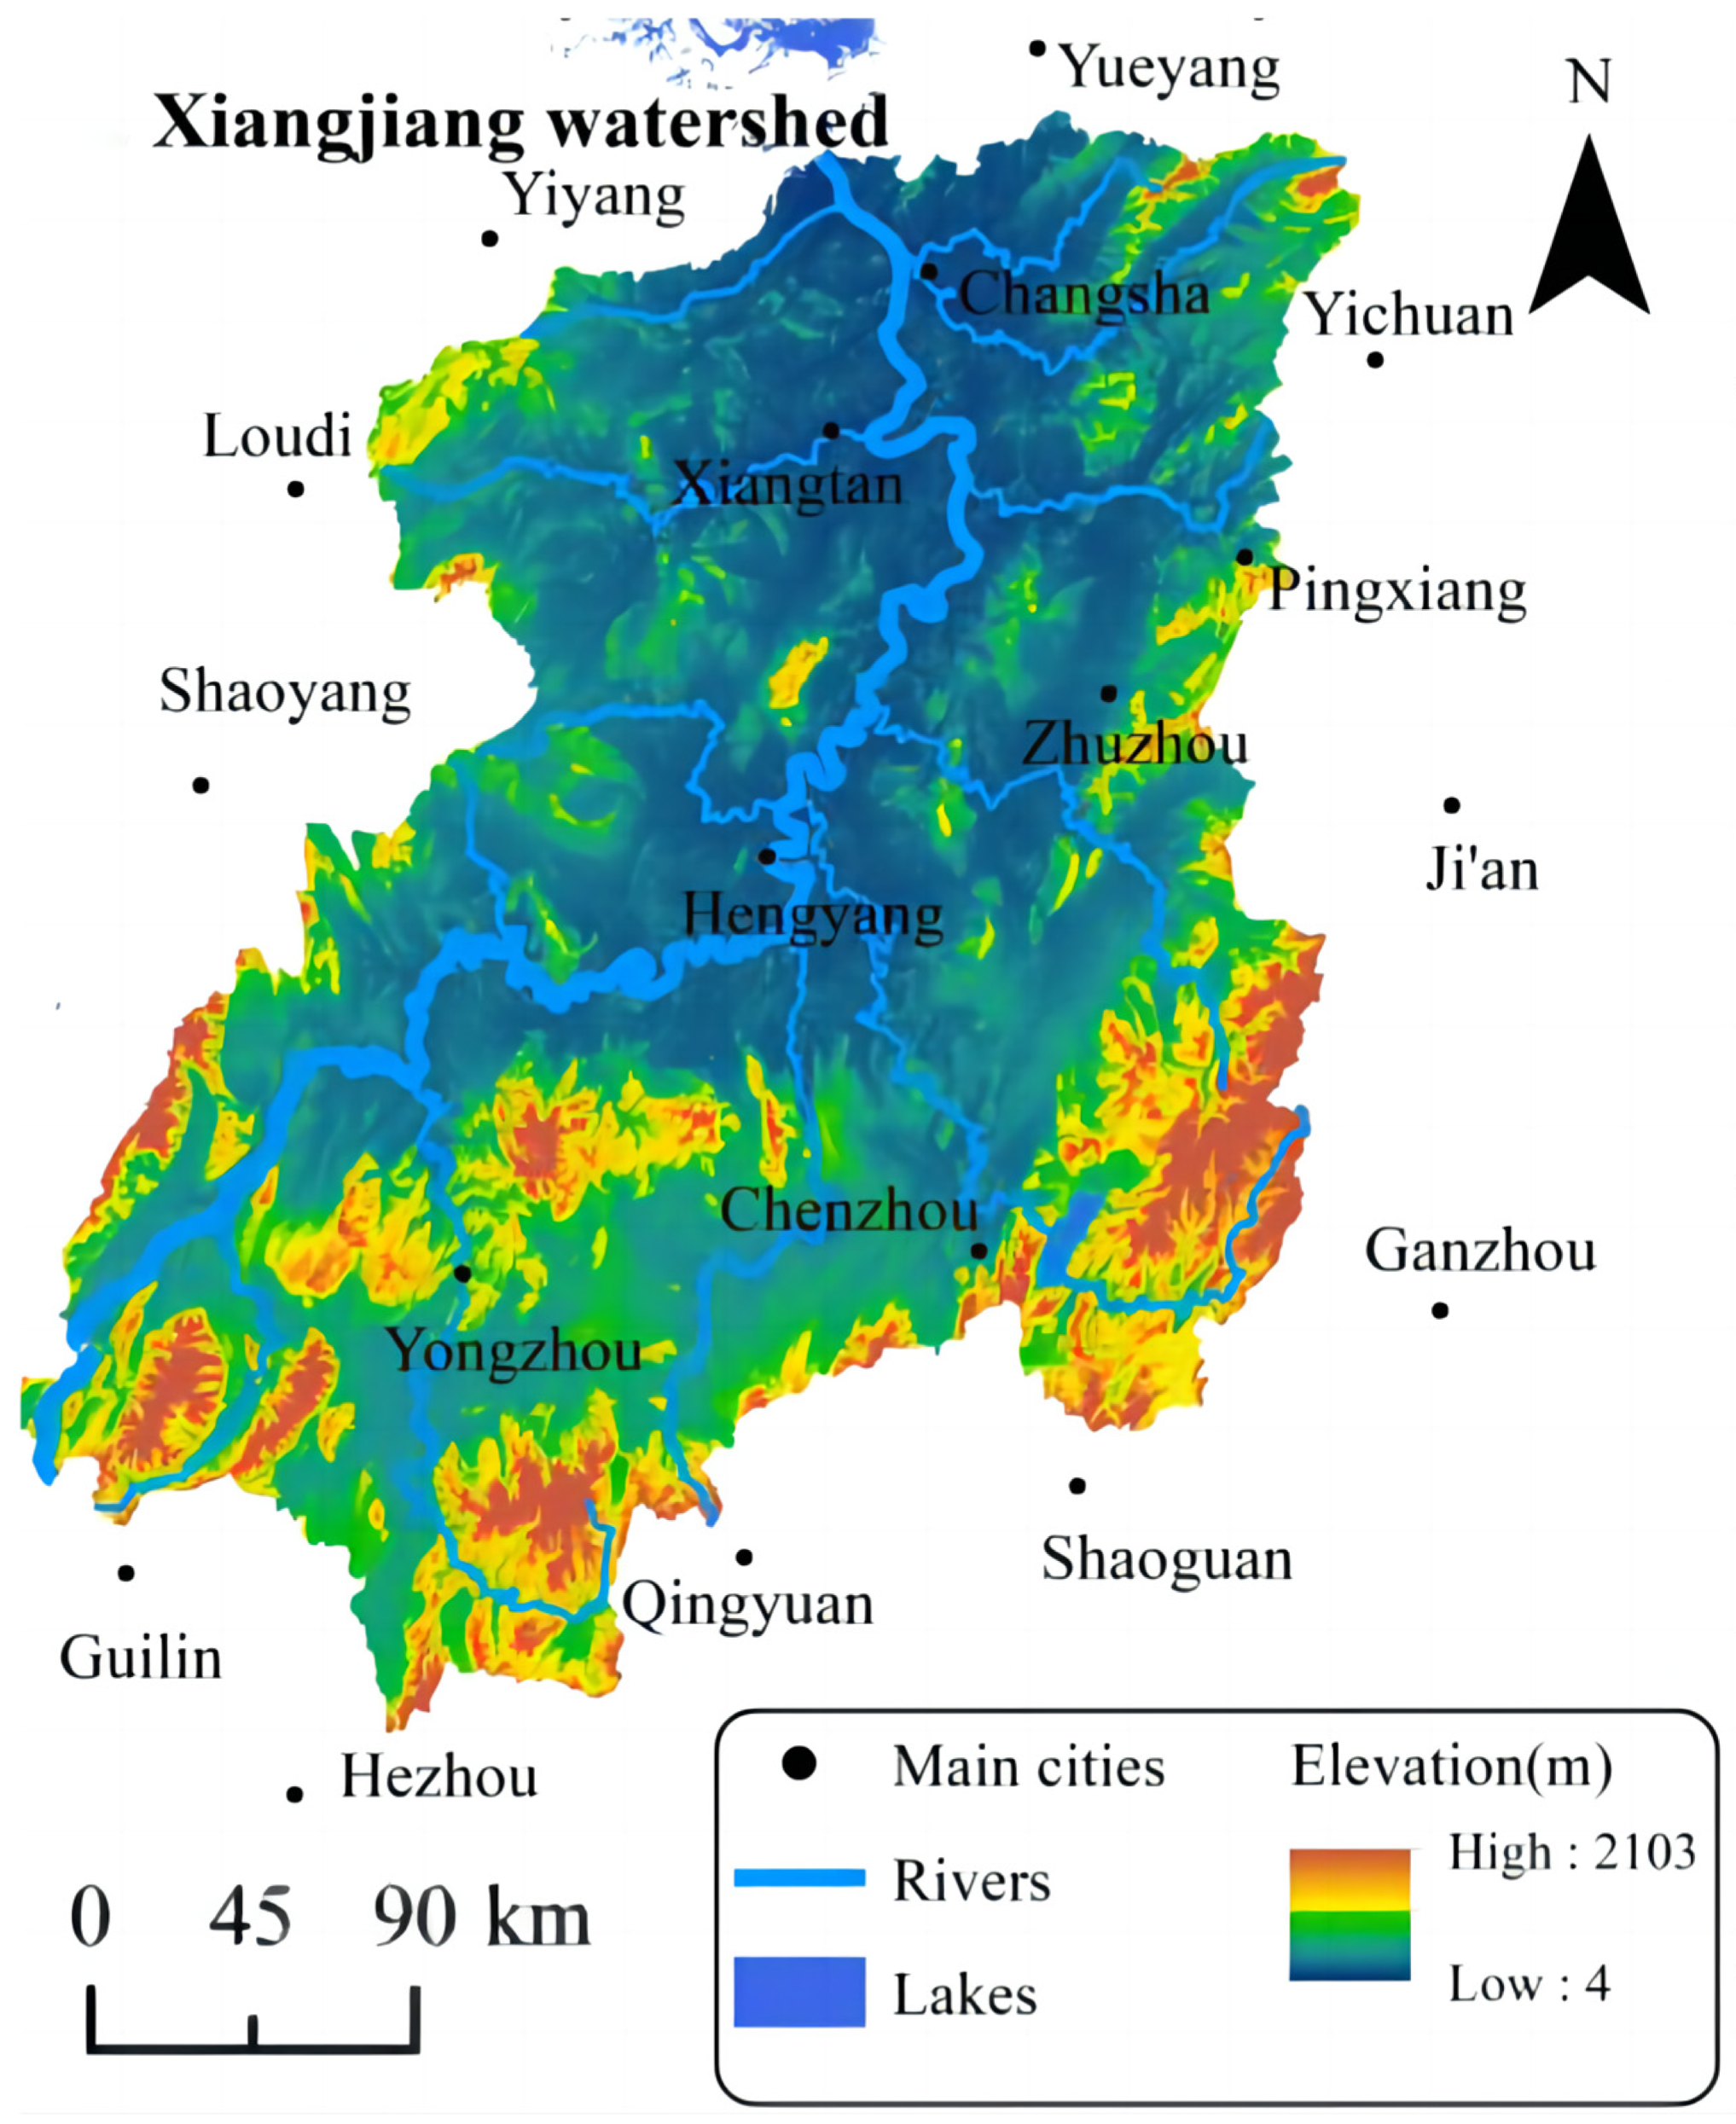
2. Status of the Study Area
2.1. Research Modules
2.1.1. Selection of Research Units
2.1.2. Overview of the Research Unit
2.2. Regional Water Resources
2.2.1. Hydrological Water Resources
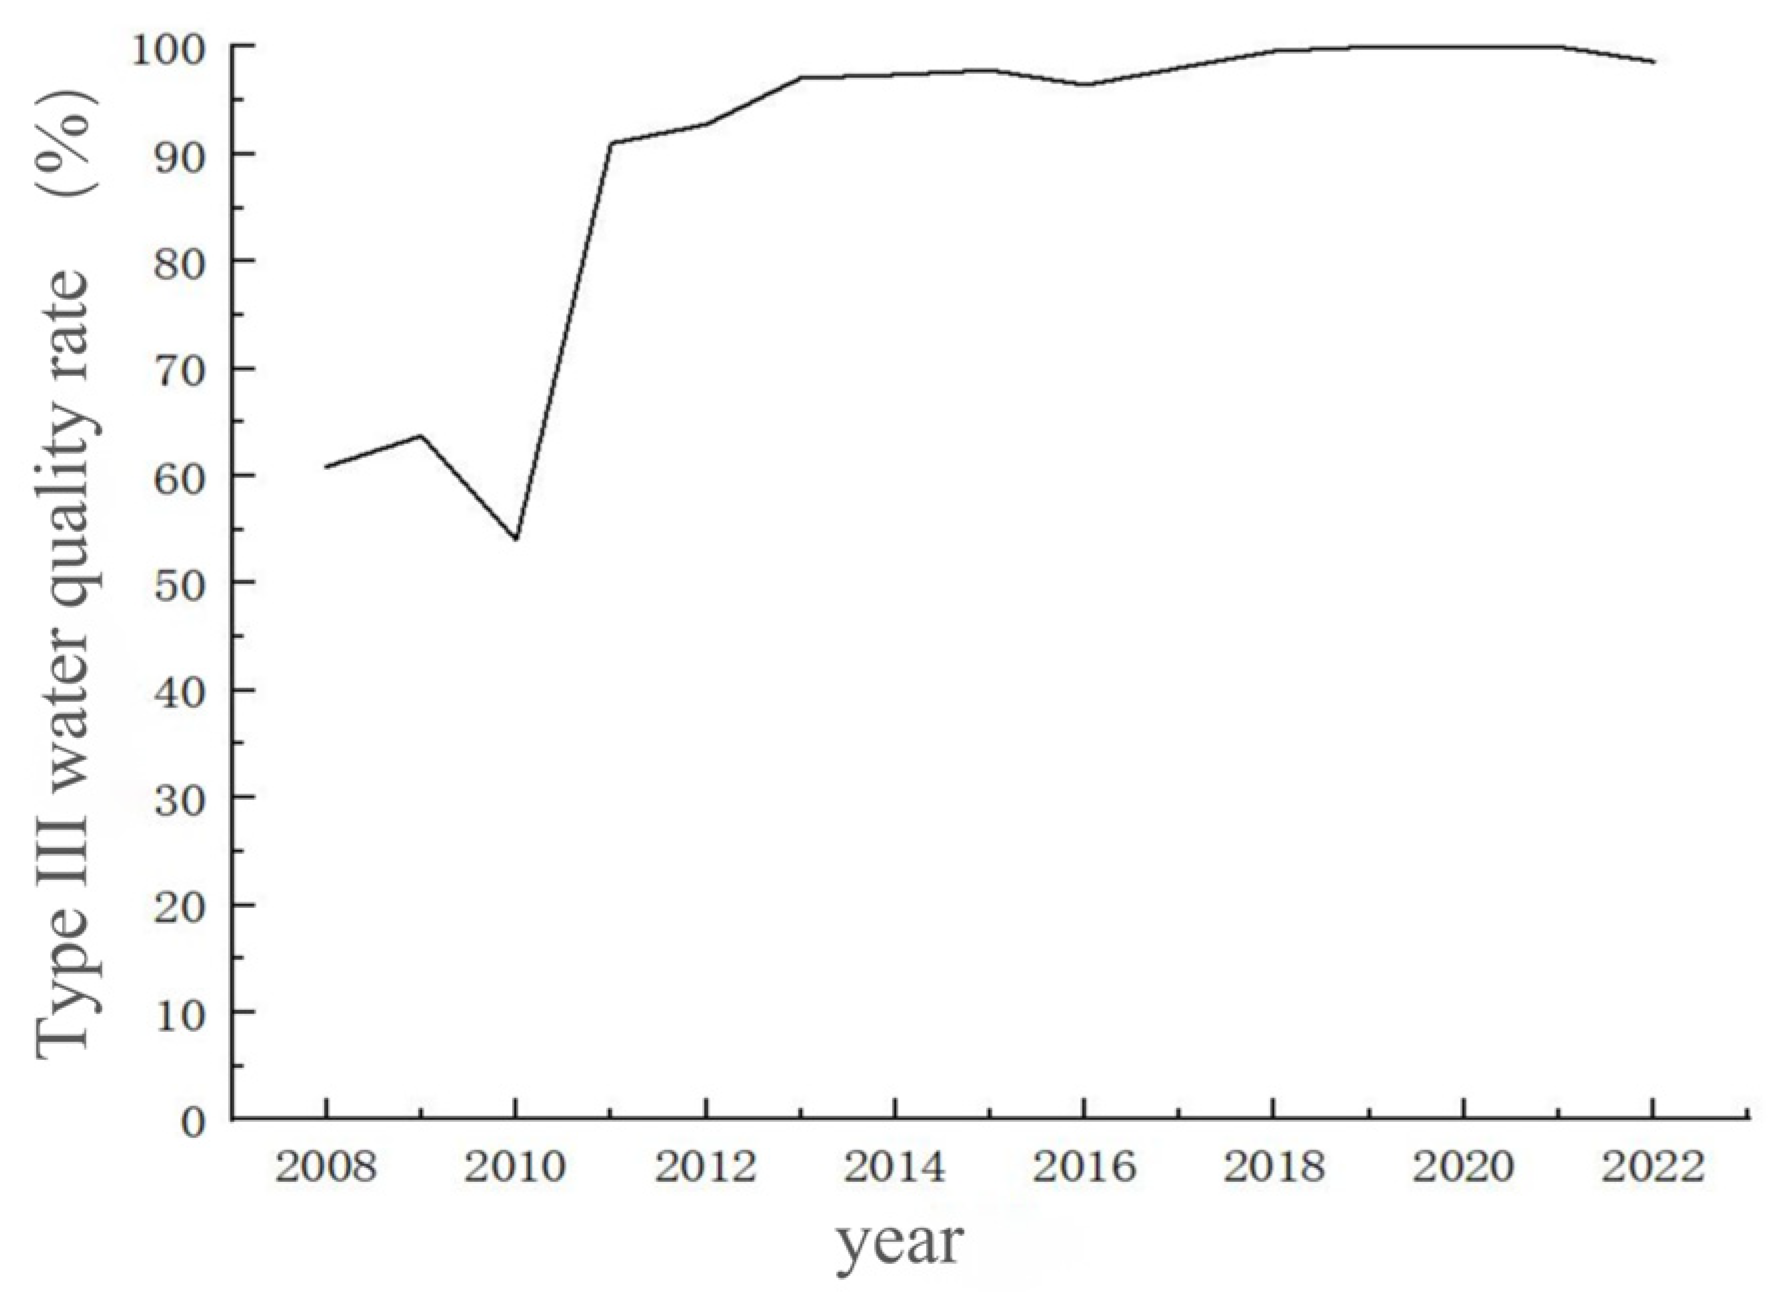
2.2.2. Water Quality and Environment
2.2.3. Economic and Social Conditions
3. Evaluation and Forecasting Methods
3.1. Evaluation Models and Methods
3.1.1. Evaluation Modelling Framework
3.1.2. TOPSIS Method
- 1.
- A set of data with a sample size of m and a number of indicators of n is processed with the same trend, and then the data are dimensionless according to the following formula, i.e., a dimensionless decision matrix:
- 2.
- Determine the optimal solution and the worst solution for each indicator:
- 3.
- Determine the weighted Euclidean distance between each evaluation object and the optimal and worst solutions and :where wj is the combination weight of indicator j.
- 4.
- Determine the proximity :
3.2. BP Neural Network Prediction Method
3.3. Screening the Indicator System
3.4. Data Sources and Pre-Processing
3.4.1. Data Sources
3.4.2. Data Processing
- 1.
- Standardized treatment
- 2.
- Weight calculation method
4. Measurement and Analysis of Water Carrying Capacity
4.1. Measurement of Water Carrying Capacity
4.1.1. Weighting Values
4.1.2. Evaluation of Water Resources Carrying Capacity
4.2. Water Carrying Capacity Analysis
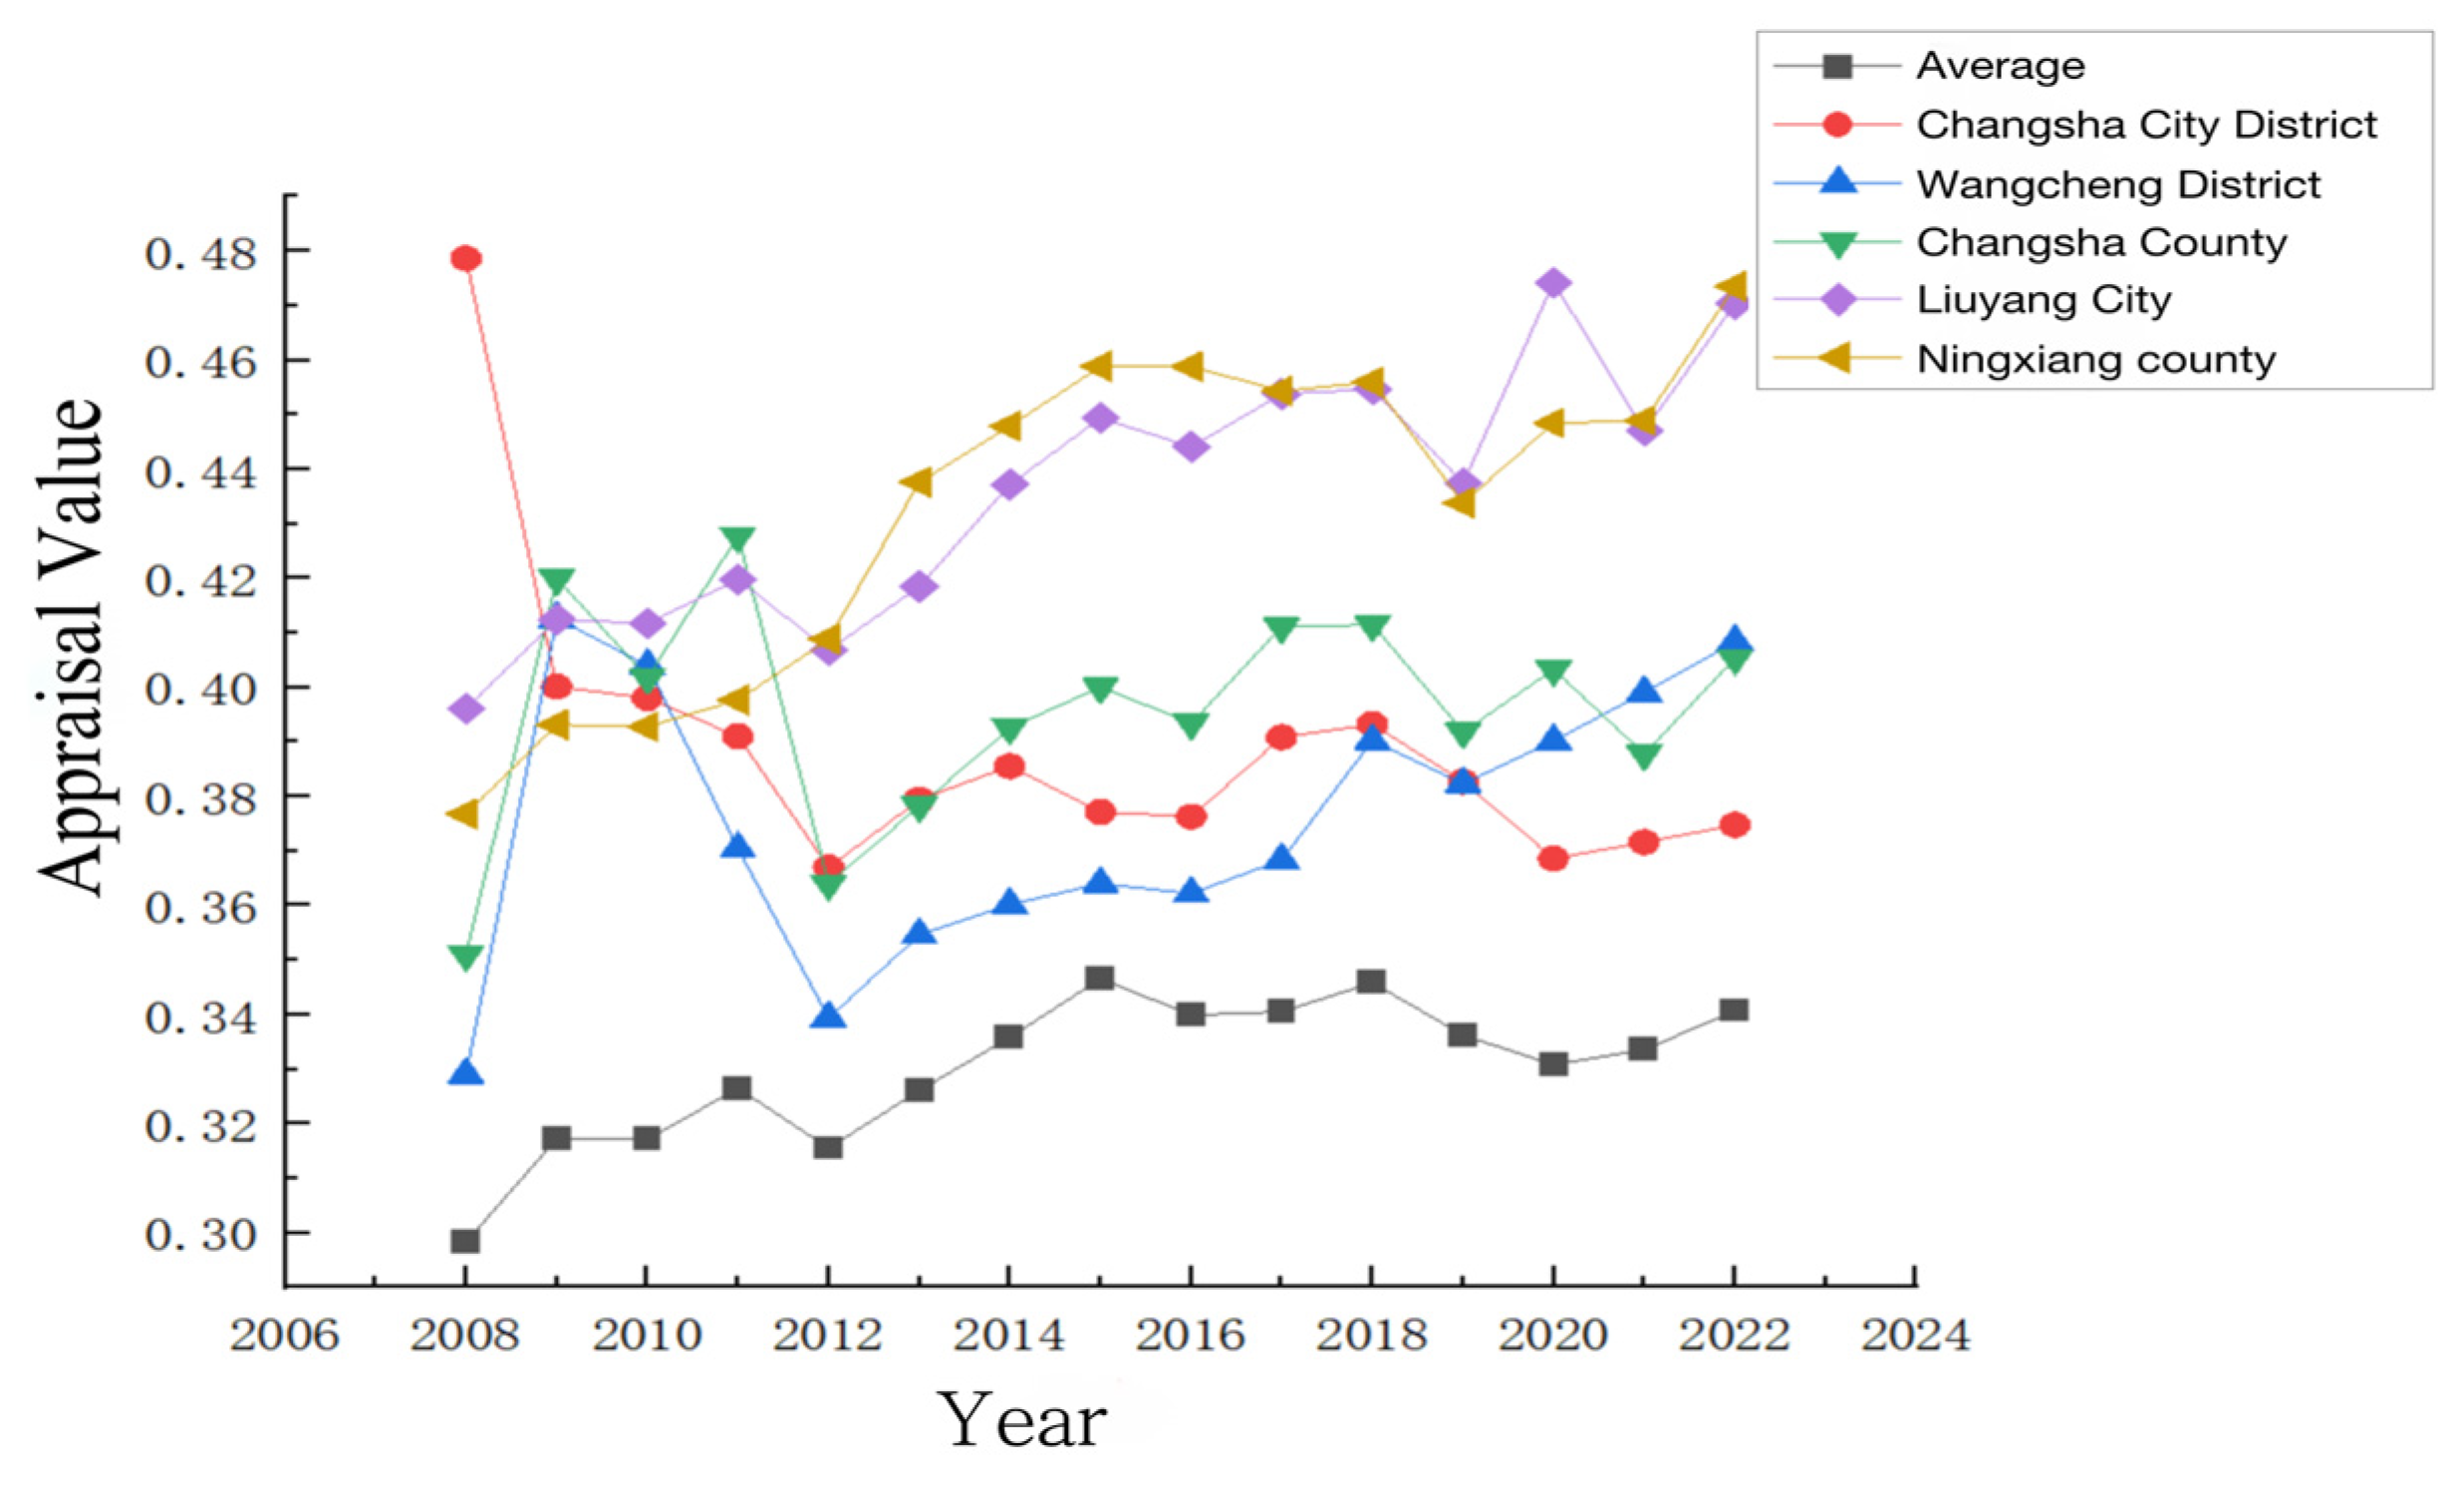
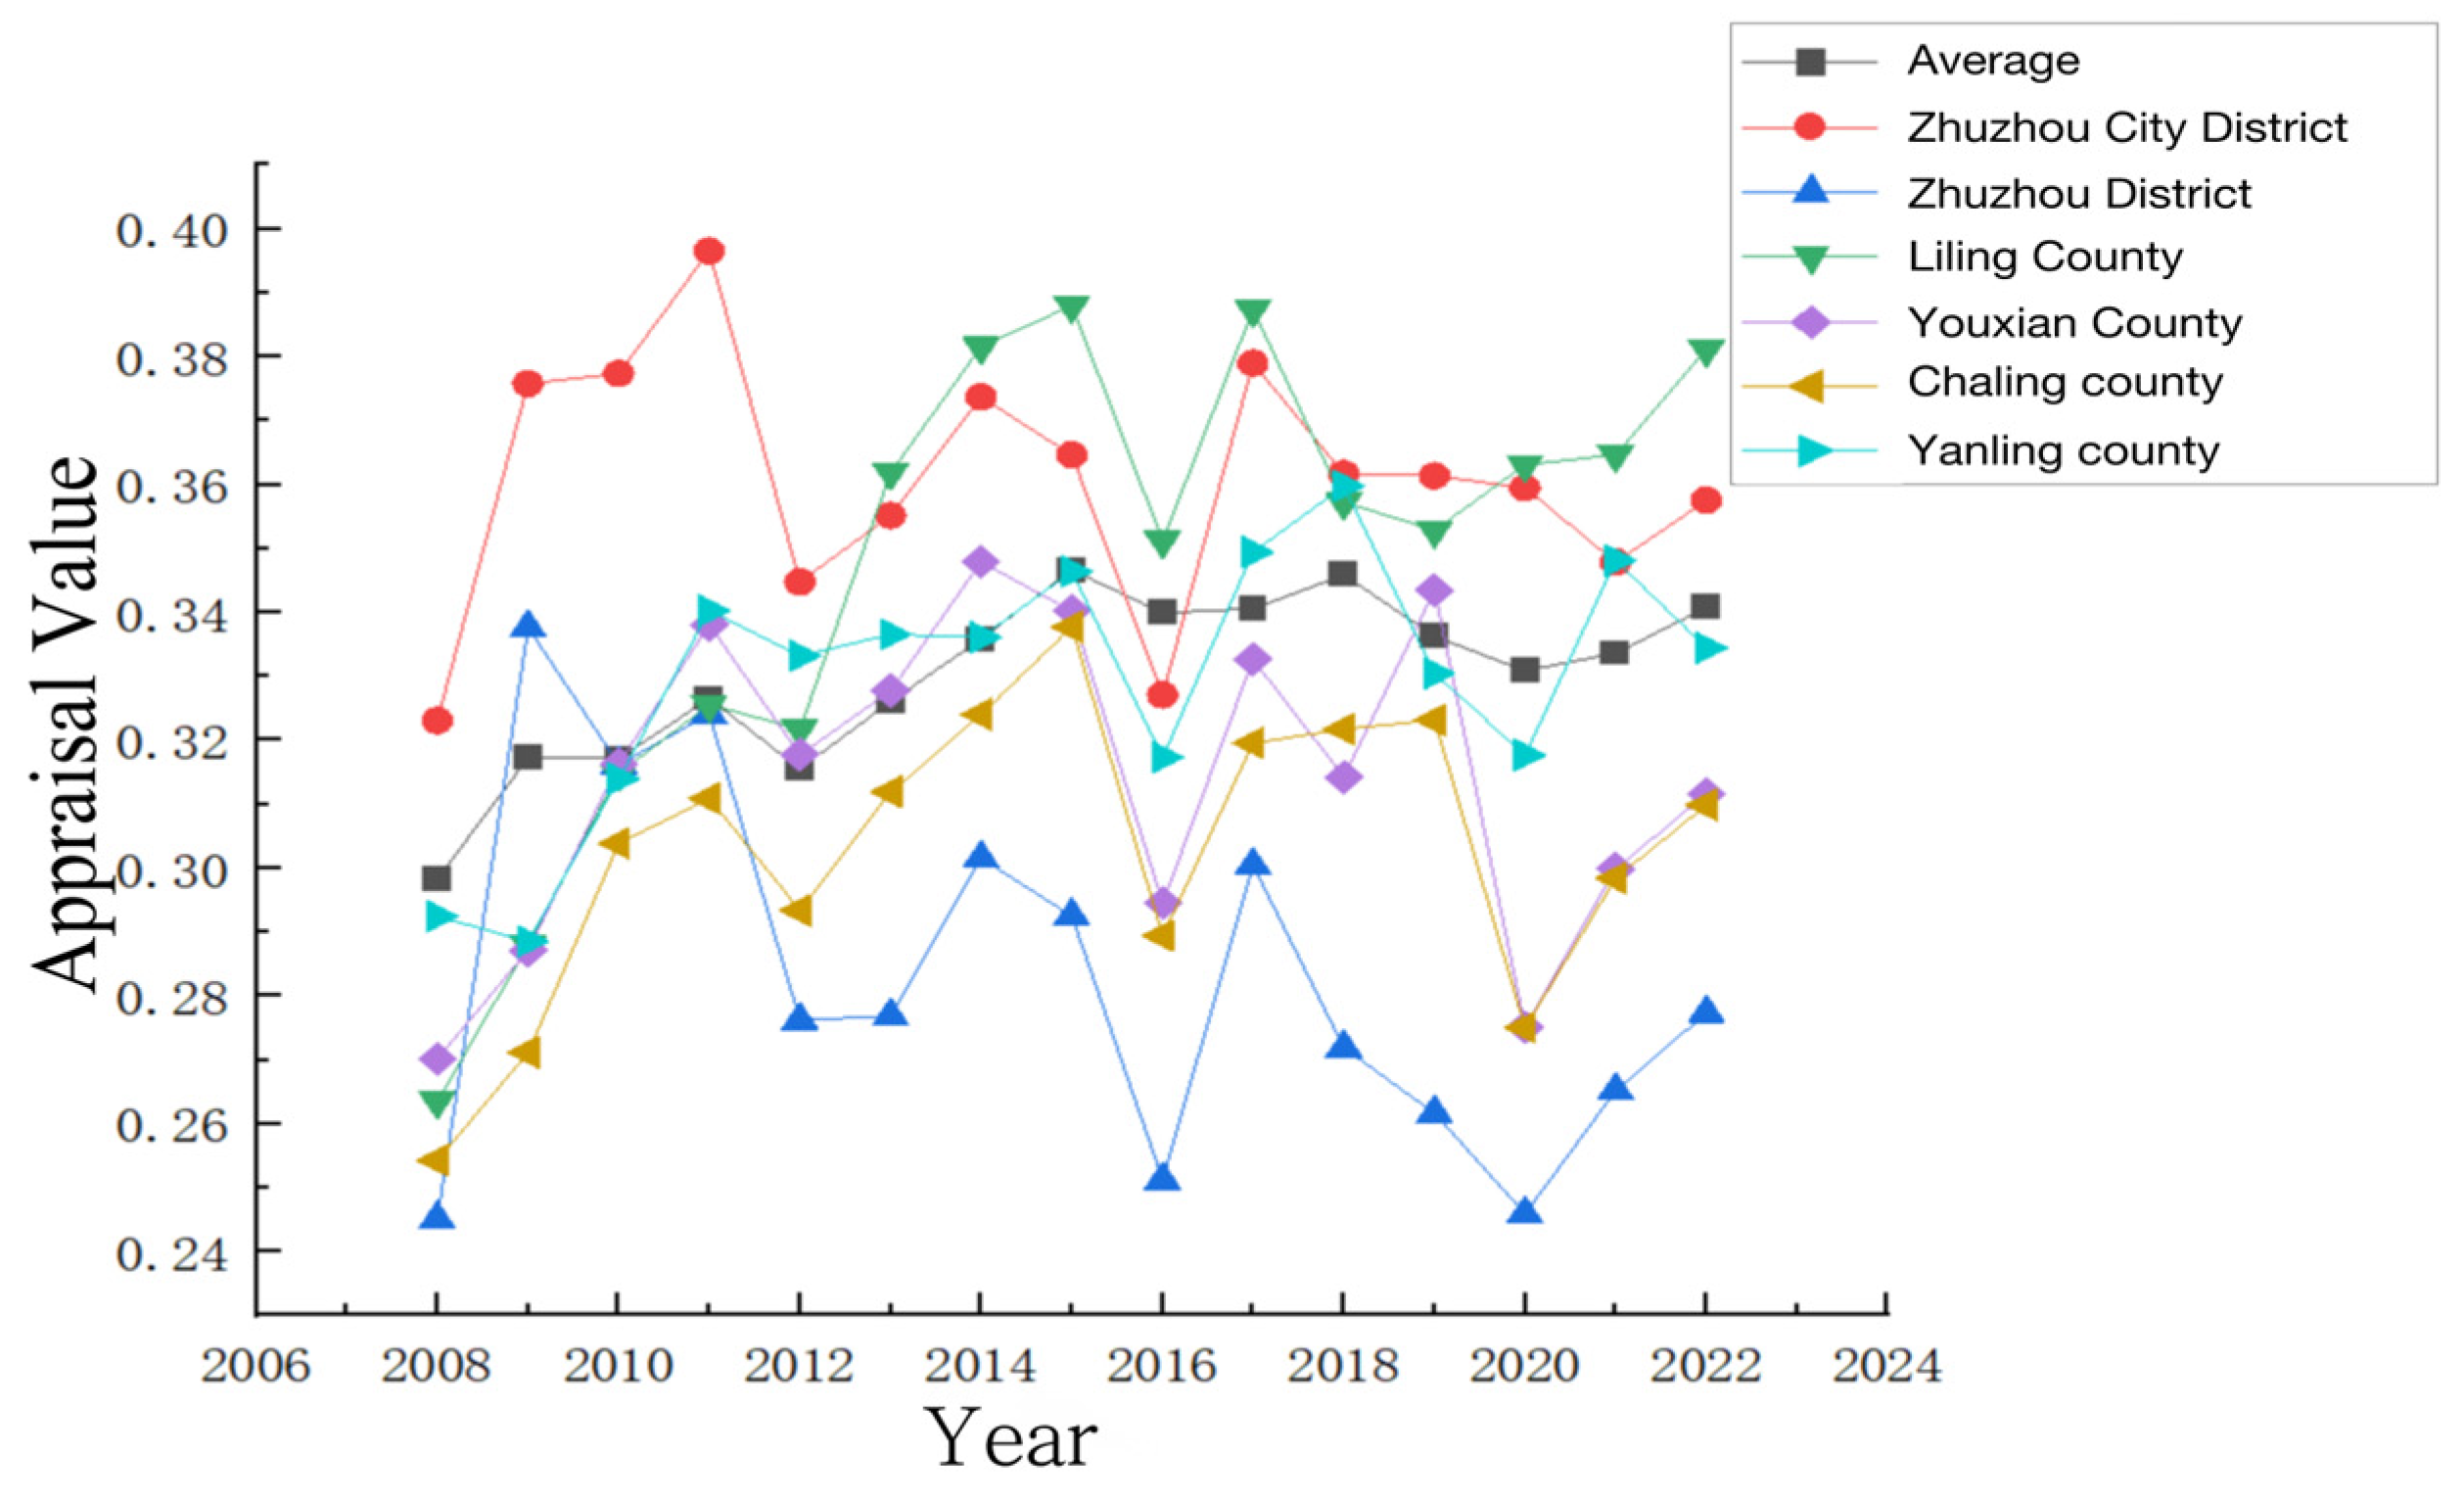
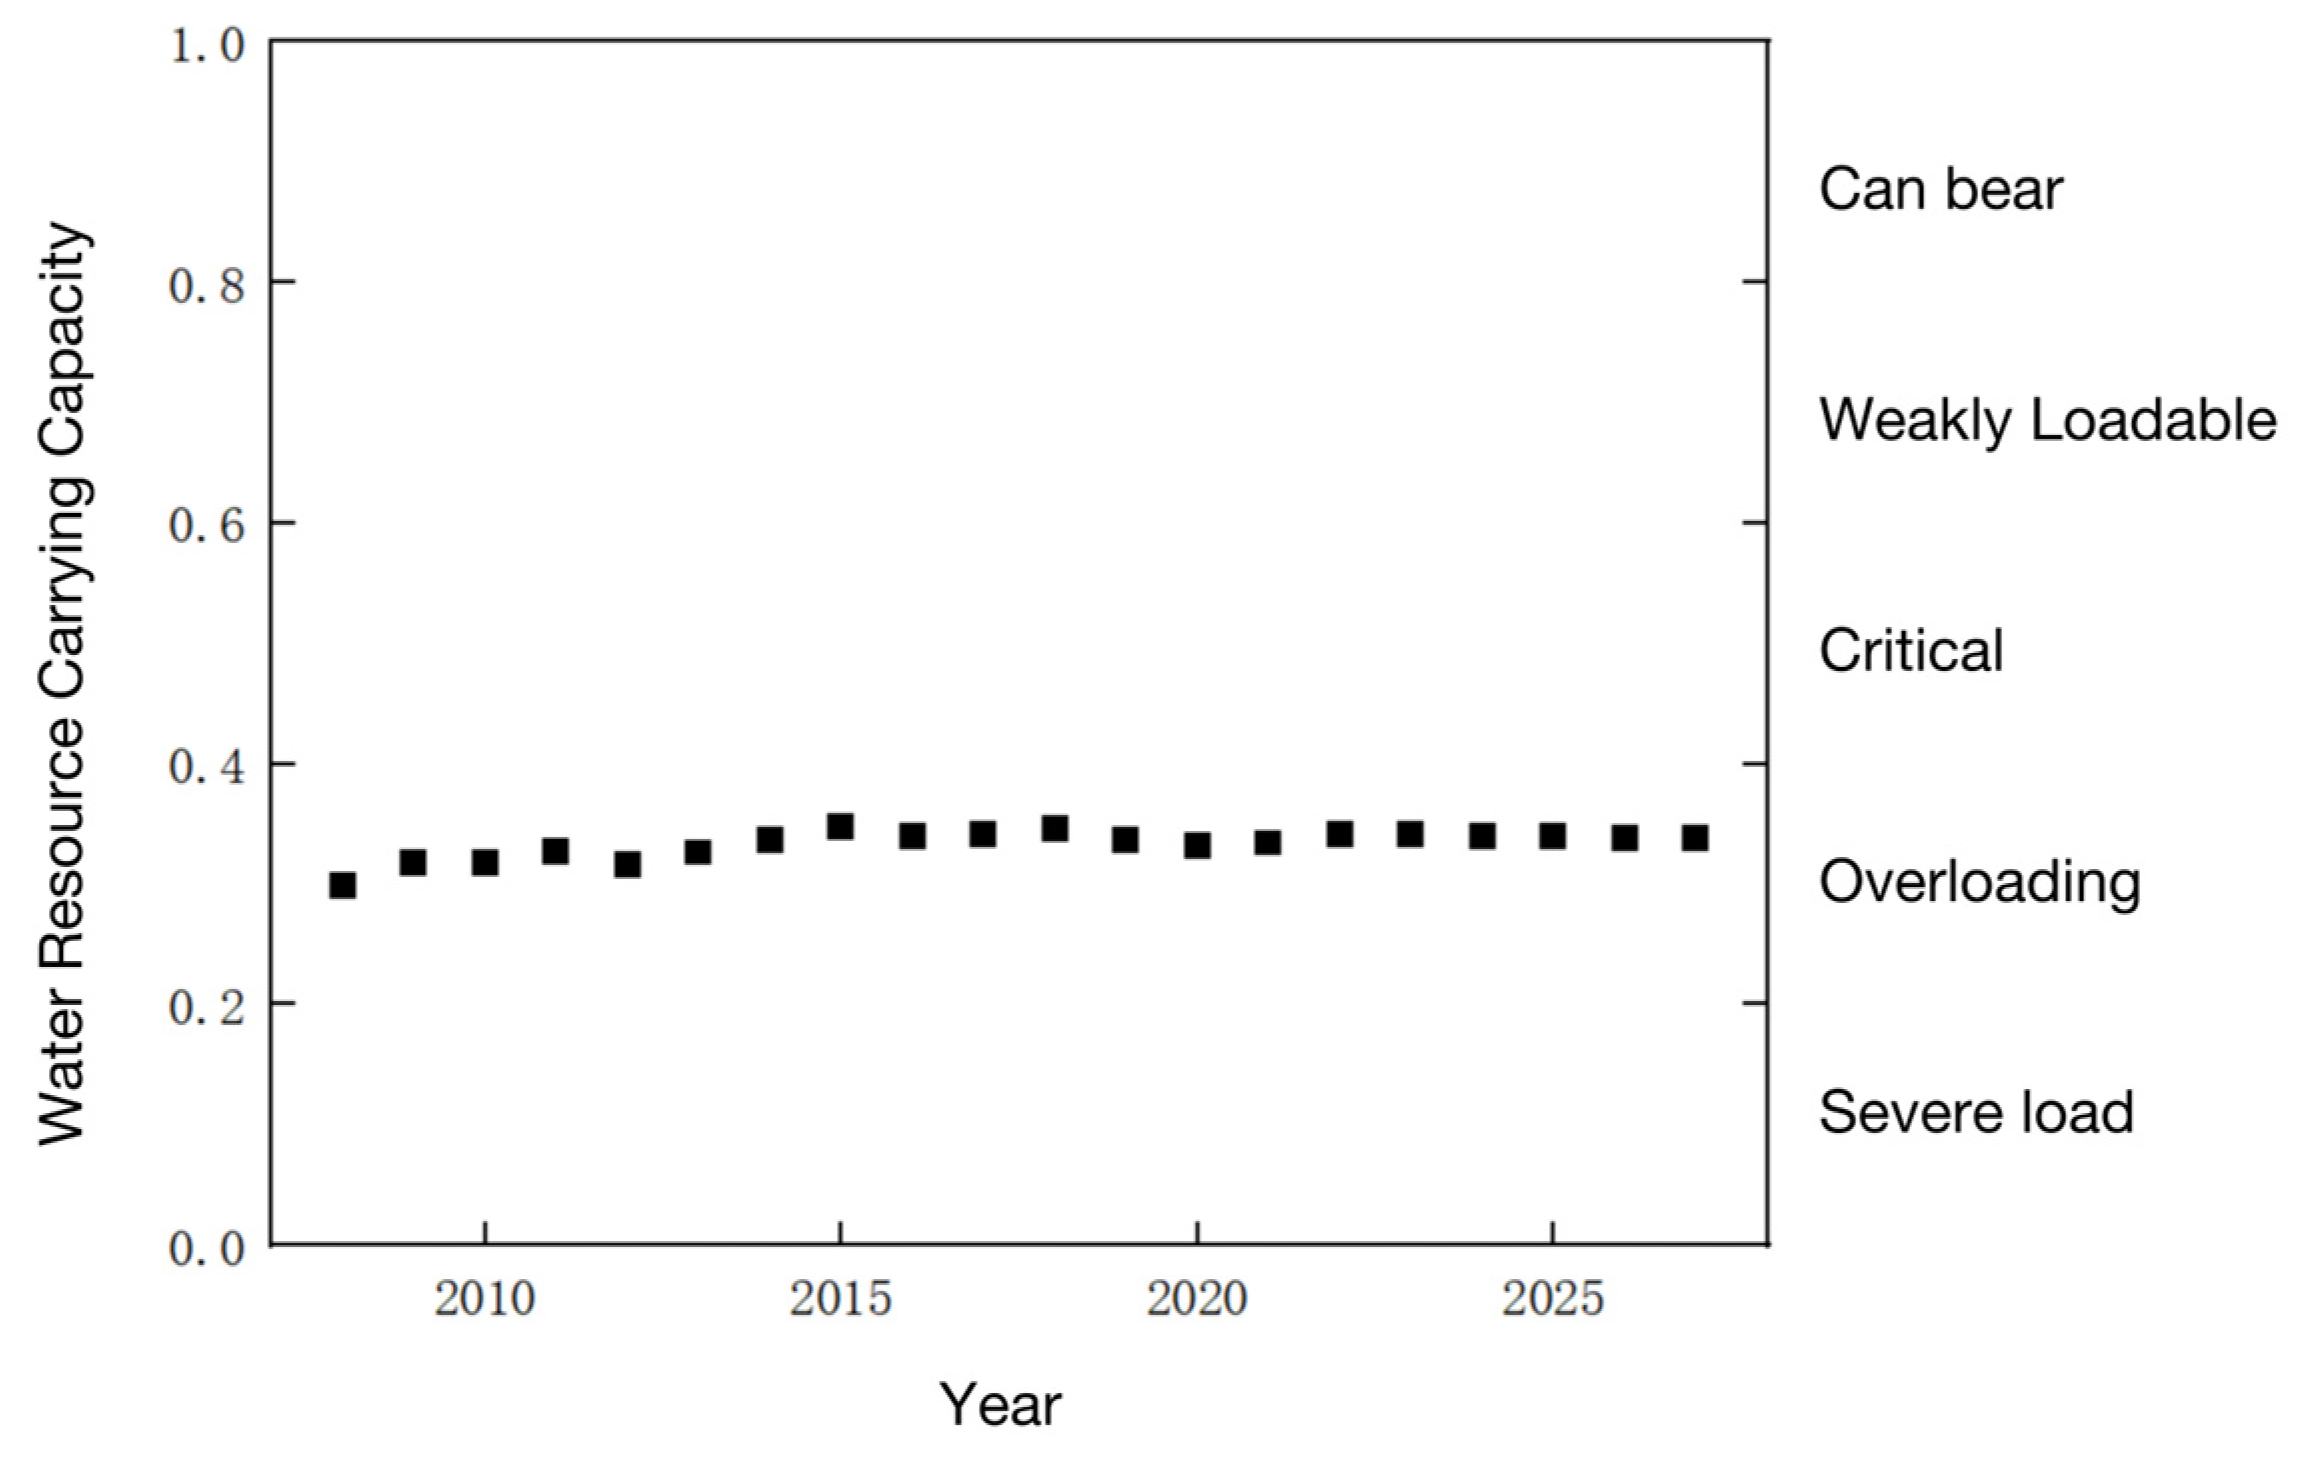
4.2.1. Time Trends
- 1.
- Changsha
- 2.
- Zhuzhou
- 3.
- Xiangtan
- 4.
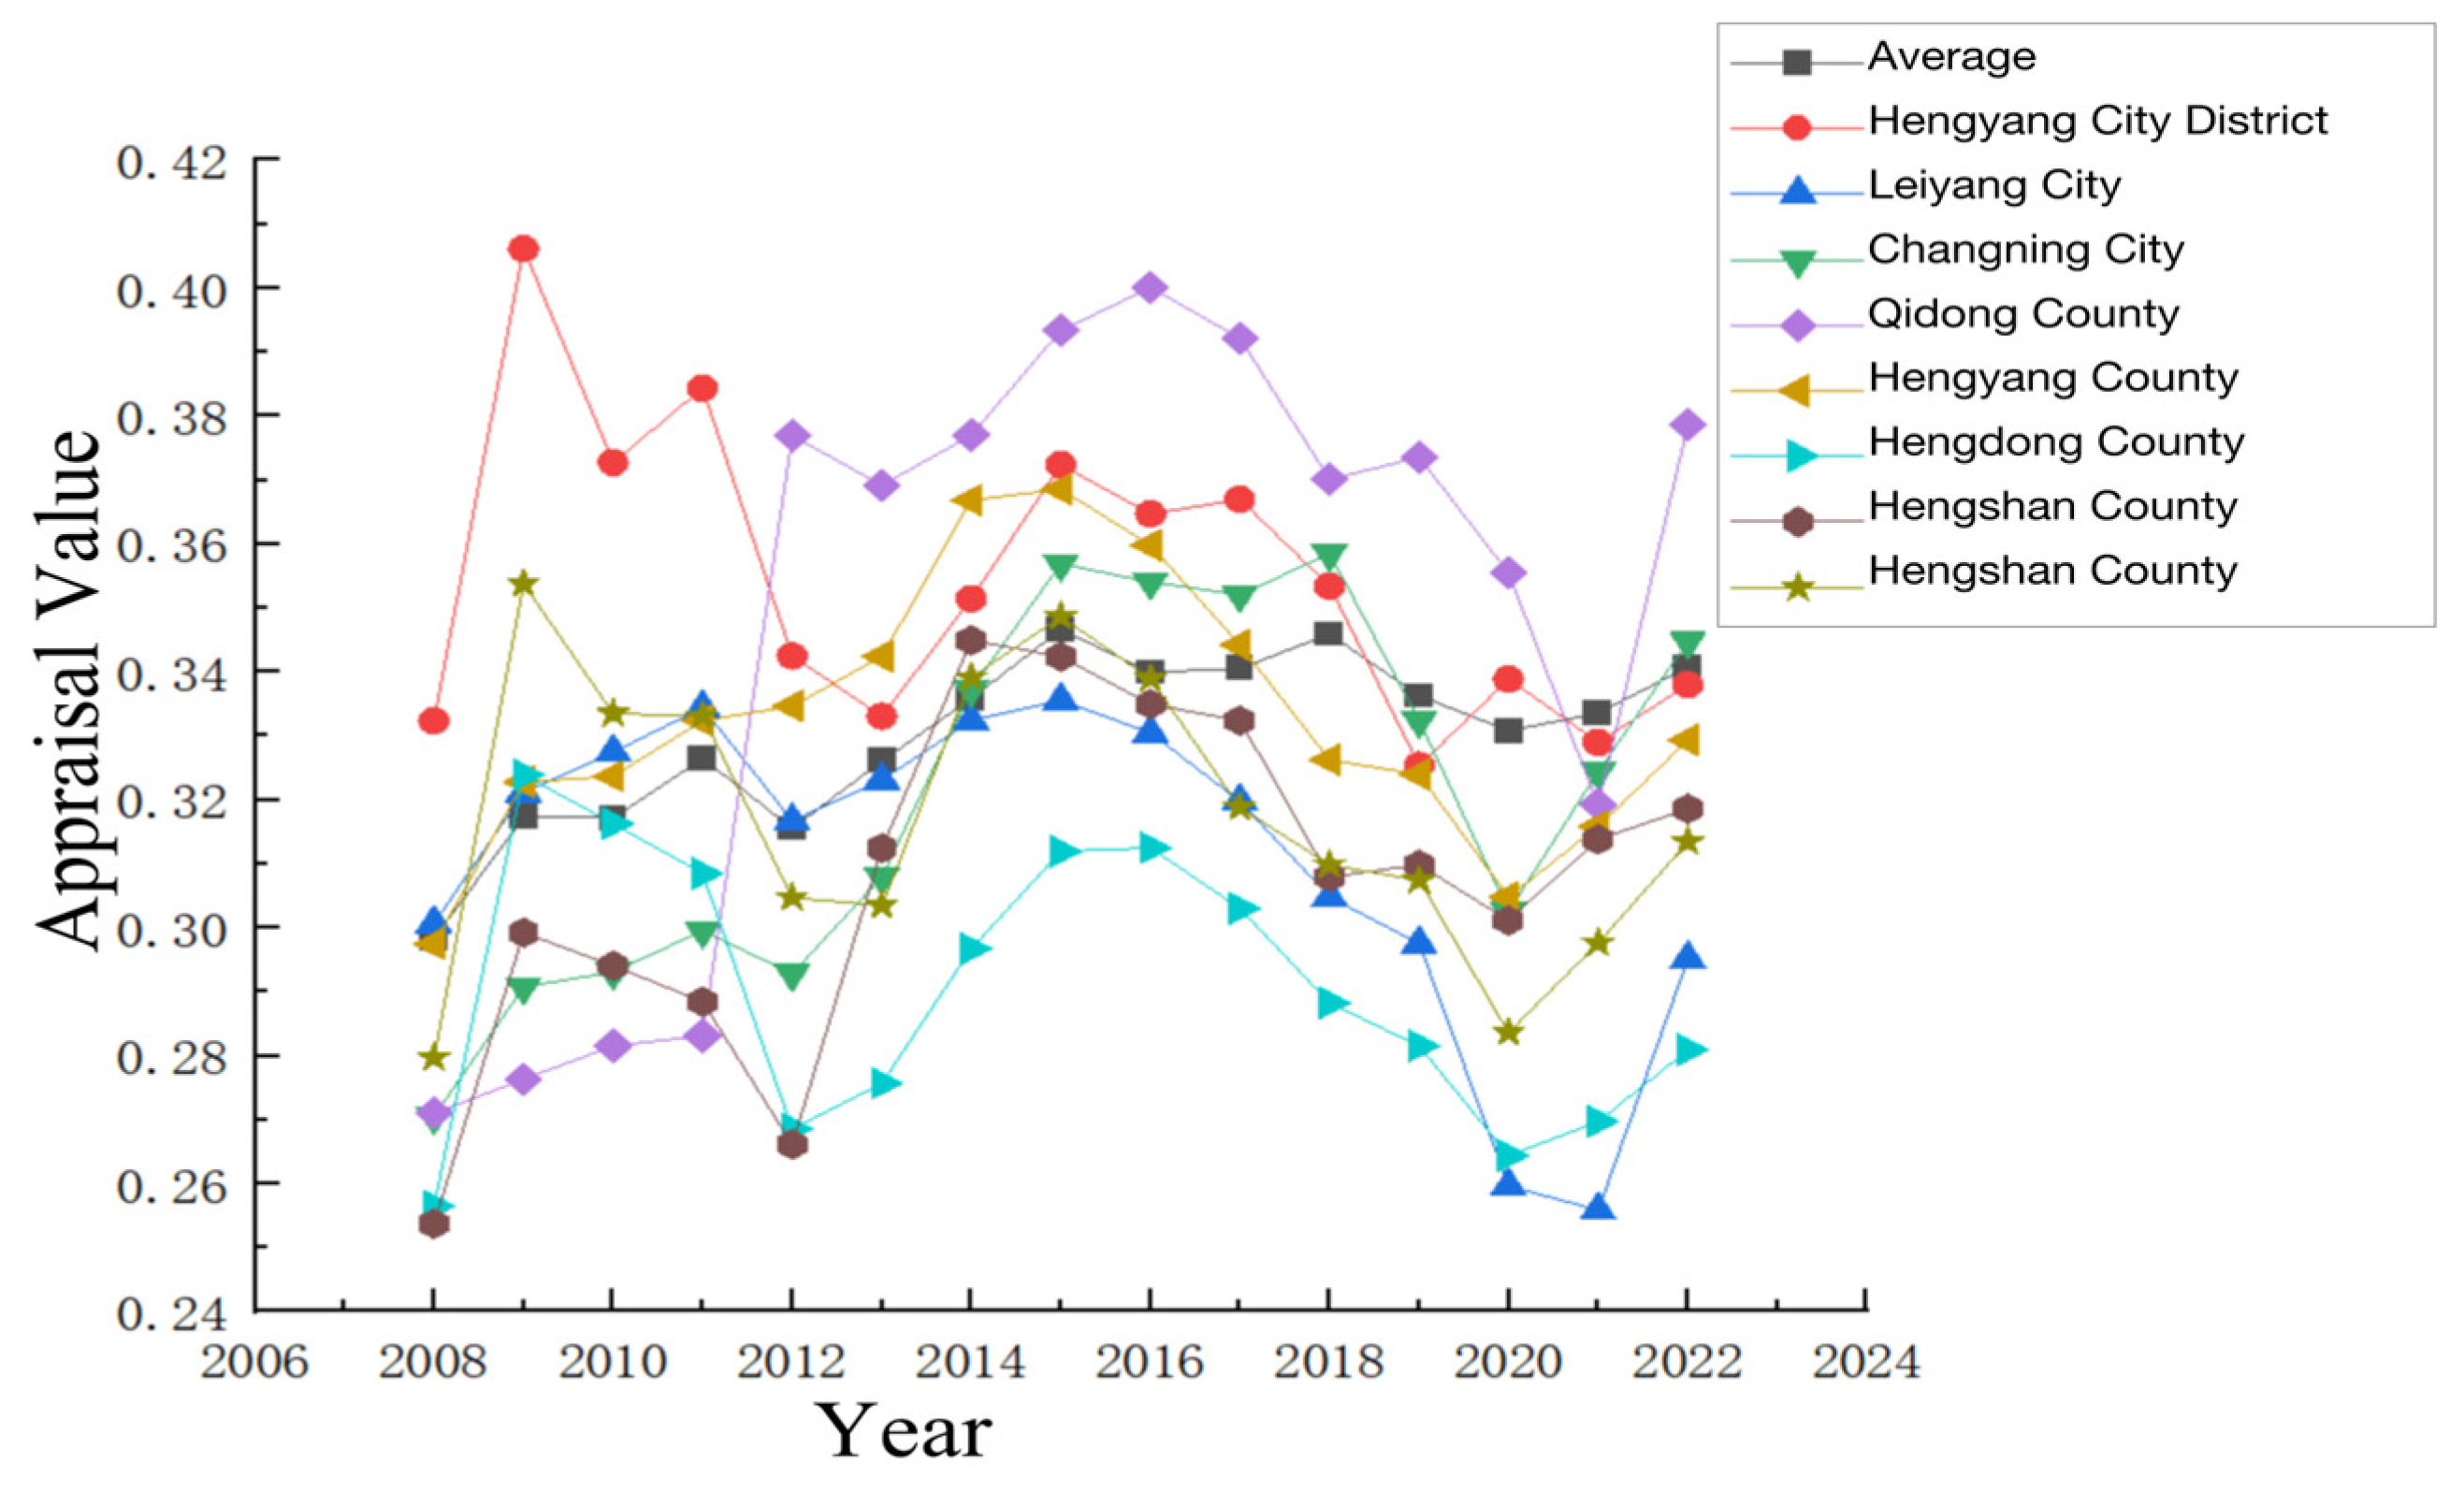
- Hengyang
- 5.
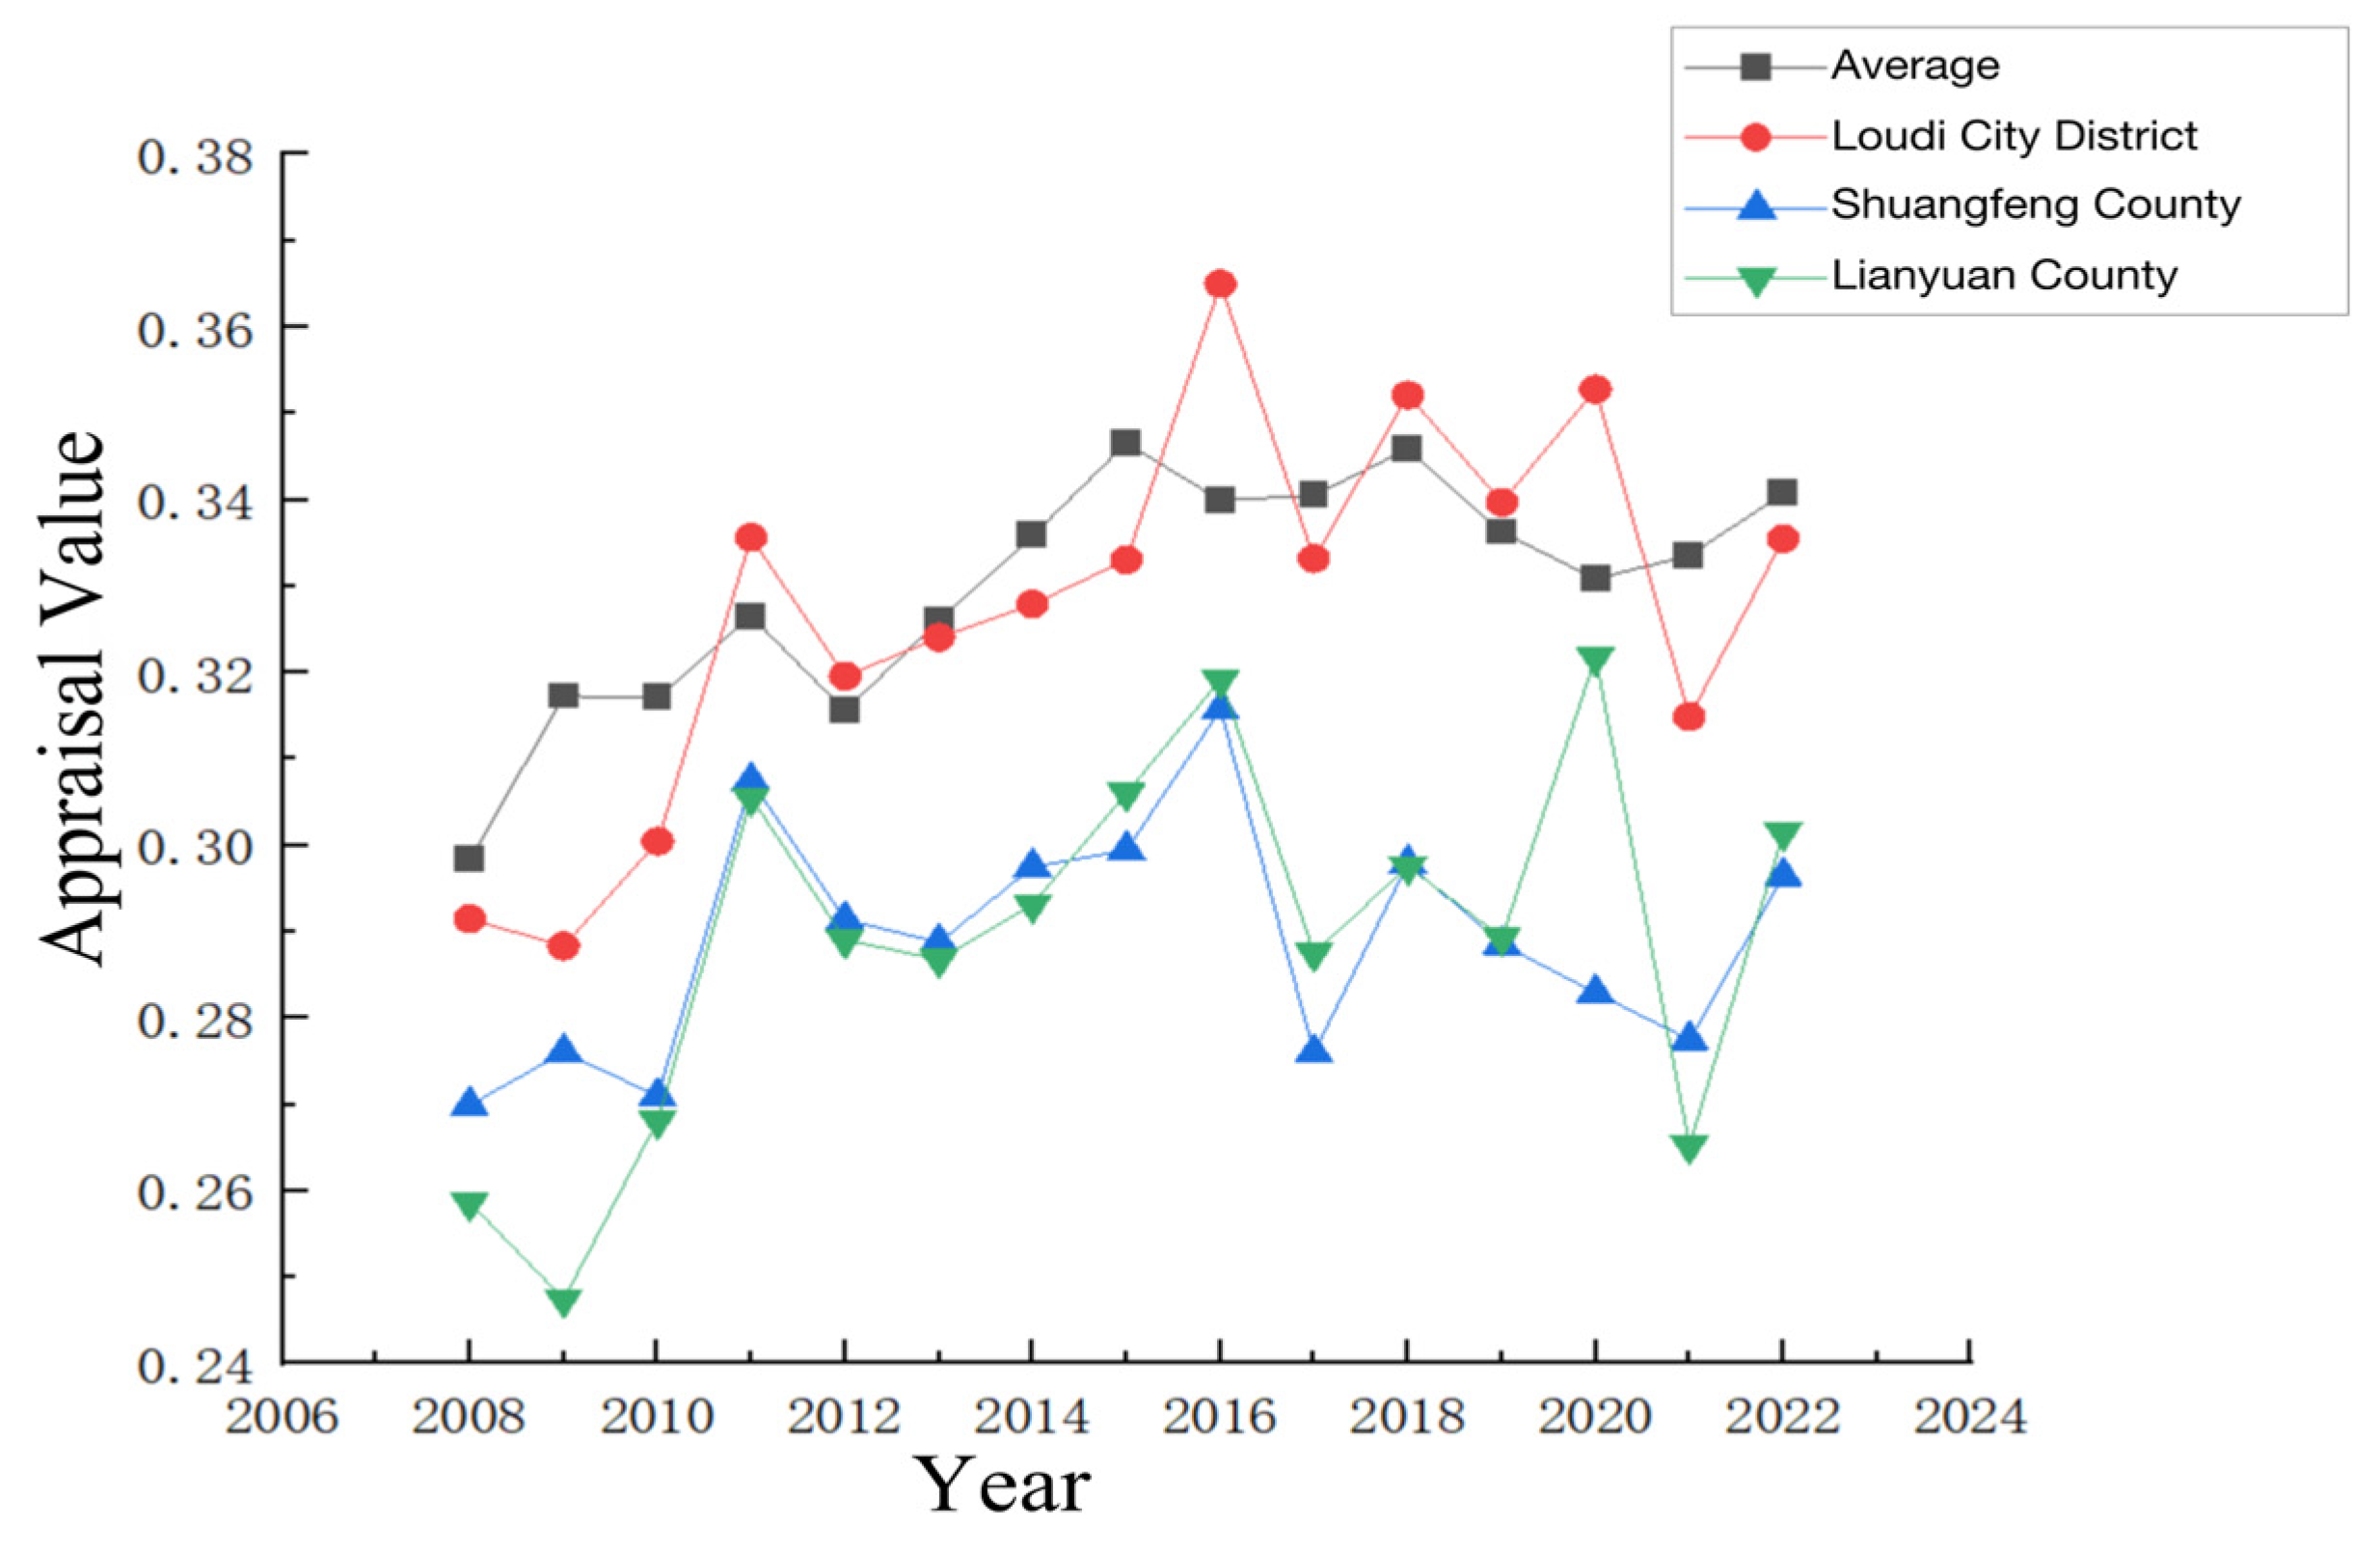
- Loudi
- 6.
- Chenzhou
- 7.
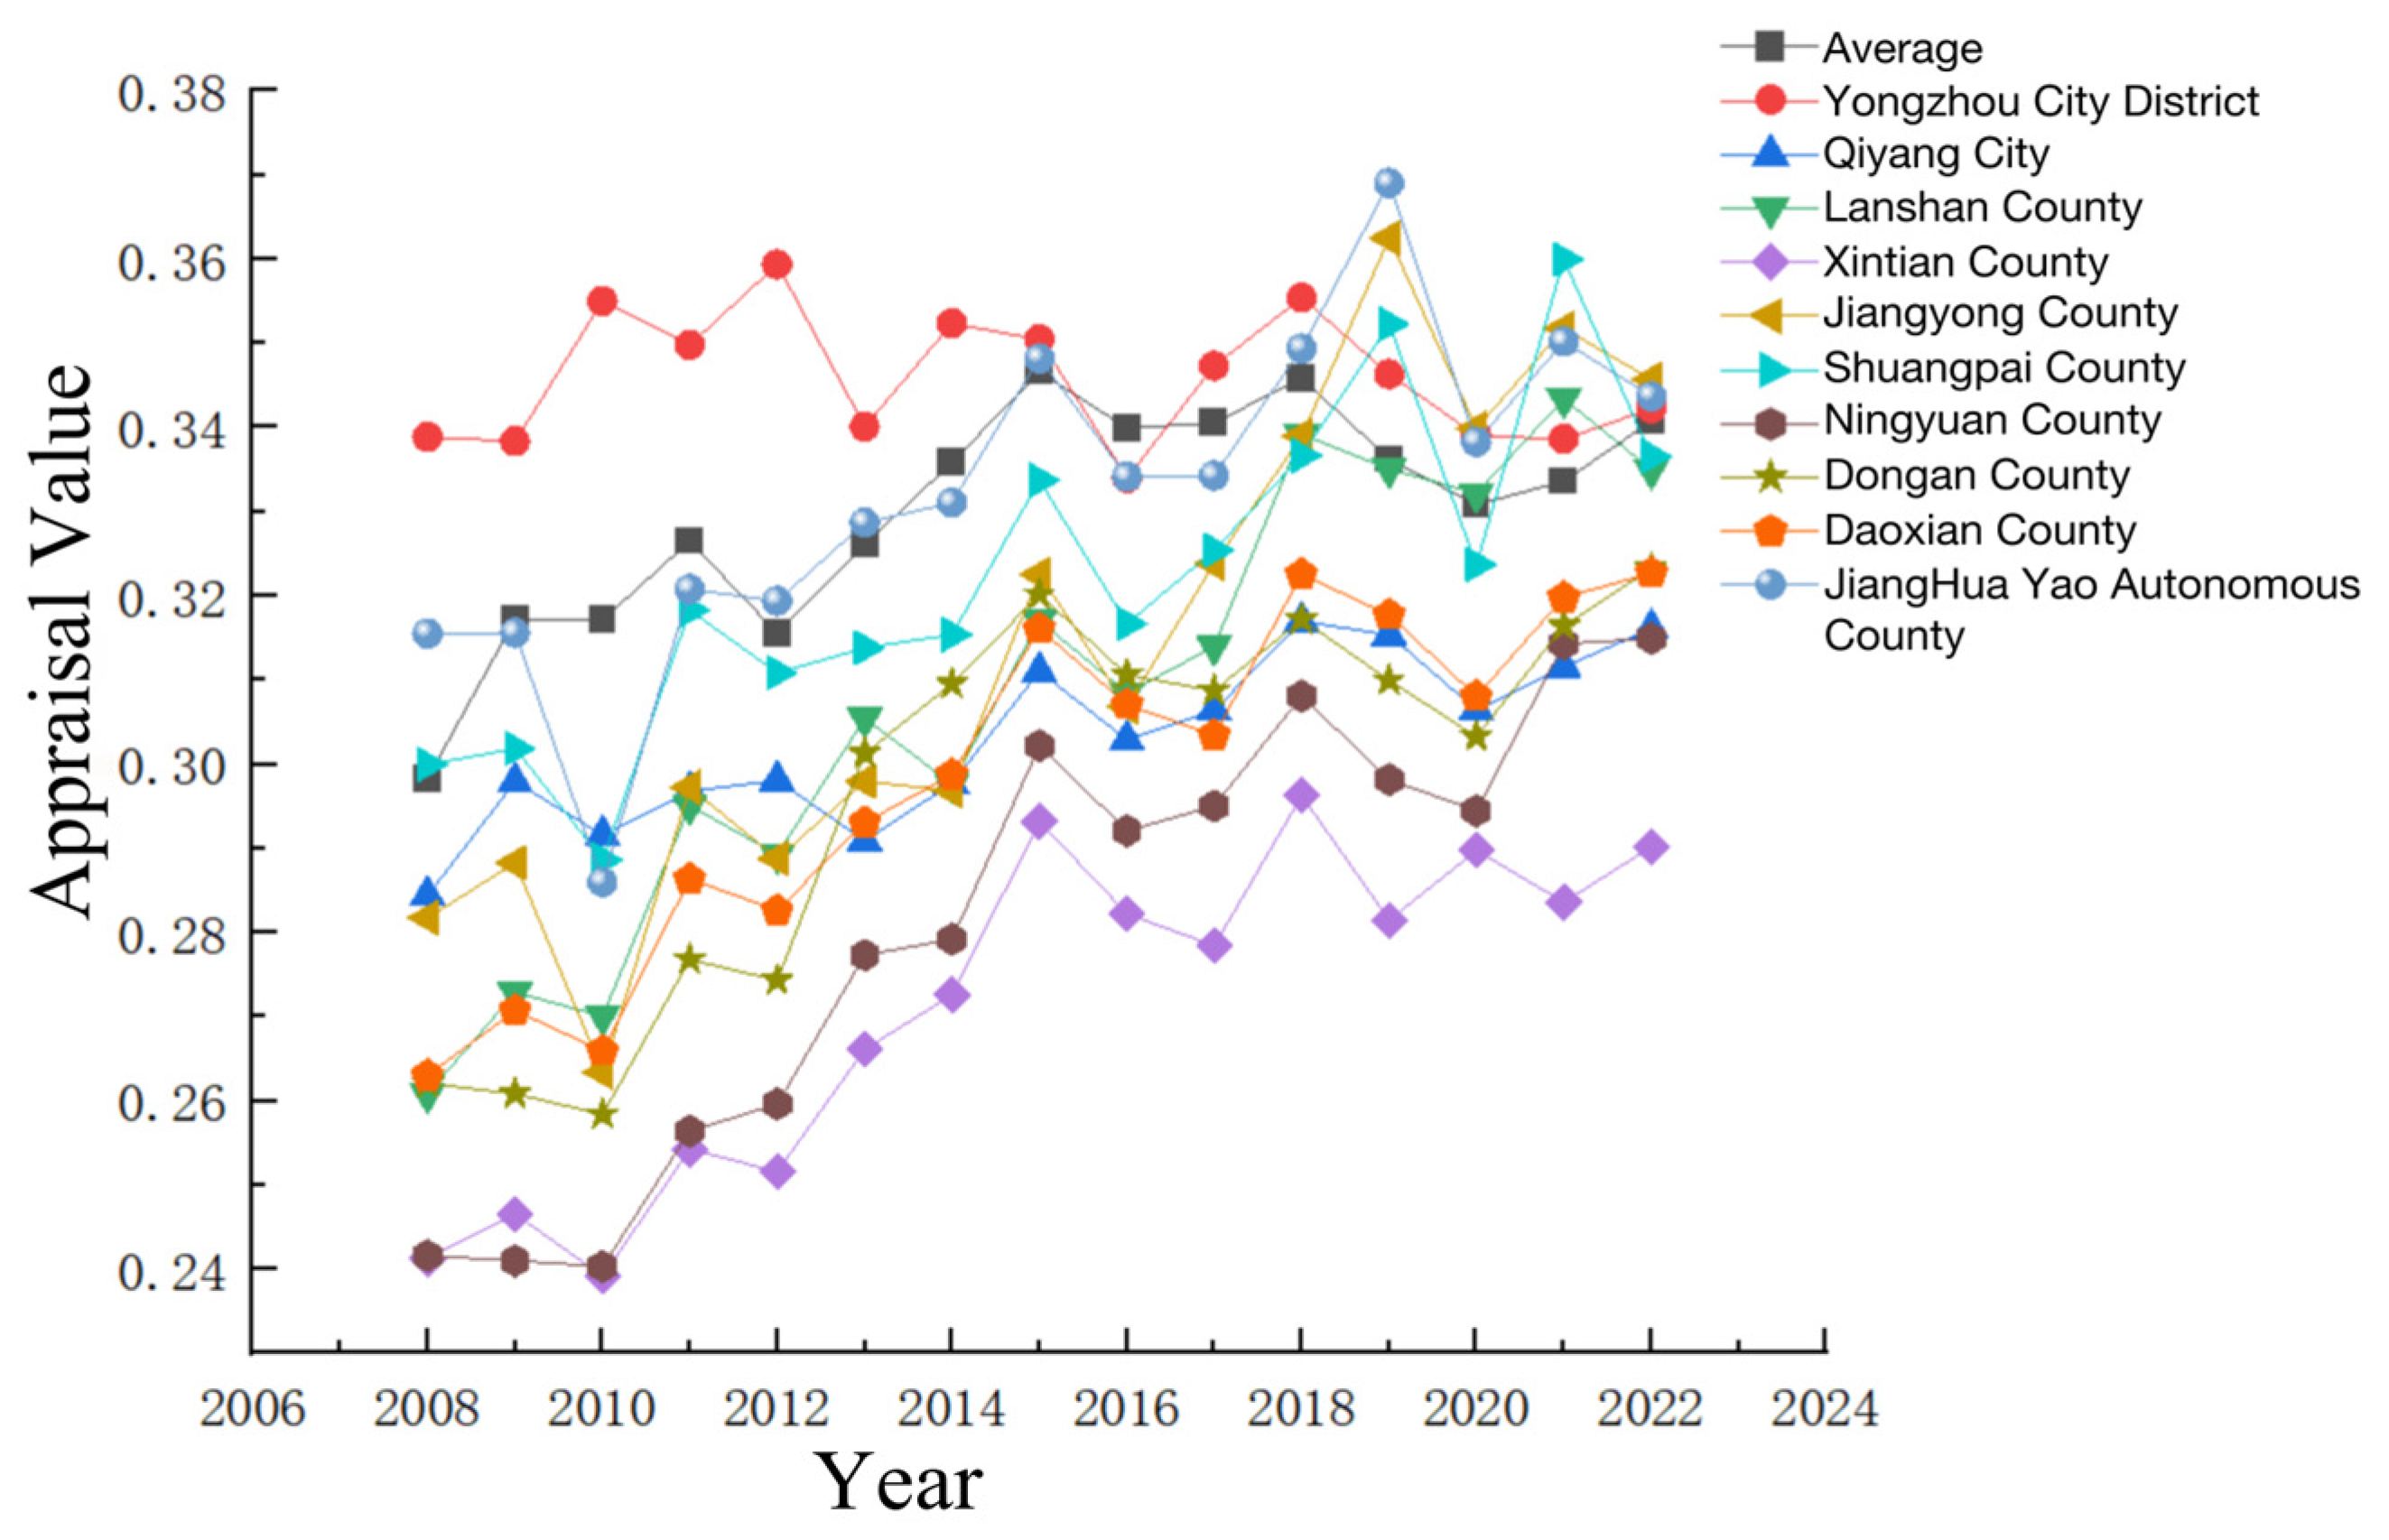
- Yongzhou
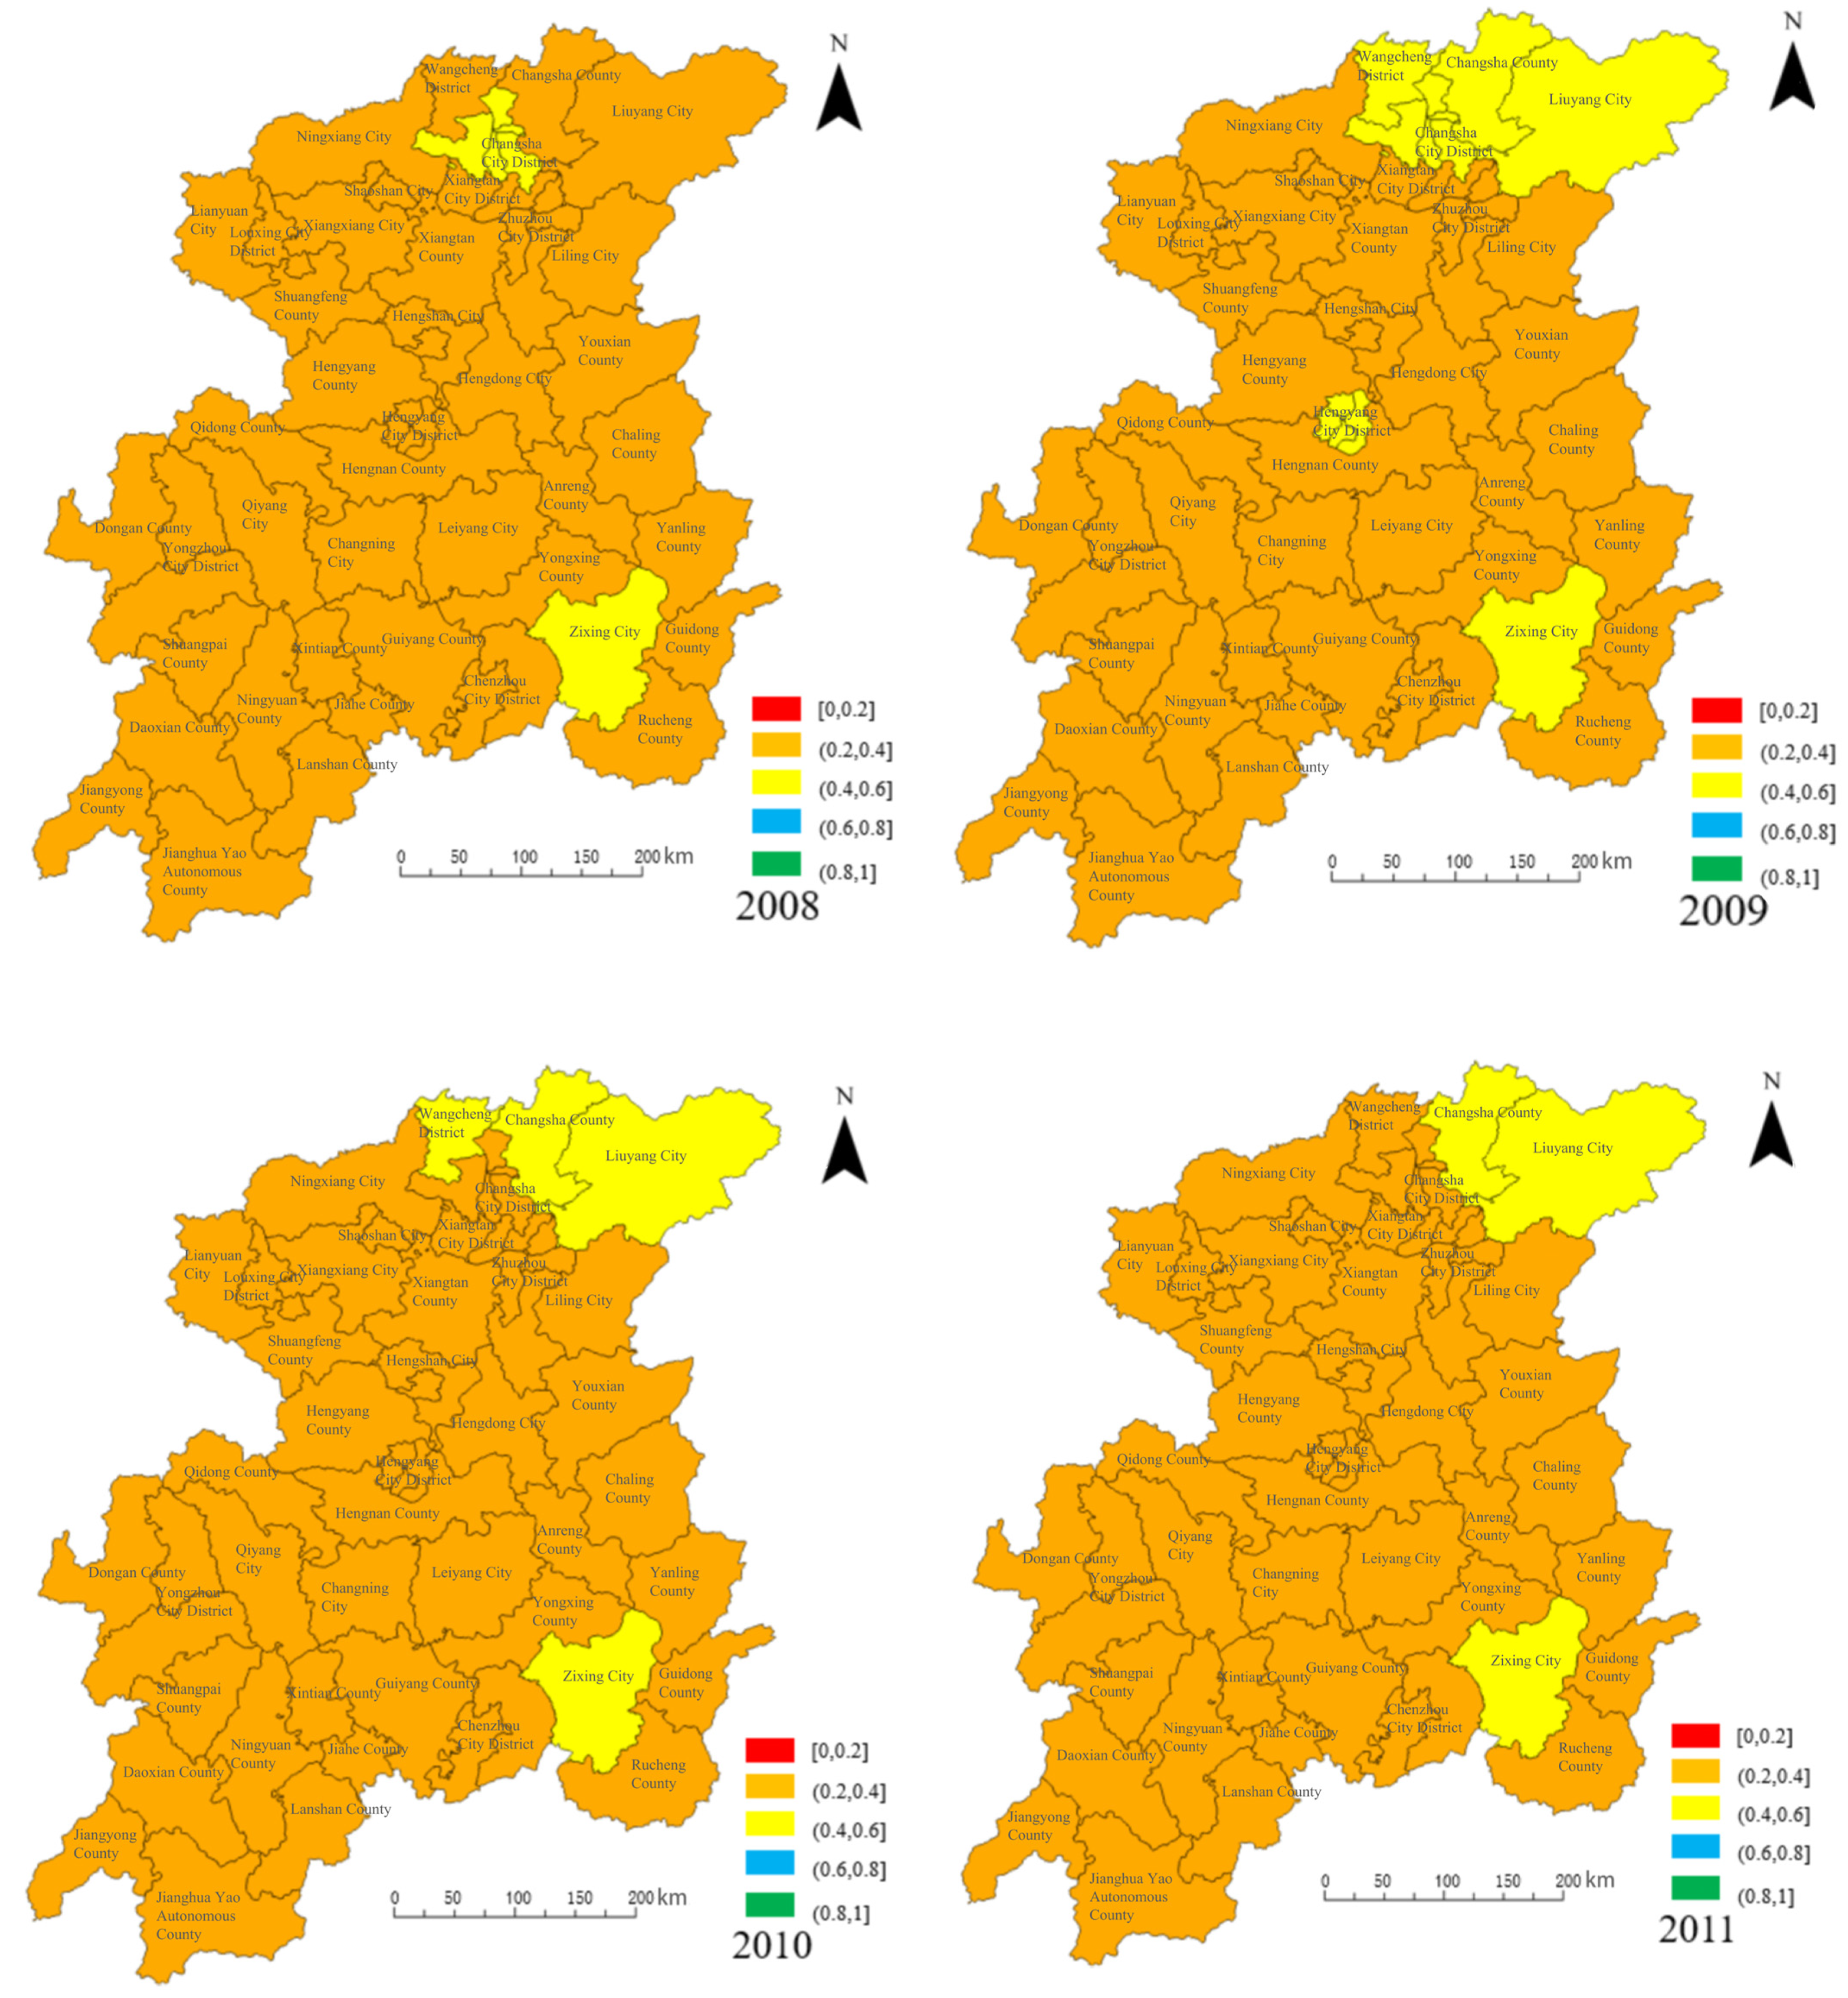
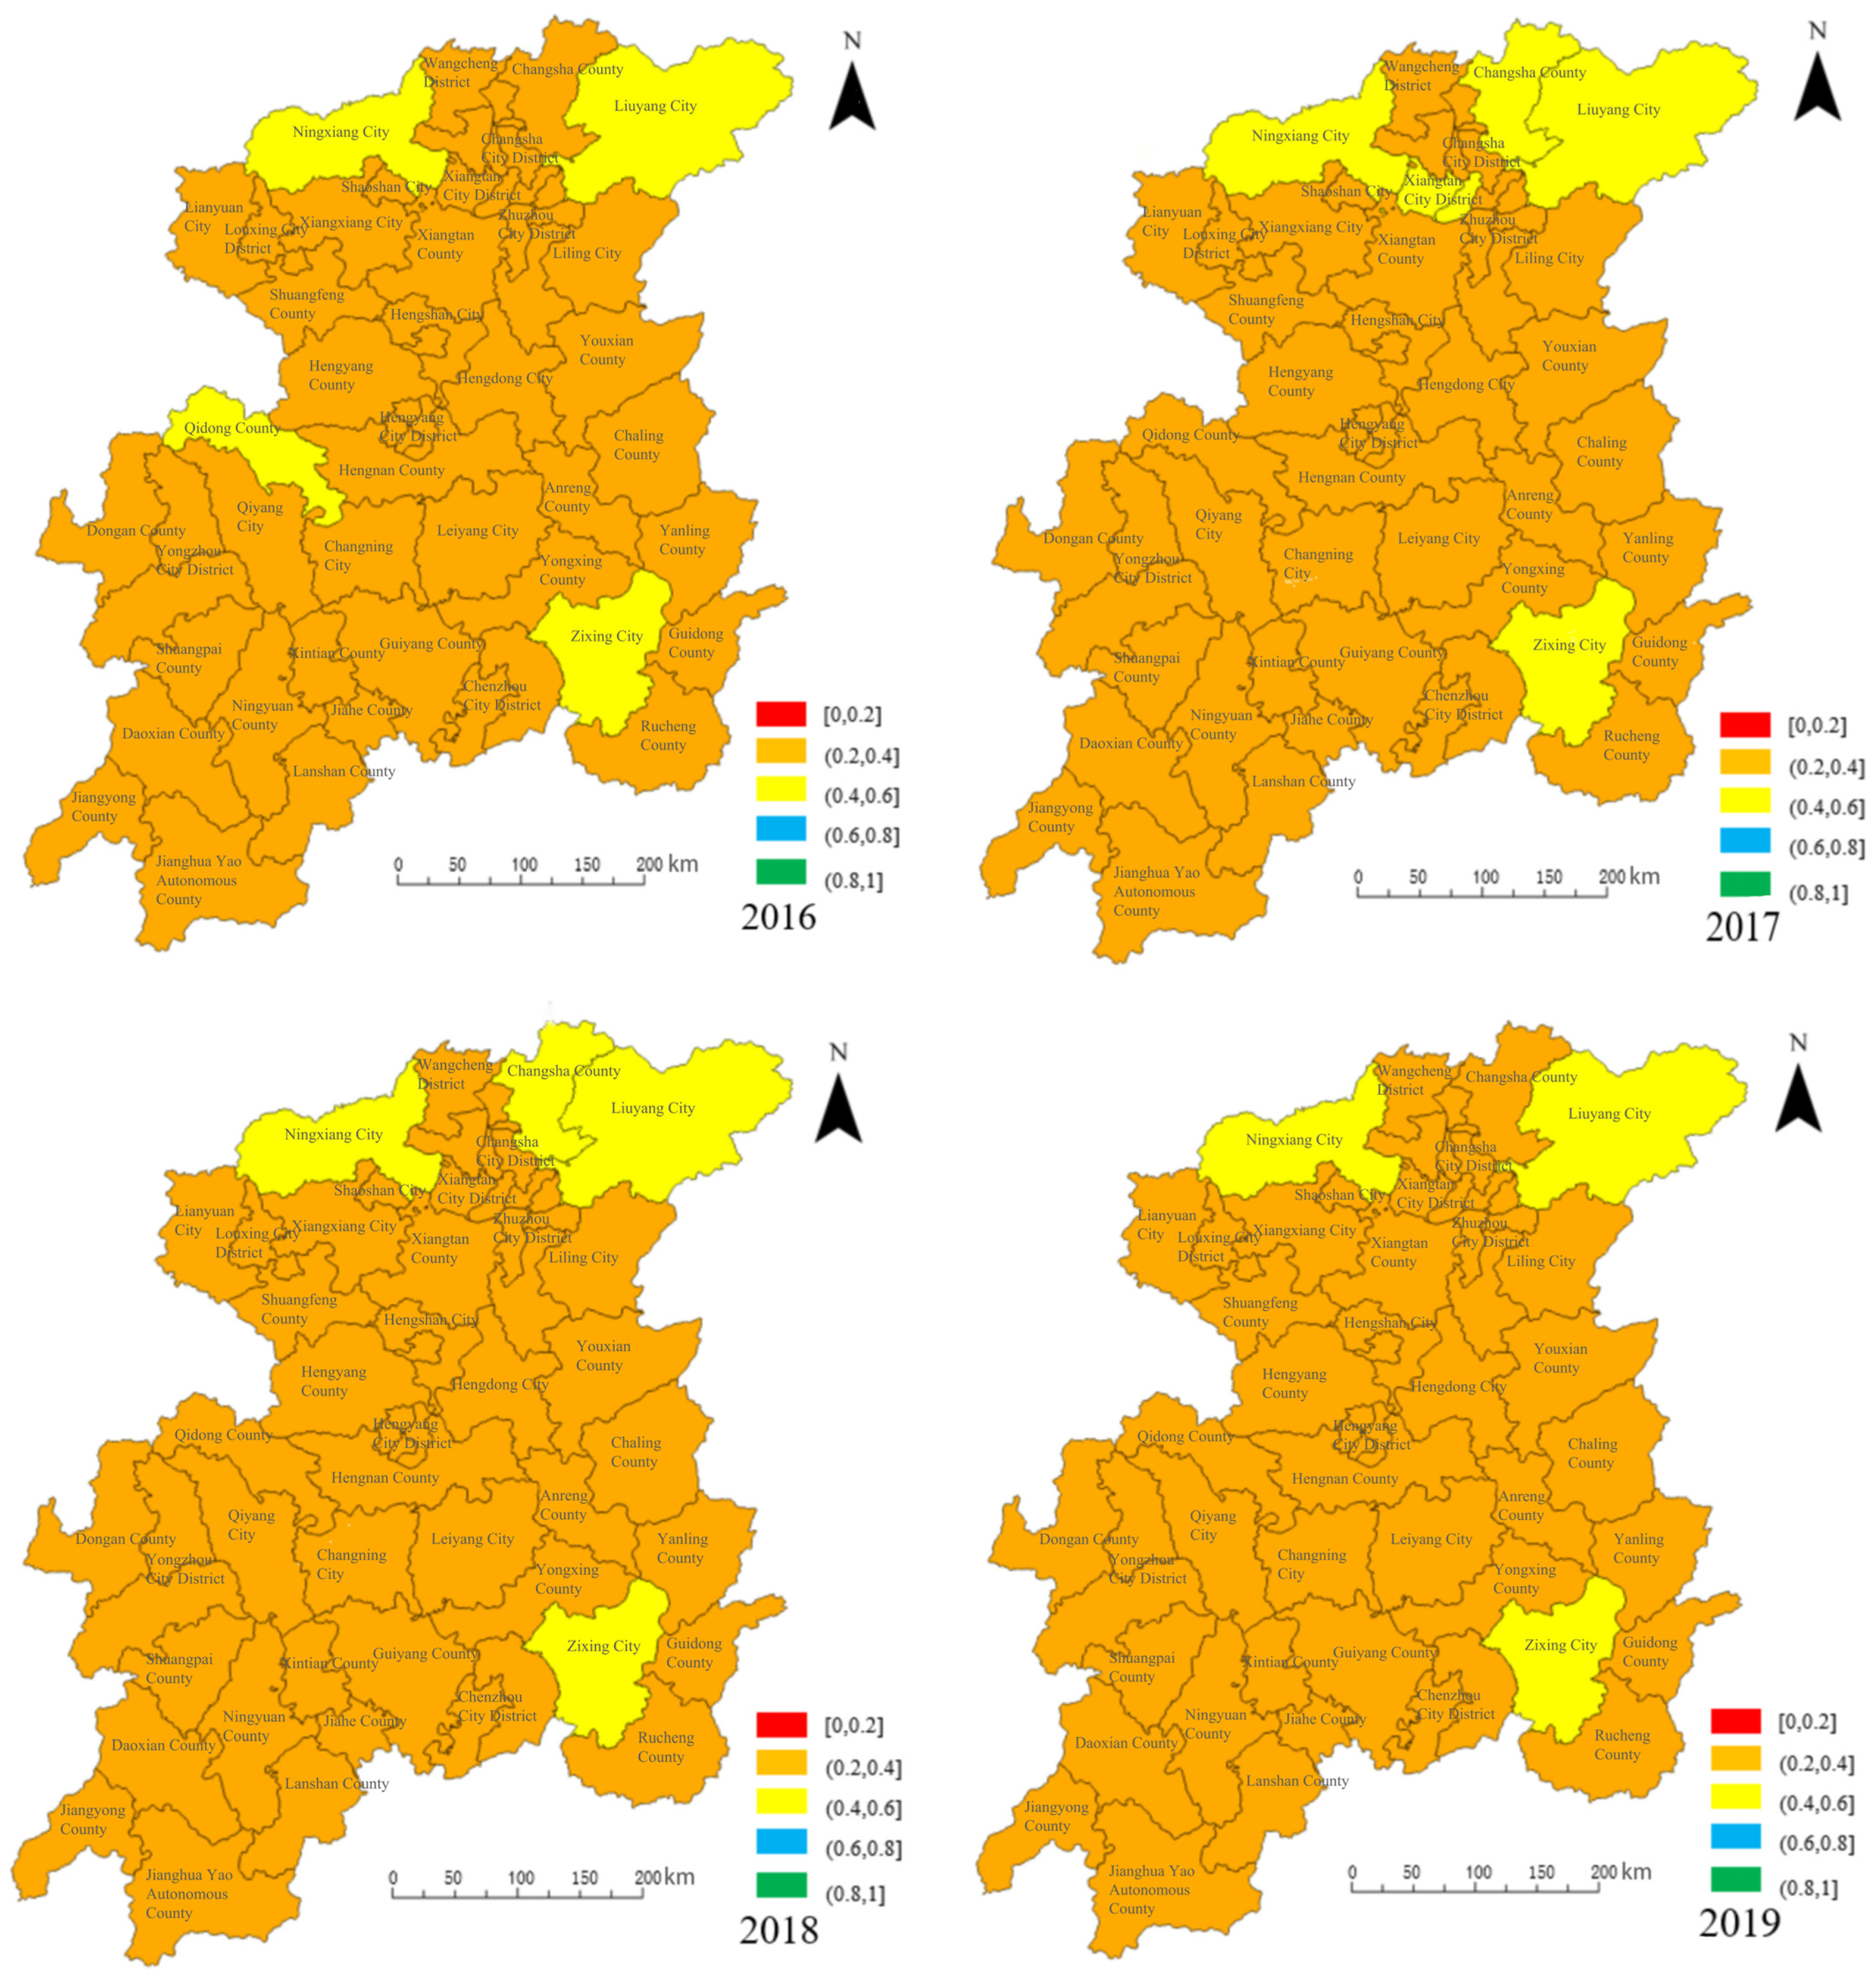
4.2.2. Spatial Evolution
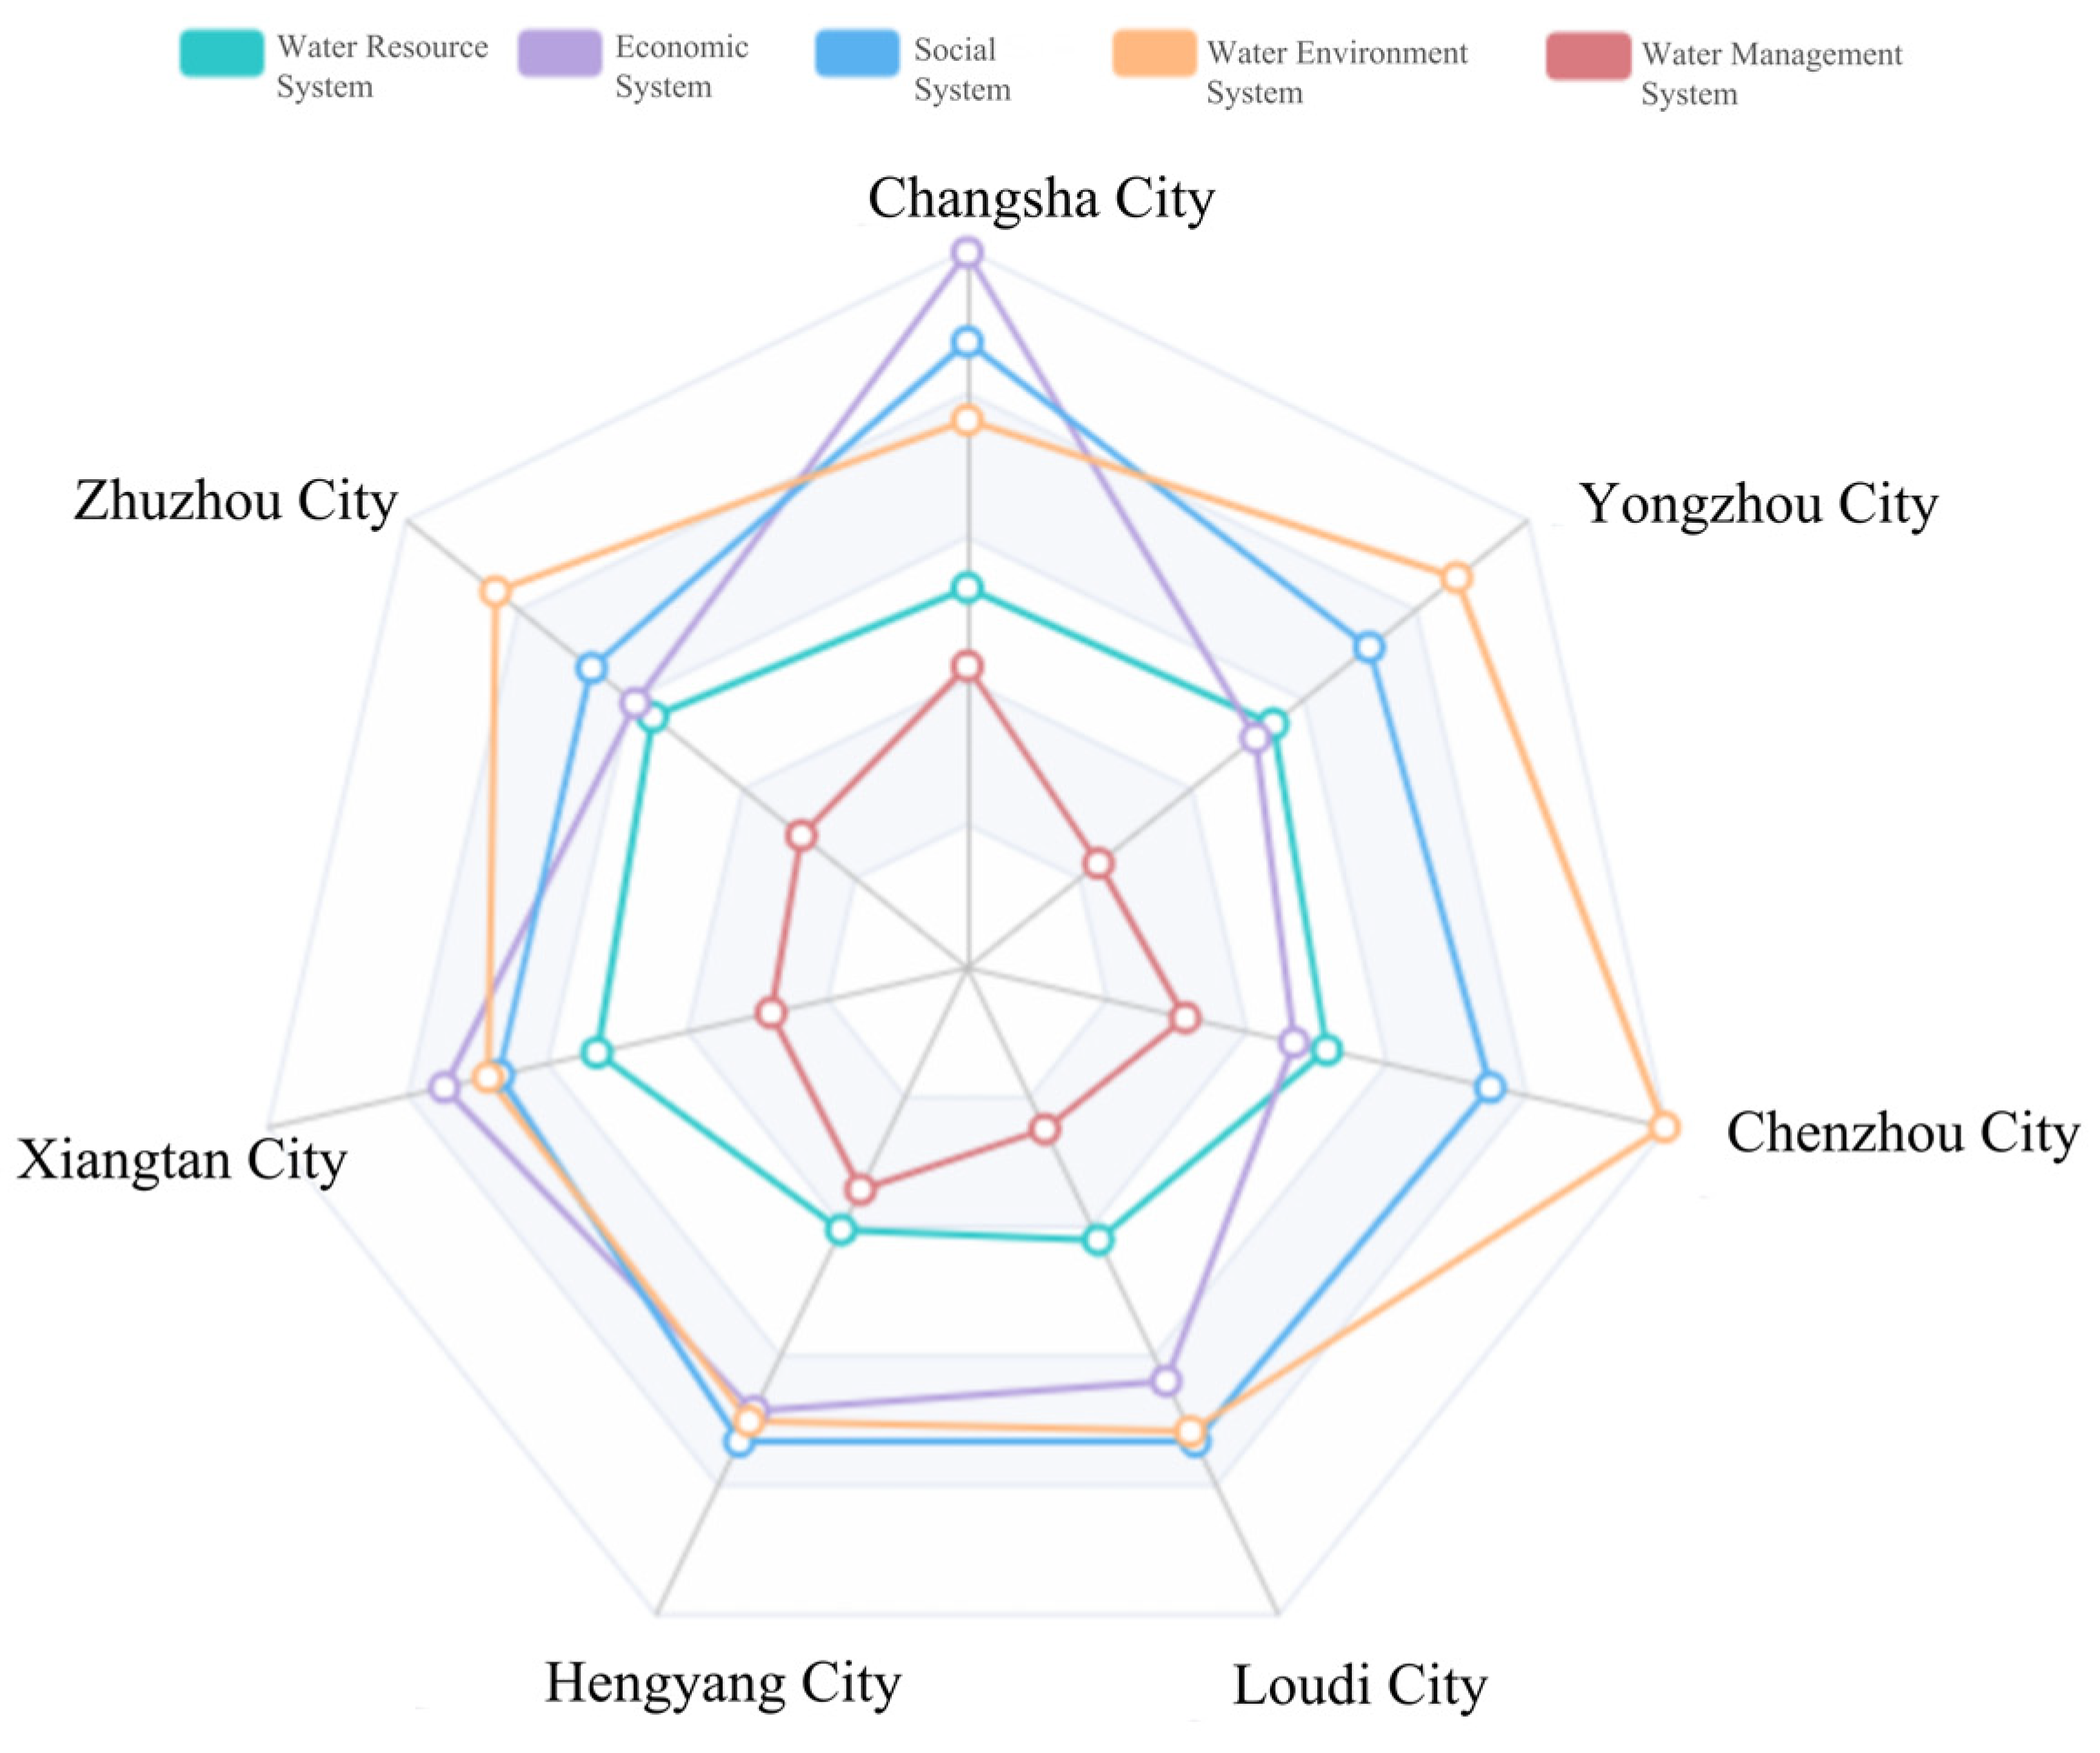
4.2.3. Guideline Layer Analysis
5. Water Carrying Capacity Projections
5.1. Forecasting Criteria
5.2. Projected Results
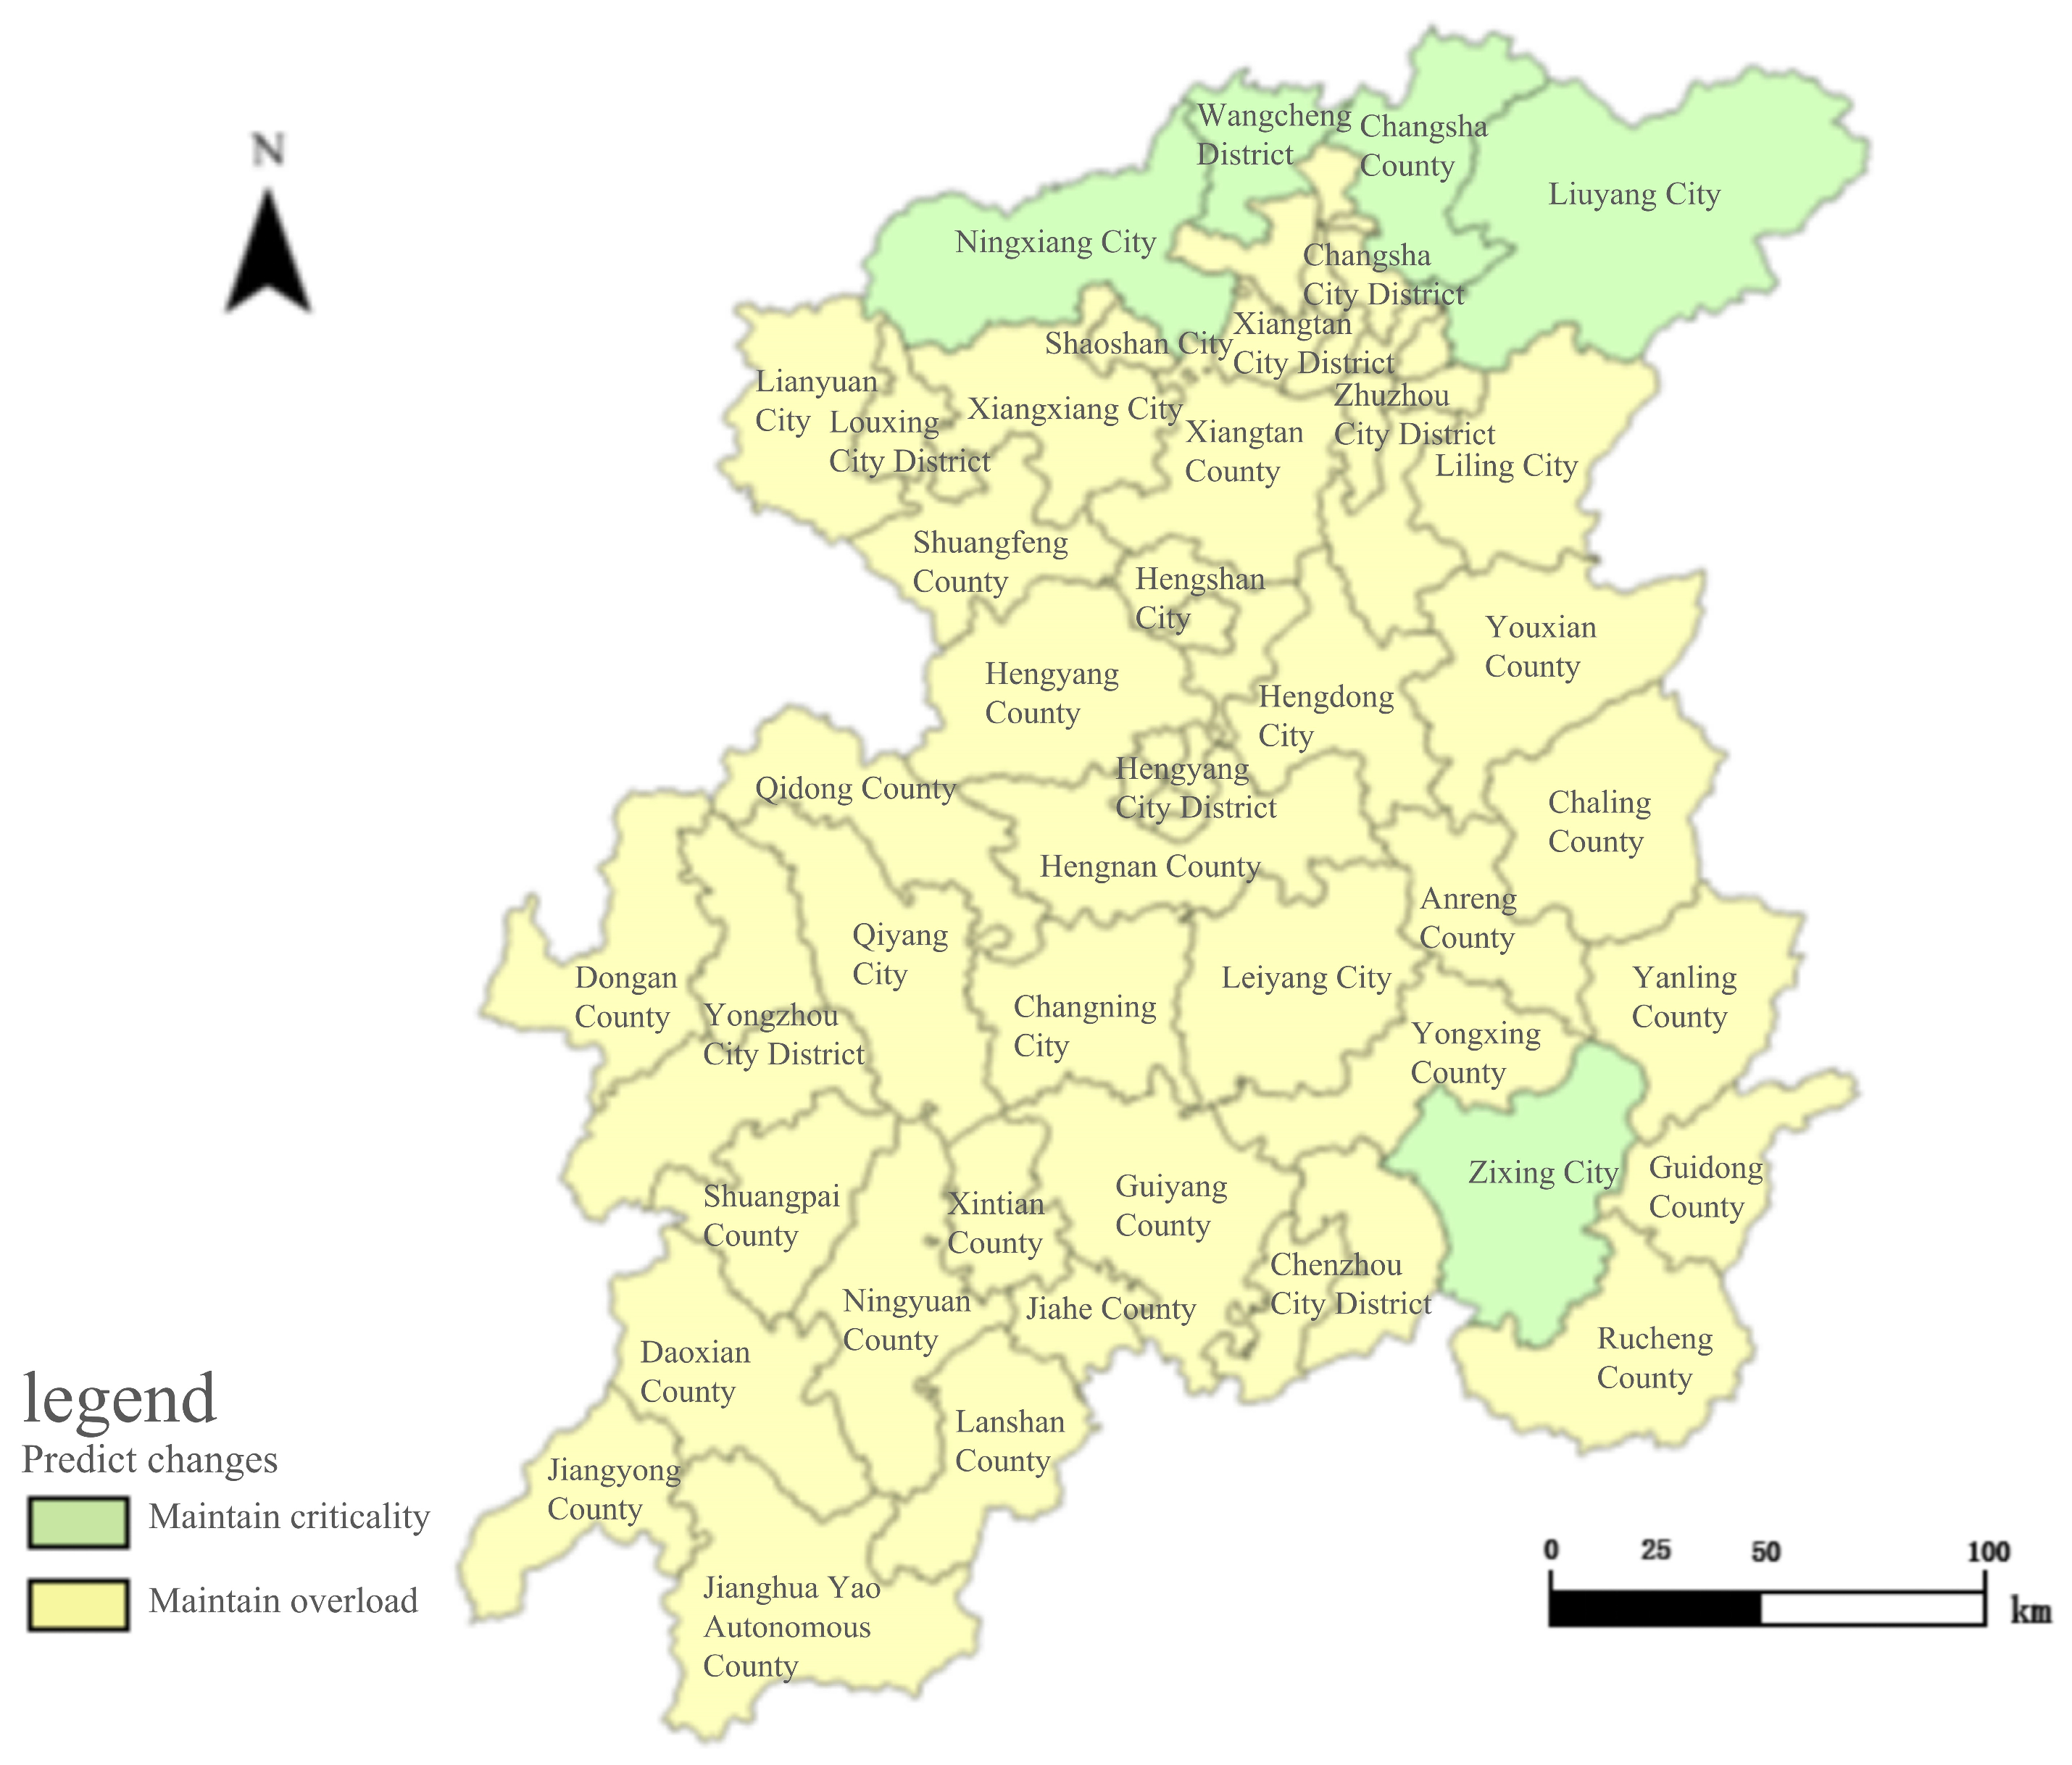
5.3. Spatial Distribution of Forecast Results
6. Discussion
7. Conclusions
- Based on 15 years of observation and research in the Xiangjiang River Basin, it was found that the water resources carrying capacity in the region maintained a relatively slow growth and then tended to flatten out during this period. However, the water resources carrying capacities of each county unit are not completely consistent, reflecting the differences and inconsistencies in local development trends, mainly due to various factors such as economic development, technological progress, and the implementation of water resource management policies.
- In terms of spatial distribution, there are relatively significant differences in the carrying capacities of water resources in the area of the Xiangjiang River. The southern (upstream) counties of Chenzhou and Yongzhou have abundant water resources and a good ecological environment, but their water resources carrying capacities are generally lower than those of the northern (middle and downstream) counties, which may be closely related to the economic development levels of Changsha, Zhuzhou, and Xiangtan. The level of water resources carrying capacity is a comprehensive issue that goes beyond the endowment of water resources.
- According to the BP neural network model, it is predicted that the water resources carrying capacity of the Xiangjiang River Basin in the coming years will continue the steady development trend of 2022. Changsha County, Wangcheng District, Ningxiang City, Liuyang City, Zixing City, and other areas will be in a critical state that is better than other counties and cities. Most county-level units are overloaded, indicating that the carrying capacity of water resources in the Xiangjiang River needs to be monitored vigilantly.
Author Contributions
Funding
Institutional Review Board Statement
Informed Consent Statement
Data Availability Statement
Conflicts of Interest
References
- Guo, X.; He, J.; Zhang, H.; Wang, P.; Li, Y.; Li, J. Some considerations on building a national water network system. China Water Resour. 2019, 15, 1–4. [Google Scholar]
- Xia, W.; Wang, N.; Shen, Y. Study on water resources carrying capacity of Shaanxi Province based on watershed. Arid Zone Geogr. 2020, 43, 602–611. [Google Scholar]
- Ait-Aoudia, M.N.; Berezowska-Azzag, E. Water resources carrying capacity assessment: The case of Algeria’s capital city. Habitat Int. 2016, 58, 51–58. [Google Scholar] [CrossRef]
- Zou, Z.; Zhao, B.; Chen, J.; Qian, H.; Gao, Y.; Li, C. Evaluation and spatiotemporal variation characteristics of water resources carrying capacity in nine provinces and regions along the Yellow River. Earth Sci. Environ. J. 2024, 46, 351363. [Google Scholar] [CrossRef]
- Yu, P.; Shang, Y.T.; Yao, M.; Liu, P. Evaluation of Water Resources Carrying Capacity in Xinjiang by Coupling Water Footprint and Principal Component Analysis. Hydrology 2021, 41, 49–54. [Google Scholar]
- Liu, Y.; Dong, H.; Tian, X. Dynamic simulation of water resources carrying capacity in Suibin County based on system dynamics model. People’s Yellow River 2024, 46 (Suppl. S1), 47–48+50. [Google Scholar]
- Zuo, Q.; Guo, J.; Ma, J.; Cui, G.; Yang, R.; Yu, L. Assessment of regional-scale water resources carrying capacity based on fuzzy multiple attribute decision-making and scenario simulation. Ecol. Indic. 2021, 130, 108034. [Google Scholar] [CrossRef]
- Zhang, F.; Yin, M.; Zhang, J. Evaluation of water resources carrying capacity in the Gansu section of the Yellow River Basin based on entropy weight TOPSIS. People’s Yellow River 2024, 46, 79–85. [Google Scholar]
- Jiang, D.; Yu, H.; Li, L. Dynamic evaluation of water resources carrying capacity in Shandong Province based on comprehensive weighting and TOPSIS model. Resour. Sci. 2024, 46, 538–548. [Google Scholar]
- Xue, Q.; Yang, K. Research on the prediction and regulation of water resources carrying capacity in Jiangsu Province based on BP neural network system dynamics coupling model. Water Resour. Hydropower Technol. (Chin. Eng.) 2022, 53, 86–99. [Google Scholar] [CrossRef]
- Fu, Z.; Hu, X.; Huang, C.; Chen, B.; Li, M.; You, Y. Study on the assessment of water resources carrying capacity in Hunan Province based on SPR model. J. Chang. Univ. Technol. (Nat. Sci. Ed.) 2023, 20, 92–103. [Google Scholar]
- Chen, M.; Xiong, G.; Zhang, J.; Li, L.; Wang, J. Comprehensive evaluation of water quality in the Xiangjiang River Basin and its spatio-temporal evolution analysis. Environ. Eng. 2019, 37, 83–90+104. [Google Scholar]
- Fu, X. Research on the Ecological Compensation Mechanism of Water Rights Handover in the Xiangjiang River. Master’s Thesis, Hunan Agricultural University, Changsha, China, 2014. [Google Scholar]
- Zhang, N.; Su, X.; Zhou, Y.; Niu, J. Evaluation of water resources carrying capacity in the Yellow River Basin. J. Nat. Resour. 2019, 34, 1759–1770. [Google Scholar]
- Du, X.; Li, Y.; Zhang, X. Research on Water Resources Carrying Capacity of Zhengzhou City Based on TOPSIS Model. People’s Yellow River 2022, 44, 84–88. [Google Scholar]
- Ma, J.; De, Y.; Wang, Q.; Wang, F.; Zheng, Y.; Du, W. Evaluation of Water Resources Carrying Capacity and Diagnosis of Obstacle Factors in Yunnan Province Based on GRA-TOPSIS Method. J. Water Resour. Water Eng. 2022, 33, 11–17+26. [Google Scholar]
- Deng, Q.; Ping, J.; Mei, X.; Lv, P.; Miao, C. Evaluation of Water Resources Carrying Capacity in Xinxiang City Based on Combination Weight TOPSIS Model. J. Water Resour. Water Eng. 2022, 33, 81–87. [Google Scholar]
- Xu, Z.; Cao, Y. Evaluation of Water Resources Carrying Capacity in Changchun City Based on Entropy Weight TOPSIS Model. J. Saf. Environ. 2022, 22, 2900–2907. [Google Scholar] [CrossRef]
- Chen, L.; Zhou, H. Evaluation of Water Resources Carrying Capacity in Karst Watersheds Based on Fuzzy Comprehensive Evaluation and Principal Component Analysis. Saf. Environ. Eng. 2021, 28, 159–173. [Google Scholar]
- Zhou, X.; Luo, H. Evaluation of water resources carrying capacity and risk identification in the the Pearl River basin. People’s Pearl River 2023, 44, 28–36+69. [Google Scholar]
- Zhang, G. Analysis of Water Resources Carrying Capacity in Baiyang River Basin, Xinjiang. Water Resour. Technol. Econ. 2022, 28, 57–62. [Google Scholar]
- Bian, J.; Xia, Y.; Mao, X.; Zhang, H. Adaptability Evaluation of Water Resources Carrying Capacity and Economic and Social Development in the Taihu Lake Lake Basin. Water Resour. Hydropower News 2022, 43, 31–37. [Google Scholar]
- Han, L.; Men, B. Evaluation of Water Resources Carrying Capacity in Haihe River Basin Based on Combination Game Theory. Hydroelectr. Energy 2021, 39, 61–64. [Google Scholar]
- Liu, X.; Zhang, M.; Xu, J.; Guo, Y.; Duan, W.; Shen, Y. Study on water resources carrying capacity of Tarim River Basin based on system dynamics model. Arid Zone Geogr. 2021, 44, 1407–1416. [Google Scholar]
- Wang, L.; Huang, X.; Li, H. Evaluation of water resources carrying capacity of nine provinces in the Yellow River Basin based on CW-FSPA. China Rural Water Conserv. Hydropower 2021, 63, 67–75. [Google Scholar]
- Shi, Z.; Feng, W.; Qian, H. Evaluation of water resources carrying capacity in Gansu Province based on basin scale. Ecol. Sci. 2021, 40, 51–57. [Google Scholar]
- Yu, G. Intelligent monitoring method of water resources ecological carrying capacity based on neural network algorithm. Constr. Manag. 2022, 30, 97–100+125. [Google Scholar]
- Men, H.-Q. Evaluation of water resources carrying capacity in Ningxia based on artificial neural network method. Ningxia Agric. For. Sci. Technol. 2014, 55, 65–68. [Google Scholar]
- Zhang, X.; Cao, Z.; Zhang, R.; Han, R.; Li, X. Evaluation of water resources carrying capacity and trend prediction in the Yellow River Delta ecological and economic zone. World Geogr. Res. 2022, 31, 549–560. [Google Scholar]
- Wang, W.; Yang, L.; Zheng, Y.; Xu, D. Evaluation of water resources carrying capacity of Shiyang River Basin based on game theory and cloud model. Water Resour. Hydropower Technol. 2021, 52, 35–45. [Google Scholar]
- Wang, J.; Geng, Y.; Zheng, X. Evaluation of water resources carrying capacity based on PSR-MDS model—Taking Hebei Province as an example. People’s Yangtze River 2021, 52, 81–86. [Google Scholar]
- Lu, Y.; Xu, H.W.; Wang, Y.X.; Yang, Y. Evaluation of water environmental carrying capacity of city in Huaihe River Basin based on the AHP method: A case in Huai’an City. Water Resour. Ind. 2017, 18, 71–77. [Google Scholar]
- Wang, C.H.; Hou, Y.L.; Xue, Y.J. Water resources carrying capacity of wetlands in Beijing: Analysis of policy optimization for urban wetland water resources management. J. Clean. Prod. 2017, 161, 1180–1191. [Google Scholar] [CrossRef]
- Yang, J.F.; Lei, K.; Khu, S.T.; Qiao, F.; Liu, Q. Assessment of water ecological carrying capacity using an indicator-based method applied to Tieling City, China. Water Sci. Technol. Water Supply 2015, 15, 940–947. [Google Scholar]
- Zhang, S.H.; Xiang, M.S.; Yang, J.S.; Fan, W.; Yi, Y. Distributed hierarchical evaluation and carrying capacity models for water resources based on optimal water cycle theory. Ecol. Ind. 2019, 101, 432–443. [Google Scholar]
- Zhou, Y.; Xie, Y. Analysis of sustainable use of water resources in Liaoning Province based on the ecological footprint model. J. Ecol. 2014, 33, 3157–3163. [Google Scholar]
- Zuo, Q.; Zhang, Z.; Wu, B. Evaluation of water resources carrying capacity of nine provinces and districts in the Yellow River Basin based on the combined weights TOPSIS model. Water Resour. Prot. 2020, 36, 1–7. [Google Scholar]
- Fu, X.; Yang, X.; Song, X. Evaluation of resource and environmental carrying capacity of Yangtze River economic belt based on DPSIR-TOPSIS model. J. Cent. South For. Univ. Sci. Technol. Soc. Sci. Ed. 2022, 16, 38–47. [Google Scholar]
- Li, Z.; Hu, Y.; Liu, Q.; Liu, S. Early warning evaluation and simulation analysis of resource and environmental carrying capacity in inland arid zones-an empirical analysis from Ningxia. Ecol. Econ. 2021, 37, 209–215+229. [Google Scholar]
- Lei, X.; Qiu, G. Empirical study on regional resource and environmental carrying capacity evaluation based on entropy weight TOPSIS model. J. Environ. Sci. 2016, 36, 314–323. [Google Scholar]
- Yang, Q.; Zhang, S. Evaluation of water environment carrying capacity based on BP neural network. Res. Land Nat. Resour. 2009, 43, 70–72. [Google Scholar]
- Josefina, L.; Alfredo, A.; Roberto, A. Simple estimation of available water capacity in soils of semiarid and subhumid environments. Arid Land Res. Manag. 2018, 32, 133–148. [Google Scholar]
- Ganguli, P.; Merz, B. Extreme Coastal Water Levels Exacerbate Fluvial Flood Hazards in Northwestern Europe. Sci. Rep. 2019, 9, 13165. [Google Scholar] [CrossRef] [PubMed]
- Gao, W.; Liu, Y.; He, S. Early warning study on the carrying capacity of water resources in watersheds based on the SD model with sub-quality. J. Peking Univ. 2018, 54, 673–679. [Google Scholar]
- Fu, X.; Jiang, J.; Wu, X.; Huang, L.; Han, R.; Li, K.; Liu, C.; Roy, K.; Chen, J.; Mahmoud, N.T.; et al. Deep learning in water protection of resources, environment, and ecology: Achievement and challenges. Environ. Sci. Pollut. Res. 2024, 31, 14503–14536. [Google Scholar] [CrossRef] [PubMed]
- Fu, X.; Zheng, Q.; Jiang, G.; Roy, K.; Huang, L.; Liu, C.; Li, K.; Chen, H.; Song, X.; Chen, J.; et al. Water quality prediction of copper-molybdenum mining-beneficiation wastewater based on the PSO-SVR model. Front. Environ. Sci. Eng. 2023, 17, 84–97. [Google Scholar] [CrossRef]
- Chen, H.; Yang, J.; Fu, X.; Zheng, Q.; Song, X.; Fu, Z.; Wang, J.; Liang, Y.; Yin, H.; Liu, Z.; et al. Water Quality Prediction Based on LSTM and Attention Mechanism: A Case Study of the Burnett River, Australia. Sustainability 2022, 14, 13231. [Google Scholar] [CrossRef]
- Lan, S.; Wang, X.; Li, M.; Fu, X.; Xu, M.; Zhu, J.; Wang, P.; Mao, Y.; Dong, Z.; Li, J.; et al. Early Warning Evaluation and Warning Trend Analysis of the Resource and Environment Carrying Capacity in Altay Prefecture, Xinjiang. Sustainability 2023, 15, 9825. [Google Scholar] [CrossRef]


| Scale | Advantage |
|---|---|
| County scale | Data precision: Data at the county scale are more specific, reflecting local water conditions, water demand, and water management issues. Local features: able to identify local water resource issues in detail, such as overexploitation or pollution of water sources in a particular county. Management measures: The county scale is conducive to formulating targeted management measures and policies that adapt to the local situation. |
| Basin scale | Comprehensive: The basin scale can comprehensively consider the water resources situation in the whole basin, including the flow and utilization of water resources upstream and downstream. Regional collaboration: Considering upstream and downstream water use, the basin scale facilitates the development of transregional water management measures to address transboundary water issues. |
| Regional scale | Macro perspective: Regional scales often involve multiple basins, providing a more macro perspective to analyze water resources’ spatial distribution and utilization. Trend analysis: suitable for identifying long-term trends in water resource changes and potential water scarcity issues within a region. |
| National scale | Overall trend: National-scale analysis can reveal the supply–demand imbalance and overall trend of water resources nationwide, such as the uneven distribution of water resources in different regions. Policymaking: It helps to formulate national-level water resource management policies and strategies, but may overlook specific local issues. |
| Name of Place or City | County and City Name and Percentage (%) | ||||||||||
|---|---|---|---|---|---|---|---|---|---|---|---|
| 1 | 2 | 3 | 4 | 5 | 6 | 7 | 8 | 9 | 10 | 11 | |
| Changsha | 100.0 Changsha | 100.0 Urban, suburban | 100.0 Wangcheng | 91.5 Ningxiang | 100.0 Liuyang | ||||||
| Zhuzhou | 100.0 Zhuzhou | 100.0 Liling | 100.0 Youxian | 100.0 Chaling | 100.0 Yanling | 100.0 Urban, suburban | |||||
| Xiangtan | 100.0 Xiangtan | 100.0 Urban, suburban | 100.0 Xiangxiang | 100.0 Shaoshan | |||||||
| Hengyang | 100.0 Hennan | 100.0 Hengyang | 100.0 Hengshan | 100.0 Hengdong | 100.0 Leiyang | 100.0 Changning | 100.0 Qidong | 100.0 Urban, suburban | |||
| Shaoyang | 6.3 Xinshao | 47.5 Shaodong | 2.0 Shaoyang | ||||||||
| Yueyang | 3.5 Xiangyin | 14.0 Miluo | |||||||||
| Loudi | 100.0 Shuangfeng | 100.0 Lianyuan | 26.8 Lengshuijiang | ||||||||
| Chenzhou | 100.0 Anren | 100.0 Yongxing | 100.0 Zixing | 91.0 Guidong | 79.0 Rucheng | 100.0 Jiahe | 98.5 Guiyang | 100.0 urban area | 25.0 Linwu | 5.5 Yizhang | |
| Yongzhou | 100.0 Urban area | 100.0 Shuangpai | 57.0 Jiang yong | 95.5 Jianghua | 100.0 Daoxian | 100.0 Lanshan | 100.0 Qiyang | 100.0 Xintian | 100.0 Ningyuan | 100.0 Dongan | 100.0 Jindong Forest Farm |
| Prefecture-Level City | County Level Unit |
|---|---|
| Changsha City | Changsha City District, Wangcheng District, Ningxiang County, Liuyang City, Changsha County |
| Xiangtan City | Xiangtan City District, Xiangxiang City, Shaoshan City, Xiangtan County |
| Zhuzhou City | Zhuzhou City District, Zhuzhou County, Liling City, You County, Chaling County, Yiling County |
| Hengyang City | Hengyang City District, Leiyang City, Changning City, Qidong County, Hengyang County, Hengdong County, Hengshan County, Hengnan County |
| Chenzhou City | Chenzhou City District, Zixing City, Anren County, Guiyang County, Rucheng County, Jiahe County, Guidong County, Yongxing County |
| Yongzhou City | Yongzhou City District, Qiyang City, Lanshan County, Xintian County, Jiangyong County, Shuangpai County, Ningyuan County, Dong’an County, Daocheng County, Jianghua Yao Autonomous County. |
| Loudi City | Loudi City District, Shuangfeng County, Lianyuan County |
| Target Level | System Level | Indicator Layer | Unit (of Measure) | Characteristic |
|---|---|---|---|---|
| Water Resources Carrying Capacity of the Xiangjiang River | Resource supportability | Precipitation | mm | Positive |
| Average per capita water resources | m3/person | Positive | ||
| Coefficient of Storage | 104 m3/km2 | Positive | ||
| Wodule of water supply | 104 m3/km2 | Positive | ||
| Eco-environment water consumption | 104 m3 | Negative | ||
| Economic support | GDP per capita | 104 CNY | Positive | |
| Effective irrigation area | % | Positive | ||
| Agricultural potential index | ton | Positive | ||
| Water consumption per 10,000 CNY GDP | m3/104 CNY | Negative | ||
| The output value of agriculture, forestry, animal husbandry, and fishery | 104 CNY | Positive | ||
| Sewage discharge per 10,000 CNY of GDP | m3/104 CNY | Negative | ||
| Social support | Density of population | Persons/km−2 | Negative | |
| Urbanization rate | % | Positive | ||
| Natural population growth rate | % | Positive | ||
| First-tier water price | CNY | Negative | ||
| Per capita water demand | m3 | Negative | ||
| Environmental support | Per capita domestic water consumption | m3/person | Negative | |
| consumption of pesticide and fertilize | kg | Negative | ||
| Proportion of Class III or above water | % | Positive | ||
| Wastewater treatment rate | % | Positive | ||
| Forest cover | % | greater than zero | ||
| Management support | Water Utilization | % | Negative | |
| Dam length | m | Positive | ||
| impoundage | m3 | Positive | ||
| water conservation practitioner | person | Positive | ||
| Rural garbage management rate | % | Positive |
| Normative Layer | 2008 | 2013 | 2018 | 2022 | On Average |
|---|---|---|---|---|---|
| Resource support | 13.39 | 15.13 | 19.83 | 20.23 | 17.14 |
| Economic support | 15.00 | 17.16 | 16.72 | 18.19 | 16.77 |
| Social support | 8.27 | 9.87 | 10.18 | 7.92 | 9.06 |
| Environmental support | 10.73 | 9.53 | 11.98 | 9.36 | 10.40 |
| Management support | 52.61 | 48.39 | 41.30 | 44.31 | 46.65 |
| County Unit | 2008–2012 | 2013–2017 | 2018–2022 | On Average | Rankings |
|---|---|---|---|---|---|
| Changsha City District | 0.407 | 0.382 | 0.378 | 0.389 | 5 |
| Wangcheng District | 0.371 | 0.362 | 0.394 | 0.376 | 7 |
| Changsha County | 0.393 | 0.395 | 0.400 | 0.396 | 4 |
| Liuyang City | 0.409 | 0.441 | 0.457 | 0.436 | 2 |
| Ningxiang County | 0.394 | 0.452 | 0.452 | 0.433 | 3 |
| Zhuzhou City District | 0.364 | 0.360 | 0.358 | 0.360 | 8 |
| Zhuzhou County | 0.300 | 0.285 | 0.264 | 0.283 | 41 |
| Liling City | 0.303 | 0.374 | 0.364 | 0.347 | 12 |
| Youxian County | 0.306 | 0.329 | 0.309 | 0.314 | 25 |
| Chaling County | 0.287 | 0.317 | 0.306 | 0.303 | 30 |
| Yanling County | 0.314 | 0.337 | 0.338 | 0.330 | 17 |
| Xiangtan City District | 0.363 | 0.398 | 0.378 | 0.380 | 6 |
| Xiangxiang City | 0.303 | 0.356 | 0.359 | 0.339 | 14 |
| Shaoshan City | 0.267 | 0.288 | 0.301 | 0.285 | 40 |
| Xiangtan County | 0.343 | 0.311 | 0.311 | 0.321 | 20 |
| Hengyang City District | 0.368 | 0.358 | 0.337 | 0.354 | 10 |
| Leiyang City | 0.320 | 0.328 | 0.283 | 0.310 | 27 |
| Changning City | 0.289 | 0.342 | 0.333 | 0.321 | 21 |
| Qidong County | 0.298 | 0.386 | 0.359 | 0.348 | 11 |
| Hengyang County | 0.322 | 0.356 | 0.320 | 0.333 | 15 |
| Hengdong County | 0.295 | 0.300 | 0.277 | 0.291 | 36 |
| Hengshan County | 0.280 | 0.333 | 0.310 | 0.308 | 28 |
| Hengnan County | 0.321 | 0.330 | 0.302 | 0.318 | 23 |
| Loudi City District | 0.307 | 0.337 | 0.339 | 0.328 | 18 |
| Shuangfeng County | 0.283 | 0.295 | 0.289 | 0.289 | 39 |
| Lianyuan County | 0.274 | 0.299 | 0.295 | 0.289 | 38 |
| Chenzhou City | 0.327 | 0.364 | 0.374 | 0.355 | 9 |
| Zixing City | 0.516 | 0.520 | 0.510 | 0.515 | 1 |
| Anreng County | 0.271 | 0.281 | 0.290 | 0.281 | 43 |
| Guiyang County | 0.279 | 0.306 | 0.309 | 0.298 | 33 |
| Rucheng County | 0.281 | 0.325 | 0.355 | 0.320 | 22 |
| Jiahe County | 0.276 | 0.299 | 0.295 | 0.290 | 37 |
| Guidong County | 0.293 | 0.312 | 0.343 | 0.316 | 24 |
| Yongxing County | 0.282 | 0.305 | 0.300 | 0.296 | 35 |
| Yongzhou County | 0.348 | 0.345 | 0.344 | 0.346 | 13 |
| Qiyang City | 0.294 | 0.302 | 0.313 | 0.303 | 31 |
| Lanshan County | 0.278 | 0.309 | 0.337 | 0.308 | 29 |
| Xintian County | 0.247 | 0.279 | 0.288 | 0.271 | 44 |
| Jiangyong County | 0.284 | 0.310 | 0.348 | 0.314 | 26 |
| Shuangpai County | 0.304 | 0.321 | 0.342 | 0.322 | 19 |
| Ningyuan County | 0.248 | 0.289 | 0.306 | 0.281 | 42 |
| Dongan County | 0.266 | 0.310 | 0.314 | 0.297 | 34 |
| Daoxian County | 0.274 | 0.304 | 0.318 | 0.299 | 32 |
| Jianghua County | 0.311 | 0.335 | 0.350 | 0.332 | 16 |
| Carrying Capacity Class | Appraise Value | Rating Color | Water Carrying Capacity |
|---|---|---|---|
| I | [0, 0.2] | red | Poor water carrying capacity |
| II | (0.2, 0.4] | orange | Relatively poor water carrying capacity |
| III | (0.4, 0.6] | yellow | Medium water carrying capacity |
| IV | (0.6, 0.8] | blue | Relatively strong water carrying capacity |
| V | (0.8, 1] | green | Strong water carrying capacity |
| Carrying Capacity Class | Appraise Value | State of Affairs | Early Warning Signal Signs |
|---|---|---|---|
| I | [0, 0.2] | Grossly overloaded | red |
| II | (0.2, 0.4] | Overloading | orange |
| III | (0.4, 0.6] | Boundary | yellow |
| IV | (0.6, 0.8] | Weak bearing | blue |
| V | (0.8, 1] | Can bear | green |
Disclaimer/Publisher’s Note: The statements, opinions and data contained in all publications are solely those of the individual author(s) and contributor(s) and not of MDPI and/or the editor(s). MDPI and/or the editor(s) disclaim responsibility for any injury to people or property resulting from any ideas, methods, instructions or products referred to in the content. |
© 2024 by the authors. Licensee MDPI, Basel, Switzerland. This article is an open access article distributed under the terms and conditions of the Creative Commons Attribution (CC BY) license (https://creativecommons.org/licenses/by/4.0/).
Share and Cite
Wang, J.; Wang, Z.; Fu, Z.; Fang, Y.; Zhao, X.; Ding, X.; Huang, J.; Liu, Z.; Fu, X.; Liu, J. Spatial-Temporal Evaluation and Prediction of Water Resources Carrying Capacity in the Xiangjiang River Basin Using County Units and Entropy Weight TOPSIS-BP Neural Network. Sustainability 2024, 16, 8184. https://doi.org/10.3390/su16188184
Wang J, Wang Z, Fu Z, Fang Y, Zhao X, Ding X, Huang J, Liu Z, Fu X, Liu J. Spatial-Temporal Evaluation and Prediction of Water Resources Carrying Capacity in the Xiangjiang River Basin Using County Units and Entropy Weight TOPSIS-BP Neural Network. Sustainability. 2024; 16(18):8184. https://doi.org/10.3390/su16188184
Chicago/Turabian StyleWang, Jiacheng, Zhixiang Wang, Zeding Fu, Yingchun Fang, Xuhong Zhao, Xiang Ding, Jing Huang, Zhiming Liu, Xiaohua Fu, and Junwu Liu. 2024. "Spatial-Temporal Evaluation and Prediction of Water Resources Carrying Capacity in the Xiangjiang River Basin Using County Units and Entropy Weight TOPSIS-BP Neural Network" Sustainability 16, no. 18: 8184. https://doi.org/10.3390/su16188184
APA StyleWang, J., Wang, Z., Fu, Z., Fang, Y., Zhao, X., Ding, X., Huang, J., Liu, Z., Fu, X., & Liu, J. (2024). Spatial-Temporal Evaluation and Prediction of Water Resources Carrying Capacity in the Xiangjiang River Basin Using County Units and Entropy Weight TOPSIS-BP Neural Network. Sustainability, 16(18), 8184. https://doi.org/10.3390/su16188184