Article

Geochemical Indicators on the Central Tibetan Plateau Lake Sediments: Historical Climate Change and Regional Sustainability

by
Xi Ma
1,
Xiaodan Wang
1,*,
Yunlong Gao
1,
Fujun Yue
2 and
Wei Chen
3
1
College of Eco-Environmental Engineering, Guizhou Minzu University, Guiyang 550025, China
2
Institute of Surface-Earth System Science, School of Earth System Science, Tianjin University, Tianjin 300072, China
3
State Key Laboratory of Palaeobiology and Stratigraphy, Nanjing Institute of Geology and Palaeontology and Center for Excellence in Life and Paleoenvironment, Chinese Academy of Sciences, Nanjing 210008, China
*
Author to whom correspondence should be addressed.
Sustainability 2024, 16(18), 8186; https://doi.org/10.3390/su16188186
Submission received: 1 August 2024 / Revised: 5 September 2024 / Accepted: 6 September 2024 / Published: 20 September 2024

Abstract

:
This study investigates geochemical indicators (TOC, TN, C/N, δ13Corg, δ15N, and pollen indicators) from sediment samples of Zigetang Co Lake on the Tibetan Plateau (TP) to explore past climate changes in the lake basin. The findings aim to provide essential data for developing sustainable strategies for the TP region. From 14.0 to 10.8 cal. ka BP, the δ15N, TOC, TN, and δ13Corg value of the lake sediments was relatively low; this indicated a low organic matter input into the lake, reflecting a probably cold and arid environment. In addition, the pollen was primarily composed of Artemisia and Gramineae, which are adapted to cold environments, further confirming that the climate during this period was likely cold and dry. From 10.8 to 8.2 cal. ka BP, the changes in the main plant composition were likely due to increased solar radiation, the onset of the monsoon, and higher temperatures and precipitation, which created more favorable conditions for the growth of Cyperaceae. From 8.2 to 4.2 cal. ka BP, when the solar radiation weakened and the monsoon diminished, the basin maintained relatively high water levels, with regional precipitation being likely influenced by westerly winds. From 4.2 to 0.01 cal. ka BP, δ13Corg and δ15N initially decreased and then increased, which was likely a transition from a cold–wet climate to warm–dry conditions during the late Holocene, and the Pollen sum also showed significant changes. Understanding climate evolution and vegetation changes is crucial for formulating timely policies to ensure regional sustainable development.

1. Introduction

Lakes are important ecosystems that serve as fundamental geographic units within terrestrial surface ecosystems. They have a significant influence on the natural environment of the surrounding areas, and play an irreplaceable role in regional and even global-scale changes [1]. Lake sediments are valuable repositories of data that hold large amounts of information, and they typically have a high resolution, wide distribution, and good continuity [2,3]. Organic matter in lake sediments provides a comprehensive signal reflecting the regional characteristics of the paleoclimate and paleoenvironment, for example, the source and fate of the original organic material [4].
Total organic carbon (TOC), total nitrogen (TN), and the carbon/nitrogen ratio (C/N) are fundamental metrics of the organic matter abundance in lake sediments [5,6]. Previous studies have shown that organic carbon isotopes (δ13Corg) and nitrogen isotopes (δ15N) can be used to trace the sources and fates of organic matter in aquatic environments [7,8,9]. For example, δ13Corg values vary due to plant photosynthesis and temperature fluctuations, as well as algal carbon utilization [10,11,12]. In non-glacial meltwater-fed lakes, precipitation affects lake water levels, soil biodegradation, and organic matter inputs, thereby influencing the magnitude of δ15N values in lake sediment [13,14]. Therefore, TOC, TN, C/N, δ13Corg, and δ15N serve as crucial indicators reflecting changes in climatic and environmental conditions [6,15]. Pollen indicators are characterized by their small size, large abundance, and resistance to acidity or alkalinity [16]. Over time, these indicators gradually transform into fossilized pollen in soil and sediment, making pollen indicators in sediment critically important for reconstructing past climates [17,18].
With an average elevation exceeding 4000 m, the Tibetan Plateau (TP) is renowned as the “Roof of the World”. And the TP is a crucial ecological security barrier for China [19]. Ecological changes in the region have a profound impact on the quality of life and economic development of local residents [20]. For example, climate change may lead to alterations in vegetation composition, which in turn affects grazing practices, thereby impacting residents’ livelihoods and the regional economy [21]. Because the vegetation of the TP is influenced by climate change [22], studying past climate variations in the region is crucial for predicting future ecological trends and achieving regional sustainable development. High-altitude lakes on plateaus possess distinct advantages in the study of global environmental change due to the specific characteristics associated with their elevated altitude. These characteristics include low atmospheric pressure, sparse air density, decreased oxygen levels, and heightened solar radiation. In recent decades, researchers have documented ice cores [23], tree rings [24], pollen [25], and lake sediments [26,27] on the TP. Climatic and environmental responses to precipitation are thought to have undergone substantial shifts over time, contributing to the establishment of broad spatial patterns across the TP. Further studies are therefore warranted in climate-sensitive regions to better understand these variations.
Located in the hinterland of the TP, Zigetang Co is a closed-basin lake characterized by its high altitude, absence of glaciers within the surrounding basin, dependence on rainfall for recharging, and negligible human impacts. The lake water is primarily composed of Na+ (380.64 mmol/L) and HCO3 (180.77 mmol/L), with δ18OH2O (−6.4‰), δ2H (−69‰), and δ13CDIC (1.9–2.0‰). From 1999 to 2012, the concentration of Na+ and K+ in the Zigetang Co lake water decreased by 43%, which reflects global climate change effectively [28]. The sediment records of this lake offer a valuable opportunity to study past climate changes and their impacts on the lake and its surroundings. Therefore, studies were conducted on the grain-size, carbonate concentration, and oxygen and carbon isotopes of ostracod shells of the Zigetang Co lake sediments, which effectively reflected past climate changes and recorded some special climatic events [29,30,31,32]. In this study, we investigated the geochemical parameters (TOC, TN, C/N, δ15N, δ13Corg) and pollen indicators in Zigetang Co, with the aim of revealing the climatic implications of the environmental geochemistry in lake systems. By examining the temporal variations in geochemical and pollen indicators, we were able to determine the climate and environmental changes since the last deglaciation. Based on the impact of climate change on regional vegetation cover, this study is important for better responding to regional sustainability policies. It also provides valuable data for predicting future change trends on the TP.

2. Materials and Methods
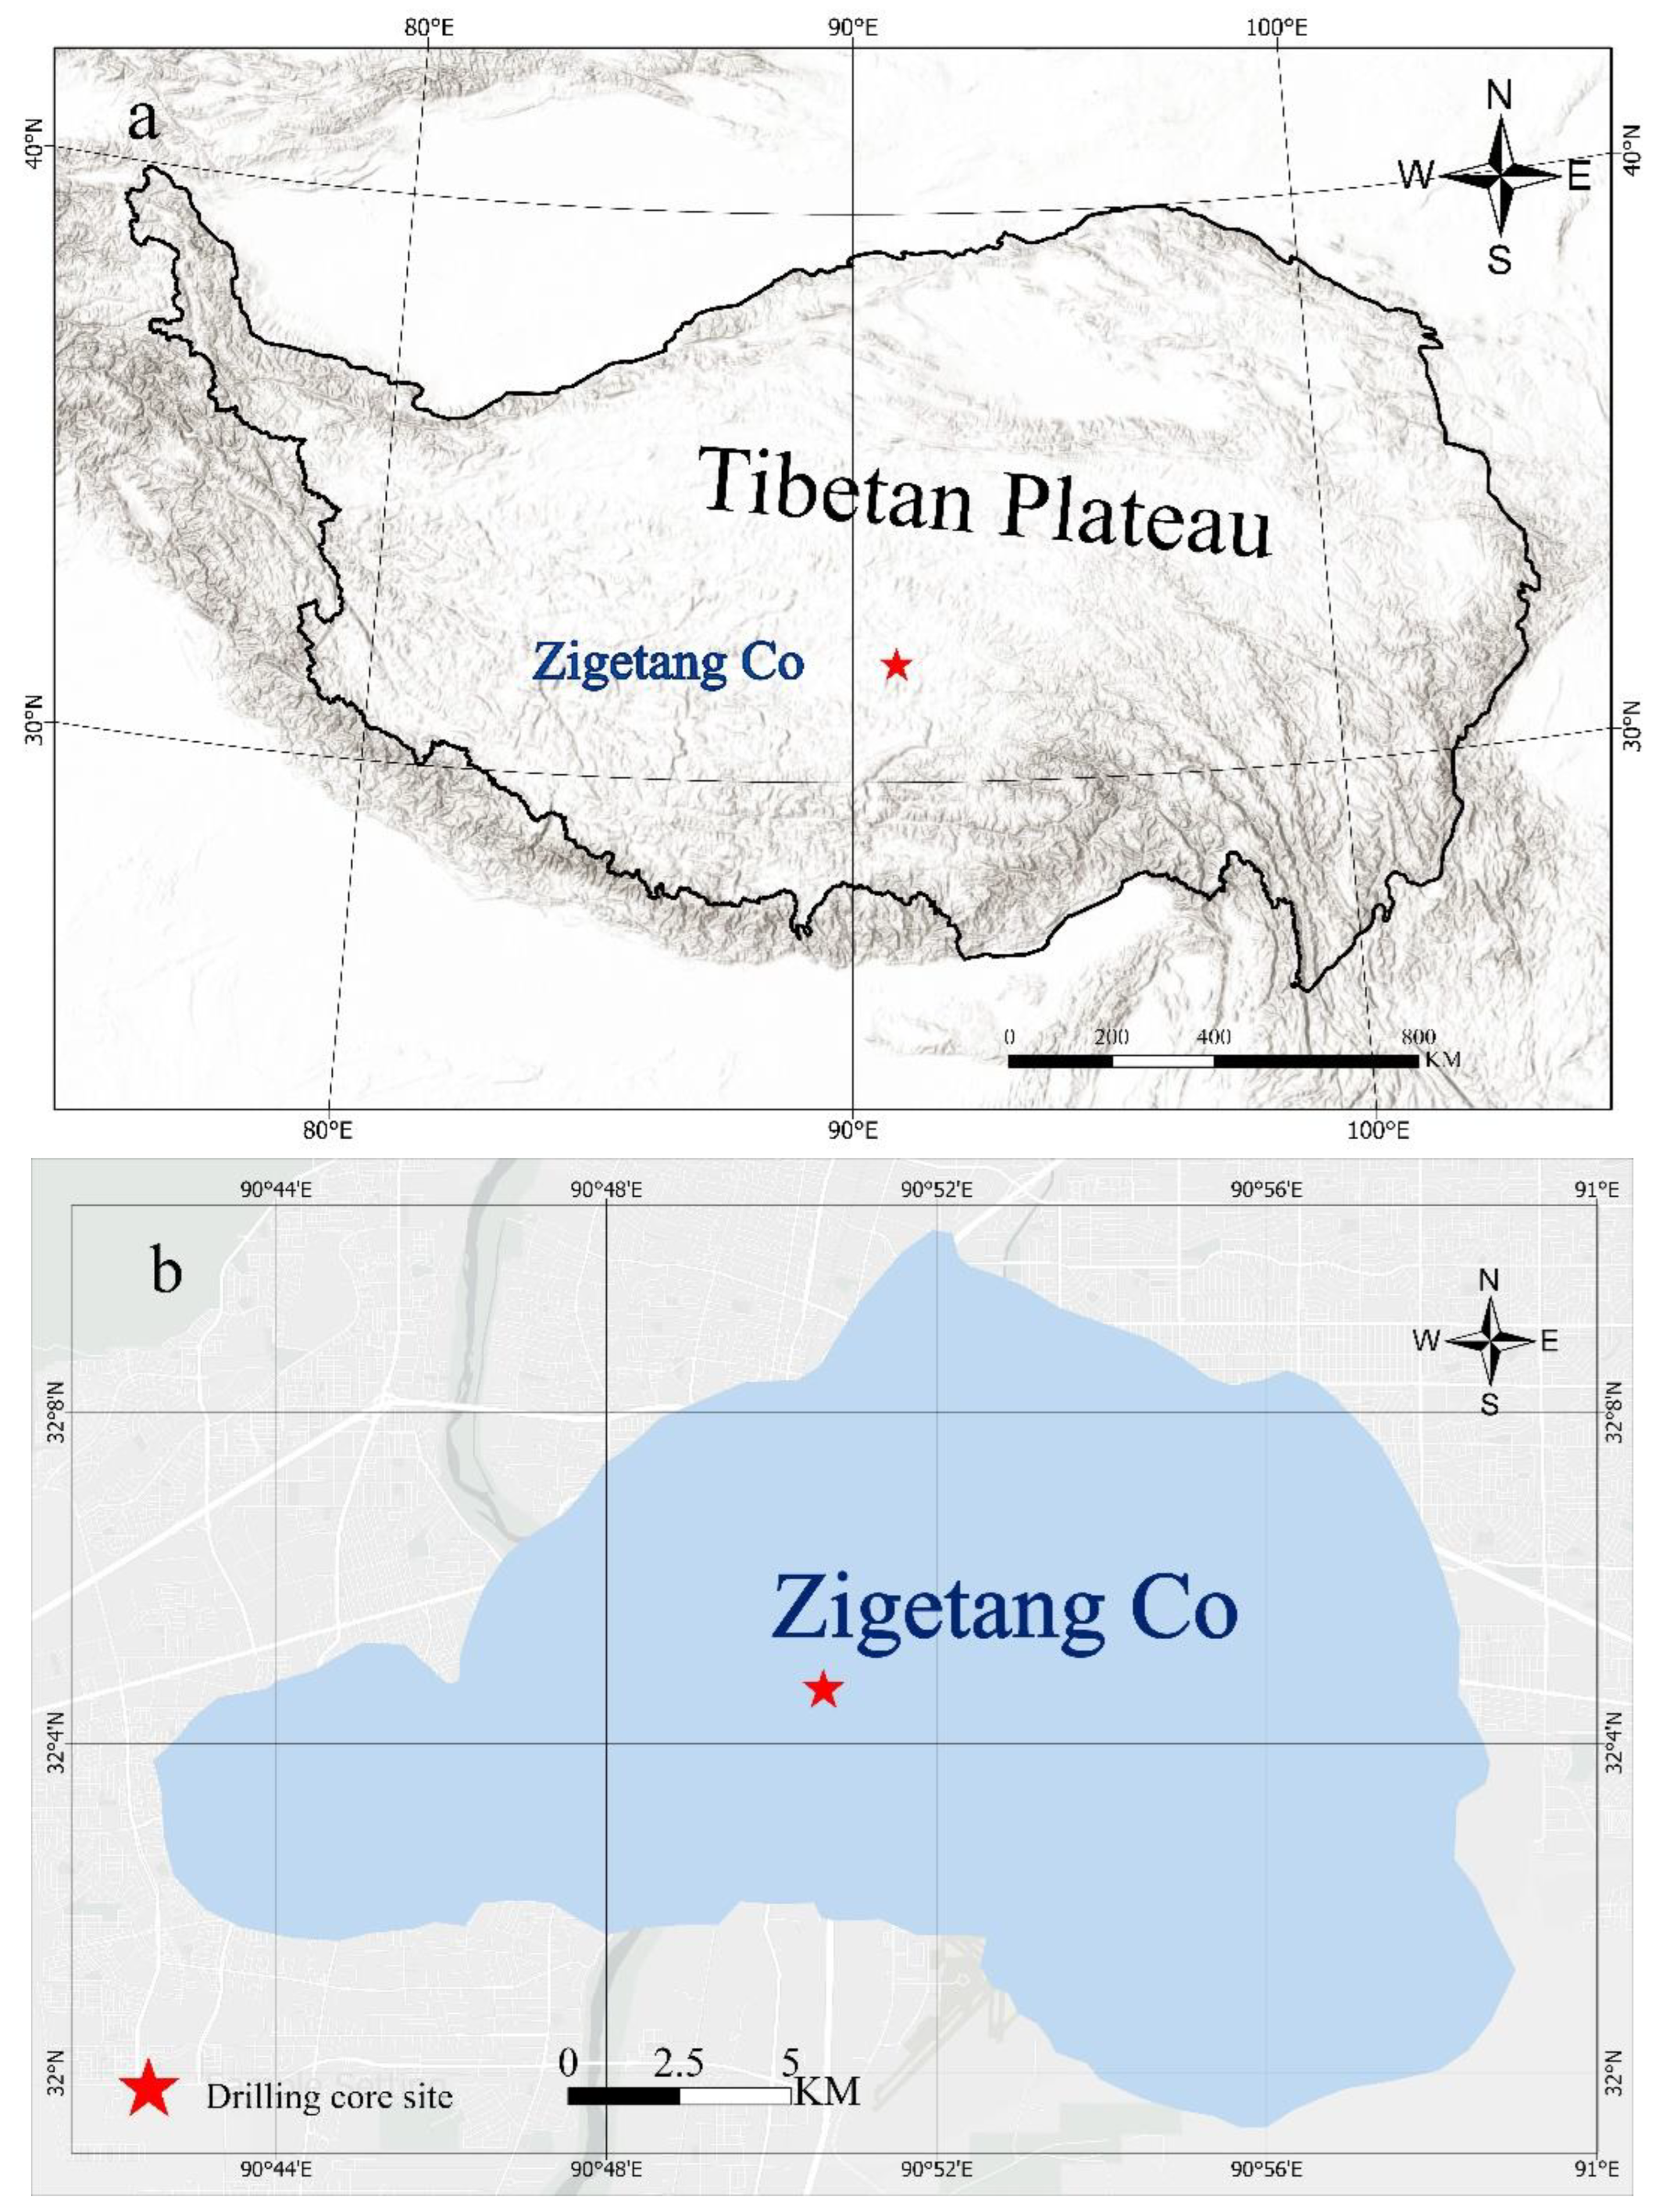
2.1. Study Area

Zigetang Co (32°00′~32°09′ N, 90°44′~90°57′ E), situated on the central TP within the Tanggula Mountains Basin, lies on the edge of the plateau’s semi-arid zone and is characterized as a typical closed lake (Figure 1) [32]. The lake covers an area of 187 km2, with an elevation of 4561 m above sea level and a maximum depth of 38.9 m. Human activities in the basin are limited, and glaciers are not present, with the lake primarily receiving water from surface runoff and precipitation. In the central and northern parts of the plateau at altitudes exceeding 3500 m, terrestrial vegetation primarily consists of C3 plants [33]. The lake has a pH of 10 and salinity of 41.36 g/L, indicating that it is a semi-mixed saline lake dominated by Na+ and HCO3 [28,34,35]. The annual mean temperature is relatively low due to the high elevation, varying from −3.4 to −0.4 °C, with instantaneous extremes of −13 °C in January and −8.9 °C in July [29].

2.2. Sample Collection and Preparation

In July and August 2012, we retrieved a continuous sediment core (length: 890 cm) from Zigetang Co. Sediment sampling was conducted using a piston sampler aboard a specialized research platform equipped with various instruments and sampling tools (UWITEC GmbH, Mondsee, Austria). The core samples were placed into PVC pipes and transported back to the laboratory. They were then sub-sampled at 1-cm intervals for further analysis. All samples were stored in a freezer prior to analysis.

2.3. Analytical Methods

14C-accelerator mass spectrometry (AMS) dating was used to determine the age of the Zigetang Co sediment core, and the carbon reservoir effect was corrected [32]. Sample pretreatment and analysis were conducted at the School of Earth System Science, Tianjin University in 2023.
TOC, TN, δ13Corg, and δ15N analysis: The freeze-dried sediment samples were sieved to a 100 mesh size. Each sediment sample was immersed in 10% HCl for 48 h to remove carbonates and then rinsed repeatedly with Milli-Q water until a neutral pH was reached. Subsequently, equal amounts of dried sediment samples were packaged in tin cups and analyzed using an elemental analyzer (Flash 2000 HT, Thermo Fisher Scientific, Waltham, MA, USA). Because the pretreatment steps removed the carbonate, the measured carbon content could be considered the TOC content, while the nitrogen content represented the TN content. These contents were typically expressed as percentages (%) of the TOC and TN in the sediment, and duplicate analyses produced an uncertainty of ±0.5%. The δ13Corg and δ15N compositions were determined using a stable isotope mass spectrometer (MAT 253 Plus, Thermo Fisher Scientific, Waltham, MA, USA) with the IAEA600 and USGS40 standards. All analyses were determined with an analytical error of 0.15‰. The results were calculated using the following formula:
δX = (Rs/Rst − 1) × 1000,
where, X represents the elements of C and N, and Rs and Rst represent the ratio of isotopes in the sample and the standard, respectively. These were expressed in per mil (‰) to represent the composition of δ¹³Corg and δ¹⁵N in sediment samples.
Pollen analysis: The HF treatment method was applied, followed by sequential treatments with 10% HCl, 10% NaOH, 36% HF, and acetolysis. The samples then underwent ultrasonic shaking and were filtered through a 10 μm nylon cloth before centrifugal enrichment. During the process, spore tablets (27,637 ± 563 grains) were also added to facilitate the quantitative calculation of the pollen concentration. The treated samples were then mounted on slides and observed under a 400-fold Zeiss optical microscope for pollen identification with reference to the Flora of China: Pollen Morphology [36], Pollen Morphology of Common Aquatic Vascular Plants in China [37], and Atlas of Quaternary Pollen in China [38].
Data analysis: The TOC, TN, δ13Corg, and δ15N data were obtained directly from the instrumental analyses. The C/N ratio was calculated using Office 16 software. The correlations referred to in the text were determined using SPSS version 27. All geochemical index variation graphs were drawn using the Origin 2019 software. The pollen percentage diagrams were plotted using the Tilia 2. 0. 45 software, and a cluster analysis was conducted on the pollen diagrams using a CONISS program [39,40].

3. Results

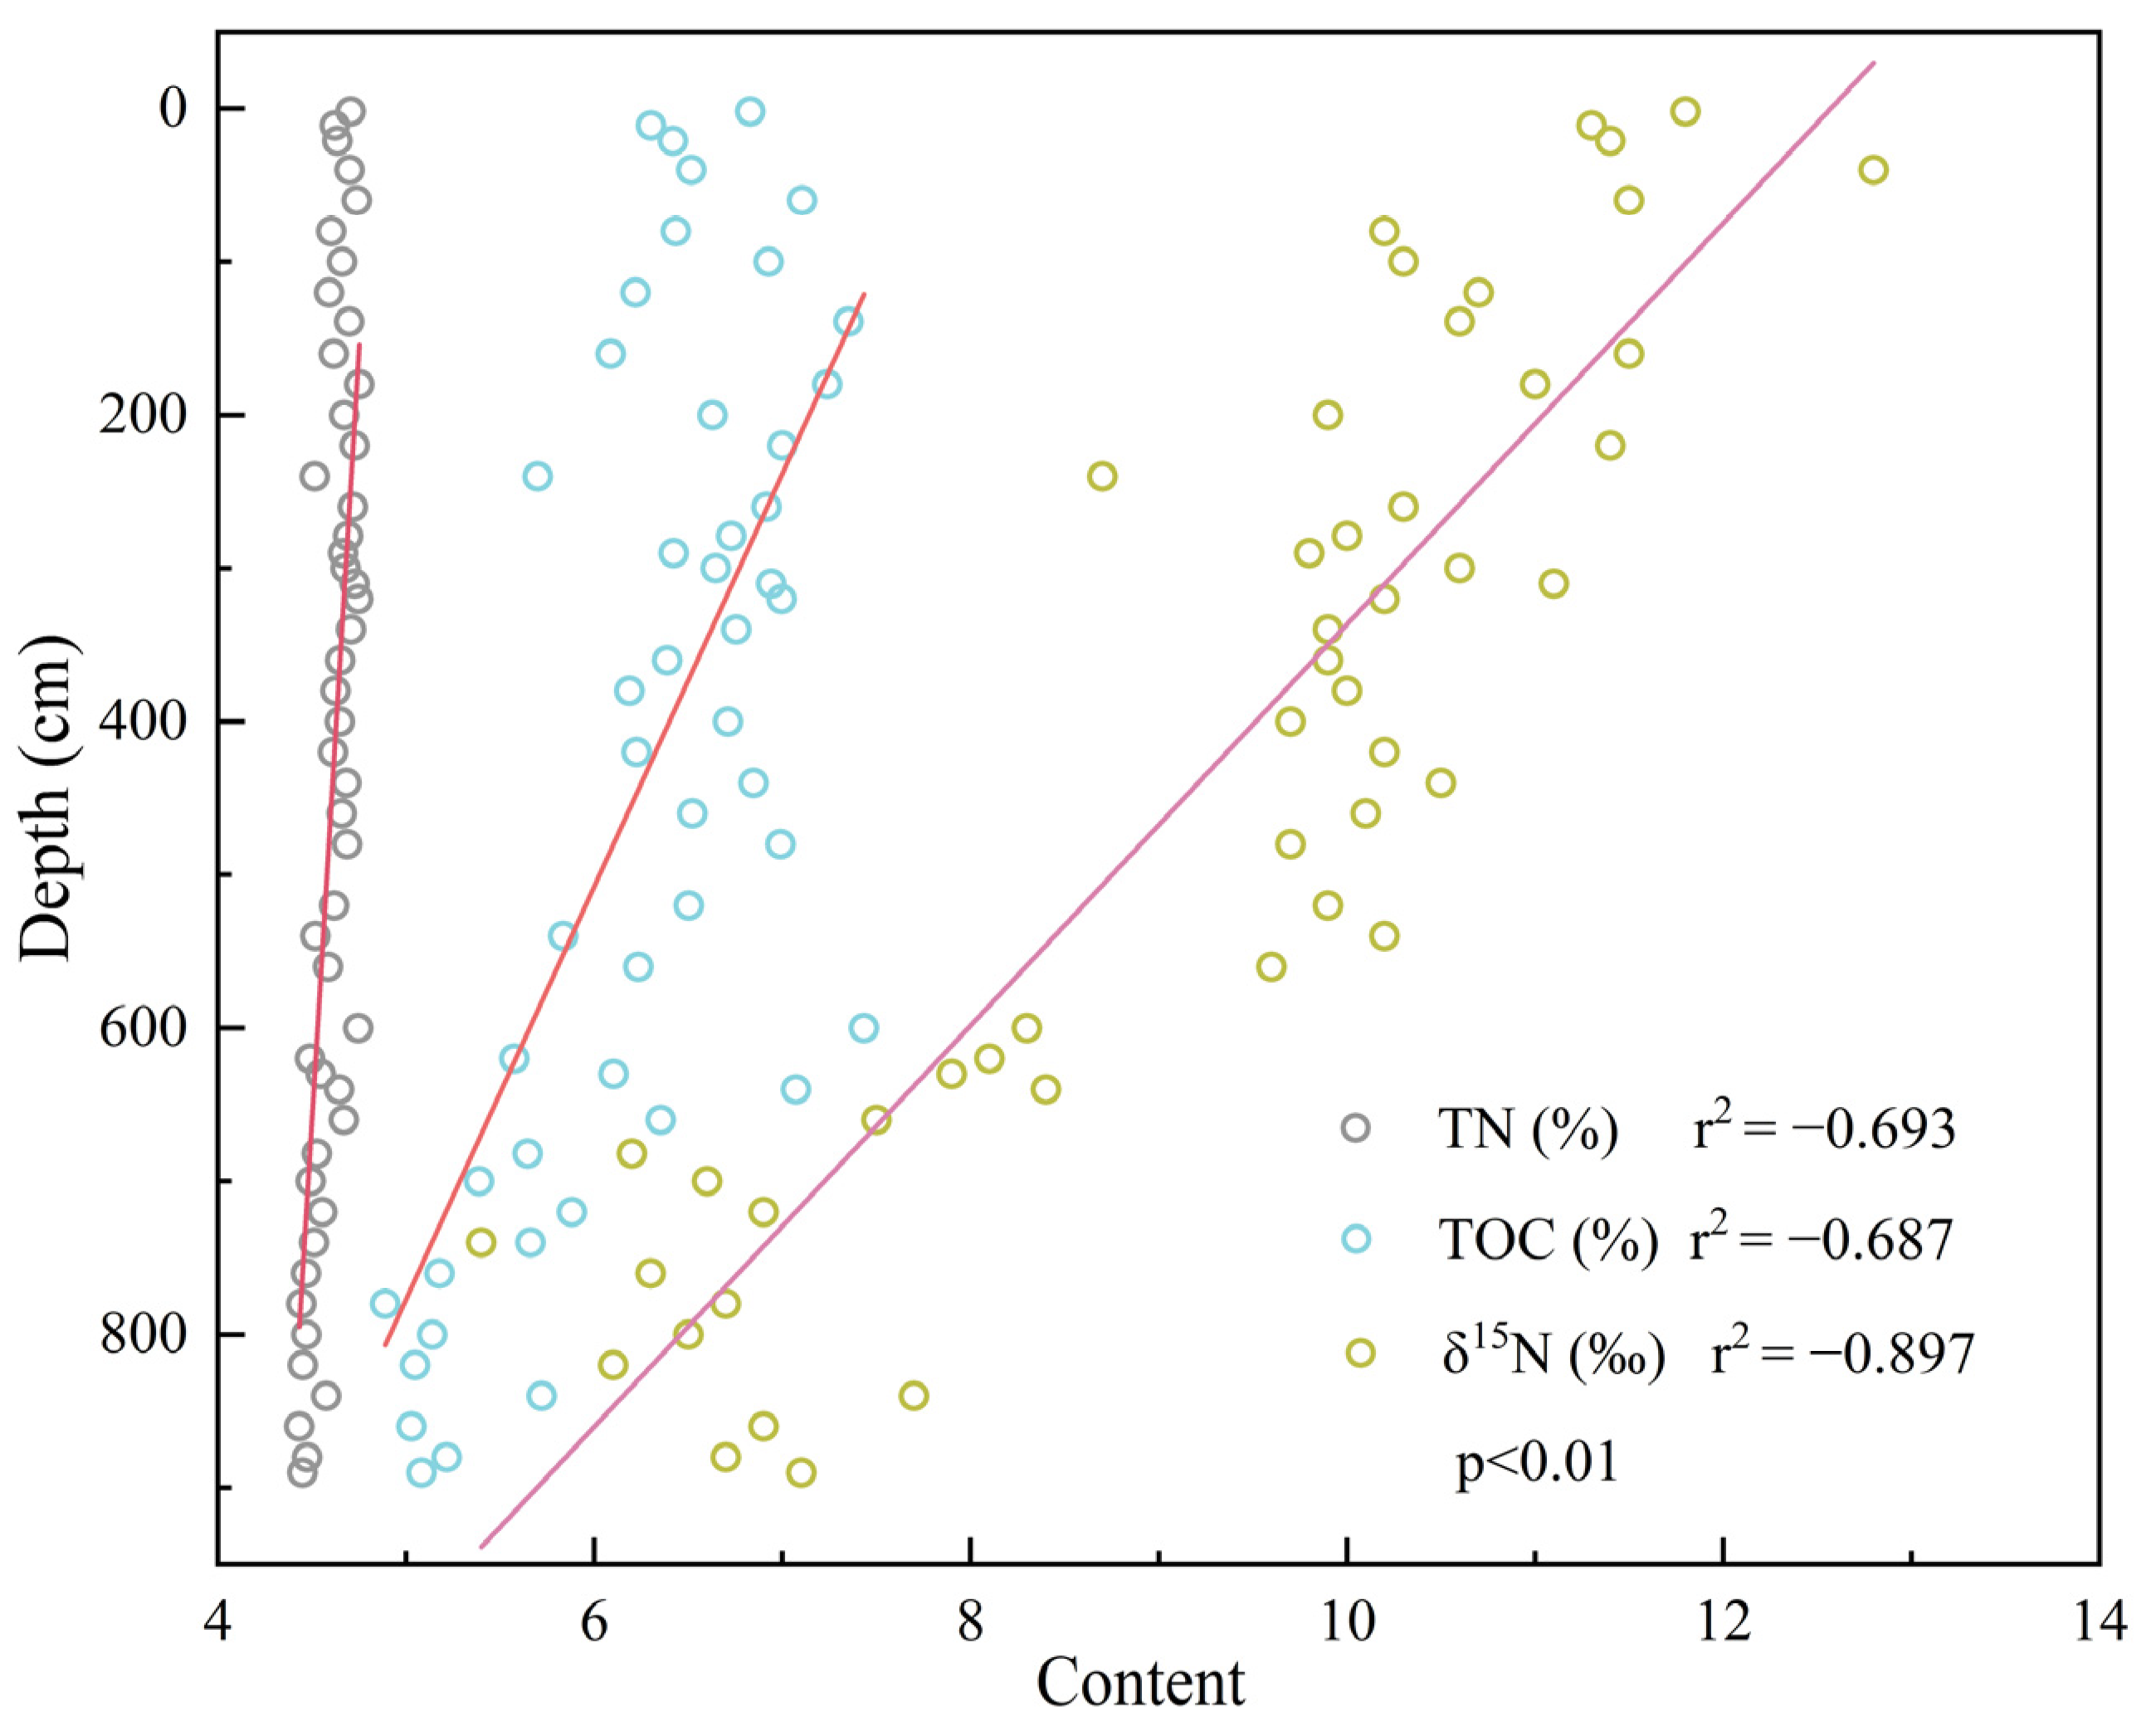
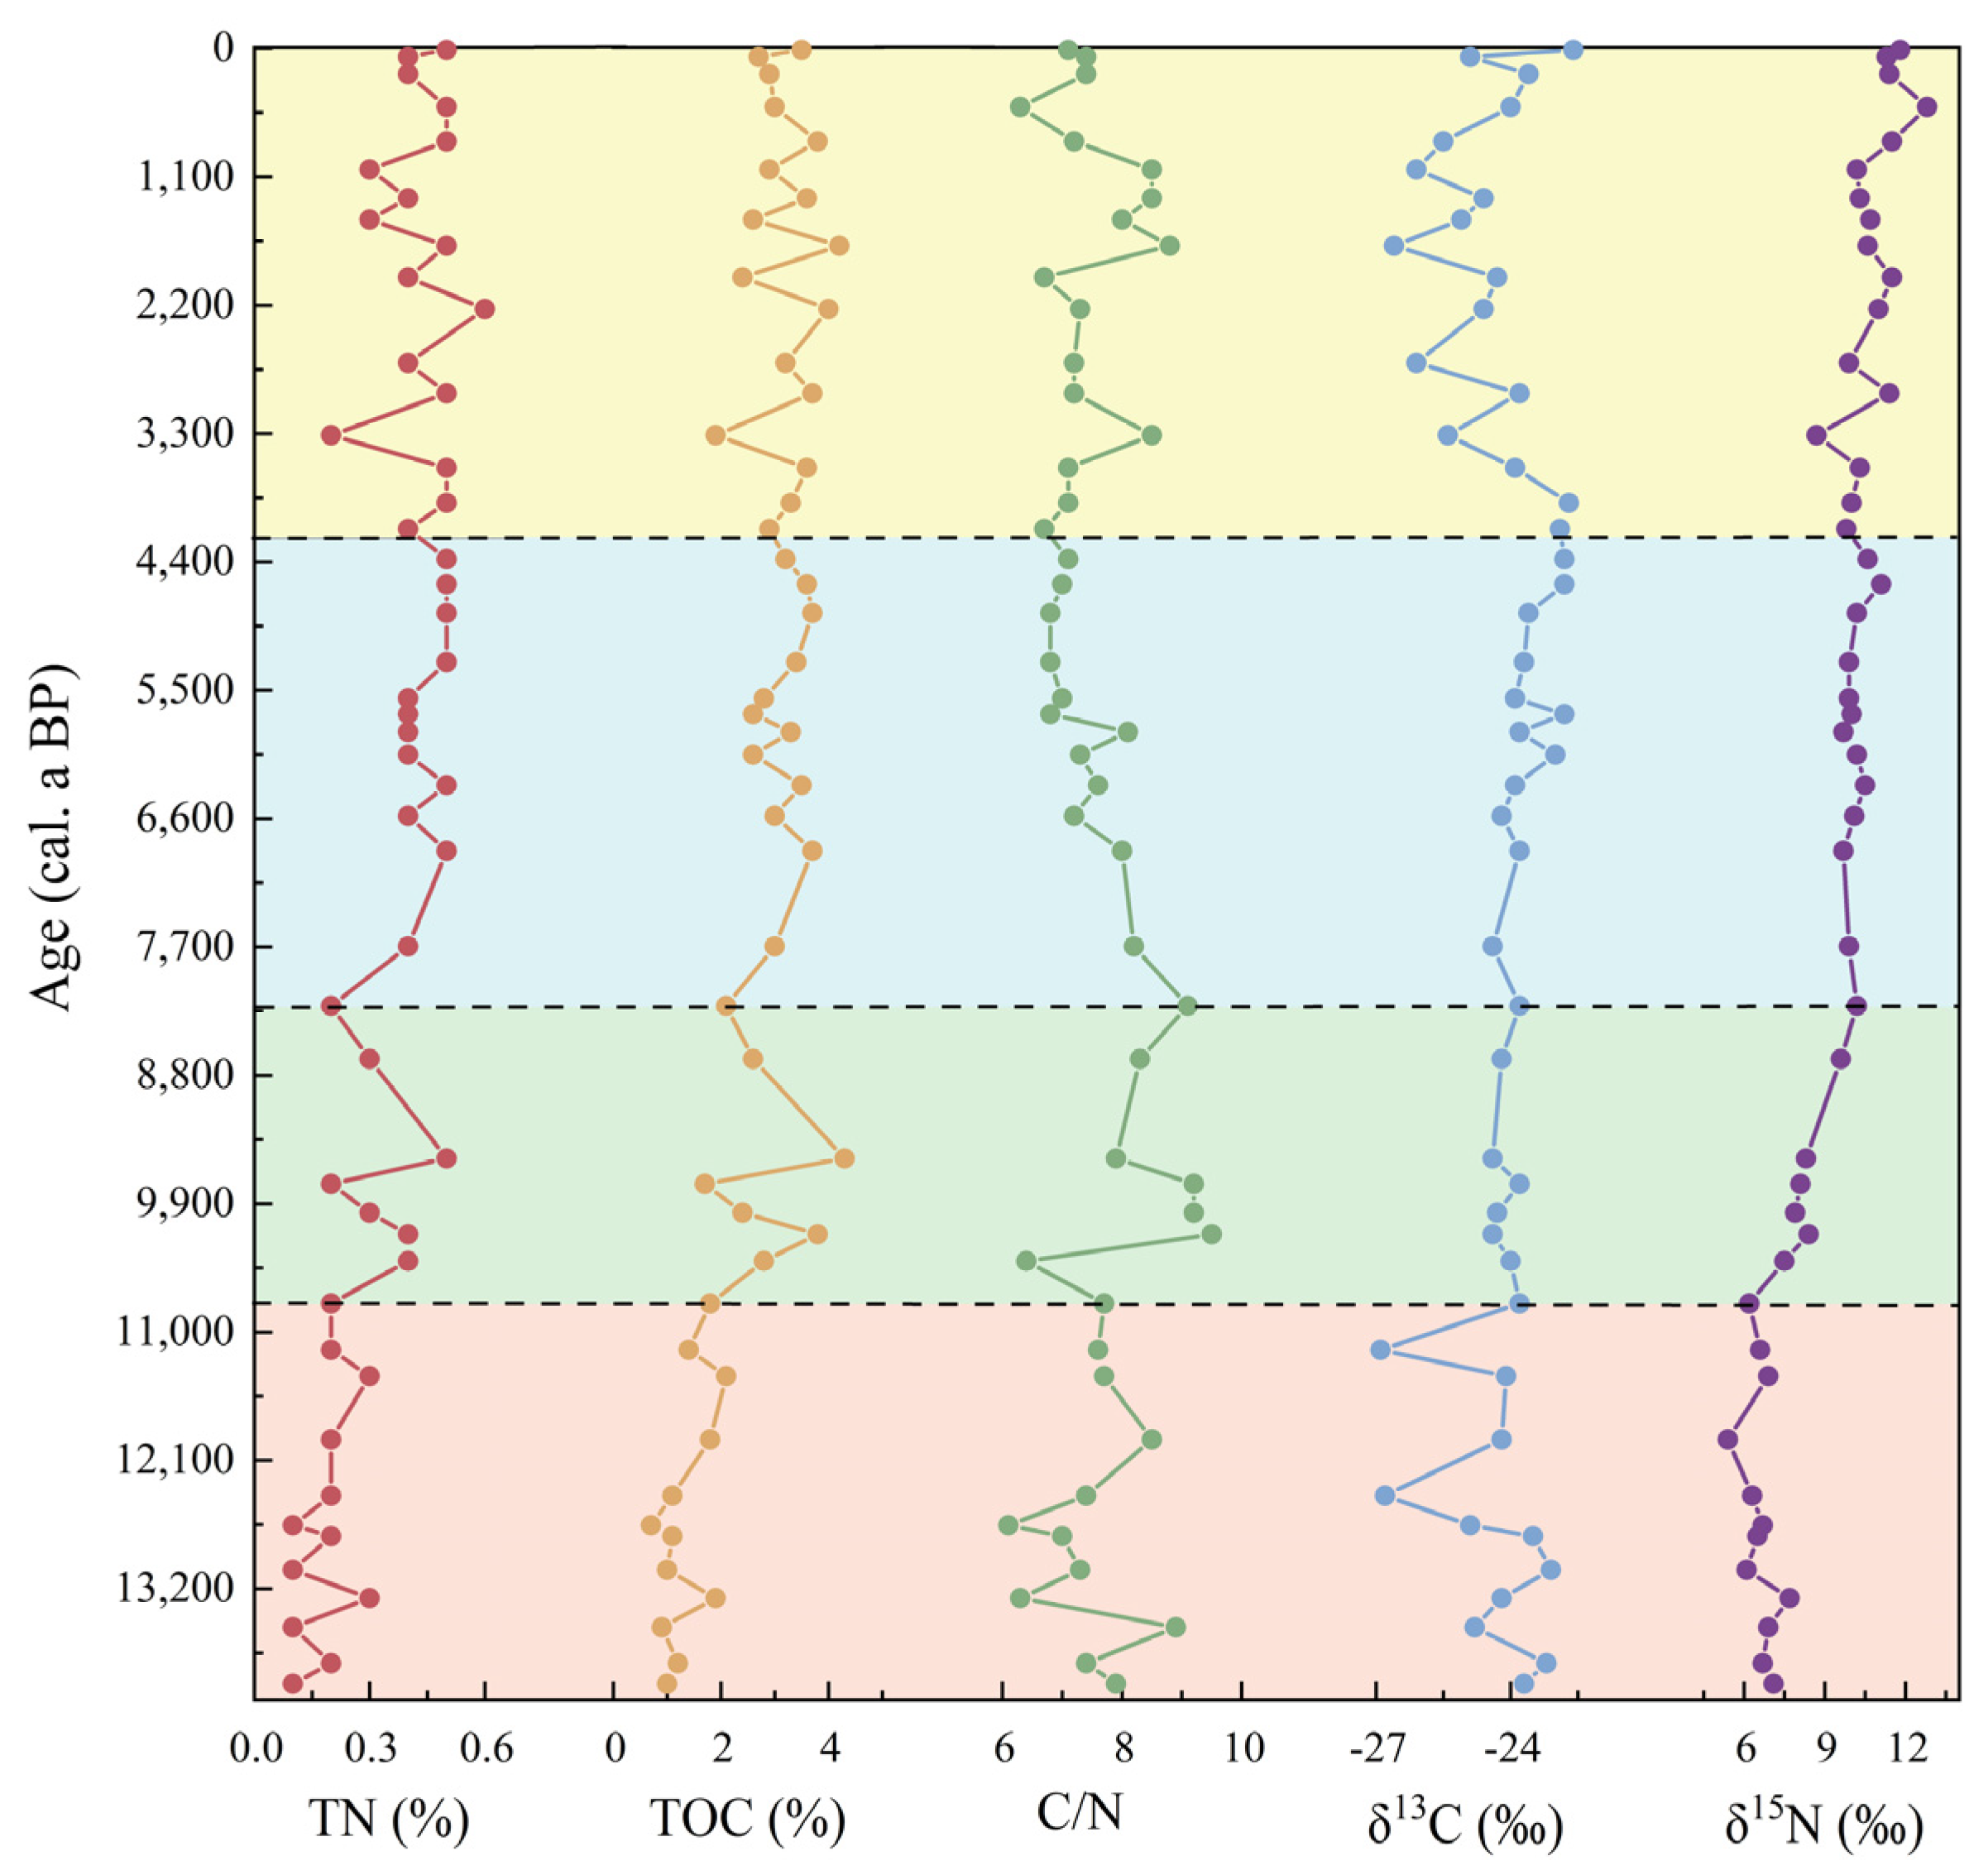
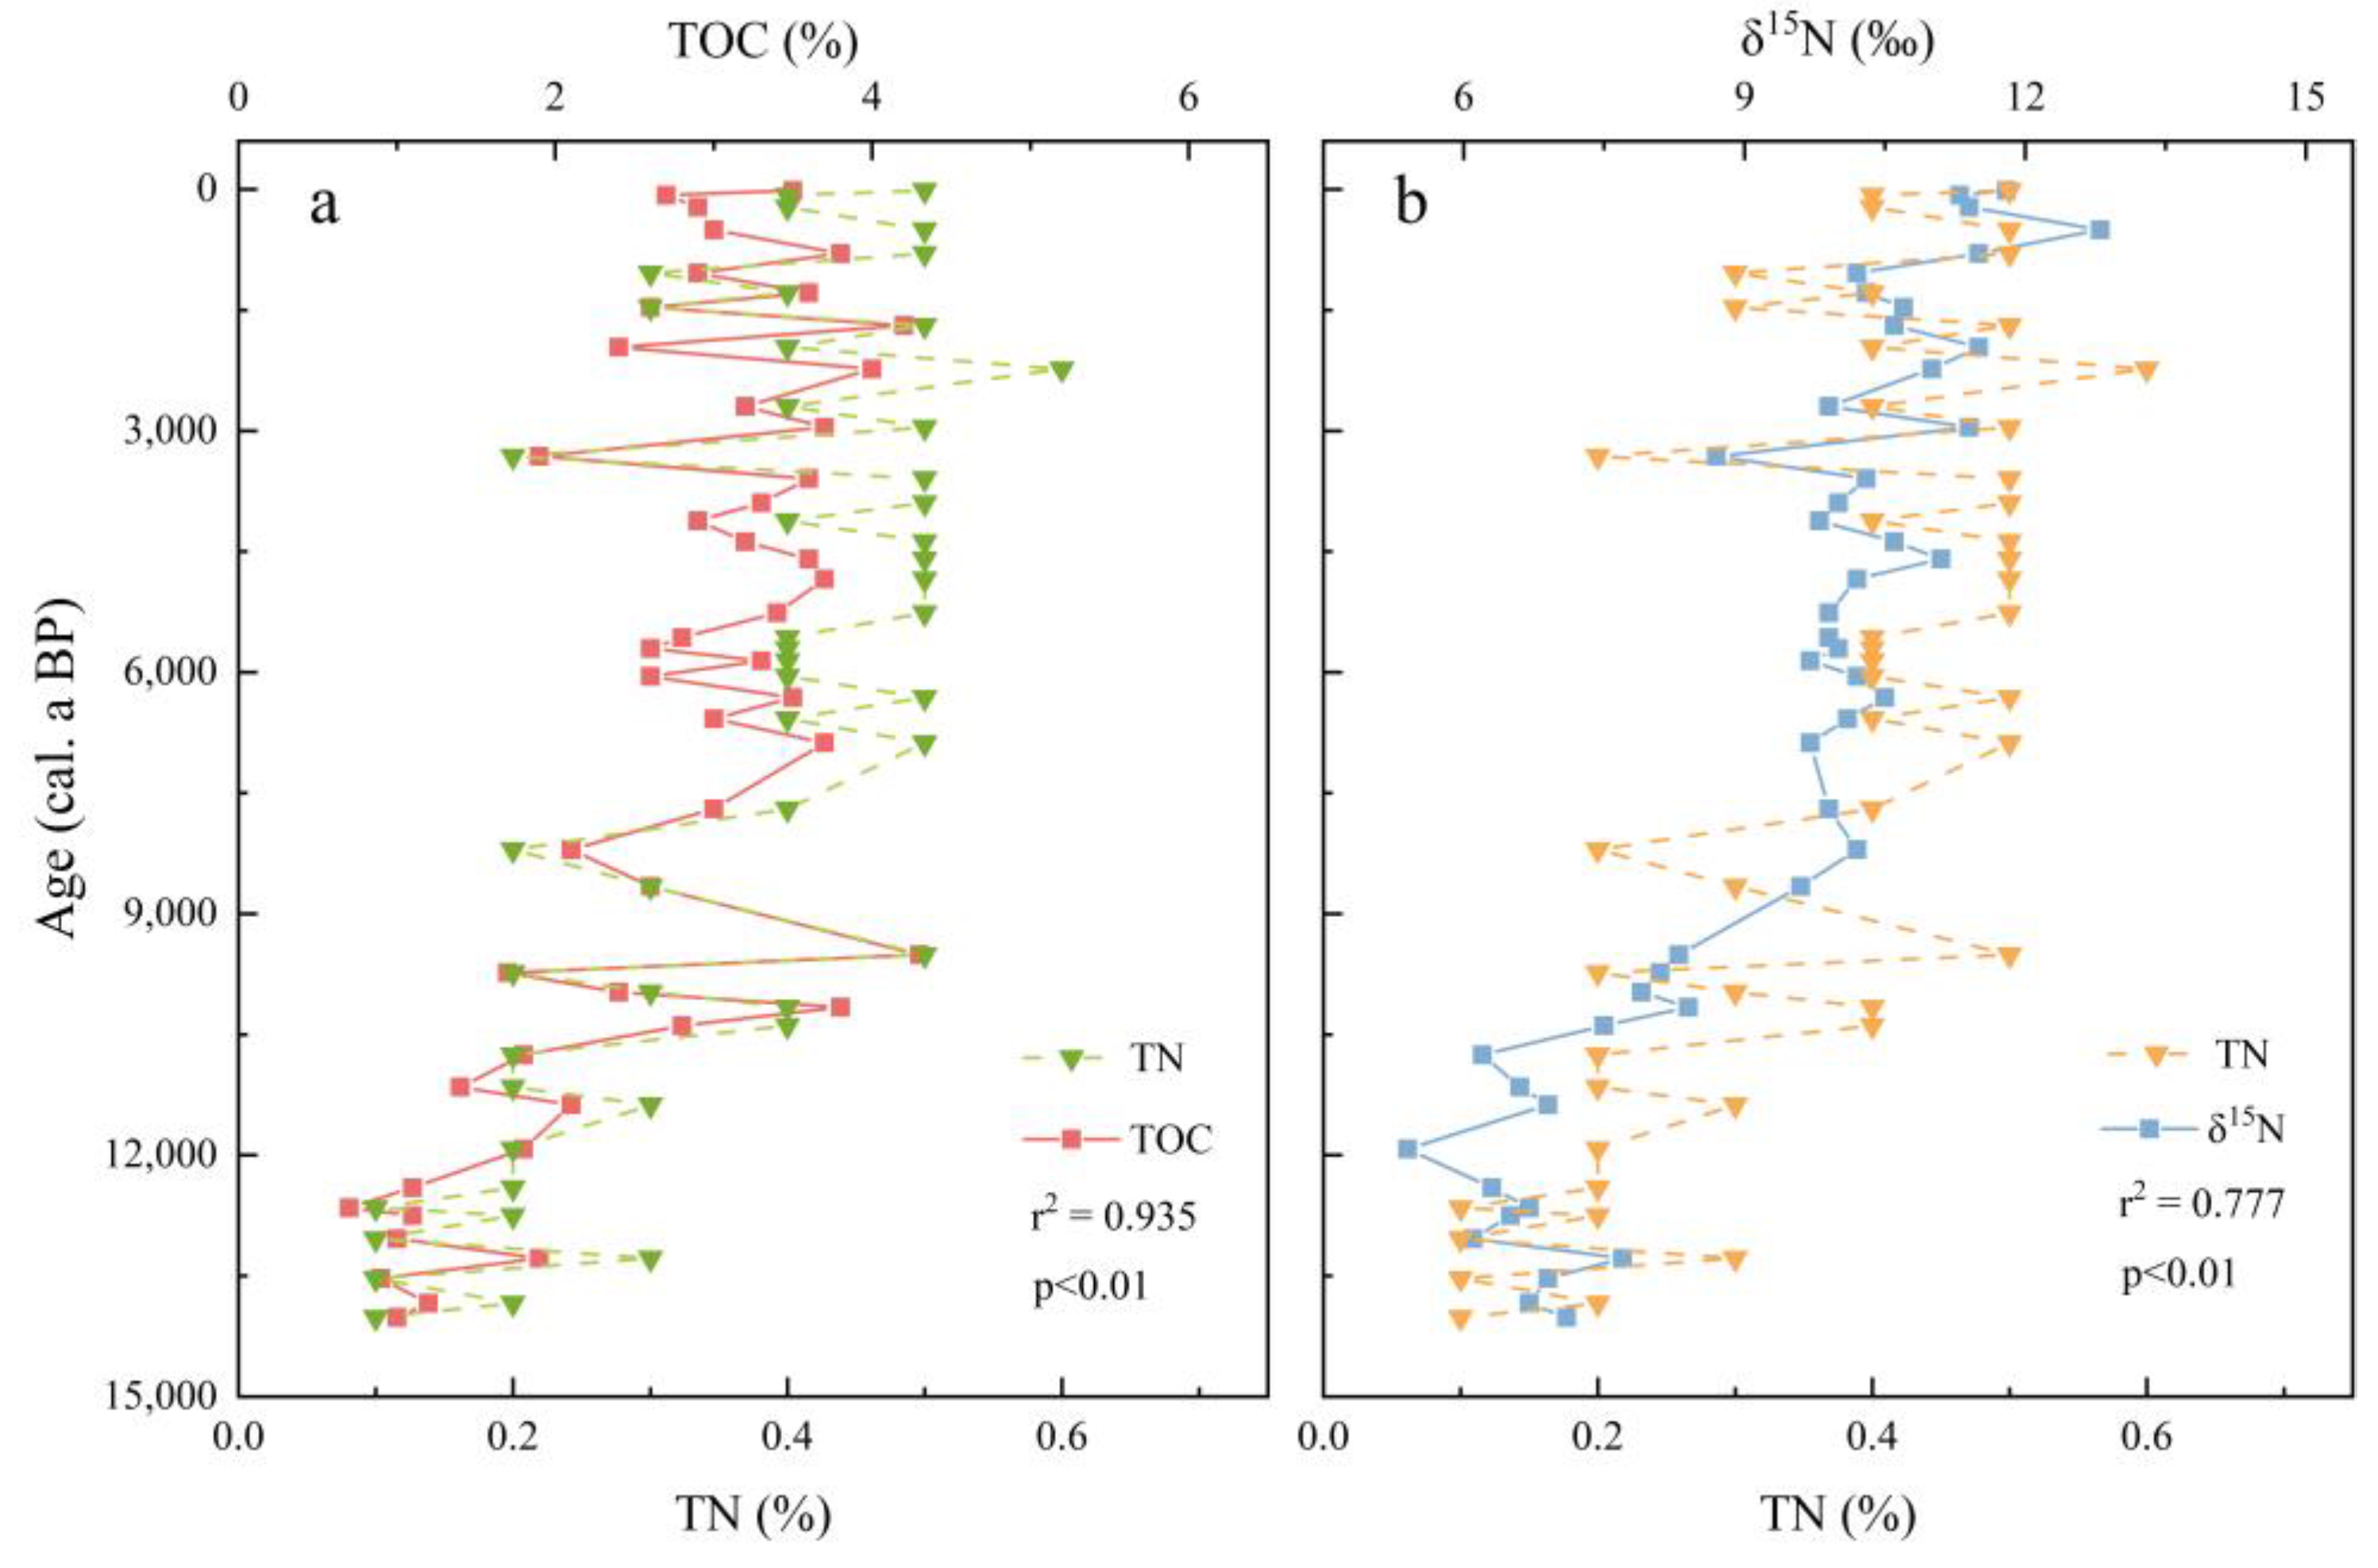
3.1. Variations in Geochemical Indicators

There were significant negative correlations between both the TOC and TN contents, and depth in the Zigetang Co sediment, indicating that the TOC and TN contents increased as the depth decreased (Figure 2). The TOC content fluctuated between 0.3% and 4.3%, with a mean value of 2.7%. The TN content fluctuated between 0.1% and 0.6%, with a mean value of 0.4% (Figure 3). The changes in the TOC and TN contents with the depth were similar. The correlation analysis revealed a significant correlation between the TOC and TN (r2 = 0.959) (Figure 4a). The TOC and TN changes could be roughly divided into four stages. During the period of 14.0–10.8 cal. ka BP, they were in a relatively low-value stage (both below the mean), with the TOC and TN reaching their minimum values at 12.7 and 13.5 cal. ka BP, respectively. During the period of 10.8–8.2 cal. ka BP, there was an increase in both the TOC and TN contents, accompanied by strong and significant fluctuations, with the TOC reaching its maximum value at 9.5 cal. ka BP. During the 8.2–4.2 cal. ka BP, there was a relatively steady change in the TOC and TN, but there were noticeable increasing and decreasing trends. During the recent 4.2 cal. ka BP, both the TOC and TN exhibited noticeable rapid changes, with the TN reaching its maximum value at 2.2 cal. ka BP. The average C/N ratio was 7.6, fluctuating between 6.1 and 9.5. Overall, there was no discernible pattern regarding C/N variations. However, notable decreases were evident between 13.5–13.3 and 1.0–0.05 cal. ka BP, while there were increases between 12.7–11.9, 10.4–10.2, and 2.0–1.7 cal. ka BP (Figure 3).

3.2. Characteristics of the δ13Corg and δ15N Variations

The δ13Corg value fluctuated between −26.9‰ and −22.6‰, with a mean of −24.2‰. The changes in δ13Corg could be roughly divided into four stages. During 14.0–10.8 cal. ka BP, the δ13Corg value was relatively low and was characterized by significant fluctuations, reaching a minimum value around 11.2 cal. ka BP. During 10.8–8.2 cal. ka BP, the δ13Corg values remained relatively stable, with little variation. During 8.2–4.2 cal. ka BP, there was a relatively high-value phase. During 4.2–0.01 cal. ka BP, the δ13Corg value displayed a pattern of initially decreasing and then increasing. The δ13Corg values were relatively low (mostly below the average) during this time. From around 3.3 cal. ka BP, there were frequent and substantial fluctuations, leading to an increase in the δ13Corg values, which reached a maximum around 0.01 cal. ka BP (Figure 3).
The fluctuations in the δ15N value had relatively small frequencies and amplitudes, but they displayed a large numerical variation, with a mean of 9.3‰ and a range from 5.4‰ to 12.8‰. There was a significant negative correlation between δ15N and depth, indicating that as the depth decreased, there was a noticeable increase in δ15N (Figure 2). There was also a significant positive correlation between δ15N and TN (r2 = 0.777) (Figure 4b). The trend in the δ15N variations could also be divided into four stages. During 14.0–10.8 cal. ka BP, the δ15N values were generally low, with an initial decreasing trend followed by an increase. In the second stage, 10.8–8.2 cal. ka BP, there was a clear trend of increasing δ15N values. In the third stage, 8.2–4.2 cal. ka BP, the δ15N values remained relatively stable, with the smallest magnitude of variation. In the fourth stage during 4.2–0.01 cal. ka BP, there were noticeable increasing and decreasing trends, with relatively high δ15N values.

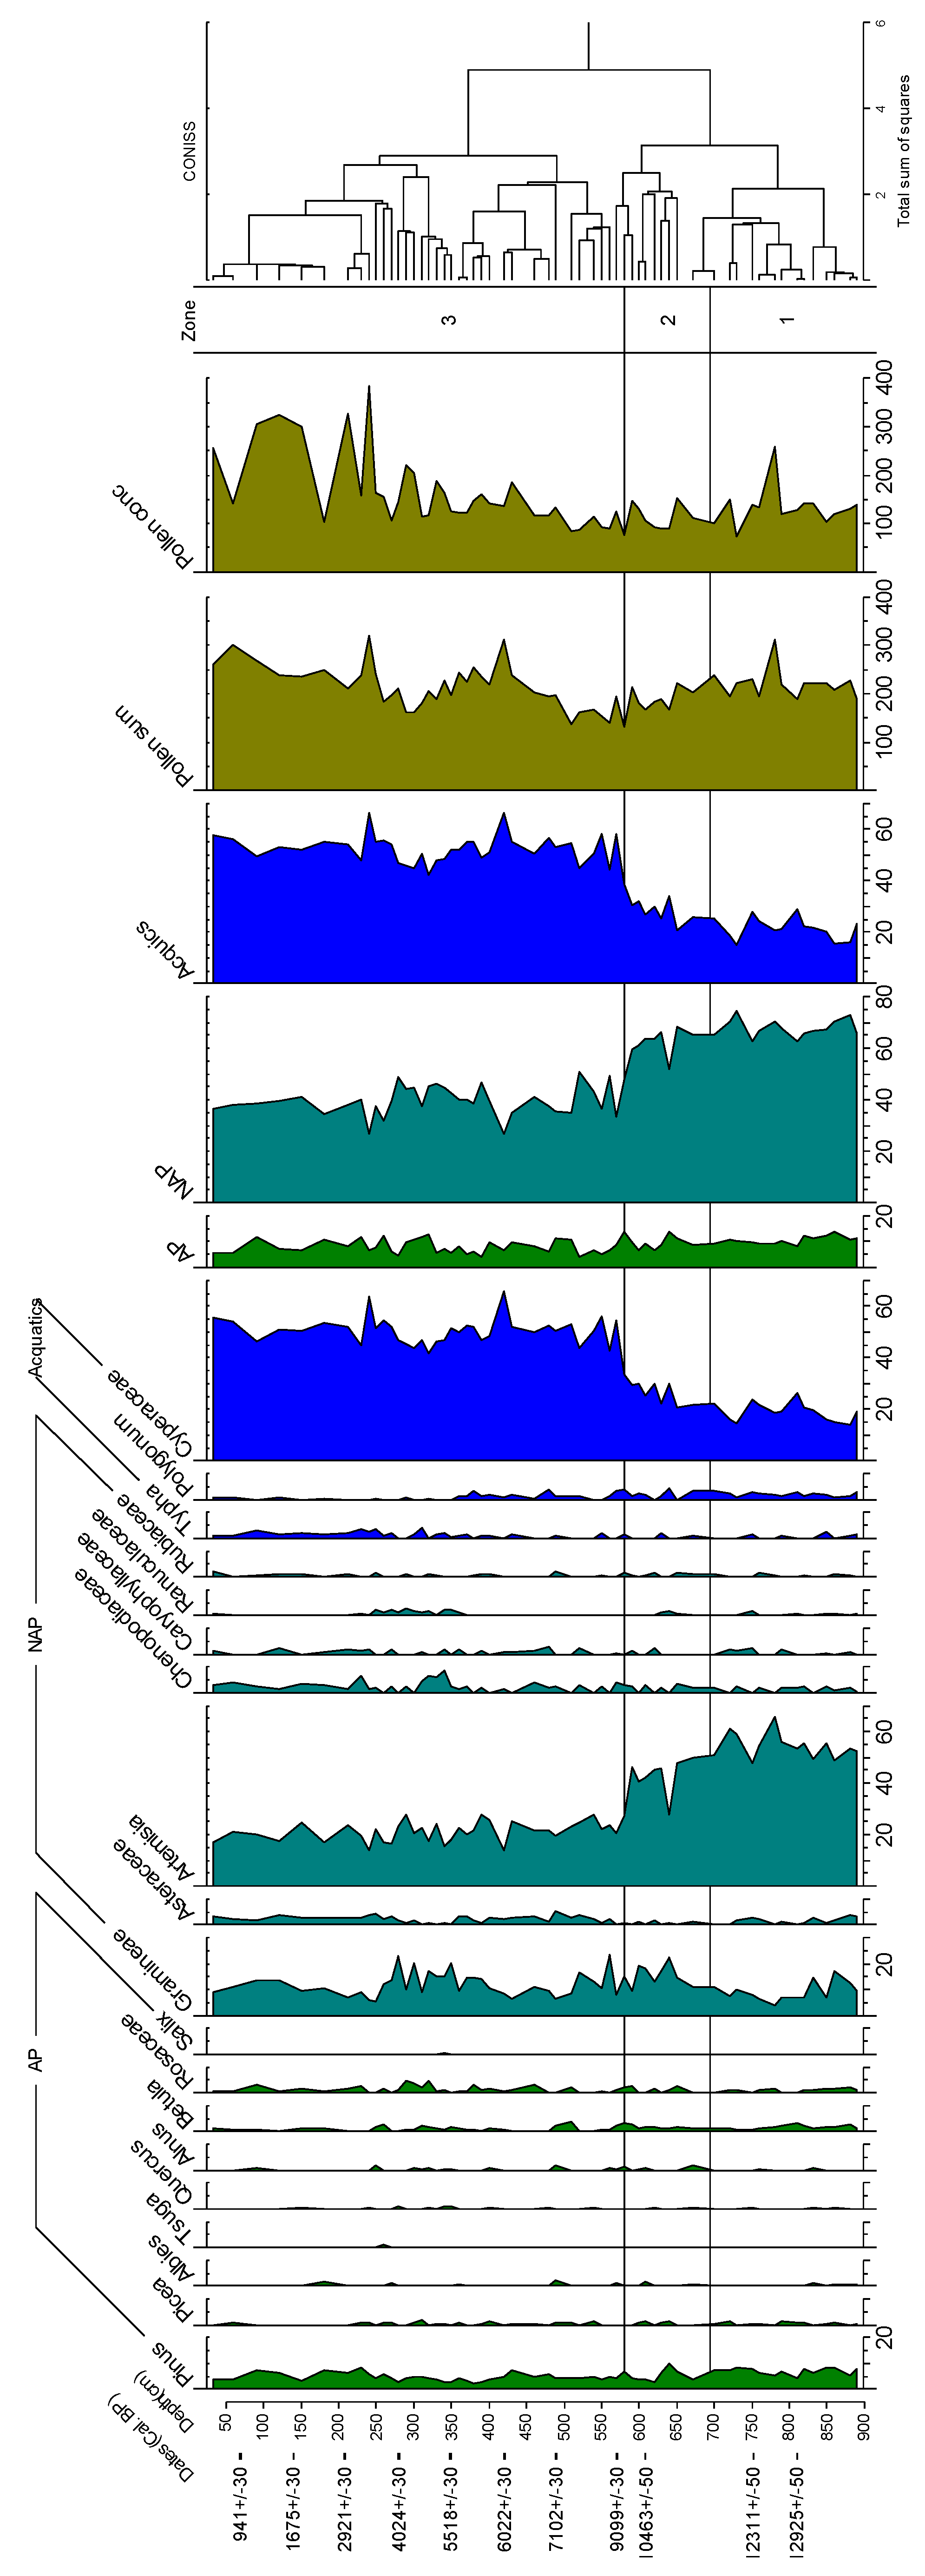
3.3. The Division and Characteristics of Pollen Assemblage Zones

The pollen analysis results indicated that the pollen content of the 59 samples from the Zigetang Co core was low, and the vegetation types were relatively monotonous. A total of 22 genera of pollen were identified. The samples were overwhelmingly dominated by pollen from herbaceous plants, which accounted for 80–90% of the total content. In the pollen from terrestrial herbaceous plants, the dominant genus was Artemisia, which accounted for over 60% of the total. Other commonly found genera included Gramineae, Chenopodiaceae, Asteraceae, and Caryophyllaceae. The pollen content of aquatic herbaceous plants was also notable, and was primarily dominated by Cyperaceae, with small amounts of Typha and Polygonum. The pollen content of woody plants in the core was low, and mainly included small amounts (no more than 10%) of Pinus. Other frequently encountered genera included Picea, Abies, Tsuga, Quercus, Alnus, and Betula. Due to the currently unsuitable conditions for the growth of these woody plants in the lake area, it was evident that these pollen grains reflected pollen transport from outside the watershed. Therefore, caution should be exercised when analyzing vegetation and environmental changes. Based on the characteristics of pollen from various families, especially the two main components, Artemisia and Cyperaceae, in the pollen diagram (Figure 5), combined with the analysis using the CONISS program, the pollen assemblage was divided into three pollen zones.
Zone 1 (890–695 cm, 14.0–11.0 cal. ka BP). In this zone, pollen from Artemisia was overwhelmingly dominant, with the average content reaching 54.46%. The pollen content of Cyperaceae was only 19.05%, followed by Gramineae at 9.27%. Other commonly found genera included Asteraceae (1.52%), Chenopodiaceae (1.3%), Caryophyllaceae (0.63%), and Typha (0.5%).
Zone 2 (695–580 cm, 11.0–9.3 cal. ka BP). In this zone, there was a change in the pollen assemblage, with the pollen content of Artemisia gradually decreasing but still maintaining a relatively high level (43.06%). The pollen content of Cyperaceae significantly increased, reaching 26.09%, while the pollen content of Gramineae also increased substantially (15.7%). Among the other common pollen types, the Asteraceae (0.5%), Caryophyllaceae (0.45%), and Typha (0.39%) contents decreased.
Zone 3 (580–0 cm, 9.3 cal. ka BP to the present). During the late Holocene, there was little change in the characteristics of the pollen vegetation zones, which remained relatively stable. The main change observed was the significant increase in the pollen content of Cyperaceae, which became the dominant component, with a pollen content of 48.98%, while the former primary component, Artemisia pollen content, rapidly decreased to 21.3%. The pollen content of Cyperaceae significantly increased to 26.1%, while the pollen content of Gramineae decreased slightly (12.3%).

4. Discussion

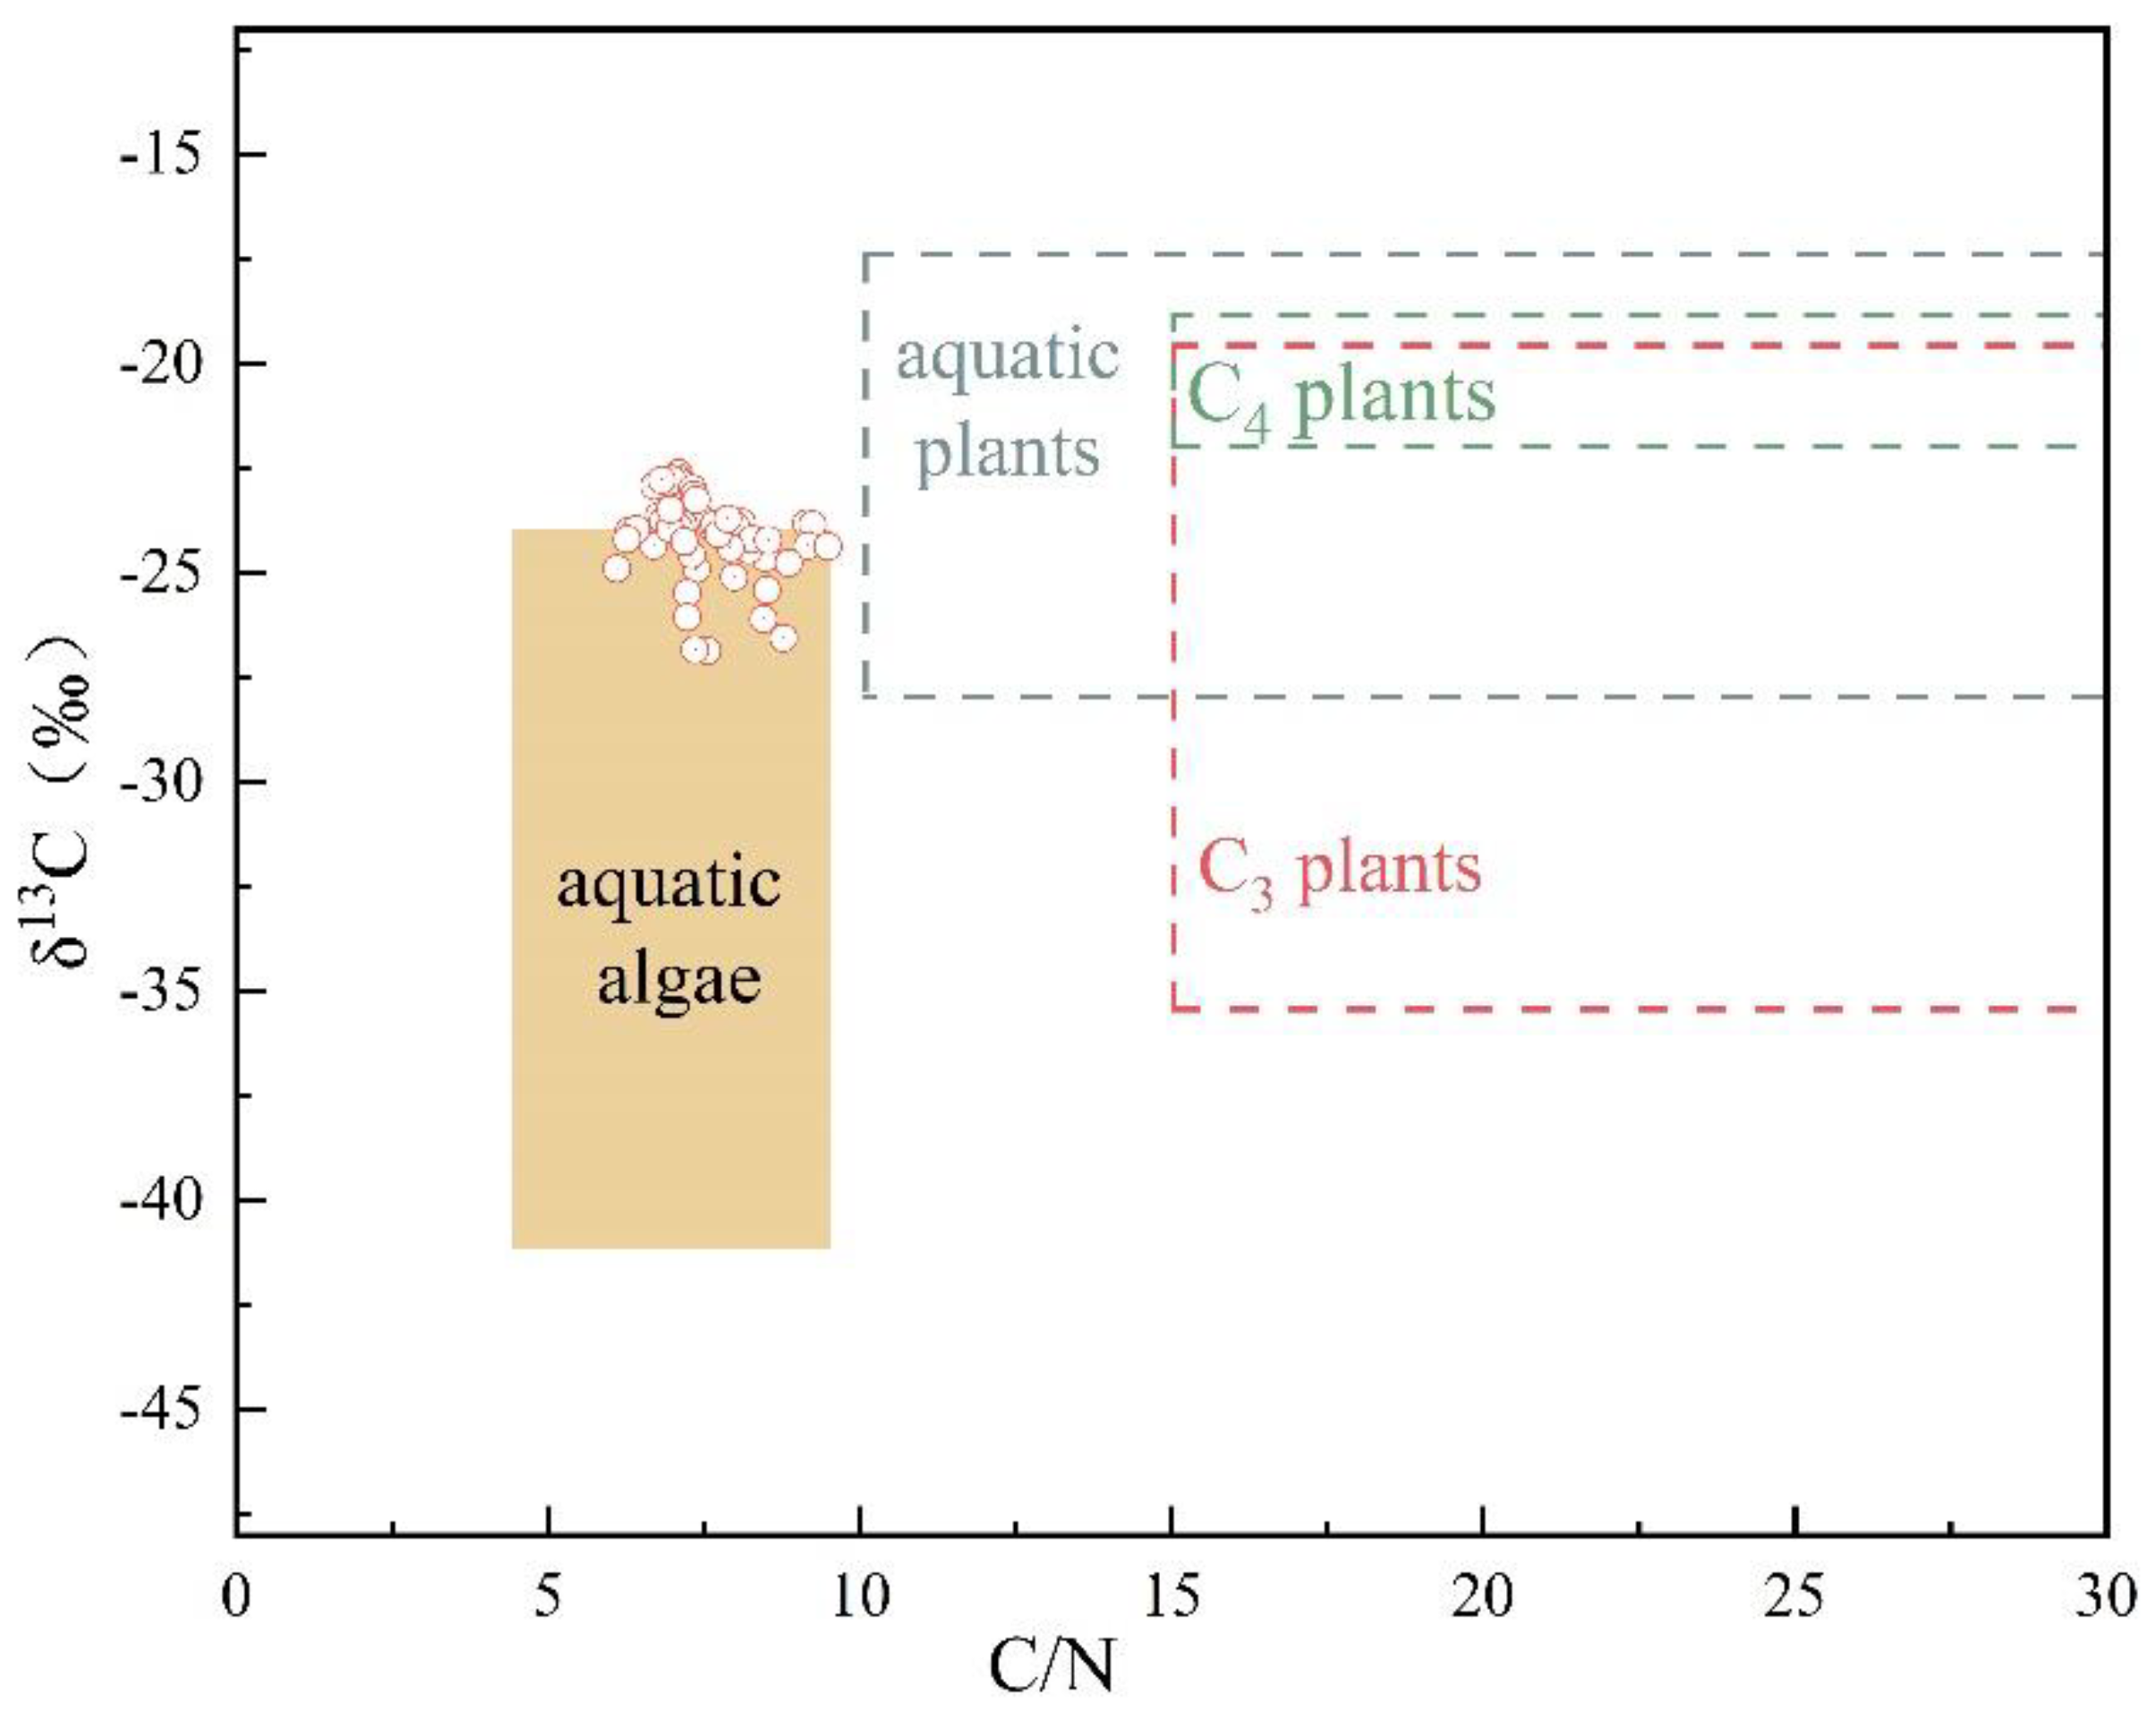
4.1. Sources of Lake Organic Matter

The C/N, δ13Corg, and δ15N values can be used as indicators to effectively distinguish the sources of organic matter in lakes [41,42]. For different types of plants there are significant differences in the δ13Corg and C/N due to variations in the mechanisms of photosynthesis. The C/N and δ13C ranges generated by aquatic algae are typically 4 to 10 and −28‰ to −18‰, respectively, while the C/N produced by terrestrial plants generally exceeds 15 [11,43,44]. The C/N values in the study area ranged from 6.1 to 9.5, with a δ13Corg value between −26.9‰ and −22.6‰, indicating that the organic matter in Zigetang Co primarily originated from aquatic algae (Figure 6). Sedimentary δ15N also provides information about the source of organic matter in lakes. The average δ15N value produced by aquatic planktonic plants using dissolved nitrate is approximately 8‰ (ranging from 7‰ to 10‰), whereas terrestrial plants utilizing atmospheric nitrogen (with a δ15N value of 0) produce a δ15N value of approximately 1‰ [45]. The range of δ15N variation in the study area was 5.4‰ to 12.8‰, with a mean value of 9.3‰. The higher δ15N values further indicated that the organic matter in the sediment of Zigetang Co primarily originates from aquatic plants. This was also supported by the results of a study of n-alkane indicators, which suggested that phytoplankton and photosynthetic bacteria largely contributed to organic matter patterns [32].

4.2. Geochemical Indicators and Climate-Environmental Changes

The primary productivity of a lake and the input of organic matter influence the TOC and TN content in sediment [46]. However, in areas less affected by human activities, the productivity of lakes is closely related to the environmental conditions and climate at that time [47]. When the temperature is high, the vegetation growth is lush, organic matter accumulates in the soil, and the biological soil formation is strong, resulting in an increase in TOC values [48]. The significant positive correlation between the TOC and TN in this study indicates a high degree of homogeneity [49]. The reducing conditions in the deep-water zone can better preserve the TOC [50]. However, TOC, TN, and δ15N show a negative correlation with depth (Figure 2), indicating an increase in TOC, TN, and δ15N values from the bottom to the surface layer, which suggests a higher influx of organic matter into the lake. Nevertheless, there is also a decreasing trend in TOC, TN and δ15N (Figure 3), indicating a reduction in organic matter input. In the sediment of Zigetang Co Lake, organic matter primarily originates from aquatic algae, whose growth environment is closely related to climate conditions. Therefore, TOC, TN, and δ15N can also serve as indicators of climate change, and we need to discuss this in segments. It has been reported that δ13Corg is influenced by the primary productivity of lakes, lake CO2 solubility, temperature, precipitation, and other factors [45,51,52]. During periods of intense solar radiation in summer in the region around 32° N, the carbonate content in the study area is relatively low [30,53]. As temperatures increased within the watershed, vegetation growth was promoted, leading to an increase in CO2 consumption. Consequently, the carbonate content decreased, the water pCO2 decreased, and more atmospheric CO2 was absorbed into the water, increasing the δ13Corg.
Climate changes can be identified from the values of the δ15N [6,54]. In the present study, δ15N was positively correlated with TN (Figure 4b). The δ15N values in Zigetang Co might be primarily influenced by the organic matter input. During 14.0–10.8 cal. ka BP, there were relatively low levels of δ15N with significant fluctuations, possibly suggesting inhibited plant growth and decreased organic matter inputs under a dry climate. In comparison, the δ15N value displayed an increasing trend during 10.8–0.01 cal. ka BP, indicating the promotion of plant growth and increased organic matter inputs in response to climate change. Additionally, the increased precipitation raised water levels, reduced dissolved oxygen levels, and favored denitrification processes, consequently leading to a gradual increase in δ15N values [13,14]. A shift in the pollen assemblage occurred around 10.8 cal. ka BP, which was marked by an increase in Gramineae and Cyperaceae. This increase suggests heavy precipitation during this period, leading to improved growth conditions for other plant types.
Together with the transition in pollen composition, it was found that the cold and dry weather in the study area was unfavorable for plant growth, resulting in a decrease in CO2 consumption, an increase in water pCO2, and a reduction in organic matter inflow into the lake. This led to relatively low TOC, TN, δ13Corg, and δ15N values. Conversely, the opposite trends were observed when climatic conditions were more favorable.

4.3. Reconstruction of the Past Climate of Zigetang Co

By combining the δ15N, δ13Corg, TOC, and pollen indicators, we propose four stages of climate change in the Lake Zigetang Co since 14.0 cal. ka BP.
Stage I (14.0–10.8 cal. ka BP). This was the late phase of the Last Glacial Termination. The TOC, TN, δ15N, and δ13Corg values were all low, indicating probably a cold and dry climate in the region. During this period, the pollen vegetation community was dominated by Artemisia and Poaceae (together accounting for over 60% of the total), with a high Artemisia/Cyperaceae ratio (29/10), which also reflected the cold and dry environment of the lake area. Cold and dry weather was unfavorable for the growth of planktonic algae, resulting in lower primary productivity in the lake. This led to a reduction in the input of organic matter into the lake, resulting in low TOC, TN, δ15N, and δ13Corg values. The δ13Corg value decreased sharply during 12.8–12.4 and 11.4–11.2 cal. ka BP (Figure 7d). The cold climate may correspond to the Older Dryas (OD) and Younger Dryas (YD) events in Europe, with similar records also found in Qinghai Lake [55].
Stage II (10.8–8.2 cal. ka BP). This stage occurred within the early Holocene. The TOC, TN, δ15N, and δ13Corg values increased significantly during the Last Glacial Termination, which probably indicated a warm and humid climate. During this stage, there was a change in the pollen assemblage, with a gradual decrease in the Artemisia pollen content and an increase in the Cyperaceae and Poaceae pollen contents, further confirming the climate transition during this period. This corresponded to the increase in effective moisture in monsoonal Central Asia and the strengthening of solar radiation at northern latitudes in June (Figure 7e). The warm and humid climate during the early Holocene not only promoted the growth and development of plants, leading to an increase in the lake biomass, but the increased precipitation also enhanced the rate of biological degradation in the soil, resulting in 15N enrichment. This enriched 15N was then transported into the lake sediments with precipitation or runoff, increasing both the TOC content and δ15N values. This was supported by the previously reported grain size index during this stage [29]. Similar observations were reported for hydrogen isotope values (δD) values in the TP lakes during this period [57]. The sharp increases and decreases in the TOC and TN also reflected the instability of the climate during the early Holocene (Figure 7a,b), with lake sediments at the same depth in Qinghai Lake also recording two episodes of cold–dry and warm–wet transitions [55]. Based on additional data, a specific cold event occurred around 9.5 cal. ka BP [31,58].
Stage III (8.2–4.2 cal. ka BP). This stage occurred within the mid-Holocene. Compared to the Last Glacial Termination period, the TOC, TN, δ15N, and δ13Corg values remained relatively high, indicating probably that the climate was still in a warm and humid phase during this period. The TN, TOC, and δ13Corg values all exhibited varying degrees of fluctuation, indicating climatic instability. The uneven distribution of the median grain size during this period reflected the variability in lake water energy and the frequent fluctuations in the lake surface, thereby indicating frequent changes in the lake area [29]. Compared to the early Holocene, during this period there was a decrease followed by an increase in TOC, TN, and δ15N, indicating a transition from dry to wet climate conditions. The dry climate corresponded to the decline of the monsoon, in response to the gradual weakening of summer solar radiation at 32° N (Figure 7e). Both Nam Co [59] and Coe [60] displayed a gradual trend towards becoming drier during the mid-Holocene. After 7.0–4.2 cal. ka BP, there was an increasing trend in the δ15N values in the Zigetang Co sediments, indicating an increase in precipitation in the lake area. Previous studies have shown that Zigetang Co is located in a transitional zone between the monsoon and westerlies [61]. Precipitation in the study area was therefore influenced by both the monsoon and westerly winds, which could also bring moisture. As solar radiation decreased, the southwestern monsoon began to decline, and the influx of westerlies resulted in abundant precipitation in the basin [62], thereby resulting in high δ15N values. The combination of pollen indicators suggested a shift in vegetation towards a high alpine meadow environment where the growth of herbaceous plants required more precipitation. This finding further supported the evidence of abundant precipitation in the basin during this stage. Linggo Co lake on the central Tibetan Plateau was also influenced by westerlies during the Middle Holocene, exhibiting a humid climate that led to a high lake level [57,63].
Stage IV (4.2–0.01 cal. ka BP). This stage occurred within the late Holocene. The δ13Corg values displayed a trend of initially decreasing and then increasing, while the δ15N values displayed an increasing trend. This probably indicated a transition from a cold and wet climate to a warm and dry climate at the beginning of the Late Holocene. The pollen sums also showed significant changes (Figure 5). From 4.2 to 2.0 cal. ka BP, solar radiation weakened, and the southwestern monsoon began to decline (Figure 7e). The westerly circulation penetrated deep into the interior of the Tibetan Plateau [64]. This brought more precipitation, causing an increase in δ15N values, and leading to a transition towards a cold and wet climate in the Zigetang Co basin. During 2.0–1.0 cal. ka BP, Dazge Co Lake located on the central Tibetan Plateau was significantly influenced by westerly circulation [65]. These results were consistent with those determined from the study of carbonates [30]. Furthermore, around 1.0 cal. ka BP, there was an increasing trend in TOC, TN, δ13Corg, and δ15N, indicating a warming climate with increased precipitation. The geochemical indicators of Zigetang Co sediments can effectively indicate climate change within the basin.

5. Conclusions

A preliminary exploration of climate and vegetation change in the Zigetang Co basin was conducted by comparing and analyzing the results of TOC, TN, C/N, δ13Corg, δ15N analyses, and pollen from the lake sediment. This study further improved our understanding of the response relationship between geochemical indicators and climate change. At the same time, it provided some insights for regional sustainable development.
(1)
It was found that the climate was probably cold and dry during the Last Glacial Termination, which was not conducive to plant growth and development. These conditions resulted in low TOC and TN contents, as well as low δ15N values, and mainly consisted of pollen from the Gramineae and Artemisia families. Both the OD and YD events were documented during this stage. A warm and humid climate likely emerged during the early Holocene, leading to increases in TOC and TN contents, and δ15N values. This was consistent with the enhanced solar radiation and monsoon-induced precipitation. There were significant changes in pollen composition. However, the early Holocene climate exhibited instability and also documented specific cold events. In the mid to late Holocene, the high δ15N values likely indicated abundant precipitation in the basin. This was evidenced by the extensive growth of herbaceous plants, reflecting the rich precipitation consistent with the penetration of westerlies into the interior of the TP. The climate changes during the Last Glacial Termination and early Holocene were influenced by the monsoon, while in the mid to late Holocene, precipitation in the basin was influenced by the westerlies.
(2)
The research found that climate conditions had a significant impact on plant growth and regional human activities. In cold and dry climatic conditions, plant growth was limited, and it was necessary to reduce human activities to protect the ecosystem. In contrast, in warm and humid conditions, plant growth was enhanced and the potential for human activities increased, though sustainable development still needed to be considered. Understanding these relationships helps in formulating adaptive policies to balance environmental protection with economic development, achieving long-term sustainable development for the region.

Author Contributions

Conceptualization, X.M. and X.W.; methodology, X.M.; software, Y.G.; validation, X.M. and W.C.; formal analysis, X.M. and W.C.; investigation, X.M. and Y.G.; resources, F.Y.; data curation, X.M.; writing—original draft preparation, X.M.; writing—review and editing, X.W. and F.Y.; visualization, X.M.; supervision, X.W.; project administration, X.W.; funding acquisition, X.W. All authors have read and agreed to the published version of the manuscript.

Funding

This research was funded by the Second Tibetan Plateau Scientific Expedition and Research Program (Sub-item: 2019QZKK0601-3) and the National Natural Science Foundation of China (NSFC grant no. 41803022).

Institutional Review Board Statement

Not applicable.

Informed Consent Statement

Not applicable.

Data Availability Statement

The data can be requested from the corresponding author upon reasonable request.

Conflicts of Interest

The authors declare no conflict of interest.

References

  1. Zhang, Y.; Qin, B.; Zhu, G.; Song, C.; Deng, J.; Xue, B.; Gong, Z.; Wang, X.; Wu, J.; Shi, K.; et al. Importance and main ecological and environmental problems of lakes in China. Chin. Sci. Bull. 2022, 67, 3503–3519. [Google Scholar] [CrossRef]
  2. Members, C. Climatic Changes of the Last 18,000 Years: Observations and Model Simulations. Science 1988, 241, 1043–1052. [Google Scholar] [CrossRef] [PubMed]
  3. Zhuo, Y.; Zeng, W.; Ma, B.; Cui, D.; Xie, Y.; Wang, J. Spatiotemporal variation and influencing factors of nitrogen and phosphorus in lake sediments in China since 1850. J. Clean. Prod. 2022, 368, 133170. [Google Scholar] [CrossRef]
  4. Anas, M.U.M.; Scott, K.A.; Wissel, B. Carbon budgets of boreal lakes: State of knowledge, challenges, and implications. Environ. Rev. 2015, 23, 275–287. [Google Scholar] [CrossRef]
  5. Ahmad, N.; Singh, S.P.; Sahu, S.; Bhattacharyya, R.; Maurya, A.S.; Kumar, N.; Rout, R.K.; Tripathy, G.R. Isotopic evidence of autochthonous organic matter acting as a major sink of anthropogenic heavy metals in modern lacustrine sediments. Environ. Pollut. 2024, 349, 123964. [Google Scholar] [CrossRef]
  6. Zhang, C.; Peng, H.; Jie, W.; Ding, H.; Hu, Y.; Fan, B.; Gao, Y.; Hong, B. Nitrogen isotopic composition of Jiulong Wetland sediments in Fanjing Mountain and Holocene climate evolution process. J. Lake Sci. 2023, 35, 1844–1852. [Google Scholar] [CrossRef]
  7. Edje, B.O.; Ishaque, A.B.; Chigbu, P. Spatial and Temporal Patterns of δ13C and δ15N of Suspended Particulate Organic Matter in Maryland Coastal Bays, USA. Water 2020, 12, 2345. [Google Scholar] [CrossRef]
  8. Lasher, G.E.; Axford, Y.; Masterson, A.L.; Berman, K.; Larocca, L.J. Holocene temperature and landscape history of southwest Greenland inferred from isotope and geochemical lake sediment proxies. Quat. Sci. Rev. 2020, 239, 106358. [Google Scholar] [CrossRef]
  9. Xia, L.; Cao, J.; Jin, J.; Xiang, B.; Ma, W.; Wang, T. Response of nitrogen isotopes to paleo-environment and organic carbon accumulation in a Late Paleozoic alkaline lake, Junggar Basin. Chem. Geol. 2022, 602, 120884. [Google Scholar] [CrossRef]
  10. Lu, C.; Wang, N.; Zhang, L.; Li, Z.; Zhao, W.; Li, M.; Su, X.; Wang, Y. Palaeoenvironmental evolution of the Badain Jaran Desert hinterland during the Early to Middle Holocene: A multi-proxy reconstruction on Taoerlegetu paleolake, northwest China. Palaeogeogr. Palaeoclimatol. Palaeoecol. 2023, 611, 111359. [Google Scholar] [CrossRef]
  11. You, A.; Xu, J.; Xie, L.; Cheng, R.; Wei, Z.; Zhong, W. Geochemical characteristics of sediments in the Xiaohai lagoon (Eastern Hainan) and implications for the paleo-typhoon activities. J. Lake Sci. 2019, 31, 1758–1769. [Google Scholar] [CrossRef]
  12. Yin, Z.; Li, L.; Liu, C.; Yan, W.; Wang, L.; Zhang, M.; Wang, D. Historical variations of sedimentary organic matter sources and their relationships with human socio-economic activities in multiple habitats of a shallow lake. Ecol. Indic. 2022, 140, 109011. [Google Scholar] [CrossRef]
  13. Zhong, W.; Zhang, J.; Yin, H.; Xue, J.; Cao, J.; Tang, X. Study on the Climatic and Environmental Implication of Stable Nitrogen Isotopes from the Holocene Lacustrine Sediments in Balikun Lake in Xinjiang. J. South China Norm. Univ. (Nat. Sci. Ed.) 2013, 45, 182–188. [Google Scholar]
  14. Pan, J.; Huang, J.; Zhang, R.; Huang, C.; Liu, J. The variation of carbon and nitrogen isotopic compositions in the Dajiuhu sediments and climate changes since Late Pleistocene in the western Hubei of Central China. Quat. Sci. 2021, 41, 916–930. [Google Scholar]
  15. Yang, Y.; Feng, Z.; Ran, M.; Zhang, D.; Lan, B.; Sun, A. Holocene vegetation and hydrology variations and their associations with climate changes: A multi-proxy analysis of a sediment core from an alpine basin in the middle Tianshan Mountains. Clim. Dyn. 2021, 56, 3835–3852. [Google Scholar] [CrossRef]
  16. Punt, W.; Hoen, P.P.; Blackmore, S.; Nilsson, S.; Thomas, A.L. Glossary of pollen and spore terminology. Rev. Palaeobot. Palynol. 2007, 143, 1–81. [Google Scholar] [CrossRef]
  17. Meng, Y.; Wang, W.; Hu, J.; Zhang, J.; Lai, Y. Vegetation and climate changes over the last 30,000 years on the Leizhou Peninsula, southern China, inferred from the pollen record of Huguangyan Maar Lake. Boreas 2017, 46, 525–540. [Google Scholar] [CrossRef]
  18. Kaufman, D.; McKay, N.; Routson, C.; Erb, M.; Davis, B.; Heiri, O.; Jaccard, S.; Tierney, J.; Dätwyler, C.; Axford, Y.; et al. A global database of Holocene paleotemperature records. Sci. Data 2020, 7, 115. [Google Scholar] [CrossRef]
  19. Deng, T.; Xu, P.; Lu, Y.; Li, Z. Spatial-Temporal Characteristics and Influencing Factors of Tourism Activity Intensity in Qinghai-Tibet Plateau. Ecol. Econ. 2023, 39, 140–146. [Google Scholar]
  20. Li, P.; Gao, C.; Luo, Y.; Guo, H.; Sun, W. Spatial differences and value conversion potential of ecological assets on the Qinghai-Tibet Plateau, China. Acta Ecol. Sin. 2024, 44, 1808–1821. [Google Scholar]
  21. Sun, J.; Jia, Y.; A, W.; Lv, W.; Liu, Y.; Zhang, M.; Tsechoe, D.; Wang, S. The main influencing factors of household income and expenditure of herdsmen in the northern Tibetan Plateau. Tibet. Sci. Technol. 2024, 46, 48–53. [Google Scholar]
  22. Ding, J.; Liu, X.; Guo, Y.; Ren, H. Study on vegetation change in the Qinghai-Tibet Plateau from 1980 to 2015. Ecol. Environ. Sci. 2021, 30, 288–296. [Google Scholar]
  23. Hou, S.; Chappellaz, J.; Jouzel, J.; Chu, P.C.; Masson-Delmotte, V.; Qin, D.; Raynaud, D.; Mayewski, P.A.; Lipenkov, V.Y.; Kang, S. Summer temperature trend over the past two millennia using air content in Himalayan ice. Clim. Past 2007, 3, 89–95. [Google Scholar] [CrossRef]
  24. Shao, X.; Wang, S.; Zhu, H.; Xu, Y.; Liang, E.; Yin, Z.-Y.; Xu, X.; Xiao, Y. A 3585-year ring-width dating chronology of Qilian juniper from the northeastern Qinghai-Tibetan Plateau. IAWA J. 2009, 30, 379–394. [Google Scholar] [CrossRef]
  25. Li, W.; Song, B.; Zhang, S.; Li, S.; Qu, H.; Song, X.; Wang, J.; Zhou, S.; Chen, M.; Wan, X. Sporopollen records and implications for surface processes: A case study of Shell Ridge in the Qaidam Basin, Qinghai-Tibetan Plateau. Quat. Int. 2020, 565, 41–53. [Google Scholar] [CrossRef]
  26. Pu, Y.; Werne, J.P.; Meyers, P.A.; Zhang, H. Organic matter geochemical signatures of sediments of Lake Ngoring (Qinghai-Tibetan Plateau): A record of environmental and climatic changes in the source area of the Yellow River for the last 1500 years. Palaeogeogr. Palaeoclimatol. Palaeoecol. 2020, 551, 109729. [Google Scholar] [CrossRef]
  27. Ma, R.; Jin, C.; Kang, S.; Li, S.; Chen, W. Paleoenvironmental changes of Cuona Lake on the central Tibetan Plateau over the last 13 kyrs based on organic geochemical proxies. Palaeogeogr. Palaeoclimatol. Palaeoecol. 2024, 638, 112061. [Google Scholar] [CrossRef]
  28. Wang, X.; Li, S.; Liu, C.Q.; Mostofa, K.M.G.; Zhao, Z.; Luo, R. Hydrogeochemistry and δ13CDIC and δ18OH2O composition of three Chinese Tibetan Plateau lakes. Isot. Environ. Health Stud. 2017, 54, 89–105. [Google Scholar] [CrossRef]
  29. Shen, H.; Li, S.; Shu, W. Pigments in the lake sediments: Environmental indicator. Mar. Geol. Quat. Geol. 2007, 27, 37–42. [Google Scholar]
  30. Li, S.; Bernd, W.; Xia, W.; Yu, S.; Shen, D.; Jiang, Y. A preliminary study of the Holocene lake level changes and their causes derived from the sediment record of Zigetang Lake, Tibetan Plateau. Earth Sci. Front. 2009, 16, 162–167. [Google Scholar]
  31. Zhang, H.; Liu, Q.; Li, S.; Fang, X.; Zhang, J.; Li, T. Holocene Environmental Changes Derived from Ostracode Shell Stable Isotopes in the Sediment Core of Zigetang Lake, Tibetan Plateau. Mt. Res. 2014, 32, 373–379. [Google Scholar]
  32. Jin, C.; Günther, F.; Li, S.; Jia, G.; Peng, P.A.; Gleixner, G. Reduced early Holocene moisture availability inferred from δD values of sedimentary n-alkanes in Zigetang Co, Central Tibetan Plateau. Holocene 2016, 26, 556–566. [Google Scholar] [CrossRef]
  33. Lü, H.; Gu, Z.; Wu, N.; Wang, L.; Guo, Z.; Wu, H. Effect of altitude on the organic carbon-sotope composition of modern surface soils from Qinghai-XiZang Plateau. Quat. Sci. 2001, 21, 399–406. [Google Scholar]
  34. Li, S.; Li, W. Hydrochemistry in meromictic Lake Zige Tangco, Central Tibetan Plateau. Asian J. Water Environ. Pollut. 2004, 1, 1–4. [Google Scholar]
  35. Li, W.; Li, S.; Yin, Y.; Ji, J.; Pu, P. The discovery of semi-mixed lakes and its significance on Tibetan Plateau. Sci. China Ser. D Earth Sci. 2001, 31, 269–272. [Google Scholar]
  36. Wang, F.; Qian, N.; Zhang, Y.; Yang, H. Pollen Flora of China; China Science Publishing & Media Ltd.: Beijing, China, 1995. [Google Scholar]
  37. Guan, Z. Pollen and Spores Morphology of Common Aquatic Vascular Plants in China; China Science Publishing & Media Ltd.: Beijing, China, 2011. [Google Scholar]
  38. Tang, L.; Mao, L.; Shu, J.; Li, C.; Shen, C.; Zhou, Z. An Illustrated Handbook of Quaternary Pollen and Spores in China; China Science Publishing & Media Ltd.: Beijing, China, 2016. [Google Scholar]
  39. Grimm, E.C. CONISS: A FORTRAN 77 program for stratigraphically constrained cluster analysis by the method of incremental sum of squares. Comput. Geosci. 1987, 13, 13–35. [Google Scholar] [CrossRef]
  40. Shu, J.; Huang, X.; Xu, D.; Chen, W.; Song, B.; Cui, A.; Eric, G. The Latest Tilia Software: Chinese Manual and Practise Skills. Acta Palaeontol. Sin. 2018, 57, 260–272. [Google Scholar]
  41. Wang, L.; Chen, G.; Huang, L.; Kong, L.; Li, R.; Han, Q.; Li, P.; Suo, Q.; Zhou, Q. Synchronic changes of lake organic and inorganic carbon burial in response to catchment development over the past century: A case study of Shilin Karst area. J. Lake Sci. 2022, 34, 1751–1764. [Google Scholar]
  42. Liu, Q.; Pang, Y.; Xiang, S.; Wan, L. Distribution characteristics and source analysis of organic matter in surface sediments of Luoma Lake. China Environ. Sci. 2021, 41, 4850–4856. [Google Scholar]
  43. Meyers, P.A. Organic geochemical proxies of paleoceanographic, paleolimnologic, and paleoclimatic processes. Org. Geochem. 1997, 27, 213–250. [Google Scholar] [CrossRef]
  44. Kendall, C.; Silva, S.R.; Kelly, V.J. Carbon and nitrogen isotopic compositions of particulate organic matter in four large river systems across the United States. Hydrol. Process. 2001, 15, 1301–1346. [Google Scholar] [CrossRef]
  45. Wu, Y.; Andreas, L.; Bernd, W.; Li, S.; Wang, S. Holocene climate change in the Central Tibetan Plateau inferred by lacustrine sediment geochemical records. Sci. China Ser. D Earth Sci. 2007, 50, 1548–1555. [Google Scholar] [CrossRef]
  46. Xiao, J.; Si, B.; Zhai, D.; Itoh, S.; Lomtatidze, Z. Hydrology of Dali Lake in central-eastern Inner Mongolia and Holocene East Asian monsoon variability. J. Paleolimnol. 2008, 40, 519–528. [Google Scholar] [CrossRef]
  47. Xiao, J.; Wu, J.; Si, B.; Liang, W.; Nakamura, T.; Liu, B.; Inouchi, Y. Holocene climate changes in the monsoon/arid transition reflected by carbon concentration in Daihai Lake of Inner Mongolia. Holocene 2006, 16, 551–560. [Google Scholar] [CrossRef]
  48. Zhang, R.; Chi, Y.; Xie, Y.; Kang, C.; Wu, P.; Sun, L.; Wei, Z. Paleofire events recorded by charcoal in Harbin loess since the middle-late Pleistocene with driving mechanism. Acta Ecol. Sin. 2022, 42, 10317–10328. [Google Scholar]
  49. Zhang, Z.; Liu, T.; Cao, Q.; Zhang, J.; Deng, H. Spatial distribution and stoichiometric characteristics of C, N, P in the sediment-Potamogeton crisp’s system in Dongping Lake. Environ. Chem. 2020, 39, 2263–2271. [Google Scholar]
  50. Kastner, S.; Ohlendorf, C.; Haberzettl, T.; Lücke, A.; Mayr, C.; Maidana, N.I.; Schäbitz, F.; Zolitschka, B. Southern hemispheric westerlies control the spatial distribution of modern sediments in Laguna Potrok Aike, Argentina. J. Paleolimnol. 2010, 44, 887–902. [Google Scholar] [CrossRef]
  51. Douglas, P.M.J.; Stratigopoulos, E.; Park, S.; Keenan, B. Spatial differentiation of sediment organic matter isotopic composition and inferred sources in a temperate forest lake catchment. Chem. Geol. 2022, 603, 120887. [Google Scholar] [CrossRef]
  52. Ouyang, J.; Wu, H.; Yang, H.; Wang, J.; Liu, J.; Tong, Y.; Wang, D.; Huang, M. Global warming induces the succession of photosynthetic microbial communities in a glacial lake on the Tibetan Plateau. Water Res. 2023, 242, 120213. [Google Scholar] [CrossRef]
  53. Berger, A.; Loutre, M.F. Insolation values for the climate of the last 10 million years. Quat. Sci. Rev. 1991, 10, 297–317. [Google Scholar] [CrossRef]
  54. Miao, X.; Feng, X.; Hu, L.; Li, J.; Liu, X.; Wang, N.; Xiao, Q.; Wei, J. Coupled δ15NTN and δ13CTOC Insights into Methane Seepage Activities in Bulk Marine Sediments of the Qiongdongnan Basin, South China Sea. J. Ocean Univ. China 2022, 21, 1495–1503. [Google Scholar] [CrossRef]
  55. Shen, J.; Liu, X.; Wang, S.; Ryo, M. Palaeoclimatic changes in the Qinghai Lake area during the last 18,000 years. Quat. Int. 2005, 136, 131–140. [Google Scholar]
  56. Herzschuh, U. Palaeo-moisture evolution in monsoonal Central Asia during the last 50,000 years. Quat. Sci. Rev. 2006, 25, 163–178. [Google Scholar] [CrossRef]
  57. Hou, J.; D’Andrea, W.J.; Wang, M.; He, Y.; Liang, J. Influence of the Indian monsoon and the subtropical jet on climate change on the Tibetan Plateau since the late Pleistocene. Quat. Sci. Rev. 2017, 163, 84–94. [Google Scholar]
  58. Wang, N.; Yao, T.; Thompson, L.G.; Henderson, K.A.; Davis, M.E. Evidence for cold events in the early Holocene from the Guliya ice core, Tibetan Plateau, China. Chin. Sci. Bull. 2002, 47, 818–823. [Google Scholar] [CrossRef]
  59. Günther, F.; Witt, R.; Schouten, S.; Mausbacher, R.; Daut, G.; Zhu, L.; Xu, B.; Yao, T.; Gleixner, G. Quaternary ecological responses and impacts of the Indian Ocean Summer Monsoon at Nam Co, Southern Tibetan Plateau. Quat. Sci. Rev. 2015, 112, 66–77. [Google Scholar] [CrossRef]
  60. Wu, Y.; Andreas, L.; Jin, Z.; Wang, S.; Schleser, G.H.; Battarbee, R.W.; Xia, W. Holocene climate development on the central Tibetan Plateau: A sedimentary record from Cuoe Lake. Palaeogeogr. Palaeoclimatol. Palaeoecol. 2006, 234, 328–340. [Google Scholar]
  61. Yao, T.; Masson-Delmotte, V.; Gao, J.; Yu, W.; Yang, X.; Risi, C.; Sturm, C.; Werner, M.; Zhao, H.; He, Y.; et al. A review of climatic controls on δ18O in precipitation over the Tibetan Plateau: Observations and simulations. Rev. Geophys. 2013, 51, 525–548. [Google Scholar] [CrossRef]
  62. Jin, C.; Li, S.; Chen, W.; Cao, C. Climate Changes on the Tibetan Plateau Inferred from Organic Geochemistry Records in Lake Sediments—A Case of Lake Zigetang Co. Bull. Mineral. Petrol. Geochem. 2016, 35, 625–633. [Google Scholar]
  63. He, Y.; Hou, J.; Brown, E.T.; Xie, S.; Bao, Z. Timing of the Indian Summer Monsoon onset during the early Holocene: Evidence from a sediment core at Linggo Co, central Tibetan Plateau. Holocene 2017, 28, 755–766. [Google Scholar] [CrossRef]
  64. Li, X.; Hou, J.; Wang, M.; He, Y. Influence of monsoon and westerlies on Holocene climate change in the Tibetan Plateau: Isotopic evidence. Quat. Sci. 2019, 39, 678–686. [Google Scholar]
  65. Li, X.; Liang, J.; Hou, J.; Zhang, W. Centennial-scale climate variability during the past 2000 years on the central Tibetan Plateau. Holocene 2015, 25, 892–899. [Google Scholar] [CrossRef]
Figure 1. (a) Geographical location of Zigetang Co Lake (the red star). (b) Geomorphic profile [32] and coring site of Zigetang Co Lake (the red star).
Sustainability 16 08186 g001
Figure 2. The variations in total organic carbon (TOC), total nitrogen (TN), and nitrogen isotopes (δ15N) with depth. The linear lines represent the linear fittings for their co-variations.
Sustainability 16 08186 g002
Figure 3. The variations in TN, TOC, carbon/nitrogen ratio (C/N), organic carbon isotopes (δ13Corg), and δ15N in sediments. Each region of the chart represents the various climatic conditions in different late glacial periods.
Sustainability 16 08186 g003
Figure 4. The correlations of TN with TOC (a) and δ15N (b) in the lake sediment.
Sustainability 16 08186 g004
Figure 5. The variation in Artemisia and Cyperaceae pollen in Zigetang Co lake sediments.
Sustainability 16 08186 g005
Figure 6. Source indications of sediment organic matter in Zigetang Co. The ranges of C3, C4, aquatic, and terrestrial plants were derived from previous studies [11,43,44].
Sustainability 16 08186 g006
Figure 7. Changes in the (a) TOC, (b) TN, (c) δ15N, and (d) δ13Corg over time, (e) the effective moisture in monsoonal Central Asia [56] and the solar insolation at 32° N in June [53]. OD and YD refer to the Older Dryas and the Younger Dryas, respectively. The yellow area indicates monsoon-influenced precipitation in the region, while the blue area indicates precipitation influenced by westerlies. The gray dashed lines delineate the areas corresponding to stages I, II, III, and IV.
Sustainability 16 08186 g007
Disclaimer/Publisher’s Note: The statements, opinions and data contained in all publications are solely those of the individual author(s) and contributor(s) and not of MDPI and/or the editor(s). MDPI and/or the editor(s) disclaim responsibility for any injury to people or property resulting from any ideas, methods, instructions or products referred to in the content.

