Article

Unveiling Consumer Satisfaction with AI-Generated Museum Cultural and Creative Products Design: Using Importance–Performance Analysis

1
School of the Arts, Kyungpook National University, Daegu 37224, Republic of Korea
2
School of Art and Design, Wuhan University of Technology, Wuhan 430070, China
3
School of Arts and Design, Yanshan University, Qinhuangdao 066004, China
*
Author to whom correspondence should be addressed.
Sustainability 2024, 16(18), 8203; https://doi.org/10.3390/su16188203
Submission received: 7 September 2024 / Revised: 19 September 2024 / Accepted: 19 September 2024 / Published: 20 September 2024

Abstract

:
While artificial intelligence (AI) is being increasingly utilized in the design of museum cultural and creative products (MCCPs), limited research has explored consumer satisfaction with these AI-generated designs. This study quantitatively examined the impact of AI-generated MCCP design on consumer satisfaction and proposed strategies for improvement. A comprehensive evaluation system consisting of fourteen factor indicators across four dimensions was constructed through literature research, user interviews, and expert suggestions. On this basis, a survey with 297 consumers was then conducted using AI-generated cultural and creative products from the Dunhuang Museum. Additionally, the Importance–Performance Analysis (IPA) method was employed to analyze the importance of various factors in these AI-generated designs and their impacts on consumer satisfaction. The findings revealed that, while consumers expressed high satisfaction in terms of product functionality and creative attraction, improvements are needed in cultural expression and user experience. It is recommended that creating a multimodal museum database, developing structured prompt card models, and building an MCCP design platform with full-process AI participation would help to increase consumer satisfaction. This study can provide theoretical and practical references for the intelligent development of MCCPs’ design and promote the sustainable development of cultural heritage.

1. Introduction

The Chinese concept of “museum cultural and creative products (MCCPs)” encompasses a variety of merchandise sold in both online and offline museum souvenir shops. In the scholarly literature, these products are also referred to as “museum cultural products”, “museum cultural and creative products”, and “museum souvenirs” [1,2,3]. These products are tangible consumer goods developed from museum collections with profound cultural connotations and practical value. They play an increasingly important role in promoting the public cultural dissemination of museums and the sustainable development of cultural heritage [4,5]. The traditional process for designing these products requires a significant amount of time and manpower and faces serious issues of “homogenization” [6,7].
However, the rapid advancement of deep learning technology has led to the emergence of AI-generated content, providing a new solution for the design of these products [8]. AI can create more diverse, personalized, and innovative design solutions through data- and algorithm-driven approaches [9]. Currently, AI-generated models offer diverse design options tailored to specific requirements by analyzing and learning from many artworks, historical documents, and cultural heritage data. For instance, Instant Mesh employs multi-view diffusion model technology to generate 3D models from input image data. It facilitates the download of OBJ format files, thereby expediting the completion of model design [10]. Stable Diffusion can learn design styles from cultural heritage materials provided by designers and create design proposals based on designers’ prompts [11]. ERNIE Bot can convert user-generated visual images into cultural and creative products, including throw pillows and mobile phone pendants [12].
With the continuous innovation in AI technology, the broader digitization and sustainable development of MCCPs have become key future trends. However, research has shown that there is a bias in people’s perceptions of AI performance in artistic creation, which may affect their aesthetic evaluation of AI-generated MCCPs [13]. Furthermore, issues such as an over-reliance on technology, insufficient controllability, and semantic discrepancies in AI-generated designs may weaken MCCPs’ uniqueness and appeal, thereby affecting market acceptance [14,15]. This implies that there may be risks associated with using AI-generated techniques to design MCCPs. Therefore, whether the current AI-generated MCCPs can effectively meet consumer expectations and achieve market recognition remains a significant issue that requires further investigation. Conducting in-depth research on consumer satisfaction and understanding how consumers perceive and evaluate AI-generated MCCPs is essential not only for influencing the quality of these designs and their market acceptance, but also for the dissemination and preservation of cultural heritage. Improving consumer satisfaction with AI-generated designs can ensure the successful market promotion of cultural products, thereby fostering the sustainable development of cultural heritage.
Among the studies related to AI-generated MCCPs, Zhang employed an AI model to generate Pop-Art-style New Year paintings and integrated them into cultural and creative product designs, which effectively addressed the challenges of diversity in traditional New Year paintings [16]. Zhao utilized Peirce’s semiotic theory to investigate the innovative applications of AIGC technology in cultural and creative design at the Shenyang Imperial Palace, assessing the effectiveness of AI in enhancing the creativity of these products [17]. Additionally, Yuan explored the impact and significance of artificial intelligence in designing museum cultural and creative products and emphasized its limitations [18]. Zhang and Cheng examined the role of AI-generated MCCPs in advancing the sustainability of cultural heritage and found that AI technology supported this sustainability by enhancing consumers’ perceived value and cultural identity [19]. Most of the current research focuses on AI-assisted creative collaboration, AI-driven design methodologies, and reflections on the impact of AI, and few studies have explored individual challenges, such as consumer satisfaction with AI-generated MCCPs’ design.
Consumer satisfaction results from comparing consumers’ expectations of a product or service with their actual experiences [20]. In the realm of MCCPs, consumer satisfaction refers to consumers’ attitudes towards and evaluations of these products. Current research on consumer satisfaction primarily focuses on three key aspects. First, scholars have investigated the factors influencing consumer satisfaction using various theoretical models and research methods [21,22,23,24]. Second, various evaluation methods have been employed to measure consumer satisfaction with these products [3,25,26]. Third, consumer satisfaction is analyzed as a mediating factor in studies that explore consumer purchase and usage intentions [27,28,29]. However, these studies have primarily focused on traditional MCCPs, whereas consumer satisfaction with AI-generated MCCPs remains underexplored. Compared with prior studies, this research focuses on consumer satisfaction with AI-generated MCCPs as its core subject, systematically evaluating the gap between consumers’ expectations and their actual experiences with AI-generated designs, thereby addressing a research gap in this field.
Based on the above, this study employs the AI design project of the Dunhuang Museum as a case study to construct a consumer satisfaction evaluation index system from the perspective of perceived value. Using the Importance–Performance Analysis (IPA) method and conducting a questionnaire survey, we assess consumer satisfaction with AI-generated designs and propose strategies to enhance consumer satisfaction with AI-generated MCCPs based on our findings. Compared with existing studies, our research offers both theoretical and practical contributions. In terms of theory, we address the gap in evaluating consumer satisfaction with AI-generated MCCPs and extend the application of the IPA model and perceived value theory in the design of AI-generated cultural and creative products. In terms of practice, we conduct a preliminary test on the effects of AI-generated MCCP designs and recommended corresponding improvement strategies. These strategies provide scientific guidance and practical insights for the intelligent development of MCCP design, contributing to the sustainable development of museum cultural heritage.

2. Literature Review

2.1. Development and Application of AI-Generated MCCP Design Technology

In recent years, remarkable progress has been made in the development of AI image generation technology. AI image generation models, by analyzing and learning from extensive cultural heritage data such as images, texts, and audio, have made artistic creation more diverse, free, and efficient. In the MCCP design field, it is often necessary to present many museums’ cultural elements in new forms that align with contemporary consumer aesthetics [30]. The proper use of AI can not only significantly reduce the time and cost of product design, but also provide designers with new sources of creativity, making product designs more personalized and innovative [31].
In terms of technological development history, the two models that have had the most significant impact on AI-generated MCCPs are Generative Adversarial Networks (GANs) and Diffusion Models. In 2014, Goodfellow et al. introduced GANs, which comprise the two following components: a generator and discriminator, creating a framework for generating realistic images [32]. The generator takes random noise vectors as input and generates data, whereas the discriminator receives real data and tries to differentiate between the real and generated data. In 2017, researchers at Rutgers University developed a Creative Adversarial Network based on the GAN architecture. The discriminator of this network assesses the authenticity of generated images and identifies whether they correspond to one of the 25 common artistic styles, thus creating more stylistically innovative images [33]. In 2020, Ho et al. proposed Denoising Diffusion Probabilistic Models (DDPMs), which operate by progressively adding Gaussian noise to data through a series of steps until the data are entirely noisy, and then learning to reverse this process to infer the true image distribution [34]. During training, DDPMs learn to denoise noisy data step-by-step and effectively reconstruct the original data from noise. This approach allows for high-quality image generation and is known for its ability to produce diverse and detailed samples. In 2022, Rombach et al. enhanced the Denoising Diffusion Probabilistic Model (DDPM) by introducing Latent Diffusion Models (LDMs), which apply the diffusion process to a latent feature space obtained after image encoding. LDMs first compress data into a lower-dimensional latent space, then perform diffusion operations within this space, and finally, reconstruct the data from the latent representation. This approach improves both performance and image generation quality while reducing computational resource requirements compared with methods that operate directly on high-dimensional data [35]. The continuous evolution and iteration of AI-generated image models have led to constant improvements and enhancements in output quality. The development of this technology has laid a solid foundation for its application in MCCPs’ design.
In terms of industrial applications, with the broad applications of AI technology in cultural and creative fields, many museums have begun to explore the possibility of AI-generated cultural and creative products. For example, the Forbidden City, in cooperation with Tencent, analyzed many palace paintings and cultural relics through AI to automatically generate a series of themed cultural and creative products based on elements of the Forbidden City. The Gansu Museum designed a Prancing Horse Mooncake Gift Box using new AI technology. The Louvre used AI technology to repair damaged artworks and generate new digital artefacts, which were then used in the museum’s cultural derivative products. For example, AI technology has been used to digitally restore Leonardo da Vinci’s works and generate a series of related cultural and creative products, such as stationery, clothing, and home decorations. These cases not only demonstrate the practical application of AI technology in the design of MCCPs, but also provide valuable experience for future research.
In terms of design research, AI image generation technology has introduced new momentum into the field of MCCP design, and AI-generated MCCP design has become a focus of scholarly attention [36]. For instance, Song analyzed the works of traditional Chinese painters, and these data were used to train AI models to extract the aesthetic features of traditional Chinese paintings, which were subsequently applied to MCCPs’ design [9]. Zhang utilized AI technology to extract traditional patterns from museums and quickly generated 3D models of MCCPs [37]. Li employed AI to extract cultural elements from Sichuan embroidery and developed a series of cultural and creative products for the Sichuan Embroidery Museum [38]. Wang used a personalized AI painting generation algorithm to create customized cultural and creative products for museums, using eight breaks as an example [39]. Zhang proposed training AI models to generate New Year picture art images quickly and stably, which were then used in cultural and creative product design [16]. In summary, research on AI-generated MCCP design has been conducted from multiple perspectives. From the perspective of design modeling, research encompasses both 2D and 3D aspects. From the product design perspective, it covers the four following elements: “Color”, “Material”, “Finishing”, and “Pattern”. Scholars have focused on the integration of AI with MCCP design, but there is still a shortage of studies on consumer satisfaction with these AI-generated designs.
Overall, with the continuous development and refinement of AI technology, future research and application scenarios in the field of MCCP design are expected to become increasingly diverse. However, a critical issue remains regarding how to assess the actual performance of and consumer satisfaction with AI-generated designs. Consumer satisfaction, which is a crucial determinant of product success, is a significant driver of the sustainable development of AI in the MCCP design field. Consequently, research on consumer satisfaction will become a key component in the integration of AI into MCCPs’ design.

2.2. Perceived Value and Consumer Satisfaction

Perceived value is a framework for analyzing consumers’ perceptions and evaluations of products and services. It provides a structure for understanding consumers’ trade-offs between gains and losses, delineating the fundamental relationships between organizations, consumers, and products or services [40]. Consumer satisfaction reflects the emotional assessment of the value received from specific products or services [20]. Jooyeon and Soo Cheong also support this concept, positing that the only way for businesses to ensure lasting consumer satisfaction is by delivering good value [41]. Therefore, perceived value can be considered as a significant antecedent to consumer satisfaction [42,43,44]. Furthermore, research has demonstrated that perceived value theory can be effectively applied in design studies to enhance design quality, thereby improving user satisfaction with products and services [45].
In related research, Jagdish N. Sheth et al. posited that perceived value comprises social, emotional, functional, cognitive, and situational dimensions [46]. Building on this framework, Sweeney and Soutar proposed a consumer perceived value model comprising the four following dimensions: social, emotional, quality, and price [47]. Tian examined the effects of perceived value on satisfaction and loyalty among visitors to cultural heritage sites, focusing on the four following aspects: cultural aesthetics, service experience, social realization, and pleasurable leisure [48]. Fu et al. suggested that commemorative, spiritual, functional, experiential, and social values are integral to the perceived value of cultural and creative products [49]. Deng conceptualized perceived value as comprising functional value, memory value, emotional value, social value, and conditional value [50]. Although scholars have varied definitions of perceived value, they all provide mechanisms for consumers to weigh benefits and costs before purchasing products or services, aiming to maximize benefits or enhance experiences. Based on the above literature review, we identified the key factors influencing consumers’ perceptions of cultural and creative product design from the perspective of perceived value. These factors include cultural perception, which assesses the extent to which the design reflects and conveys museum culture; creative perception, which evaluates the originality and artistic innovation of the design; functional perception, focusing on the design’s functionality and practicality; and experiential perception, which considers the emotional and sensory engagement of the consumer.

2.3. Importance–Performance Analysis

The Importance–Performance Analysis (IPA) method, introduced by Martilla and James in 1977, is a widely used tool for evaluating consumer satisfaction [51]. It compares the expected importance of products or services with the satisfaction derived from actual experiences. In this analysis, importance is plotted on the horizontal axis and performance on the vertical axis, creating a two-dimensional grid divided into the four following quadrants: high importance–high satisfaction, low importance–high satisfaction, low importance–low satisfaction, and high importance–low satisfaction. Attributes that fall into quadrant IV (high importance–low satisfaction) suggest areas that need improvement, whereas those in quadrant I (high importance–high satisfaction) highlight the strengths of AI-generated design. The IPA method provides a clear framework for prioritizing improvements, particularly in the context of AI-generated MCCP design. This guides the development of strategies aimed at enhancing consumer satisfaction. The objective assessment of this method has been extensively adopted in product design research to identify and improve critical attributes [52,53,54]. This study utilized IPA to visually present the importance and performance of various aspects of AI-generated MCCPs, helping to quickly identify areas for enhancement and provide a scientific basis for further quality improvements.

3. Methods

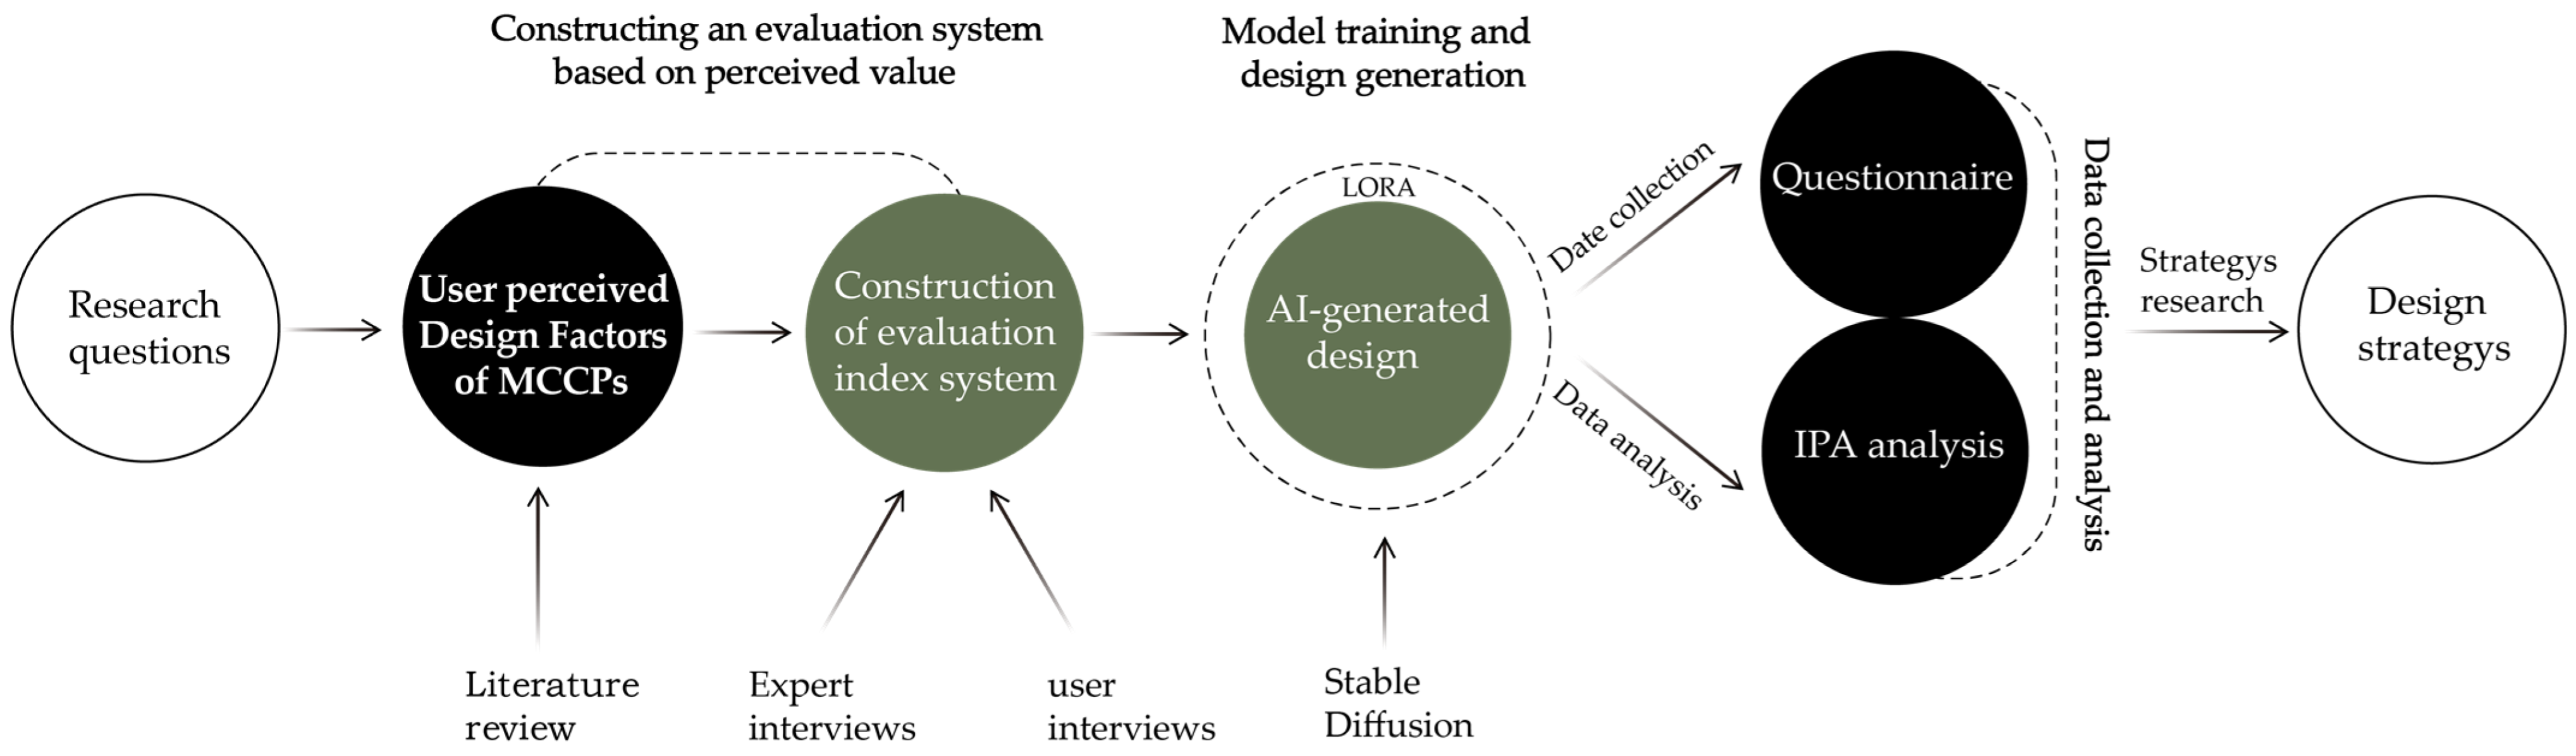
3.1. Research Structure and Methods

After clarifying the research question, a literature review was conducted to explore the factors influencing consumer perceptions of AI-generated MCCP designs. An evaluation index system was developed based on interviews with consumers and expert opinions. Subsequently, product design schemes were generated through Stable Diffusion, and consumer satisfaction data were gathered through questionnaire surveys. These data were then analyzed using the IPA method, leading to the proposal of design improvement strategies based on the analysis results (see Figure 1).

3.2. Construction of the Evaluation Index System

The factors that influence consumer satisfaction are relatively complex. To scientifically and objectively evaluate these factors, their hierarchical nature and complexity must be considered. Therefore, it was necessary to construct a hierarchical evaluation index system. This study divides the consumer satisfaction evaluation index into three layers, according to the study purpose and complexity of the research object. The first layer is the objective layer (A), overall user satisfaction; the second layer is the factor layer (B); and the third layer is the indicator layer (C). Drawing from the literature review, the key factors influencing consumers’ perceptions of MCCPs were identified. These included cultural, creative, functional, and user experience perceptions.
The researchers employed random and snowball sampling methods to select 50 consumers and gathered their evaluations of MCCPs to identify the key factors influencing consumers’ general perceptions. The interview outline was developed based on a comprehensive literature review (see Table 1) [55,56,57]. To ensure the relevance and diversity of the interview content, the researchers employed the following criteria to select interviewees: (1) individuals who purchase MCCPs at least three times a year and actively engage with such products and (2) participants representing substantial diversity, including a gender ratio of approximately 1:1, encompassing various professions, income levels, and purchase motivations. For the selection of visual samples, the three most renowned museums were chosen based on their online popularity rankings, as follows: the Dunhuang Research Academy, Sanxingdui Museum, and the Palace Museum. From each museum’s online store, six representative products were selected based on their sales rankings. The sample content consisted predominantly of product images, videos, and descriptive introductions (see Figure 2).
The interviews were conducted in a quiet room using visual sample stimulation. Eighteen representative samples collected previously were used to elicit the participants’ semantic evaluations of the museum cultural and creative product designs. Each interview lasted between 15 and 20 min and was fully recorded. After the interviews, the initial audio content was compiled and cross-referenced with the interview notes, resulting in the identification of 186 primary terms. Data extraction was conducted using Colaizzi’s seven-step method [58], which included reading the transcripts, extracting meaningful statements, coding recurring viewpoints, forming sub-themes, condensing sub-themes into main themes, defining the themes according to interview objectives and theoretical concepts, and validating them with the participants. Subsequently, the summarized information was further categorized using the KJ method, yielding 24 semantic evaluation keywords (see Table 2). The KJ method, also known as the Affinity Diagram method, is a consensus-building technique that aids in organizing complex ideas and information. Developed by the Japanese anthropologist Jiro Kawakita, this method effectively gathers and organizes diverse experiences and ideas related to a specific issue, categorizing them according to their inherent affinities to clarify essential needs [59]. The KJ method is frequently used in the design and development of cultural and creative products, owing to its effectiveness and scientific rigor. It particularly suitable for exploring the needs of target consumers in detail and providing a robust basis for product design and evaluation [60,61].
After classifying the initial keywords, we employed the Delphi method to obtain expert insights [62]. Three university professors and two professional designers participated in a two-round survey in May 2024. The university professors had strong academic credentials and had led research projects related to the digitization of intangible cultural heritage in museums. The two designers, each with over five years of experience in cultural and creative product design, possessed a wealth of practical design experience. Detailed information on these experts is provided in Table 3. The surveys were administered via WeChat and online meetings with weekly data collection. After the first round, the survey instrument was refined based on statistical analysis and expert feedback, leading to the second round. The process was concluded when the experts reached a consensus. The Delphi method leverages expert knowledge and experience, allowing each participant to independently assess issues, with the final consensus emerging through iterative rounds of feedback.
After reaching a consensus among the experts, we derived the key factors influencing consumer satisfaction. Moreover, considering that this study is still in the conceptual design phase, certain factors, such as price, manufacturing processes, and environmental friendliness, cannot be precisely measured. Consequently, these dimensions were excluded from this study. Ultimately, based on the design factors refined through the literature review, a museum cultural and creative product design satisfaction evaluation system was established, consisting of 14 evaluation indicators across 4 dimensions (see Figure 3).

3.3. AI-Generated MCCPs Design Experiment

The objective of this study was to assess consumer satisfaction with AI-generated MCCP design. To achieve this, we needed to generate a substantial number of qualified design samples for the consumer satisfaction survey. Our experimental method was specifically designed to simulate actual design workflows, allowing the research team to modify key variables such as product type and material under controlled conditions. This ensured both diversity and quality in the design outcomes. Furthermore, the experimental approach not only minimized potential confounding factors, such as differences in product style and individual preferences, thereby providing results that more reliably reflect genuine consumer feedback, but also offered a robust validation framework. This enabled a precise evaluation of the factors influencing consumer satisfaction with AI-generated MCCP design.
This study employed an experimental design process involving image sample collection, image processing, style transfer training, and design generation (see Figure 4). The choice of this process not only adhered to established technical standards in the field of AI-generated design [13,17], but more importantly, it addressed the specific objectives of this study by generating museum cultural and creative product designs that met the required quality standards, which can be used in subsequent consumer satisfaction surveys. Firstly, this process enabled precise control over variables, particularly during the collection and processing of image samples. To ensure diversity and minimize bias from single-source samples, we selected representative images from Dunhuang murals spanning various historical periods. Furthermore, image saliency detection techniques were applied to improve the sample consistency, reducing biases caused by sample quality issues and enhancing the validity of the design experiment [9].
Moreover, integrating style transfer training with Stable Diffusion enhanced the controllability of text-to-image generation. By applying specialized style transfer training to the AI model, we ensured that it could accurately generate images of Dunhuang cultural elements. The model learned the unique stylistic features of Dunhuang murals, enabling the generated images to better align with the intended design objectives. This training, combined with the high controllability of Stable Diffusion, effectively minimized semantic bias and improved the stability and consistency of the generated outputs.
Finally, during the design generation phase, we assembled six senior designers from various design disciplines into collaborative groups. Designers specializing in product types were drawn from the field of product design, which ensured a diverse range of product categories. Meanwhile, those focused on material design came from craft art and visual design backgrounds, guaranteeing the scientific rigor of their material choices. This collaborative approach significantly enhanced the richness and quality of the generated design outcomes. Through this experimental design, we flexibly adjusted the product types and materials under controlled conditions, enhancing both the diversity and quality of design solutions.

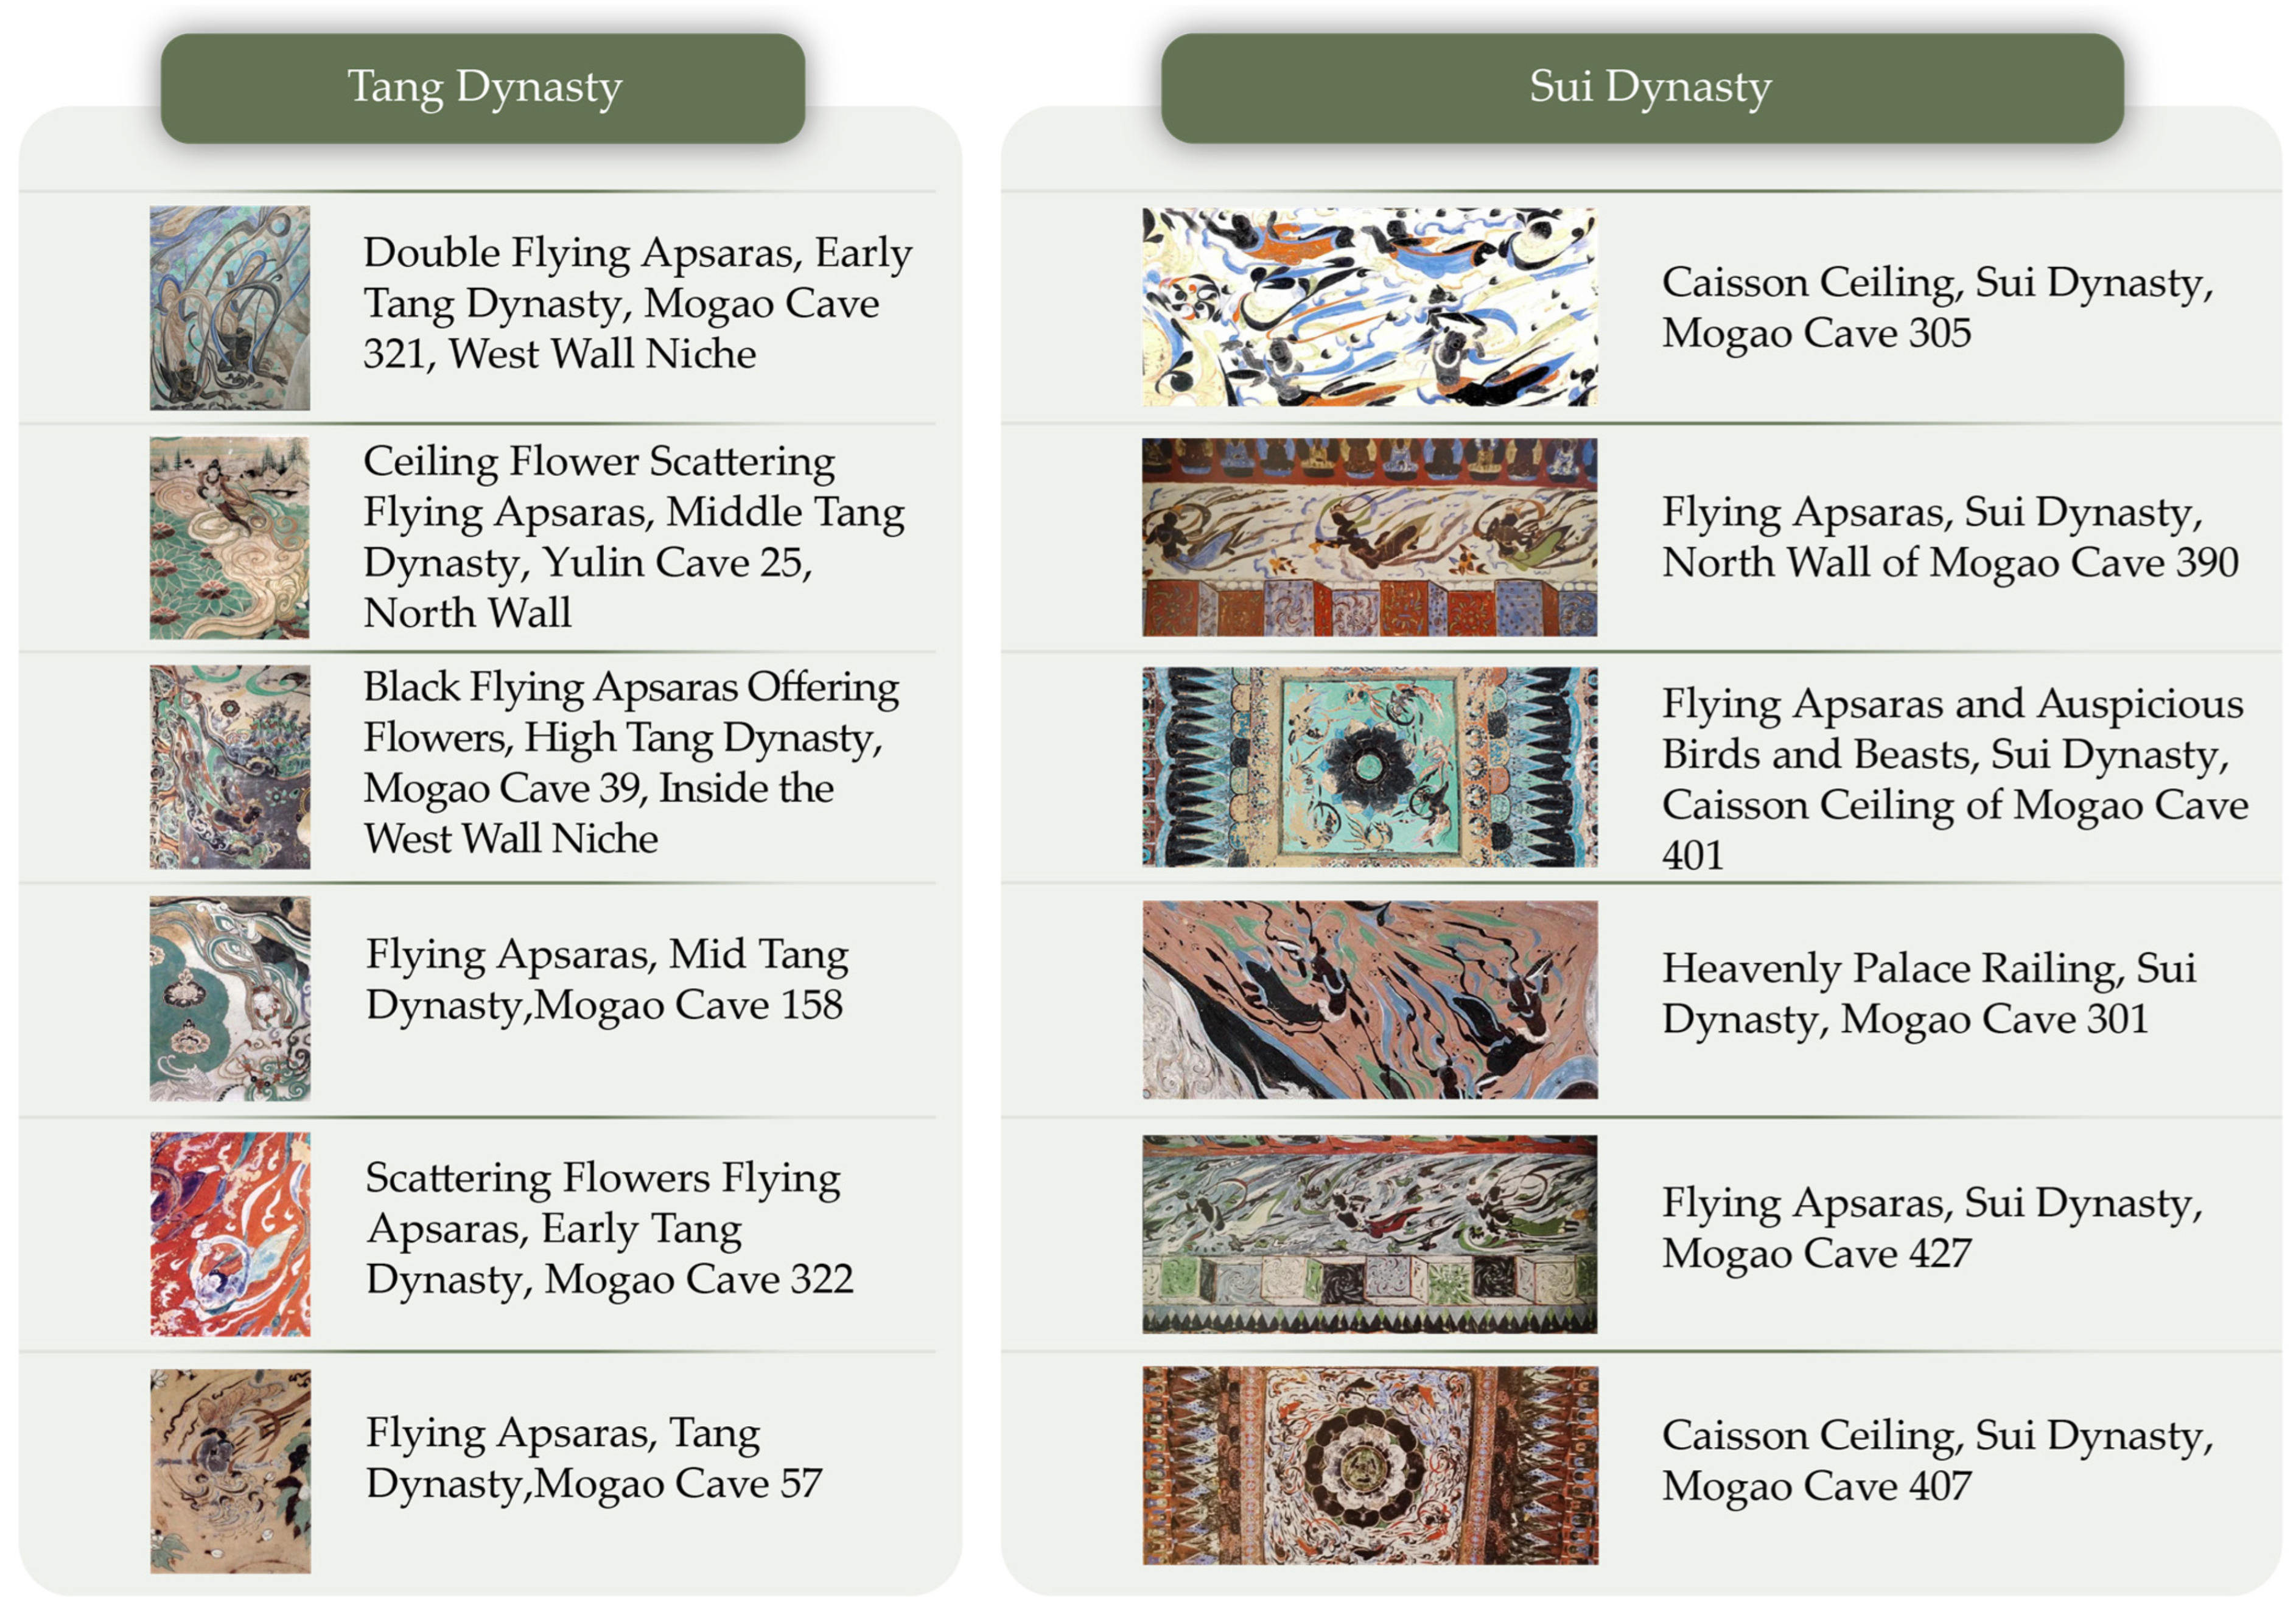
3.3.1. Dunhuang Flying Apsaras Culture Sample Collection

Dunhuang Flying Apsaras, iconic artistic figures in Dunhuang murals, are renowned for their graceful postures, flowing ribbons, and vivid expressions, which show a high level of artistic skill and aesthetic value [63]. These figures incorporate various cultural elements from the Central Plains, India, and Persia, reflecting multicultural exchanges and integration along the Silk Road. Due to changes in dynasties and shifts in political, economic, and cultural landscapes, Flying Apsaras have developed a distinctive evolutionary history. During the Sui Dynasty, the depiction of Flying Apsaras in Dunhuang murals experienced unprecedented growth, with a rich diversity of content and a more refined and vibrant quality. By the Tang Dynasty, the depiction techniques of the Flying Apsaras had reached an unparalleled zenith, becoming an indispensable part of regular cave decorations.
The selection of cultural element samples for this experiment was based on several criteria, as follows: (1) representative mural samples from peak periods, (2) mural samples with rich colors and textures, and (3) mural samples that met clarity requirements. Following these criteria, the research team conducted on-site investigations in Dunhuang and systematically collected 112 cultural samples related to the Dunhuang Flying Apsaras culture (see Figure 5). These samples were obtained from Dunhuang Museum and Mogao Cave 220, Mogao Cave 321, Mogao Cave 427, Mogao Cave 407, and Yulin Cave 25, among others.

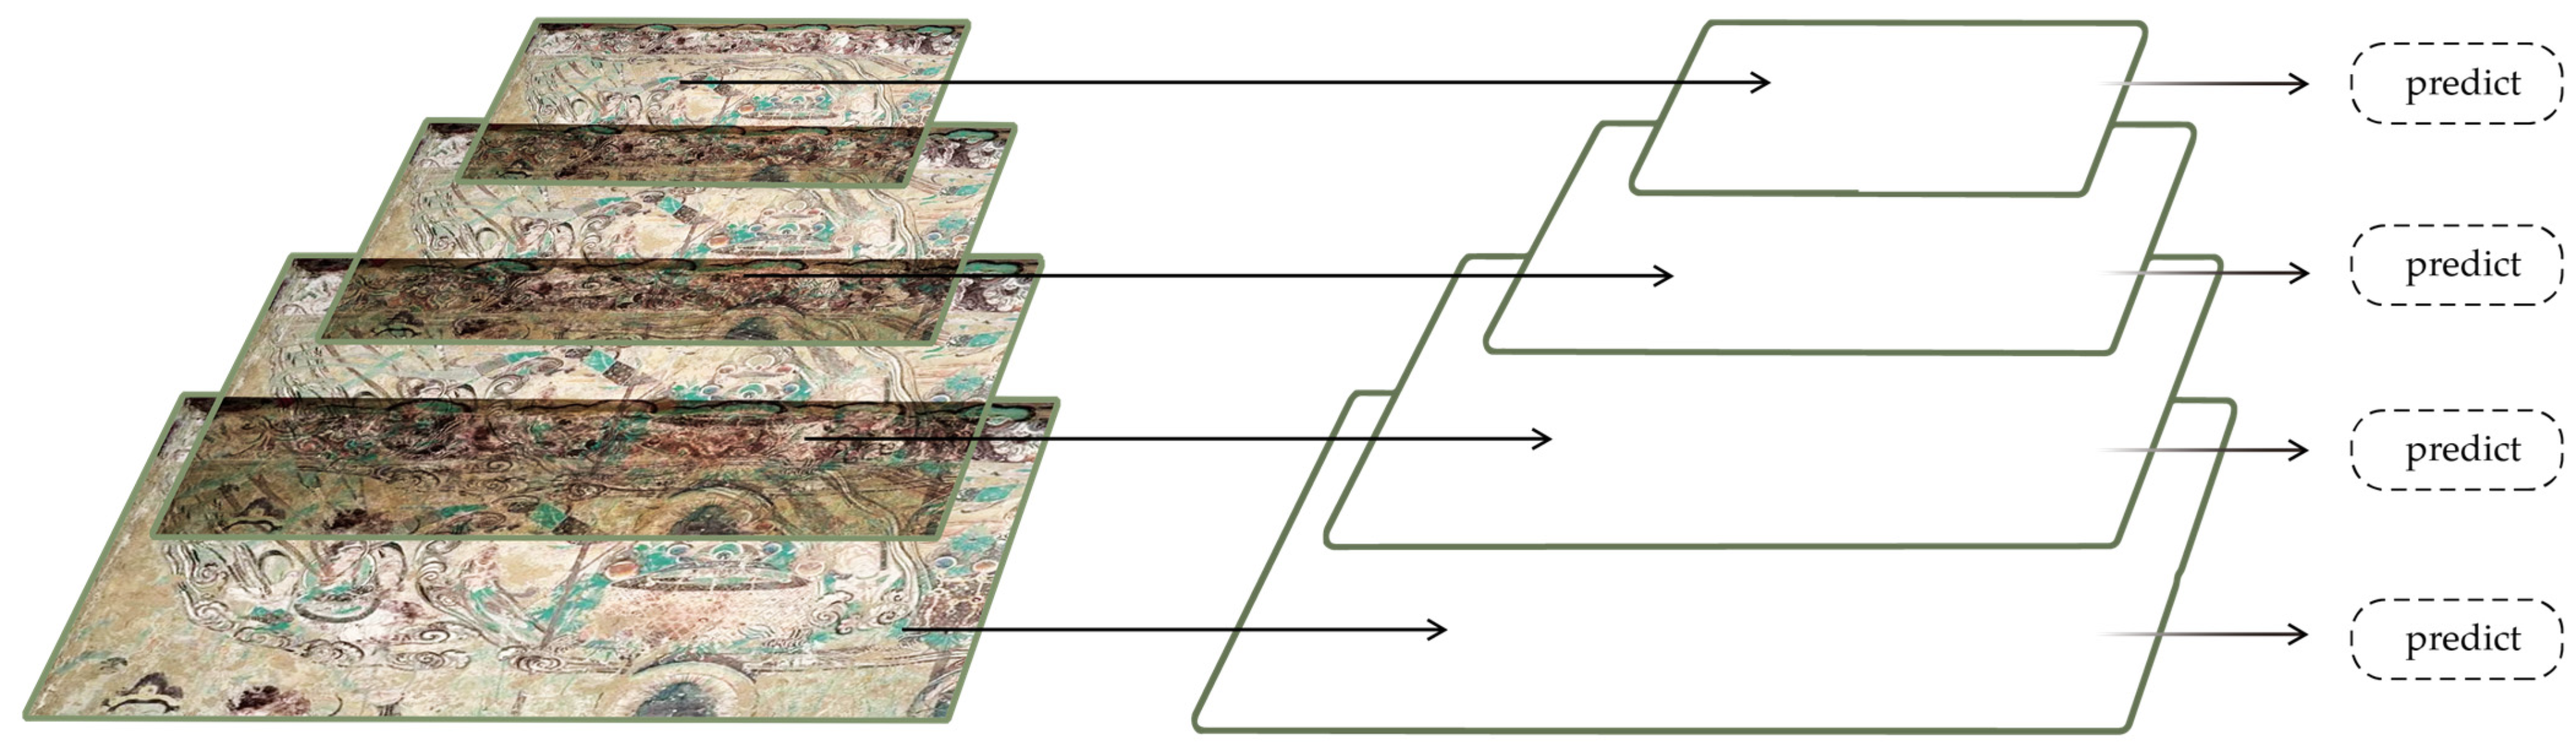
3.3.2. Sample Image Preprocessing

To ensure the quality and consistency of the AI training data and enhance the learning accuracy, the preprocessing of the samples was necessary. This process involved removing extraneous and complex interference elements from the sample images while maintaining their original color information and a uniform image format. Initially, saliency calculations were performed on the collected images. Saliency research, a field within computer vision, aims to simulate and understand the perception of the human visual system and focus on important regions within visual scenes. Given the varying image sizes, this study utilized the Gaussian Pyramid technique to process the original images. The Gaussian Pyramid is a multi-scale image representation method used for image analysis and processing in computer vision (see Figure 6) [64].
The core of the Gaussian Pyramid involves the application of Gaussian kernel convolution to the entire image. The central element of the convolution kernel is the largest and gradually decreases toward the periphery. The computation of the Gaussian convolution function is shown in Equation (1):
G x ,   y = 1 2 π θ 2 e x x 0 2 y y 0 2 2 a 2
In Equation (1), x 0 represents the pixel mean value in the Gaussian convolution kernel in direction x; y 0 represents the pixel mean value in the Gaussian convolution kernel in direction y; and θ denotes the standard deviation, which characterizes the dispersion of the Gaussian convolution kernel, affecting the filtering intensity. In addition, this study incorporated an 8-layer feature pyramid, where the features of the original image become increasingly blurred with the deepening of the layers. Subsequently, all feature maps were scaled to the original image size and subjected to pixel normalization, as shown in Equation (2):
N = S r c max ( S r c ) min ( S r c ) + min S r c min S r c max S r c x
N represents the normalized result of the entire image; S r c represents the untreated original image; and max S r c and min S r c , respectively, denote the maximum and minimum pixel values in the original image.
After obtaining the saliency map, the original color information was retained, and binary thresholding was applied to the saliency map to achieve consistent image segmentation. In this study, Otsu’s algorithm [65] was employed to process the saliency map. A key benefit of this algorithm is its capacity to automatically establish an optimal threshold by analyzing the statistical data from an image, thus eliminating the need for manual threshold selection. Specifically, it categorizes pixels in the saliency map into foreground and background classes, iteratively calculating the threshold that maximizes inter-class variance, as detailed in Equations (3) and (4):
μ = ω 0 × μ 0 + ω 1 × μ 1
ν = ω 0 μ 0 μ 2 + ω 1 μ 1 μ 2
μ and ν denote the mean values of the entire image; μ0 and μ1 represent the pixel grayscale average values of the foreground and background regions of the image, respectively; and ω0 and ω1 denote the pixel grayscale weights of the foreground and background regions, respectively. After binarizing the saliency map and performing segmentation, the segmented regions were used to mask the original images, thereby retaining their color information. A total of 312 valid sample images with a 1:1 aspect ratio and uniform resolution were obtained.

3.3.3. AI-Generated MCCP Design

The designer classified the processed sample images into six groups according to different style types and assigned tags to each image. After generating the initial tags, the Booru Dataset Tag Manager was used to adjust the machine-generated tags. Subsequently, the tagged material set was imported into a locally deployed SD trainer. This was performed by selecting base model files, setting the Lora model save names, and conducting training to generate six Lora models. The best model and its corresponding weight values were selected through model testing. Based on the feedback from the MCCP design scenarios, the training materials and tags were optimized, and style training was iterated until the final Lora module achieved the optimal stability and generalization. This process enabled the AI model to learn the artistic style of the Dunhuang Flying Apsaras murals, gradually enhancing the quality of their generative designs during training.
To enhance the diversity of the design generation schemes and improve the reliability of the satisfaction survey data, this study selected six designers with experience in AI-generated design. They were divided into two experimental groups, A and B, based on their respective fields, and assigned distinct design tasks (see Table 4). Group A was tasked with generating a variety of product types, including figurines, pendants, refrigerator magnets, fans, silk scarves, and cups, to ensure a broad range of product forms. Conversely, Group B focused on generating a diverse set of design materials, such as plastic, metal, embroidery, fabric, paper, and wood, encompassing materials commonly used in cultural and creative products.
In the design generation process, Group A started with sketching initial concepts as line drawings, which were then imported into the “Text-to-Image” section of the Stable Diffusion model. Market analysis informed the input of both positive and negative prompts to establish the overall direction, including specific aspects such as product form and detailed features. Subsequently, parameters such as weights, sampling methods, and iteration steps were set to render the sketches. To increase the diversity of the generated designs, the batch size was set to “4” and the quantity per batch was “1”. Through multiple iterations of generation and optimization, various types of basic design forms for the products (form and appearance) were produced. These initial designs were then passed to Group B, which utilized the “Image-to-Image” module for further refinement. Group B adjusted the scripts, preprocessors, models, and generation algorithms to assign appropriate materials to the products and fine-tuned details such as precision, lighting, and shading to generate the final designs (see Figure 7).
Despite employing a rigorous design process and grouping strategy, our experiment still encountered potential sources of error. For instance, subjectivity and inconsistencies in sample labeling and classification could introduce bias during model training, potentially impacting the quality of the generated results. The Lora model’s training involves several variables, such as label selection and weight adjustment; incorrect settings or inadequate training might lead to suboptimal design outcomes. Additionally, during the material matching process between Group A and Group B, insufficient communication may cause mismatches between product forms and materials, which could affect the final design’s effectiveness. To address these issues, we implemented a feedback mechanism and used design collaboration tools to improve the communication between the two groups. We also iteratively adjusted the training parameters and optimized the materials and labels to ensure the AI model’s stability and generalizability.

3.4. Questionnaire

After completing the design proposal, a questionnaire survey was conducted using random sampling to collect consumer satisfaction data. The IPA questionnaire items were primarily based on the indicators developed in the evaluation system (as shown in Appendix A). In designing the questionnaire, we consulted the relevant literature to strengthen its validity [51,54,66]. The survey was conducted in two parts. The first part gathered consumers’ views on Dunhuang Flying Apsaras culture and the AI-generated designs, along with demographic information. The second part assessed the perceived importance and satisfaction of the AI-generated MCCP designs using a five-point Likert scale that effectively measured user attitudes and opinions. Sullivan and Artino support the Likert scale’s effectiveness in balancing granularity and simplicity, making it widely applicable across various research fields [67]. The respondents rated their experiences on a scale ranging from 1 (strongly disagree) to 5 (strongly agree). They were shown the AI-generated design proposals, and the production process was explained to them before completing the questionnaire.

3.5. Data Collection

According to the survey results, individuals aged 18–35 constitute the primary consumer demographic and the most targeted audience for MCCPs’ consumption [68]. Given the characteristics of the products generated in this design experiment, survey data were collected mainly from individuals aged 18–35. The data collection period for this study extended from 15 June 2024 to 30 June 2024. The questionnaire, designed to ensure data reliability, included the two following screening questions: age range and previous MCCP purchase history. During data analysis, questionnaires that did not meet the criteria were excluded, ensuring that only valid responses were analyzed. Confidentiality and anonymity were maintained for all the respondents’ data.
The data were collected using both online and offline methods. Online data collection was conducted using questionnaires distributed on platforms, such as WeChat and Weibo. The offline survey was conducted from 5 June 12024, to 23 June 2024, at locations such as the Dunhuang Museum, Dunhuang Mogao Grottoes, and Dunhuang Grotto Art Protection and Research Exhibition Center. A total of 314 questionnaires were collected and 297 valid responses were included in the analysis. The demographic analysis of the questionnaire responses (see Table 5) showed that the male-to-female ratio was approximately 2:3, which aligns well with the gender characteristics of primary MCCP buyers. Awareness of AI-generated art and design (rated on a 5-point scale) scored 3.38, suggesting that most respondents had heard of or seen such designs. Interest in AI-generated art and design was rated at 4.03, indicating a high level of consumer interest in this novel art form, with strong potential to attract attention.

4. Results

4.1. Reliability and Validity Analysis

To evaluate the reliability of the scale, we employed SPSS version 27 in this study. For reliability analysis, we used Cronbach’s alpha, a widely recognized measure for assessing scale reliability [69]. The calculation formula is shown in Equation (5):
α = k k 1 1 p i 2 p t 2
κ represents the total number of questionnaires, p i 2 represents the variance within items for each item, and p t 2 indicates the total variance across all questionnaires. The alpha coefficient, which ranges from 0 to 1, measures internal consistency. A coefficient above 0.7 generally indicates an acceptable reliability. Some research suggests that a value above 0.6 is acceptable, while a range from 0.8 to 0.9 indicates a high reliability [70]. In this study, the alpha coefficient was 0.914, demonstrating the questionnaire’s high reliability.
The structural validity of the questionnaire was evaluated through factor analysis. Prior to this, we used the KMO measure of sampling adequacy and Bartlett’s test of sphericity. The KMO values, which range from 0 to 1, assess the validity of the data—values above 0.8 indicate a strong validity, values between 0.7 and 0.8 indicate a good validity, values between 0.6 and 0.7 suggest an average validity, and values below 0.6 suggest a poor validity. The results of this study showed a KMO value of 0.903, exceeding the acceptable threshold of 0.6 (refer to Table 6), thereby indicating a good data validity.
To ensure the reliability and interpretability of the factors, it was essential to analyze the factor loadings. The study utilized the Varimax rotation method, and we derived the loading values for each indicator across the corresponding factors (see Table 7). Factor loadings were used to evaluate the contribution of each indicator to its associated factors, thereby ensuring the scale’s construct validity. When the communalities of all research items exceeded 0.4, it signified a strong association between the items and the factors. Additionally, a factor loading coefficient greater than 0.4 indicated a satisfactory alignment between the item and its corresponding factor [71].
Based on the analysis of factor loadings, all items in this study exhibited relatively high loadings. Specifically, the loadings for “regional culture”, “cultural heritage”, and “historical culture” on Factor 1 were 0.935, 0.908, and 0.883, respectively. The loadings for “modeling”, “color”, “graphics”, and “material” on Factor 2 were 0.857, 0.892, 0.756, and 0.833, respectively. Similarly, the loadings for “clearly functional”, “simple and practical”, and “memorial value” on Factor 3 were 0.820, 0.780, and 0.630, respectively. Finally, the loadings for “emotional resonance”, “aesthetic preferences”, “personalization”, and “social fulfillment” on Factor 4 were 0.923, 0.850, 0.918, and 0.763, respectively. These results demonstrate that the evaluation indicators in the scale were highly representative and exhibited strong correlations with their respective factors, thereby supporting the scale’s validity. Moreover, the communality further illustrated the explanatory power of these items concerning the overall factor structure. In summary, the factor loadings and communality data confirmed that the indicators within the evaluation scale possessed a robust explanatory power regarding their associated factors, thereby affirming the construct validity of the scale.

4.2. Importance and Satisfaction Analysis

Based on the evaluation results of importance and satisfaction from a sample of 297 respondents, the mean values for importance and satisfaction, the mean difference between importance and satisfaction (I-P), the IPA index, and the satisfaction level were analyzed according to the factor layer and index layer presented in Figure 3. The results obtained through SPSS 27.0 statistical analysis are shown in Table 8.
As shown in Table 8, the mean importance rankings of the factor layer, as perceived by respondents, were as follows: Cultural expression (4.33) > User experience (4.11) > Creative attraction (4.07) > Product functionality (3.55). Three of these four factors had mean importance values exceeding 4.0, indicating that the respondents had high expectations for AI-generated museum cultural and creative designs. Additionally, the importance score for Product Functionality (3.55) was relatively moderate, indicating that respondents did not prioritize product functionality highly.
Table 9 shows that, among the specific indicators affecting consumer satisfaction in the index layer, those with mean importance values greater than 4.0 included C4 Modeling (4.06), C5 Color (4.14), C6 Graphics (4.13), C8 Regional culture (4.43), C9 Cultural heritage (4.42), C10 Historical culture (4.13), C11 Emotional resonance (4.46), C12 Aesthetic preferences (4.16), and C13 Personalization (4.29). These nine indicators received significant attention in the AI-generated product design projects.

4.3. Importance–Performance Index Analysis

The IPA index quantifies the difference between the perceived importance and the satisfaction of each indicator. This was calculated using the following formula:
I P A I = I P I × 100
The formula includes the Importance–Performance Analysis Index (IPAI), where I stands for Importance and P denotes Performance. A lower IPAI index corresponds to a higher level of satisfaction. Satisfaction levels were categorized into the five following groups: “Very Satisfied” (less than 5.00), “Satisfied” (5.01–10.00), “Neutral” (10.01–20.00), “Dissatisfied” (20.01–30.00), and “Very Dissatisfied” (greater than 30.01).
Table 8 shows that the analysis of the mean differences between Importance and Satisfaction (I-P) and the IPA index values for the factor layer indicate that satisfaction ranged from −1.965% to 25.173%. The IPA index analysis indicates that the index for Creative Attraction was negative, signifying “Very Satisfied” according to the IPA evaluation standard. The IPA index for Product Functionality was 6.197, which is classified as “Satisfied”. Conversely, Cultural Expression and User Experience are categorized as “Dissatisfactory”.
Table 9 categorizes the satisfaction levels of the index layer into the five following groups: (1) “Very Satisfied” indicators include C3 Memorial value, C4 Modeling, C5 Color, C6 Graphics, and C7 Material; (2) “Satisfied” indicators include C1 Clearly functional and C2 Simple and practical; (3) “Neutral” indicators include C14 Social fulfillment; (4) “Dissatisfied” indicators include C8 Regional culture, C9 Cultural heritage, and C10 Historical culture; and C12 Aesthetic preferences; and (5) “Very Dissatisfied” indicators include C11 Emotional resonance and C13 Personalization.

4.4. Overall IPA Matrix Analysis

Using the previous analysis, an Importance–Performance Analysis (IPA) quadrant matrix was developed to comprehensively assess the evaluation factors at the indicator layer (see Figure 8). The average values of importance (x = 4.022) and performance (y = 3.476) served as the intersection points, positioning importance on the x-axis and performance on the y-axis. This allowed for the creation of a detailed IPA matrix that included the average values of the 14 indicators. The analysis was performed as follows:
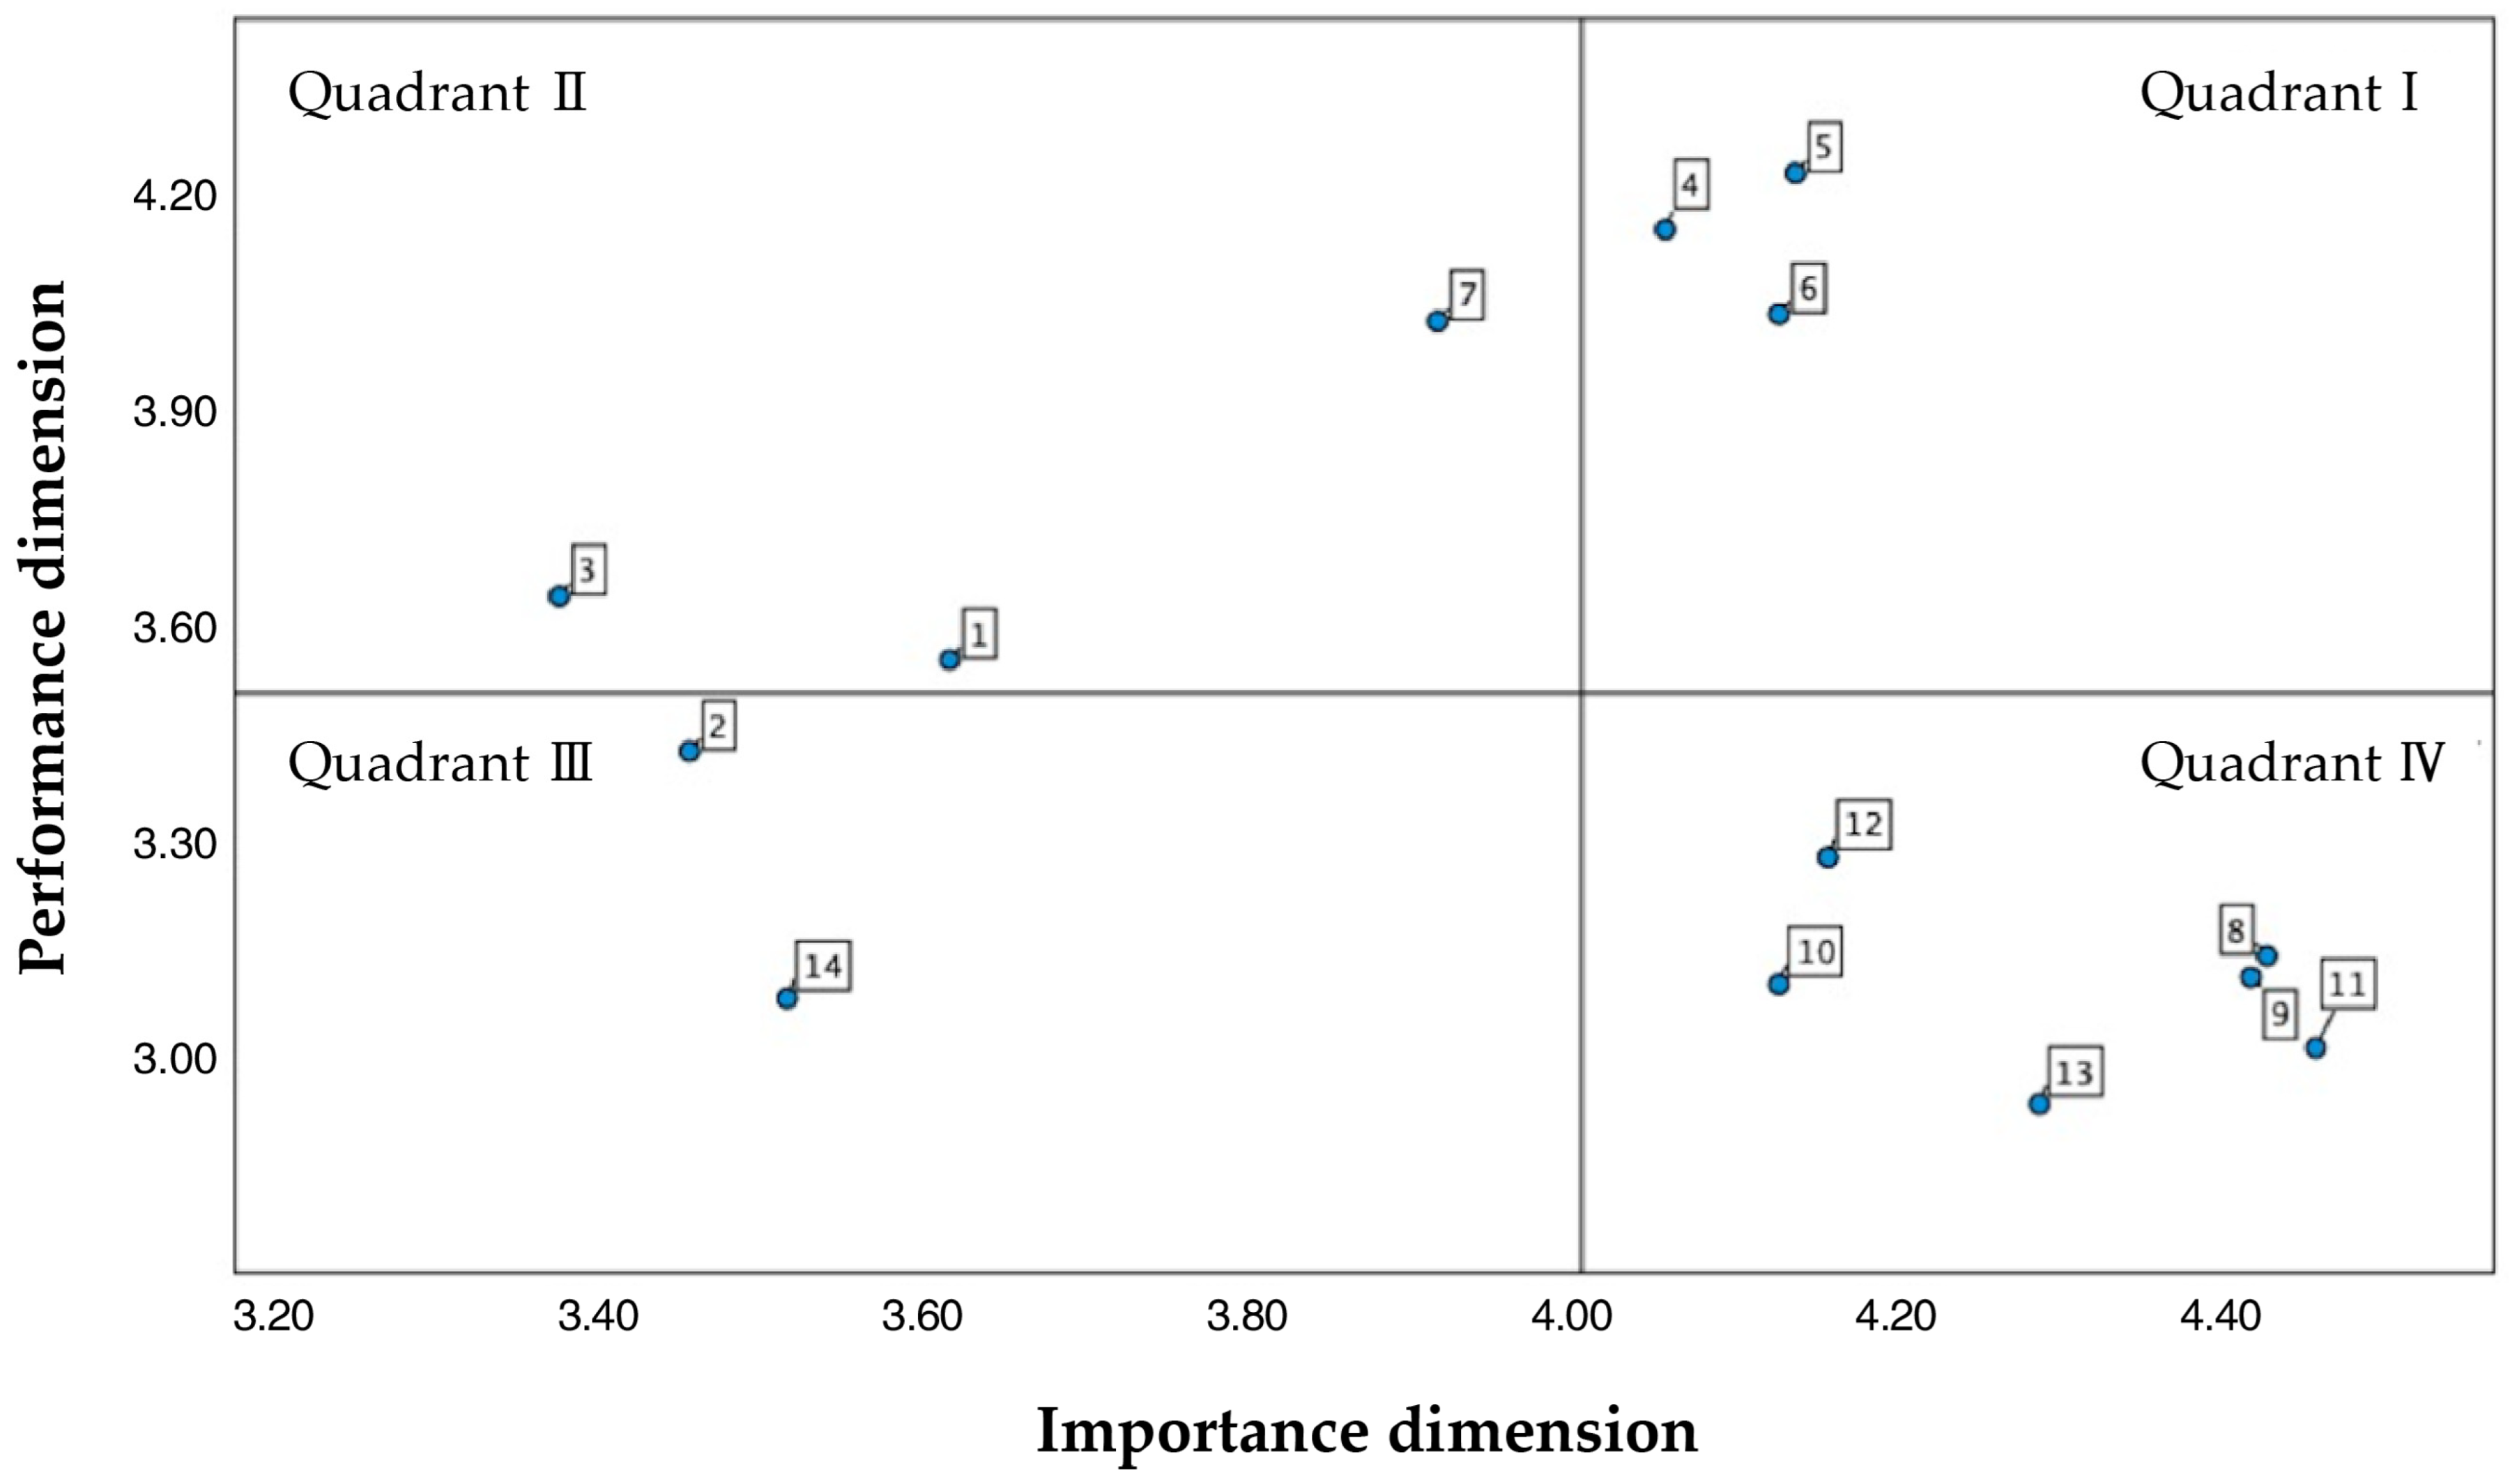
  • Quadrant I (H, H): Strength Area. This quadrant represents high importance and high satisfaction, indicating the need to maintain and continuously improve quality and efficiency. This quadrant includes three indicators, C4 Modeling, C5 Color, and C6 Graphics. Among these indicators, C5 Color is considered as the most important, suggesting that AI-generated designs still have significant room for improvement in this aspect. Furthermore, AI-generated MCCPs received positive feedback from respondents concerning C4 Modeling and C6 Graphics.
  • Quadrant II (L, H): Maintenance Area. This quadrant contains indicators that are less important but exhibit high satisfaction, suggesting that these aspects should be maintained at their current quality. Indicators in this quadrant include C3 Memorial value and C7 Material. The advantages of the AI-generated MCCP design should continue to leverage its existing strengths in memorial value and materials.
  • Quadrant III (L, L): Opportunity Area. This quadrant signifies low importance and low satisfaction, signaling areas for potential improvement in AI-generated museum cultural and creative design. The indicators in this quadrant include C1 Clearly functionality, C2 Simple and practical, and C14 Social fulfillment. Currently, respondents find it difficult to fully experience the functionality of AI-generated MCCP design. However, with advancements in digital technologies such as AR and MR, the overall experience is expected to improve significantly [72].
  • Quadrant IV (H, L): Improvement Area. This quadrant signifies high importance yet low satisfaction and comprises indicators such as C8 Regional culture, C9 Cultural heritage, C10 Historical culture, C11 Emotional resonance, C12 Contemporary aesthetic, and C13 Personalization. Respondents value these indicators, yet the current design outcomes are dissatisfied, resulting in a psychological gap and relatively low satisfaction. These should be primary areas for future enhancement. Compared to general products, respondents exhibit a stronger preference for the inherent cultural attributes of MCCPs. The regional cultural elements exhibited in these products, along with their alignment with personal emotions, aesthetic preferences, and personalization, garner particular interest from consumers. AI-generated MCCP design should focus on enhancing consumer satisfaction in these aspects. Additionally, C11 Emotional resonance is deemed the most important yet least satisfactory indicator, indicating a lack of resonance of and emotional connection with AI-generated designs. This indicates the need for advancements in creativity, emotional expression, and aesthetic judgment.

5. Strategies and Recommendations

5.1. Create a Multimodal Museum Database

According to the IPA index analysis, the current AI-generated MCCP designs face the problem of lacking a connection with museum cultural elements, which leads to a decline in consumers’ cultural perception of these products. The primary cause of this issue is the limitations of AI algorithms in comprehending complex cultural elements [73]. Moreover, AI-generated designs are constrained by the limited data provided by designers, which inadequately represent specific cultural symbols, aesthetic principles, and artistic styles, thereby resulting in designs that lack profound cultural connections [74]. To address this, it is crucial to provide AI with a rich and effective training dataset [75], thereby enhancing its cultural translation capabilities and improving the cultural perception in the generated designs. For instance, building a multimodal museum database that integrates multimodal learning resources such as images, videos, and textual information ensures that the datasets used for AI model training are comprehensive. Representative cultural resources in museums are deconstructed into foreground, background, and main elements, with thematic keywords being defined and the corresponding relationships between keywords and elements being established. This approach enables AI models to deeply explore museum cultural elements, ensuring that they possess an ideological framework compatible with both artistic innovation and regional cultural characteristics. Consequently, this allows for the creation of MCCPs that are both regionally distinctive and innovatively significant.

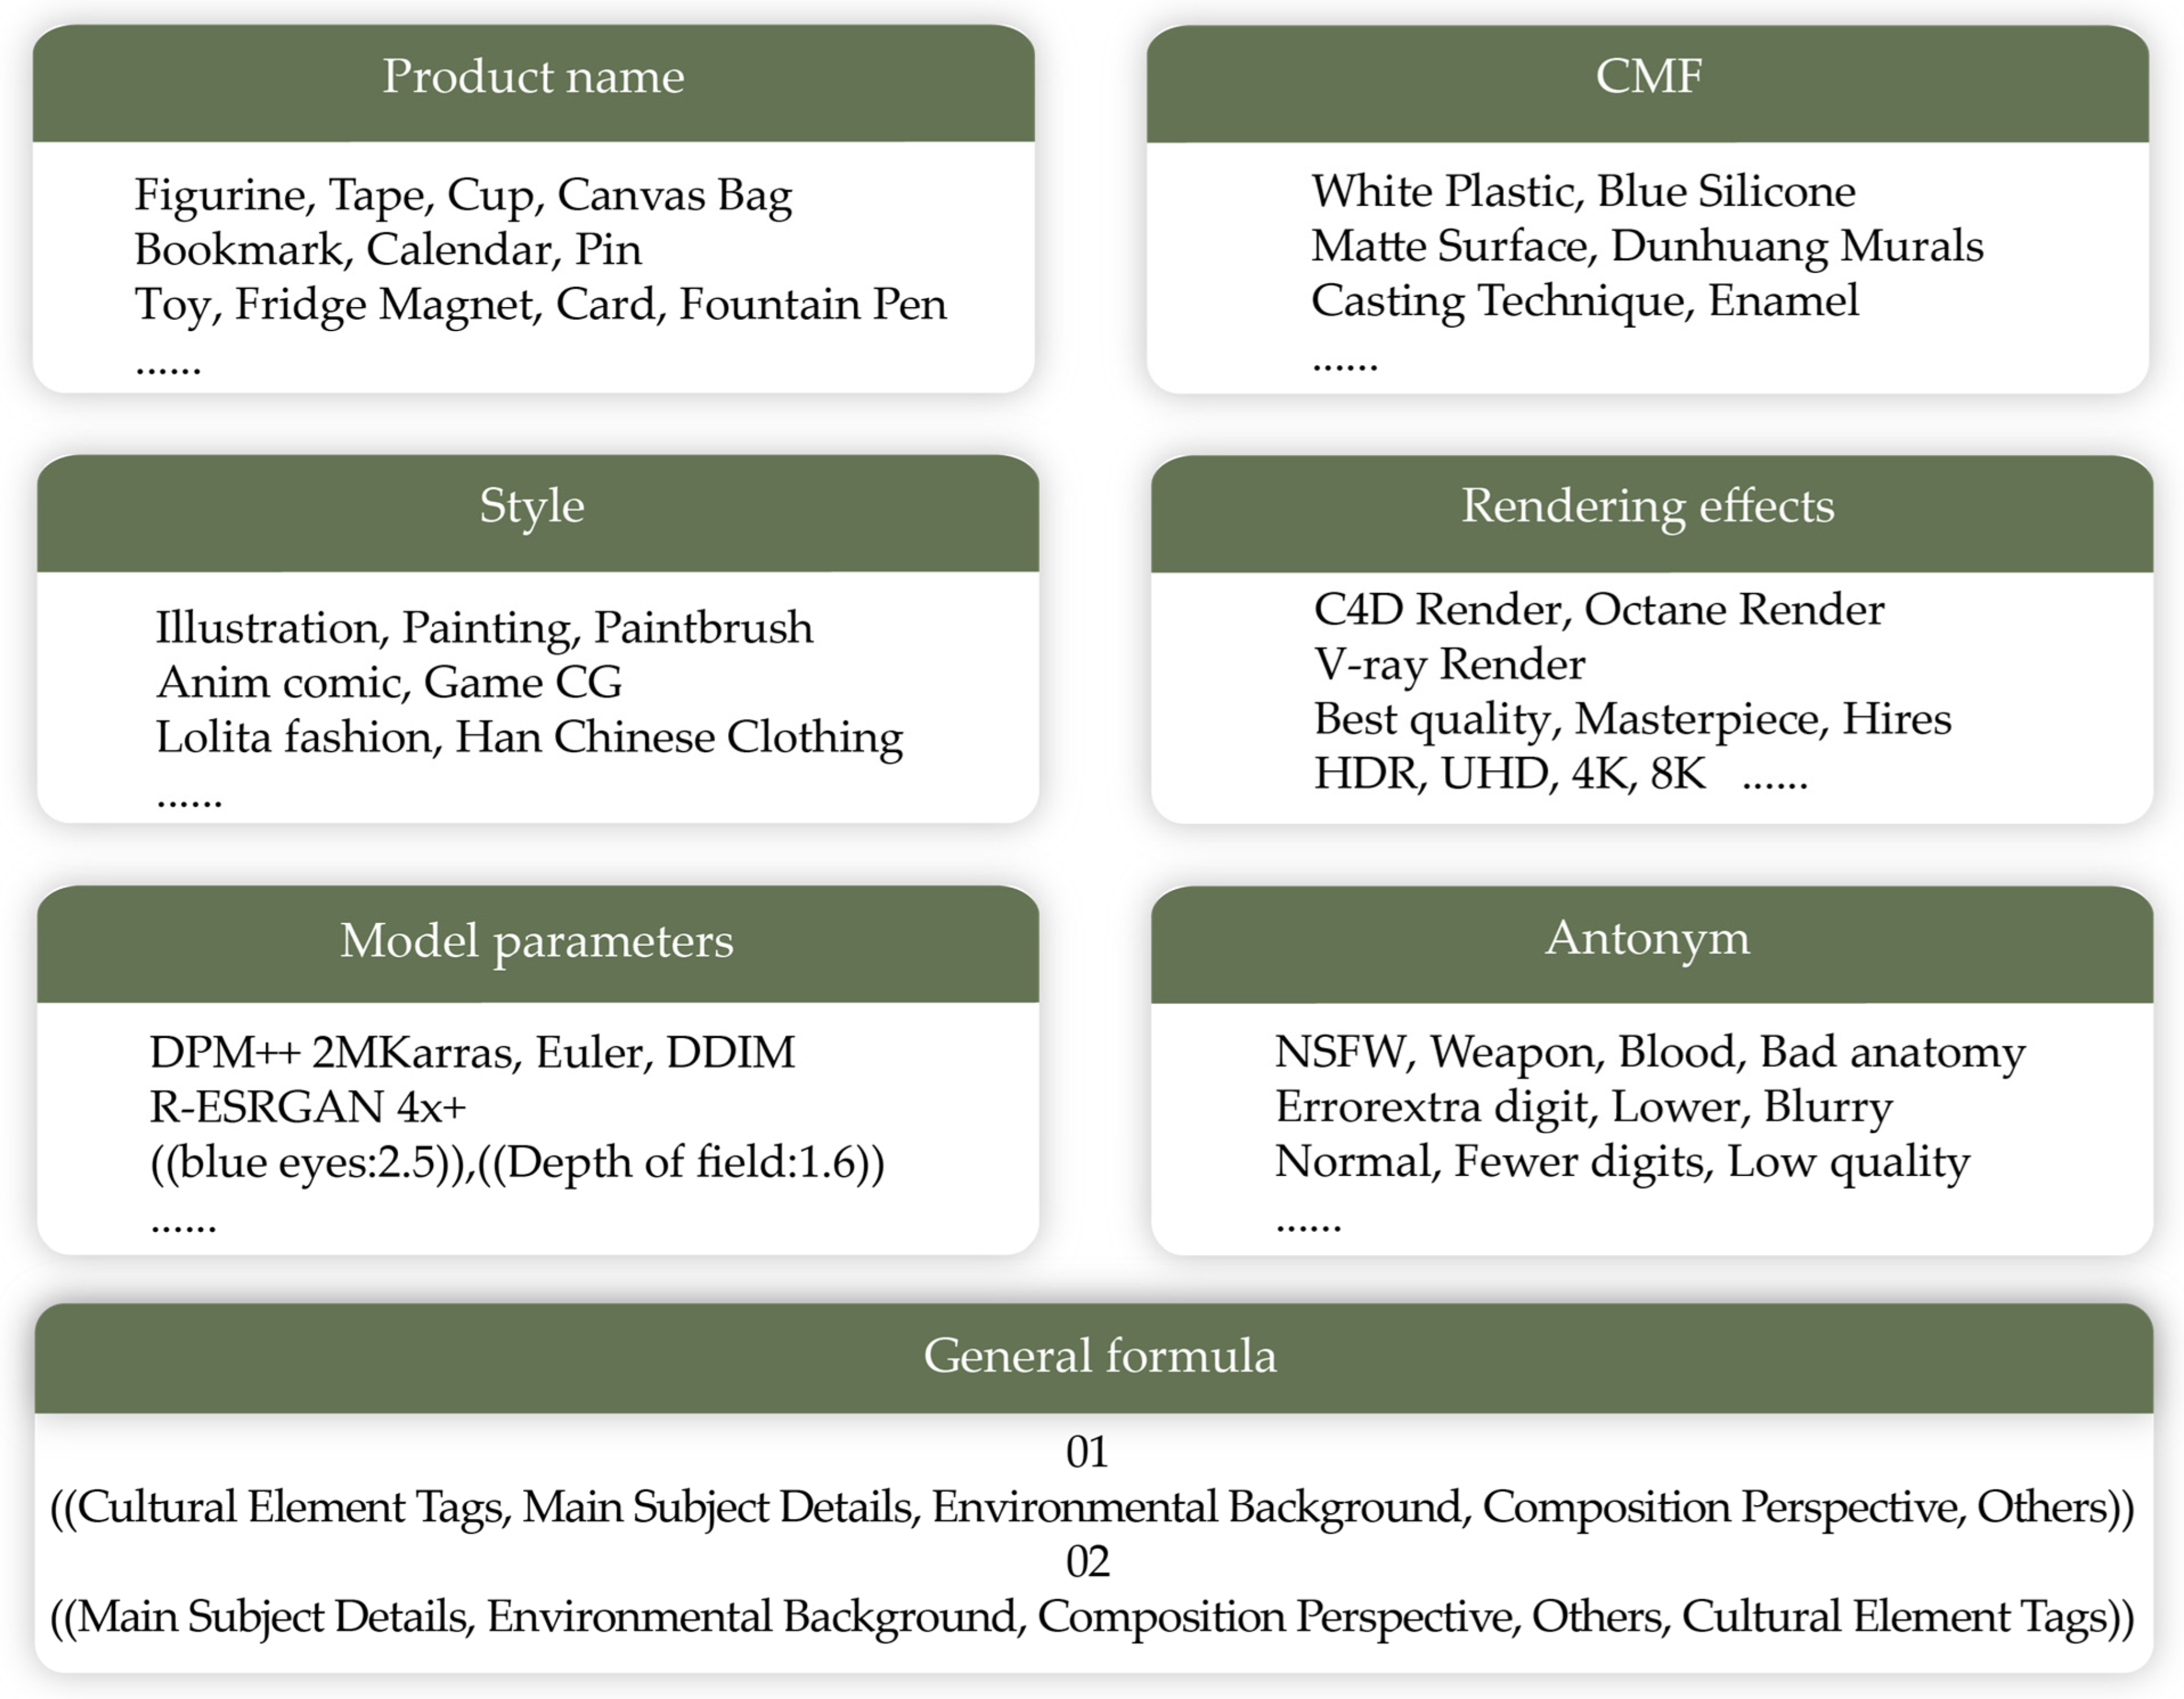
5.2. Develop Structured Prompt Card Models

Based on the results of the IPA analysis, the evidence suggests that consumers place considerable importance on the user experience of product design (Importance: 4.11); however, the satisfaction score in this area was notably low (Satisfaction: 3.10). This indicates that the consumers’ expectations regarding product design were not fully met. Specifically, a significant gap existed between users’ expectations and their actual experiences, particularly in the areas of ‘emotional resonance’ (C11) and ‘personalization’ (C13). Therefore, enhancing the user experience of AI-generated designs is crucial for improving consumer satisfaction. In the AI-driven design process for MCCPs, AI employs complex algorithms to generate designs without providing clear explanations or control over its decision-making processes. This lack of transparency hinders designers’ ability to accurately comprehend and anticipate AI’s design decisions, resulting in deviations from the original design concepts. Such inconsistencies further impede personalized expression and emotional resonance in these designs, thereby diminishing consumer satisfaction and their sense of identification with the final products.
Prompt is a crucial method by which designers can communicate their design concepts and enhance AI’s creativity during the collaborative process between designers and AI. Standardized prompts significantly improve the accuracy of generated designs [76]. In the AI-driven design process for MCCPs, designers must use specific terminology recognizable by AI models and clearly articulate their design expectations to ensure controllability and precision. Drawing from a literature review [77,78] and our practical experience, we researched multiple dimensions to identify the key factors and proposed a general product design formula, as follows: ((Cultural Element Tags, Main Subject Details, Environmental Background, Composition Perspective, Image Quality, Others)) and ((Cultural Element Tags, Main Subject Details, Environmental Background, Composition Perspective, Others, Image Quality)). Additionally, we developed a structured design generation card model (see Figure 9) categorized by product type, style requirements, functional requirements, Color Material Finishing (CMF), model parameters, rendering effects, and image quality. These cards serve as practical tools for AI to generate MCCPs, offering clear and concise guidelines that enhance the controllability and accuracy of the design process to meet consumer demands.

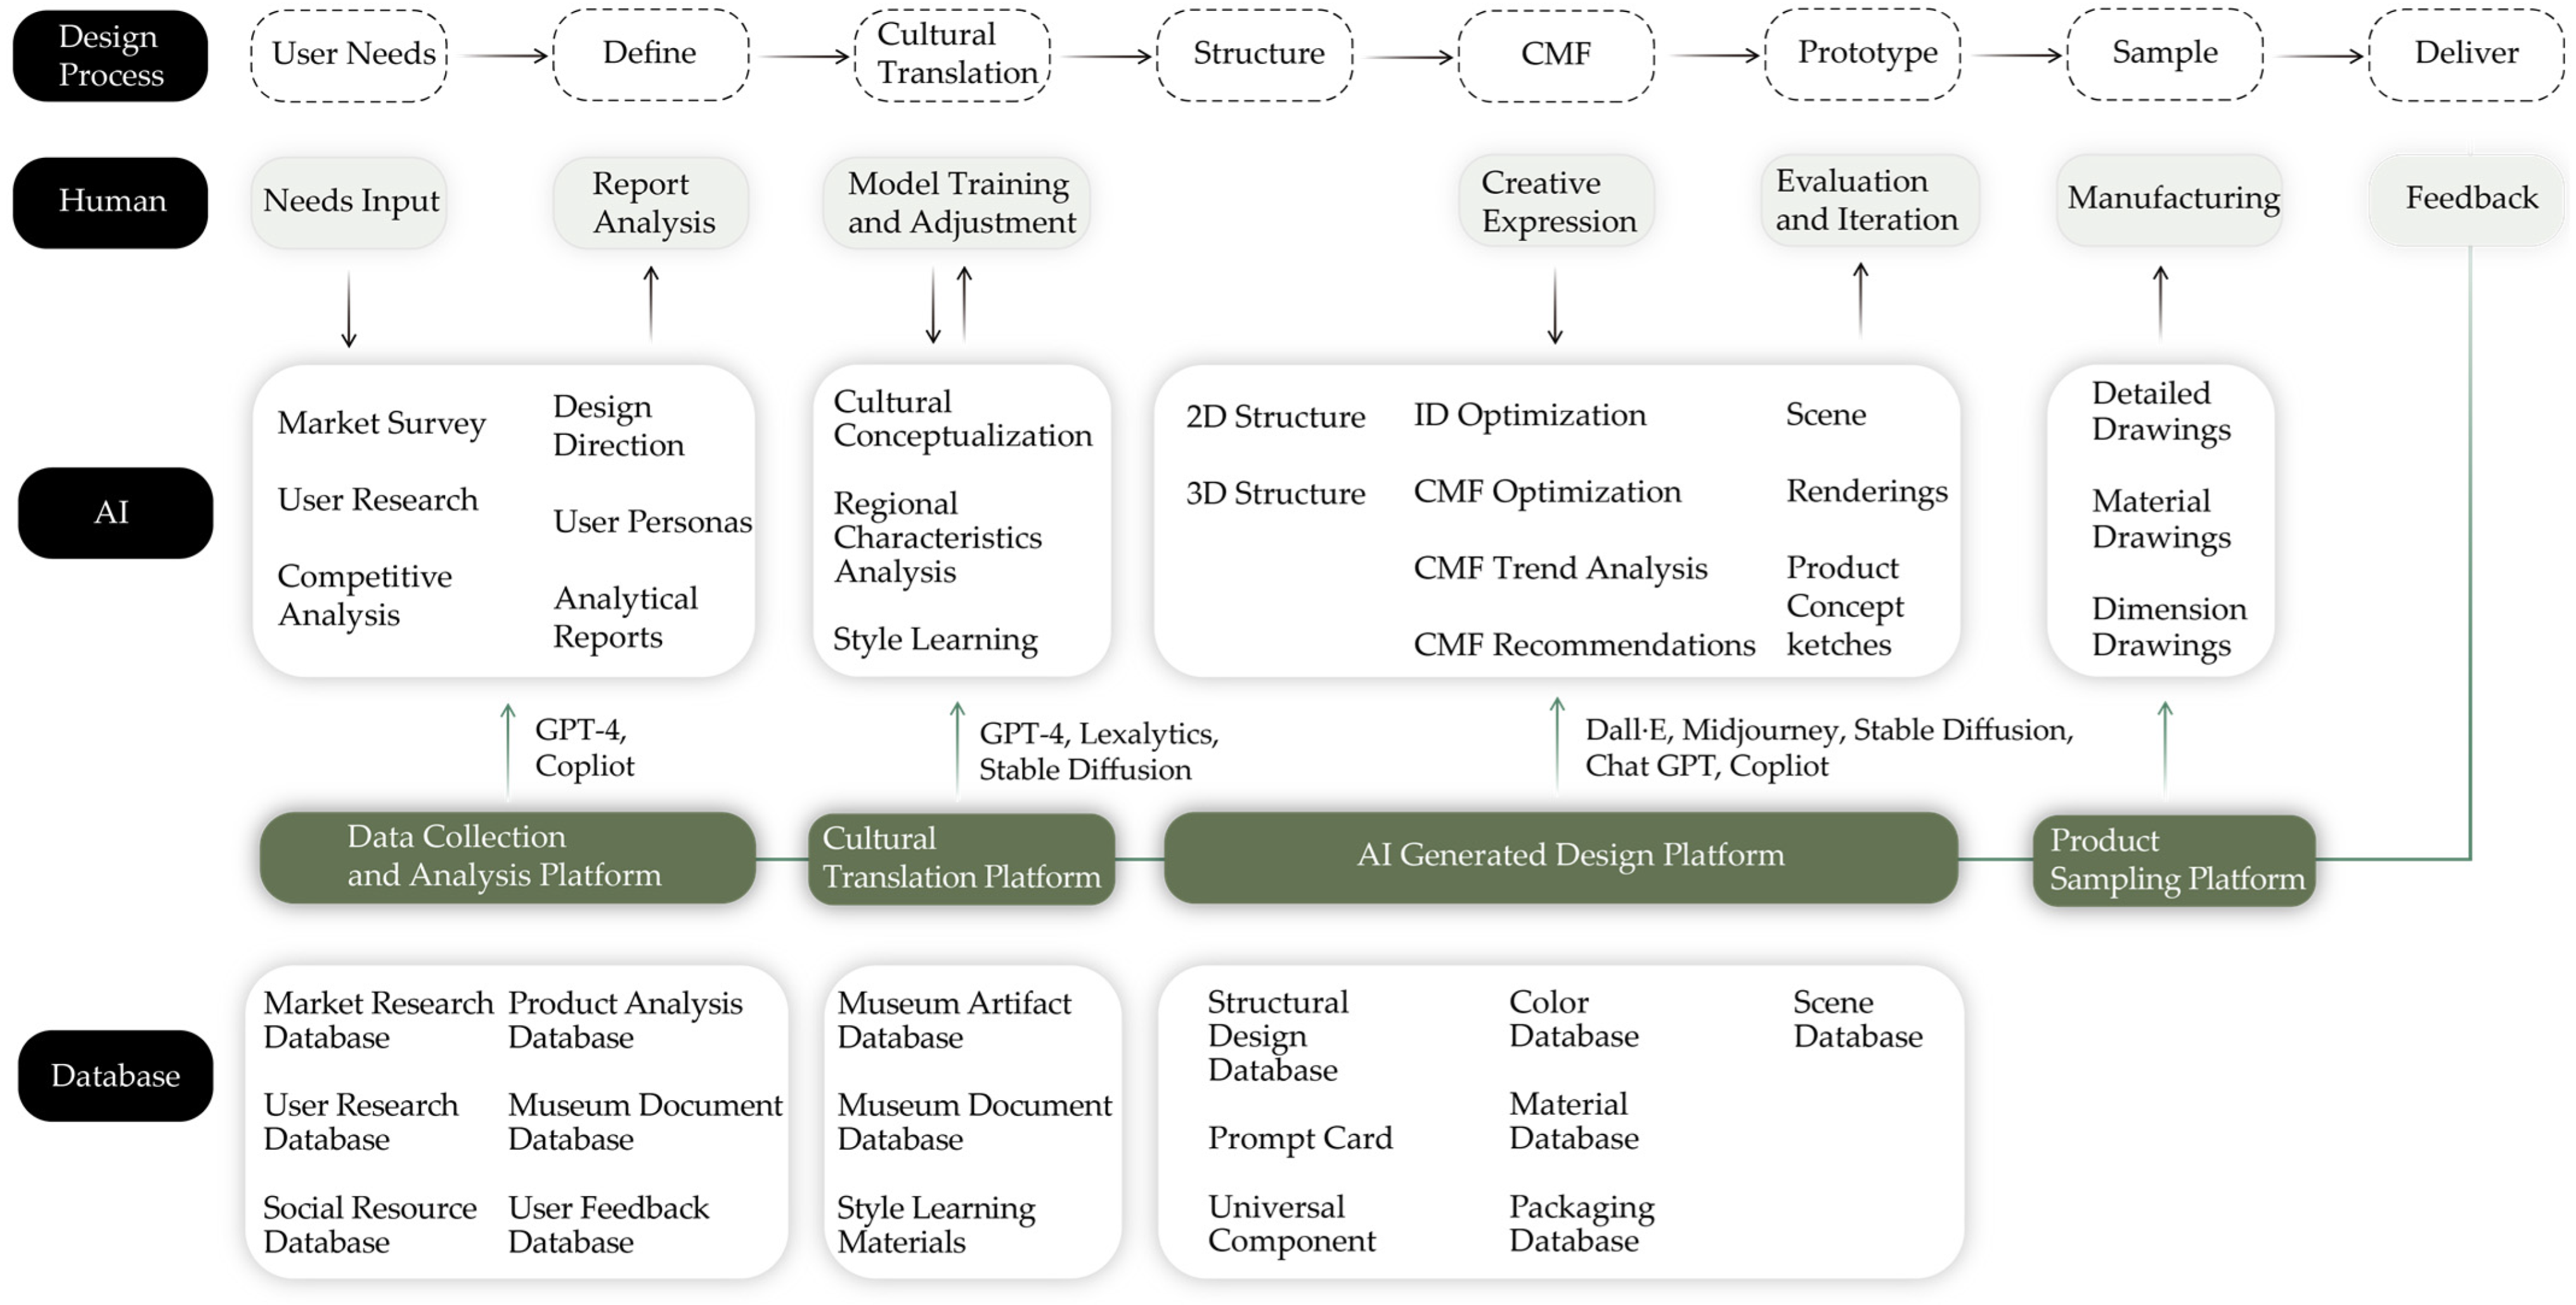
5.3. Building an MCCP Design Platform with AI Full-Process Participation

Incorporating these two recommendations, we should develop a systematic approach throughout the design process to ensure overall consumer satisfaction with AI-generated MCCP design. The design of MCCPs should leverage AI to achieve comprehensive intelligent design services throughout the entire process, rather than focusing solely on specific stages such as product concept design. AI should be integrated into the design and development cycle, encompassing design analysis, generation, manufacturing, and evaluation feedback. This integration unifies designers, engineers, manufacturers, and consumers into a single system, transitioning from a traditional participatory design to an AI and data-driven innovation model. Building an MCCP design platform with full AI participation throughout the process will enhance the efficiency of the design and service management processes, thereby improving user experience. This study proposes the development of a comprehensive AI-driven platform for MCCP design to deliver design services throughout the entire product lifecycle. This includes understanding demand, definition, cultural translation, structural design, color, material, and finish (CMF), prototype generation, sampling, and delivery testing (see Figure 10).
The development of a comprehensive AI-driven platform for MCCP design entails the creation of AI service sub-platforms and the construction of resource databases. The platform comprises the four following key sub-platforms: a data collection and analysis platform, a cultural translation platform, an AI-generated design platform, and a product sampling platform. In the stages of demand understanding and definition, the data collection and analysis platform leverages its robust information-processing capabilities to assist designers in extracting valuable insights from vast datasets, thereby providing critical support for design. Utilizing machine learning and data mining techniques, this platform supports market research, user needs prediction, and targeted product development. In the cultural translation stage, the cultural data translation platform, derived from the museum’s multimodal cultural data asset library, underpins the design generation sub-platform. By employing AI image-processing methods, this platform digitizes collection images and extracts essential cultural features such as colors, lines, and textures from artifacts. These styles are then applied to images to generate design materials that reflect distinctive regional cultural characteristics. Designers can evaluate and refine these designs based on their aesthetic and professional expertise, thereby producing works that resonate with the local cultural and aesthetic preferences. During the prototype generation stage, designers utilize the AI-generated design platform to fine-tune the design parameters and produce various design schemes, aiding informed design decision making. In the production stage, designers transfer the finalized design data to the product sampling platform, where the manufacturers execute the sampling process. After product delivery, consumer feedback is fed back to the data collection and analysis platform, facilitating continuous iterations in product design.
The development of a resource database involves data extraction, transformation, and loading. The resource database serves as the underlying data support for the AI service platform, enhancing the design capabilities by enriching the database resources. This includes the museum multimodal cultural database, color resource database, material resource database, process resource database, generative design cue word model database, user needs database, and feedback database. Data extraction gathers information from sources such as museum literature, digitized collection data, user feedback, demand surveys, AI Q&A systems, market research, and supply chain data. During the data transformation stage, market survey data, user survey records, product sample data, and the museum’s cultural element data are integrated into a unified database for analysis in cultural and creative product design. Subsequently, the data loading process imports the processed data into the corresponding AI service sub-platform, enhancing AI data generation capabilities and providing designers with effective design resources, thereby promoting design development.
In summary, the intelligent design of MCCPs is not only concerned with the appearance design of products, but also with full-process management work based on data analysis. By building an MCCP design platform with full-process AI participation, AI can become a partner for designers, engaging in the entire creative design process to achieve the transformation from intermittent to continuous and proactive interaction. This approach enhances personalization and consumer satisfaction and promotes intelligent innovation and sustainable development in the design of these products.

6. Discussion and Conclusions

This study employed the Importance–Performance Analysis (IPA) method to systematically evaluate consumer satisfaction with AI-generated MCCP design. The findings highlighted two main points. First, consumers expressed high satisfaction with the functionality and creativity of the AI-generated designs, particularly in terms of modeling, color, and patterns. This indicates that AI has a significant advantage in enhancing design efficiency and creative expression. However, consumers expressed lower satisfaction with the cultural expressiveness and user experience of these products. Factors such as regional cultural perception, emotional resonance, and personalization were key negative influences on consumer satisfaction. These findings highlight the limitations of AI in deeply integrating cultural elements and performing emotional analyses, which has resulted in AI-generated MCCPs falling short of consumer expectations. Based on these findings, this study identifies key directions for future improvements in AI-generated MCCP design practices. Specifically, efforts should concentrate on enhancing AI’s capabilities in emotional analysis and cultural translation. This includes constructing a multimodal museum database to improve AI’s cultural understanding, developing structured prompt models to enhance semantic comprehension, and creating an AI-driven MCCP design platform with full-process participation to foster intelligent innovation. Specifically, efforts should concentrate on enhancing AI’s capabilities in emotional analysis and cultural translation. This includes constructing a multimodal museum database to improve AI’s cultural understanding, developing structured prompt models to enhance semantic comprehension, and creating an AI-driven MCCPs design platform with full process participation to foster intelligent innovation. These strategies are anticipated to enhance the cultural value and design quality of the products, thereby better meeting consumer expectations. The findings provide valuable theoretical insights and practical guidance for advancing the design of AI-generated MCCPs and facilitate the comprehensive application of AI technology in the cultural creative sector, thereby promoting the sustainable development of cultural heritage.
Previous research has predominantly focused on the application of AI technology to innovate these product designs. For instance, improving design efficiency [14,15] and enhancing design creativity [16] through AI. However, research that focuses solely on technical applications cannot ensure that AI-generated designs fully meet user expectations and needs. In comparison with existing studies, we conducted a systematic evaluation of consumer satisfaction with these AI-generated designs and proposed targeted improvement strategies. This constitutes a significant contribution to the existing interdisciplinary research framework of AI and MCCP design, addressing certain shortcomings of the current research. Additionally, our study expands the application of the IPA model and perceived value theory by incorporating them into the evaluation of consumer satisfaction with AI-generated MCCPs. This offers new perspectives and evidence for the practical application of these theories in the field of AI-generated design.
Furthermore, our research makes significant contributions to design practices. For designers, these strategies provide a complementary approach that broadens their perspectives and supports their design processes. During the development of this project, we observed that some designers recognized the importance of improving consumer satisfaction. However, they often struggled to identify specific factors that affect consumer satisfaction, making it challenging to develop concrete design strategies to guide their work. The proposed strategies offer designers a systematic approach that enhances both the efficiency and creativity of utilizing AI in design.
This study has certain limitations. First, this research is limited to data collection and analysis of the Dunhuang Museum and common types of MCCP design. Different cultural regions and wider variety of products may yield different results. Therefore, future research should expand its scope to include various types of products and cultural elements from different regions, to improve the generalizability and applicability of the findings. Second, in this study, the factors influencing customer satisfaction were identified using qualitative methods, such as user interviews, and a corresponding evaluation index system was developed. However, these methods may not have fully captured consumer behaviors and needs, leading to certain limitations in the existing index system. By leveraging emerging technologies, such as deep learning, deeper insights into consumer behavior patterns and preferences can be obtained [79]. Therefore, future research should consider integrating these new technologies into the construction of the customer satisfaction evaluation index system to enhance and further optimize it. In addition, there are certain limitations in the research design. Although the selected cultural samples are representative, they do not comprehensively cover all artistic styles of the Dunhuang Flying Apsaras murals. The limitations in sample size and source may affect the generalizability of the research findings. While the Stable Diffusion tool offers a high controllability, it may not fully capture the complex details and cultural connotations of the murals, and the label generation and adjustment tools may introduce errors. Furthermore, the quality of the generated designs could be influenced by factors such as the quality of the sketches, the prompt words, and the parameter settings, which may, in turn, affect the final design quality. Therefore, future improvements in sampling methods, tool usage, and experimental design will be key to enhancing the validity and applicability of this research.

Author Contributions

Conceptualization, H.L.; data curation, Y.Z. and Q.G.; formal analysis, J.W.; funding acquisition, M.S. and W.L.; investigation, H.L., Y.Z. and M.S.; methodology, H.L.; Project administration, M.S. and W.L.; resources, Q.G. and J.W.; supervision, W.L.; visualization, Y.Z.; writing—original draft, H.L.; writing—review and editing, H.L. and M.S. All authors have read and agreed to the published version of the manuscript.

Funding

This research was funded by the 2023 Major Project Fund for Humanities and Social Sciences Research from the Hebei Provincial Department of Education, grant number ZD202327.

Institutional Review Board Statement

This research was approved by School of Art and Design, Wuhan University of Technology.

Informed Consent Statement

Informed consent was obtained from all participants involved in the study.

Data Availability Statement

Data are contained within the article.

Acknowledgments

The authors thank all the designers and experts who provided the images for this study.

Conflicts of Interest

The authors declare no conflict of interest.

Appendix A

Appendix A.1. Questionnaire: Part_01: Demographic Information

1.
Your Age:
  • [ ] 18–24  [ ] 25–30 [ ] 31–35
2.
Your Gender:
  • [ ] Male [ ] Female
3.
Highest level of education:
  • [ ] High school and below [ ] Junior college
  • [ ] Bachelor       [ ] Master or above
4.
How often do you buy cultural and creative products in a year?
  • [ ] 1–3 [ ] 4–6 [ ] 7 or above
5.
How much do you think you know about Dunhuang culture? (1 is the lowest, 5 is the highest):
  • [ ] 1 [ ] 2 [ ] 3 [ ] 4 [ ] 5
6.
What is the cognitive level of AI Art? (1 is the lowest, 5 is the highest)
  • [ ] 1 [ ] 2 [ ] 3 [ ] 4 [ ] 5
7.
How interested are you in AI art? (1 is the lowest, 5 is the highest)
  • [ ] 1 [ ] 2 [ ] 3 [ ] 4 [ ] 5

Appendix A.2. Questionnaire: Part_02: The Measurement of the Consumer Satisfaction with AI-Generated Museum Cultural and Creative Designs

Please rate the importance and satisfaction of each of the following items from 1 (Strongly Disagree) to 5 (Strongly Agree), based on your true feelings about the above AI-generated museum cultural and creative products.
NoQuestionImportance
How Important Do You Consider the Following Elements for Museum Cultural and Creative Product Design?Extremely UnimportantUnimportantNeutralVery ImportantVery Important
1Clearly functional
2Simple and practical
3Memorial value
4Modeling
5Color
6Graphics
7Material
8Regional culture
9Cultural heritage
10Historical culture
11Emotional resonance
12Aesthetic preferences
13Personalization
14Social fulfillment
NoQuestionSatisfaction
For the Design of this Museum’s Cultural and Creative Products, How Do You Feel about the Experience of the Following Elements?Very DissatisfiedDissatisfiedNeutralSatisfiedVery Satisfied
1Clearly functional
2Simple and practical
3Memorial value
4Modeling
5Color
6Graphics
7Material
8Regional culture
9Cultural heritage
10Historical culture
11Emotional resonance
12Aesthetic preferences
13Personalization
14Social fulfillment

References

  1. Li, Z.; Shu, S.; Shao, J.; Booth, E.; Morrison, A.M. Innovative or Not? The Effects of Consumer Perceived Value on Purchase Intentions for the Palace Museum’s Cultural and Creative Products. Sustainability 2021, 13, 2412. [Google Scholar] [CrossRef]
  2. Liu, H.; Zainal Abidin, S.N. A Systematic Review on the Sustainable Development of Museum Cultural and Creative Products. In Handbook of Research on Issues, Challenges, and Opportunities in Sustainable Architecture, 2nd ed.; Ng, V.F.P., Srirangam, S., Zainal Abidin, S.N., Eds.; IGI Global: Hershey, PA, USA, 2022; pp. 126–138. [Google Scholar]
  3. Tu, J.-C.; Liu, L.-X.; Cui, Y. A Study on Consumers’ Preferences for the Palace Museum’s Cultural and Creative Products from the Perspective of Cultural Sustainability. Sustainability 2019, 11, 3502. [Google Scholar] [CrossRef]
  4. Huang, H.; Chen, H.; Zhan, Y. A Study on Consumers’ Perceptions of Museum Cultural and Creative Products through Online Textual Reviews: An Example from Palace Museum’s Cultural and Creative Flagship Store. Behav. Sci. 2023, 13, 318. [Google Scholar] [CrossRef] [PubMed]
  5. Geng, C.; Lu, C.L. Study on the Consumption Accessibility of Museum Cultural and Creative Products and Its Influencing Factors: Taking Hubei Provincial Museum and Wuhan Museum as Examples. Southeast Cult. 2024, 1, 179–189. [Google Scholar]
  6. Zhao, Y.; Zeng, J.Y.; Zhang, Y.H.; Yu, J.Y. Research on the design strategy and application of cultural IP in museums. Highlights Art Des. 2023, 2, 89–93. [Google Scholar] [CrossRef]
  7. Dalle Nogare, C.; Murzyn-Kupisz, M. Do museums foster innovation through engagement with the cultural and creative industries? J. Cult. Econ. 2021, 45, 671–704. [Google Scholar] [CrossRef]
  8. Zhang, Y.; Ji, N.; Zhu, X.; Zhao, Y. Inheritance and Revitalization: Exploring the Synergy between AIGC Technologies and Chinese Traditional Culture. In Proceedings of the AI-generated Content, Singapore, 24 April 2024. [Google Scholar] [CrossRef]
  9. Song, Y.; Qian, X.S.; Peng, L.Y.; YE, Z.H.; Qin, J.Y. AIGC Chinese Aesthetics Cultural and Creative Design Research. Packag. Eng. 2023, 44, 1–8. [Google Scholar] [CrossRef]
  10. Xu, J.; Cheng, W.; Gao, Y.; Wang, X.; Gao, S.; Shan, Y. Instant Mesh: Efficient 3D Mesh Generation from a Single Image with Sparse-view Large Reconstruction Models. arXiv 2024. [Google Scholar] [CrossRef]
  11. Lv, J.F.; Sun, L. Opportunities and Challenges of Artificial Intelligence Generated Content Enabling Innovative Product Design Processes. Chin. Art 2024, 1, 28–37. [Google Scholar]
  12. Zhang, W. Research on the application of generative artificial intelligence in the development of cultural and creative products. J. Jiangsu Second Norm. Univ. 2024, 2, 13–18. [Google Scholar]
  13. Chamberlain, R.; Mullin, C.; Scheerlinck, B.; Wagemans, J. Putting the art in artificial: Aesthetic responses to computer-generated art. Psychol. Aesthet. Creat. Arts 2018, 12, 177–192. [Google Scholar] [CrossRef]
  14. Lyu, Y.; Shi, M.; Zhang, Y.; Lin, R. From Image to Imagination: Exploring the Impact of Generative AI on Cultural Translation in Jewelry Design. Sustainability 2024, 16, 65. [Google Scholar] [CrossRef]
  15. Zhou, E.; Lee, D. Generative artificial intelligence, human creativity, and art. Proc. Natl. Acad. Sci. USA Nexus 2024, 03, 052. [Google Scholar] [CrossRef] [PubMed]
  16. Zhang, B.; Romainoor, N.H. Research on Artificial Intelligence in New Year Prints: The Application of the Generated Pop Art Style Images on Cultural and Creative Products. Appl. Sci. 2023, 13, 1082. [Google Scholar] [CrossRef]
  17. Zhao, W.Q.; Zang, X.C. Design of Cultural and Creative Products Based on the Combination of Pierce Semiotics and AIGC. Packag. Eng. 2024, 45, 116–126. [Google Scholar] [CrossRef]
  18. Yuan, L. Research on the application of AIGC technology in the design of cultural and creative products in museums. J. Shoes Technol. Des. 2023, 3, 42–44. [Google Scholar]
  19. Zhang, B.L.; Cheng, P.; Deng, L.J.; Romainoor, N.H.; Han, J.H.; Luo, G.S.; Gao, T.B. Can AI-generated art stimulate the sustainability of intangible cultural heritage? A quantitative research on cultural and creative products of New Year Prints generated by AI. Heliyon 2023, 9, e20477. [Google Scholar] [CrossRef]
  20. Woodruff, R.B.; Gardial, S.F. Know Your Customer: New Approaches to Customer Value and Satisfaction, 1st ed.; Blackwell: Cambridge, UK, 1996; pp. 54–59. [Google Scholar]
  21. Liu, S.; Song, C. Consumer Satisfaction Research on Archive Cultural and Creative Products Based on the SOR Model. Product. Res. 2024, 8, 96–100. [Google Scholar] [CrossRef]
  22. Ge, Y.; Xie, S.Y. Analysis of Factors Influencing User Satisfaction with Archival Cultural and Creative Products: A Grounded Theory Approach Based on the Puzzle Book The Seventh Archive Room. Arch. Constr. 2022, 11, 56–59. [Google Scholar]
  23. Chai, C.; Bao, D.; Sun, L.; Cao, Y. The Relative Effects of Different Dimensions of Traditional Cultural Elements on Customer Product Satisfaction. Int. J. Ind. Ergon. 2015, 48, 77–88. [Google Scholar] [CrossRef]
  24. Wang, W. The Application of KANO Model in the Design of Cultural Creative Products. Appl. Math. Nonlinear Sci. 2023, 8, 1851–1858. [Google Scholar] [CrossRef]
  25. Li, Y.Q.; Ma, L.M.; Du, S.L. Exploring Online Sales Satisfaction of Guochao Cultural Creative Products Based on ROST Text Mining Software. Exhib. Econ. 2024, 3, 114–117. [Google Scholar] [CrossRef]
  26. Sun, Y. Design and Purchase Intention Analysis of Cultural and Creative Goods Based on Deep Learning Neural Networks. Comput. Intell. Neurosci. 2022, 2022, 3234375. [Google Scholar] [CrossRef] [PubMed]
  27. Guo, M.N. Perceived Values and Purchase Intention of Museum Cultural and Creative Products. Packag. Eng. 2018, 39, 223–227. [Google Scholar] [CrossRef]
  28. Guo, T.; Li, N. Study on Tourists’ Consumption Intention of Cultural and Creative Products under the Perspective of Perceived Value. Econ. Forum. 2022, 12, 38–46. [Google Scholar]
  29. Zhou, Y.Q.; Song, Y.H. Research on the Influence of Brand and Packaging of Cultural and Creative Products on Consumer Purchasing Behavior: The Mediating Role of Consumer Satisfaction. Art Des. Theor. 2024, 6, 89–93. [Google Scholar]
  30. Li, Y.; Li, J. The Influence of Design Aesthetics on Consumers’ Purchase Intention Toward Cultural and Creative Products: Evidence from the Palace Museum in China. Front. Psychol. 2022, 13, 939403. [Google Scholar] [CrossRef]
  31. CAI, X.Q.; LI, Z.J.; XI, M.Y. Costume Pattern Sketch Colorization and Style Transfer Based on Neural Network. J. Syst. Simul. 2023, 35, 604–615. [Google Scholar]
  32. Goodfellow, I.; Pouget-Abadie, J.; Mirza, M.; Xu, B.; Warde-Farley, D.; Ozair, S.; Courville, A.; Bengio, Y. Generative Adversarial Nets. In Proceedings of the 27th Advances in Neural Information Processing Systems, Montreal, QC, Canada, 8–13 December 2014. [Google Scholar] [CrossRef]
  33. ELGAMMAL, A.; Liu, B.; ELHOSEINY, M. Can: Creative Adversarial Networks, Generating “Art” by Learning about Styles and Deviating from Style Norms. In Proceedings of the Advances in Neural Information Processing Systems 2017, Long Beach, CA, USA, 4–9 December 2017. [Google Scholar]
  34. Ho, J.; Jain, A.; Abbel, P. Denoising Diffusion Probabilistic Models. In Proceedings of the Advances in Neural Information Processing Systems, Online, 6–12 December 2020. [Google Scholar] [CrossRef]
  35. Rombach, R.; Blattmann, A.; Lorenz, D.; Esser, P.; Ommer, B.; Ieee Comp, S.O.C. High-Resolution Image Synthesis with Latent Diffusion Models. In Proceedings of the IEEE/CVF Conference on Computer Vision and Pattern Recognition, New Orleans, LA, USA, 13 April 2022. [Google Scholar] [CrossRef]
  36. Liu, Y.H.; Li, W.J.; Ji, T. Review of Research on Generative Product Design Abroad. Packag. Eng. 2021, 42, 9–27. [Google Scholar]
  37. Zhang, F.; Su, Y.; Cui, Q. Research on Generative Design of Traditional Clothing Patterns. Packag. Eng. 2023, 44, 1–8. [Google Scholar]
  38. Jia, L.; Jing, Z. Innovative Design and Digital Promotion of Shu Embroidery AIGC under the Threshold of Aesthetic Education. Packag. Eng. 2024, 45, 485–490. [Google Scholar] [CrossRef]
  39. Wang, X.H.; Qin, J.Y.; Quan, H.C. Cultural and Creative Product Design Method Based on AI Painting. Packag. Eng. 2020, 41, 7–12. [Google Scholar] [CrossRef]
  40. Zeithaml, V.A. Consumer Perceptions of Price, Quality, and Value: A Means-End Model and Synthesis of Evidence. J. Mark. 1988, 52, 2–22. [Google Scholar] [CrossRef]
  41. Ha, J.; Jang, S. Perceived values, satisfaction, and behavioral intentions: The role of familiarity in Korean restaurants. Int. J. Hosp. 2010, 29, 2–13. [Google Scholar] [CrossRef]
  42. Eggert, A.; Ulaga, W. Customer-perceived value: A substitute for satisfaction in business markets? J. Bus. Ind. Mark. 2002, 17, 107–118. [Google Scholar] [CrossRef]
  43. Lam, S.Y.; Shankar, V.; Erramilli, M.K.; Murthy, B. Customer value, satisfaction, loyalty, and switching costs: An illustration from a business-to-business service context. J. Acad. Mark. Sci. 2004, 32, 293–311. [Google Scholar] [CrossRef]
  44. Gong, J.X. A study on the relationship between perceived value, satisfaction and behavioral intention of tourists in historical and cultural towns: The case of Shawan Ancient Town. Tourism 2021, 15, 5–9. [Google Scholar]
  45. Kacen, J.J.; Lee, J.A. The Influence of Culture on Consumer Impulsive Buying Behavior. J. Consum. Psychol. 2002, 12, 163–176. [Google Scholar] [CrossRef]
  46. Sheth, J.N.; Newman, B.I.; Gross, B.L. Why We Buy What We Buy: A Theory of Consumption Values. J. Bus. Res. 1991, 22, 159–170. [Google Scholar] [CrossRef]
  47. Sweeney, J.C.; Soutar, G.N. Consumer perceived value: The development of a multiple item scale. J. Retail. 2001, 77, 203–220. [Google Scholar] [CrossRef]
  48. Tian, C.Y.; Pei, Z.B. Study on the Relationship between Visitors’ Perceived Value, Satisfaction and Loyalty in Cultural Heritage Sites: An Empirical Analysis Based on the Yuanmingyuan Garden in Beijing. J. Arid Land Resour. Environ. 2021, 35, 203–208. [Google Scholar]
  49. Fu, Y.; Liu, X.M.; Wang, Y.Q.; Chao, R.F. How experiential consumption moderates the effects of souvenir authenticity on behavioral intention through perceived value. Tour. Manag. 2018, 69, 356–367. [Google Scholar] [CrossRef]
  50. Deng, W.W.; Lu, C.B.; Lin, Y.X.; Chen, W. A study on the effect of tourists value co-creation on the perceived value of souvenirs: Mediating role of psychological ownership and authenticity. Asia Pac. J. Tour. Res. 2021, 26, 200–214. [Google Scholar] [CrossRef]
  51. Martilla, J.A.; James, J.C. Importance-Performance Analysis. J. Mark. 1977, 41, 77–79. [Google Scholar] [CrossRef]
  52. Simpson, G.D.; Parker, J. Data for an Importance-Performance Analysis (IPA) of a Public Green Infrastructure and Urban Nature Space in Perth, Western Australia. Data 2018, 3, 69. [Google Scholar] [CrossRef]
  53. Xia, H.; Song, F.; Li, K.Z. SOHO desk design based on integrated fuzzy KANO-IPA analysis. For. Ind. 2023, 60, 47–53. [Google Scholar]
  54. Sun, H.; Ong, S.K.; Nee, A.Y.C.; Guo, W.A. Customer requirements analysis method of considering product scenarios for improving product design. J. Eng. Des. 2023, 34, 339–362. [Google Scholar] [CrossRef]
  55. Xu, H.; Song, H.-y. Key Factors Influencing Chinese Consumers’ Demand for Naturally Dyed Garments: Data Analysis through KJ Method and KANO Model. Sustainability 2024, 16, 1189. [Google Scholar] [CrossRef]
  56. Li, P. Cultural Communication in Museums: A Perspective of the Visitor Experience. PLoS ONE 2024, 19, e0303026. [Google Scholar] [CrossRef]
  57. Seidman, I. Interviewing as Qualitative Research: A Guide for Researchers in Education and the Social Sciences, 3rd ed.; Teachers College Press: New York, USA, 2006; pp. 154–196. [Google Scholar]
  58. Colaizzi, P.F. Psychological Research as the Phenomenologist’s View It; Oxford University Press: New York, NY, USA, 1978; Available online: https://www.scirp.org/reference/referencespapers?referenceid=573953 (accessed on 26 July 2024).
  59. Gensler, S.; Völckner, F.; Egger, M.; Fischbach, K.; Schoder, D. Listen to Your Customers: Insights into Brand Image Using Online Consumer-Generated Product Reviews. Int. J. Electron. Commer. 2015, 20, 112–141. [Google Scholar] [CrossRef]
  60. Wen, Y.; Li, W. A study on the perceived imagery of red cultural and creative users’ purchase based on the KJ method. Design 2021, 34, 104–106. [Google Scholar]
  61. Xie, T. Design and development of library cultural and creative products based on KJ method and KANO model. Shanxi Libr. J. 2023, 1, 55–63. [Google Scholar]
  62. Powell, C. The Delphi Technique: Myths and Realities. J. Adv. Nurs. 2003, 41, 376–382. [Google Scholar] [CrossRef] [PubMed]
  63. Zhou, Z.; Li, L. Vision and Site: Revisiting a Pure Land Cave of Dunhuang. Religions 2024, 15, 329. [Google Scholar] [CrossRef]
  64. Zheng, N.; Mu, P.A. Colored Fabric Defect Detection Based on Gaussian Pyramid and Visual Saliency. Packag. Eng. 2020, 41, 247–252. [Google Scholar] [CrossRef]
  65. Li, X.D.; Zhou, L.H. Calculation Method of Adaptive Threshold for Open Set Voiceprint Recognition Based on Otsu Algorithm. J. Jilin Univ. (Sci. Ed.) 2021, 04, 909–914. [Google Scholar] [CrossRef]
  66. Sitaridis, I.; Kitsios, F. Course Experience Evaluation using Importance-Performance Analysis. In Proceedings of the 2019 IEEE Global Engineering Education Conference (EDUCON), Dubai, United Arab Emirates, 8–11 April 2019; pp. 859–862. [Google Scholar] [CrossRef]
  67. Sullivan, G.M.; Artino, A.R., Jr. Analyzing and interpreting data from Likert-type scales. J. Grad. Med. Educ. 2013, 05, 541–542. [Google Scholar] [CrossRef]
  68. Wang, P. Research on the Influencing Factors of Consumption Willingness of Museum Cultural and Creative Products. Master’s Thesis, Minzu University of China, Beijing, China, 2020. [Google Scholar] [CrossRef]
  69. Vaske, J.J.; Beaman, J.; Sponarski, C.C. Rethinking Internal Consistency in Cronbach’s Alpha. Leisure Sci. 2017, 39, 163–173. [Google Scholar] [CrossRef]
  70. Hossain, G. Rethinking Self-Reported Measures in Subjective Evaluation of Assistive Technology. Hum. Cent. Comput. Inf. Sci. 2017, 7, 23. [Google Scholar] [CrossRef]
  71. Stevens, J.P.; Stevens, J.P. Applied Multivariate Statistics for the Social Sciences, 4th ed.; Psychology Press: London, UK, 2001. [Google Scholar] [CrossRef]
  72. Cascini, G.; O’Hare, J.; Dekoninck, E.; Becattini, N.; Boujut, J.F.; Ben Guefrache, F.; Carli, I.; Caruso, G.; Giunta, L.; Morosi, F. Exploring the Use of AR Technology for Co-Creative Product and Packaging Design. Comput. Ind. 2020, 123, 103308. [Google Scholar] [CrossRef]
  73. Tang, W.L.; Zhou, T.; Cao, C.G. Application and Optimisation Strategy of Artificial Intelligence in Art Design. Shanghai Pack. 2023, 8, 23–25. [Google Scholar] [CrossRef]
  74. Chen, L.F.; Xiang, A.L.; Shen, Y. The Road to Integration: Opportunities and Challenges for AIGC in Chinese Art and Design. Chin. Art 2023, 05, 36–44. [Google Scholar]
  75. Xu, C.; Du, X.; Yu, K. Challenges and Strategies in the Application of AIGC in the Design Industry. Artif. Intell. 2023, 4, 51–60. [Google Scholar]
  76. Dubberly, H.; Pangaro, P. How Might We Help Designers Understand Systems? She Ji J. Des. Econ. Innov. 2023, 9, 135–156. [Google Scholar] [CrossRef]
  77. Verheijden, M.P.; Funk, M. Collaborative Diffusion: Boosting Designerly Co-Creation with Generative AI. In Proceedings of the Extended Abstracts of the 2023 CHI Conference on Human Factors in Computing Systems, Hamburg, Germany, 23–28 April 2023. [Google Scholar] [CrossRef]
  78. Artificial Intelligence in the Industrial Design Process. Available online: https://hj.diva-portal.org/smash/record.jsf?pid=diva2%3A1769813&dswid=-3529 (accessed on 22 July 2024).
  79. Xu, A.; Li, Y.; Donta, P.K. Marketing Decision Model and Consumer Behavior Prediction with Deep Learning. J. Organ. End User Comput. 2024, 36, 1–25. [Google Scholar] [CrossRef]
Figure 1. Research methods and structure.
Sustainability 16 08203 g001
Figure 2. Example of a collection form for a visual sample of MCCPs (partial).
Sustainability 16 08203 g002
Figure 3. Satisfaction evaluation index system for MCCP design.
Sustainability 16 08203 g003
Figure 4. AI-generated design process for MCCPs.
Sustainability 16 08203 g004
Figure 5. Dunhuang Flying Apsaras culture sample (partial).
Sustainability 16 08203 g005
Figure 6. Pyramid model diagram.
Sustainability 16 08203 g006
Figure 7. AI-generated MCCPs designed by researchers: (a) figurine; (b) hand fan; (c) jigsaw puzzle; (d) key chain; and (e) silk scarf.
Sustainability 16 08203 g007
Figure 8. Consumer satisfaction IPA matrix for AI-generated MCCPs.
Sustainability 16 08203 g008
Figure 9. Structured Prompt Card Models.
Sustainability 16 08203 g009
Figure 10. AI full-process participation design platform framework.
Sustainability 16 08203 g010
Table 1. Interview outline.
NumberQuestion
1When you see these museum cultural products, what is your first reaction?
2Could you select a few products that you find satisfactory and share your thoughts or feelings about them?
3What aspects of these products do you like the most? What feelings or associations do these aspects evoke in you?
4Are there any aspects you are not satisfied with? What factors influenced your level of satisfaction?
5Would you consider purchasing these products? What influenced your decision to buy or not buy them?
Table 2. Clustering keywords using the KJ method (partial).
Key Terms After KJ Method ClassificationExtracted Key PhrasesOriginal Interview Contents
Reasonable Price
Regional Culture
Modern Aesthetics
Social Media
Interest
Material
Reflection of Cultural
Unique Styling Design
Acceptable Price
Suitable for a Wide Range of People
U1: I believe the biggest feature of this cup from the Palace Museum is its expression of cultural elements through the shape of the vessel, allowing ordinary consumers to physically see and touch something that truly exists in the current trend of aesthetics.
U2: I really like this bookmark from the Sanxingdui Museum; it feels appropriate to buy it as a gift for friends.
U5: I know this cup is very popular online, with high sales; as a daily necessity, its target audience is broad, and its price is acceptable to most consumers.
SafetyMaterial is Important
Safety in Use
U7: I feel there is an issue with the material of this product from the Sanxingdui Museum; I am not satisfied, as it often oxidizes, and visually, it looks cheap and rough.
U7: This product emphasizes the process of excavating objects, which is very interesting. However, its container is made of asbestos, and I honestly doubt whether such a material is safe to use.
HandmadeSocial media
Gift Attributes
Fun in Use
U9: I like this pen holder’s design; its four legs are movable, allowing me to adjust them to my desired pose, which I find fun.
U32: I really like this bookmark from the Sanxingdui Museum; I feel this product uses the simplest form to express the cultural essence of Sanxingdui, making it suitable to buy as a gift for friends.
Table 3. Basic information on experts consulted.
ItemIndicatorFrequencyPercentage (%)
GenderMale240
Female360
Age30–39360
40–49120
50–59120
Education LevelBachelor’s Degree120
Master’s Degree240
Doctorate240
OccupationUniversity Professor360
Designer240
Table 4. Experiment participant profiles.
TeamParticipantsGenderFieldLevelAIGC Experience
Group A
(product types)
Designer A1MaleIndustrial DesignAdvancedExtensive
Designer A2FemaleProduct DesignIntermediateExtensive
Designer A3MaleProduct DesignAdvancedExtensive
Group B
(Product Materials)
Designer B1MaleTextile DesignIntermediateExtensive
Designer B2MaleVisual DesignAdvancedExtensive
Designer B3FemaleArts and CraftsAdvancedModerate
Table 5. Participant characteristics (n = 297).
MeasureItemsFrequencyPercentage
GenderMale12140.8%
Female17659.2%
Age18–2411839.7%
25–309732.7%
31–358227.6%
Education LevelHigh school and below3110.4%
Junior college7224.3%
Bachelor13946.8%
Master or above5518.5%
Purchase Frequency (per year)1–316756.2%
4–69431.7%
>73612.1%
Level of understanding in Dunhuang culture3.76
Level of cognitive in AI art and design3.38
Level of interest in AI art and design4.03
Table 6. Validity test.
KMO and the Bartlett’s TestItemsValue
KMO sampling adequacy 0.903
Bartlett’s sphericity testApproximate chi-square1760.459
df375
p-value0.000
Table 7. Factor loading coefficients.
NameFactor Loadings (Rotated)Communality
Factor1Factor2Factor3Factor4
Clearly functional 0.820 0.924
Simple and practical 0.780 0.929
Memorial value 0.630 0.865
Modeling 0.857 0.844
Color 0.892 0.899
Graphics 0.756 0.909
Material 0.833 0.746
Regional culture0.935 0.961
Cultural heritage0.908 0.945
Historical culture0.883 0.918
Emotional resonance 0.9230.949
Aesthetic preferences 0.8500.901
Personalization 0.9180.926
Social fulfillment 0.7630.815
Rotation method: Varimax.
Table 8. Evaluation results for the importance and satisfaction of the factor layer and IPA index.
Factor LayerImportanceSatisfactionI-P MD 2IPAI 3Satisfaction
AverageSD 1AverageSD 1
B1 Product functionality3.551.0143.330.9610.226.197Satisfied
B2 Creative attraction4.070.7184.150.646−0.08−1.965Very satisfied
B3 Cultural expression4.330.7783.241.2121.0925.173Dissatisfied
B4 User experience4.110.9323.100.9751.0124.574Dissatisfied
1 Standard deviation, 2 I-P mean difference, 3 IPA index.
Table 9. The evaluation results for importance and satisfaction of indicator layer and IPA index.
Factor LayerImportanceSatisfactionI-P MD 2IPAI 3Satisfaction
AverageSD 1AverageSD 1
C1 Clearly functional3.620.9973.280.9890.349.392Satisfied
C2 Simple and practical3.460.9813.230.9090.236.647Satisfied
C3 Memorial value3.580.9623.480.9780.12.793Very satisfied
C4 Modeling4.060.7274.190.601−0.13−3.201Very satisfied
C5 Color4.140.6594.270.598−0.13−3.141Very satisfied
C6 Graphics4.130.6764.070.7020.061.453Very satisfied
C7 Material3.920.7924.060.663−0.14−0.357Very satisfied
C8 Regional culture4.430.7023.160.5861.2728.668Dissatisfied
C9 Cultural heritage4.420.7013.431.0920.9922.398Dissatisfied
C10 Historical culture4.130.8853.121.4361.0124.455Dissatisfied
C11 Emotional resonance4.460.7043.030.9781.4332.062Very dissatisfied
C12 Aesthetic preferences4.160.8473.301.3391.1627.885Dissatisfied
C13 Personalization4.290.8752.950.6731.3431.235Very dissatisfied
C14 Social fulfillment3.520.9673.11.0350.4211.931Neutral
1 Standard deviation,2 I-P mean difference, 3 IPA index.
Disclaimer/Publisher’s Note: The statements, opinions and data contained in all publications are solely those of the individual author(s) and contributor(s) and not of MDPI and/or the editor(s). MDPI and/or the editor(s) disclaim responsibility for any injury to people or property resulting from any ideas, methods, instructions or products referred to in the content.

