Article

Experimental Study on Optimization of Consolidation Parameters of Silty Clay Based on Response Surface Methodology: A Case Study on the Protection and Restoration of the Ming and Qing Dynasty Hangzhou Seawall Site

1
School of Civil Engineering and Architecture, Zhejiang University of Science and Technology, Hangzhou 310023, China
2
Zhejiang-Singapore Joint Laboratory for Urban Renewal and Future City, Hangzhou 310023, China
*
Author to whom correspondence should be addressed.
Sustainability 2024, 16(18), 8219; https://doi.org/10.3390/su16188219
Submission received: 20 August 2024 / Revised: 13 September 2024 / Accepted: 18 September 2024 / Published: 21 September 2024

Abstract

:
The preservation of the ancient seawall site is a focal point and challenge in the protection of historical relics along Hangzhou’s Grand Canal in China. This endeavor holds significant historical and contemporary value in uncovering and perpetuating Hangzhou’s cultural heritage. Researchers investigating the Linping section of the seawall site aimed to address soil site deterioration by selecting environmentally friendly alkali-activated slag cementitious materials and applying the response surface method (RSM) to conduct solidification experiments on the seawall soil. Researchers used the results of unconfined compressive strength tests and microscopic electron microscopy analysis, considering the comprehensive performance of soil solidification mechanisms and mechanical properties, to establish a least-squares regression fitting model to optimize the solidification material process parameters. The experimental results indicate that the optimal mass ratio of lime, gypsum, and slag for achieving the best solidification process parameters for the seawall soil, with a 28-day curing period, is 1:1.9:6.2. This ratio was subsequently applied to the restoration and reconstruction of the seawall site, with parts of the restored seawall exhibited in a museum to promote the sustainable conservation of urban cultural heritage. This study provides theoretical support and practical guidance for the protection and restoration of soil sites.

1. Introduction

The Hangzhou seawall site stretches 317 km along both sides of the Qiantang River estuary, between the southern edge of the Taihu Lake Plain and the northern side of the Ningshao Plainin the southeast of China. It has witnessed coastal and urban changes, as well as agricultural and economic development since the Song Dynasty, and carries the cultural information of the history and development of the city [1]. From around 900 AD until the Qing Dynasty, continuous innovation in pond structures, protection facilities, defense strategies, and engineering design ensured the well-being of the local people and laid the foundation for national economic development [1,2].
As the inevitable intersection of the canal construction associated with the Beijing-Hangzhou Grand Canal Renovation Project and the seawall site, the government has decided to preserve the historical information and restore the appearance of the seawall through two approaches. The first approach involves cutting blocks of soil for museum exhibition, while the second involves reconstructing the seawall using historical construction techniques, followed by backfilling with soil to create a replica that preserves the original landscape. These measures aim to promote the understanding and transmission of the history and culture of Hangzhou while providing valuable resources for academic research and public education. Field investigation revealed that long-term weathering has caused surface chalking, flaky spalling, and loss of rammed earth at the soil site, seriously damaging its aesthetic appearance and mechanical properties. Selecting appropriate materials and processes is necessary to protect and repair the soil site, effectively preserving historical information and extending the life of the seawall site.
Appropriate soil solidification techniques can effectively restore the aesthetic appearance of soil sites and improve the mechanical properties and durability of the soil. Improving the structural integrity and strength of soil structures enhances their stability and seismic resistance in soil site preservation. Physical and chemical reinforcement techniques address common soil site deterioration issues, such as cracking and collapse. Physical reinforcement improves stress distribution within the soil by installing support structures, typically for large, easily dislodged soil masses, but this kind of method often alters the original appearance and historical value of the site, as the external structures can cause further damage. Additionally, these methods may fail to ensure long-term stability in preservation efforts. Chemical reinforcement enhances soil durability and stability through spraying or grouting techniques, suitable for structurally damaged soil surfaces. Most studies in the chemical reinforcement area focus on improving soil strength and stability by incorporating a single material [2,3,4] or one or more composite materials [5,6,7,8]. To minimize energy consumption and carbon dioxide emissions, promote resource recycling, and comply with soil site protection policies and regulations [9,10,11], researchers employed an alkali-activated slag cementitious material system [6,12,13], which is composed of slag (a by-product of steel production) [14], biodegradable gypsum, and lime with carbon sequestration capabilities [2,15]. This approach aims to restore the historic appearance of the soil site and improve its durability.
Although several studies have been conducted on restoring and preserving the seawall site in Hangzhou [2,16,17], identifying suitable solidification materials and construction techniques for reinforcing the seawall soil remains unresolved. When investigating the effects of multiple reinforcement materials on soil consolidation, the traditionally used orthogonal test method [18,19,20,21,22], while capable of studying the influence of multiple factors with relatively few tests [23], has limitations. It cannot clarify the interaction between factors or identify the optimal response value and the best combination of factors within the experimental range [24,25]. To optimize process parameters and achieve effective resource utilization, the response surface methodology [26,27], which effectively captures the interaction between factors, is used to determine the optimal factor parameters by fitting the functional relationship between factors and response values [25]. This method is widely used in materials science [28,29,30], bioengineering [31,32,33], and other fields but is less commonly applied to the configuration of process parameters for site soil curing materials, making its application in this context highly significant for research. Following the policies and regulations for soil site conservation in China [10,11], researchers applied the response surface methodology to optimize the formulation of alkali-activated slag cementitious solidified agents for reinforcing cultural heritage soils [13]. Efficiently using industrial waste in soil site restoration prevents solid waste from polluting the environment, promotes the long-term preservation of site soil in a conservation environment, and balances the preservation of historical and cultural heritage with modern urban development, thus promoting the harmonious coexistence of cultural heritage protection and sustainable development [19].

2. Experimental Materials

2.1. Soil Samples from Seawall Site

Following soil site restoration and stabilization requirements, researchers conducted a field investigation and sampling at the Linping section of the Hangzhou seawall site (Figure 1). Researchers tested the physical and chemical properties of the sampled soil under laboratory conditions and found that the soil at this site is a powdery clay. Table 1 presents the physical indicators.
The primary rock minerals and chemical components are listed in Table 2. The main mineral components of the site soil are quartz (SiO2, 65%), albite (Na2Al2Si6O16, 17%), muscovite (KAl3Si3O10(OH)2, 13%), and dolomite (CaMg(CO3)2, 5%).

2.2. Alkali-Activated Slag Cementitious Materials

The alkali-activated slag cementitious materials are composed of lime, gypsum, and slag powder, which were used to reinforce the silty clay of the ancient seawall site in Hangzhou. The lime used in the experiments is high-purity quicklime from the Huihui brand, the gypsum is construction gypsum powder produced by Hubei Wanjia New Building Materials Co., Ltd. in Hubei Province, China, and the slag is ground granulated blast furnace slag powder S105 produced by Gongyi City Longze Water Purification Materials Co., Ltd. in Henan Province, China.

3. Experimental Design

3.1. Response Surface Methodology Experimental Design

Response Surface Methodology (RSM) is widely used in multi-factor (variable) experimental design and objective optimization processes. It involves designing appropriate experimental points and fitting them with an implicit limit state function using the experimental results. During the experiment, researchers can either select the target points or iterate over the original points so that the failure probability of the functional model converges to the true failure probability of the implicit limit state function. Finally, the researchers use multiple quadratic regression equations to fit the relationship between the factors and the response values to create accurate models of the input and output variables. This approach identifies optimal response values and corresponding factor values, predicts response values over a specified range, and provides confidence intervals.
The researchers conducted a full factorial experiment on lime, gypsum, and slag materials based on previous research on cementitious materials at home and abroad. The study of unconfined compressive strength test results of mortar specimens revealed interactions between the materials. Then, using response surface design principles, the researchers coded the factor levels and selected a three-factor (K = 3), five-level Central Composite Circumscribed design (CCC) to optimize the process parameters for curing silty clay using the alkali-activated slag cementitious materials system.
Figure 2 shows the composition points for each experimental group under the central composite design, including 2K = 8 cubic points and 2K = 6 star points. To evaluate the pure experimental error and improve the accuracy and stability of the model, the researchers designed M0 = 6 central experimental points, resulting in 2K + 2K + M0 = 20 experimental groups. Equation (1) shows the coding transformation of the independent variable values.
X i = ( x i x o ) / x i
where X i is the coded value of the independent variable x i , x o is the value of the independent variable at the center point, and x i is the step size of the variable change. In this experiment, i takes the values of 1, 2, and 3.
The response surface method uses the least-squares method for non-linear fitting of experimental results to establish the relationship between response variables and their respective factors. The fitted model relationship expression is given below:
Y = α 0 + i = 1 3 α i X i + i = 1 3 α i i X i 2 + i < j 3 α i j X i X j ( i , j = 1 , 2 , 3 )
where Y is the predicted value of the response variable; α 0 is the constant term; α i is the linear coefficient of term i ; X i is the input factor; α i i is the coefficient of the quadratic term; and α i j is the coefficient of the factor interaction term.
This experiment refers to the current engineering construction quality assessment and concrete proportion design-related standards, combined with the actual use of cured site soil scenarios and reinforcement requirements, the main investigation target for the soil solidification effect in the middle and late stages, so the design of cured soil target maintenance age of 28 days. In this paper, the response variable Y is 28-day unconfined compressive strength, and the influence factors X1, X2, and X3 are the coded values of lime, gypsum, and slag in 500 g dry soil of the seawall site, respectively. The coding and values of each process parameter in this experiment are shown in Table 3. (unit: g):

3.2. Experimental Method

3.2.1. Sample Preparation

First, the researchers dried and thoroughly crushed the silty clay at the Linping section of the Hangzhou seawall site, passed it through a 0.6 mm sieve, and mixed it evenly with pure water based on its natural moisture content. They sealed the mixture overnight to ensure uniform moisture diffusion, according to the target experimental proportion weighing the corresponding alkali-activated slag cementitious materials, water-cement ratio of 0.3. Preparation of soil samples and using the standard compaction method to obtain unconfined compressive strength specimens (ϕ 39.1 mm × 80.0 mm). When meeting the specimen demolding conditions, the demolded specimen with a preservation bag and a rubber band sealing package, placed in a constant temperature and humidity maintenance box (temperature 20 ± 1 °C, relative humidity: 70–80%), curing to the target age.

3.2.2. Macroscopic Unconfined Compression Test

The unconfined compressive strength of the specimens after curing to the target age was determined using the TKA-TTS-1 fully automatic stress path triaxial instrument manufactured by Nanjing Tekao Technology Co., Ltd., Jiangsu Province, China, taking the average compressive strength values of three parallel specimens in each group as the experimental results and using the unconfined compressive strength as evaluation index of the solidification effect.

3.2.3. Microscopic Scanning Electron Microscope Experiment

Samples were taken with a sharp knife from the central part of the specimens that had completed the compression experiment, and after spraying the gold coating treatment on them, the microscopic structure of the soil was photographed using a HITACHI SU1510 Scanning Electron Microscope, Hitachi, Tokyo, Japan.

4. Results and Discussion

4.1. Compressive Strength Test and Regression Fitting Model Analysis

To prevent the test results from introducing errors in the fitted model, the researchers randomly interrupted and then carried out the test sequence of each group. The test design and results are shown in Table 4. In these 20 groups of tests, the unconfined compressive strength of the 28-day cured soil specimens varied within the range of 1.47–5.21 MPa.
A quadratic polynomial regression was fitted to the experimental data and the accuracy and significance of the regression model was identified by ANOVA. The ANOVA results of the model are shown in Table 5, which shows that the p-value of the model is <0.0001 and the p-value of lack of fit is >0.05, indicating that the model fit is highly significant and there is no lack of fit due to the omission of higher-order interaction terms. The p values of X3 and X1 are less than 0.0001, and the F values of both are higher than others, indicating that slag and lime affect compressive strength obviously through their linear effects. The p values ≤ 0.05 for X1 × X1, X1 × X2, and X1 × X3 indicate significant interactions of lime × lime, lime × gypsum, and lime × slag. This result shows that the dosage of lime and slag significantly affects the response value, and interactions between lime, gypsum, and slag influence the compressive strength.
The researchers fitted the experimental results of the response surface design using the least-squares method, set the significance level at 95%, and manually eliminated insignificant terms step by step to derive the regression model as in Equation (3).
Y = 4.01 + 0.753 W 1 0.3308 W 2 + 0.2334 W 3 0.0891 W 1 × W 1 + 0.1124 W 1 × W 2 0.02071 W 1 × W 3
To assess the relative error and accuracy of fit between the experimental values and the predicted values of the model, the model’s fit results were compared with the experimental data, and the average relative error was calculated using Equation (4).
= | V V e x p | V × 100 %
where is the average relative error, V is the experimental value, and V e x p is the predicted value.
An analysis of the goodness of fit of the model and the relative error between the experimental values and the predicted values is shown in Table 6 and Table 7, which shows that the correlation coefficient of the 28d regression model, R-sq (adjusted) is 95.35% and the average relative error is 4.19%, which indicates that the model has a high accuracy of fit and can be used as a guide for optimizing the process parameters of the solidified soil of seawall site.

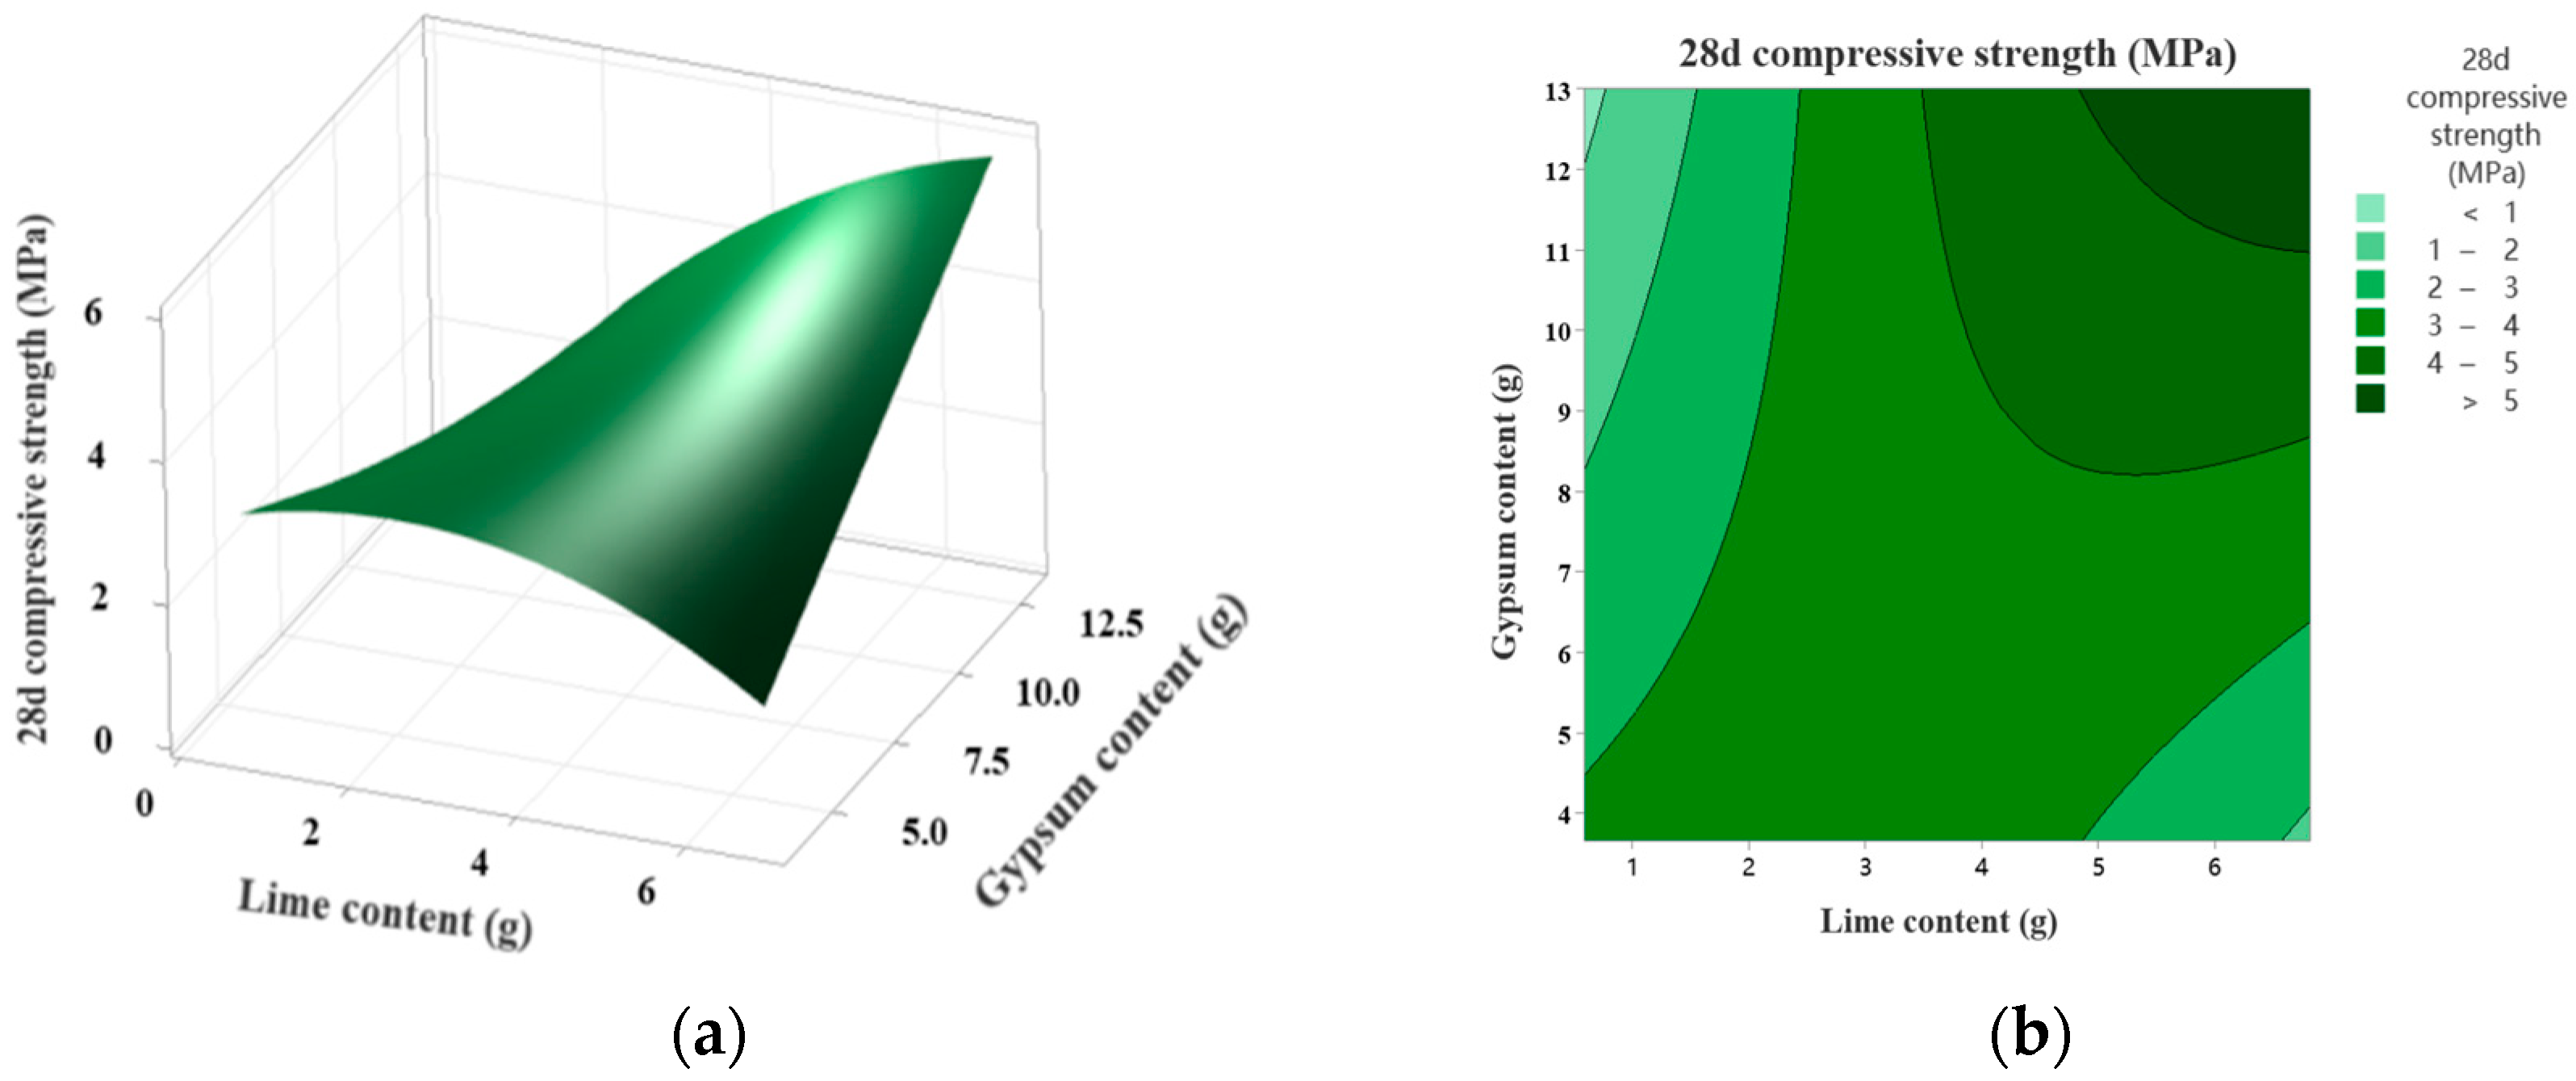
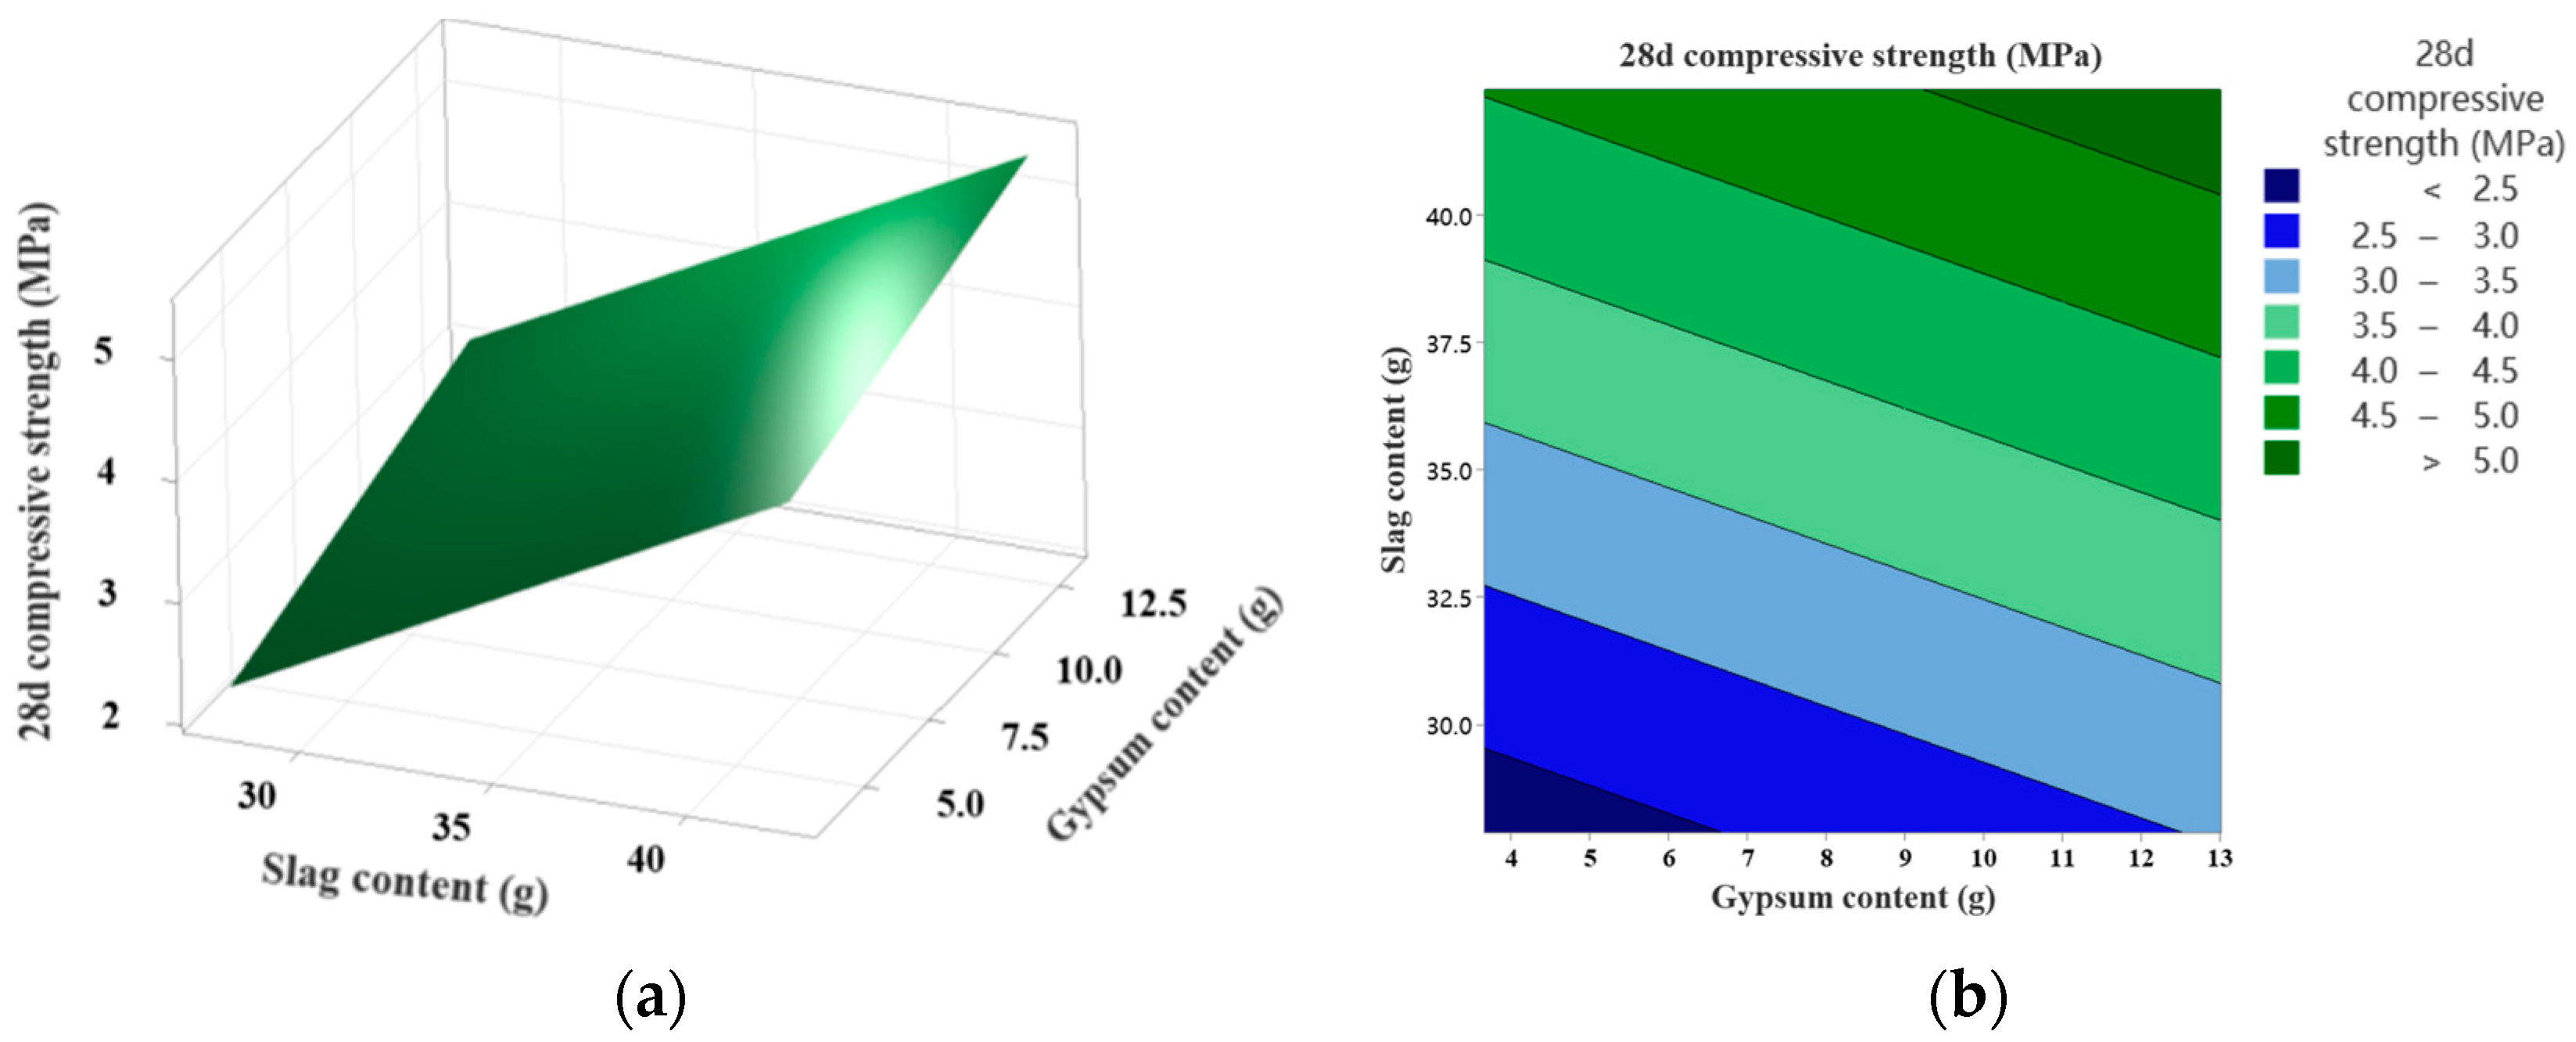
4.2. Response Surface Model Analysis

The response surface model can more clearly and intuitively show the influence law of the dosage of each factor on the compressive strength of the response value and explore the mechanism of the solidification effect under the dosage of different materials. The three-dimensional surface plots and contour plots of 28-day compressive strength with three interaction forms of lime × gypsum, lime × slag, and gypsum × slag are analyzed as follows.
Figure 3 shows the response surface and contour plots of the interaction between compressive strength and lime and gypsum dosages over the experimental range, with slag dosage set at the 0 level (35.1665 g). The steeper the response surface, the more significant the interaction between the factors. When lime content ranges from 1–3 g, increasing the gypsum content decreases compressive strength, showing that a low lime-to-gypsum ratio weakens the solidification effect. As lime content increases to 5–6 g, the 28-day compressive strength increases significantly with the rising gypsum dosage, and compressive strength becomes more sensitive to gypsum content. When both lime and gypsum contents are high, the contour plot shows an upward-curving parabola, indicating that the optimal lime and gypsum dosages for achieving the maximum 28-day compressive strength can be determined within the tested range.
Increasing the lime content with a low gypsum dosage (<6 g) results in a decrease in the 28-day compressive strength. At high gypsum dosage (9–13 g), the 28-day compressive strength increases significantly with the rise in lime content. Sufficient gypsum must be ensured when increasing lime dosage, as insufficient gypsum reduces the 28-day compressive strength despite higher lime content. This suggests that increasing lime content continuously in alkali-activated slag reactions may limit hydration reactions, affecting solidification performance.
Figure 4 shows the interaction between compressive strength and the dosages of slag and lime over the experimental range, with the gypsum dosage set at the 0 level (8.3335 g). The response surface plot shows that at low slag dosage, increasing lime dosage significantly boosts the growth rate of compressive strength; at higher slag dosage, the growth rate gradually decreases with increasing lime dosage, though compressive strength overall still increases. It can also be seen from the contour plots: at low lime dosage, increasing slag dosage significantly enhances compressive strength, whereas, at higher lime dosage, the increase in slag dosage has a smaller effect on compressive strength. Combining both plots shows that while an optimal slag and lime dosage exists for compressive strength within the experimental range, a more suitable process parameter scheme might be appropriately preferred when considering sustainability and economic effects.
Figure 5 illustrates the interaction relationship between slag and gypsum dosage within the experimental range when lime is kept at the 0 level (3.7035 g). The response surface plot is flat, and the contour plots show a parallel distribution of contour lines, indicating no interaction between slag and gypsum. The p-value of the BC term in the model fitting process is >0.05, indicating a non-significant interaction effect, this term was manually excluded in the previous fitting of the response surface model.

5. Microstructural Analysis

Figure 6 shows the original morphology of the silty clay from the ancient seawall under a scanning electron microscope. At 400× magnification, the unreinforced soil particles appear angular and scattered, with granular polygon shapes and small size differences. Noticeable gaps separate the particles, and the overall structural arrangement is loose, with adjacent particles more tightly connected. At 4000× magnification, the surface of the soil particles shows some flake separation, and the overall surface of the soil particles appears relatively smooth.
The researchers observed the alkali-activated slag-cured silty clay specimens at the age of 28 days. Figure 7 shows images taken by a scanning electron microscope at 250× magnification. The consolidated soil particles are compactly distributed and closely arranged in a cemented form, with a reduced number and size of pores compared to the unconsolidated soil. Figure 8 shows the morphology of the consolidated soil at 4000× magnification. The originally loose soil particles are effectively cemented into a whole, with numerous agglomeration products. The interparticle spaces produce many needle-like, flocculent, amorphous, and block-like substances that densely wrap and fill the soil particles. These substances construct a three-dimensional network skeleton structure that reduces the porosity of the original soil and makes the soil structure more compact.

6. Mechanism of Solidification Systems

The alkali-activated slag cementitious materials system in the experiment consists of lime, gypsum, and slag. The main components of slag are CaO, SiO2, Al2O3, and Fe2O3. Lime raises the pH of the reaction system, promoting the release of reactive SiO2 and Al2O3 from the mineral powder and forming hydrated calcium aluminates and hydrated calcium silicates on the soil particle surfaces. The chemical reactions of the process are shown in Equations (5)–(7).
C a O + H 2 O C a O H 2 C a 2 + + 2 O H
S i O S i + 3 O H [ S i O ( O H ) 3 ]
S i O A l + 7 O H [ S i O ( O H ) 3 ] + [ A l O ( O H ) 4 ]
The experiment used construction gypsum powder ( C a S O 4 · 2 H 2 O ) . During the reaction, it forms calcium sulfoaluminate hydrate ( C a 6 [ A l ( O H ) 6 ] 2 · 24 H 2 O ) 6 + , also known as ettringite ( 3 C a O · A l 2 O 3 · 3 C a S O 4 · 32 H 2 O , A F t ) , with hydrated calcium aluminate ( [ A l O ( O H ) 4 ] ) , as shown in Equation (8). If calcium sulfoaluminate hydrate colloid is formed during the reaction, it can accumulate on the soil particle surfaces, filling the interparticle pores and aggregating the soil particles into block-like structures. With an optimal solution ratio, ettringite crystals form the best needle-like structure, creating slight expansion and crystallization pressure that fills interparticle pores while enhancing structural strength and integrity. Within the spatial network structure of the solidified soil, ettringite retains a large amount of pore water through hygroscopic expansion, increasing stability under wet and water-erosion conditions and then preventing disintegration under moisture infiltration.
2 [ A l O ( O H ) 4 ] + 3 S O 4 2 + C a 2 + + 3 O H + 26 H 2 O 3 C a O · A l 2 O 3 · 3 C a S O 4 · 32 H 2 O
While calcium aluminate hydrates form, part of the S i O 3 2 forms silica gel ( H 2 S i O 3 ) within the solution, and another part of S i O 3 2 reacts with gypsum to form hydrated calcium silicate (C-S-H). The reactions for the above processes are shown in Equations (9)–(11).
S i O 3 2 + 2 H + H 2 S i O 3
C a 2 + + S i O 3 2 + H 2 O C a O · S i O 2 · H 2 O   ( C - S - H )
[ S i O ( O H ) 3 ] + C a O H 2 + H 2 O x C a O · y S i O 2 · z H 2 O
The hydration products from the above reaction cement the originally loose soil particles into dense agglomerates, reducing the number and size of pores and distributing the soil particles tightly in a solidified form. Needle-like ettringite, abundant flocculent, and agglomerates fill the interstices of soil particles, building a three-dimensional network skeleton that resists external forces. This structure slows down the direct contact of water and inorganic salts with the internal particles of soil. Additionally, hydrated calcium silicate on the surface of ettringite crystals prevents direct contact with CO2, enhancing the durability of the cured soil.
Pareto plots clearly show the influence of each factor on the solidification effect. Figure 9 indicates that the order of contribution to compressive strength, considering interactions, is as follows: slag, lime, lime × gypsum, lime × lime, gypsum, and lime × slag. Considering the solidification mechanism of alkali-activated slag cementitious materials, the increase in compressive strength of the 28-day cured soil within the experimental dosage range is mainly due to the hydration of slag under the alkaline conditions provided by lime. This suggests that hydration products significantly influence the strength increase of the cured soil.
Besides forming various hydration products during the reaction, negatively charged clay mineral particles attract cations in the solution, creating a diffuse double layer. This attraction causes the hydration products to accumulate among soil particles, forming a dense structure. Additionally, it reduces the zeta potential on the soil particle surfaces, thins the water film adsorbed on the surfaces and enhances the direct attraction between particles. Consequently, this reduces total porosity and significantly increases the compressive strength of the cured soil.
The interaction effect of the response surface provides a quantitative interpretation of the solidification mechanism. Combined with the lime × gypsum and slag × lime interactions, it shows that the alkaline environment provided by lime stimulates the fracturing of the glassy portion of the slag, producing hydrated calcium silicate, hydrated calcium aluminate, and ettringite, which increases the compressive strength of the cured soil. When lime is added at high doses, more Ca(OH)2 is produced in the reaction system, which is readily adsorbed on the surfaces of the dihydrate gypsum crystals and ettringite. This hinders gypsum from participating in the hydration reaction and affects the formation of chemical bonds between dihydrate gypsum crystals and ettringite. Additionally, the significant reduction in H+ in the solution inhibits the formation of silica gel(H2SiO3) and the cementation of loose particles, leading to a reduction in compressive strength.

7. Optimization of Process Parameters

The curved response surface plot and the parabolic sections in the contour plot indicate that within the range of the experimental material dosages, an optimal combination of process parameters can achieve maximum compressive strength. Using the experimental data, researchers employed Minitab 21 software to optimize the model response, seeking factor values that maximize the response. Table 8 shows the predicted results of the response optimization of the model.
Researchers repeated tests according to the above process parameters and compared the experimental values of the optimized solution with the predicted values to verify the model’s validity. Table 9 shows the experimental values of the three sets of unconfined compressive tests.
Table 9 shows that the difference between the optimized process parameter experimental values and the model predictions is relatively small, with the average relative errors of the compressive strength test values below 5%. This indicates that the response surface method effectively predicts the response values under different process parameters. The most significant solidification effect on the silty clay from the ancient seawall in Hangzhou can be achieved with alkali-activated slag cementitious materials configured in the ratio of lime:gypsum:slag at 1:1.9:6.2.

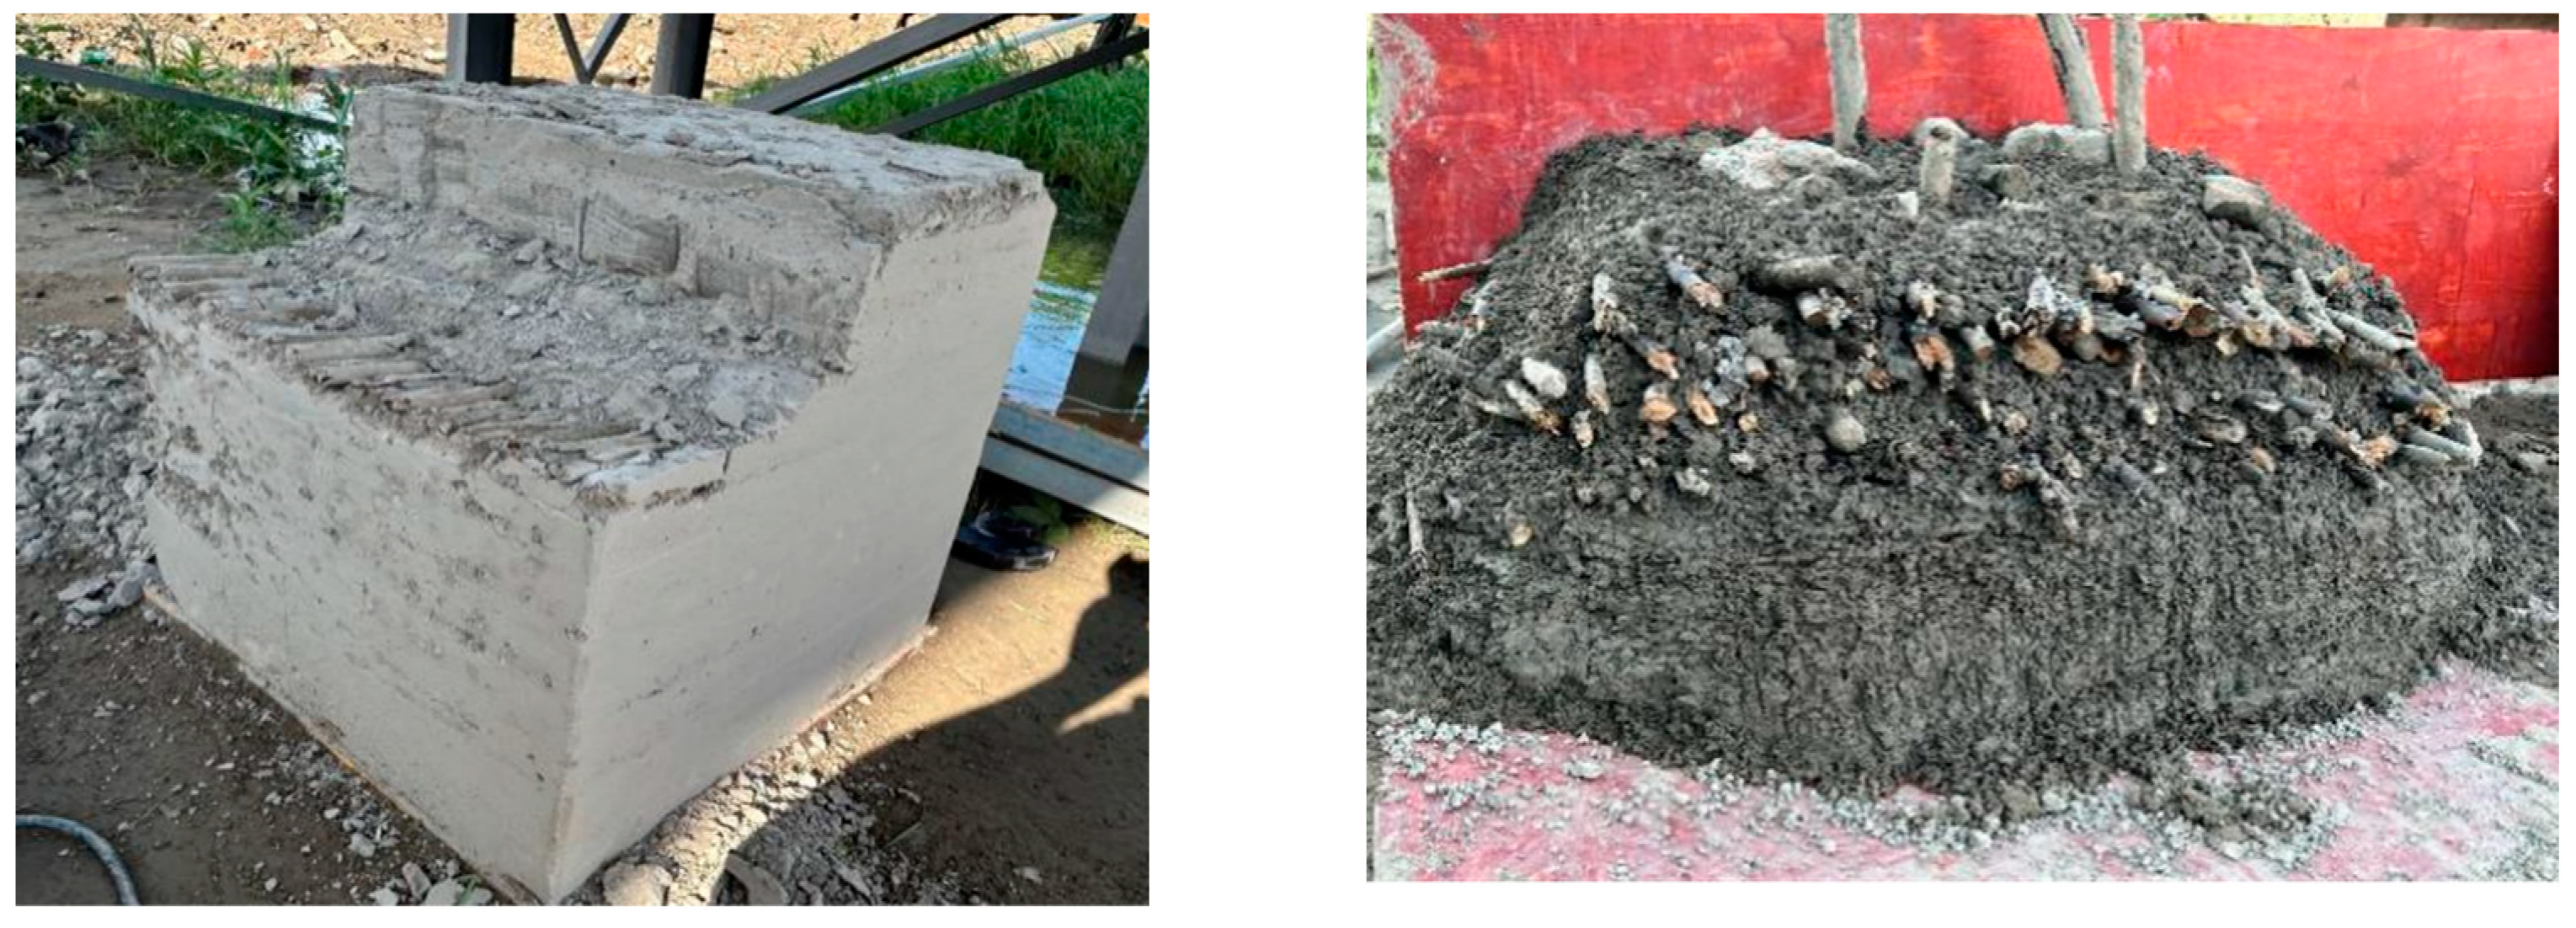
8. Practical Approaches to the Restoration and Reinforcement of the Seawall Site

To adhere to the principle of “restoring the old as it is” in soil site restoration, researchers conducted a color difference analysis between the solidified and original soils. Using a color meter, five random points were measured on both the solidified and original soil samples, and the results were presented in Table 10. A comparison of the data, together with a visual inspection, showed minimal color differences between the 28-day solidified soil and the original soil, indicating that post-treatment color adjustment of the solidified soil is unnecessary.
To restore the Hangzhou seawall site and preserve its historical and cultural information, researchers applied the optimized alkali-activated slag material in the restoration and reconstruction process. Researchers created a 50 cm × 50 cm × 50 cm model of the seawall site on-site using traditional construction techniques [1,2]. This model confirmed the feasibility of applying the optimized alkali-activated slag material in on-site soil restoration (Figure 10). Subsequently, the solidified soil was then backfilled and covered using traditional construction techniques to create a replica model of the seawall site, which is now on display at the Museum of Seawall Site of Hangzhou (Figure 11). Additionally, researchers meticulously applied the solidified soil as a mud coating to repair damaged and deteriorated areas of the cut original soil blocks. A sealable glass cover was constructed around the cut blocks to ensure complete containment. Temperature, humidity, and sterilization controls were implemented within the museum environment to enable the original soil blocks to be displayed at the Hangzhou Museum (Wushan Branch) (Figure 11).

9. Conclusions

Environmentally friendly alkali-activated slag materials were selected for the restoration and preservation of the Hangzhou seawall site. Response surface methodology was used to establish a least-squares fitting model of material dosage and compressive strength, taking into account the effects of different material ratios on the mechanical properties of the solidified soil. The results were as follows:
  • The dosages of slag, lime, and gypsum significantly affect the linear growth rate of the 28-day compressive strength, and the interactions between lime and gypsum, as well as between lime and slag, significantly impact the compressive strength.
  • The lime: gypsum: slag ratio of 1:1.9:6.2 achieves the optimum process parameters for the alkali-activated slag material, leading to the best solidification effect on the silty clay after 28 days.
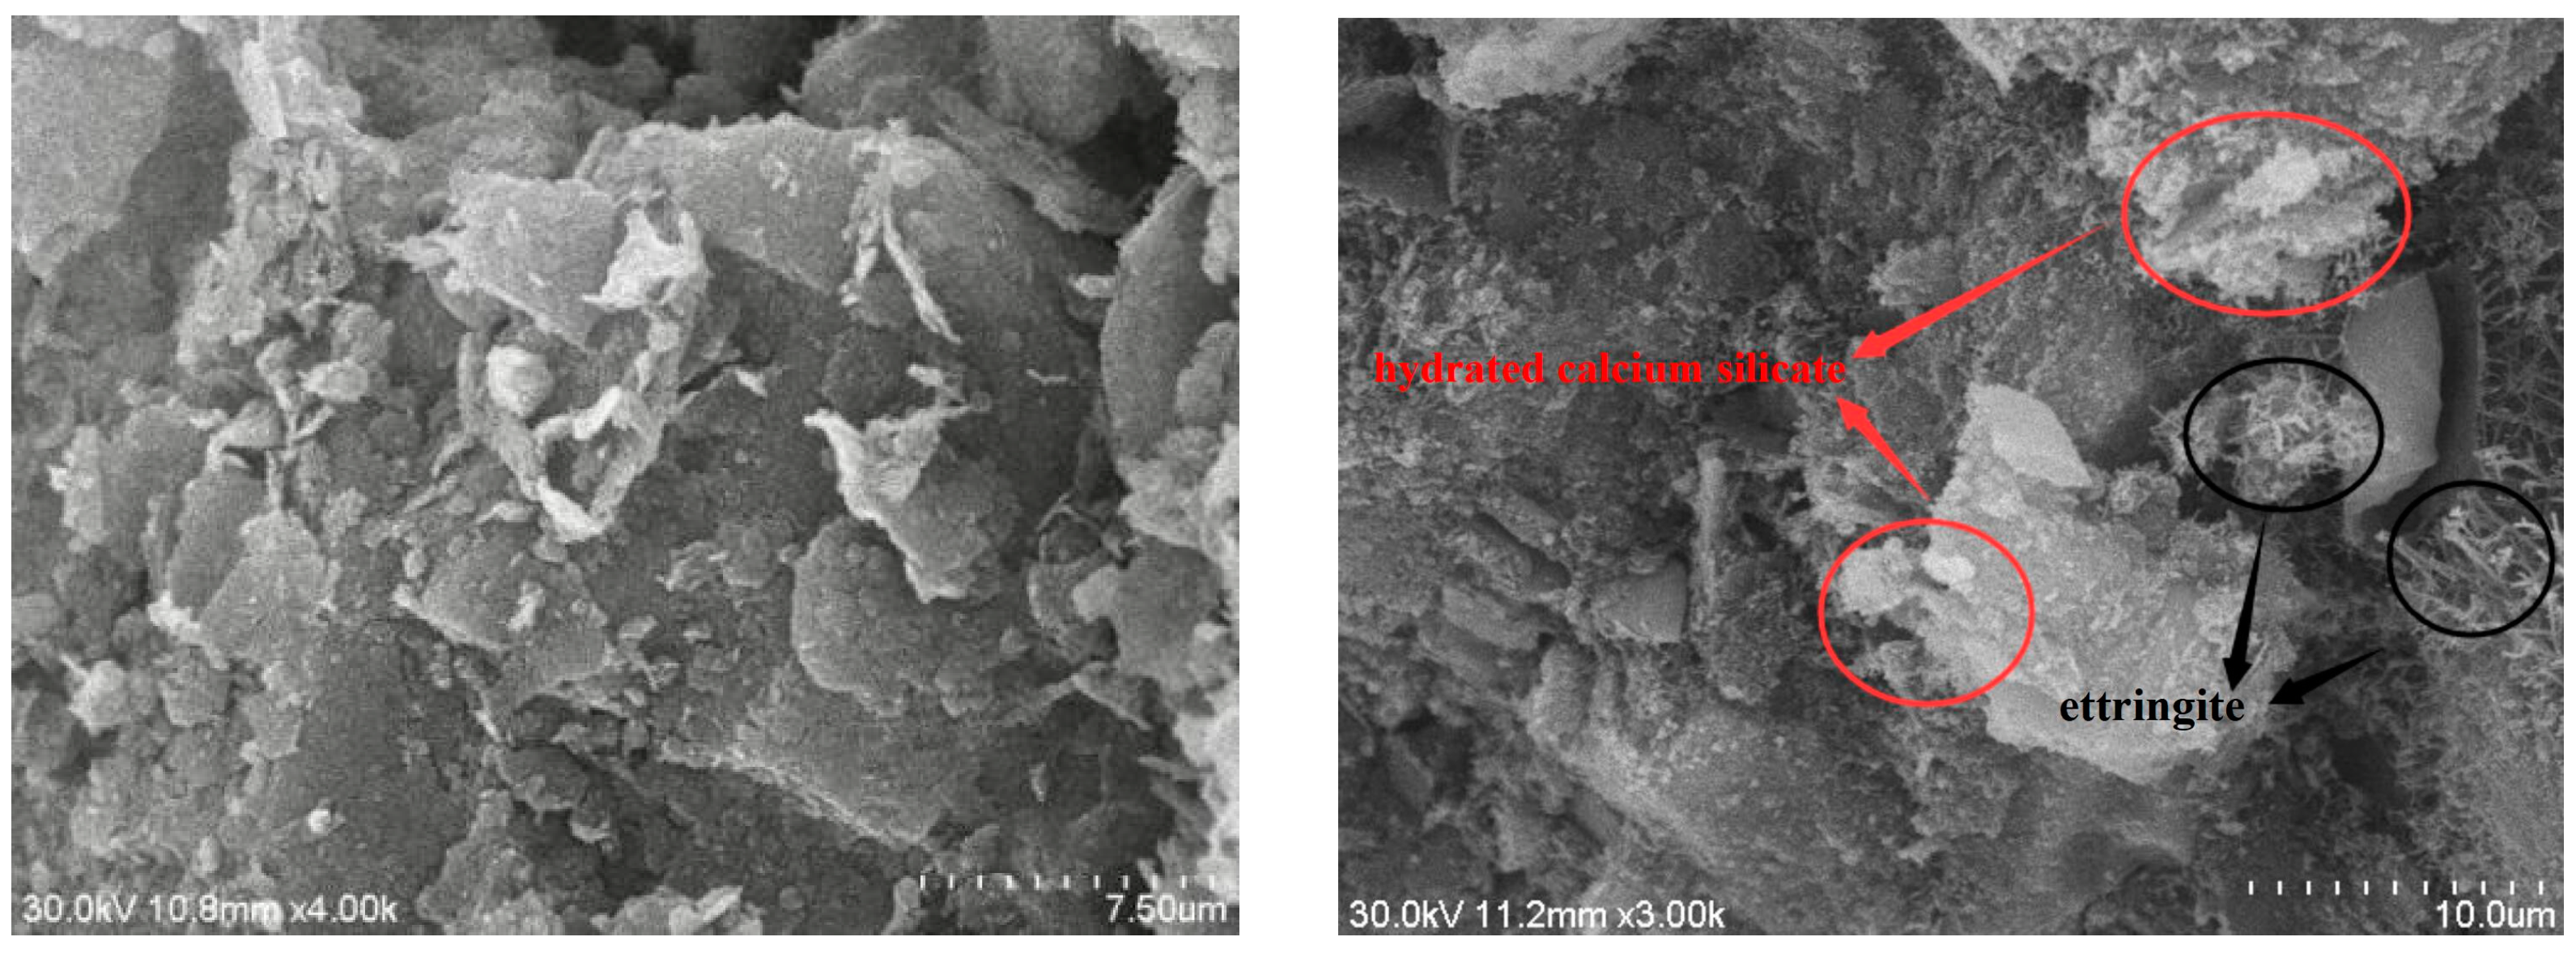
  • Microscopic observation of the optimized soil revealed that the formation of a substantial amount of amorphous calcium silicate hydrate and needle-like ettringite contributed to the enhancement of the compressive strength of the solidified soil. These substances tightly wrap around and fill the soil particles, constructing a three-dimensional network skeleton structure that reduces the porosity of the original soil and makes the soil structure more compact.
This conclusion was applied to the restoration and reinforcement project of the Hangzhou seawall site, contributing to the harmonious coexistence of urban cultural heritage preservation and sustainable development in Hangzhou. It also provided an experimental design and theoretical reference for optimizing the soil consolidation process parameters.

Author Contributions

L.Y.: direction, supervision, funding acquisition, review. Z.C.: conceptualization, methodology, data collection and analysis, writing—review and editing. L.W.: direction, conceptualization, funding acquisition, supervision, review. B.Z.: direction, methodology, funding acquisition, review. All authors have read and agreed to the published version of the manuscript.

Funding

This research was funded by 2024 R&D Tackling Plan of the ‘Elite Troops & Leading Geese + X’ Initiative by Zhejiang Provincial Department of Science and Technology: Research and Application Demonstration on Comprehensive Protection Technology for Earthen Sites and Limestone Sculptures in Humid Southern Environments, Project Number: 2024C03261-5, and Zhejiang Provincial Cultural Heritage Protection Science and Technology Project by the Cultural Heritage Bureau of Zhejiang Province: Investigation and Research on the Deterioration Characteristics of Cliff Inscriptions in Wenzhou Region, Project Number: 2025018. The authors would like to thank the anonymous editors and reviewers for their help.

Institutional Review Board Statement

The test materials used in this study were purchased from online compliance shops. The experimental studies and fieldwork on consolidated soils in this study were conducted in accordance with relevant institutional, national, and international guidelines and legislation.

Informed Consent Statement

The study does not involve humans.

Data Availability Statement

The data used to support the findings of this study are available from the corresponding author upon request.

Conflicts of Interest

The authors declare no conflicts of interest.

References

  1. Tao, C.; Zhou, C. The Qiantang River Seawall during the Ming and Qing Dynasties; China Water & Power Press: Beijing, China, 2001; p. 225. [Google Scholar]
  2. Zhao, P.; Jackson, M.D.; Zhang, Y.; Li, G.; Monteiro, P.J.; Yang, L. Material characteristics of ancient Chinese lime binder and experimental reproductions with organic admixtures. Constr. Build. Mater. 2015, 84, 477–488. [Google Scholar] [CrossRef]
  3. Pei, Q.Q.; Wang, X.D.; Guo, Q.L.; Zhao, L.; Zhang, B.; Li, Z.P. Action mechanism of sticky rice-paste-modified site soil: A traditional Chinese cementitious material. Stud. Conserv. 2020, 65, 238–250. [Google Scholar] [CrossRef]
  4. Wang, H.; Zhang, J.; Yan, X.; Xiong, R. Study on properties of magnesium oxychloride cement solidified soil. Adv. Mater. Sci. Eng. 2022, 2022, 5195450. [Google Scholar] [CrossRef]
  5. Cai, J.; Ding, B.; Yuan, Y.; Luo, X.; Gu, J.; Ukrainczyk, N.; Pan, J. Development of High-Performance Sticky Rice–Lime Composite with Metakaolin and Hemp Fibers. J. Mater. Civ. Eng. 2024, 36, 04024090. [Google Scholar] [CrossRef]
  6. Li, S.; Wang, D.; Wu, Y. Strength and load-bearing behaviors of cement-industrial by-products solidified crust layer over soft subsoil. Constr. Build. Mater. 2024, 412, 134744. [Google Scholar] [CrossRef]
  7. Mohammadi, E.L.; Najafi, E.K.; Ranjbar, P.Z.; Payan, M.; Chenari, R.J.; Fatahi, B. Recycling industrial alkaline solutions for soil stabilization by low-concentrated fly ash-based alkali cements. Constr. Build. Mater. 2023, 393, 132083. [Google Scholar] [CrossRef]
  8. Wang, S.; Wang, S.; Lu, Z.; Meng, Z.; Li, B.; Zhao, N. Revamp of the sticky rice-lime binder with metakaolin and natural fiber for restoration: Properties and characteristics. J. Cult. Herit. 2022, 57, 1–15. [Google Scholar] [CrossRef]
  9. Ministry of Science and Technology, Ministry of Culture, and State Administration of Cultural Heritage. Joint Issuance of the “National 13th Five-Year Plan for Cultural Heritage Protection and Public Cultural Service Science and Technology Innovation”. Herit. Prot. Res. 2017, 2, 126. [Google Scholar] [CrossRef]
  10. Cultural Relics Protection Law of the People’s Republic of China. 2008. Available online: https://flk.npc.gov.cn/detail2.html?MmM5MDlmZGQ2NzhiZjE3OTAxNjc4YmY4N2U1NjBhYjk (accessed on 15 August 2023).
  11. General Office of the State Council of the People’s Republic of China. Notice on the Issuance of the “14th Five-Year Plan for Cultural Relics Protection and Scientific and Technological Innovation” (State Office [2021] No. 43). Gaz. State Counc. People’s Repub. China; 2021; pp. 21–36. Available online: https://www.gov.cn/xinwen/2021-11/08/content_5649838.htm (accessed on 30 September 2023).
  12. Dong, W.; Zhan, Q.; Zhao, X.; Wang, A.; Zhang, Y. Study on the solidification property and mechanism of soft soil based on the industrial waste residue. Rev. Adv. Mater. Sci. 2023, 62, 20220303. [Google Scholar] [CrossRef]
  13. Geng, K.; Chai, J.; Qin, Y.; Xu, Z.; Cao, J.; Zhou, H.; Zhang, X. Damage evolution, brittleness and solidification mechanism of cement soil and alkali-activated slag soil. J. Mater. Res. Technol. 2023, 25, 6039–6060. [Google Scholar] [CrossRef]
  14. Ahmad, J.; Kontoleon, K.J.; Majdi, A.; Naqash, M.T.; Deifalla, A.F.; Ben Kahla, N.; Isleem, H.F.; Qaidi, S.M. A comprehensive review on the ground granulated blast furnace slag (GGBS) in concrete production. Sustainability 2022, 14, 8783. [Google Scholar] [CrossRef]
  15. Acharya, A.; Archroy, S.; Gokhale, V.A. Role of additives in mortars: Historic precedents. Int. J. Eng. Res. Appl. 2017, 7, 7–12. [Google Scholar] [CrossRef]
  16. Sekar, P.; Alluri, S.K.R. Impact of Cyclones and Surge on Slope Stability of Rubble Mound Seawall. In Proceedings of the OCEANS 2022-Chennai, Chennai, India, 21–24 February 2022; pp. 1–5. [Google Scholar]
  17. Chen, Q.; Tu, X.; Lv, Y.; Liu, W.; Shi, L. Experimental study on vertical bearing and deformation characteristics of Qiantang river ancient seawall. Buildings 2023, 13, 2788. [Google Scholar] [CrossRef]
  18. Chang, T.; Zhan, L.; Tan, W.; Li, S. Optimization of curing process for polymer-matrix composites based on orthogonal experimental method. Fibers Polym. 2017, 18, 148–154. [Google Scholar] [CrossRef]
  19. Li, Y.; Jia, S.; Liu, J. Solidification, remediation and long-term stability of heavy metal contaminated soil under the background of sustainable development. Sci. Rep. 2022, 12, 10330. [Google Scholar] [CrossRef] [PubMed]
  20. Shang, Y.; Cui, Z.; Zhang, Y. Experimental Study on the Synergistic Solidification of Soft Soil with Ceramic Powder–Slag–Phosphorus Slag. Sustainability 2023, 15, 15474. [Google Scholar] [CrossRef]
  21. Wang, X.-K.; Pang, J.-Y.; Wang, Q. Orthogonal Experimental Studies on Unconfined Compressive Strength of Composite Cement-soil. J. Yangtze River Sci. Res. Inst. 2015, 32, 72. [Google Scholar]
  22. Zhang, H.; Li, L.; Sarker, P.K.; Long, T.; Shi, X.; Wang, Q.; Cai, G. Investigating various factors affecting the long-term compressive strength of heat-cured fly ash geopolymer concrete and the use of orthogonal experimental design method. Int. J. Concr. Struct. Mater. 2019, 13, 63. [Google Scholar] [CrossRef]
  23. Liu, R.J.; Zhang, Y.W.; Wen, C.W.; Tang, J. Study on the design and analysis methods of orthogonal experiment. Exp. Technol. Manag. 2010, 27, 52–55. [Google Scholar]
  24. Ihueze, C.; Obiuto, C.; Okafor, C.E.; Okpala, C.C. Orthogonal array application and response surface method approach for optimal product values: An application for Oil blending process. World Acad. Sci. Eng. Technol. 2013, 76, 610–614. [Google Scholar]
  25. Li, Z.; Lu, D.; Gao, X. Optimization of mixture proportions by statistical experimental design using response surface method- A review. J. Build. Eng. 2021, 36, 102101. [Google Scholar] [CrossRef]
  26. Edwards, I.; Jutan, A. Optimization and control using response surface methods. Comput. Chem. Eng. 1997, 21, 441–453. [Google Scholar] [CrossRef]
  27. Khuri, A.I. Response surface methodology and its applications in agricultural and food sciences. Biom. Biostat. Int. J. 2017, 5, 155–163. [Google Scholar] [CrossRef]
  28. Alyamac, K.E.; Ghafari, E.; Ince, R. Development of eco-efficient self-compacting concrete with waste marble powder using the response surface method. J. Clean. Prod. 2017, 144, 192–202. [Google Scholar] [CrossRef]
  29. Anwar, M.; Rasul, M.G.; Ashwath, N.; Rahman, M.M. Optimisation of second-generation biodiesel production from Australian native stone fruit oil using response surface method. Energies 2018, 11, 2566. [Google Scholar] [CrossRef]
  30. Kakavandi, B.; Takdastan, A.; Jaafarzadeh, N.; Azizi, M.; Mirzaei, A.; Azari, A. Application of Fe3O4@ C catalyzing heterogeneous UV-Fenton system for tetracycline removal with a focus on optimization by a response surface method. J. Photochem. Photobiol. A Chem. 2016, 314, 178–188. [Google Scholar] [CrossRef]
  31. Dao, T.A.T.; Webb, H.K.; Malherbe, F. Optimization of pectin extraction from fruit peels by response surface method: Conventional versus microwave-assisted heating. Food Hydrocoll. 2021, 113, 106475. [Google Scholar]
  32. Penkhrue, W.; Jendrossek, D.; Khanongnuch, C.; Pathom-Aree, W.; Aizawa, T.; Behrens, R.L.; Lumyong, S. Response surface method for polyhydroxybutyrate (PHB) bioplastic accumulation in Bacillus drentensis BP17 using pineapple peel. PLoS ONE 2020, 15, e0230443. [Google Scholar] [CrossRef] [PubMed]
  33. St-Pierre, N.R.; Weiss, W.P. Technical note: Designing and analyzing quantitative factorial experiments. J. Dairy Sci. 2009, 92, 4581–4588. [Google Scholar] [CrossRef]
Figure 1. Photographs of the Linping section of the Hangzhou seawall site.
Sustainability 16 08219 g001
Figure 2. Schematic diagram of the composition points for the experimental group in the central composite circumscribed design.
Sustainability 16 08219 g002
Figure 3. Response surface plot (a) and contour plot (b) of compressive strength for the lime and gypsum interaction.
Sustainability 16 08219 g003
Figure 4. Response surface plot (a) and contour plot (b) of compressive strength for the slag and lime interaction.
Sustainability 16 08219 g004
Figure 5. Response surface plot (a) and contour plot (b) of compressive strength for the slag and gypsum interaction.
Sustainability 16 08219 g005
Figure 6. Morphology of the original soil from the seawall site observed using a scanning electron microscope (SEM).
Sustainability 16 08219 g006
Figure 7. Microstructure of the 28-day solidified soil sample at 250× magnification.
Sustainability 16 08219 g007
Figure 8. Microstructure of the 28-day solidified soil sample at 400× magnification.
Sustainability 16 08219 g008
Figure 9. Pareto chart of standardized effects on 28-day compressive strength.
Sustainability 16 08219 g009
Figure 10. Preliminary replica model of the seawall site.
Sustainability 16 08219 g010
Figure 11. Exhibited model of the seawall site of Hangzhou in the museum: (a) Located in the Museum of the Seawall Site of Hangzhou; (b) Located in the Hangzhou Museum.
Sustainability 16 08219 g011
Table 1. Physical and mechanical properties of site soil.
Moisture Content
/%
Wet
Density
(g·cm−3)
Dry
Density
(g·cm−3)
Relative DensitySpecific Gravity of Soil
Particles
Plastic Limit
/%
Liquid Limit
/%
Plasticity IndexLiquidity Index
34.22.1241.660.111.91618.6832.6513.9701.111
Table 2. Oxide composition and content of the soil samples.
Oxide
Composition
SiO2Al2O3Fe2O3CaOK2OMgOTiO2Na2OOthers
Content
(%)
65.459.598.416.564.142.051.611.290.9
Table 3. Coded levels and corresponding uncoded values of chosen variables for CCC.
VariablesCodeUnencoded Value
(g)
Coded Levels and Corresponding Uncoded Values
−1.682−10+1+1.682
LimeX1W10.5891.8513.7035.5566.818
GypsumX2W23.6595.5548.33311.11313.007
SlagX3W327.87930.83335.16739.50042.454
Where the coded values can be calculated from the uncoded values, for example, the coded value of lime is given by: Coded Value = [W1 − (5.556 − 1.851)/2]/[(5.556 + 1.851)/2]; the uncoded values can also be derived from the coded values. For instance, the uncoded value of lime is 3.703 + (5.556 − 1.851)/2 × Coded Value.
Table 4. CCC experimental design matrix with 28-day unconfined compressive strength test values.
No.X1X2X3Y/MPa
10004.10
21−113.94
3−1−1−12.66
40003.96
5−1.682001.96
6−1113.62
70003.78
80003.67
91115.21
10−1−113.97
11−11−11.47
1211−14.42
130003.74
1400−1.6822.55
1500+1.6824.74
16+1.682013.84
170013.86
180+1.68214.18
191−1−12.60
200−1.68203.17
Table 5. Significance of regression coefficients and analysis of variance (ANOVA) for compressive strength regression model.
Response28d Compressive Strength
SourceAdj SSAdj MSF-Valuep-Value
Model15.64991.7388838.90<0.0001
X14.24254.2424994.90<0.0001
X20.77280.7727617.290.0002
X36.29656.29654140.85<0.0001
X1X11.42691.4206731.78<0.0001
X2X20.02300.023020.520.489
X3X30.03690.036870.820.385
X1X22.67962.6796159.94<0.0001
X1X30.22110.221114.950.050
X2X30.01050.010510.240.638
Lack of Fit0.32290.064592.600.159
Table 6. Goodness-of-fit analysis of the regression model.
ModelSR-sqR-sq(adj)R-sq(pred)
28d0.19849196.82%95.35%90.26%
Where S is the standard deviation between experimental and predicted values; R-sq is the goodness of fit of the model (regression sum of squares as a proportion of the total sum of squares of deviations); R-sq(adj) adjusts for the number of predictors in the model, providing a more accurate measure when multiple predictors are involved; R-sq(pred) measures how well the model predicts responses for new observations.
Table 7. Compressive strength experimental values, regression model predictions, and relative errors.
No.V28dV28d predΔ28d
14.103.787.79%
23.943.735.37%
32.662.419.28%
43.963.784.53%
51.961.980.95%
63.623.425.47%
73.783.780.02%
83.673.783.02%
95.215.362.91%
103.974.103.37%
111.471.7317.79%
124.424.341.90%
133.743.781.09%
142.552.643.48%
154.744.923.86%
163.843.850.35%
173.863.782.05%
184.184.180.02%
192.602.703.96%
203.173.386.65%
Average 4.19%
Where V28d represents the 28-day compressive strength test values; V28d pred represents the 28-day compressive strength predicted values; Δ28d represents the 28-day compressive strength relative error.
Table 8. Optimization of the response surface regression model.
ModelLime/
(g)
Gypsum/
(g)
Slag/
(g)
Compressive Strength
Predicted Value/(Mpa)
Standard Error of Fitting Value95%
Confidence Interval
95%
Predicted Interval
28d6.81813.00742.4546.9360.356(6.166, 7.706)(6.046, 7.825)
Where 95% Confidence Intervals: The range within which the true model parameters lie with 95% confidence when the same test is repeated; 95% Prediction Intervals: The range within which the response value is 95% likely to fall for a given process parameter.
Table 9. Experimental results and relative errors of process parameters under response optimization.
AgeNo.Compressive Strength (Mpa)Relative Error to Fitting (%)Average Relative Error (%)
28d16.742.91%2.92%
27.335.38%
36.970.49%
Table 10. Color test results of seawall soil before and after solidification..
SubjectNo.Labch
Original Soil144.645.2423.2223.7577.85
247.214.8324.0122.9378.11
349.124.9122.9424.4777.54
448.715.3523.1823.1277.84
545.335.1724.1322.4276.64
Average47.0025.10023.49623.33877.596
Solidified Soil162.294.2918.5619.0576.98
253.824.1517.3817.8776.59
359.404.5919.9419.4876.36
455.244.3317.9918.5076.48
560.54.4718.2318.7776.23
Average58.254.36618.42018.73476.528
Where L: Lightness; a: the color value on the red-green axis; b: the color value on the yellow-blue axis; c: Chroma, the color’s intensity or saturation; h: hue angle.
Disclaimer/Publisher’s Note: The statements, opinions and data contained in all publications are solely those of the individual author(s) and contributor(s) and not of MDPI and/or the editor(s). MDPI and/or the editor(s) disclaim responsibility for any injury to people or property resulting from any ideas, methods, instructions or products referred to in the content.

