
The Impact of Architects’ Reasoning on Early Design Decision-Making for Energy-Efficient Buildings


Abstract
:1. Introduction
2. Architects’ Reasoning in Design Decision-Making
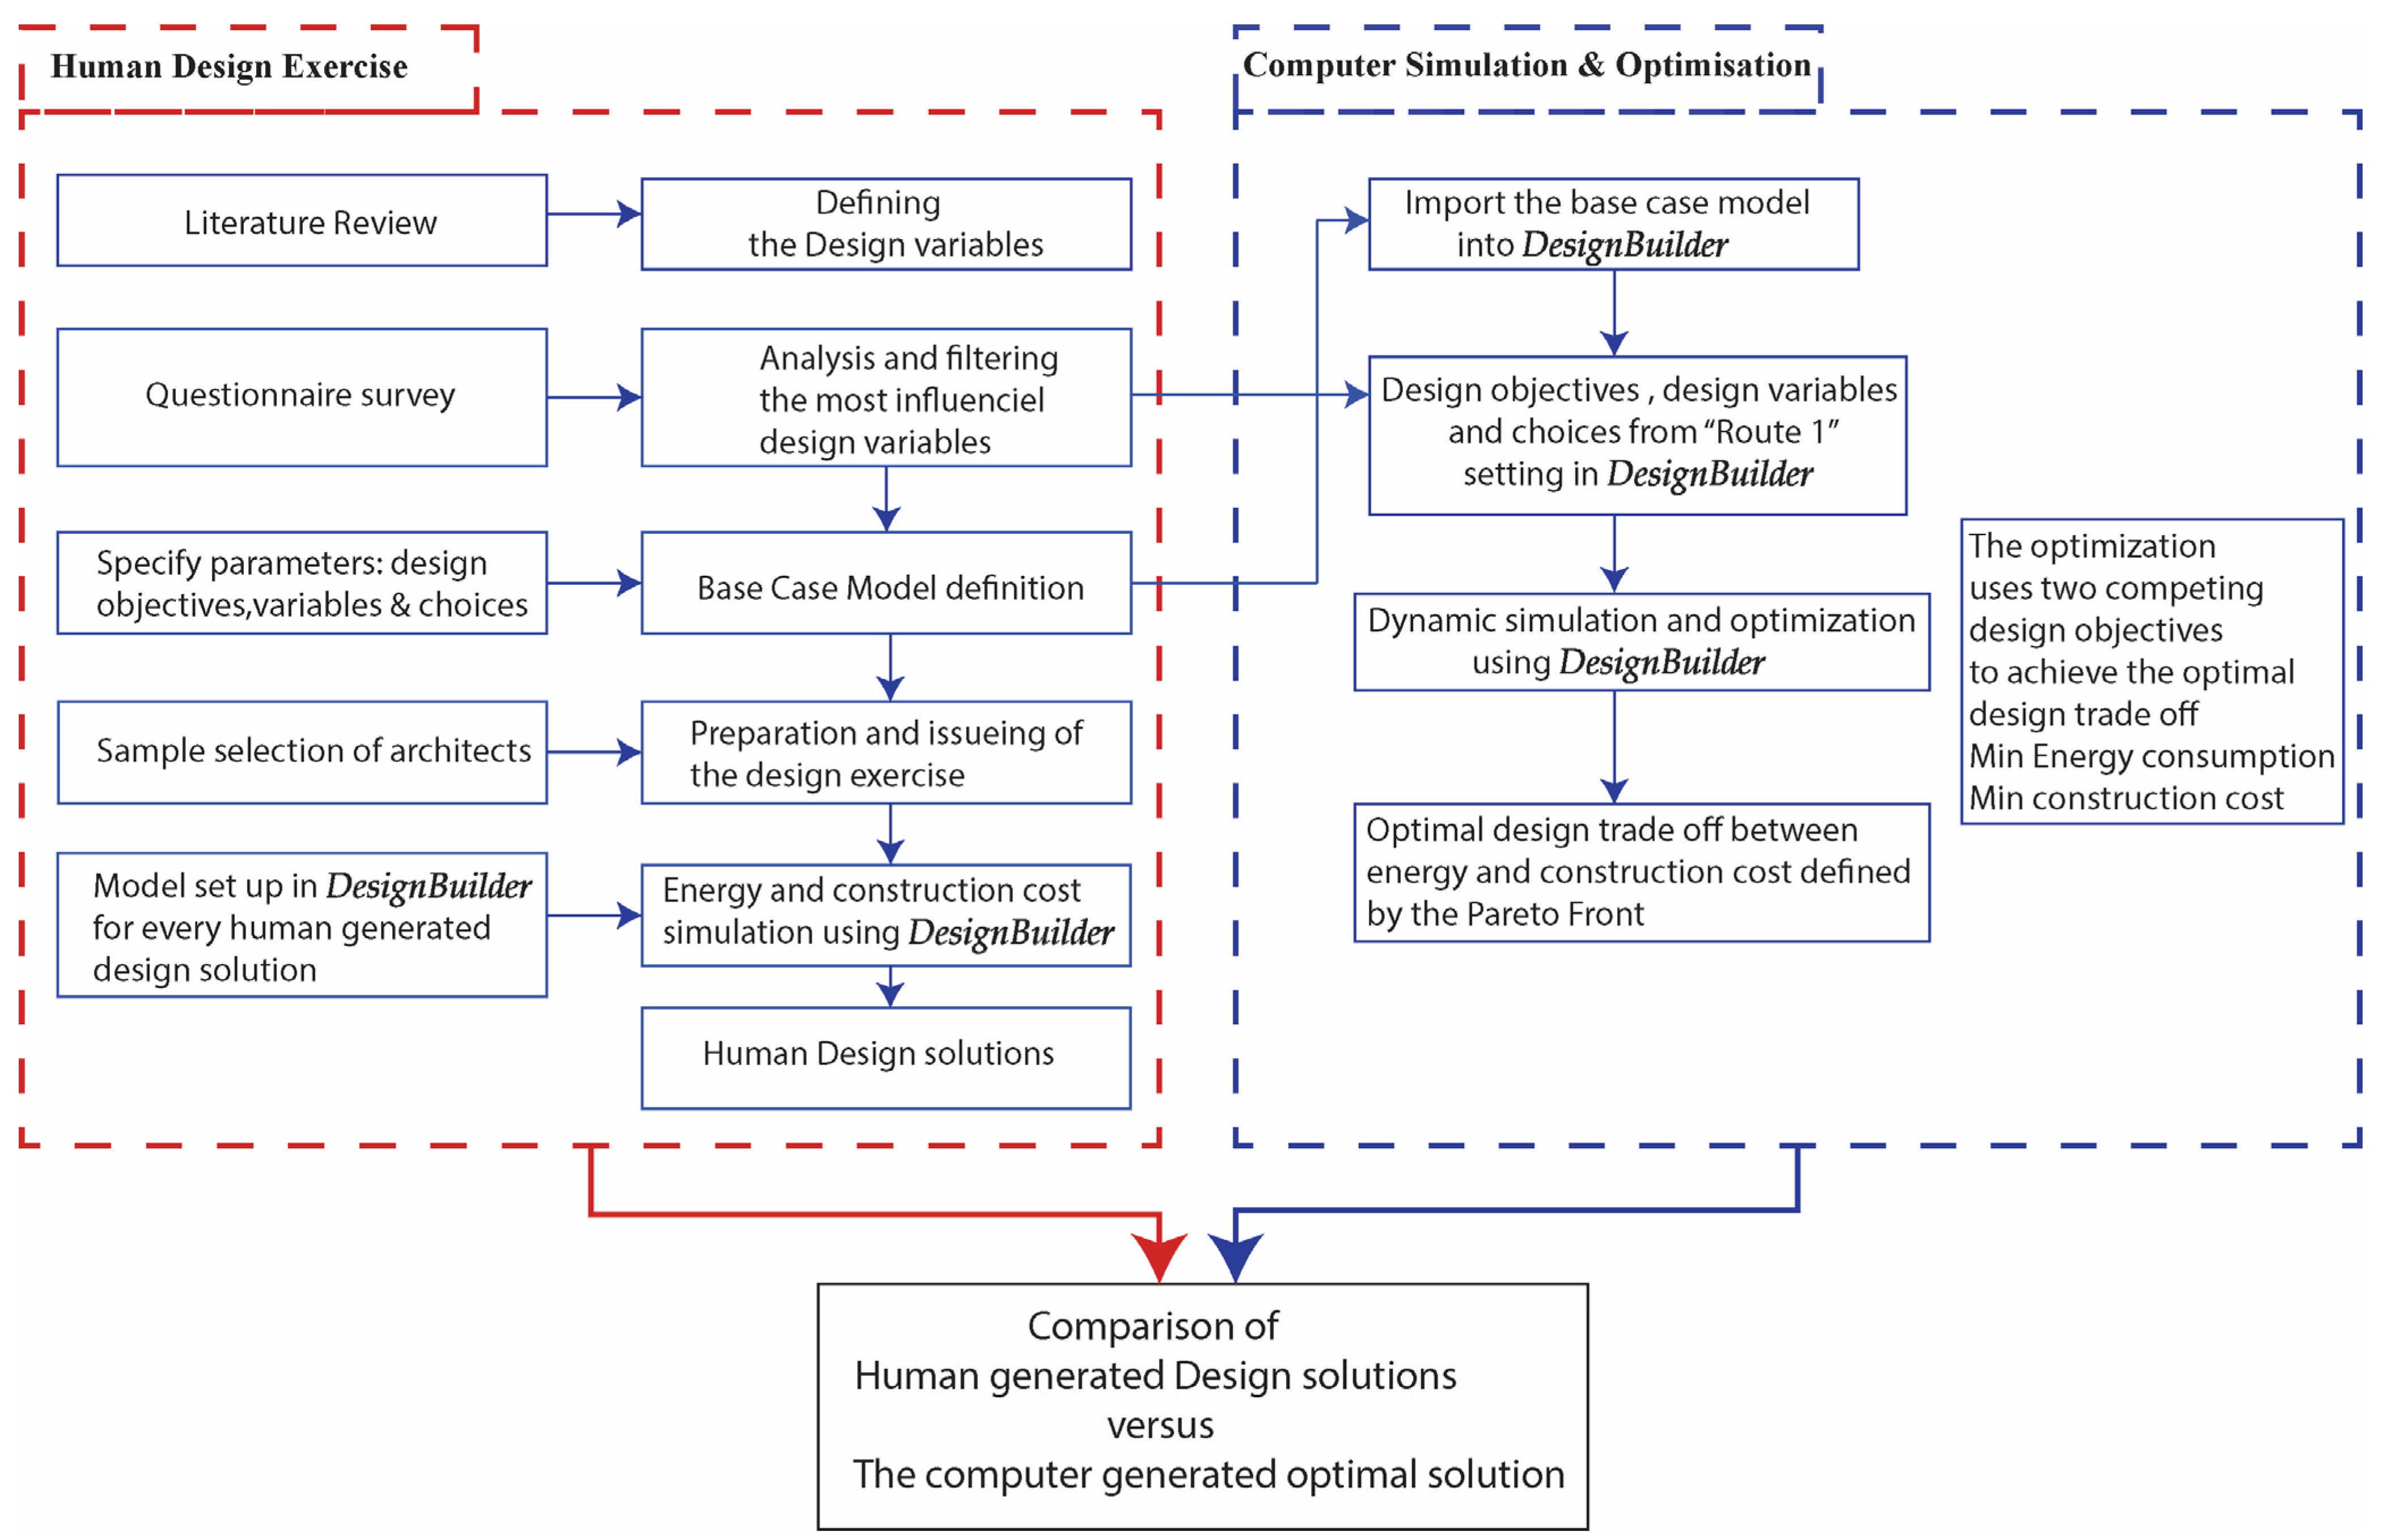
3. Method
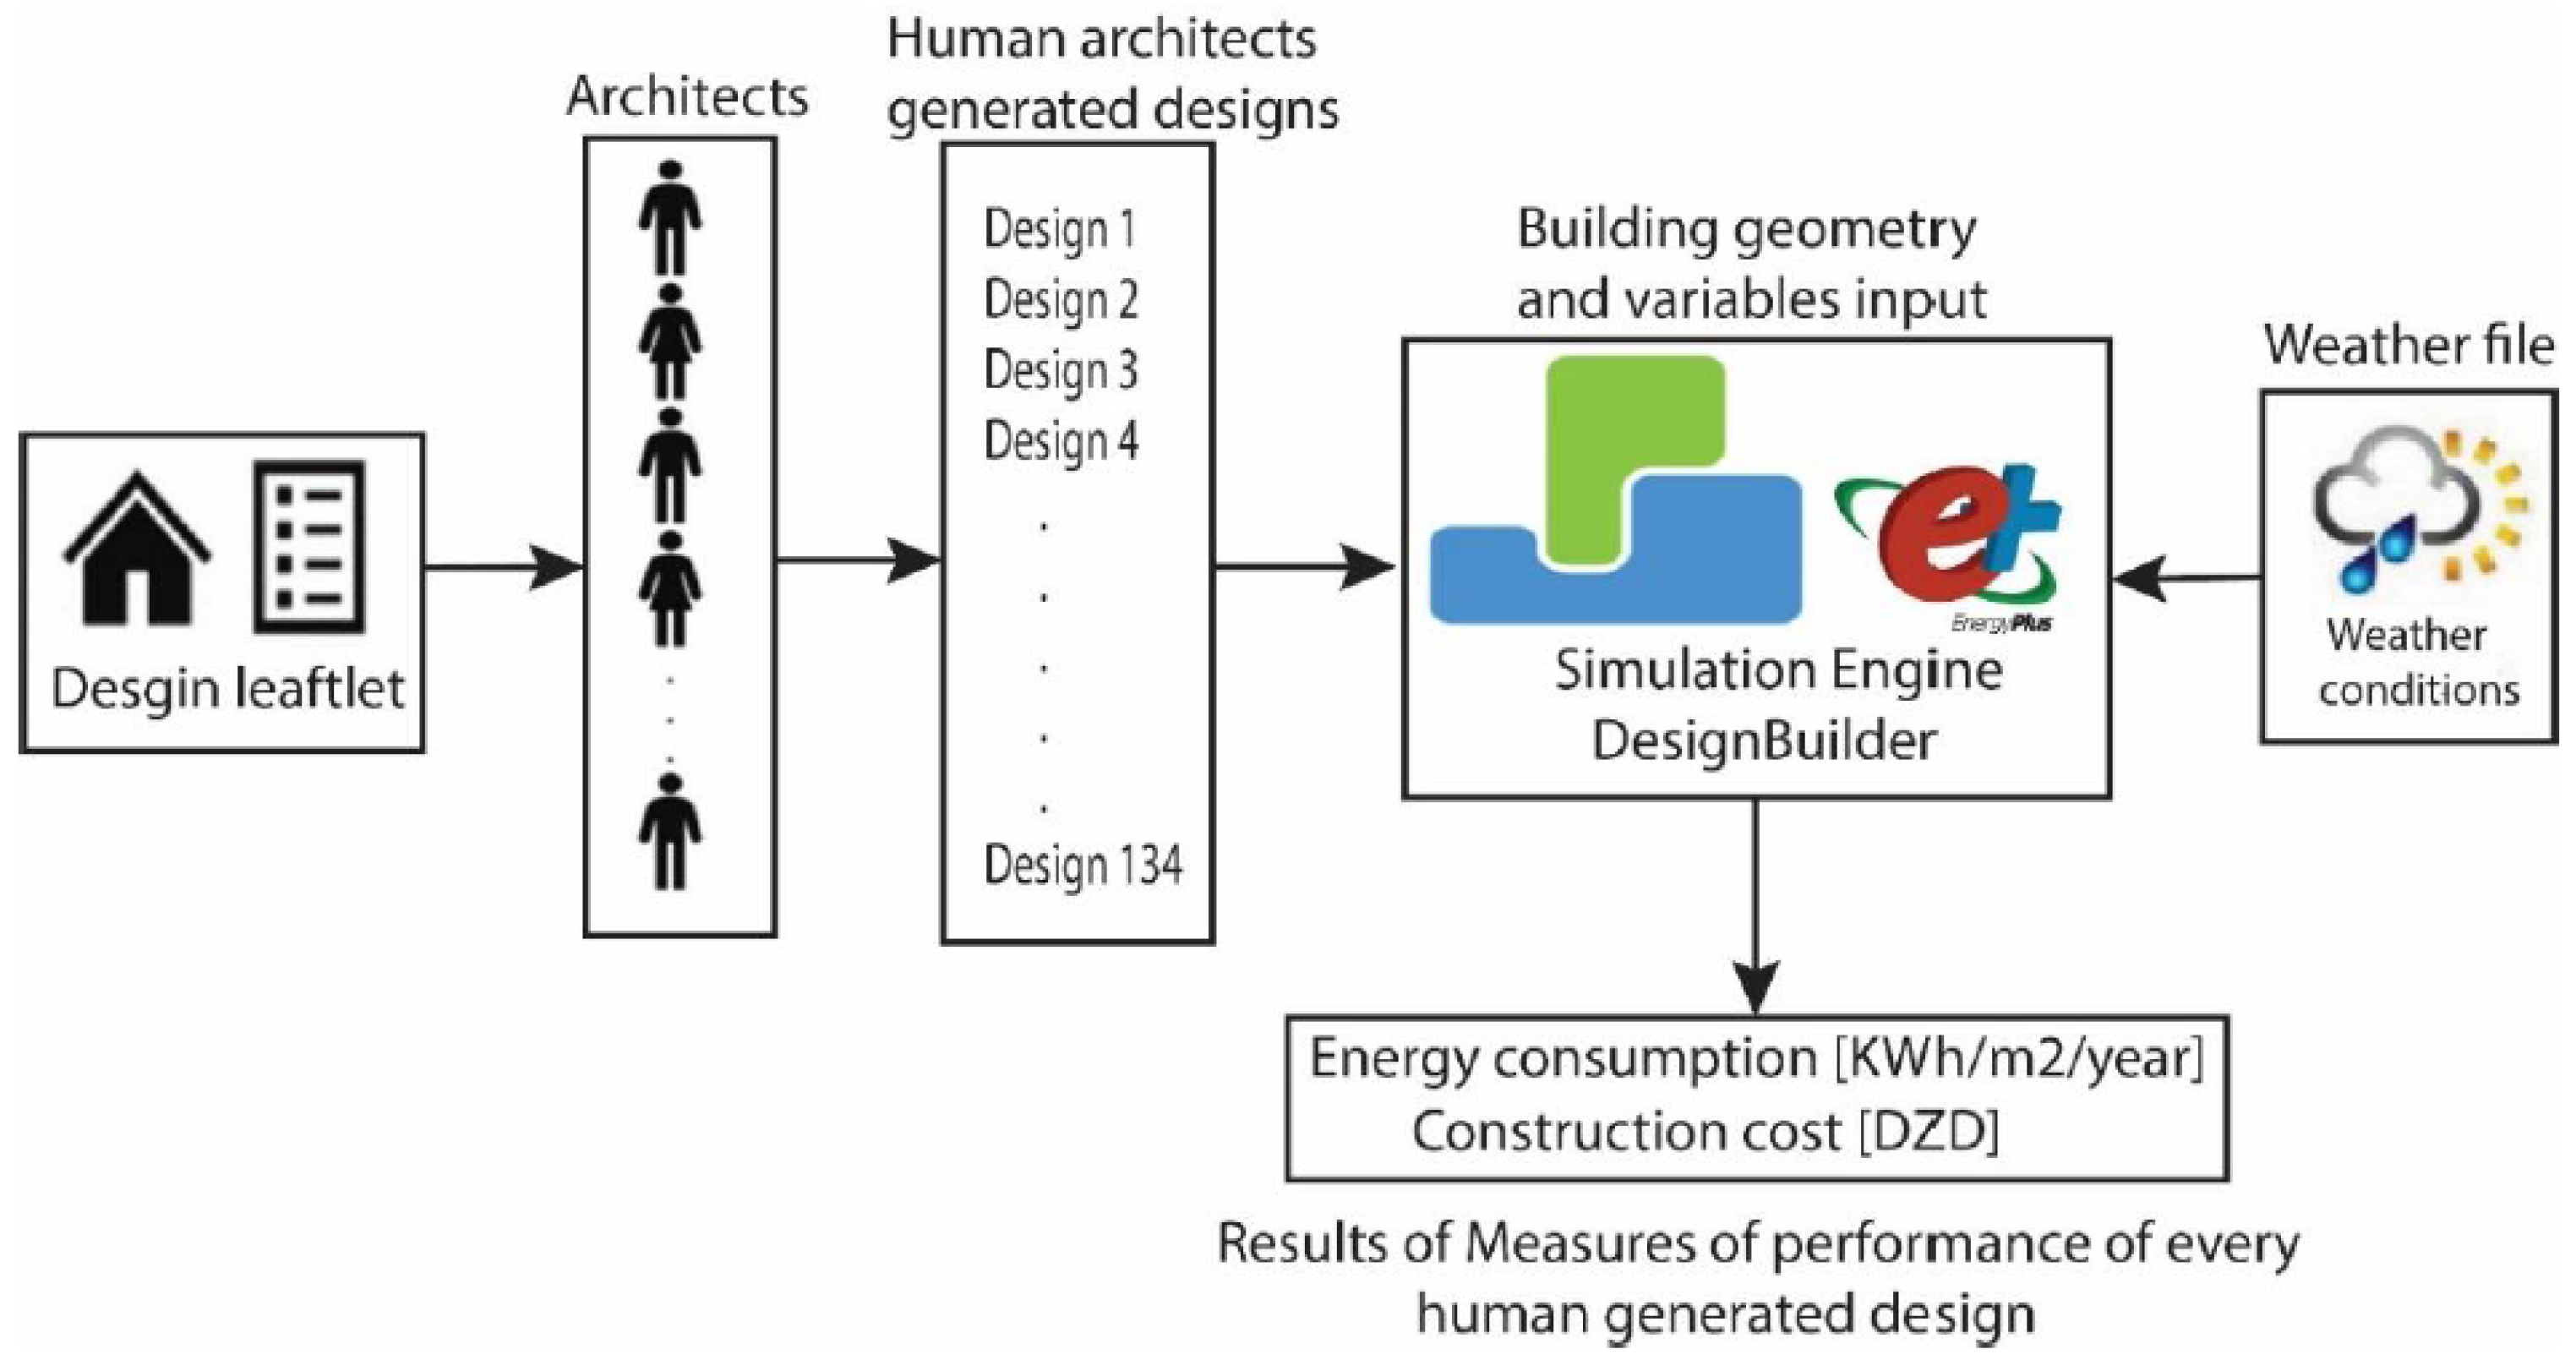
3.1. Human Architects Design Experiment
3.2. Base Case Model Definition
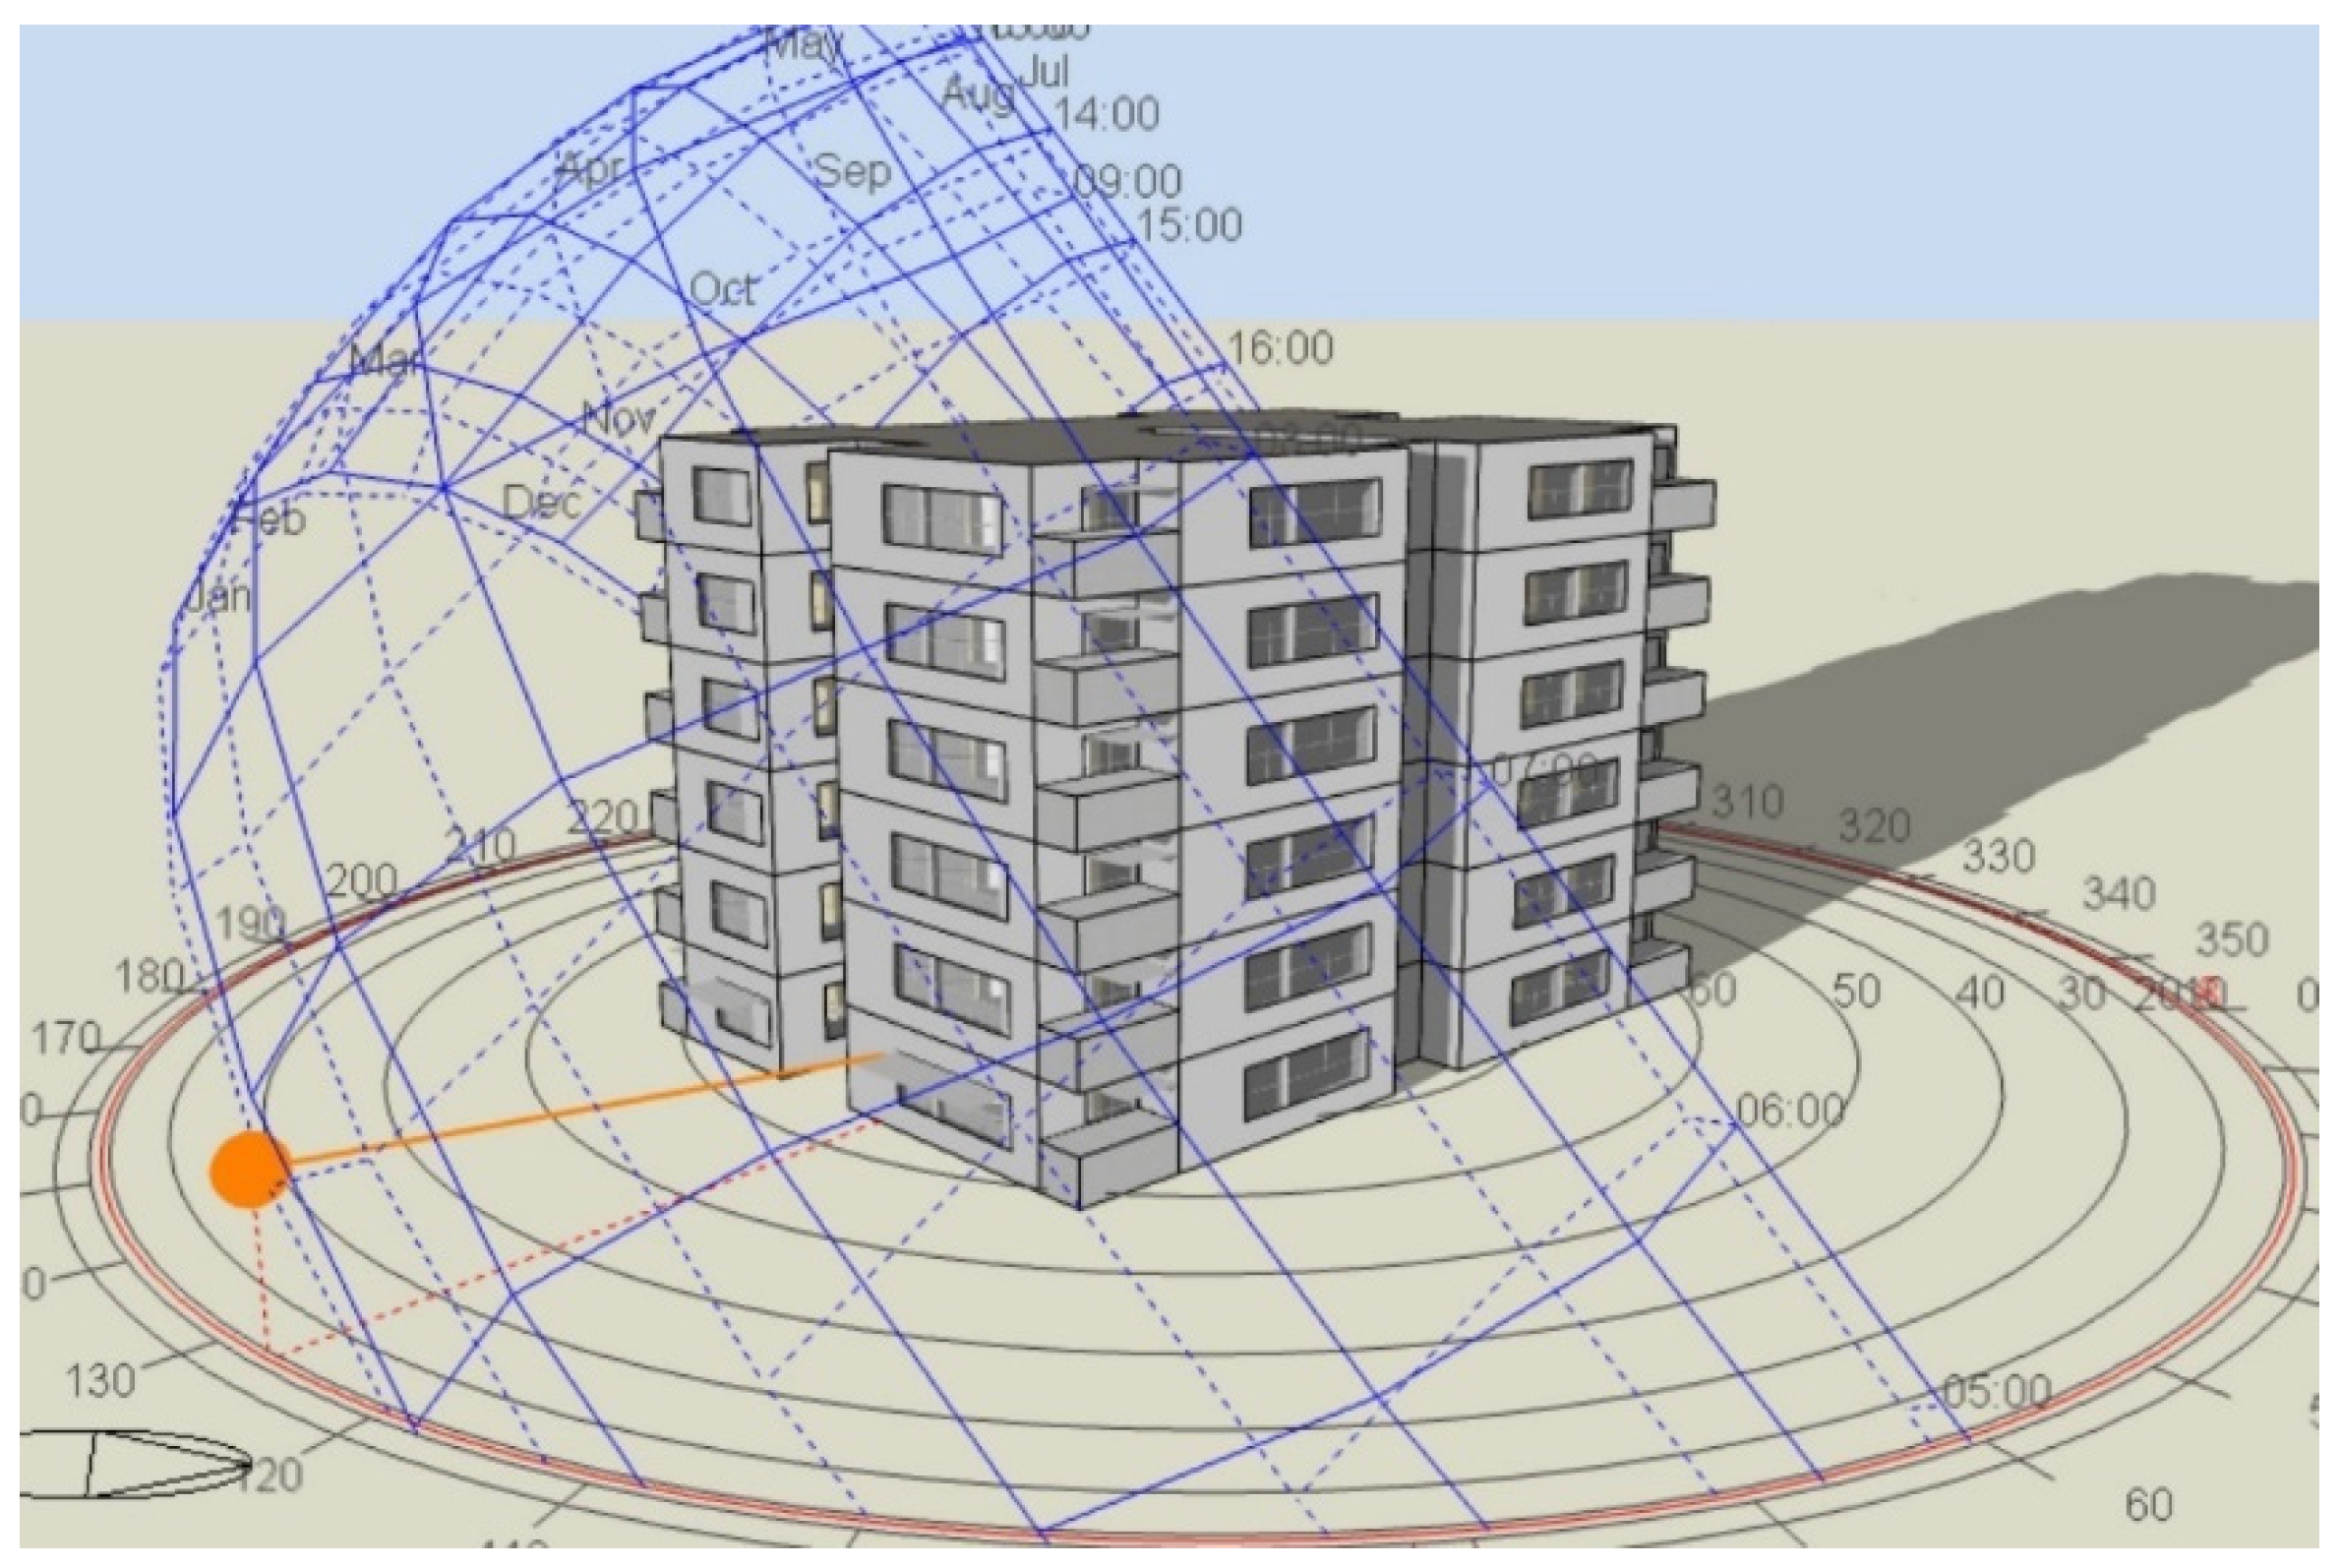
3.2.1. Weather Profile
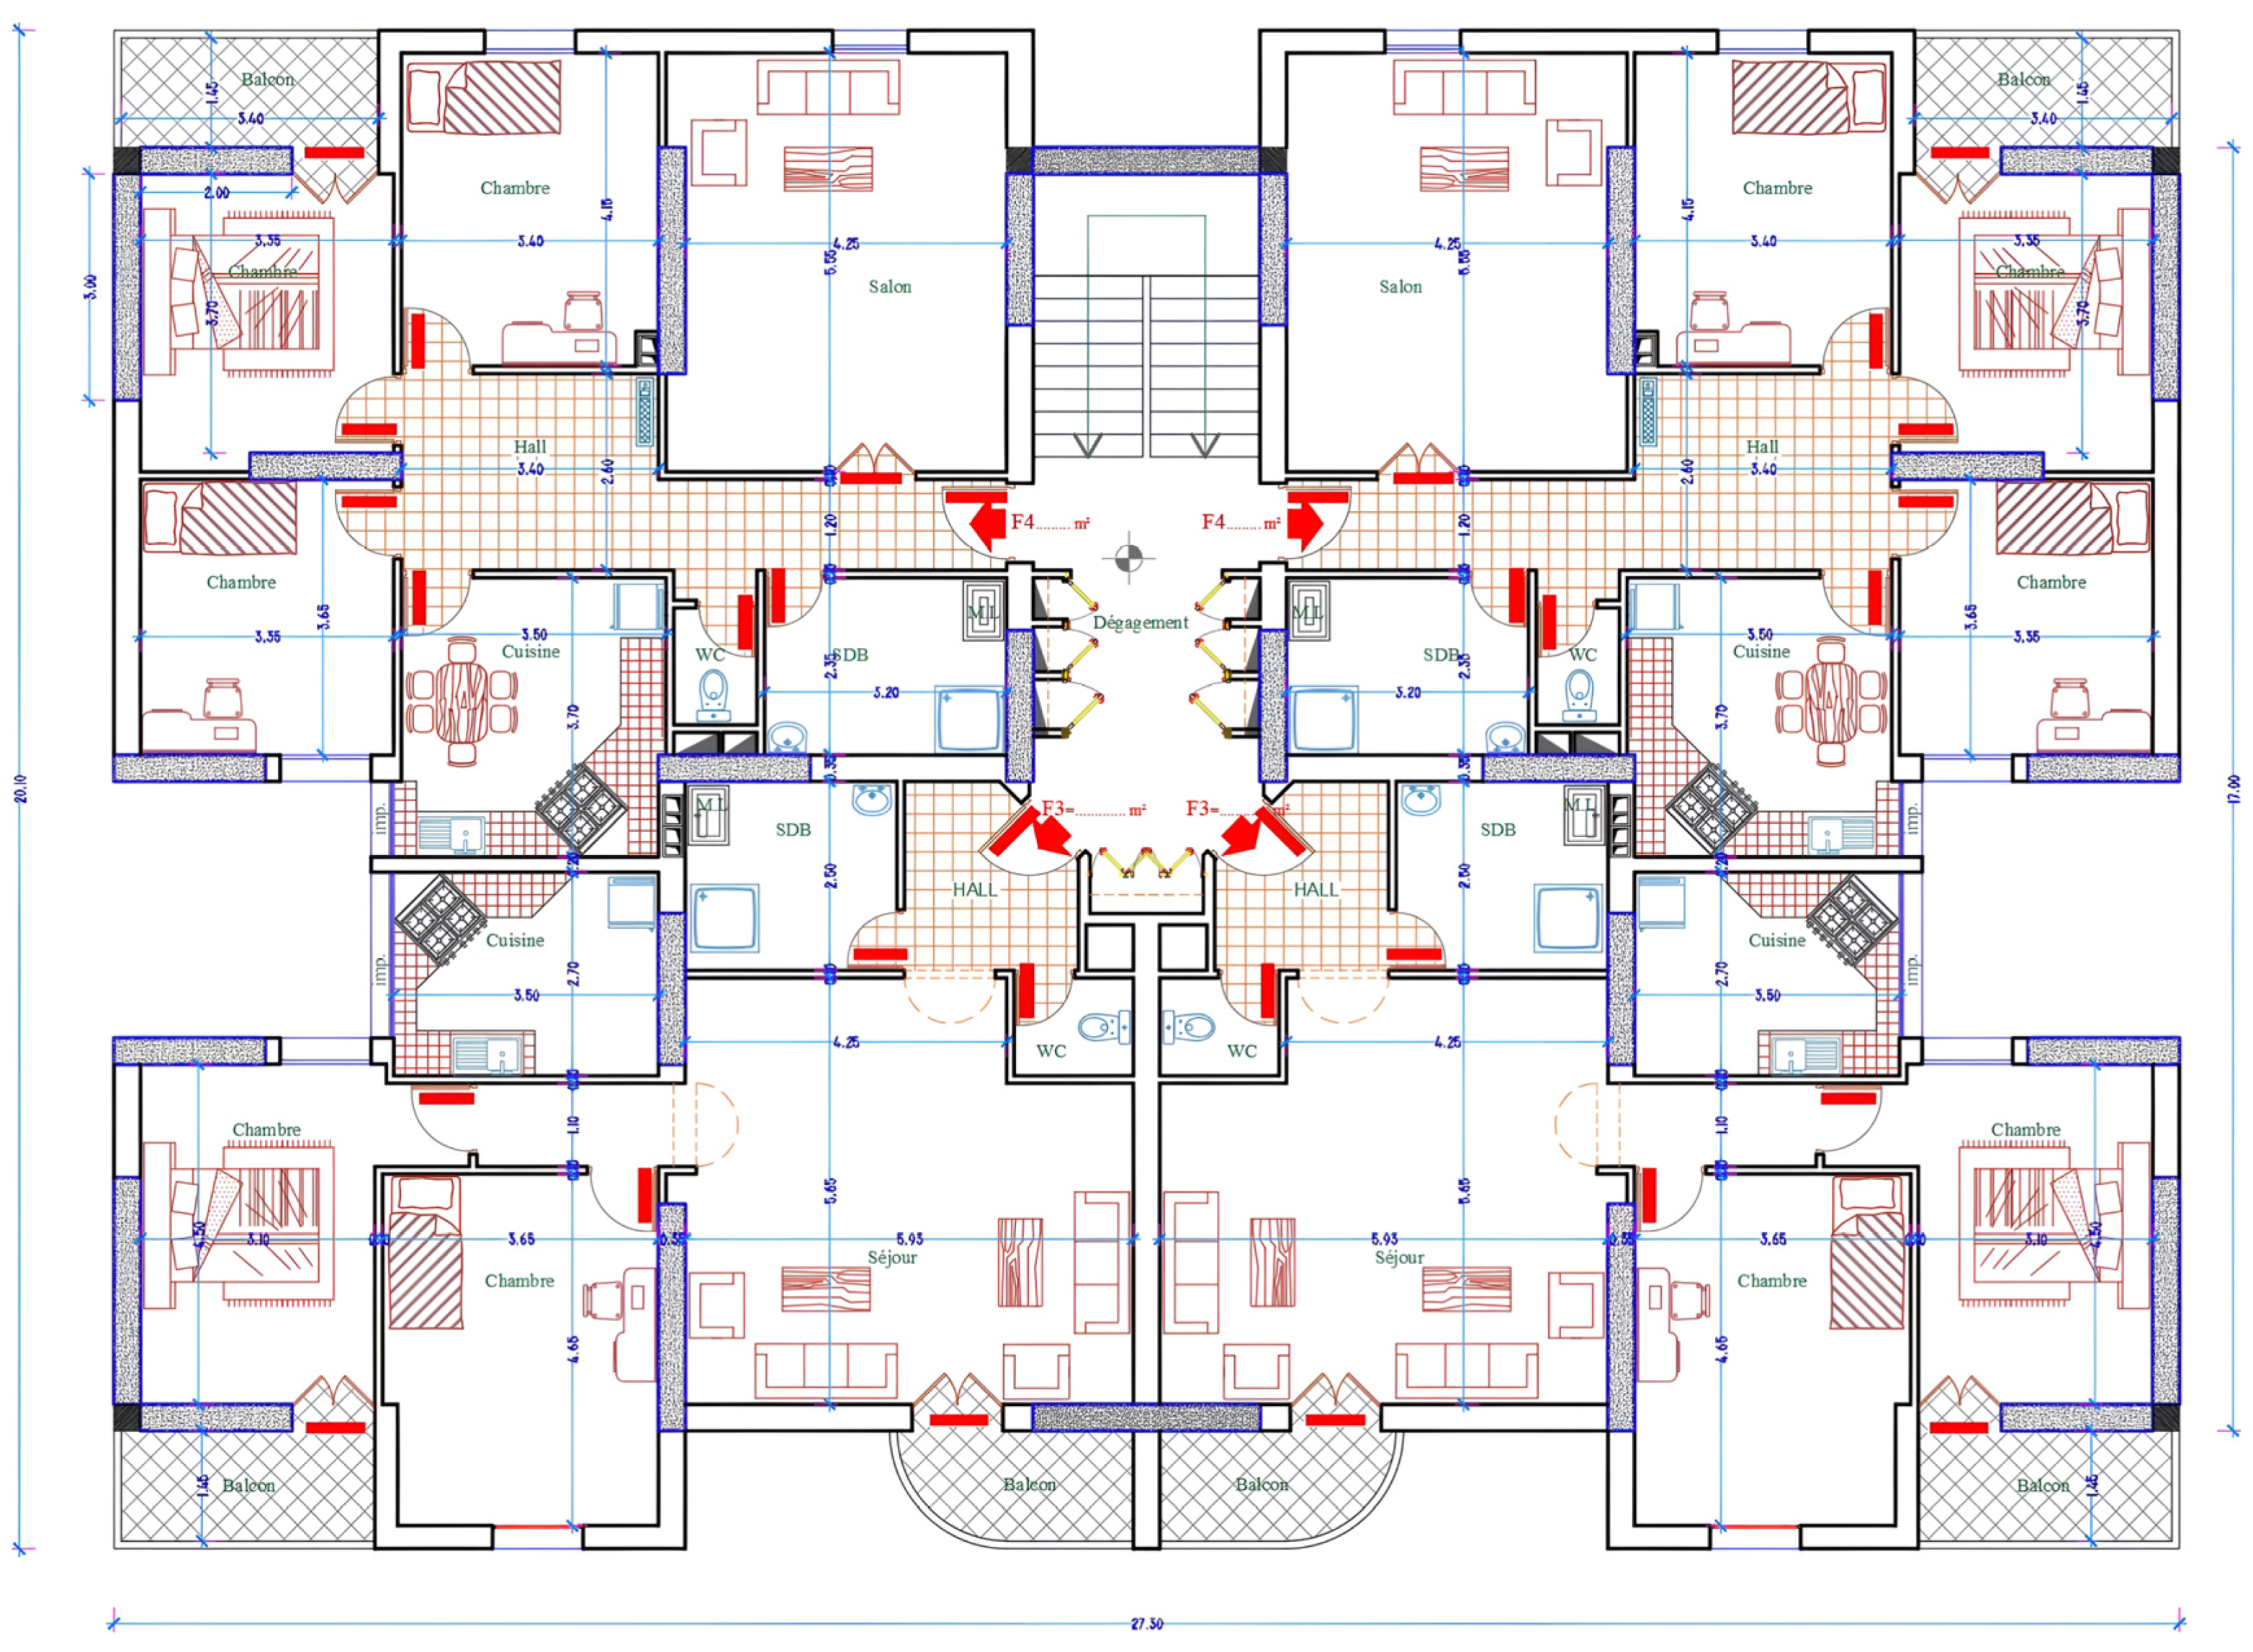
3.2.2. Base Case Model Description
3.2.3. Sampling Strategy
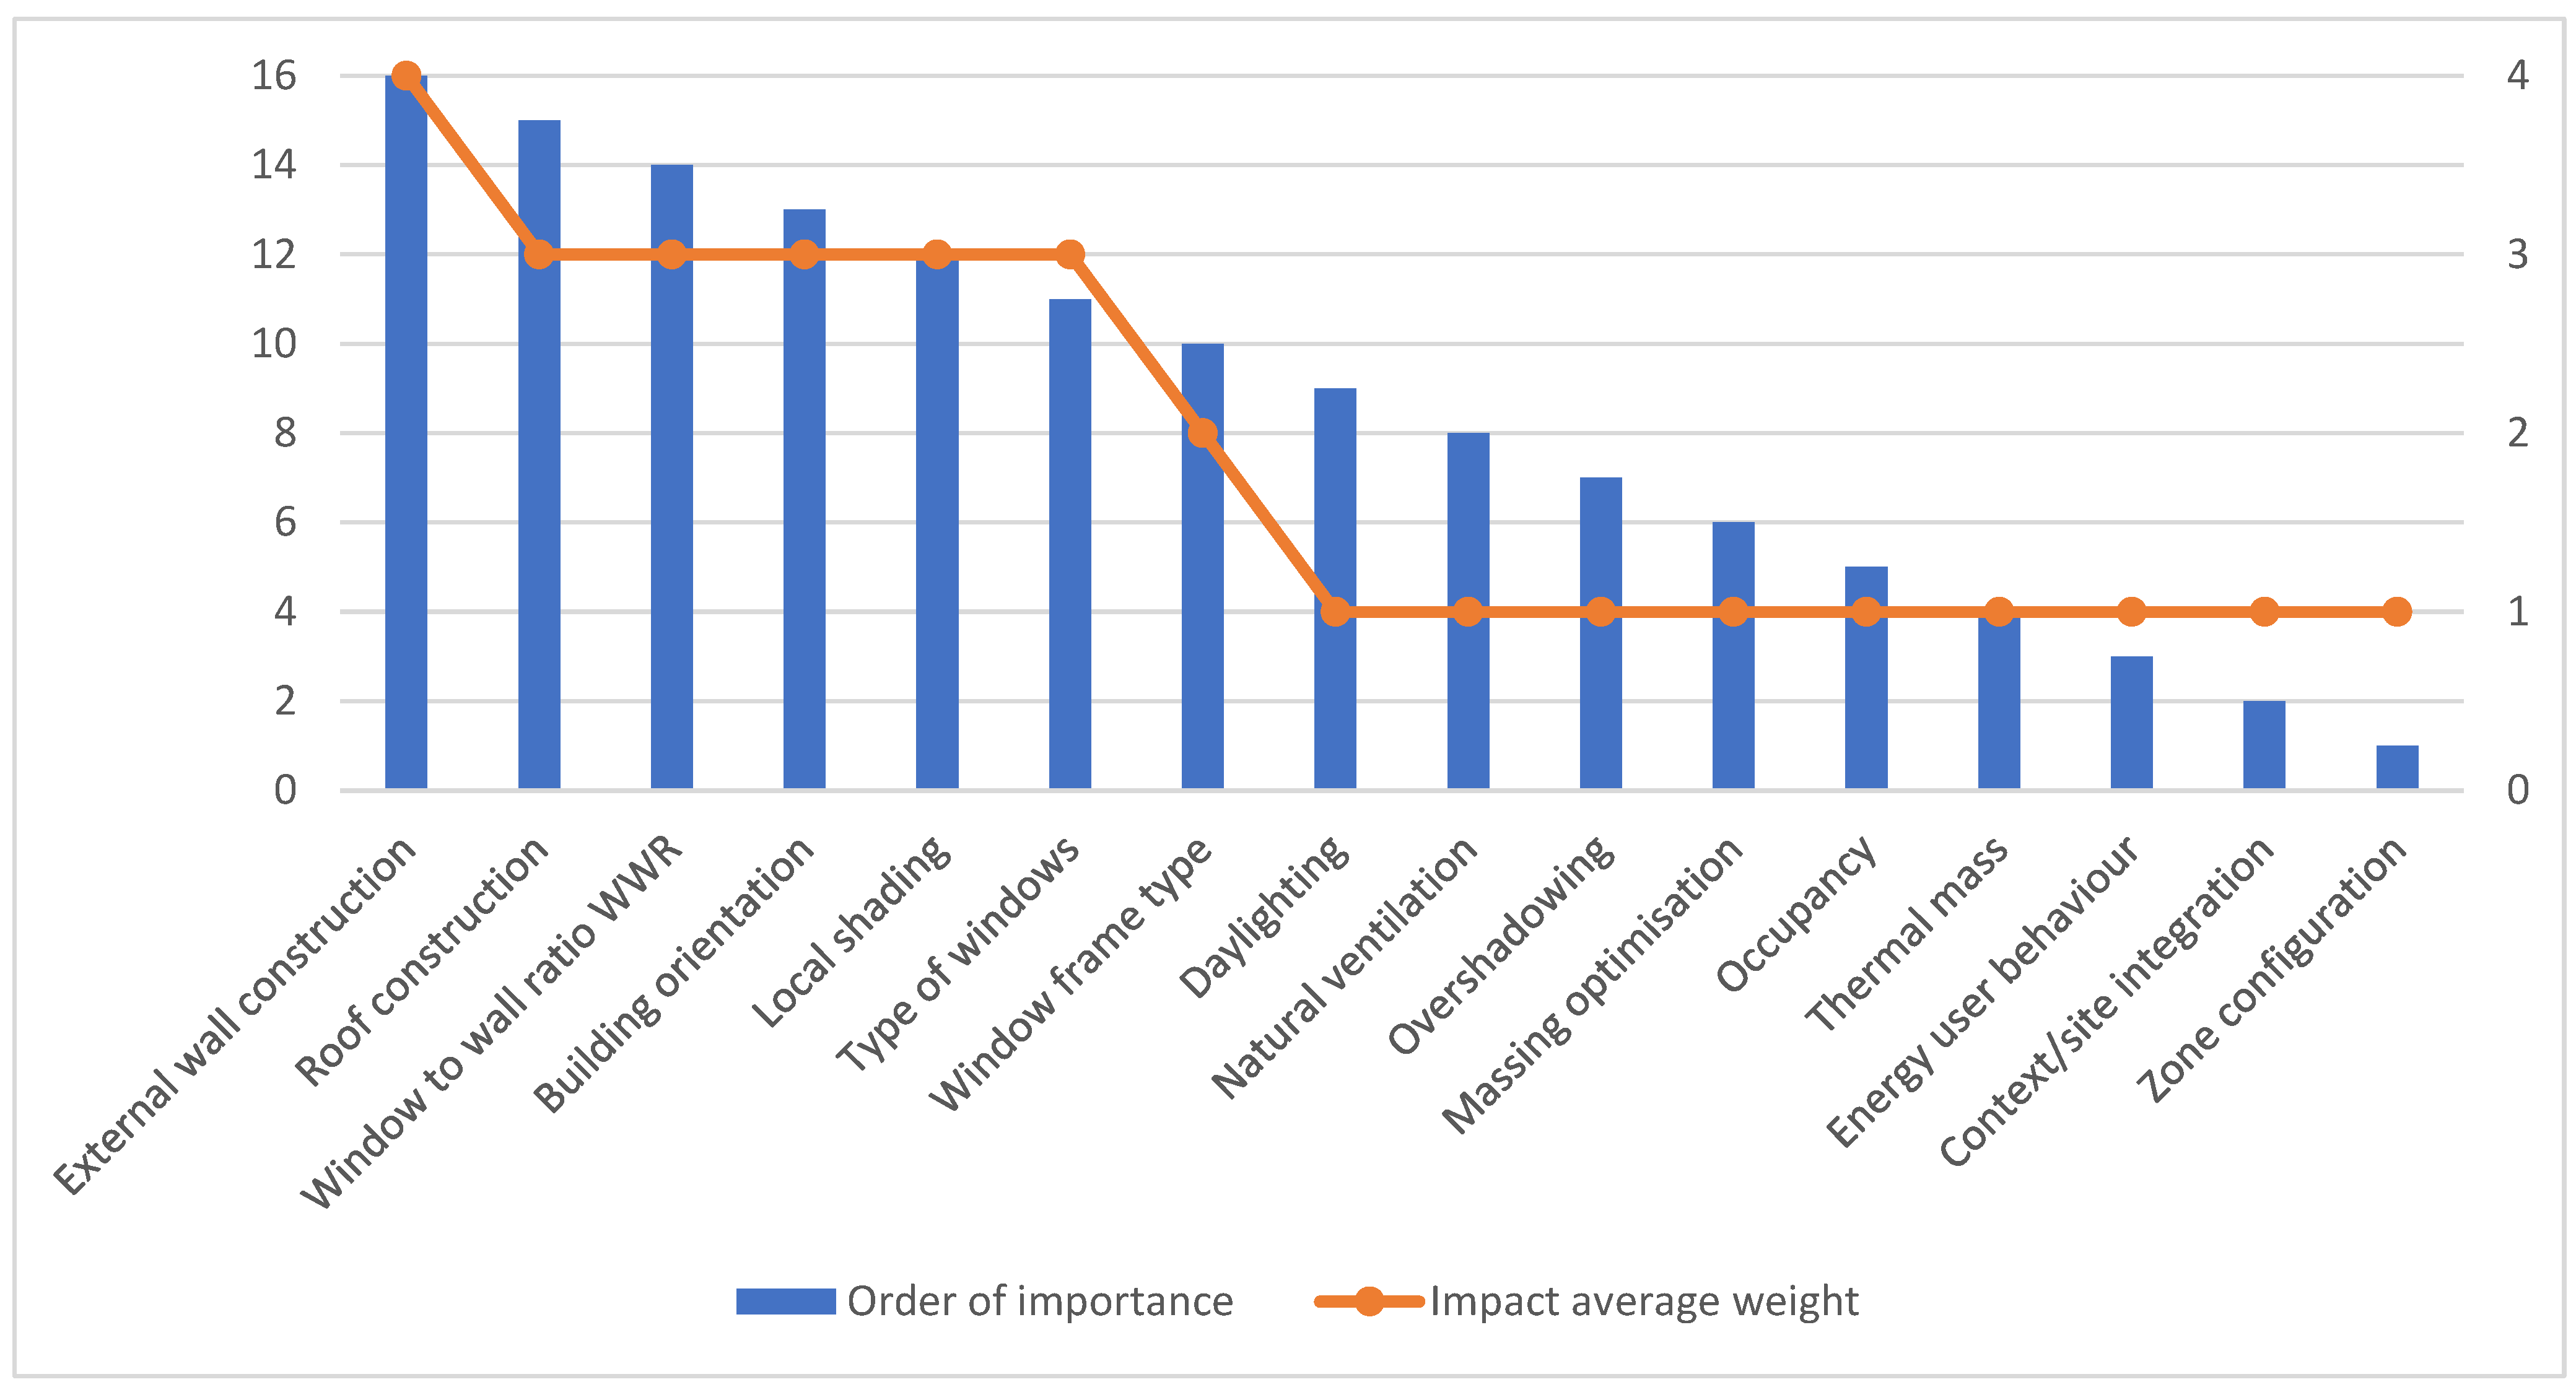
3.2.4. Questionnaire Survey to Identify Pertinent Design Variables
- Activity: The average occupancy for residential apartments in Algeria is four people per apartment. A typical family would consist of a father, mother, and two to three children. From the building layout, the total occupancy area of each flat is approximately 90 m2. Therefore, the occupancy density specified in the simulation was 0.055 people/m2. Furthermore, DesignBuilder’s default metabolic factors were used: 1.00 for men, 0.85 for women, and 0.75 for children or an average value if there is a mix of occupants.
- The lighting heat gain was set to 7 W/m2 from the CIBSE energy code of practice [27]. The default diversity factor of 70% was used for the lighting heat gain, since it is unlikely that all lights will be on simultaneously. From the assumed occupancy schedule, lighting in the base case model was set to be used daily from 12:00 to 23:00.
- The heating and cooling setpoint temperatures were selected as default values; 21 °C for heating and 25 °C for cooling.
- Minimum fresh air was assumed to be 10 L/s–person, as suggested in the CIBSE 2015 guide [27]
- Depending on the nature of the treated zone in the energy simulation model, the internal gains, such as from occupants and equipment, were left at their default values from DesignBuilder, depending on the nature of the occupant activity schedule and metabolic rate.
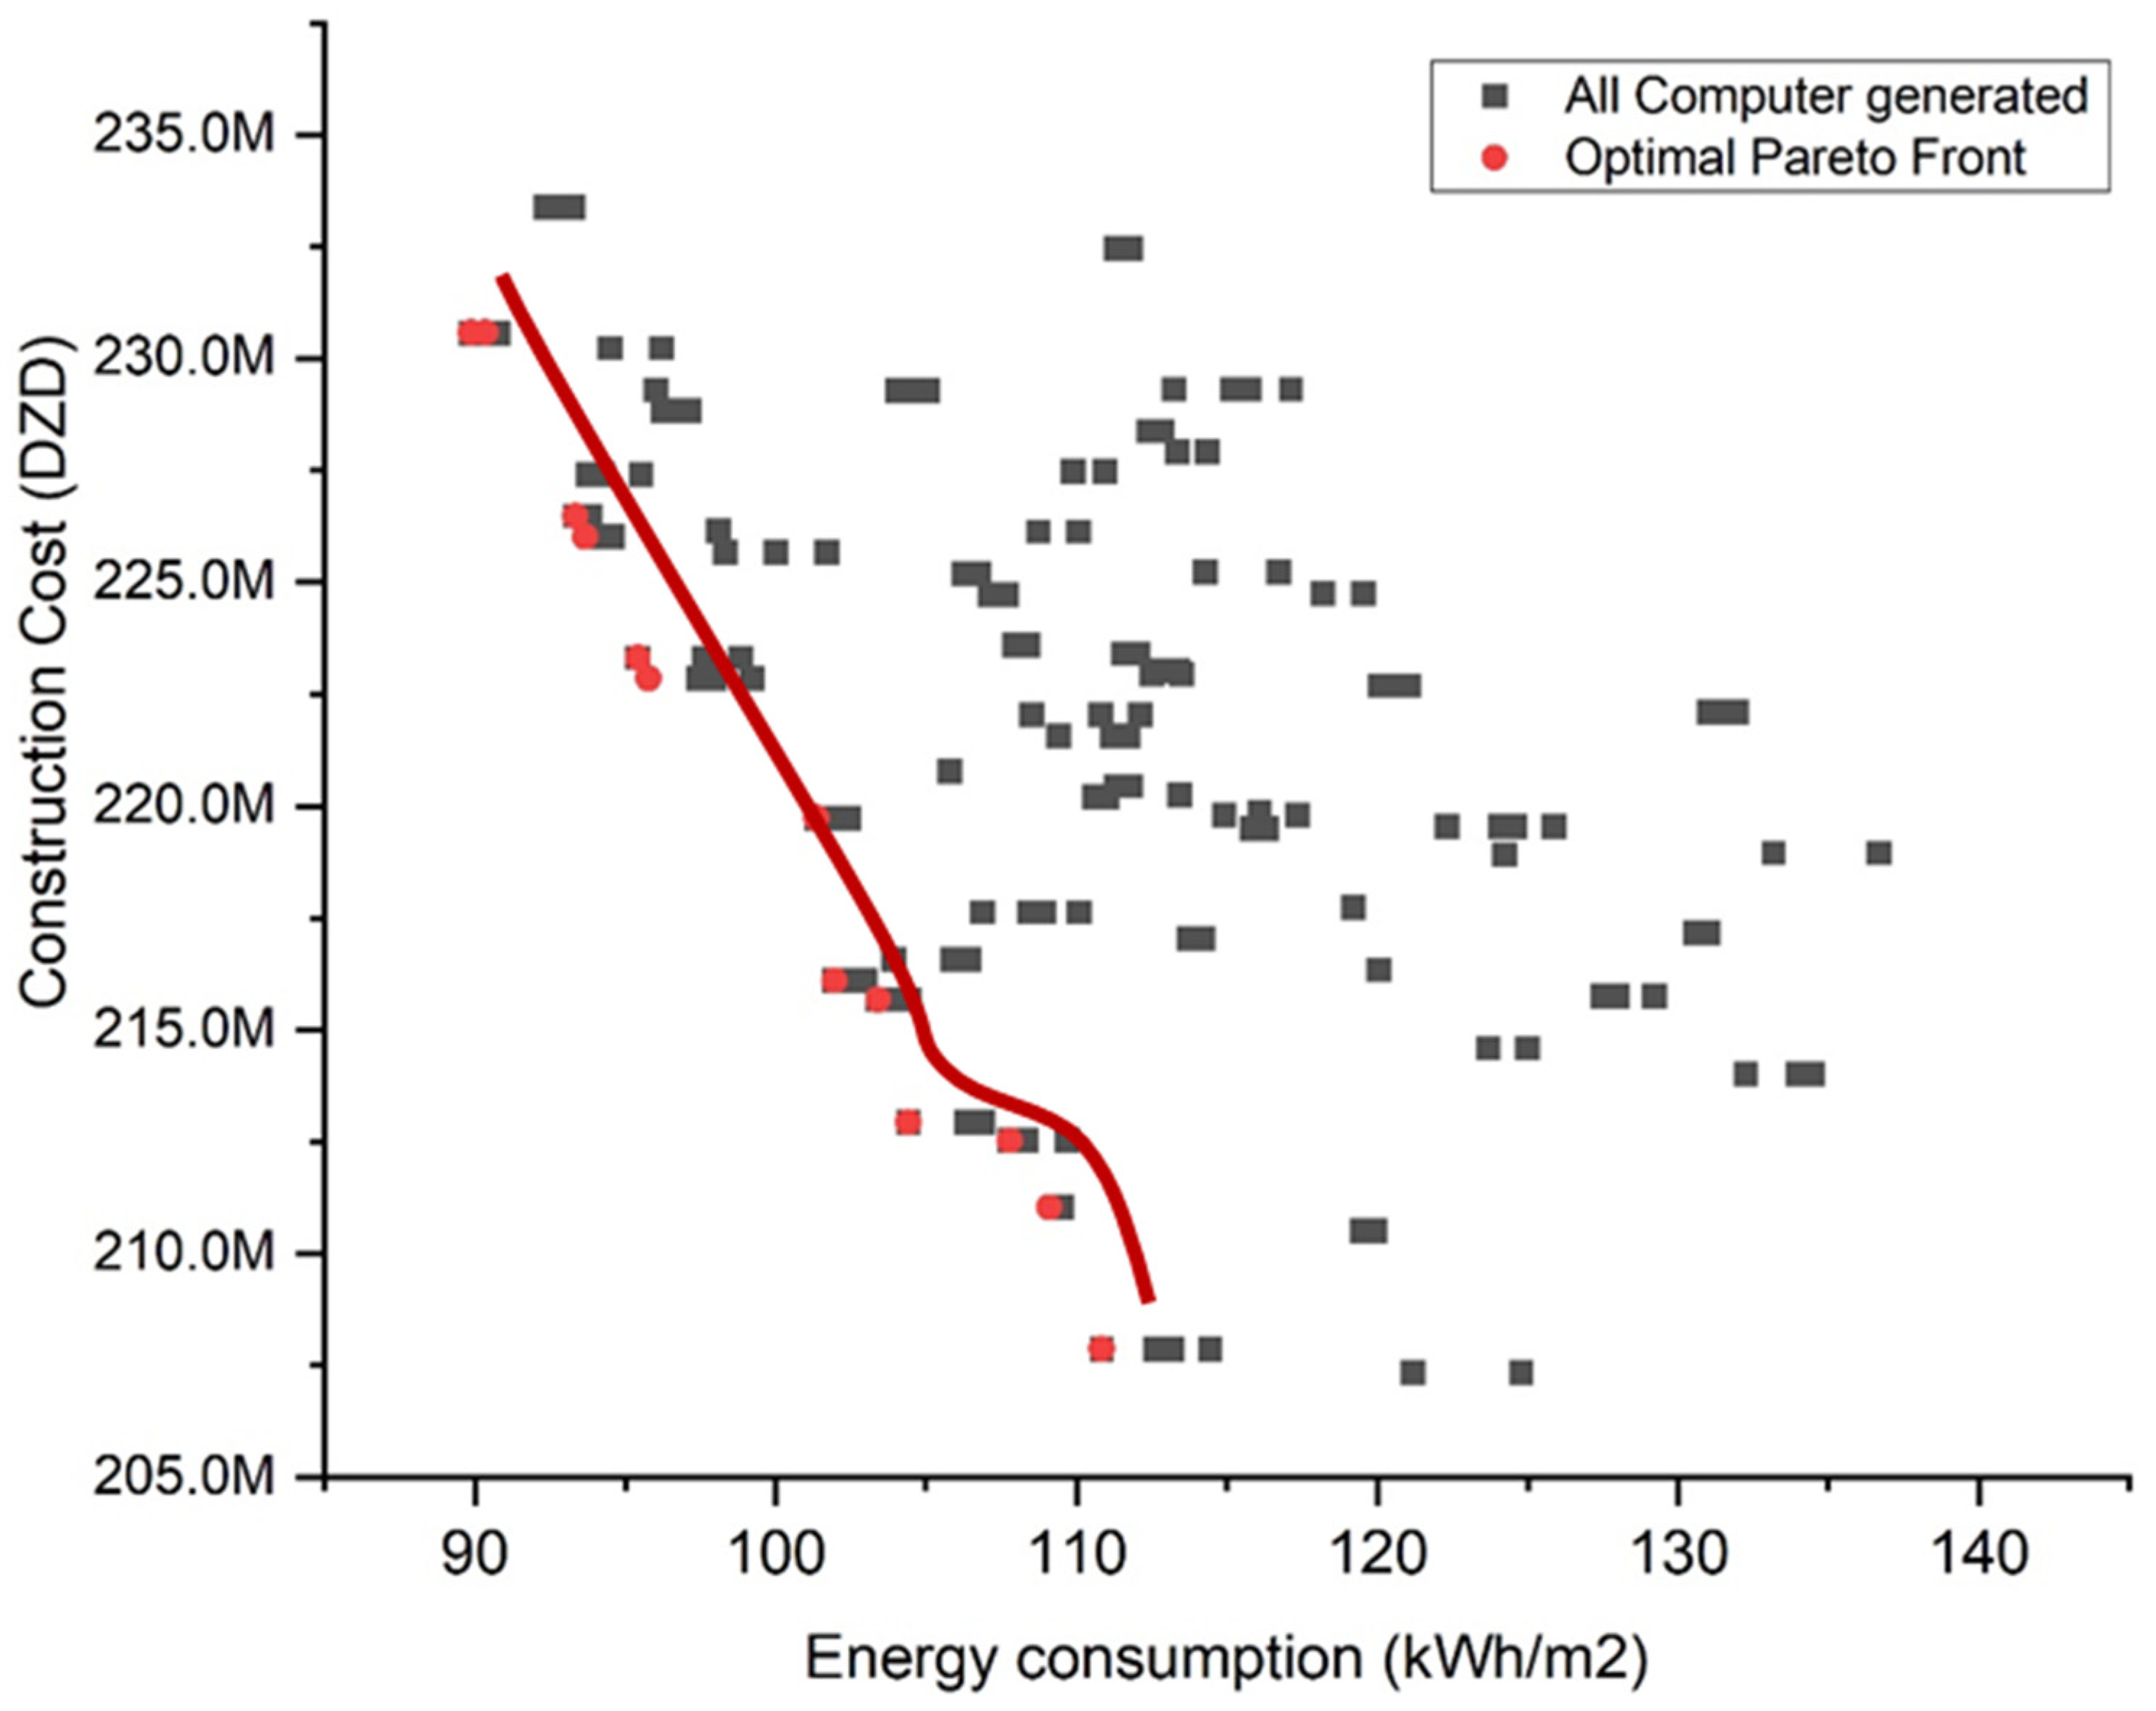
3.3. Computer Optimisation
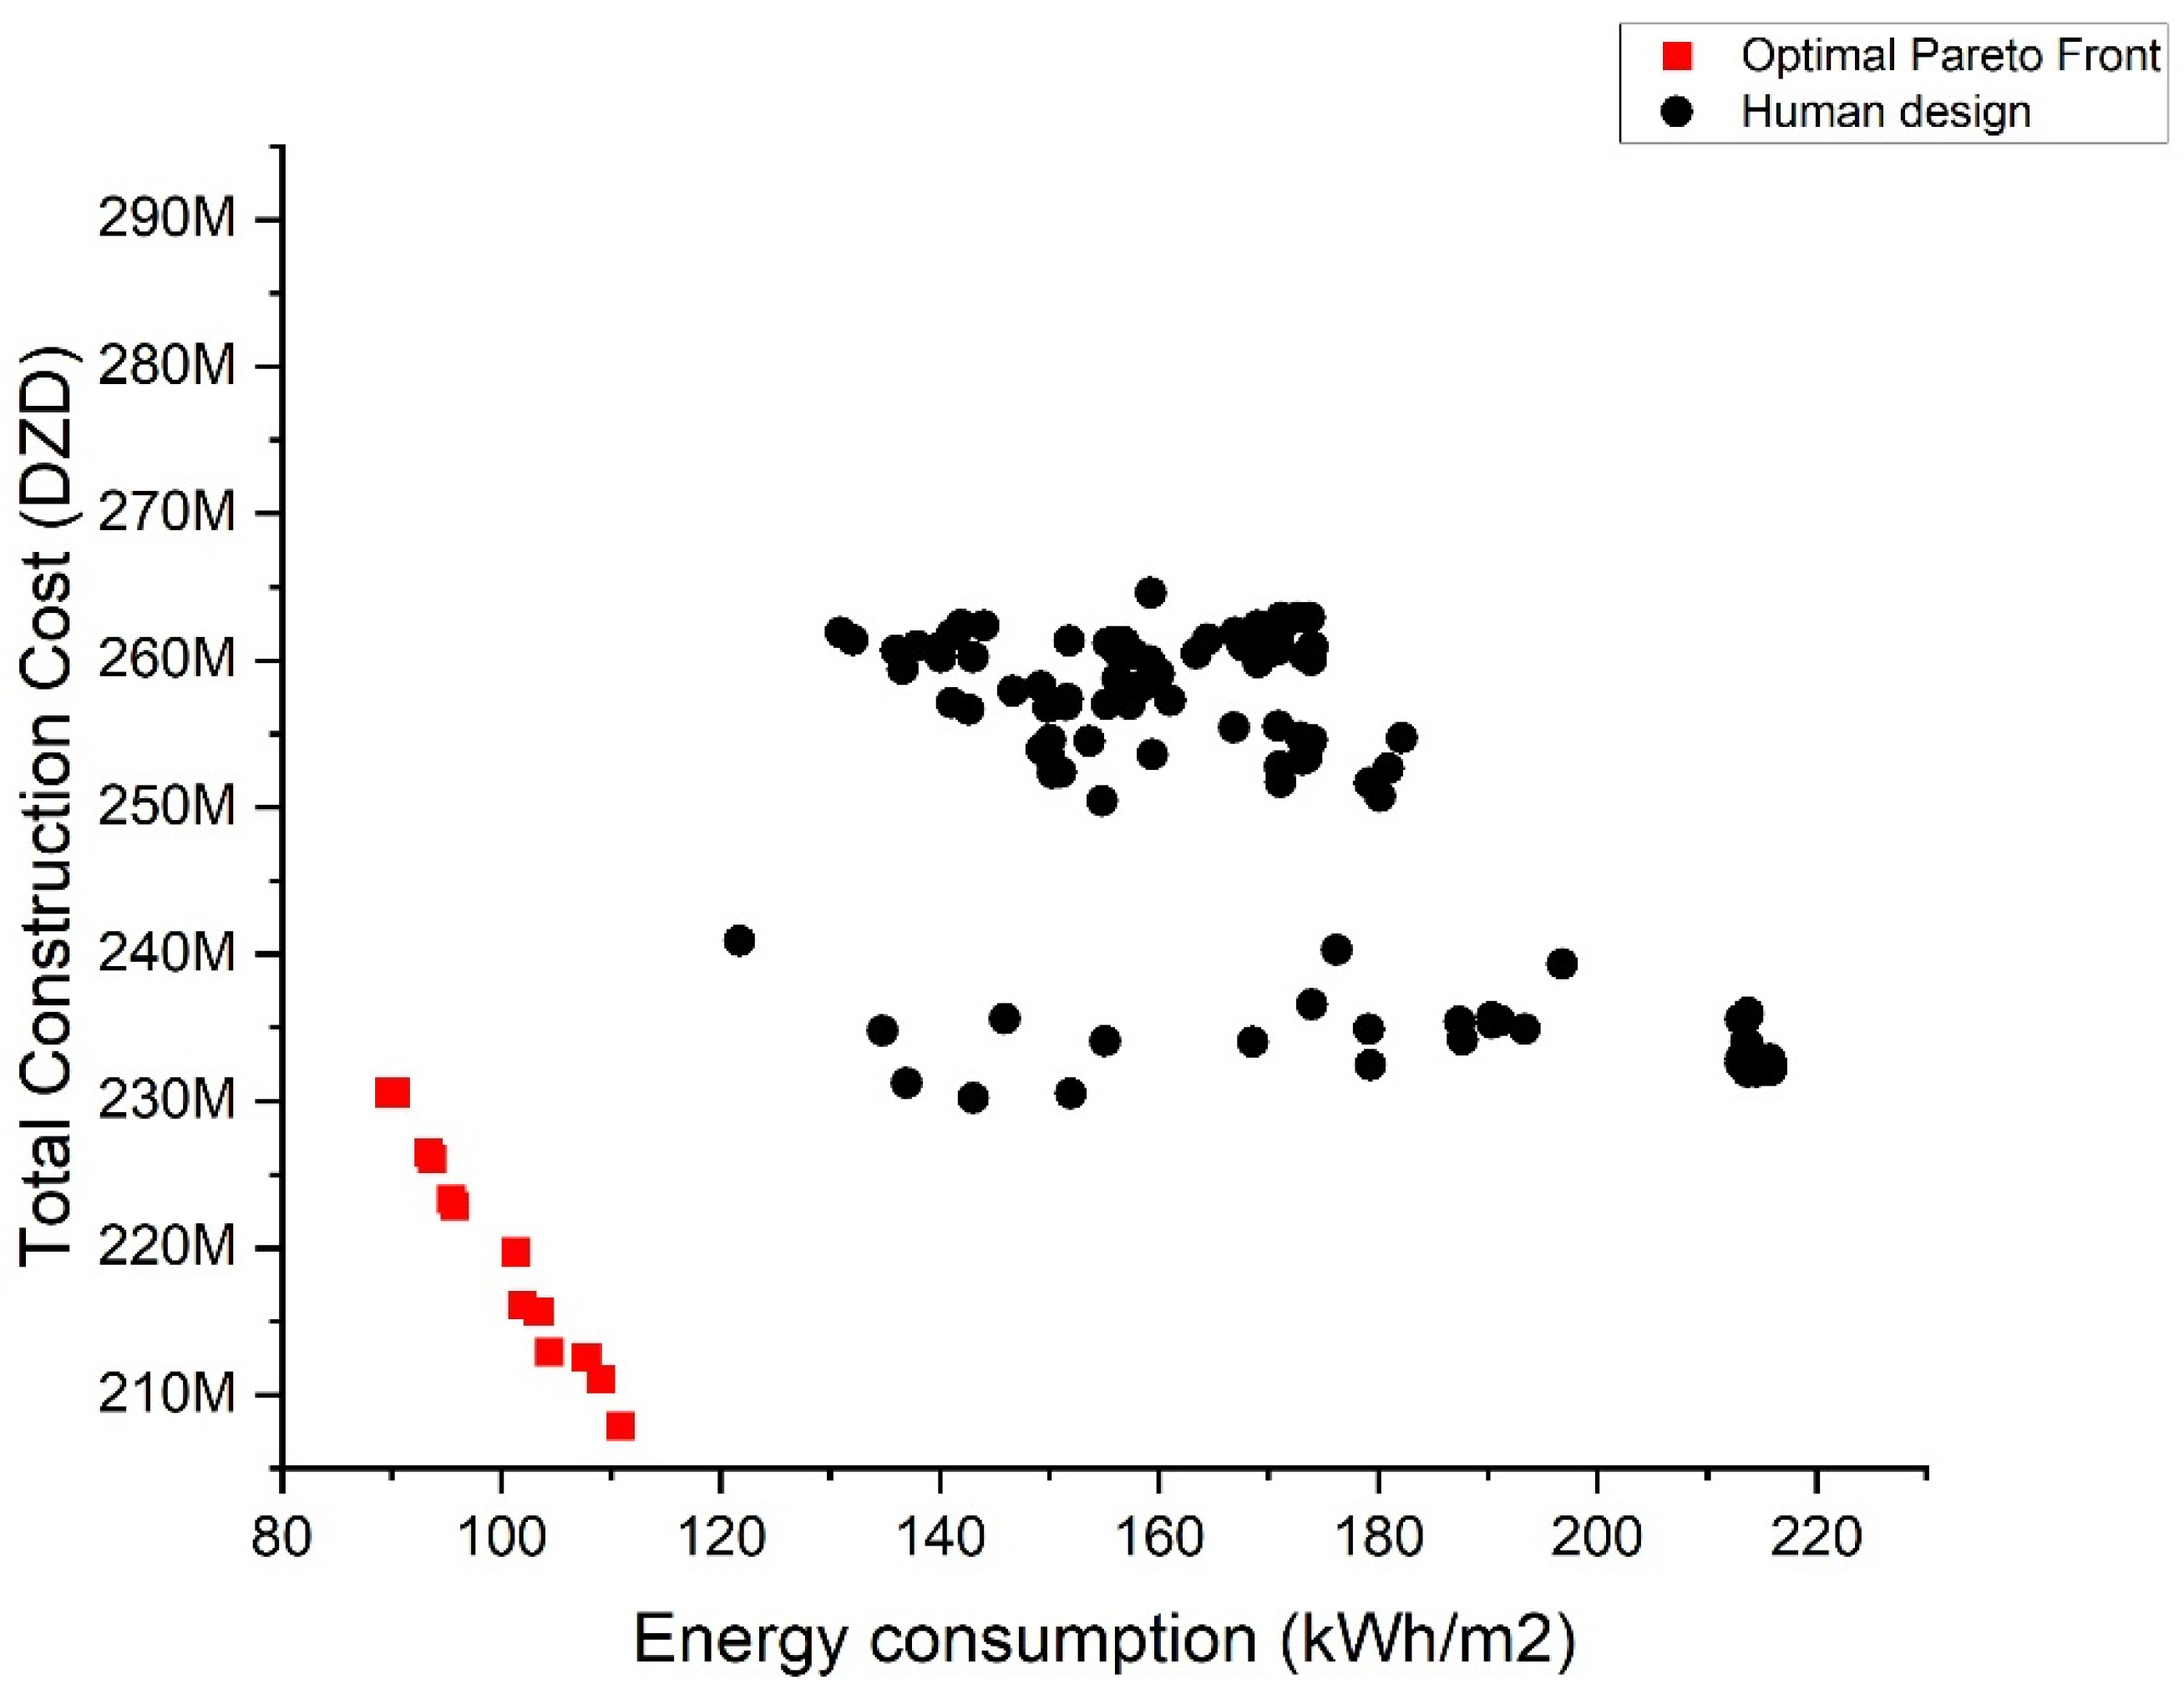
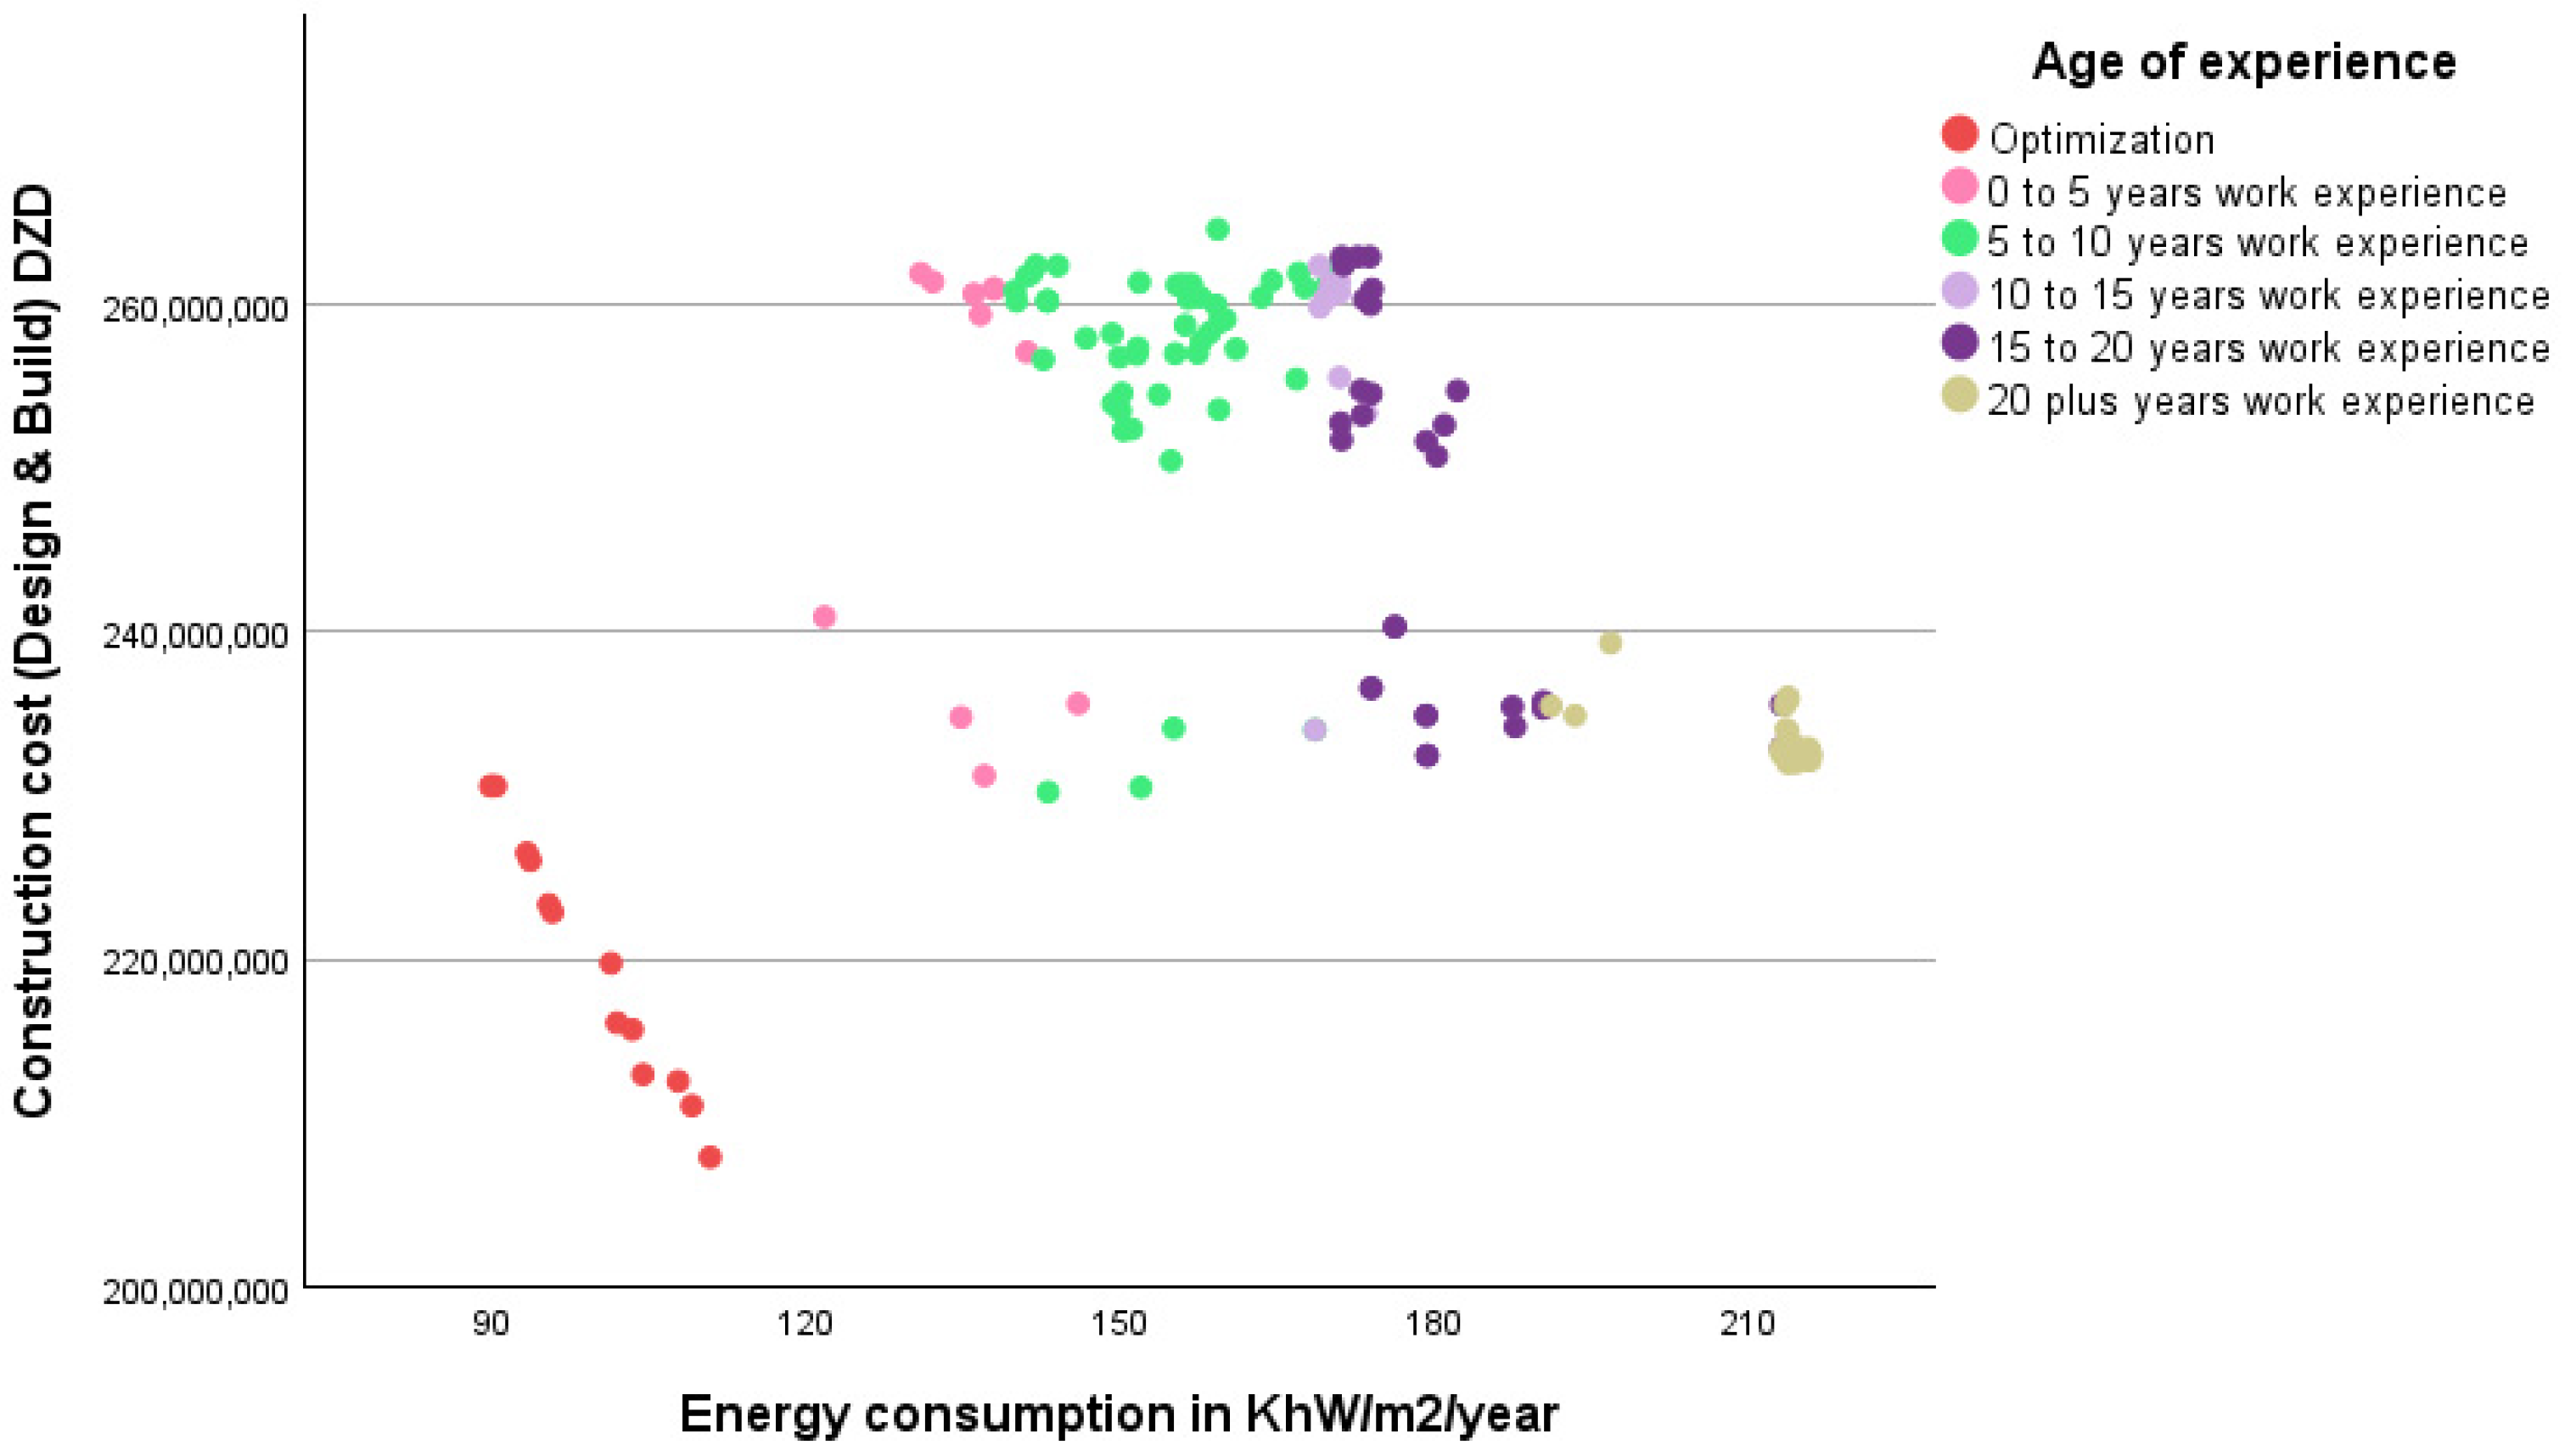
4. Results and Discussion
5. Conclusions
Author Contributions
Funding
Institutional Review Board Statement
Informed Consent Statement
Data Availability Statement
Conflicts of Interest
References
- Mahmoud, R.; Kamara, J.M.; Burford, N. Opportunities and Limitations of Building Energy Performance Simulation Tools in the Early Stages of Building Design in the UK. Sustainability 2020, 12, 9702. [Google Scholar] [CrossRef]
- Terim Cavka, B.; Cavka, H.B.; Salehi, M.M. An Investigation of the Design Process’s Effect on a High-Performance Building’s Actual Energy System Performance. J. Integr. Des. Process Sci. 2022, 26, 85–100. [Google Scholar] [CrossRef]
- Attia, S.; Gratia, E.; De Herde, A.; Hensen, J.L.M. Simulation-Based Decision Support Tool for Early Stages of Zero-Energy Building Design. Energy Build. 2012, 49, 2–15. [Google Scholar] [CrossRef]
- Tresidder, E. Accelerated Optimisation Methods for Low-Carbon Building Design. Ph.D. Thesis, De Montfort University, Leicester, UK, 2014. [Google Scholar]
- Ercan, B.; Elias-Ozkan, S.T. Performance-Based Parametric Design Explorations: A Method for Generating Appropriate Building Components. Des. Stud. 2015, 38, 33–53. [Google Scholar] [CrossRef]
- de Wilde, P. Building Performance Analysis, 1st ed.; Wiley-Blackwell: Hoboken, NJ, USA, 2018. [Google Scholar]
- Urban, B.J. The MIT Design Advisor: Simple and Rapid Energy Simulation of Early-Stage Building Designs. Ph.D. Thesis, Massachusetts Institute of Technology, Cambridge, MA, USA, 2007. [Google Scholar]
- Rezaee, R.; Brown, J.; Haymaker, J.; Augenbroe, G. A Novel Inverse Data Driven Modelling Approach to Performance-Based Building Design during Early Stages. Adv. Eng. Inform. 2019, 41, 100925. [Google Scholar] [CrossRef]
- Hirschi, N.W.; Frey, D.D. Cognition and Complexity: An Experiment on the Effect of Coupling in Parameter Design. Res. Eng. Des. 2002, 13, 123–131. [Google Scholar] [CrossRef]
- Daly, S.R.; Yilmaz, S.; Christian, J.L.; Seifert, C.M.; Gonzalez, R. Design Heuristics in Engineering Concept Generation. J. Eng. Educ. 2012, 101, 601–629. [Google Scholar] [CrossRef]
- Dinar, M.; Shah, J.J.; Cagan, J.; Leifer, L.; Linsey, J.; Smith, S.M.; Hernandez, N.V. Empirical Studies of Designer Thinking: Past, Present, and Future. J. Mech. Des. 2015, 137, 021101. [Google Scholar] [CrossRef]
- Dorst, K. The Core of “design Thinking” and Its Application. Des. Stud. 2011, 32, 521–532. [Google Scholar] [CrossRef]
- Connell, N.A.D.; Klein, J.H.; Powell, P.L. It’s Tacit Knowledge but Not as We Know It: Redirecting the Search for Knowledge. J. Oper. Res. Soc. 2003, 54, 140–152. [Google Scholar] [CrossRef]
- Petersen, S. General Rights Simulation-Based Support for Integrated Design of New Low-Energy Office Buildings. Ph.D. Thesis, Technical University of Denmark, Department of Civil Engineering, Kongens Lyngby, Denmark, 2011. [Google Scholar]
- Stanitsa, A.; Hallett, S.H.; Jude, S. Investigating Key Factors Influencing Decision-Making in the Design of Buildings and Places: A Survey of Stakeholders’ Perception. Archit. Struct. Constr. 2022, 2, 381–401. [Google Scholar] [CrossRef]
- Singh, H.; Cascini, G.; McComb, C. Comparing Design Outcomes Achieved by Teams of Expert and Novice Designers through Agent-Based Simulation. Proc. Des. Soc. 2021, 1, 661–670. [Google Scholar] [CrossRef]
- Björklund, T.A. Initial Mental Representations of Design Problems: Differences between Experts and Novices. Des. Stud. 2013, 34, 135–160. [Google Scholar] [CrossRef]
- Moradi, A.; Kavgic, M.; Costanzo, V.; Evola, G. Impact of Typical and Actual Weather Years on the Energy Simulation of Buildings with Different Construction Features and under Different Climates. Energy 2023, 270, 126875. [Google Scholar] [CrossRef]
- Kalvelage, K.; Passe, U.; Rabideau, S.; Takle, E.S. Changing Climate: The Effects on Energy Demand and Human Comfort. Energy Build. 2014, 76, 373–380. [Google Scholar] [CrossRef]
- Seddiki, M.; Bennadji, A.; Tehami, M. Barriers to the Adoption of Energy Efficiency Measures in Mostaganem, Algeria. J. Constr. Dev. Ctries. 2020, 25, 39–61. [Google Scholar] [CrossRef]
- Sahabi Abed, S.; Matzarakis, A. Seasonal Regional Differentiation of Human Thermal Comfort Conditions in Algeria. Adv. Meteorol. 2017, 2017, 9193871. [Google Scholar] [CrossRef]
- Errebai, F.B.; Derradji, L.; Limam, A.; Amara, M. Energy Efficiency and Economic Profitability between Standard and High Energy Performance Dwellings in a Semi-Arid Climate. Int. J. Ambient. Energy 2022, 43, 4020–4036. [Google Scholar] [CrossRef]
- Hamdy, M.; Palonen, M.; Hasan, A. Implementation of Pareto-Archive Nsga-Ii Algorithms to a Nearly-Zero-Energy Building Optimisation Problem. In Proceedings of the BSO Conference 2012: 1st Conference of IBPSA-England, Loughborough, UK, 10–11 September 2012; IBPSA: Loughborough, UK, 2012; pp. 181–188. [Google Scholar]
- Sasena, M.J.; Papalambros, P.; Goovaerts, P. Exploration of Metamodeling Sampling Criteria for Constrained Global Optimization. Eng. Optim. 2002, 34, 263–278. [Google Scholar] [CrossRef]
- Baglivo, C.; Congedo, P.M.; Fazio, A.; Laforgia, D. Multi-Objective Optimization Analysis for High Efficiency External Walls of Zero Energy Buildings (ZEB) in the Mediterranean Climate. Energy Build. 2014, 84, 483–492. [Google Scholar] [CrossRef]
- ISO 10456:2007; Building Materials and Products—Hygrothermal Properties—Tabulated Design Values and Procedures for Determining Declared and Design Thermal Values. International Organization for Standardization: Geneva, Switzerland, 2007.
- Parand, F.; Nicol, F.; Nikolopoulou, M. Environmental Design. (Incorporating Corrections as of May 2019); Chartered Institution of Building Services Engineers: London, UK, 2019. [Google Scholar]
- Negendahl, K.; Nielsen, T.R. Building Energy Optimization in the Early Design Stages: A Simplified Method. Energy Build. 2015, 105, 88–99. [Google Scholar] [CrossRef]
- Hsu, D. Identifying Key Variables and Interactions in Statistical Models Ofbuilding Energy Consumption Using Regularization. Energy 2015, 83, 144–155. [Google Scholar] [CrossRef]
- CYPE Ingenieros; CYPE Ingenieros, S.A.: Alicante, Spain, 2024.
- Wang, B.; Zhou, J.; Koschny, T.; Kafesaki, M.; Soukoulis, C.M. Chiral Metamaterials: Simulations and Experiments. J. Opt. A Pure Appl. Opt. 2009, 11, 114003. [Google Scholar] [CrossRef]
- Du, R.K.J.; El-Gafy, M. Human Computation Enabled Organizational Learning in the Face of Deep Uncertainty: Example of Conceptual Estimating. J. Inf. Technol. Constr. (ITcon) 2015, 20, 275–294. [Google Scholar]
- Elfaki, A.O.; Alatawi, S. Representing the Knowledge of Public Construction Project Cost Estimator by Using Rule-Based Method. J. Build. Constr. Plan. Res. 2015, 03, 189–195. [Google Scholar] [CrossRef]
- Woo, J.H.; Clayton, M.J.; Johnson, R.E.; Flores, B.E.; Ellis, C. Dynamic Knowledge Map: Reusing Experts’ Tacit Knowledge in the AEC Industry. Autom. Constr. 2004, 13, 203–207. [Google Scholar] [CrossRef]
- Zhang, G.; Raina, A.; Cagan, J.; McComb, C. A Cautionary Tale about the Impact of AI on Human Design Teams. Des. Stud. 2021, 72, 100990. [Google Scholar] [CrossRef]


| Choices for Building Envelope Variable | Layers | Choices for Layer Thickness Choices (mm) |
|---|---|---|
| Types of external walls; the choice of internal/external insulation was left to the participants | ||
| External heavyweight wall Type 1 | Concrete | 90/100/110/120/130/140/150 |
| Polyurethane foam 1 | 20/30/40/50/60/70/80/90/100/120 | |
| Concrete exp. clay | 50 | |
| Polyurethane foam 2 | 20/30/40/50/60/70/80/90/100/110/120/130/140 | |
| Concrete | 100 | |
| External heavyweight wall Type 2 | Concrete | 10/20/30/40/50/60/70/80/90/100/110/120/130/140/150 |
| Cork panel exp. | 10/20/30/40/50/60/80/100/120/140/160 | |
| Cellulose fibre | 30/40/50/60/80/100/120/140/160/180 | |
| Brick | 120 | |
| Polyethylene exp. | 2/3/4/5/6/8/10/12/15/20/25/30 | |
| External heavyweight wall Type 3 | Concrete | 90/100/110/120/130/140/150 |
| Polyurethane foam 1 | 20/30/40/50/60/70/80/90/100/120 | |
| Cross-laminated timber panels | 60/78/95/128/146/162/202 | |
| Polyurethane foam 2 | 20/30/40/50/60/70/80/90/100/110/120/130/140 | |
| Plaster | 15 | |
| External lightweight wall Type 4 | Concrete | 90/100/110/120/130/140/150 |
| Hemp fibre | 30/40/50/60/80/100/120/140/160/180/200/220/240 | |
| Air | 5/10/15/20/25/30/35/40/45/50 | |
| Cross-laminated timber panels | 60/78/95/128/146/162/202 | |
| Cork panel exp. | 10/20/30/40/50/60/80/100/120/140/160 | |
| External lightweight wall Type 5 | Concrete | 90/100/110/120/130/140/150 |
| Fibreboard | 20/40/60/80/100/120/140/160 | |
| Polyethene exp. | 2/3/4/5/8/10/12/15/20/25/30 | |
| Cork panel exp. | 10/20/30/40/50/60/80/100/120/140/160 | |
| Plaster | 15 | |
| External lightweight wall Type 6 | Concrete | 90/100/110/120/130/140/150 |
| Wood fibre hardboard | 20/40/60/80/100/120/140/160 | |
| Wood fibre hardboard | 20/40/60/80/100/120/140/160 | |
| Polyurethane foam 1 | 20/30/40/50/60/70/80/90/100/120 | |
| OSB (Oriented Strand Board) | 15/18/22/25 | |
| Roof type | ||
| Ground floor This part is fixed | Ceramic finishing | 7 |
| Cement mortar | 50 | |
| Polystyrene | 0 to 50 | |
| Reinforced concrete slab | 200 | |
| Roof type 1-hollow core | Plasterboard | 15 |
| Hollow concrete slab | 160 | |
| Compression slab | 40 | |
| Polystyrene | 0 to 180 | |
| Sealing layer | 20 | |
| Roof type 2-prestressed reinforced concrete | Plasterboard | 15 |
| Solid slab | 150 | |
| Vapour barrier | 20 | |
| Polystyrene | 0 to 180 | |
| Sealing layer | 20 | |
| Window Variables | Window Layer Thickness (mm) | U-Value (W/m2 K) | SHGC | Solar Transmission | Solar Reflectance | Visual Transmission |
|---|---|---|---|---|---|---|
| Single glazing (Glz1) | 2.5 | 5.74 | 0.87 | 0.85 | 0.075 | 0.901 |
| Double glazing filled with air (Glz2) | 2.5/12.7/2.5 | 2.95 | 0.777 | 0.727 | 0.129 | 0.817 |
| Triple glazing filled with air (Glz3) | 2.5/12.7/2.5/12.7/2.5 | 2 | 0.7 | 0.624 | 0.168 | 0.744 |
| Double glazing filled with air +1 low emissivity layers facing inward (Glz4) | 3/12.7/2.5 | 1.76 | 0.597 | 0.544 | 0.22 | 0.769 |
| Double glazing filled with argon +1 low emissivity layers facing inward (Glz5) | 3/12.7/2.5 | 1.43 | 0.596 | 0.544 | 0.22 | 0.769 |
| Other Variables | Symbol | Lower Limit | Upper Limit | Unit |
|---|---|---|---|---|
| Shading coefficient of windows facing south | SCs | 0 | 1 | - |
| Shading coefficient of windows facing east | SCe | 0 | 1 | - |
| Shading coefficient of windows facing west | SCw | 0 | 1 | - |
| Glazing | Glz | Glz1, Glz2, Glz3, Glz4, Glz5 | - | - |
| Type of window frame | WF | Aluminium, Wood, UPVC | - | - |
| Building Orientation | BO | ±45°, ±90° | - | Degrees from North |
| Window-to-wall ratio | WWR | 20 | 90 | % |
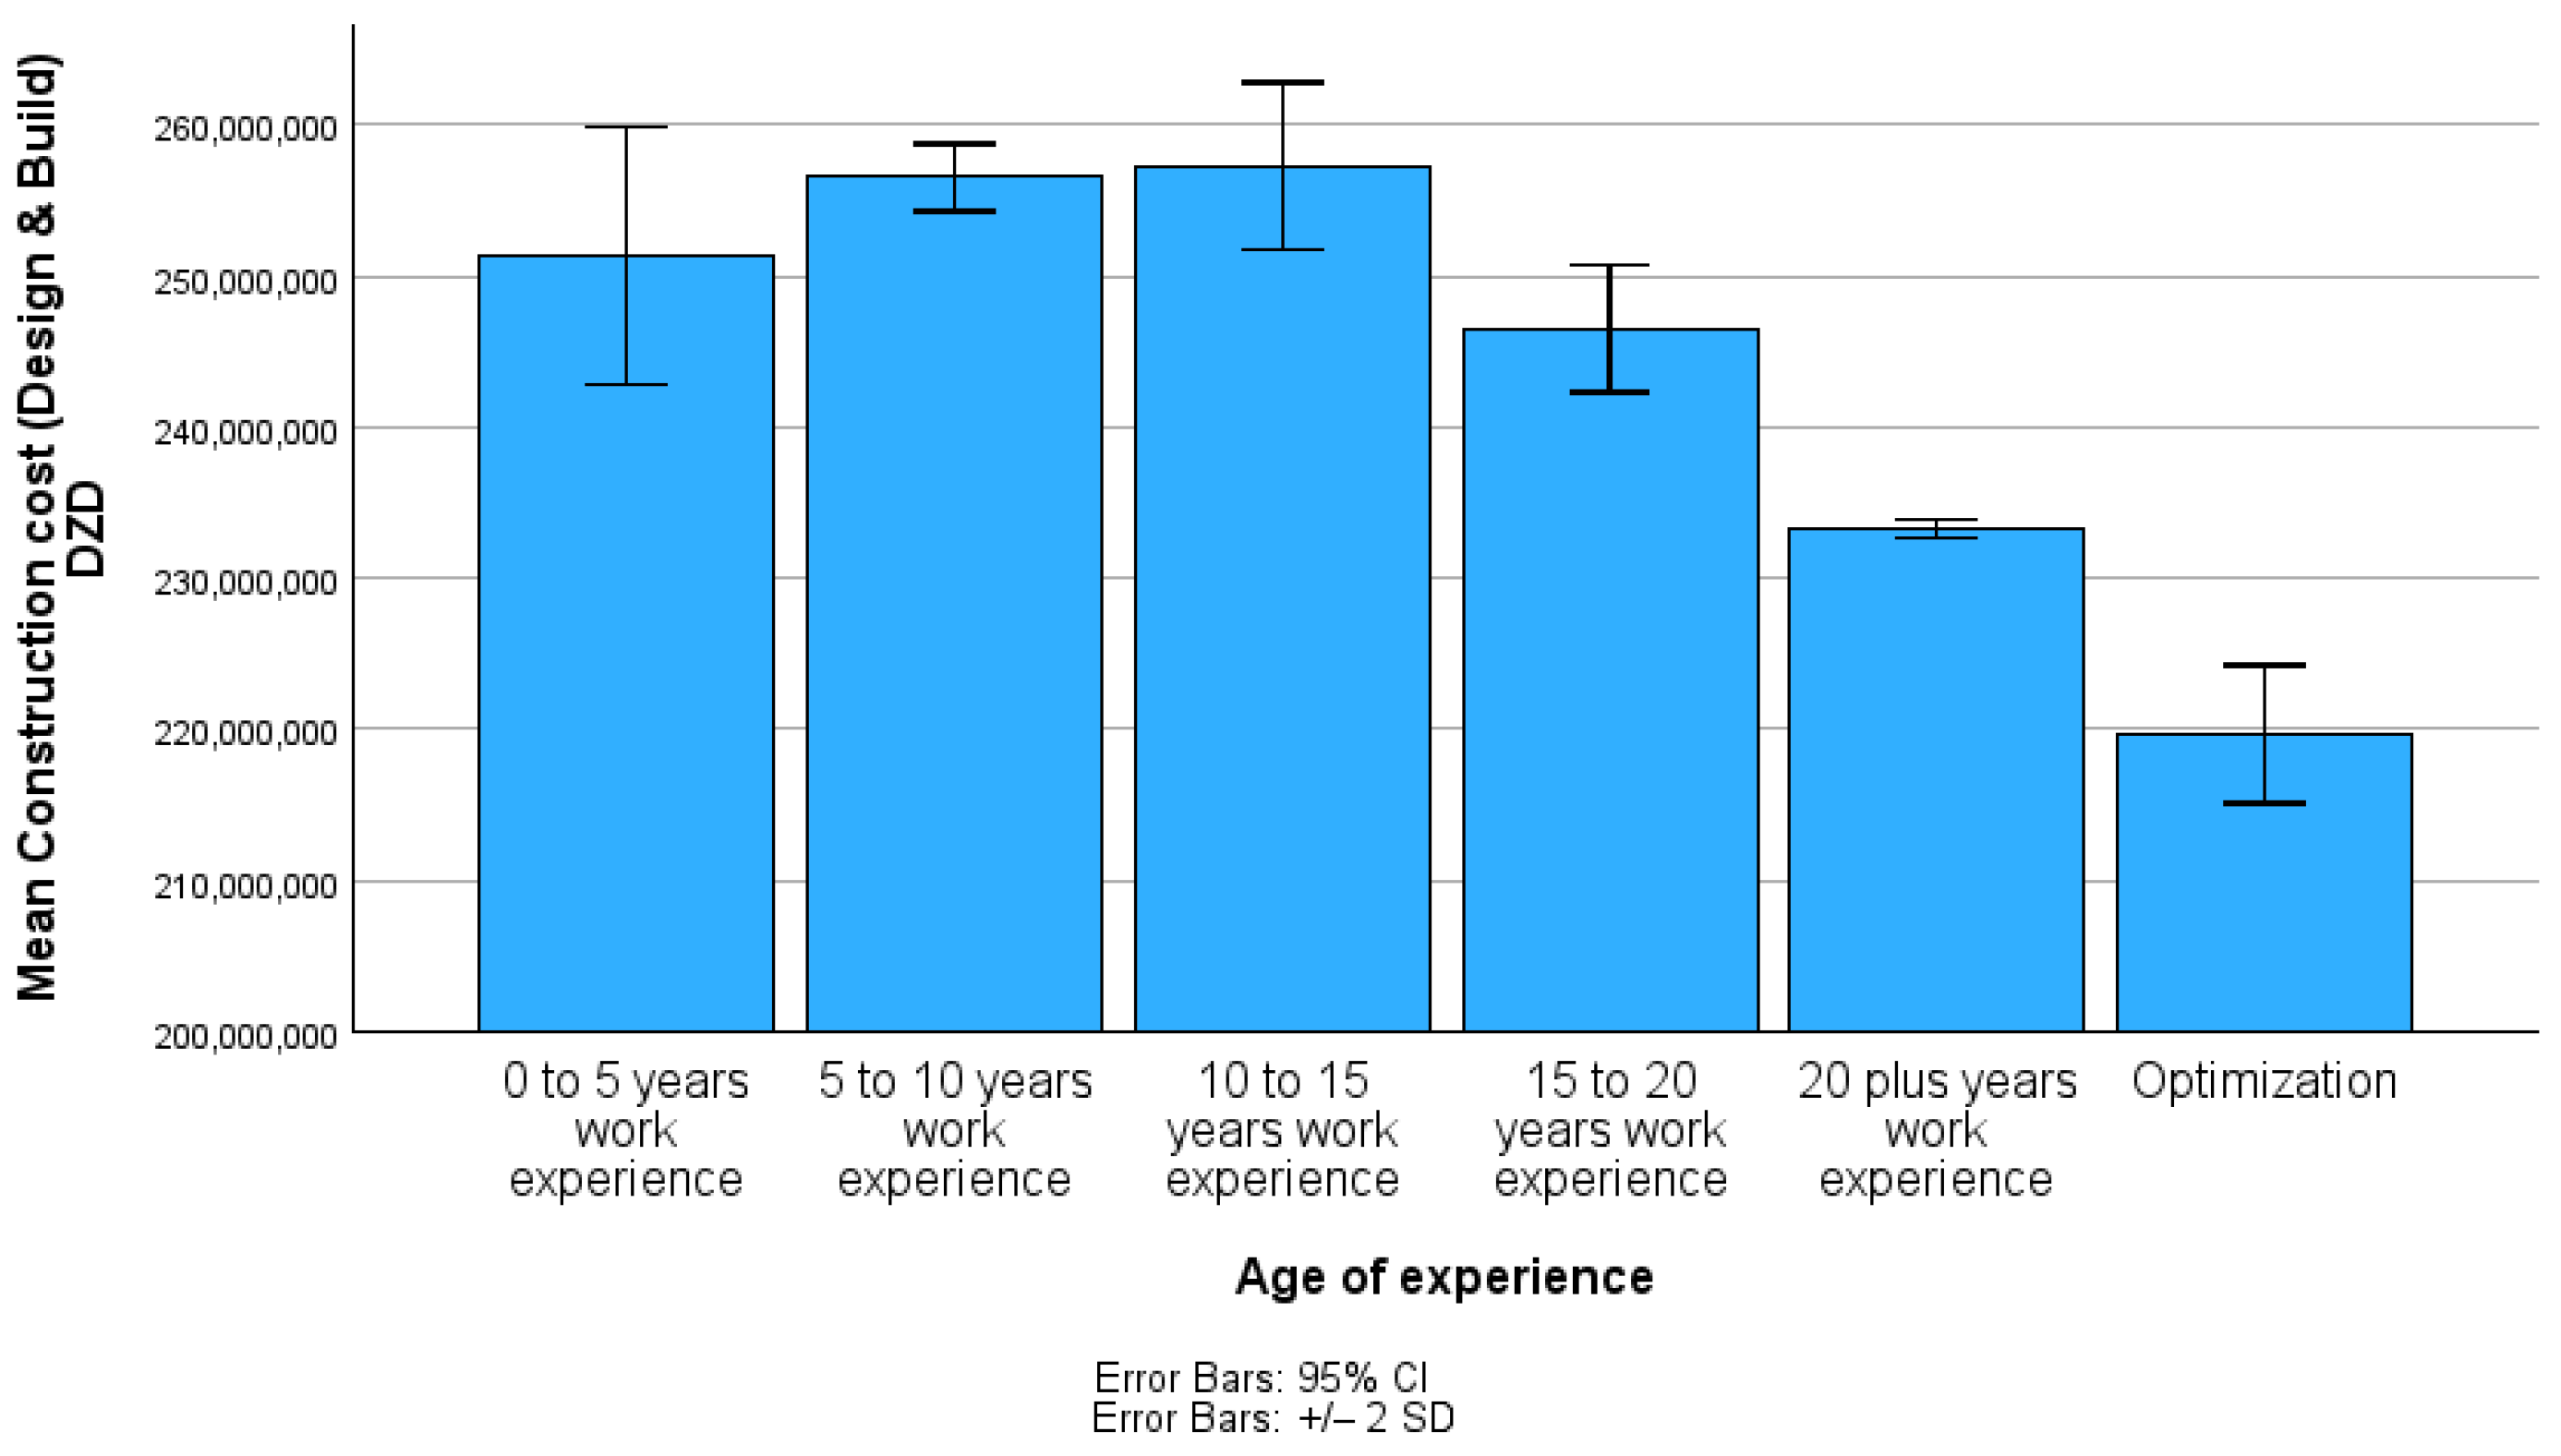
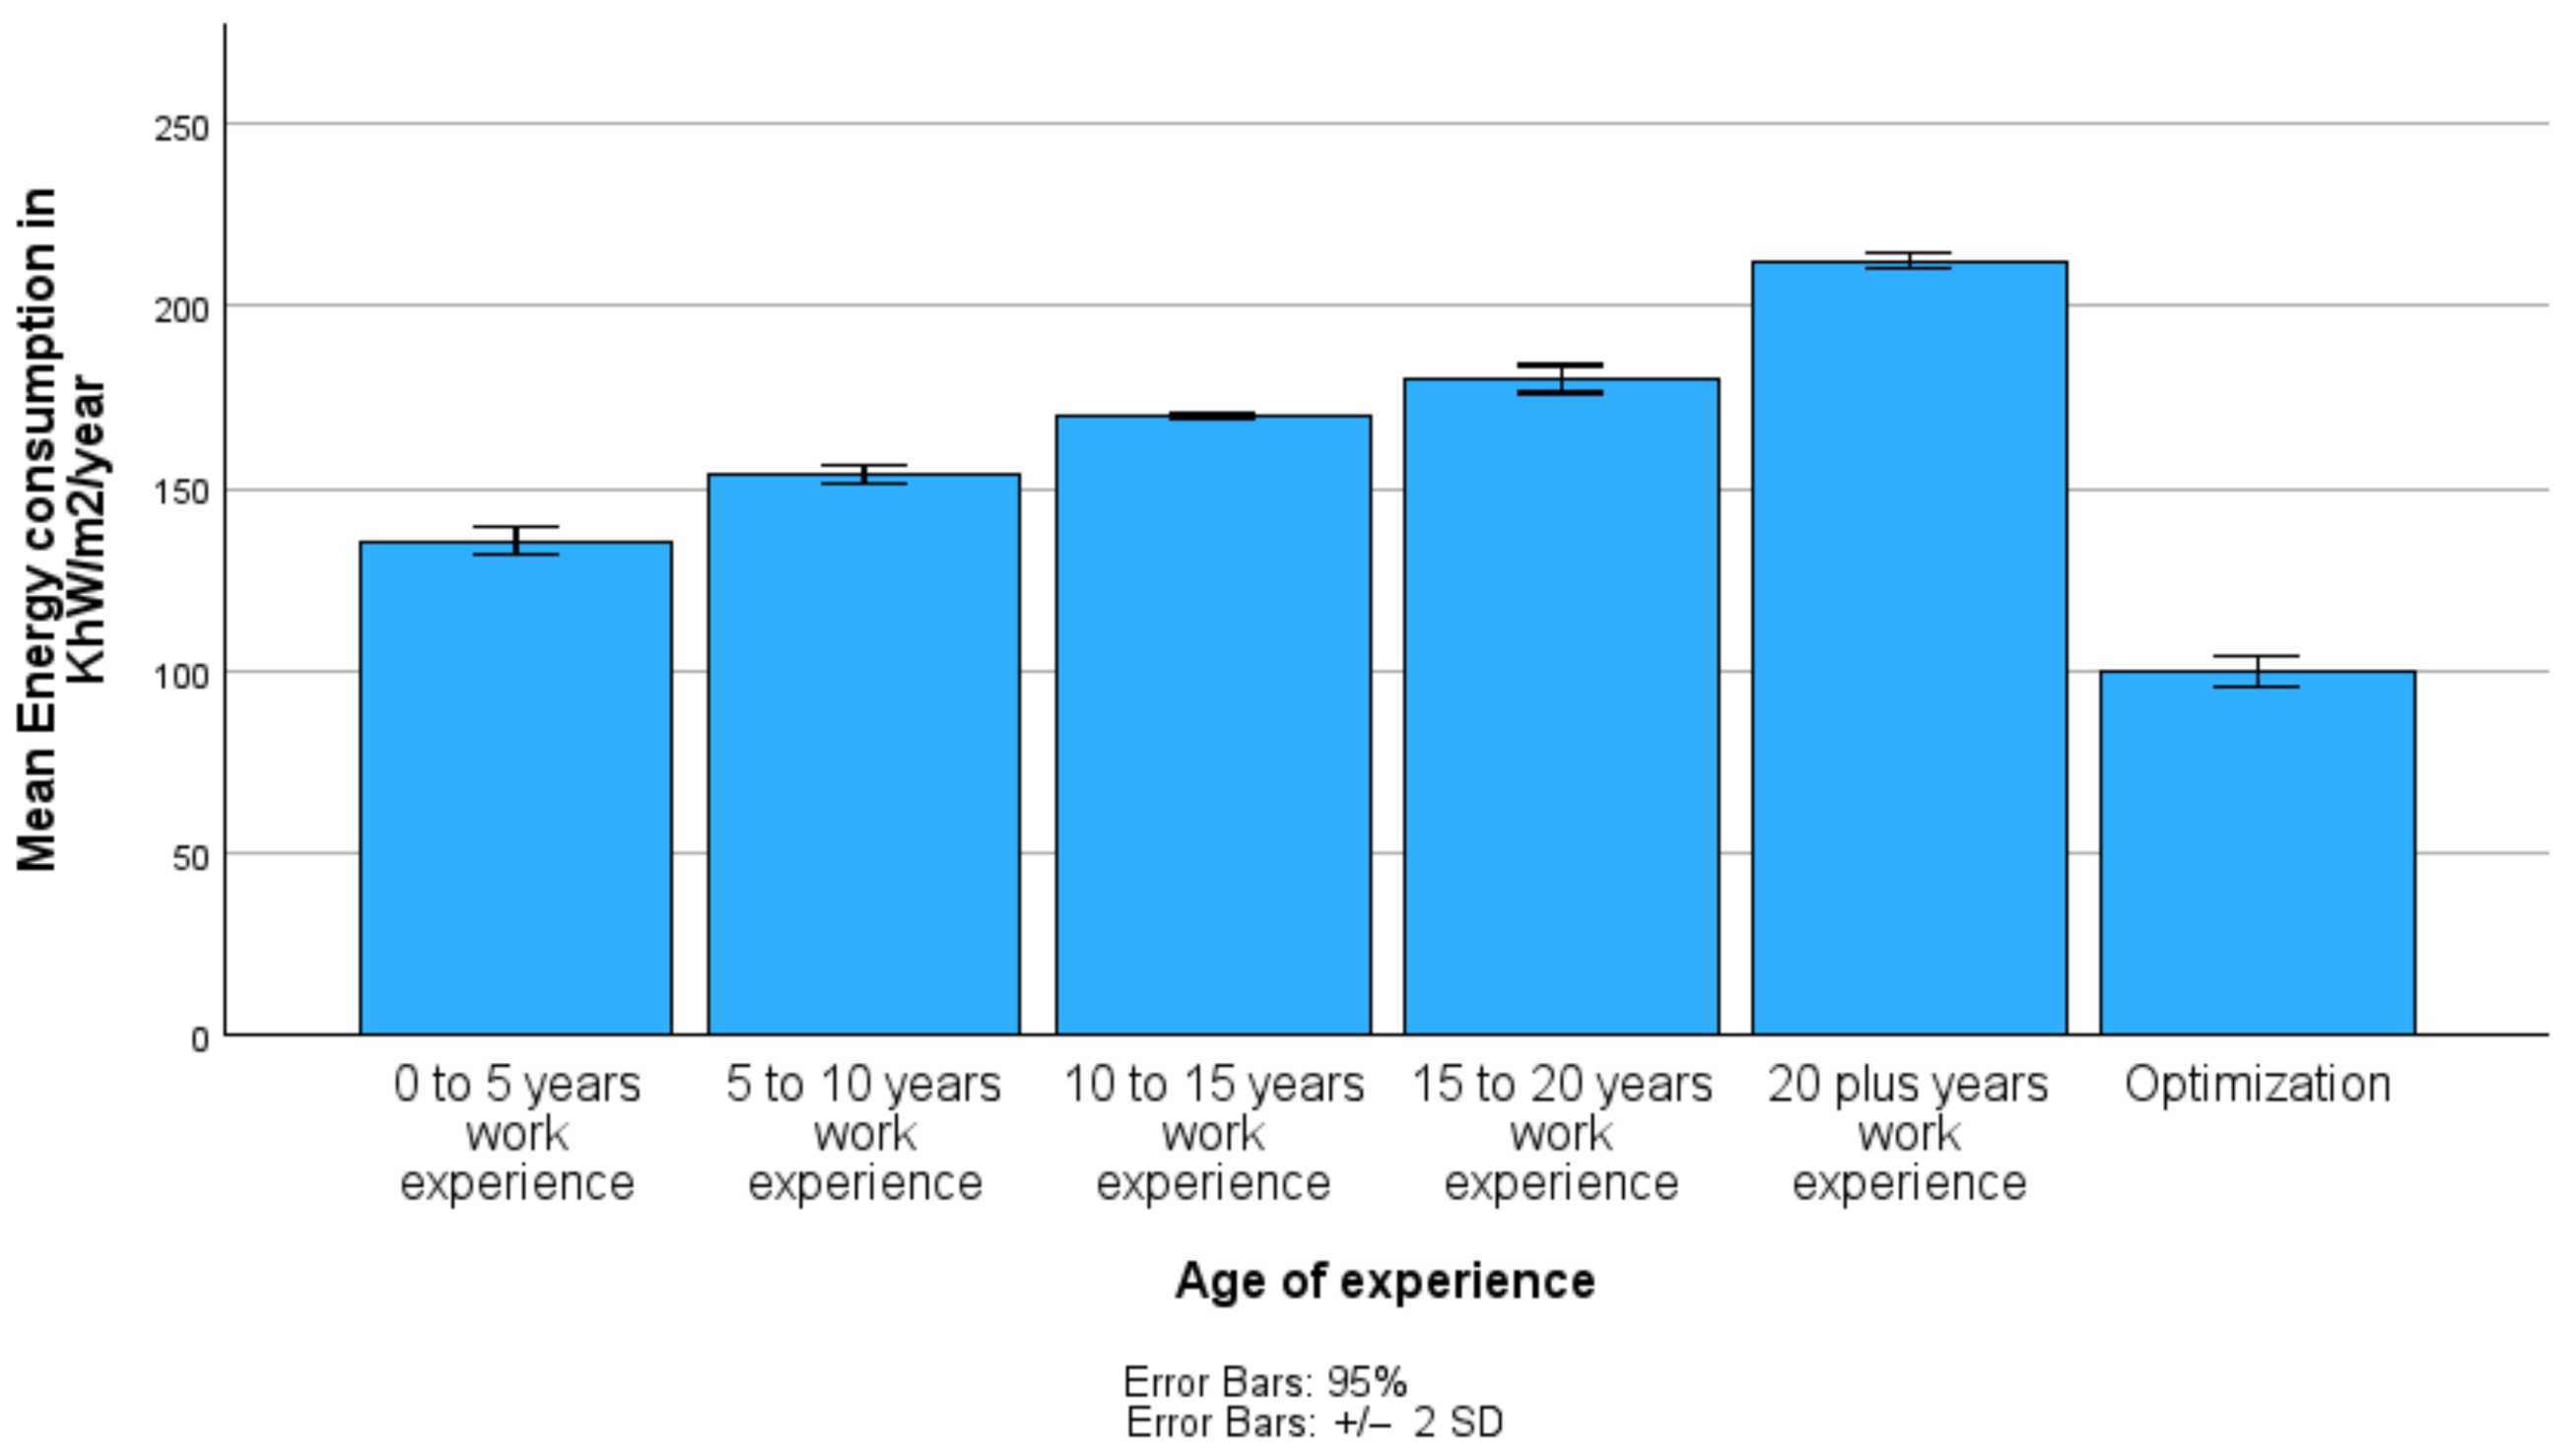
| Human Designs | Energy kWh/m2/Year | Construction Cost in Euros |
|---|---|---|
| Architect 1 | 143.07 | 260,210,000.00 |
| Architect 2 | 151.67 | 257,351,000.00 |
| Architect 3 | 150.01 | 253,508,000.00 |
| Architect 4 | 173.47 | 253,367,000.00 |
| Architect 5 | 172.64 | 262,919,000.00 |
| Architect 6 | 157.38 | 257,025,000.00 |
| Architect 7 | 182.19 | 254,735,000.00 |
| Architect 8 | 174.04 | 260,942,000.00 |
| Architect 9 | 156.81 | 261,224,000.00 |
| Architect 10 | 214.39 | 232,977,000.00 |
| Architect 11 | 215.87 | 232,580,000.00 |
| Architect 12 | 190.56 | 235,461,000.00 |
| Architect 13 | 163.46 | 260,451,000.00 |
| Architect 14 | 190.37 | 235,731,000.00 |
| Architect 15 | 215.61 | 232,501,000.00 |
| Architect 16 | 136.03 | 260,651,000.00 |
| Architect 17 | 137.92 | 260,965,000.00 |
| Architect 18 | 215.85 | 232,117,000.00 |
| Architect 19 | 213.73 | 236,004,000.00 |
| Architect 20 | 170.91 | 260,738,000.00 |
| Architect 21 | 213.09 | 235,553,000.00 |
| Architect 22 | 169.02 | 262,370,000.00 |
| Architect 23 | 169.5 | 261,038,000.00 |
| Architect 24 | 169.98 | 260,500,000.00 |
| Architect 25 | 215.3 | 232,201,000.00 |
| Architect 26 | 156.01 | 261,224,000.00 |
| Architect 27 | 173.29 | 260,320,000.00 |
| Architect 28 | 146.72 | 257,943,000.00 |
| Architect 29 | 215.37 | 232,820,000.00 |
| Architect 30 | 143.01 | 260,222,000.00 |
| Architect 31 | 143.02 | 260,222,000.00 |
| Architect 32 | 151.1 | 252,390,000.00 |
| Architect 33 | 173.1 | 253,239,000.00 |
| Architect 34 | 170.7 | 262,200,000.00 |
| Architect 35 | 161.04 | 257,285,000.00 |
| Architect 36 | 171.3 | 262,416,000.00 |
| Architect 37 | 155.23 | 257,001,000.00 |
| Architect 38 | 214.85 | 232,773,000.00 |
| Architect 39 | 143.1 | 230,201,000.00 |
| Architect 40 | 153.69 | 254,490,000.00 |
| Architect 41 | 150.29 | 252,309,000.00 |
| Architect 42 | 172.96 | 254,765,000.00 |
| Architect 43 | 173.79 | 262,919,000.00 |
| Architect 44 | 156.1 | 289,391,000.00 |
| Architect 45 | 180.2 | 250,731,000.00 |
| Architect 46 | 169.04 | 259,840,000.00 |
| Architect 47 | 154.82 | 250,443,000.00 |
| Architect 48 | 214.2 | 232,983,000.00 |
| Architect 49 | 215.9 | 232,490,000.00 |
| Architect 50 | 196.8 | 239,309,000.00 |
| Architect 51 | 160.01 | 259,099,000.00 |
| Architect 52 | 193.4 | 234,870,000.00 |
| Architect 53 | 213.21 | 232,601,000.00 |
| Architect 54 | 132.1 | 261,390,000.00 |
| Architect 55 | 137.92 | 260,965,000.00 |
| Architect 56 | 215.7 | 232,877,000.00 |
| Architect 57 | 213.73 | 232,004,000.00 |
| Architect 58 | 170.91 | 260,738,000.00 |
| Architect 59 | 213.09 | 232,553,000.00 |
| Architect 60 | 169.02 | 262,370,000.00 |
| Architect 61 | 167.6 | 261,038,000.00 |
| Architect 62 | 140.1 | 260,210,000.00 |
| Architect 63 | 149.9 | 256,781,000.00 |
| Architect 64 | 151.57 | 256,951,000.00 |
| Architect 65 | 170.91 | 255,547,000.00 |
| Architect 66 | 171.15 | 262,919,000.00 |
| Architect 67 | 159.4 | 253,580,000.00 |
| Architect 68 | 180.92 | 252,635,000.00 |
| Architect 69 | 173.89 | 259,998,000.00 |
| Architect 70 | 156.5 | 260,359,000.00 |
| Architect 71 | 215.28 | 232,500,000.00 |
| Architect 72 | 214.9 | 232,821,000.00 |
| Architect 73 | 191.12 | 235,461,000.00 |
| Architect 74 | 164.45 | 261,451,000.00 |
| Architect 75 | 190.37 | 235,319,000.00 |
| Architect 76 | 213.05 | 232,835,000.00 |
| Architect 77 | 130.94 | 261,903,000.00 |
| Architect 78 | 136.64 | 259,376,000.00 |
| Architect 79 | 213.58 | 232,769,000.00 |
| Architect 80 | 170.87 | 261,378,000.00 |
| Architect 81 | 142.64 | 256,644,000.00 |
| Architect 82 | 213.75 | 233,853,000.00 |
| Architect 83 | 141.52 | 261,913,000.00 |
| Architect 84 | 141.06 | 261,733,000.00 |
| Architect 85 | 214.83 | 232,809,000.00 |
| Architect 86 | 121.76 | 240,907,000.00 |
| Architect 87 | 159.3 | 264,600,000.00 |
| Architect 88 | 155.09 | 234,102,000.00 |
| Architect 89 | 169.51 | 260,333,000.00 |
| Architect 90 | 155.4 | 261,203,000.00 |
| Architect 91 | 159.41 | 258,901,000.00 |
| Architect 92 | 179.29 | 232,433,000.00 |
| Architect 93 | 170.09 | 261,222,000.00 |
| Architect 94 | 157.61 | 260,453,000.00 |
| Architect 95 | 215.31 | 232,430,000.00 |
| Architect 96 | 214.97 | 232,321,000.00 |
| Architect 97 | 187.69 | 234,200,000.00 |
| Architect 98 | 158.53 | 258,285,000.00 |
| Architect 99 | 187.43 | 235,416,000.00 |
| Architect 100 | 213.7 | 232,001,000.00 |
| Architect 101 | 134.79 | 234,773,000.00 |
| Architect 102 | 137.01 | 231,201,000.00 |
| Architect 103 | 213.92 | 232,490,000.00 |
| Architect 104 | 213.64 | 232,309,000.00 |
| Architect 105 | 171.03 | 252,765,000.00 |
| Architect 106 | 213.11 | 232,919,000.00 |
| Architect 107 | 170.03 | 285,391,000.00 |
| Architect 108 | 171.11 | 251,731,000.00 |
| Architect 109 | 139.94 | 260,840,000.00 |
| Architect 110 | 166.83 | 255,443,000.00 |
| Architect 111 | 214.48 | 231,983,000.00 |
| Architect 112 | 151.95 | 230,490,000.00 |
| Architect 113 | 176.19 | 240,309,000.00 |
| Architect 114 | 141.08 | 257,099,000.00 |
| Architect 115 | 213.74 | 235,870,000.00 |
| Architect 116 | 145.96 | 235,601,000.00 |
| Architect 117 | 141.95 | 262,390,000.00 |
| Architect 118 | 159.13 | 259,965,000.00 |
| Architect 119 | 179.19 | 234,877,000.00 |
| Architect 120 | 168.58 | 234,004,000.00 |
| Architect 121 | 156.19 | 258,738,000.00 |
| Architect 122 | 173.95 | 236,553,000.00 |
| Architect 123 | 144.02 | 262,370,000.00 |
| Architect 124 | 213.57 | 234,038,000.00 |
| Architect 125 | 149.21 | 258,210,000.00 |
| Architect 126 | 157.73 | 257,781,000.00 |
| Architect 127 | 149.28 | 253,951,000.00 |
| Architect 128 | 173.94 | 254,547,000.00 |
| Architect 129 | 167.02 | 261,919,000.00 |
| Architect 130 | 150.14 | 254,580,000.00 |
| Architect 131 | 179.21 | 251,635,000.00 |
| Architect 132 | 170.03 | 260,998,000.00 |
| Architect 133 | 151.82 | 261,359,000.00 |
| Architect 134 | 213.41 | 235,500,000.00 |
| Pareto Design Iteration | Energy (kWh/m2/Year) | Cost (DZD) |
|---|---|---|
| Pareto 01 | 107.79 | DZD 212,521,000.00 |
| Pareto 02 | 95.43 | DZD 223,319,000.00 |
| Pareto 03 | 104.41 | DZD 212,935,000.00 |
| Pareto 04 | 103.4 | DZD 215,679,000.00 |
| Pareto 05 | 90.35 | DZD 230,570,000.00 |
| Pareto 06 | 101.37 | DZD 219,733,000.00 |
| Pareto 07 | 93.34 | DZD 226,477,000.00 |
| Pareto 08 | 89.86 | DZD 230,570,000.00 |
| Pareto 09 | 110.84 | DZD 207,874,000.00 |
| Pareto 10 | 95.77 | DZD 222,855,000.00 |
| Pareto 11 | 93.66 | DZD 226,012,000.00 |
| Pareto 12 | 101.95 | DZD 216,092,000.00 |
| Pareto 13 | 109.09 | DZD 211,031,000.00 |
Disclaimer/Publisher’s Note: The statements, opinions and data contained in all publications are solely those of the individual author(s) and contributor(s) and not of MDPI and/or the editor(s). MDPI and/or the editor(s) disclaim responsibility for any injury to people or property resulting from any ideas, methods, instructions or products referred to in the content. |
© 2024 by the authors. Licensee MDPI, Basel, Switzerland. This article is an open access article distributed under the terms and conditions of the Creative Commons Attribution (CC BY) license (https://creativecommons.org/licenses/by/4.0/).
Share and Cite
Ouldja, S.A.; Demian, P.; Eftekhari, M. The Impact of Architects’ Reasoning on Early Design Decision-Making for Energy-Efficient Buildings. Sustainability 2024, 16, 8220. https://doi.org/10.3390/su16188220
Ouldja SA, Demian P, Eftekhari M. The Impact of Architects’ Reasoning on Early Design Decision-Making for Energy-Efficient Buildings. Sustainability. 2024; 16(18):8220. https://doi.org/10.3390/su16188220
Chicago/Turabian StyleOuldja, Sid Ahmed, Peter Demian, and Mahroo Eftekhari. 2024. "The Impact of Architects’ Reasoning on Early Design Decision-Making for Energy-Efficient Buildings" Sustainability 16, no. 18: 8220. https://doi.org/10.3390/su16188220