Article

Research on the Identification, Network Construction, and Optimization of Ecological Spaces in Metropolitan Areas Based on the Concept of Production-Living-Ecological Space

1
School of Architecture and Art Design, Hunan University of Science and Technology, Xiangtan 411201, China
2
School of Civil Engineering and Architecture, Wuhan Institute of Technology, Wuhan 430074, China
3
School of Architecture and Art, Central South University, Changsha 410083, China
*
Author to whom correspondence should be addressed.
Sustainability 2024, 16(18), 8228; https://doi.org/10.3390/su16188228
Submission received: 27 August 2024 / Revised: 10 September 2024 / Accepted: 19 September 2024 / Published: 21 September 2024

Abstract

:
In the strategic orientation of promoting high-quality development of metropolitan areas, ecological space is not only the core carrier for maintaining regional ecological balance and harmony but also a key element in shaping the scientific layout of metropolitan areas and promoting harmonious coexistence between cities and nature. This paper takes the Chang-Zhu-Tan metropolitan area as the research object and identifies and classifies ecological space based on the “Production-Life-Ecology” concept, extracts core ecological source areas through the minimum resistance model, and generates ecological resistance surfaces. Then, three types of ecological space corridors are constructed by using the MCR gravity model. This study finds that the ecological space in the Chang-Zhu-Tan metropolitan area is seriously fragmented, the number of corridors is insufficient, and the spatial configuration of the “Production-Life-Ecology” is imbalanced in the region and proposes optimization models and strategies in combination with the spatial network approach to identify and classify ecological space patterns for the metropolitan area. Accordingly, the study proposes optimization models and strategies based on the spatial network approach to provide theoretical support and practical guidance for the ecological spatial pattern and sustainable development of the metropolitan area.

1. Introduction

Metropolitan areas, at the forefront of global urbanization, such as China’s Beijing-Tianjin wing, India’s Delhi, and other large cities in some developing countries and regions have entered the key stage of the urbanization process. However, behind the rapid growth, a series of urban ecological issues have become increasingly prominent [1,2]. Lee [3] (2022) found through empirical measurements that the built-up area of new cities in South Korea has increased by more than 35% in 30 years, and predictions indicate that when the built-up area increases to about 60%, the SUHI intensity will increase by 4 °C in most areas. In addition, several scholars’ studies have concluded that human activities have a strong impact on urban ecological factors [2]. Especially under the backdrop of high population density, and intensified light and water pollution, the conflict between urbanization and ecologicalization in Shanghai [4] and other metropolitan areas has reached an unprecedentedly sharp level [5,6]. In Hashem (2018) [7], by analyzing land use change, urbanization, and its impact on changing landscape patterns in the Tabriz Metropolitan Area (TMA) between 1996 and 2016, he found that the expansion of urbanization led to an increase in fragmentation and a decrease in the aggregation of ecological landscapes and that the degree of landscape aggregation is increasing. Land use change, urbanization, and its impact on landscape pattern change in the Tabriz Metropolitan Area (TMA) over the period from 2007 to 2010 found that the expansion of urbanization leads to an increase in fragmentation and a decrease in the aggregation of ecological landscapes, and an increasing degree of aggregation of landscapes.
The activities have not only disrupted key ecological corridors and intensified the isolation of ecological patches but also weakened the overall connectivity and service provision capacity of urban ecosystems, posing a severe challenge to the ecological space and residents’ well-being in metropolitan areas [8,9,10]. Against this backdrop, the construction of ecological civilization has become a new demand for the transformation and upgrading of metropolitan areas, pursuing high-quality development [11]. Ecological space, as an indispensable green foundation of metropolitan areas, not only carries rich natural ecological information and energy flow but also profoundly affects the boundaries and form of urban expansion. The optimization of its structure and rational layout has become a key path to alleviating “urban diseases” and promoting sustainable development [12,13]. Optimizing the structure of ecological space can not only enhance landscape connectivity and improve the resilience and self-recovery ability of urban ecosystems but also provide residents with higher-quality ecological services, enhancing human well-being [14]. Therefore, scientific planning and management of ecological space in metropolitan areas, through the efficient use of resources, the reduction in circulation costs, and the construction of low-cost and high-efficiency modes of ecological information flow have become hot spots and key directions in the field of urban research. In order to promote the protection of ecological networks and the sustainable development of cities, it is crucial to adopt scientific planning and management tools [15].
Currently, the identification, evaluation, and network construction of ecological spaces are unfolding with unprecedented depth and breadth. The research focuses on the quality of urban ecological spaces [16], the assessment of ecosystem service values, as well as the spatiotemporal evolution [17,18], driving mechanisms, ecological security patterns, and regulatory strategies [19]. In particular, in the construction of ecological space networks, scholars have formed the important paradigm of ‘source-corridors’ [20], aiming to connect isolated ecological patches through ecological corridors, mitigate the impact of fragmentation, and promote the protection of biodiversity. In the identification of ecological source areas, the current research is mostly based on large ecological patches such as nature reserves and forests [21], employing methods like morphological spatial analysis and landscape connectivity indices. These methods tend to focus on natural ecological areas or single ecosystem indicators [22], have a strong subjectivity, and lack a comprehensive consideration of urban multifaceted factors. To address this issue, future research urgently needs to establish a new pattern for the identification of ecological source areas, which should comprehensively consider various factors of the city, including production, living, and ecology, to enhance the scientific, comprehensive, and objective selection of ecological source areas. At the same time, the identification and construction of ecological corridors are also one of the hot topics in current research [23]. Scholars generally use methods such as the Minimum Cumulative Resistance (MCR) model [24,25], graph theory, and electrical current theory [26,27], but there are differences in the analysis results among different methods. Among them, the MCR model has become one of the most commonly used methods due to its effectiveness and practicality [28]. However, with in-depth research, the study on the width of ecological corridors [29], the identification of ecological nodes [30], and other aspects are also increasing, showing a diversified trend in ecological corridor research. In order to effectively construct the ecological space network and ecological corridors of the metropolitan area, it is crucial to establish a new pattern for the selection of ecological spaces. This pattern should comprehensively consider multifaceted factors at various levels of the city, including production, living, and ecology, and identify ecological source areas through scientific methods, thereby enhancing the objectivity and comprehensiveness of selection. It can not only promote the rational planning and protection of urban ecological spaces but also provide strong support for achieving the goals of sustainable human development and harmonious coexistence between humans and nature.
The “Production-Living-Ecological” spatial concept is rooted in the philosophy of harmonious development between humans and the environment [31]. Its basic connotation and the inner relationship of the three types of space are the composite space jointly characterized by the behavioral features of human production, life, and ecology and the relationship of the three, and at the same time, the production and living space is embedded in the ecological space in the way of covering, including, and intertwining the three [32]. At the same time, production and living space are embedded in ecological space by covering, including, and intersecting, and the three are intertwined [33]. The core purpose of ecological corridors, as an indispensable link between the ‘production-life-ecology’ (or ‘three lives’) spaces of the city, is to significantly reduce the resistance to the flow of ecological information between the production spaces and the living spaces and to construct a more forward-looking, expanding and integrated complex mesh-like spatial structure. The core purpose is to significantly reduce the resistance to the flow of ecological information in the production space and living space, so as to construct a more forward-looking, expansive, and integrated complex mesh spatial structure. Therefore, identifying urban ecological sources based on the “Production-Living-Ecologica” spatial concept and constructing an index system for the ecological function importance of ecological sources can precisely identify and effectively express types of ecological spaces, undoubtedly enhancing the objectivity of ecological source selection. This not only provides a more comprehensive and solid foundation for further exploration of potential urban ecological space corridors but also establishes a solid ecological foundation for promoting sustainable urban development.
In summary, in response to the high degree of subjectivity in existing studies, the homogeneity of the scope and elements considered, and the lack of consideration of the diverse environmental factors of cities. This paper takes the Chang-Zhu-Tan metropolitan area as the research subject, starting with ecological patches and combining the layout of business types in production and living spaces to simulate the composite urban spaces that may form ecological space corridors. By using Points of Interest (POI) data to identify ecological (mixed) spaces in the “Production-Living-Ecological” spaces of the metropolitan area, and taking the POI data as the basis for the relative resistance generated by the flow of ecological information, the MCR model is applied to simulate the three-level ecological space corridors of the Chang-Zhu-Tan metropolitan area. To realize a scientific and comprehensive consideration of multiple elements and to improve the existing system of research scope and methodology. The paper also proposes suggestions for optimizing the spatial layout of ecological space corridors in the metropolitan area. This is expected to provide theoretical support and practical guidance for the optimization of the ecological space pattern and sustainable development of metropolitan areas in China, and also to provide references and insights for optimizing the territorial spatial pattern of metropolitan areas.

2. Research Area and Methods

2.1. Study Area Overview

The Chang-Zhu-Tan metropolitan area encompasses the entire territory of Changsha City, the central urban area of Zhuzhou City and its subordinated Liling City, the central urban area of Xiangtan City and its subordinated Shaoshan City and Xiangtan County (Figure 1), with a total area of 18,900 square kilometers [34], making it the core growth pole for the development of Hunan Province. Driven by the continuous development of urbanization and industrialization, the region is facing many common ecological challenges [35], including but not limited to environmental pollution, overconsumption of resources, and the degradation of ecosystems. The ecological pattern within the area has been negatively affected by high-intensity human economic activities, leading to low overall landscape connectivity and fragmented ecological landscape patches that create significant resistance to the flow of ecological information. In response to these existing ecological issues, the Hunan Provincial Government has successively proposed ecological protection strategies such as creating the “Chang-Zhu-Tan Ecological Green Core” and “Metropolitan Area Central Urban Parks”, formally embarking on the path of exploring regional ecological civilization construction.

2.2. Data Sources and Pre-Processing

Urban POI (Points of Interest) data contain a wealth of information on production, living, and ecological spaces, providing a more comprehensive, detailed, and diversified research data foundation for the precise identification of the city’s “Production-Living-Ecological “ spaces [36,37,38]. This study utilized Python 3.6 web crawler technology to classify and collect the latest 2023 POI data from Gaode Map, obtaining POI information in 16 sub-categories within the Chang-Zhu-Tan metropolitan area. This information extensively covers various aspects including scenic spots, parks, squares, and companies. After a series of preprocessing steps such as data deduplication, screening, and correction, a total of 527,592 valid POI data entries were retained. These were then categorized into three major categories and 16 subcategories based on the functional types of the “Production-Living-Ecological” spaces: ecological space POI data, production space POI data, and living space POI data.
The administrative division data for the Chang-Zhu-Tan metropolitan area used in the study was sourced from the Natural Resources Bureau of Hunan Province, while the DEM (Digital Elevation Model) data within the region was obtained from the Data Center for Resources and Environmental Sciences of the Chinese Academy of Sciences. The spatial resolution of the data is 30 m, and it was acquired in December 2023. To ensure accurate spatial registration of all spatial information, the aforementioned data were processed with projection transformations using ArcGIS software 10.6.

2.3. Research Methods

2.3.1. Spatial Network Model

The spatial network model is a complex network analysis tool for analyzing and optimizing spatial structure. In this paper, this method is applied to the ChangZhuTan metropolitan area in order to identify and classify ecological space in a fine-grained manner and construct a network of ecological spatial corridors containing multiple layers, identify core ecological sources and potential ecological corridors with the help of the Least Resistance Model (LRM) and the MCR gravity model, and propose optimization strategies aiming at enhancing ecological connectivity and improving ecosystem service function accordingly. Based on this, we propose optimization strategies to enhance ecological connectivity and ecosystem services, which provide scientific support for ecospatial planning in the region [39,40,41].
Using the ArcGIS 10.6 connectivity tool, calculate the minimum cumulative resistance that needs to be overcome for elements to migrate between ecological source sites and identify least-cost pathways as potential ecological corridors.

2.3.2. POI Data Processing and Fishing Net Creation

POI Data Processing and Fishnet Creation. Firstly, based on documents such as the “Urban Land Classification and Planning Construction Land Standards” [42] (GB50137-2011) and the “2017 National Economic Industry Classification” [43] (GB/T4754-2017), the research achievements of scholars such as Shi Jiefeng [44,45,46,47] on the division and classification of the “Three Lives” space using POI data as the research element were summarized by comparison. Two weighted indicators, relevance and area scoring, were selected, and the relevance of each subcategory of POI data was determined by the Analytic Hierarchy Process (AHP). Then, the product of the relevance of the POI data and their relative land occupation area was used to represent the comprehensive weight P of the element (Table 1). Subsequently, a fishnet was constructed for the study area using ArcGIS, dividing the study area into 68,517 basic spatial units with a 600 m × 600 m grid, and then associating the basic spatial units with the POI data within them.

2.3.3. Production-Living-Ecological Space Recognition

Calculate the cumulative comprehensive weight S i of POI data of production, life and ecology in each basic space unit through Equation (1). Reuse Equation (2) identifies the “ecological space” of the Changsha Zhuzhou Xiangtan metropolitan area, in which Cells with K t ∈ [50%, 1] are regarded as ecological spaces, and cells with K s ∈ [33.3%, 50%) are regarded as ecological mixed spaces.
S i = a = n p a
In the Equation (1), S i is the cumulative comprehensive weight in the basic unit i; n is the number of POI data in the basic unit i; P a is the comprehensive weight of element a in basic unit i.
K t = S t i n S i
In the Equation (2), K t is the proportion of ecological elements in the basic unit i; S i is the sum of the comprehensive values of the “Production-Living-Ecological” elements in the basic unit i; S t is the sum of the comprehensive values of ecological elements in the basic unit i.

2.3.4. Ecological Resistance Value Generation

The analytic hierarchy process is used to compare the relative capacity p of ecological information in different POI elements, and ra = 1/pa is used to represent the relative resistance value to be overcome during ecological flow (Table 2). The cumulative resistance value of each basic unit is calculated by Equation (3).
R i = a = 1 t = 16 r a × k a
In the Equation (3), R i is the ecological resistance value of the basic unit i; ra is the ecological resistance value of POI element a; K a is the proportion of POI elements of class a in the total comprehensive weight of all elements of the basic unit in which they are located; t is the POI data of t sub categories in the ith basic unit.

2.3.5. Construction of Ecological Space Corridor Network

This study aims to explore the potential nodes of ecological information flow between factors in the city and how these nodes can be effectively utilized to facilitate ecological circulation. To this end, we adopt the Minimum Cumulative Resistance (MCR) model, which is capable of processing a large amount of data during the calculation process to identify the path of least resistance. The dynamic adjustment capability of the MCR model gives it a significant advantage in ecological network analysis. By applying the MCR model, this study not only achieves accurate measurement of ecological circulation nodes but also provides a solid model foundation for subsequent ecological network optimization. The ArcGIS10.6 connectivity tool is used to calculate the minimum cumulative resistance to the migration of elements between ecological sources and identify the minimum cost path as a potential ecological corridor. The specific equation is as follows:
M C R = min j = n i = m ( D i j × R i )
In Equation (4), MCR is the minimum cumulative resistance value of ecological flow between ecological patches; Dij is the spatial distance between patches i and j; R i is derived from Equation (3); n, m is two different ecological patches in the metropolitan area.
Based on the gravity model, the interaction matrix between ecological sources is calculated to quantitatively evaluate the interaction intensity between ecological sources, determine the relative importance of potential ecological corridors, and identify important ecological corridors. The gravity model formula is as follows:
F c d = M c × M d D c d 2
In Equation (5), F c d is the interaction force between plaque c and plaque d; Mc and Md are the proportion of ecological elements of patch c and patch d, respectively; Dcd is the corridor distance between patch c and patch d.

2.3.6. Spatial Network Optimization Layout

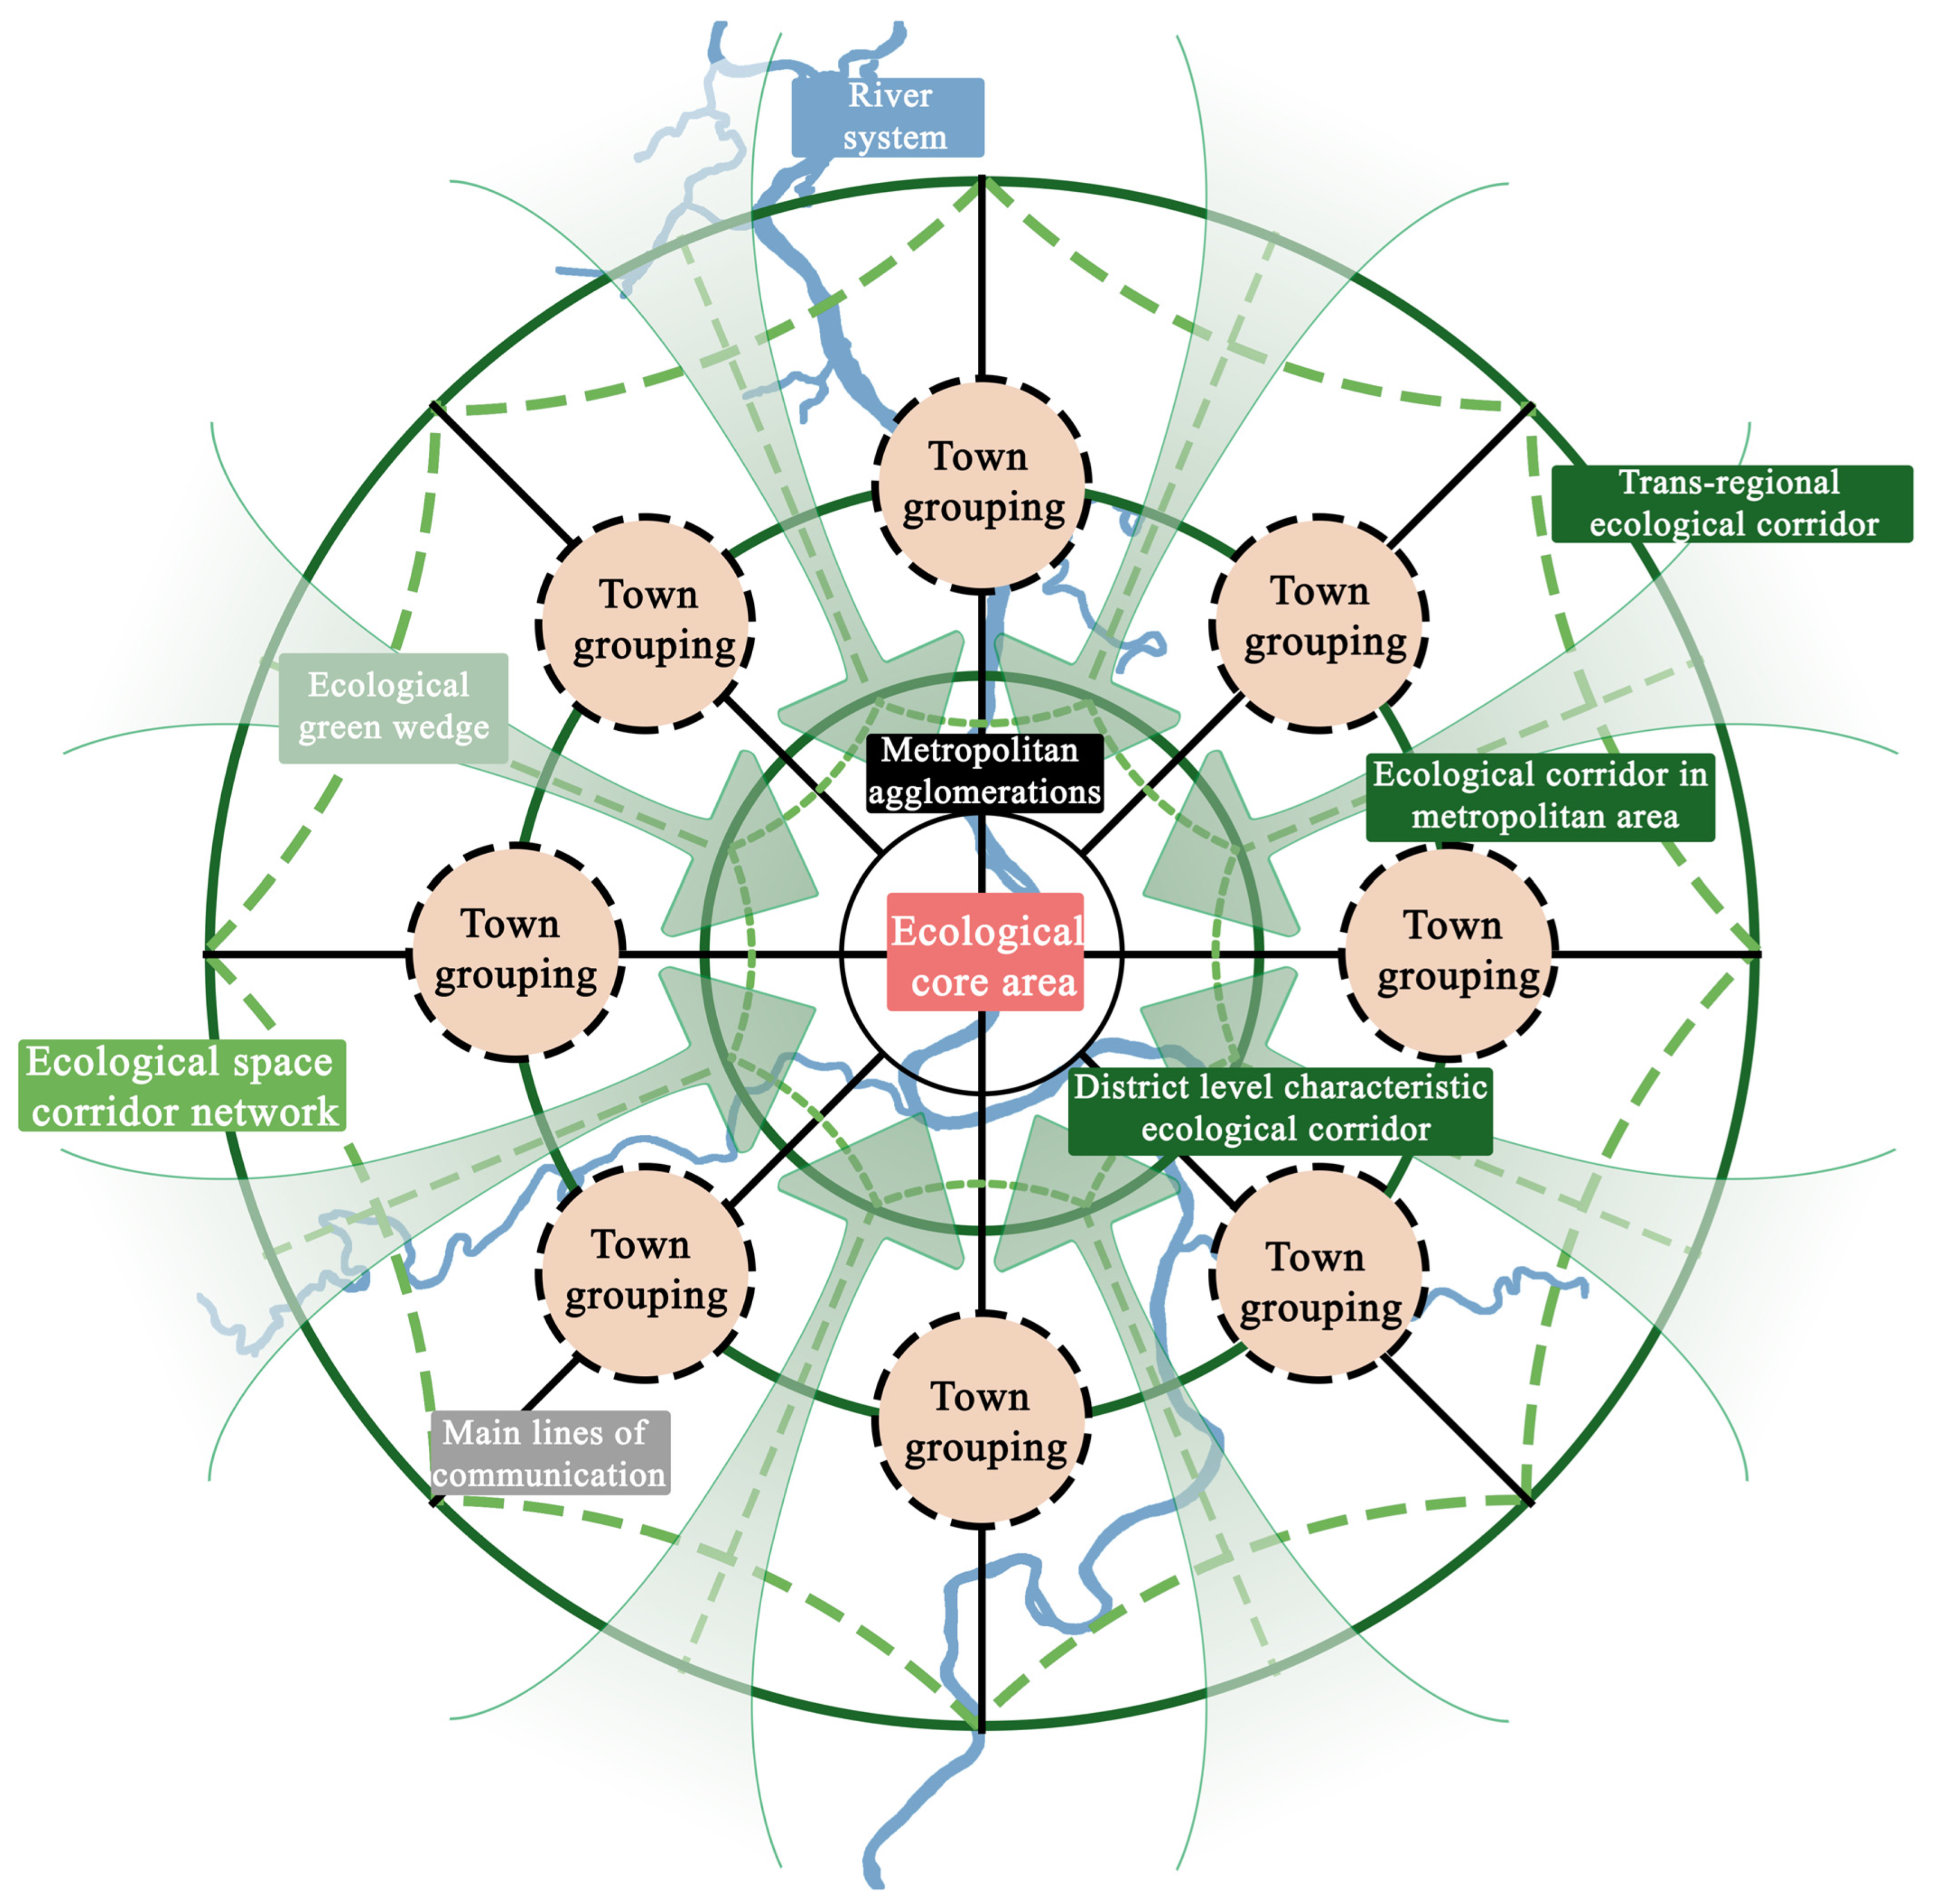
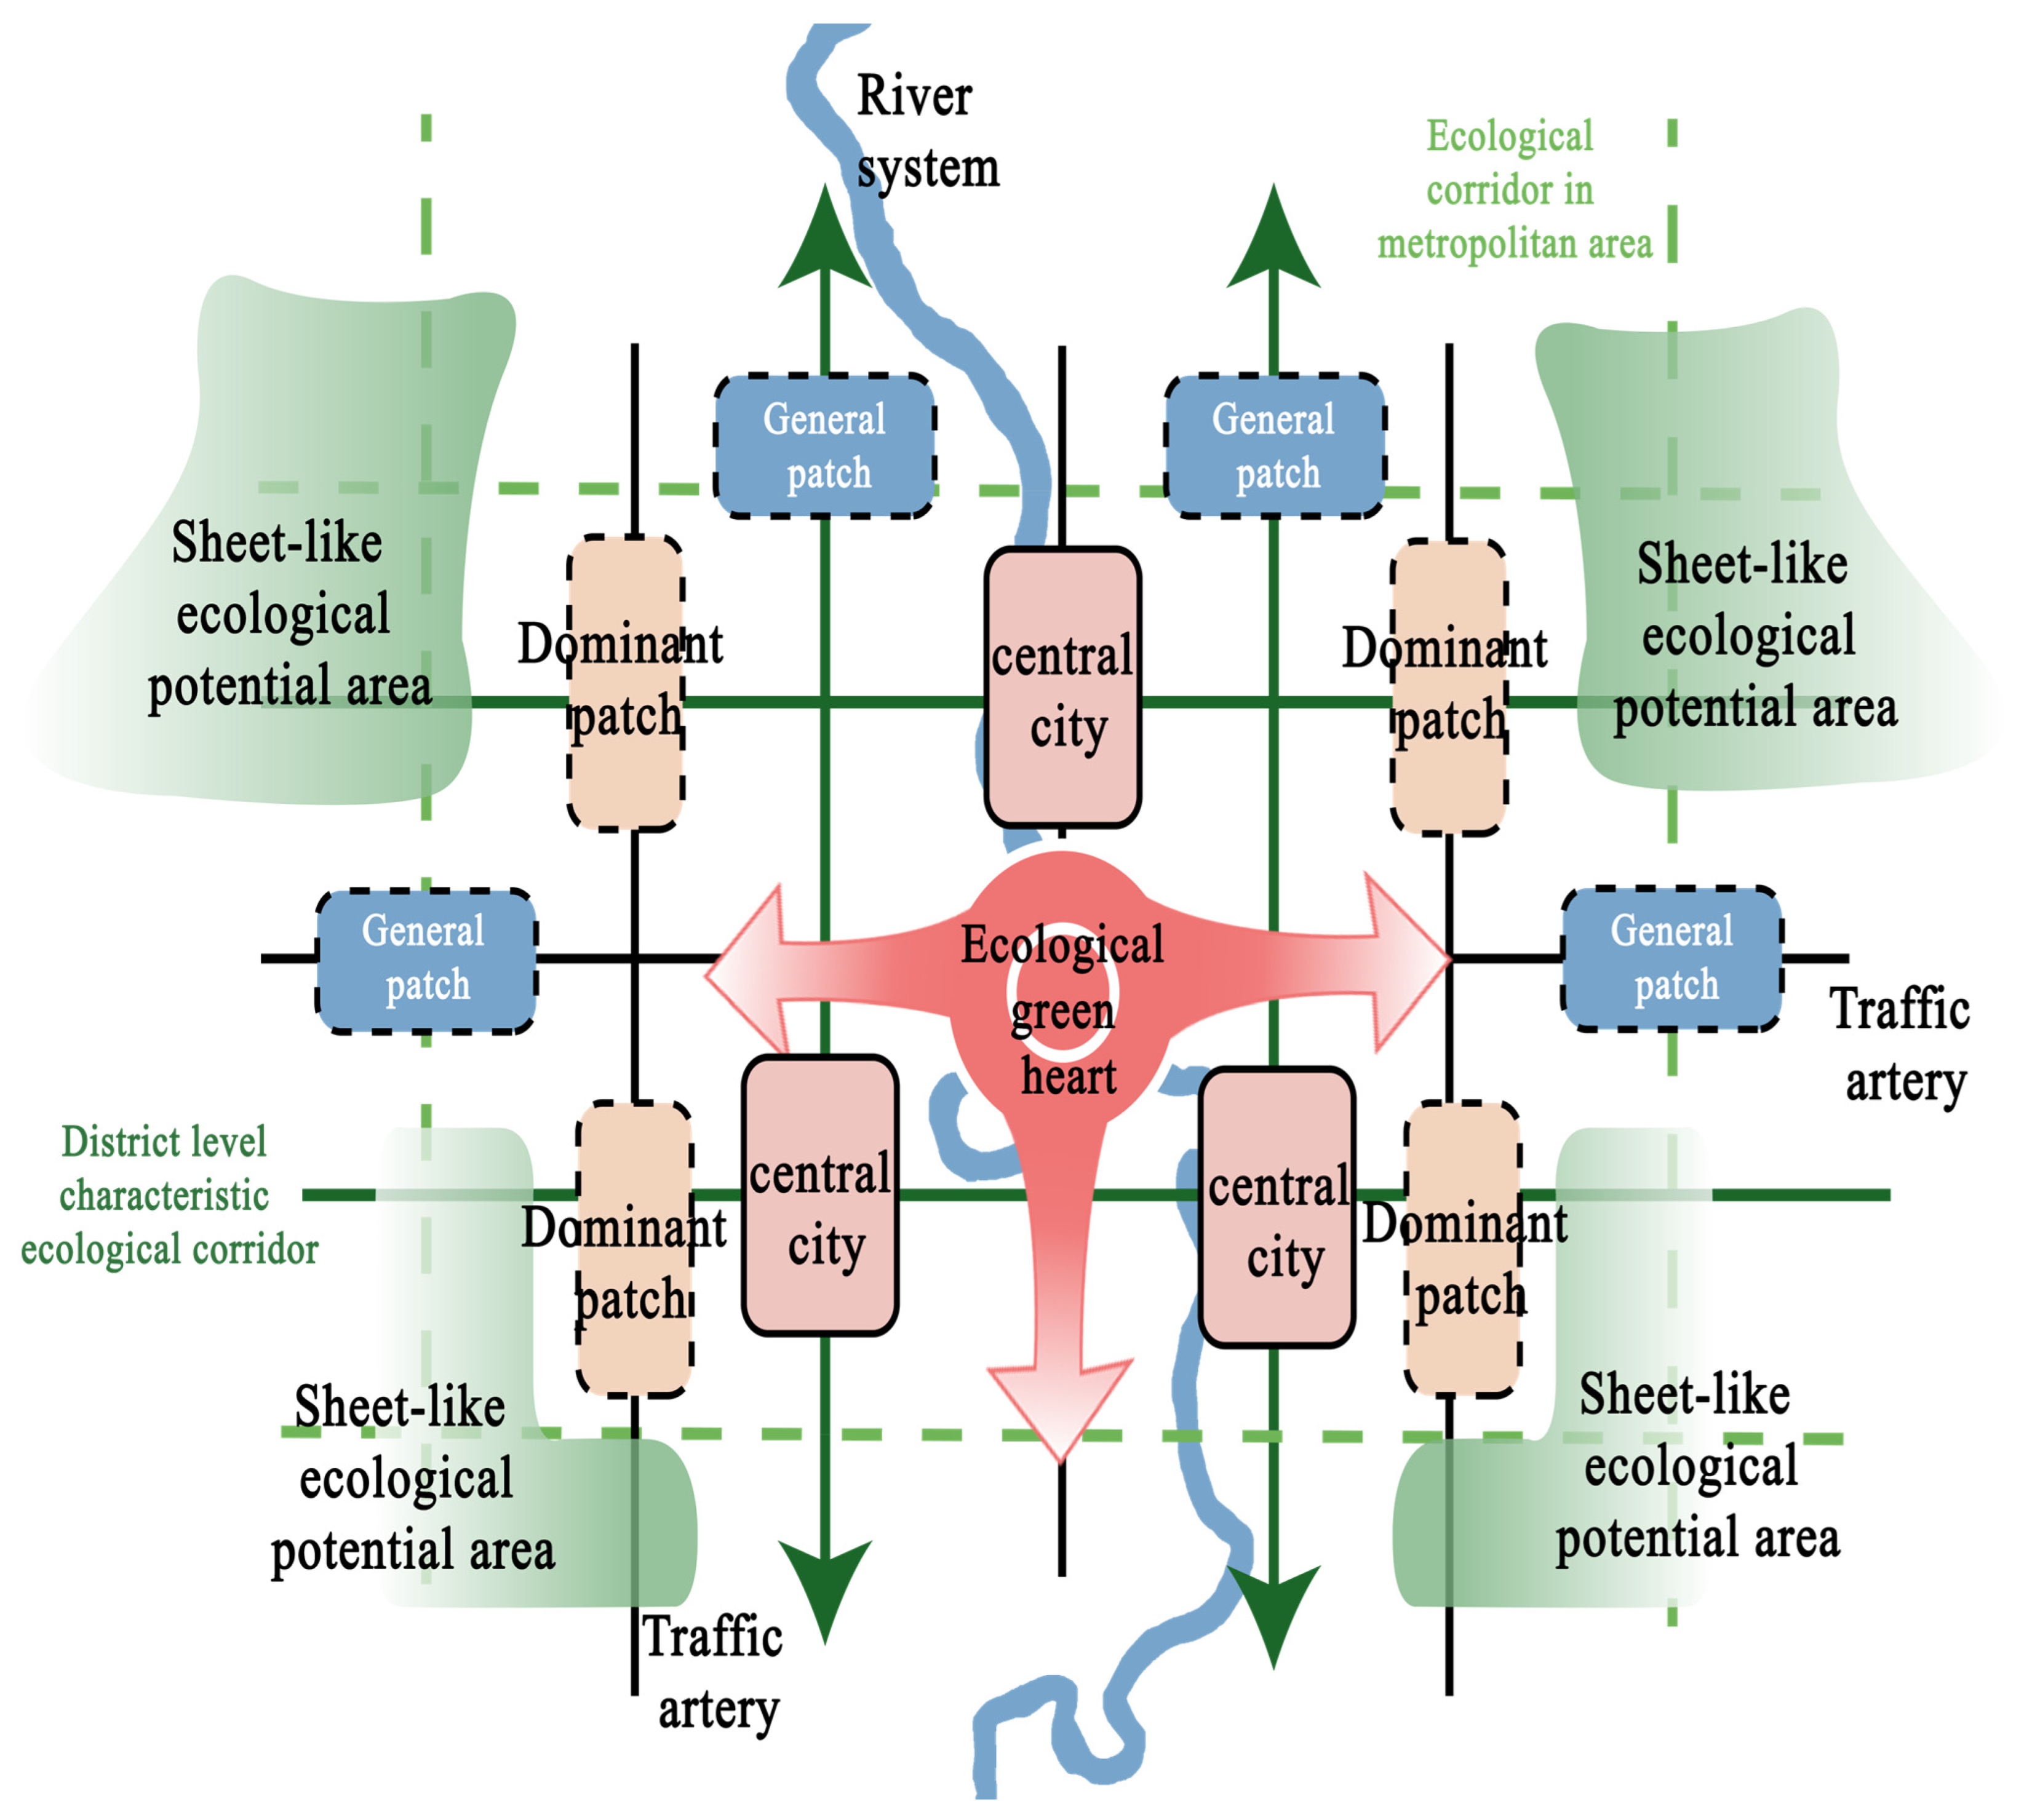
Incorporating the identified potential ecological patches and potential ecological corridors into the scope of the ecological source area, and using the “green wedge + green ring” annular network radiating optimization model (Figure 2) and the “green core + green belt” ribbon network checkerboard optimization model (Figure 3) [48] for layout, the originally independent and fragmented ecological spaces (including ecological mixed spaces) and the originally “patch-corridor” dominated ecological space corridor structure are optimized and upgraded into a spatial layout model with “patch-network” as the core, enhancing the capacity of ecological information flow between patches and inside and outside the area. At the same time, following the principle of “symbiosis”, other element types in the metropolitan area are organically integrated with ecological elements, endowing ecological elements with more production and living functions, and further expanding the supply range of ecological space, enhancing the integrity of the metropolitan area’s ecological space.

2.4. Technical Route

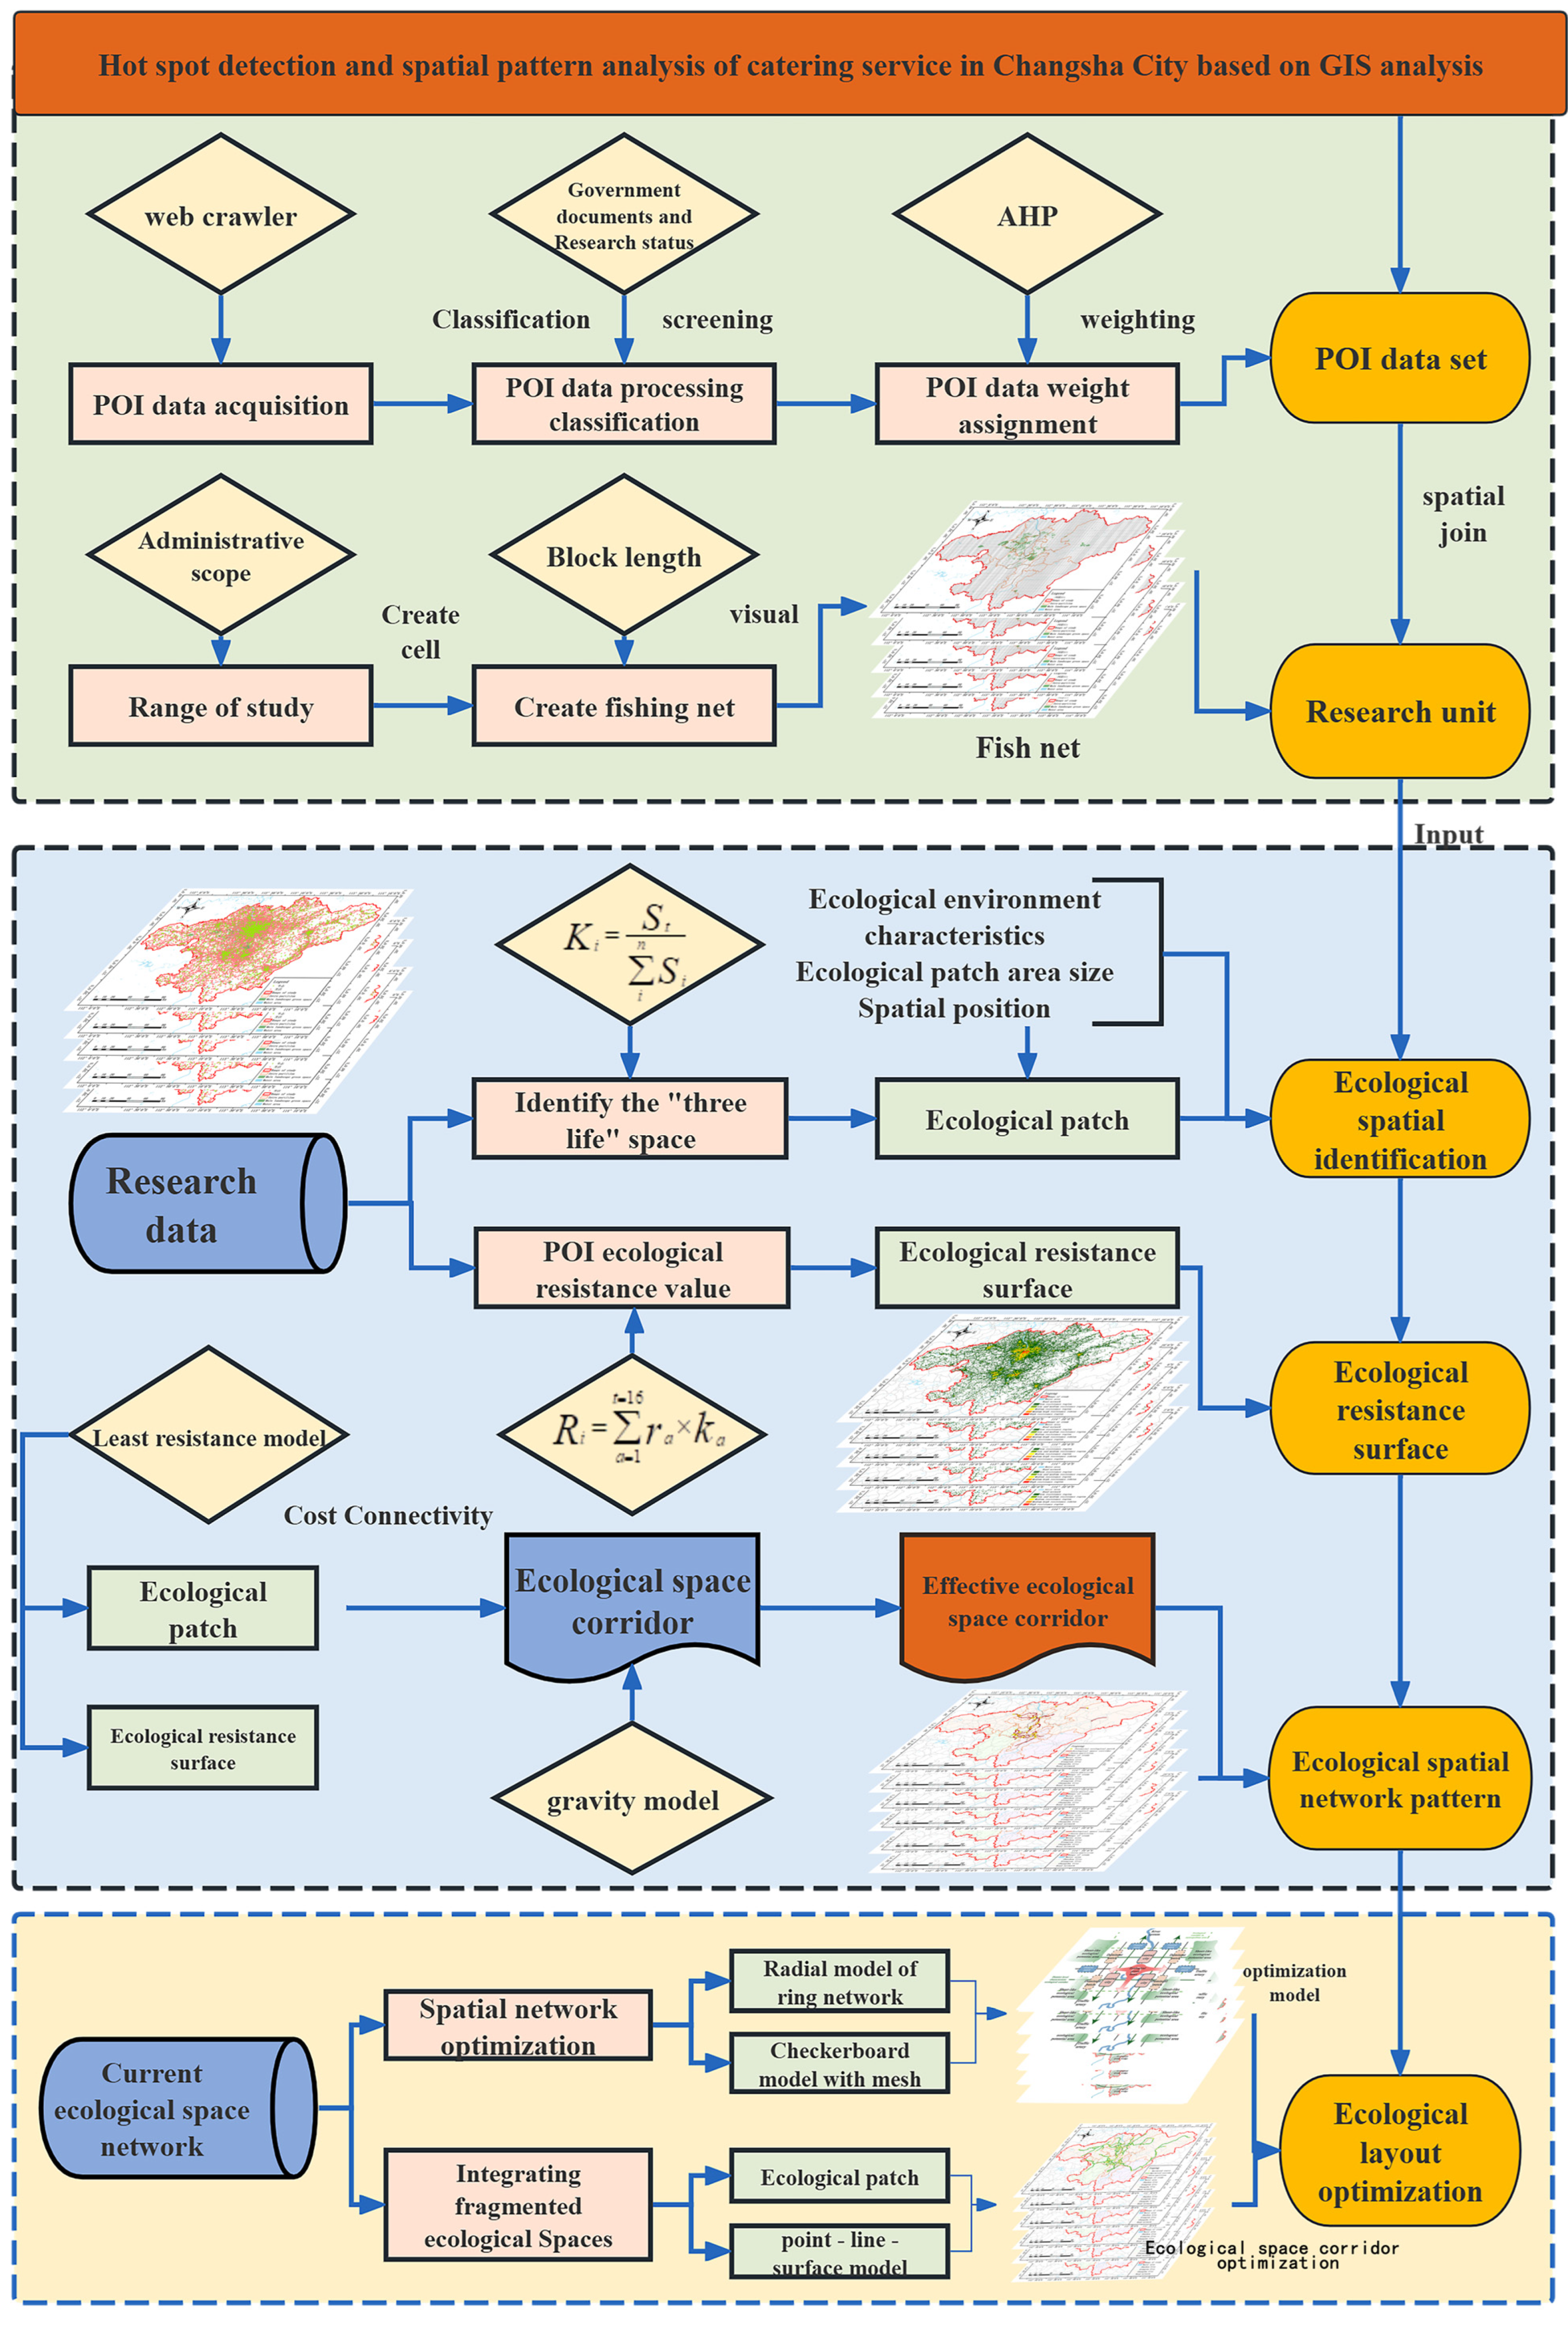
The technical approach of this study is primarily divided into five parts, which are POI data processing and fishnet creation, ecological space identification, ecological resistance generation, ecological space corridor network construction, and spatial network optimization layout (Figure 4).

3. Analysis of Results

3.1. Identification Results of Ecological Space in Metropolitan Area

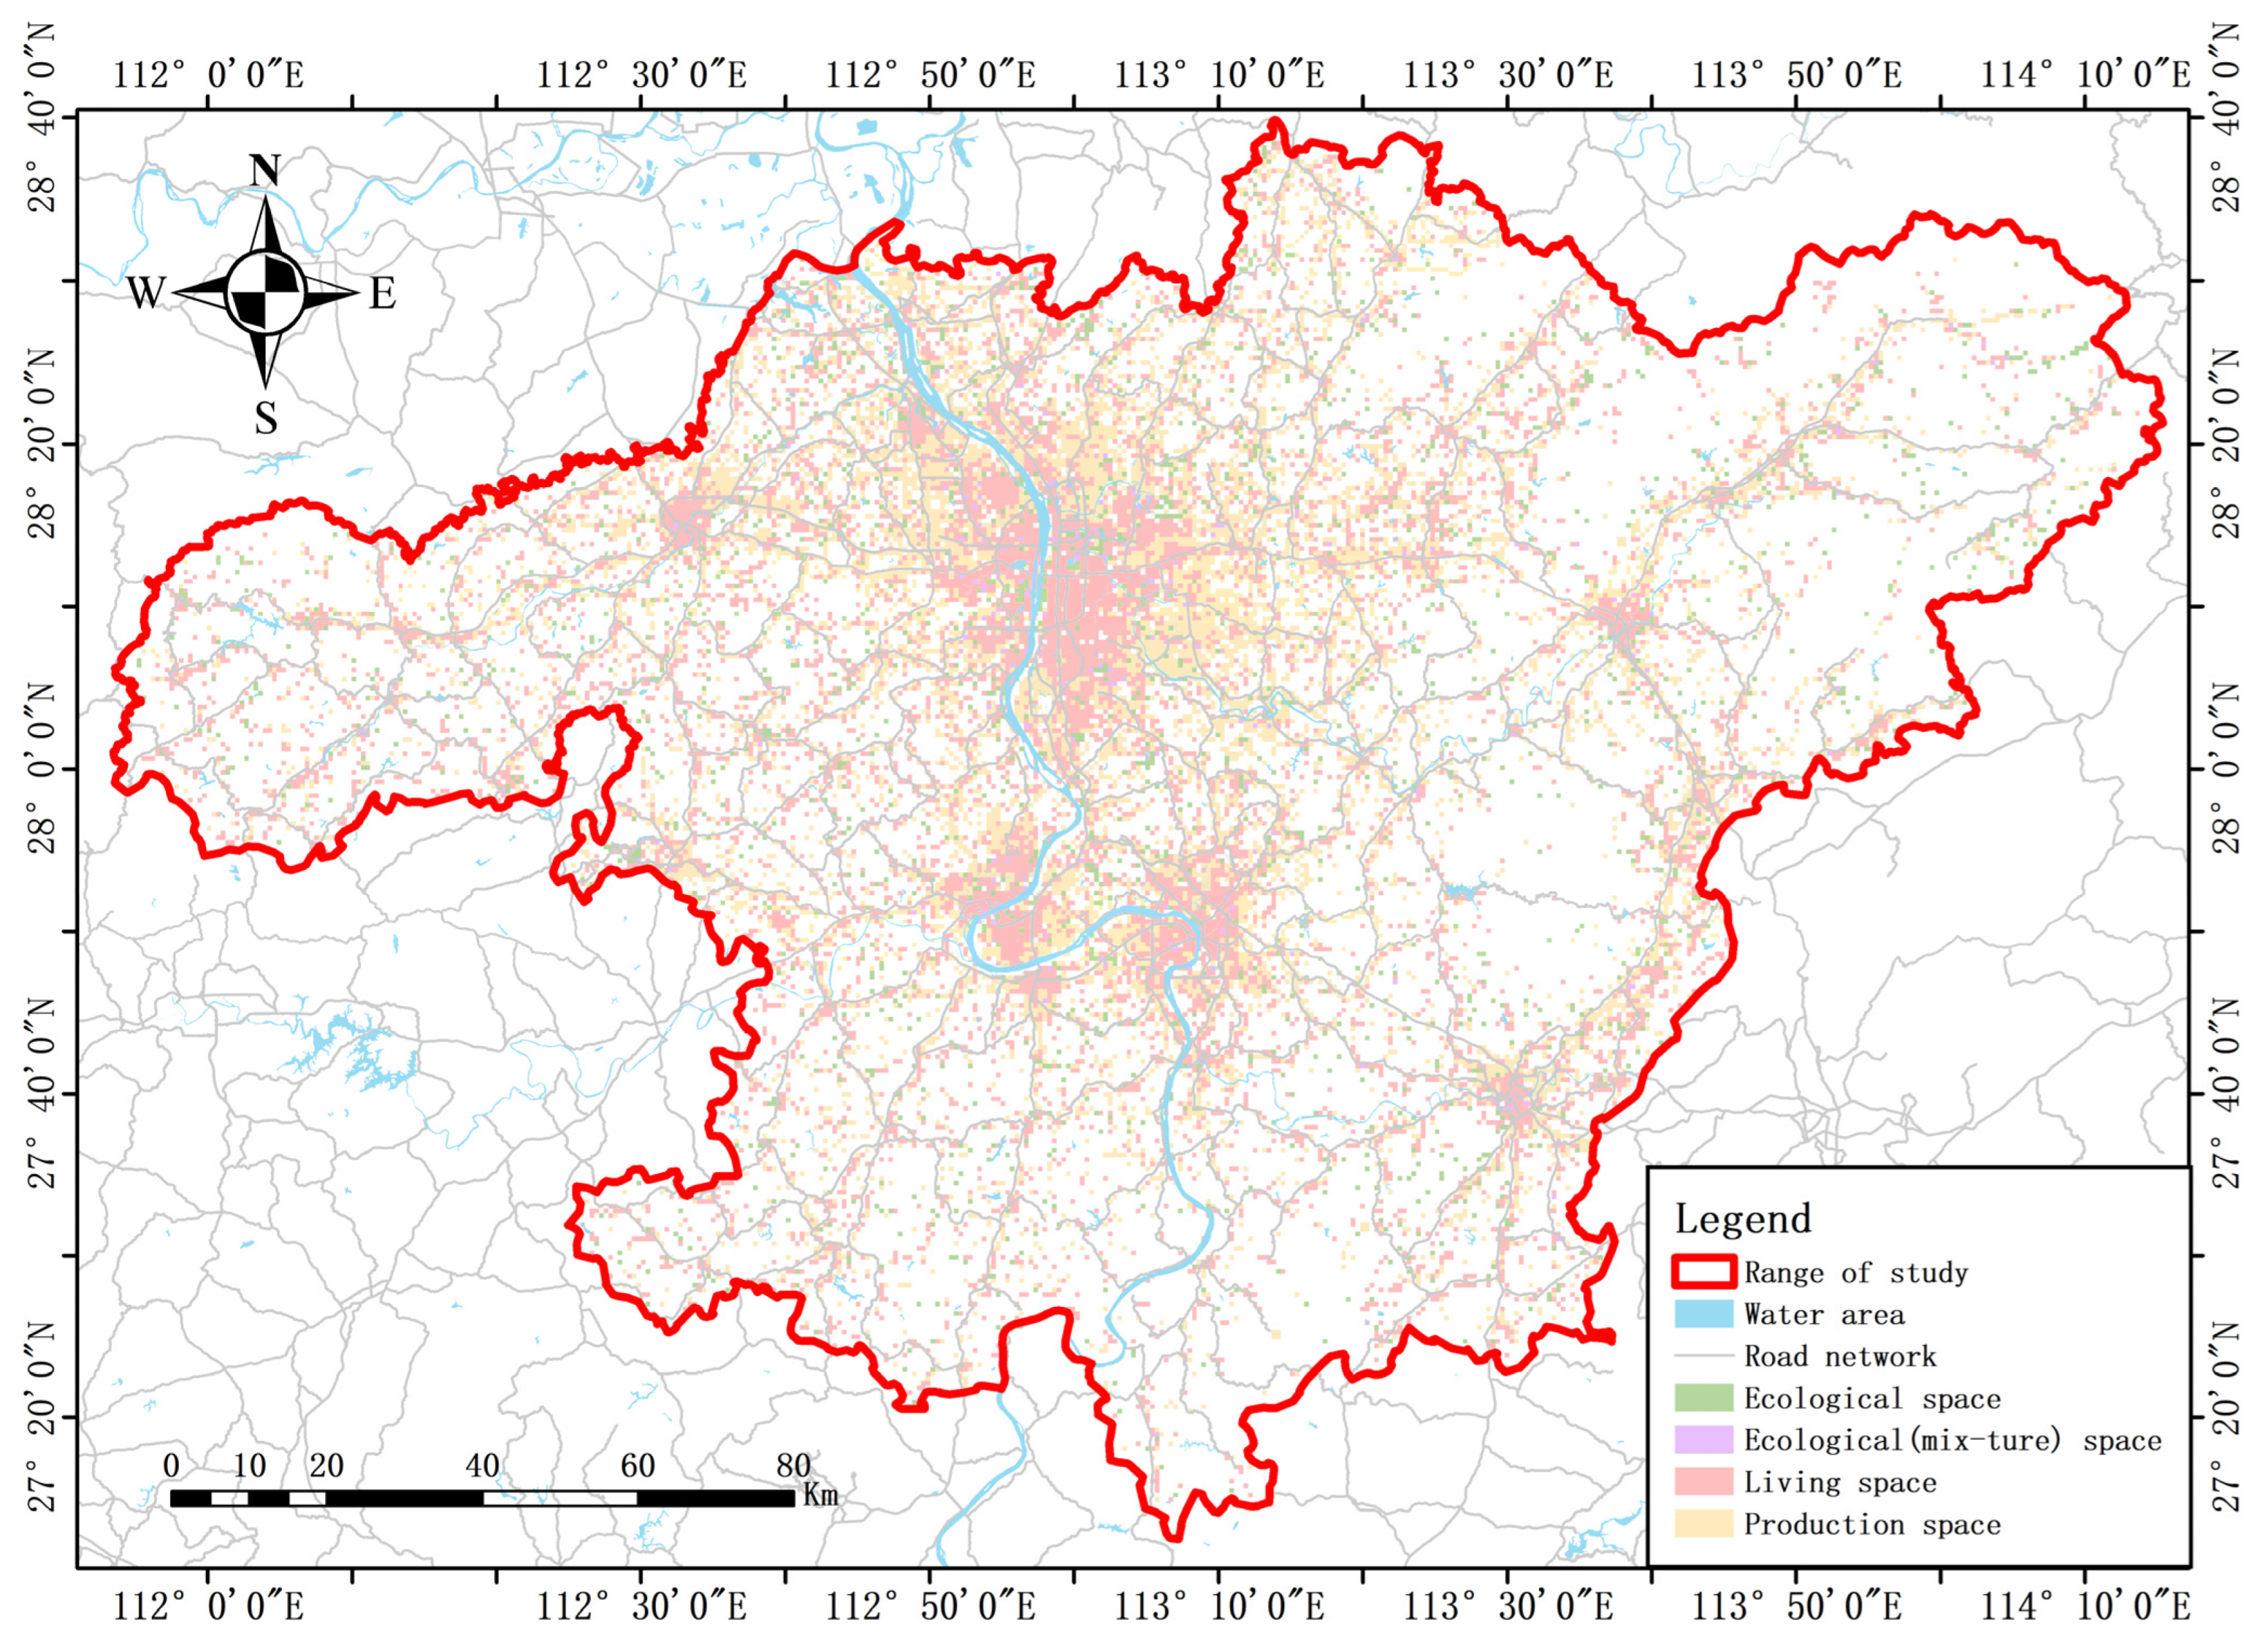
The “Production-Living-Ecological” urban ecological spaces include urban parks and green spaces, scenic and historical sites, garden lands, grasslands, water systems, etc., and are closely related to leisure, health, culture, and other industrial activities. Therefore, the study of urban ecological spaces requires an integrated consideration of ecological spaces with various urban elements. Through the “Production-Living-Ecological” space identification formula calculation, a total of 20,839 identifiable units of “Three Lives” spaces in the Chang-Zhu-Tan metropolitan area were obtained, as shown in Table 3. Among them, there are 9128 production space identification units with a total area of 3281.52 km2, 9529 living space identification units with a total area of 3425.70 km2, 1983 ecological space identification units with a total area of 712.19 km2, and 197 ecological mixed space identification units with a total area of 71.64 km2. From the table, it can be seen that the core area of the Chang-Zhu-Tan metropolitan area is mainly composed of living space units, accounting for 45% of the total number of space units, close to half, followed by production space. The number of ecological spaces and ecological mixed spaces is relatively small, accounting for only 10% of the total number of space units.
Visualizing the spatial types of each unit in the Chang-Zhu-Tan metropolitan area (Figure 5), it can be observed that living spaces are primarily distributed along the Xiangjiang River, forming aggregation core points in the central urban areas surrounding the river basin. Production spaces are centered around living spaces in the central area of the study region, exhibiting a ring-like distribution around them. Outside the central urban area, living spaces and ecological spaces exhibit a strip-like distribution along National Highway 0422 in the eastern part. The ecological spaces are overall more scattered with a low degree of aggregation, showing a fragmented distribution, and the larger ecological patches are mainly formed along the Xiangjiang River.

3.2. The Formation Results of Urban Factor Resistance Surface

In landscape ecology, the trend surface formed by species overcoming resistance while moving between different landscape elements is called a resistance surface. It reflects the total cost required for species to travel from the source to the destination and is a type of space that inhibits the process of ecological information flow. The resistance surface of urban elements is represented by the cumulative results of resistance from different POI elements within each basic unit. As can be seen from Figure 6, the resistance surface of the Chang-Zhu-Tan metropolitan area mainly presents a “six cores and three belts” structure. The “six cores” are composed of the central urban areas of Changsha, Zhuzhou, and Xiangtan, as well as the secondary centers of Liuyang, Liling, and Ningxiang. They are not only the concentrated embodiment of medium to high or high resistance areas but also show a gradient effect that gradually decreases from the core to the periphery. It is worth noting that the Wangcheng District is gradually showing a trend of evolving into a medium to high resistance area. The “three belts” closely connect the “six cores”, which are the eastern “Liuyang-Liling” belt, the northern “Liuyang-Changsha-Ningxiang” belt, and the southern “Liling-Zhuzhou-Xiangtan” belt. These belt areas stretch along the Hangchang, Changzhang, Jingguang, and Hukun expressway trunk lines, promoting economic connections between regions and forming important connection channels in the resistance surface network. This allows medium to high or high-resistance areas to achieve effective network interconnection through medium-low or low-resistance areas. In the central Xiangjiang River Basin, although there are ecological low resistance patches such as the Yuelu Mountain Scenic Area, Yanghu Wetland Park, Da Wangshan Scenic Area, and Zhaoshan Scenic Area, which add greenery and vitality to the region, the connectivity between these patches is still weak, and the mobility of ecological elements needs to be strengthened. In addition, in the extensive areas outside the central city, medium-low resistance and low-resistance areas occupy the dominant position, and these areas are characterized by a significant distribution along both sides of the roads.

3.3. Ecological Space Corridor Recognition Results

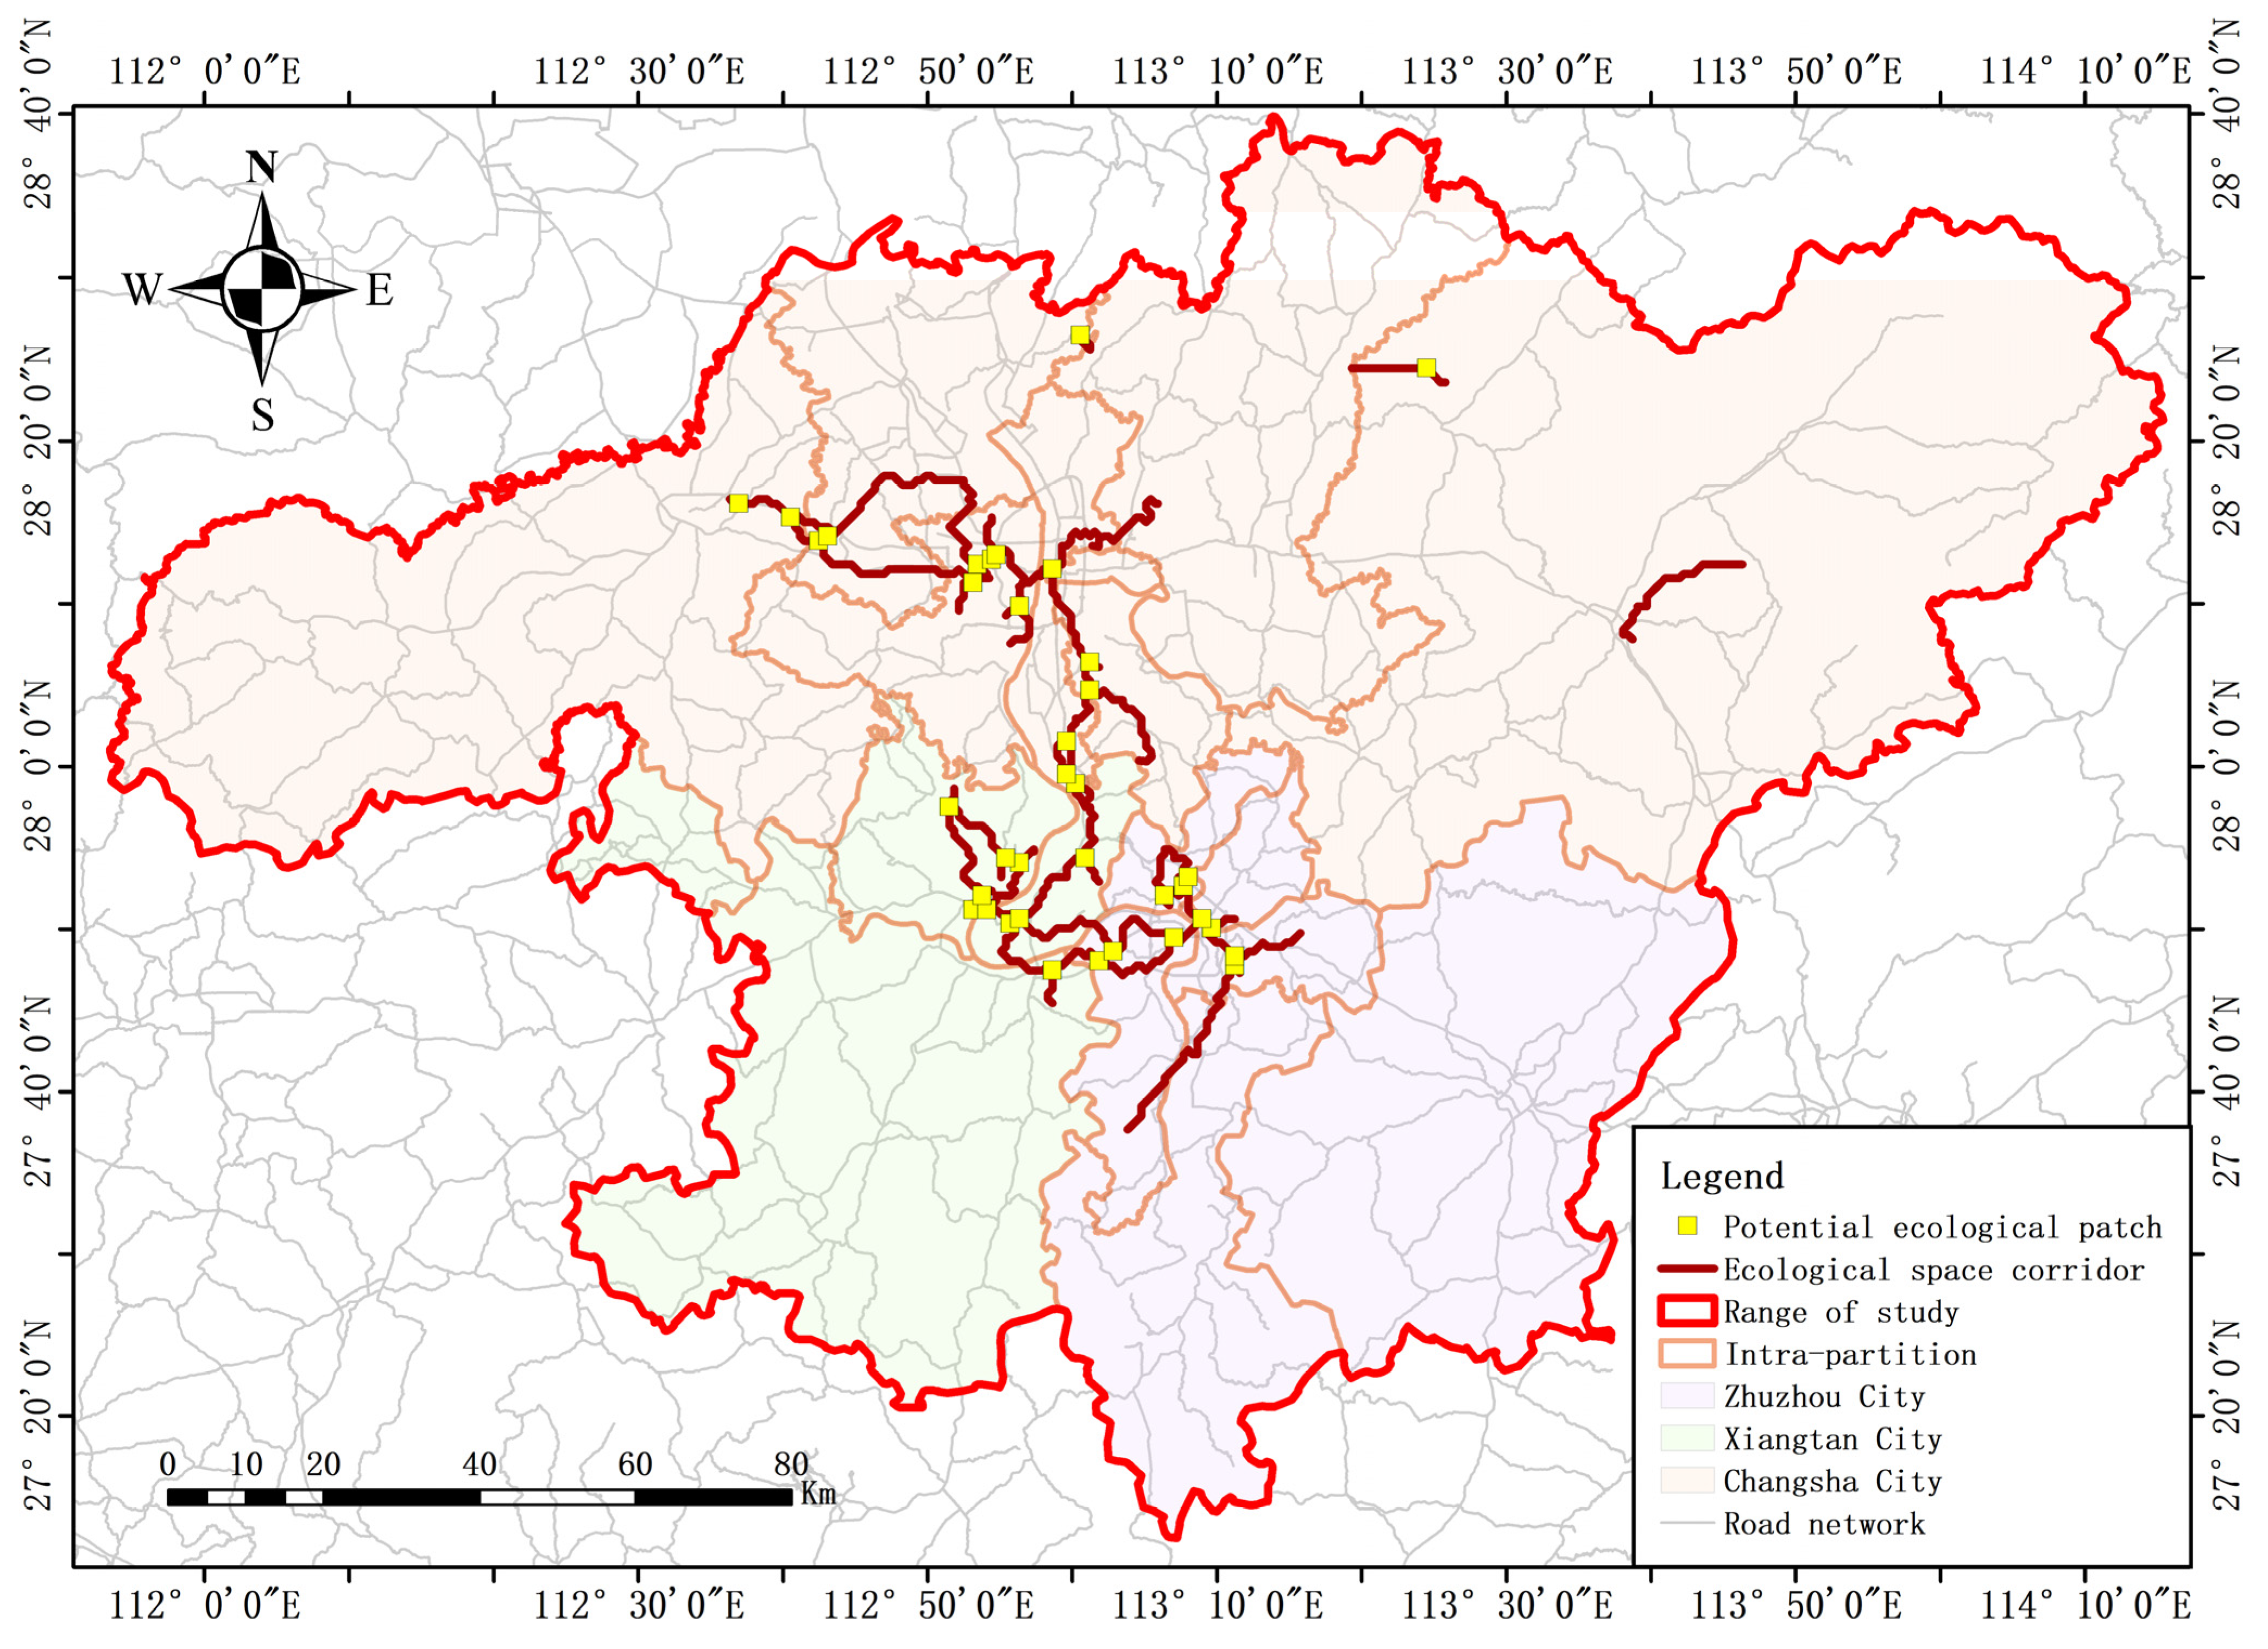
In ArcGIS 10.6, if the connection points of the ecological space corridors are within the ecological space, they are considered ecological patches; if they are not within the ecological space, they are regarded as potential ecological patches. Based on the ecological and environmental characteristics of the Chang-Zhu-Tan metropolitan area, the identification results of the “Production-Life-Ecology” space, the size and spatial location of the ecological patches, important ecological patches with an area greater than 0.1 km2 and significant ecological functions within the study area have been identified. These include natural or artificial ecological sources such as Yuelu Mountain Scenic Area, Yanghu Wetland Park, and Jiuhua De Cultural Park, as well as 48 urban ecological space corridors and 39 (potential) ecological patches, as shown in Figure 7. The total length of the ecological space corridors is 650.30 km, with an average length of 13.54 km (Table 4), the closure of the connectivity index is 0.62, the line-point ratio is 2.19, and the connectivity is only 0.04. Table 4 shows the 48 ecospatial corridors mentioned above, indicating the starting point, midpoint, and length of the corridors, from which it can be seen that Yuelu Mountain Scenic Area and Meixi Lake Ecological Park are important ecological patches, and the ecospatial corridors formed by them as the ecological source occupy a high proportion of the overall ecospatial corridors, and at the same time, the lengths of the ecospatial corridors formed by them are diversified, which side by side reflects the ecological influence of the ecological patches. The length of the ecospatial corridor formed by it is diversified, reflecting the ecological influence of this ecological patch. It can be seen that the ecological space corridors of the Chang-Zhu-Tan metropolitan area are concentrated in the central area and develop along the axis. The ecological space corridors around the central “ecological green heart” area have a high degree of circularity, the horizontal network connection is dense, and the ecological network structure is relatively complex. However, the ecological correlation with the surrounding areas is low. The surrounding areas of the metropolitan area have smaller ecological patches, fewer ecological space corridors, poor connectivity, and have not formed ecological space corridors that connect various ecological patches.
Referring to the “Hunan Province Provincial Ecological Corridor Construction Master Plan (2019–2023)” and the “Changsha City Ecological Corridor Construction Plan (2020–2023)” for the delineation of ecological corridors, this study classifies potential ecological space corridors into three levels: cross-regional ecological corridors, metropolitan area internal ecological corridors, and district-level characteristic ecological corridors, from the perspectives of the metropolitan circle, the city, and the district levels. The first level, cross-regional ecological corridors, mainly connect the green channels between different cities or regions within the metropolitan circle, as well as the ecological spaces of urban and rural areas, achieving the interconnection of urban and rural ecological spaces, which is of strategic significance and crucial for maintaining regional ecological security and promoting the flow of ecological resources. The second level, metropolitan area internal ecological corridors, run through the green network within the city, mainly connecting larger ecological patches, enabling urban spaces with lower ecological resistance to exchange information and complete the cross-district flow of ecological information. The third level, district-level characteristic ecological corridors, are important channels connecting ecological islands within the city, such as urban parks, community green spaces, small and micro wetlands, etc., and also strengthen the internal connections between ecological patches.
The classification of potential ecological space corridors within the Chang-Zhu-Tan metropolitan area is as follows: there are 9 cross-regional ecological corridors, 13 metropolitan area internal ecological corridors, and 26 district-level characteristic ecological corridors. Figure 8, Figure 9, Figure 10 and Figure 11 shows the breakdown of the corridors at each level, with the serial numbers of the corridors in the map matching the serial numbers in Table 4, which should be read in conjunction with Table 4.
(1) Cross-regional ecological corridors (Figure 8). Within the Changsha city area, there are 3 distributed corridors that precisely connect the Wangcheng District with the Yuelu District and the Furong District with Changsha County. They serve not only as green channels for the transmission of ecological information but also significantly strengthen the close connection and interaction between the central urban areas and the surrounding ecological spaces. Within the Xiangtan city area, 5 corridors are distributed with strong connectivity, and the overall form is basically in line with the Xiangjiang River basin within the territory of Xiangtan city. This feature indicates that the formation of these ecological space corridors is closely related to the water areas. As an important ecological element, water areas play a key role in the formation and development of the corridors. These corridors not only protect the ecological environment of the Xiangjiang River basin but also promote ecological exchange and integration within Xiangtan City and surrounding areas. Within the Zhuzhou city area, there is only 1 remaining corridor, which, with a length of about 29 km, has become the longest ecological corridor within the territory of Zhuzhou city. It crosses through the Tianyuan, Lukou, and Lusong areas, effectively connecting the natural ecosystems and artificial green spaces in these areas, forming a strong ecological connectivity.
Figure 8. Cross-regional ecological corridor.
Sustainability 16 08228 g008
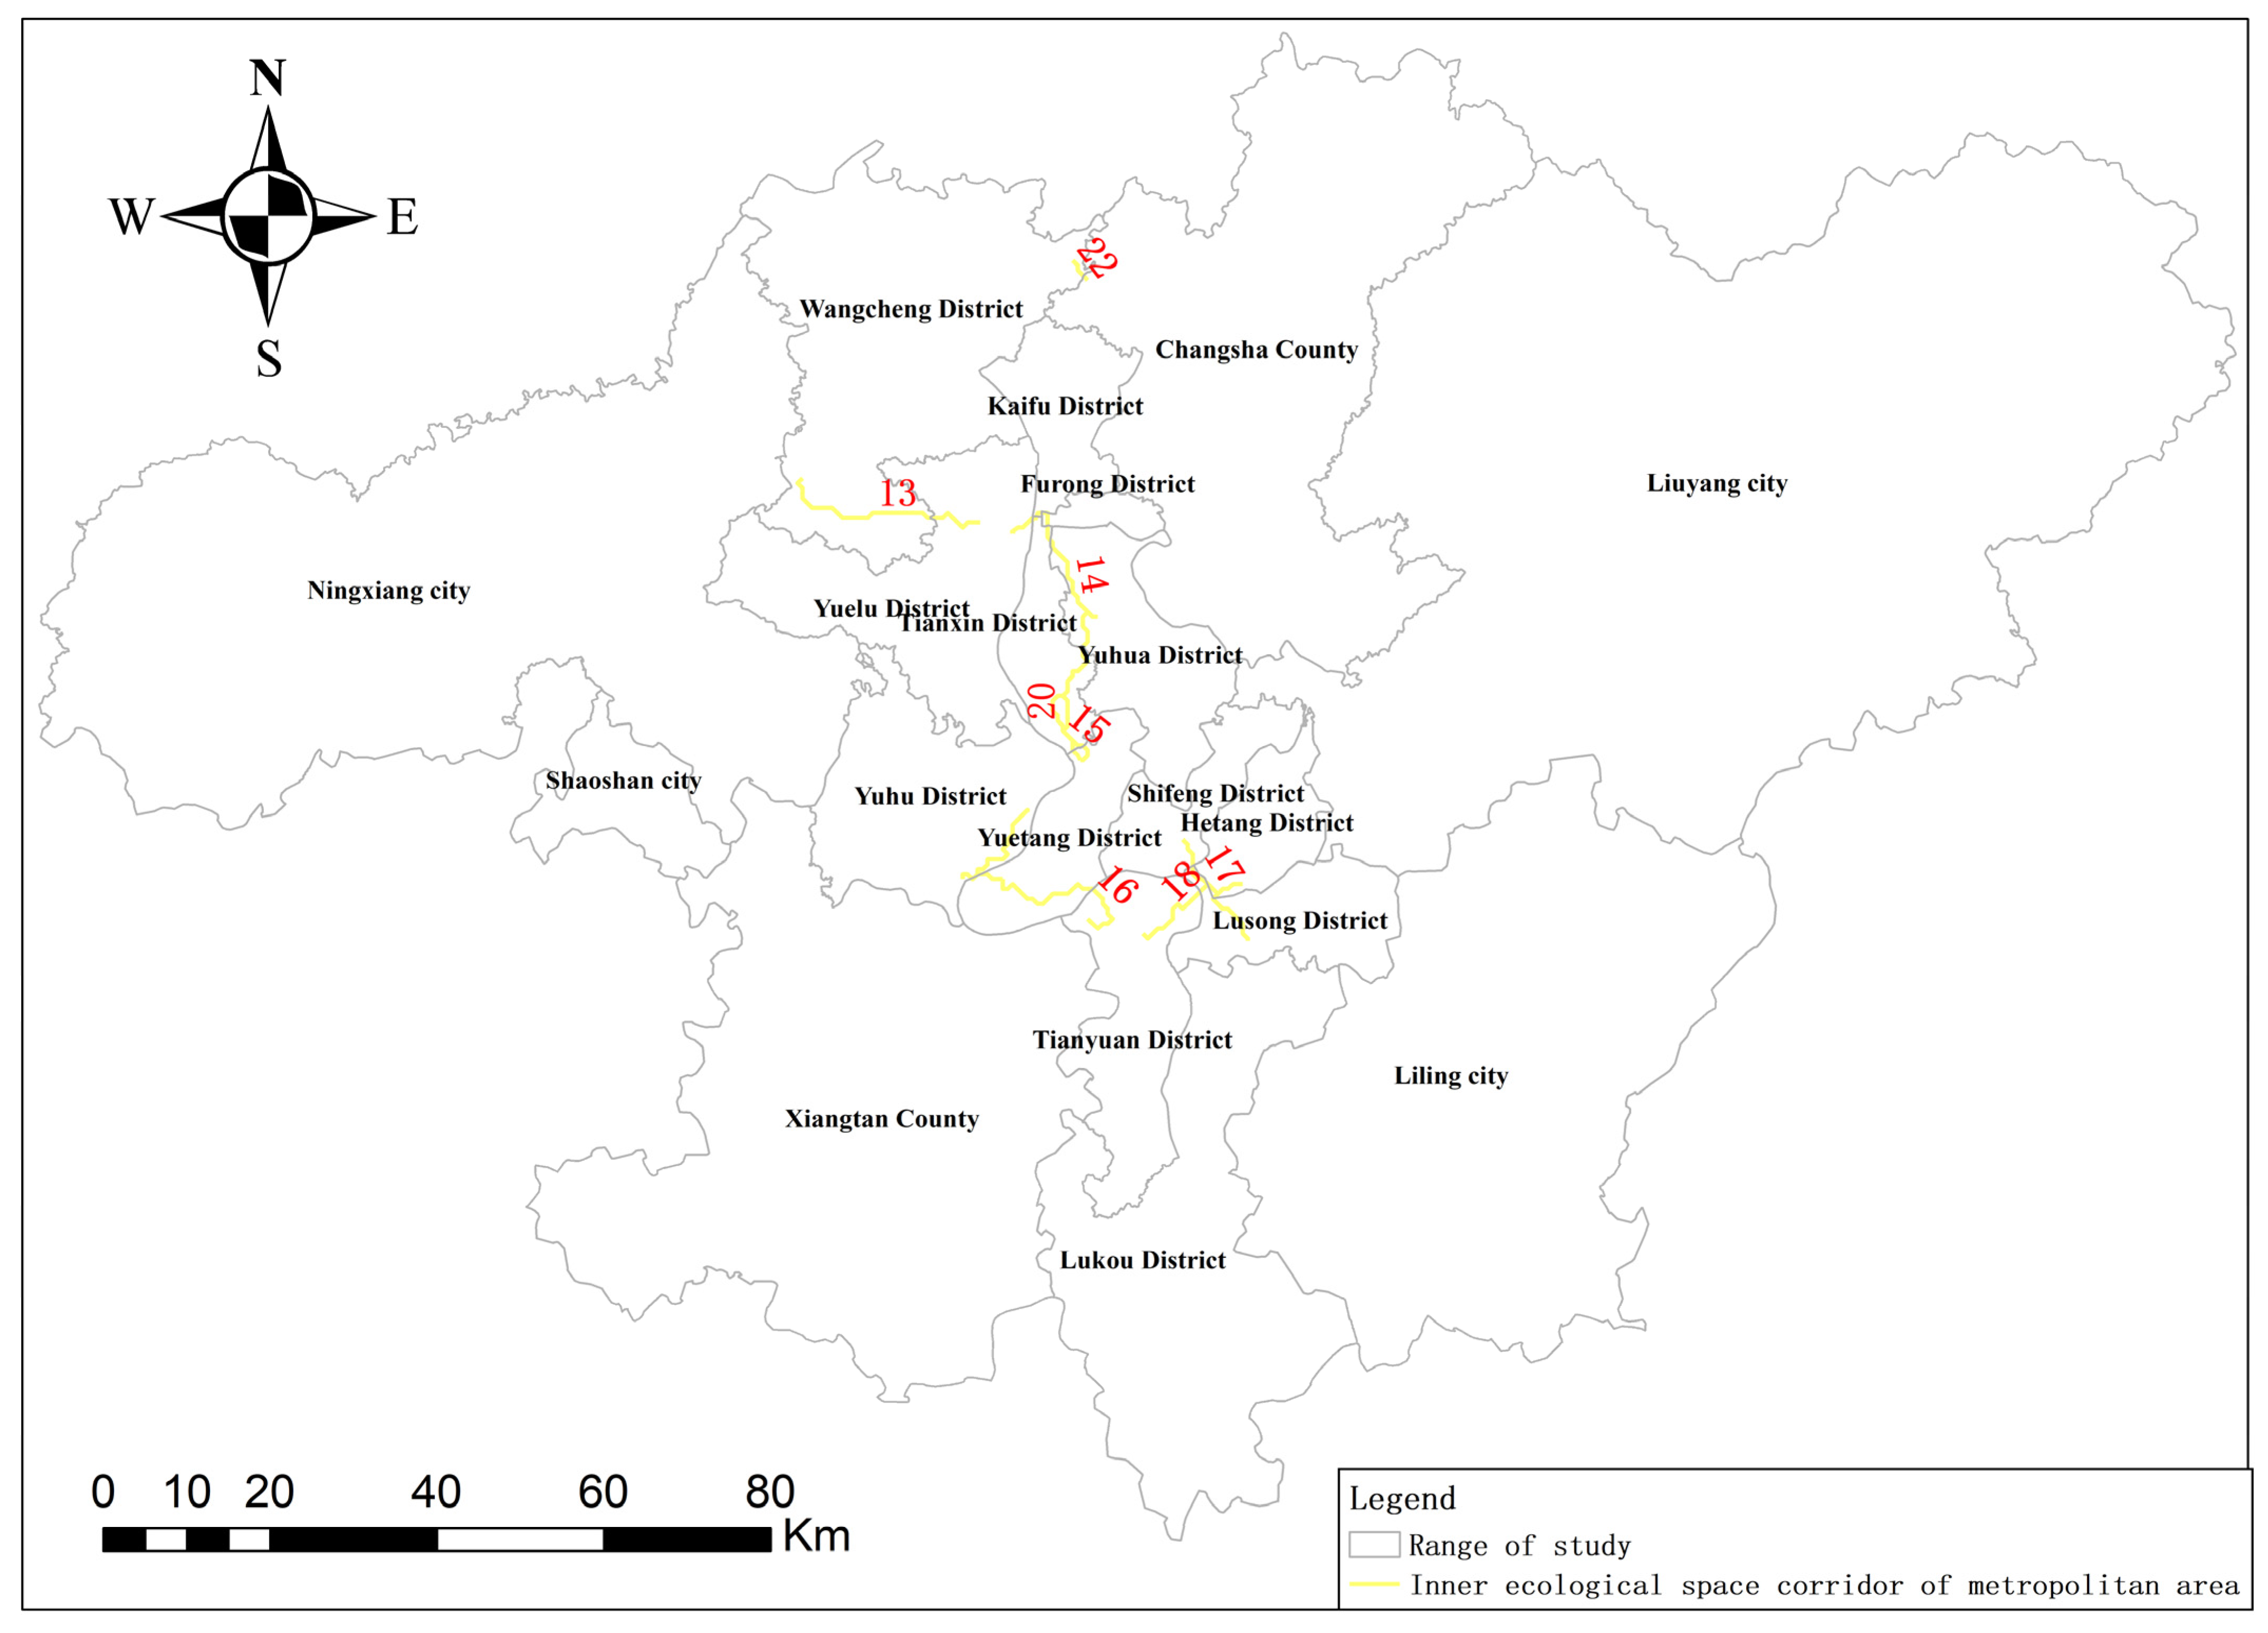
(2) Metropolitan area internal ecological corridors (Figure 9). Mainly distributed in the central area of the Chang-Zhu-Tan metropolitan circle, they generally run from north to south, with strong connectivity between the corridors, and the straight-line distance of disconnection is basically less than 5 km. This lays the foundation for the future high spatial connectivity of the Chang-Zhu-Tan metropolitan circle and also proves that the core area of the Chang-Zhu-Tan metropolitan circle has initially met the prerequisites for constructing a comprehensive ecological space corridor grid.
Figure 9. Ecological corridor within the metropolitan area.
Sustainability 16 08228 g009
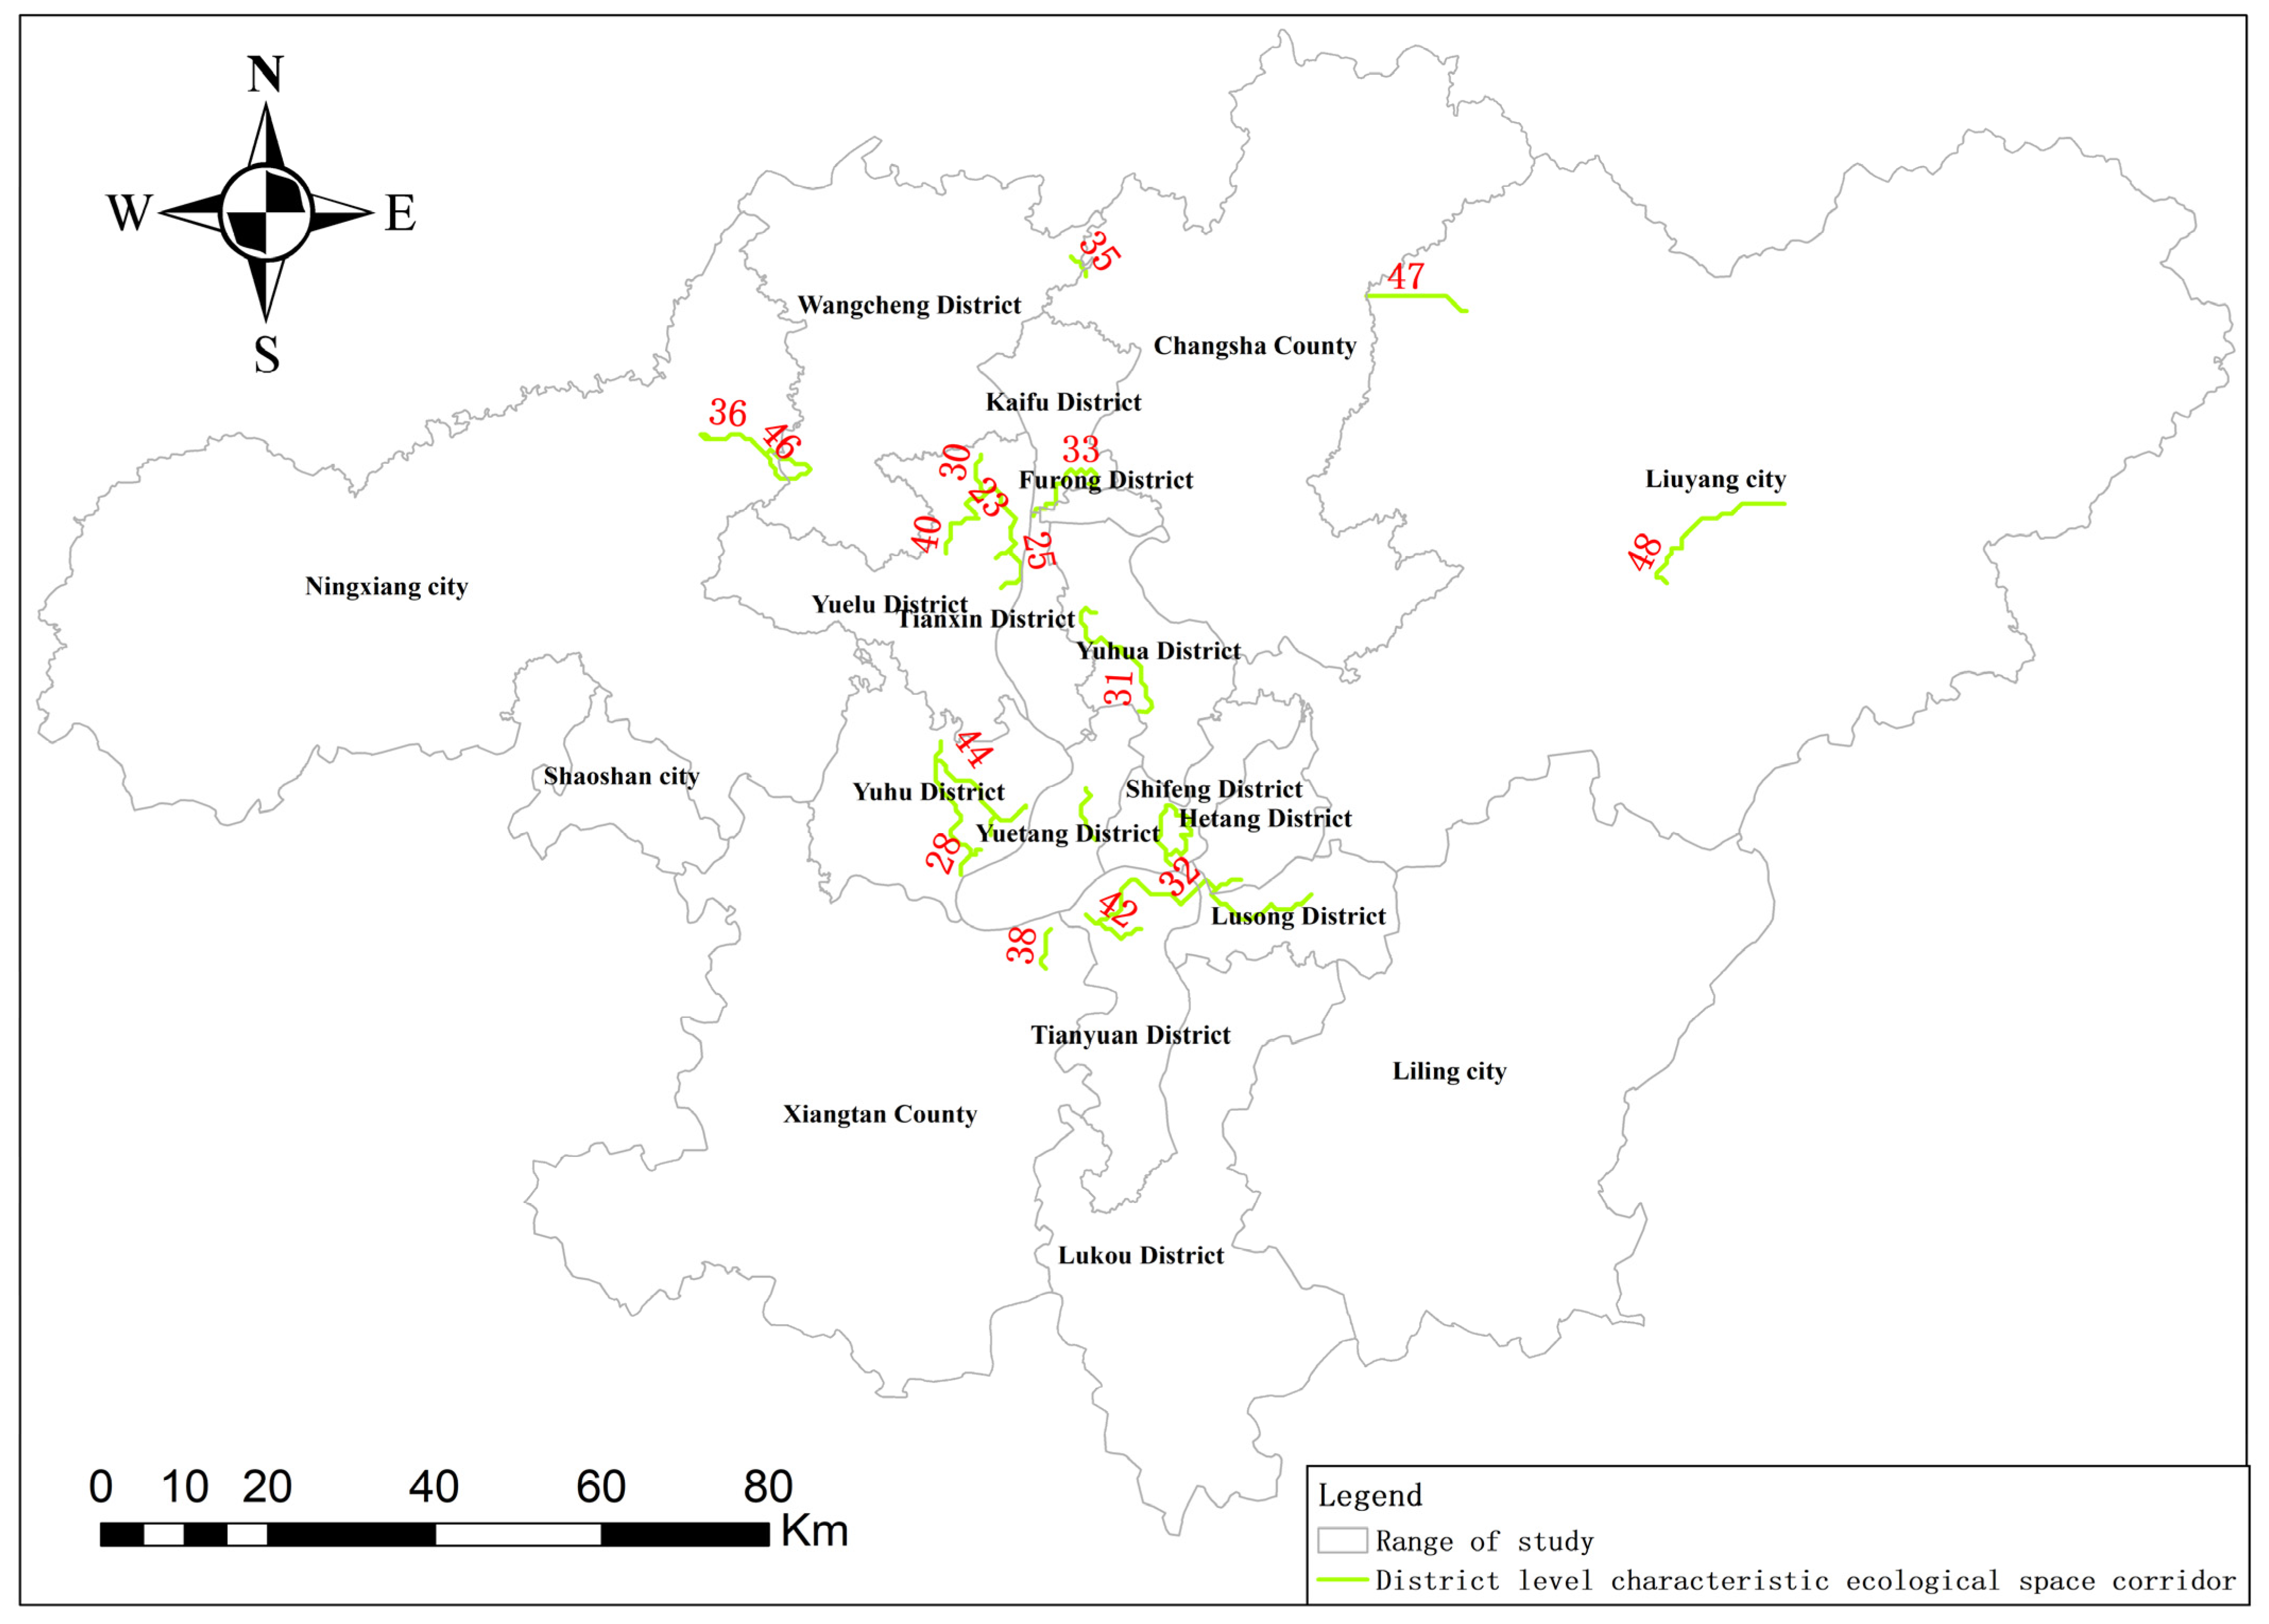
District-level characteristic ecological corridors (Figure 10). In terms of overall distribution, they show distinct levels and differences. The central city area, as the core, has a denser layout of ecological corridors compared to the surrounding areas. The density of corridors in the central city areas of Zhuzhou and Xiangtan is slightly higher than that in the central city area of Changsha, forming a unique “dual-core leadership, center dense” distribution pattern. Outside the central city area, there are four relatively independent ecological corridors, located in Ningxiang City, Liuyang City, and Changsha County, respectively.
Figure 10. District-level characteristic ecological corridor.
Sustainability 16 08228 g010
An overall analysis of the ecological space corridors at all levels, as shown in Figure 11, indicates that the current ecological space corridors in the metropolitan area are mainly concentrated in the central region, especially in the urban central areas of the three cities of Chang-Zhu-Tan. The ecological corridors in the surrounding areas are sporadically distributed, mostly district-level ecological corridors, with relatively lower grades and scales, which have a limited impact on the overall construction of the urban and rural ecological space network. The distribution characteristics of the corridors in the central concentration area are quite obvious: the northern part shows a north-south strip distribution pattern, connecting multiple ecological patches; the southern part takes the Xiangjiang River as a natural link, forming a more significant grid distribution trend. The ecological corridors on both sides of the Xiangjiang River are interwoven, jointly building an ecological network system. This layout not only strengthens the ecological connectivity within the region but also lays an ecological foundation for the sustainable development of the Chang-Zhu-Tan metropolitan circle.
Figure 11. Overall ecological corridor distribution.
Sustainability 16 08228 g011

3.4. Results of Ecological Space Network Construction

In the process of deepening the construction of the Chang-Zhu-Tan city cluster’s ecological space network, the study will incorporate the potential ecological patches that have been identified into the range of ecological source areas and build a corridor network to enhance connectivity. Optimizing and integrating through a “point-line-surface” process will consolidate the independent and fragmented ecological spaces, enhance the integrity and completeness of the ecological space, and promote the sustainable ecological development of the region.
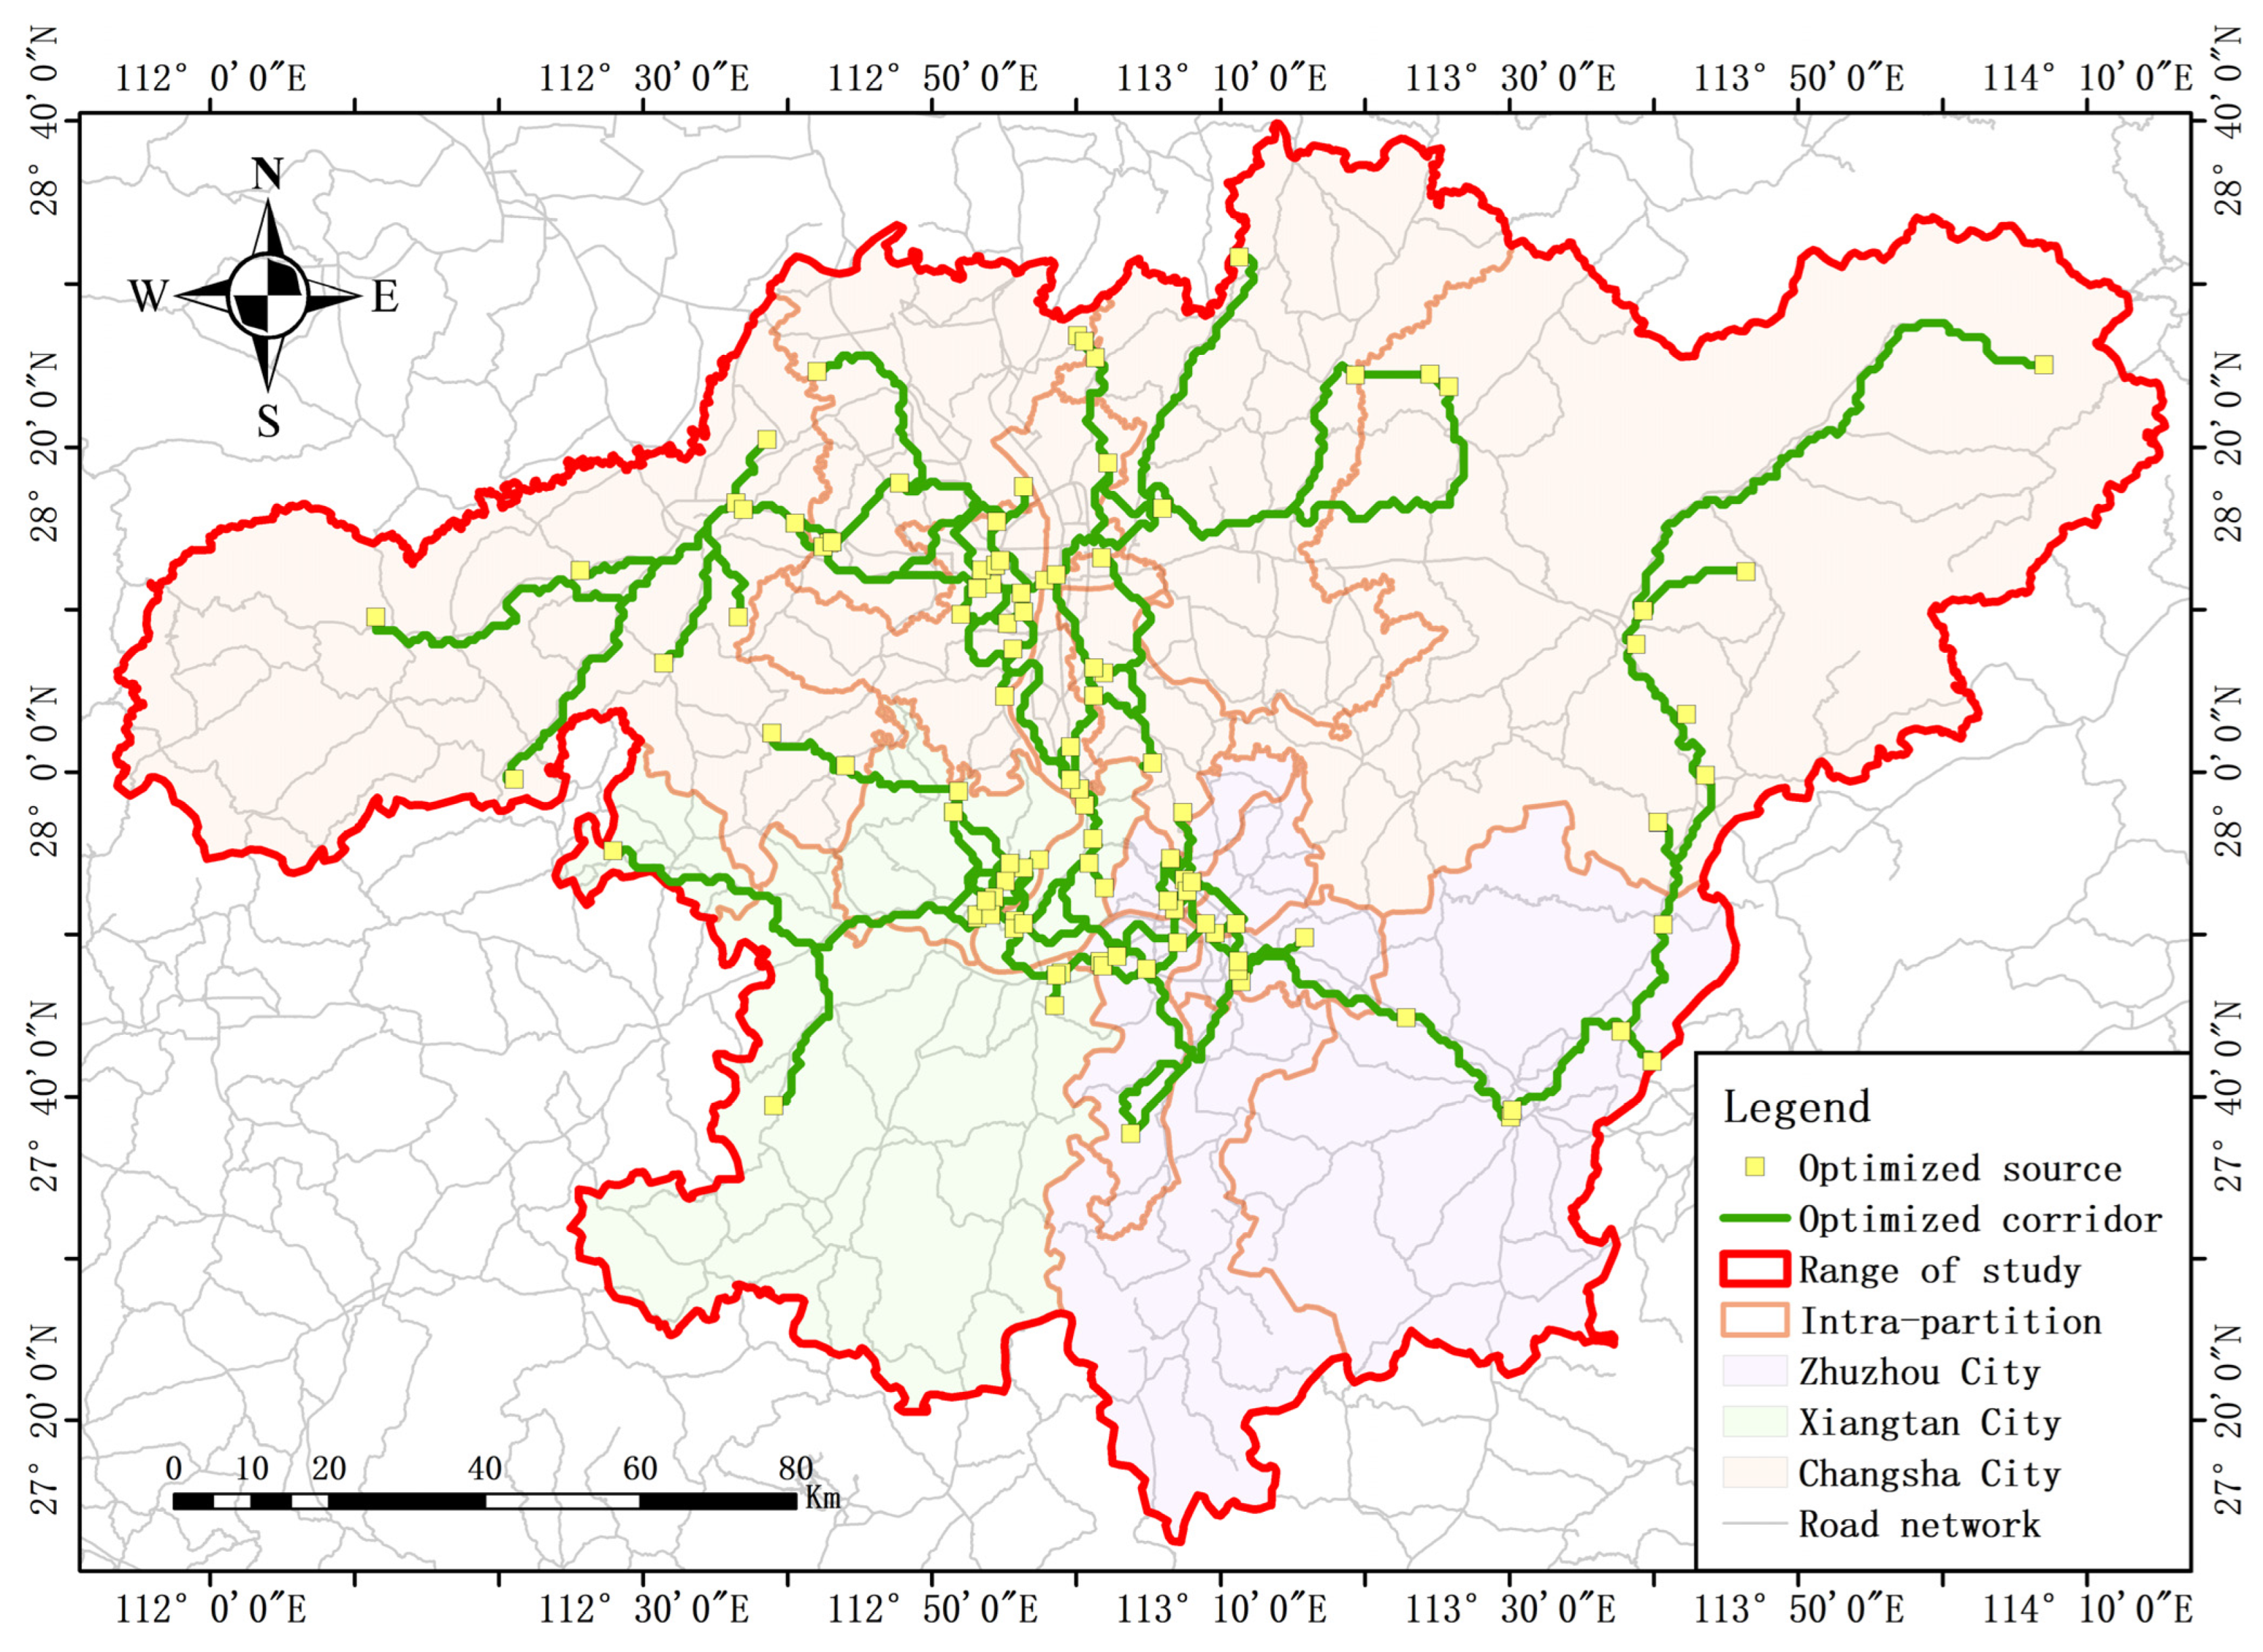
The overall construction of the metropolitan area’s ecological space network is shown in Figure 12, with 53 new ecological corridors added, averaging a length of 18.8 km. Among them:
(1)
There are 11 cross-regional ecological corridors, utilizing high-quality ecological resources such as Meixi Lake, Beishan Forest Wetland Park, Xiangbiwo Forest Wetland Park, and the Luoxiao Mountain Range. Urban-level ecological corridors are planned on the outskirts of the metropolitan area, relying on composite traffic corridors to form a green ring around the metropolitan area and wedge-shaped ecological green rings. This connects the highly concentrated Chang-Zhu-Tan main urban area with the loosely distributed town groups on the periphery. Between the town groups, radial green wedges are used as isolation to form a “green wedge + green ring” cross-regional ecological spatial network with a ring and radial pattern.
(2)
There are 12 internal metropolitan area ecological corridors, utilizing high-quality ecological resources such as the Xiangjiang River and its scenic belt, the Da Wangshan Scenic Area, the Chang-Zhu-Tan Green Heart Ecological Protection Zone, as well as the “potential” ecological patches excavated by previous studies. Ecological corridors are planned within the metropolitan area. The three urban functional centers of Changsha, Zhuzhou, and Xiangtan are connected by a network of traffic corridors such as Furong Road, Xiaoxiang Road, Beijing-Hong Kong-Macao Expressway, Chang-Tan West Expressway, and Shanghai-Kunming Expressway, and are distributed along the Xiangjiang River. In the center is the “Green Heart” ecological protection area connected by ecological conservation green belts. The functional centers are interwoven with the ecological green heart, and the functional centers are separated by ecological green belts, forming an internal “Green Heart + Green Belt” ecological space network pattern of the metropolitan area with a belt and grid chessboard layout.
(3)
Thirty district-level characteristic ecological corridors can integrate and connect micro-level urban ecological points such as parks, community green spaces, and ancillary green spaces, “making the small into the large” to construct a diversified and multi-level composite ecological information network, transforming “islands” into a “network”. For example, by utilizing elements such as Yuhu Park in Yuhu District of Xiangtan City, Jiuhua Lake China Virtue Culture Park, Jinxia Mountain Forest Park, and Wanfeng Lake Wetland Park, the district-level ecological space corridors numbered 44, 38, and 42 can be integrated and upgraded, thereby incorporating them into the internal metropolitan area ecological corridor network.

4. Discussions

At present, the Chang-Zhu-Tan metropolitan area faces significant challenges in promoting the construction of ecological space corridors. The primary dilemma lies in the fragmented distribution of ecological space and the lack of overall construction, which not only weakens the coherence and systematic nature of the corridor layout but also overly relies on linear structures, making it difficult to build an efficient and collaborative ecological network system. Secondly, the number of corridors is severely insufficient at all levels, which cannot support the comprehensive needs of the metropolitan area’s ecological space networking, thereby restricting the efficient flow and widespread sharing of ecological resources. What is more severe is the imbalance in the allocation of “Production, Living, and Ecology” spaces within the region, with excessive expansion of living spaces, and there is a lack of in-depth exploration and practice of strategies for the multi-element integration and efficient use of the three.
In response to the aforementioned issues, this paper focuses on the three main cities, thirteen municipal districts, and six counties within the Chang-Zhu-Tan metropolitan area. Based on the concept of balanced development of “Production, Living, and Ecology” spaces, it meticulously identifies and classifies ecological spaces. By applying the minimum resistance model to extract core ecological source areas and generate ecological resistance surfaces, it further utilizes the MCR gravity model to construct the ecological space corridor network of the metropolitan area. The results show that:
(1) Characteristics of Ecological Resistance Formation: Ecological resistance is positively correlated with the abundance of urban POI (Points of Interest) elements. High resistance values are mainly concentrated in the central areas of the three main cities and six county centers, and the resistance values gradually decrease from the main cities and county centers to the periphery, revealing the tension between urban development and ecological protection.
(2) Identification and Classification of Metropolitan Ecological Corridors: Based on a comprehensive consideration of the gravitational forces between ecological patches and the inhibitory forces of urban elements, 9 inter-regional ecological corridors, 13 internal metropolitan ecological corridors, and 26 district-level characteristic ecological corridors have been identified. This classification not only reveals the hierarchical structure of the corridors but also provides detailed data support for subsequent planning.
(3) Urban Ecological Space Network Construction Strategy: Adhering to the “point-line-surface” construction logic, that is, the “ecological patch-ecological corridor-ecological space network” model, it creatively integrates the “green wedge + green ring” ring network radial model with the “green heart + green belt” belt network checkerboard model. For different types of ecological corridors, by adding metropolitan ecological space corridors, a trans-regional ecological space network and an internal metropolitan ecological space network are constructed. The trans-regional ecological space network mainly adopts the “green wedge + green ring” ring network radial model, while the internal metropolitan ecological space network mainly adopts the “green heart + green belt” belt network checkerboard model (Figure 13). The “green wedge” refers to large wedge-shaped ecological patches that extend from the outer areas into the interior of the metropolitan circle, such as Liling Mingyue Peak, Changsha Dashiba Forest Park, Ningxiang Weishan, etc., serving as ecological corridors connecting the inside and outside of the metropolitan circle. With their unique form, they guide the expansion trajectory of the metropolitan circle, showing an outward radiation and orderly development trend. The “green ring” refers to large ring-shaped ecological corridors distributed along the edge of the built-up area of the metropolitan circle, such as Chang-Zhang Expressway, Hang-Chang Expressway, Xu-Guang Expressway, Hu-Kun Expressway, etc. It is a natural ecological barrier that can effectively resist and slow down the encroachment of urban construction land on ecological space, curb uncontrolled urban sprawl and adhesion, maintain the diversity of the metropolitan landscape and ecological balance, and ensure the sustainable development of the metropolitan circle. The “green heart” is a large ecological patch within the metropolitan circle, with the Chang-Zhu-Tan green heart mainly consisting of large areas of forest land, nature reserves, natural landscape areas, and large-scale garden green spaces between the three cities, serving as natural ecological buffers. The “green belt”, as an important link connecting various ecological patches, is a large linear ecological corridor that carries the function of ecological information flow. Inside the metropolitan circle, it is mainly Furong Road, Shaoshan Road, Xiaoxiang Avenue, Tanzhou Avenue, Chang-Tan West Expressway, and the Xiangjiang River, relying on the urban road network and natural water system to build an ecological corridor system connecting various ecological green hearts.
It should be noted that in the construction of the district-level ecological space network, a significant challenge is that the ecological patches in the areas of high POI element aggregation in the main cities and county centers are constrained by high ecological resistance, mainly relying on district-level ecological space corridors as limited channels for ecological information exchange with the outside world. This also leads to a lack of efficient and natural ecological information circulation mechanisms between patches, and these ecological patches are precisely the ones that bear the important function of providing daily leisure and recreational activities for the public, an indispensable part of urban space quality. In order to enhance the overall quality of urban space and promote the smooth exchange and energy flow of ecological information between cities and counties, it is urgent to explore and practice a composite ecological information network structure. This structure can not only effectively enhance the ecological service function of ecological patches but also achieve harmonious coexistence and efficient use of production, living, and ecological space within the metropolitan circle, thus solving the current dilemma. Ways to facilitate the flow of ecological information include the creation of ecological corridors to connect dispersed ecosystems, upgrading the quality of ecological patches to enhance their ecological functions, and planning at the landscape scale to ensure the continuity of ecological networks. In addition, protecting critical habitats, minimizing human disturbance, improving the connectivity of ecological networks, and providing safe passage for wildlife through the construction of bridges and tunnels, etc., are all key measures. Scientific planning using ecological modeling and GIS tools, combined with community involvement and education to raise public awareness, as well as cross-regional cooperation and scientific research, support the management of ecological networks. Finally, the formulation of policies and regulations, and the establishment of sustainable funding mechanisms are all important safeguards to ensure that the flow of ecological information can be effectively facilitated. These integrated measures help to maintain ecosystem health and biodiversity and support the proper functioning of ecological processes.
Based on the aforementioned research findings, the following planning recommendations are proposed for the optimization and protection of ecological space in the metropolitan area: (1) Accurately Match and Optimize Models: Select appropriate optimization models according to the ecological foundation and spatial structure of the metropolitan area, such as adopting the “Green Wedge + Green Ring” model and the “Green Heart + Green Belt” model, to construct an ecological space network at different levels. This approach will adjust the ecological space structure framework according to local conditions, ensuring the integrity and connectivity of the ecosystem, and laying a solid ecological foundation for the sustainable development of the metropolitan area. (2) Expand Ecological Service Functions: Advocate the integration of ecological service functions into production spaces, and explore new models for moderately incorporating production functions into ecological spaces. This will extend the service supply boundary of ecological spaces, promote a win-win situation between ecology and economy, and realize the beautiful vision of green development and prosperous coexistence. (3) Implement Differentiated Zone Management: Based on the differences in ecological sensitivity and service functionality of ecological spaces, implement refined zone management strategies to ensure that various types of ecological spaces are protected and managed in a targeted manner, maximizing their ecological and social benefits.

5. Conclusions

In the new vision of high-quality development of the metropolitan area, green and low carbon have become the distinct trends of its transformation and upgrading, and the scientific planning and optimization of ecological space have constituted the core points of the new stage of urbanization in the metropolitan area. This transformation is of inestimable significance for optimizing the spatial layout of the metropolitan area, strengthening regional collaborative development, and promoting the formation of a more prosperous and sustainable metropolitan pattern. This paper focused on the ecological space at the scale of the metropolitan area, based on the identification of the “three types of living spaces”, and identifies the ecological corridors of the Chang-Zhu-Tan metropolitan area through the minimum resistance model and the MCR gravity model, dividing them into three categories: inter-regional ecological corridors, internal metropolitan ecological corridors, and district-level characteristic ecological corridors. For different types of ecological corridors, it creatively uses the “green wedge + green ring” ring network radial model and the “green heart + green belt” belt network checkerboard model to construct the ecological space network of the metropolitan area, thereby improving the quality of the living environment, preventing the uncontrolled expansion of the metropolitan area, optimizing the spatial layout of the metropolitan area, promoting ecological connections and functional collaboration between cities in the metropolitan area, and laying a solid foundation for the sustainable development of the metropolitan area.
Facing the problems of land resource tension, ecological structure change, and ecological space limitation brought by future urbanization, we need to innovate the ecological space optimization model and strategy. In this paper, we will explore the differentiated management of ecological space in the metropolitan area on the basis of existing research and establish a flexible and efficient dynamic adjustment mechanism to meet the needs of future urban development. Our future research will focus on real-time monitoring of changes in urban ecosystems, enhancing the adaptability of ecospatial optimization models, promoting multidisciplinary cooperation to formulate comprehensive policies, and increasing public participation and awareness of ecological protection. These research directions will support sustainable urban development.

Author Contributions

Investigation, J.Z. and H.Y.; Conceptualization, N.Z.; Methodology, J.Z. and P.Z.; Software, J.Z. and X.J.; Writing—original draft preparation, J.Z. and P.Z.; Supervision, H.Y. and X.J.; Data curation, Writing—review & editing, J.Z. and P.Z.; funding acquisition, N.Z. All authors have read and agreed to the published version of the manuscript.

Funding

This research was funded by the National Natural Science Foundation of China (NSFC) Project, grant number 51178465. Hunan Provincial Department of Education Science Research Project, grant number 23B0478. Hunan Province Graduate Student Research and Innovation Project, grant number CX20240885.

Institutional Review Board Statement

Not applicable.

Informed Consent Statement

Not applicable.

Data Availability Statement

The original contributions presented in the study are included in the article, further inquiries can be directed to the corresponding authors.

Conflicts of Interest

The authors declare no conflict of interest.

References

  1. Shaker, R.R.; Yakubov, A.D.; Nick, S.M.; Vennie-Vollrath, E.; Ehlinger, T.J.; Forsythe, K.W. Predicting aquatic invasion in Adirondack lakes: A spatial analysis of lake and landscape characteristics. Ecosphere 2017, 8, e01723. [Google Scholar] [CrossRef]
  2. Shaker, R.R.; Altman, Y.; Deng, C.; Vaz, E.; Forsythe, K.W. Investigating urban heat island through spatial analysis of New York City streetscapes. J. Clean. Prod. 2019, 233, 972–992. [Google Scholar] [CrossRef]
  3. Lee, K.; Kim, Y.; Sung, H.C.; Kim, S.H.; Jeon, S.W. Surface urban heat island in South Korea’s new towns with different urban planning. Environ. Monit. Assess. 2022, 194, 360. [Google Scholar] [CrossRef] [PubMed]
  4. Wang, M.; Guo, G. The coupled and coordinated relationship between urbanisation and ecological environment in the Shanghai metropolitan area—An empirical analysis based on panel data from 2011–2020. J. Beijing For. Univ. 2024, 46, 101–111. [Google Scholar]
  5. Wu, M.; Wu, X. Exploration of urban ecological network planning based on the concept of ‘ecological integration city’—An overview of the division and reconnection of ecological functions in spatial planning. Urban Plan. 2018, 42, 9–17. [Google Scholar]
  6. Yuan, Q.; Li, R. The negative impacts of human activities on the ecological corridor in the karst highly urbanized area are gradually diminishing: A case study from the karst mountain cities in Southwest China. Ecol. Indic. 2023, 157, 111257. [Google Scholar] [CrossRef]
  7. Dadashpoor, H.; Azizi, P.; Moghadasi, M. Land use change, urbanization, and change in landscape pattern in a metropolitan area. Sci. Total Environ. 2019, 655, 707–719. [Google Scholar] [CrossRef]
  8. Aguilera, M.A.; Tapia, J.; Gallardo, C.; Núñez, P.; Varas-Belemmi, K. Loss of coastal ecosystem spatial connectivity and services by urbanization: Natural-to-urban integration for bay management. J. Environ. Manag. 2020, 276, 111297. [Google Scholar] [CrossRef]
  9. Fan, J.; Wang, Q.; Ji, M.; Sun, Y.; Feng, Y.; Yang, F.; Zhang, Z. Ecological network construction and gradient zoning optimization strategy in urban-rural fringe: A case study of Licheng District, Jinan City, China. Ecol. Indic. 2023, 150, 110251. [Google Scholar] [CrossRef]
  10. Wang, Y.; Qu, Z.; Zhong, Q.; Zhang, Q.; Zhang, L.; Zhang, R.; Yi, Y.; Zhang, G.; Li, X.; Liu, J. Delimitation of ecological corridors in a highly urbanizing region based on circuit theory and MSPA. Ecol. Indic. 2022, 142, 109258. [Google Scholar] [CrossRef]
  11. Zheng, S.; Yang, S.; Ma, M.; Dong, J.; Han, B.; Wang, J. Linking cultural ecosystem service and urban ecological-space planning for a sustainable city: Case study of the core areas of Beijing under the context of urban relieving and renewal. Sustain. Cities Soc. 2023, 89, 104292. [Google Scholar] [CrossRef]
  12. Hüse, B.; Szabó, S.; Deák, B.; Tóthmérész, B. Mapping an ecological network of green habitat patches and their role in maintaining urban biodiversity in and around Debrecen city (Eastern Hungary). Land Use Policy 2016, 57, 574–581. [Google Scholar] [CrossRef]
  13. Jiake, S.; Yuncai, W. An improved method for the identification and setting of ecological corridors in urbanized areas. Urban Ecosyst. 2022, 26, 141–160. [Google Scholar]
  14. Zhang, Y.; Hu, W.; Min, M.; Zhao, K.; Zhang, S.; Liu, T. Optimization of ecological connectivity and construction of supply-demand network in Wuhan Metropolitan Area, China. Ecol. Indic. 2023, 146, 109799. [Google Scholar] [CrossRef]
  15. Yang, S. Evaluation of urban ecological security model based on GIS sensing and MCR model. Meas. Sens. 2024, 33, 101206. [Google Scholar] [CrossRef]
  16. Huang, Y.; Chen, T.; Hu, D.; Lin, T.; Zhu, W.; Zhang, G.; Xue, X. Spatiotemporal patterns and influencing factors of urban ecological space availability in coastal cities of China during rapid urbanization. Ecol. Indic. 2023, 154, 1160. [Google Scholar] [CrossRef]
  17. Sobhani, P.; Esmaeilzadeh, H.; Wolf, I.D.; Deljouei, A.; Marcu, M.V.; Sadeghi, S.M.M. Evaluating the ecological security of ecotourism in protected area based on the DPSIR model. Ecol. Indic. 2023, 155, 110957. [Google Scholar] [CrossRef]
  18. Biedemariam, M.; Birhane, E.; Demissie, B.; Tadesse, T.; Gebresamuel, G.; Habtu, S. Ecosystem Service Values as Related to Land Use and Land Cover Changes in Ethiopia: A Review. Land 2022, 11, 2212. [Google Scholar] [CrossRef]
  19. Li, X.; Li, Z.; Xie, X.; Liu, X.; Chen, J.; Li, Y. Analysis of the interaction mechanism of urbanization, carbon emissions, and production-living-ecological space in Henan Province of China. Nongye Gongcheng Xuebao/Trans. Chin. Soc. Agric. Eng. 2023, 39, 256–265. [Google Scholar]
  20. Bian, H.; Li, M.; Deng, Y.; Zhang, Y.; Liu, Y.; Wang, Q.; Xie, S.; Wang, S.; Zhang, Z.; Wang, N. Identification of ecological restoration areas based on the ecological safety security assessment of wetland-hydrological ecological corridors: A case study of the Han River Basin in China. Ecol. Indic. 2024, 160, 111780. [Google Scholar] [CrossRef]
  21. Wang, S.; Chen, H.; Guo, Y.; Su, W.; Xu, Y.; Cui, S.; Zhou, Z. Interpretation of spatial and temporal changes and drivers of ecological source regions based on LightGBM-SHAP. AIP Adv. 2024, 14, 065036. [Google Scholar] [CrossRef]
  22. Mostofa, T.; Manteghi, G. Influential factors of water body to enhance the urban cooling islands (UCIs): A review. Int. Trans. J. Eng. Manag. Appl. Sci. Technol. 2020, 11, 1–12. [Google Scholar]
  23. Zeng, W.; Tang, H.; Liang, X.; Hu, Z.; Yang, Z.; Guan, Q. Using ecological security pattern to identify priority protected areas: A case study in the Wuhan Metropolitan Area, China. Ecol. Indic. 2023, 148, 110121. [Google Scholar] [CrossRef]
  24. Dai, L.; Liu, Y.B.; Luo, X.Y. Integrating the MCR and DOI models to construct an ecological security network for the urban agglomeration around Poyang Lake, China. Sci. Total Environ. 2021, 754, 141868. [Google Scholar] [CrossRef]
  25. Wang, Z.; Shi, Z.; Huo, J.; Zhu, W.; Yan, Y.; Ding, N. Construction and Optimization of an Ecological Network in Funiu Mountain Area Based on MSPA and MCR Models, China. Land 2023, 12, 1529. [Google Scholar] [CrossRef]
  26. Guan, J.; Hu, J.; Li, B. How to restore ecological impacts from wind energy? An assessment of Zhongying Wind Farm through MSPA-MCR model and circuit theory. Ecol. Indic. 2024, 163, 112149. [Google Scholar] [CrossRef]
  27. Gao, C.; Pan, H.; Wang, M.; Zhang, T.; He, Y.; Cheng, J.; Yao, C. Identifying priority areas for ecological conservation and restoration based on circuit theory and dynamic weighted complex network: A case study of the Sichuan Basin. Ecol. Indic. 2023, 155, 111064. [Google Scholar] [CrossRef]
  28. Hu, J.; Jiao, S.; Xia, H.; Qian, Q. Construction of Rural Multifunctional Landscape Corridor Based on MSPA and MCR Model—Taking Liukeng Cultural and Ecological Tourism Area as an Example. Sustainability 2023, 15, 12262. [Google Scholar] [CrossRef]
  29. Li, Y.Y.; Zhang, Y.Z.; Jiang, Z.Y.; Guo, C.X.; Zhao, M.Y.; Yang, Z.G.; Guo, M.Y.; Wu, B.Y.; Chen, Q.L. Integrating morphological spatial pattern analysis and the minimal cumulative resistance model to optimize urban ecological networks: A case study in Shenzhen City, China. Ecol. Process. 2021, 10, 63. [Google Scholar] [CrossRef]
  30. Lin, J.; Yang, W.; Yu, K.; Geng, J.; Liu, J. Identification and Construction of Ecological Nodes in the Fuzhou Ecological Corridors. Forests 2022, 13, 1837. [Google Scholar] [CrossRef]
  31. Pan, J. Harmonious coexistence between humans and nature must be promoted. In China‘s Global Vision for Ecological Civilization: Theoretical Construction and Practical Research on Building Ecological Civilization; Springer: Berlin, Germany, 2021; pp. 57–72. [Google Scholar]
  32. Zhang, L.; Hou, Q.; Duan, Y. Research on three living spaces in the context of ecological civilisation: Connotation, progress and countermeasures. J. Ecol. 2024, 44, 47–59. [Google Scholar] [CrossRef]
  33. Xiao, P.; Xu, J.; Zhao, C. Conflict identification and zoning optimization of “production-living-ecological” space. Int. J. Environ. Res. Public Health 2022, 19, 7990. [Google Scholar] [CrossRef] [PubMed]
  34. HNPR—2022—00002; Changzhutan Metropolitan Area Development Plan. Hunan Provincial People’s Government: Hunan, China, 2022.
  35. Zhou, Y.; Zhao, X. Spatial relationship between human activity intensity and ecosystem service value in ChangZhuTan urban agglomeration. China Environ. Sci. 2024, 44, 1–14. [Google Scholar] [CrossRef]
  36. Wan, J.; Fei, T. Research on the recognition method of ‘three living spaces’ based on street view images. J. Geo-Inf. Sci. 2023, 25, 838–851. [Google Scholar]
  37. Yu, Z.; Yuan, Y.; Zhou, M.; Yang, Y.; Zhu, L. A study on fine-grained identification and distribution characteristics of street types based on POI—Taking Fuzhou main city as an example. J. Xi’an Univ. Archit. Technol. (Nat. Sci. Ed.) 2022, 54, 406–413. [Google Scholar]
  38. Li, N.; Wu, K. Research on the identification and distribution characteristics of urban functional areas based on POI data. Remote Sens. Technol. Appl. 2022, 37, 1482–1491. [Google Scholar]
  39. Bevilacqua, C.; Sohrabi, P. Networking analysis in the urban context. A novel instrument for managing the urban transition. Urban. Inf. 2020, 12, 6–10. [Google Scholar]
  40. Barthelemy, M. Spatial networks. Phys. Rep. 2011, 499, 1–101. [Google Scholar] [CrossRef]
  41. Calabrese, J.M.; Fagan, W.F. A comparison test of spatial landscape models for ecological connectivity. Ecology 2004, 85, 2087–2095. [Google Scholar]
  42. GB 50137-2011; Code for Classification of Urban Land Use and Planning Standards of Development Land. China Architecture & Building Press: Beijing, China, 2011.
  43. GB/T4754-2017; Industrial Classification for National Economic Activities. (China) National Bureau of Statistics (NBS): Beijing, China, 2017.
  44. Shi, J.; Wu, J. Research on the delineation method of urban ‘three life spaces’ based on POI data--Taking the central part of Xi’an city as an example. Land Resour. Informatisation 2021, 1, 23–29. [Google Scholar]
  45. Liu, J.; Liu, Y.; Li, Y. Classification evaluation and spatial-temporal analysis of "production-living-ecological" spaces in China. Acta Geogr. Sin. 2017, 72, 1290–1304. [Google Scholar] [CrossRef]
  46. Tao, Y.; Wang, Q. Quantitative recognition and characteristic analysis of production-living-ecological space evolution for five resource-based cities: Zululand, Xuzhou, Lota, Surf Coast and Ruhr. Remote Sens. 2021, 13, 1563. [Google Scholar] [CrossRef]
  47. Han, Z.; Shi, J.; Wu, J.; Wang, Z. Recognition Method of “The Production, Living and Ecological Space” based on POI Data and Quad-tree Idea. J. Geo-Inf. Sci. 2022, 24, 1107–1119. [Google Scholar]
  48. Wang, Z.; Feng, J.; Huang, Y.; Yang, T.; Xie, L. Evaluation of ecological space identification, network construction and optimisation model for mega-city metropolitan areas. Gard. China 2024, 1–7. [Google Scholar]
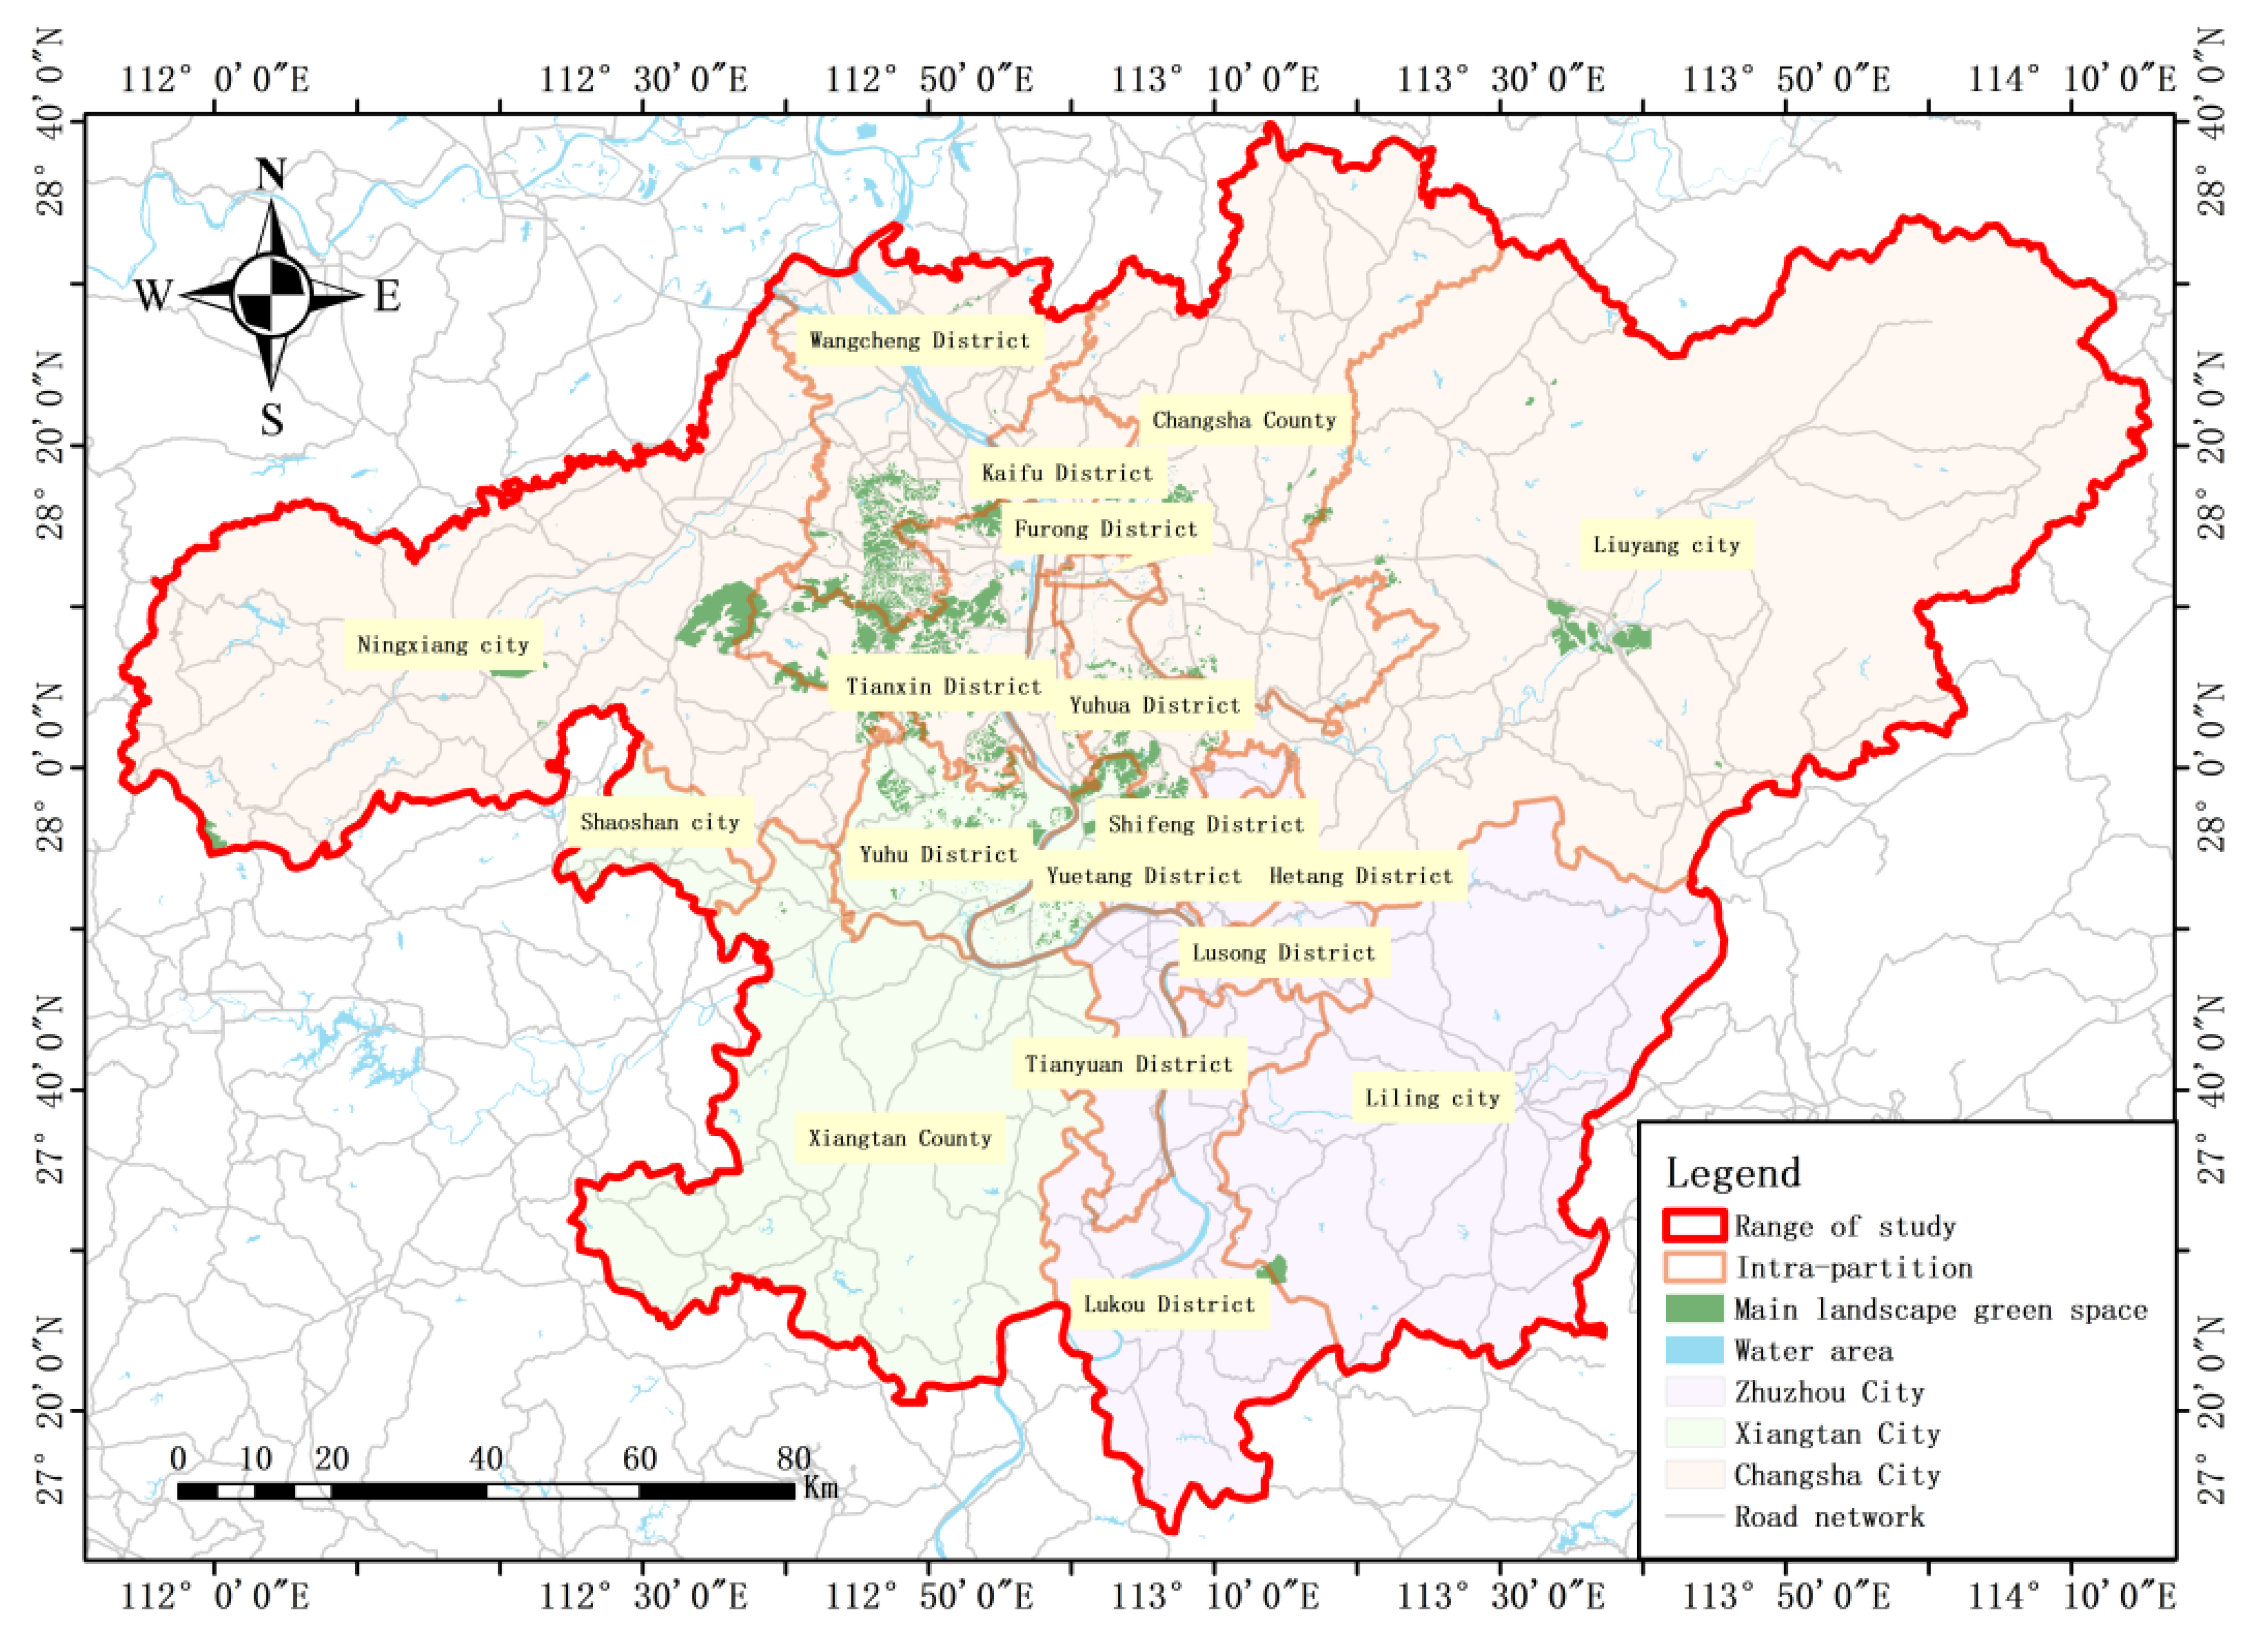
Figure 1. The location of the study area of the Changsha-Zhuzhou-Zhuzhou-Tan metropolitan area.
Sustainability 16 08228 g001
Figure 2. ‘Green wedge + green ring’ radial optimization model of the ring network.
Sustainability 16 08228 g002
Figure 3. ‘Green heart + green belt’ checkerboard optimization model of belt network.
Sustainability 16 08228 g003
Figure 4. Metropolitan ecological space identification and network construction flow chart.
Sustainability 16 08228 g004
Figure 5. Identification results of Production-Living-Ecological space in Changsha Zhuzhou Xiangtan metropolitan area.
Sustainability 16 08228 g005
Figure 6. Distribution of ecological resistance of POI elements in Changsha-Zhuzhou-Xiangtan metropolitan area.
Sustainability 16 08228 g006
Figure 7. Potential ecological corridors.
Sustainability 16 08228 g007
Figure 12. Construction Plan of Ecological Space Corridors in the Chang-Zhu-Tan Metropolitan Area.
Sustainability 16 08228 g012
Figure 13. Ecological Space Network Construction Diagram of the Chang-Zhu-Tan Metropolitan Area.
Sustainability 16 08228 g013
Table 1. Comprehensive weight of POI elements of Production-Living-Ecological Space.
Space TypeCategorySubclassFunction Weight P1Area Score P2 Comprehensive Weight P
Production spaceCommercial Productive spaceCorporate enterprise0.113303.392
Financial insurance0.098302.951
Industrial Production spaceIndustry and Industrial Park0.143507.139
Warehouse logistics0.126101.257
Transportation spaceTransportation services0.242204.835
Public management spaceGovernmental agencies0.278102.783
Living spaceLiving service spaceCatering services0.050100.495
Shopping service0.059150.887
Life service0.040100.396
Medical care0.077201.530
Sports leisure0.041150.621
Science and education culture0.068302.043
Accommodation services0.028150.423
Residential spaceCommercial residence0.6385031.878
Ecological spaceEcological spacePark green space0.6767047.325
Scenic spots0.3249029.154
Table 2. Relative resistance values of various types of POI compressive forces.
Spatial Attributes and External ResistanceResistance ValueSpatial Attributes and External ResistanceResistance Value
Production spaceCorporate enterprise37.17Living spaceCatering services66.23
Financial insurance48.54Shopping service59.88
Factories and industrial parks105.26Life service47.39
Warehousing logistics99.01Medical care30.12
Governmental agencies31.15Sports leisure30.21
Transportation facilities9.92Science and education culture109.89
Ecological spacePark green space3.33Accommodation services68.03
Scenic spots3.33Commercial residence17.54
Table 3. Statistics on the number of cells in each space type.
Space TypeNumber of Units/PieceTotal Unit Area/km2
Production space91283281.52
Living space95293425.70
Ecological space1983712.19
Ecological mixed space19771.64
Table 4. Potential ecological corridors in the Changsha-Zhuzhou-Tan metropolitan area.
NumberOriginEndpointLength/KMNumberOriginEndpointLength/KM
1Yangtian LakeMuYu Lake20.0825Yanghu Wetland ParkYuelu Mountain9.81
2Songya Lake National WetlandShibatun Wetland Park14.6026Jiulangshan ParkShi Feng park8.14
3Zhaoshan scenic spotYangtian Lake Park5.0627Jinpenling ParkShi Feng park6.64
4Wushan Forest Wetland ParkMeixi Lake28.2128Mine Ecological parkYi Jia Hu Park20.03
5MuYu LakeYangtian Lake Park20.0829Heping Ecological ParkYi Jia Hu Park4.696
6Jinxia MountainWanfeng Lake Park5.7930Gushan ParkMeixi Lake11.03
7Hongyan ParkPhoenix Mountain Park29.9131Shiyan Lake ecological tourism scenic spotTianjiling National Park21.74
8MuYu LakeJinxia Mountain15.0832Wanfeng Lake ParkLotus Pond Ecological Park26.21
9Lion Rock ParkWushan Forest Wetland Park12.9333Orange IsleShibatun Wetland Park15.65
10Orange IsleYuelu Mountain3.6534Xiangtan Pan Dragon Grand View GardenYangtian Lake Park7.79
11Jiuhua Lake cultural and ecological ParkYi Jia Hu Park15.3835Beishan ParkBlack Moose Peak3.49
12MuYu LakeYi Jia Hu Park6.1436Lion Rock ParkBoat Mountain17.38
13Lion Rock ParkMeixi Lake26.93737Biquan LakeJiuhua Lake cultural and ecological Park7.54
14Orange IsleTianjiling National Park17.5838Shuizhu ParkJinxia Mountain5.54
15Zhaoshan scenic spotTianjiling National Park25.5239Yuelu MountainMeixi Lake13.07
16Wanfeng Lake ParkMuYu Lake23.0740Elephant trunk NestMeixi Lake7.39
17Jinpenling ParkLotus Pond Ecological Park12.1841Dajing Scenic spotLotus Pond Ecological Park19.32
18Bogu Mountain ParkLotus Pond Ecological Park17.1742Bogu Mountain ParkWanfeng Lake Park8.33
19Phoenix Mountain ParkLotus Pond Ecological Park11.5343Changxing LakeLiuyang River National Wetland15.83
20Zhaoshan scenic spotTianjiling National Park23.3544Mine Ecological parkJiuhua Lake cultural and ecological Park18.53
21Orange IsleYuelu Mountain3.7845Jinpenling ParkJiulangshan Park7.89
22Black Moose PeakBeishan Park3.1446Lion Rock ParkBoat Mountain15.68
23Meixi LakeYuelu Mountain12.9447Chima LakeDashong forest Wetland Park12.74
24Zhaizizing ParkYuelu Mountain5.1148Tianmashan Ecological ParkChangxing Lake ecological Park6.39
Total650.30 kmmean value13.54 km
Disclaimer/Publisher’s Note: The statements, opinions and data contained in all publications are solely those of the individual author(s) and contributor(s) and not of MDPI and/or the editor(s). MDPI and/or the editor(s) disclaim responsibility for any injury to people or property resulting from any ideas, methods, instructions or products referred to in the content.