
A Review of Agrivoltaic Systems: Addressing Challenges and Enhancing Sustainability


Abstract
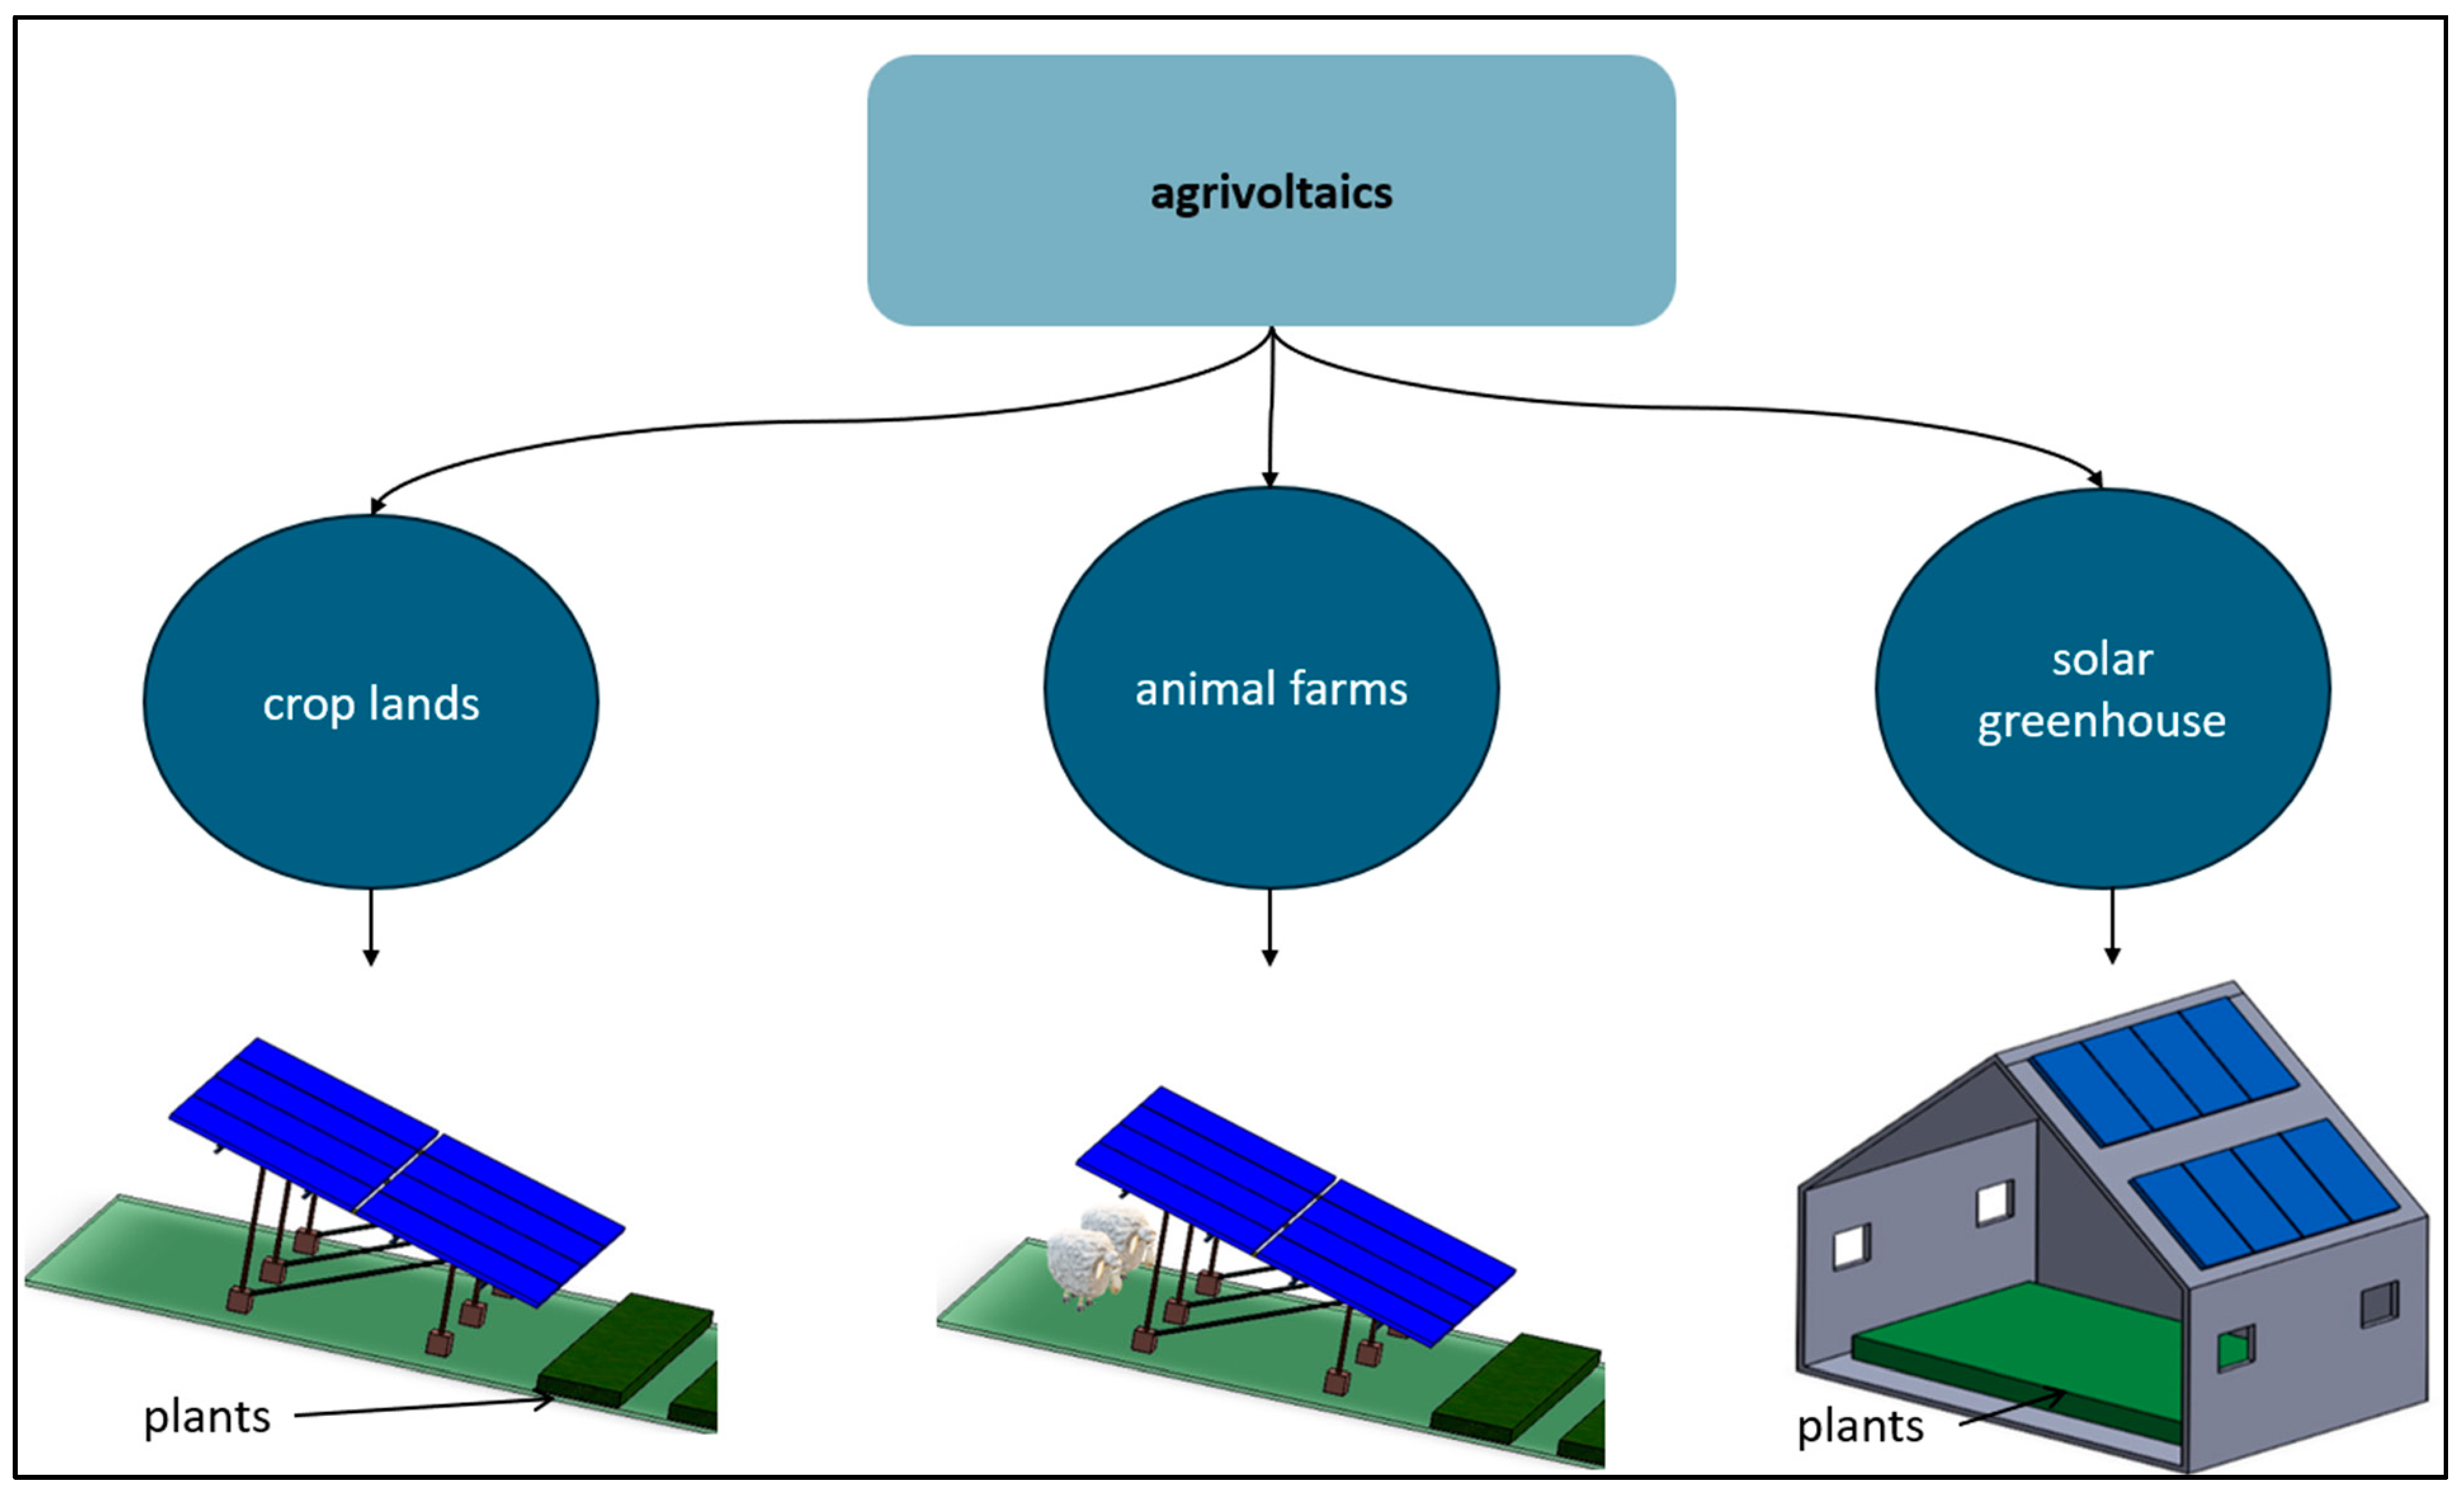
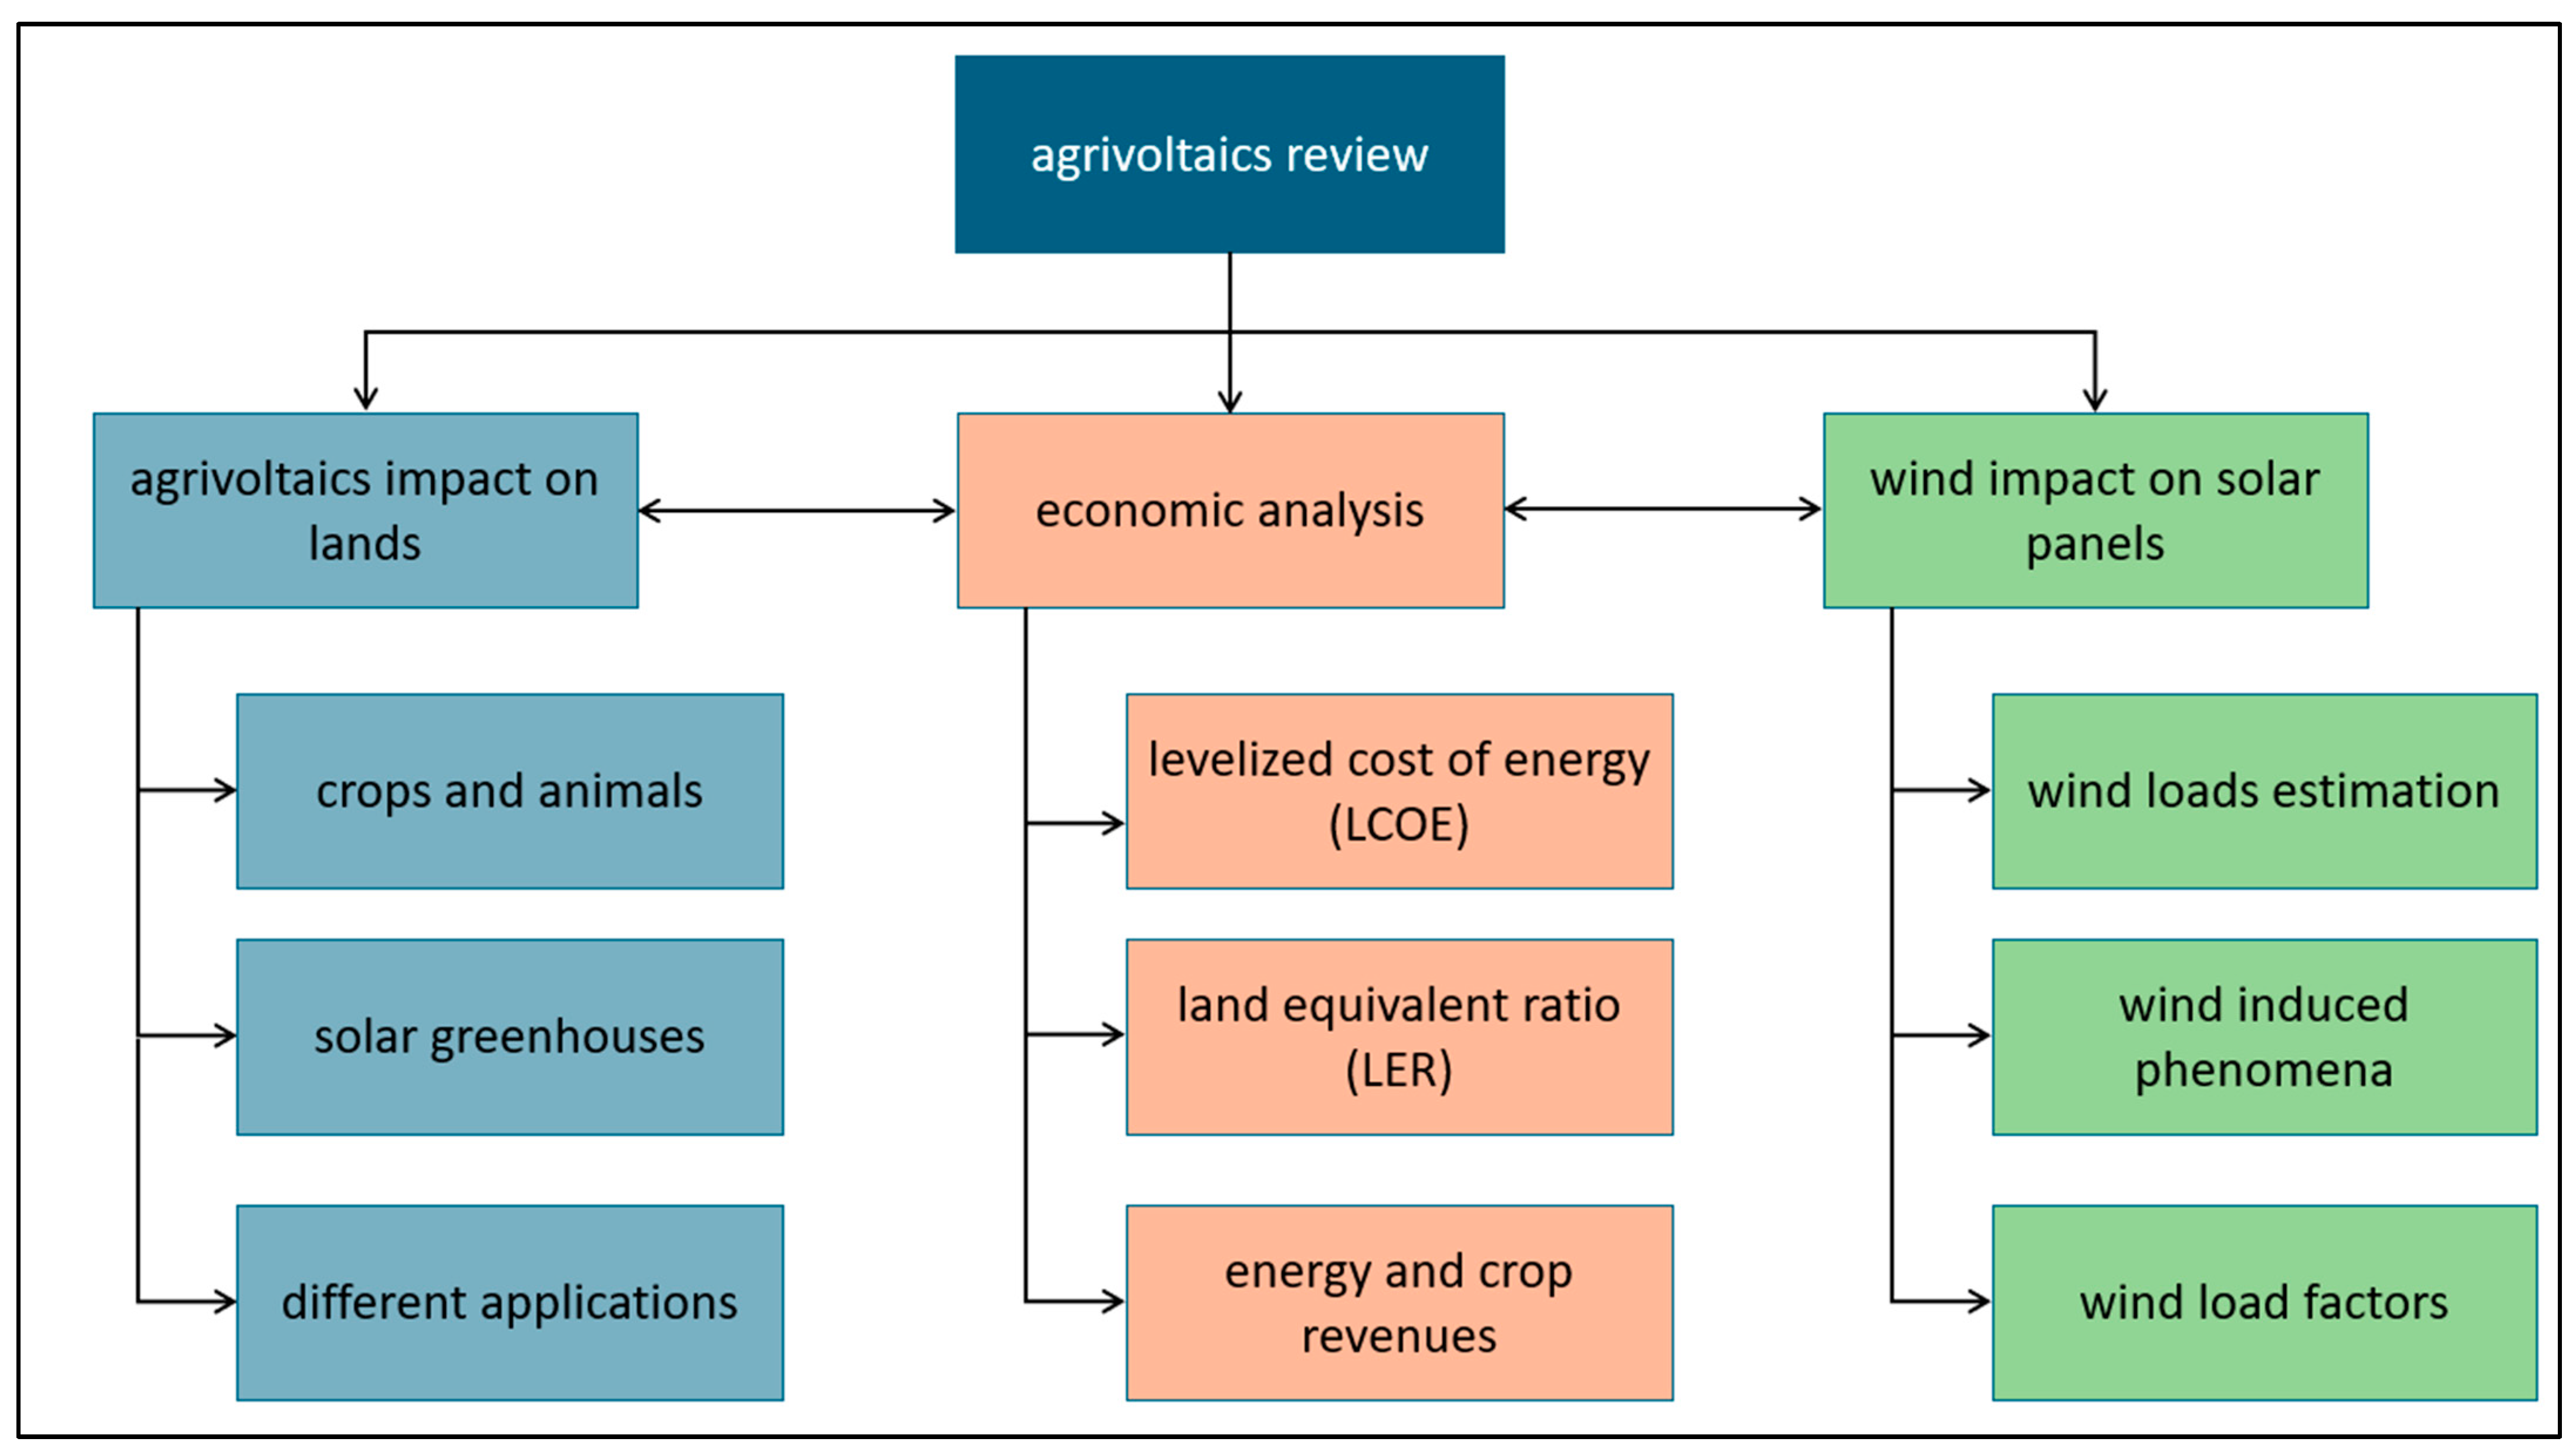
1. Introduction
2. Agrivoltaic Impact on Lands
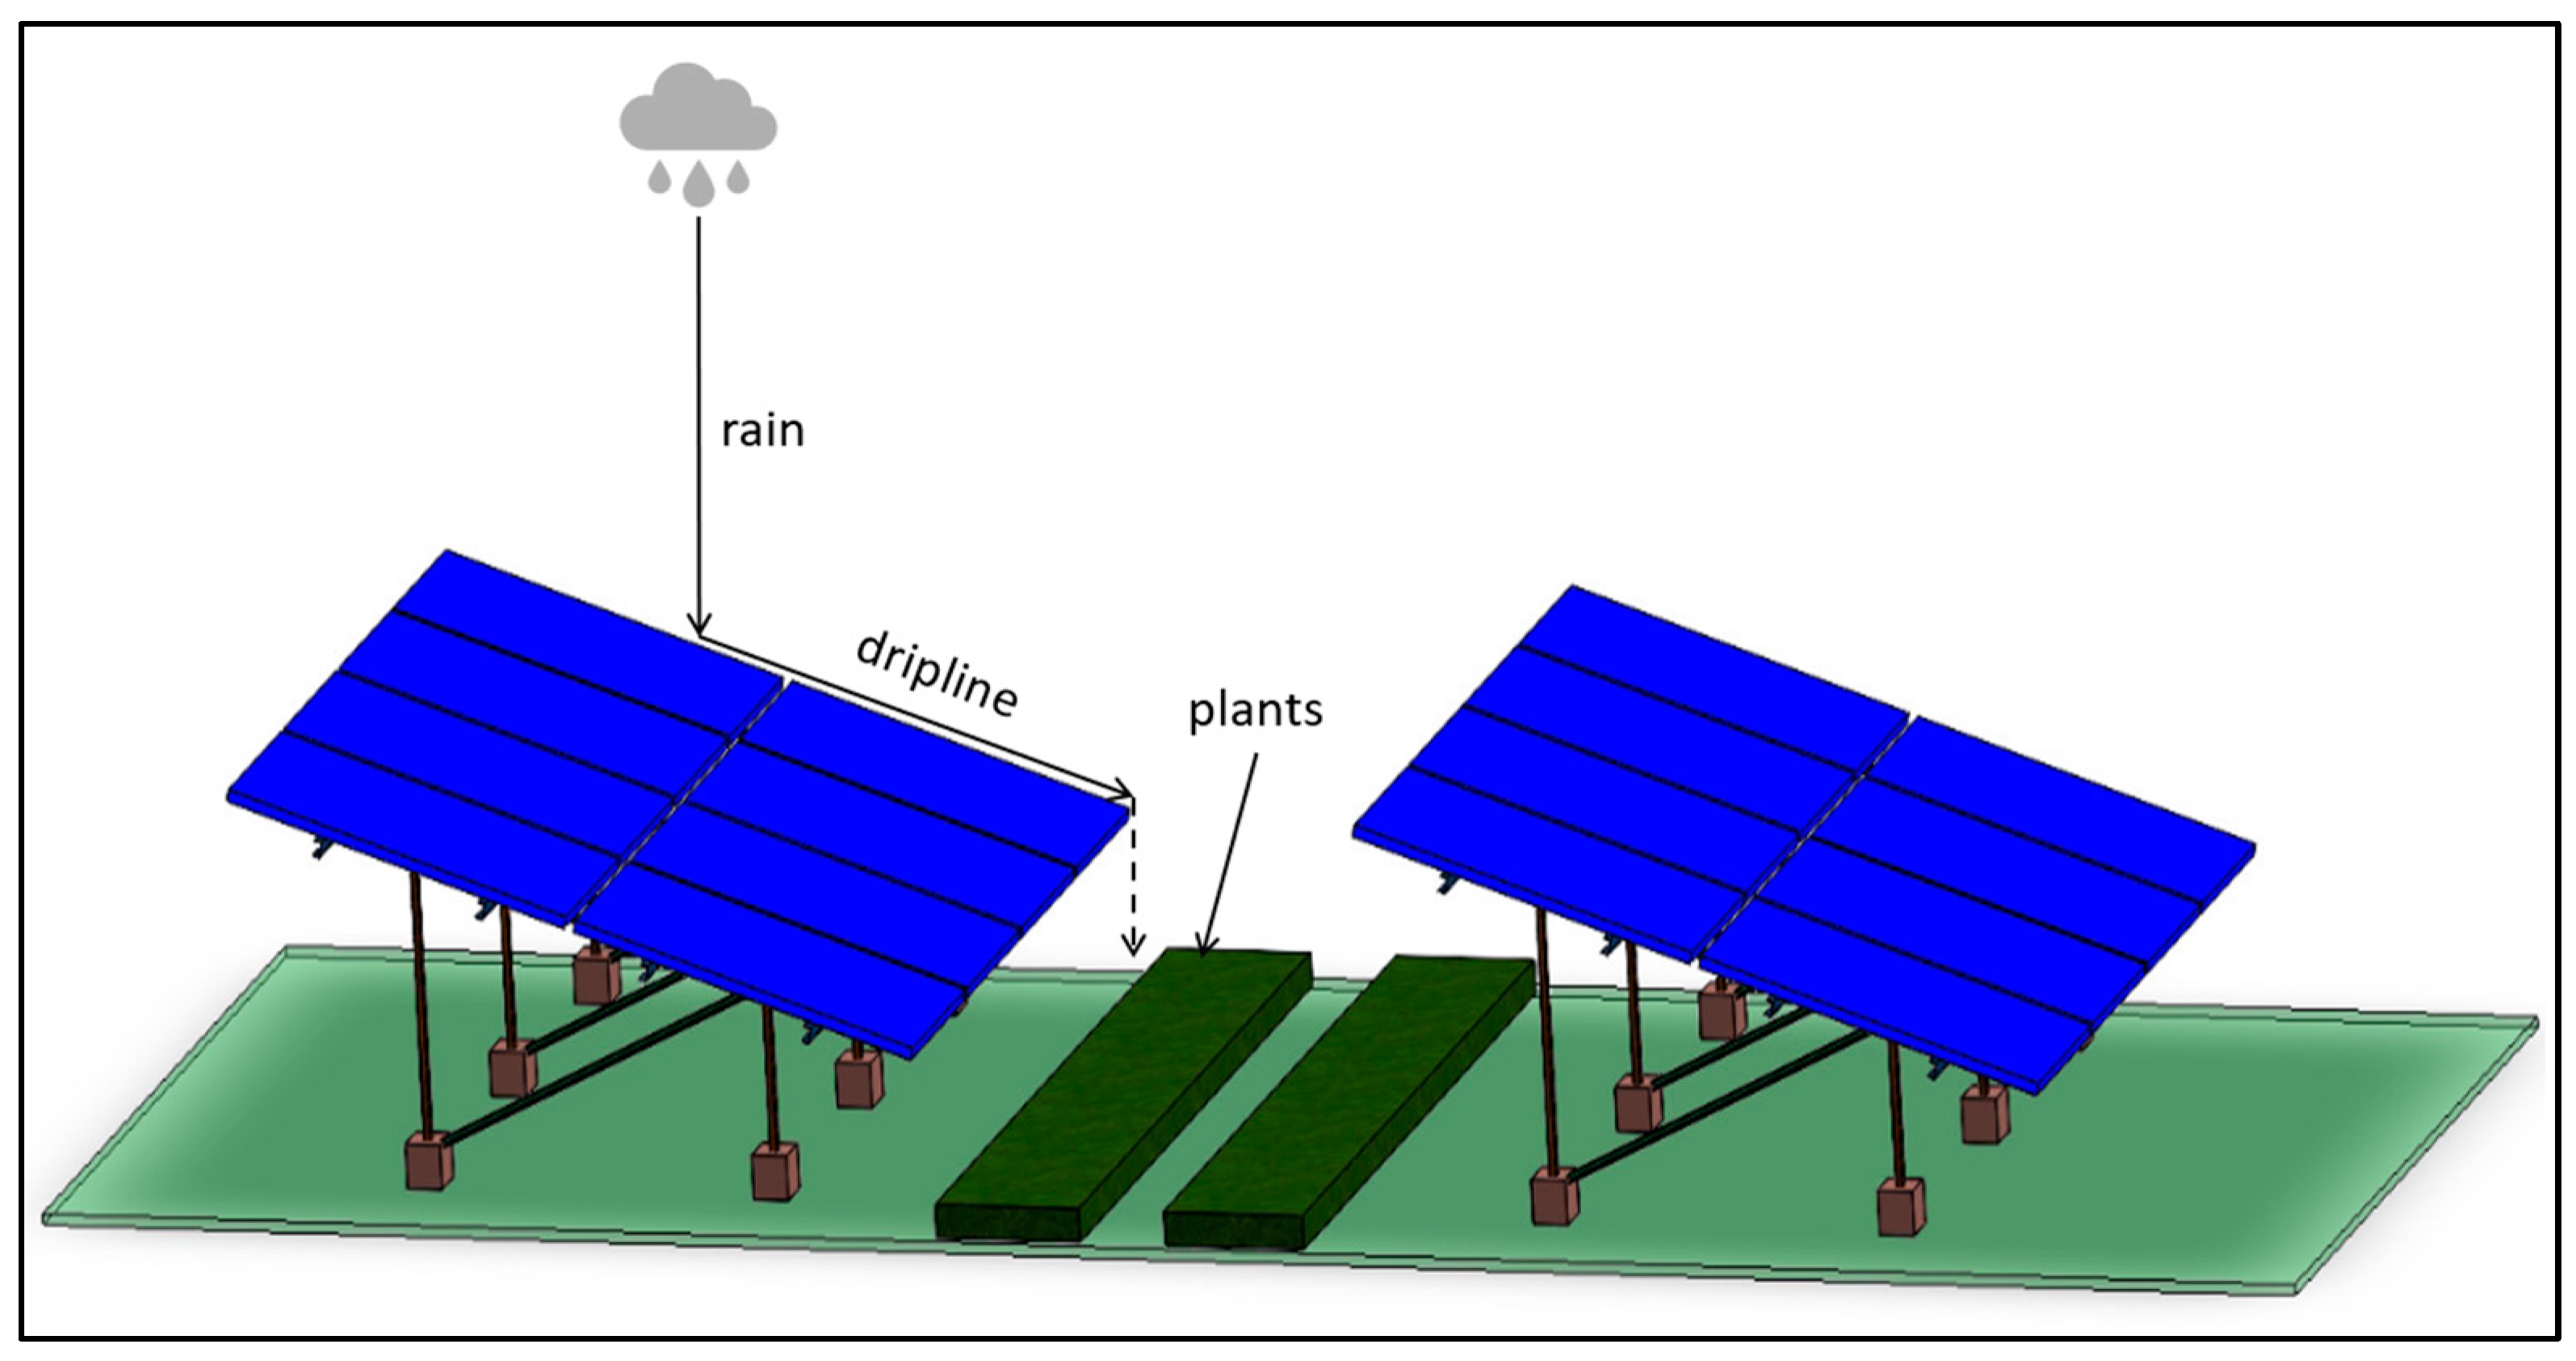
2.1. Water and Soil Management
2.2. Shading on Crops
2.3. Agrivoltaics with Animals
3. Agrivoltaics with Greenhouses
4. Agrivoltaics with Different Applications
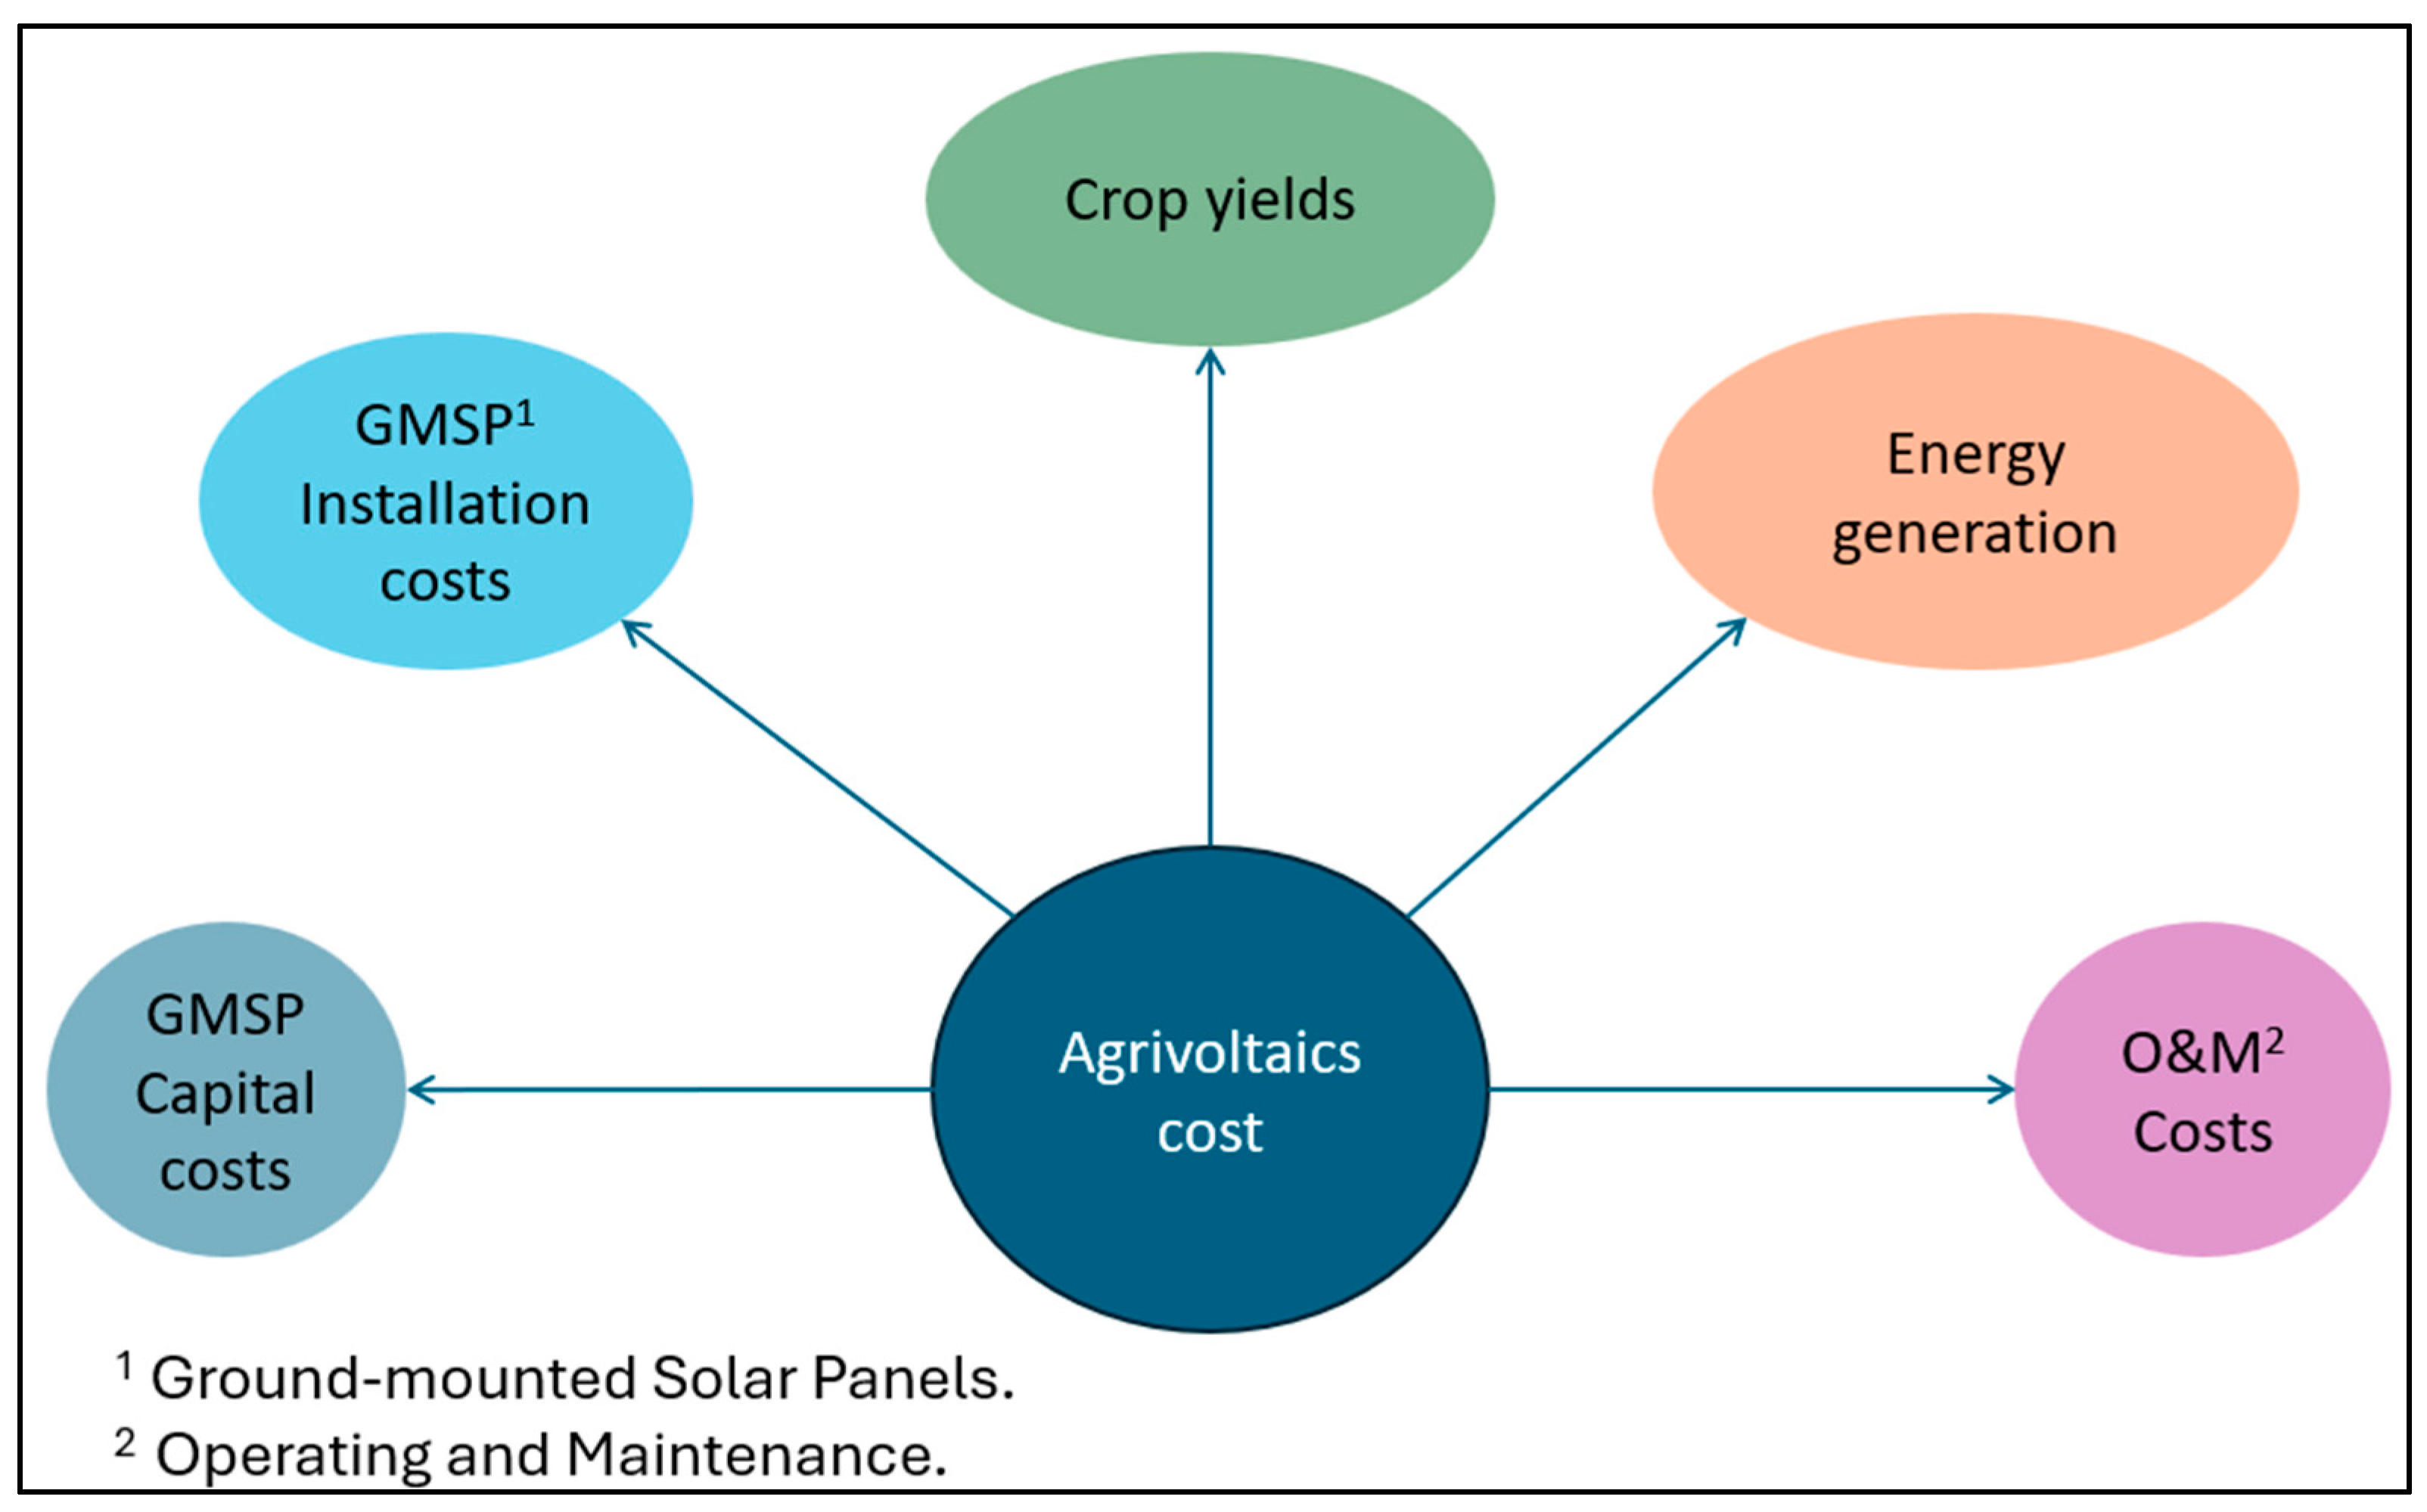
5. Economic Analysis of Agrivoltaics
5.1. Ground-Mounted Solar Panel Capital Costs
5.2. Operating and Maintenance (O&M) Costs
5.3. Crop Yields
5.4. Energy Generation
6. Wind Impact on Agrivoltaics
6.1. Wind Load Design Standards Analysis
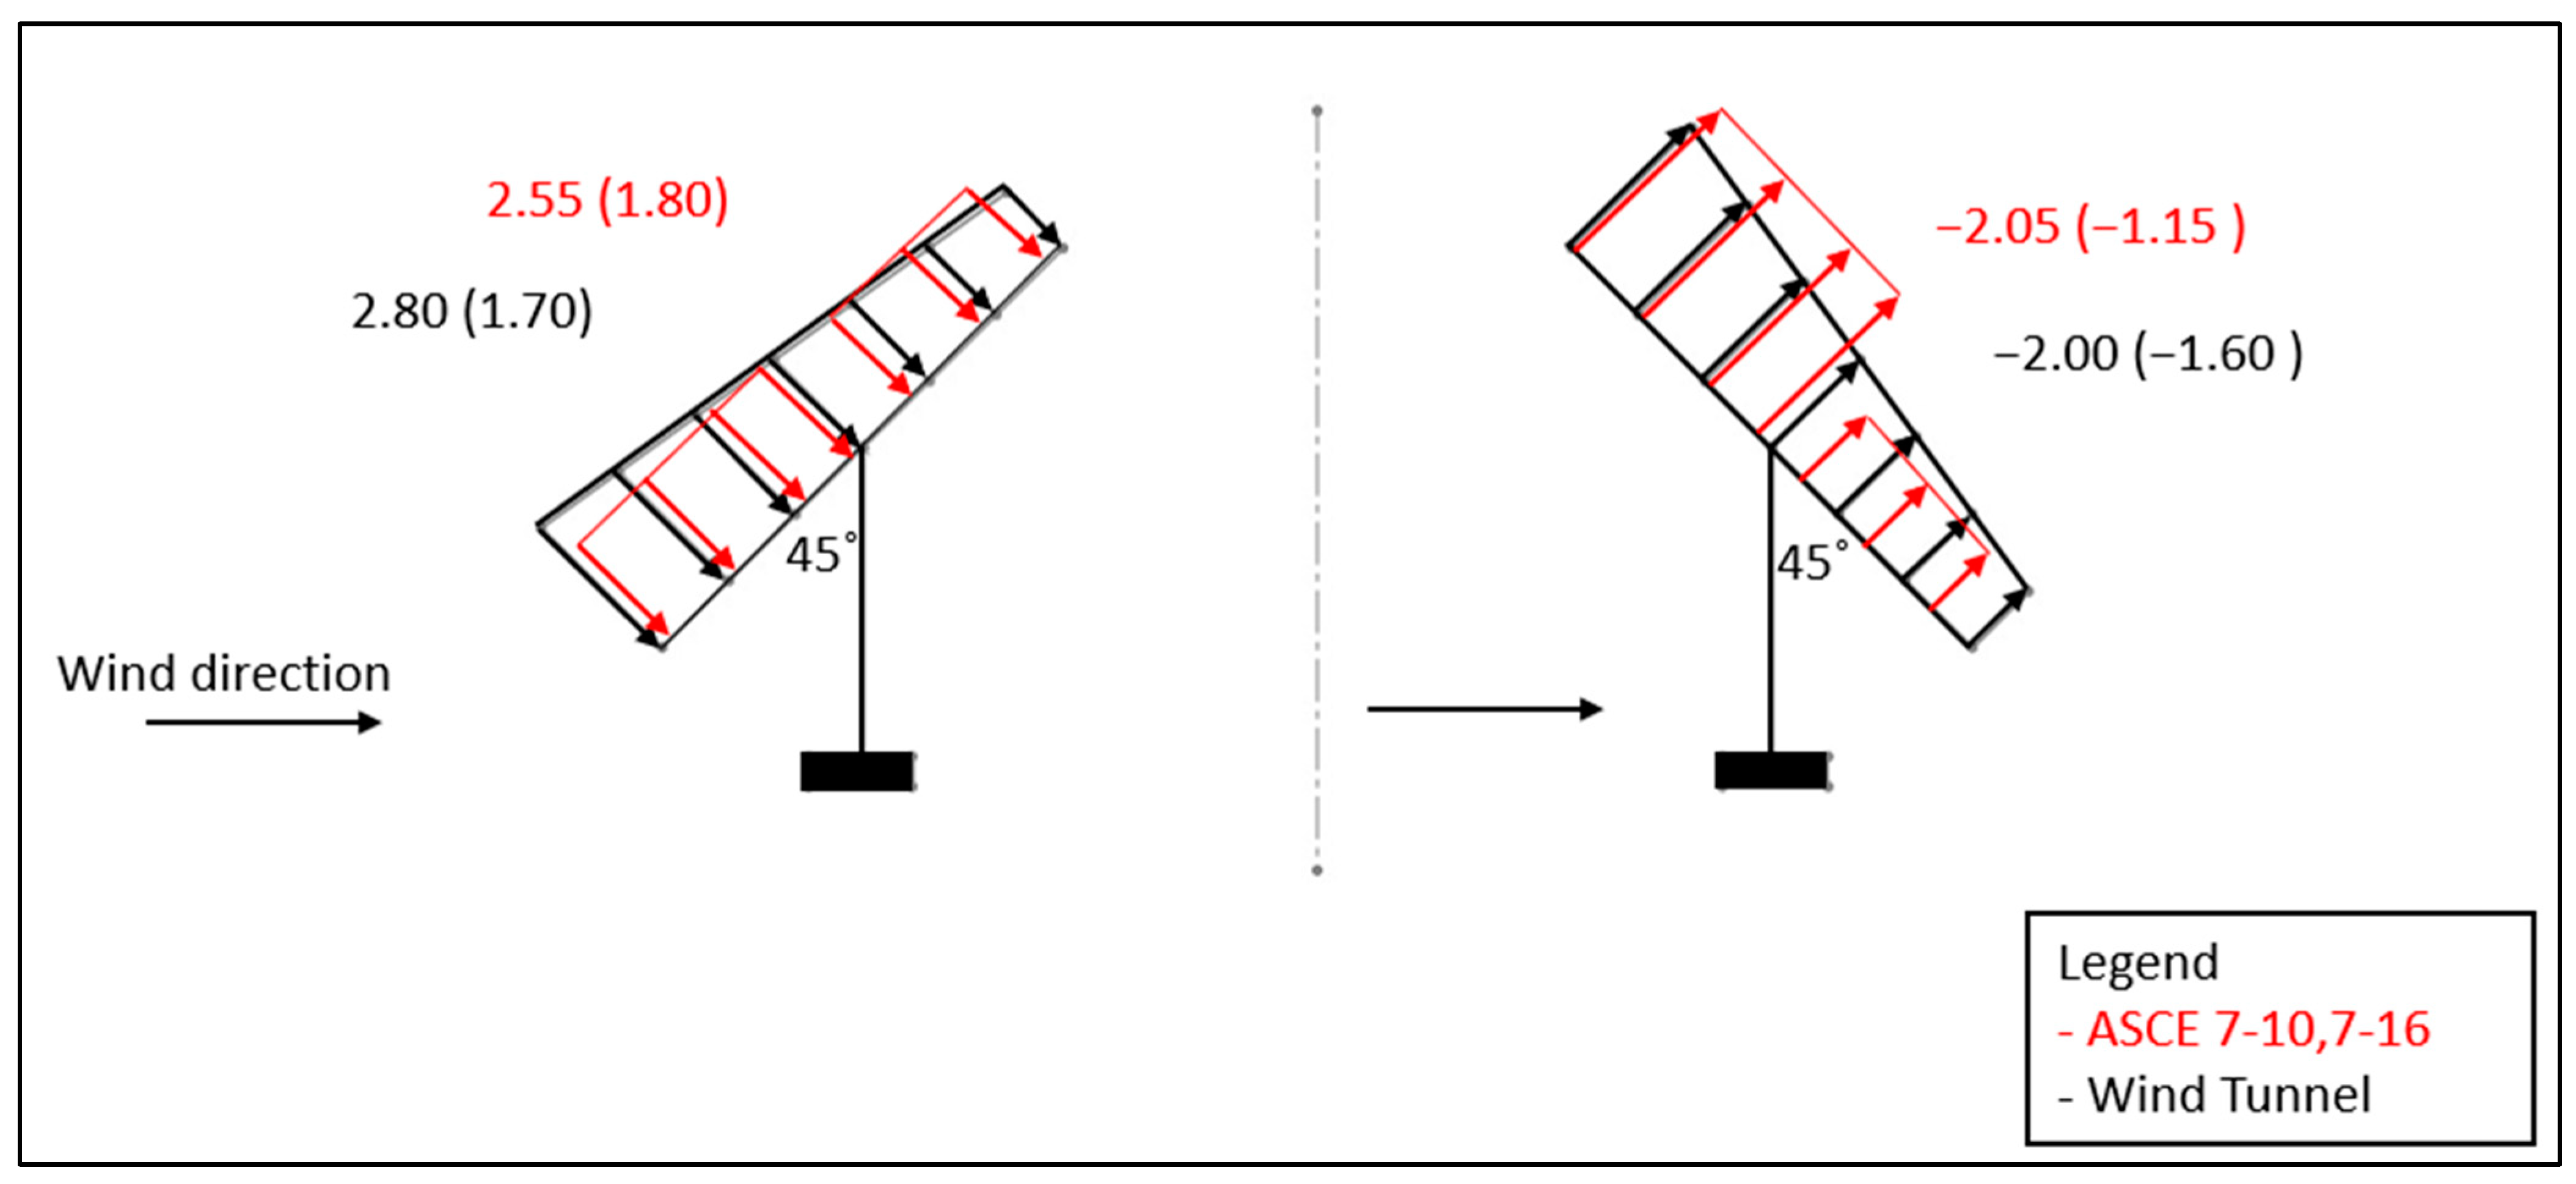
6.2. Example Analysis: A Comparison between ASCE 7-16 Wind Load and Wind Tunnel Test Results
6.3. Computational Fluid Dynamic (CFD) Simulations and Wind Tunnel Testing
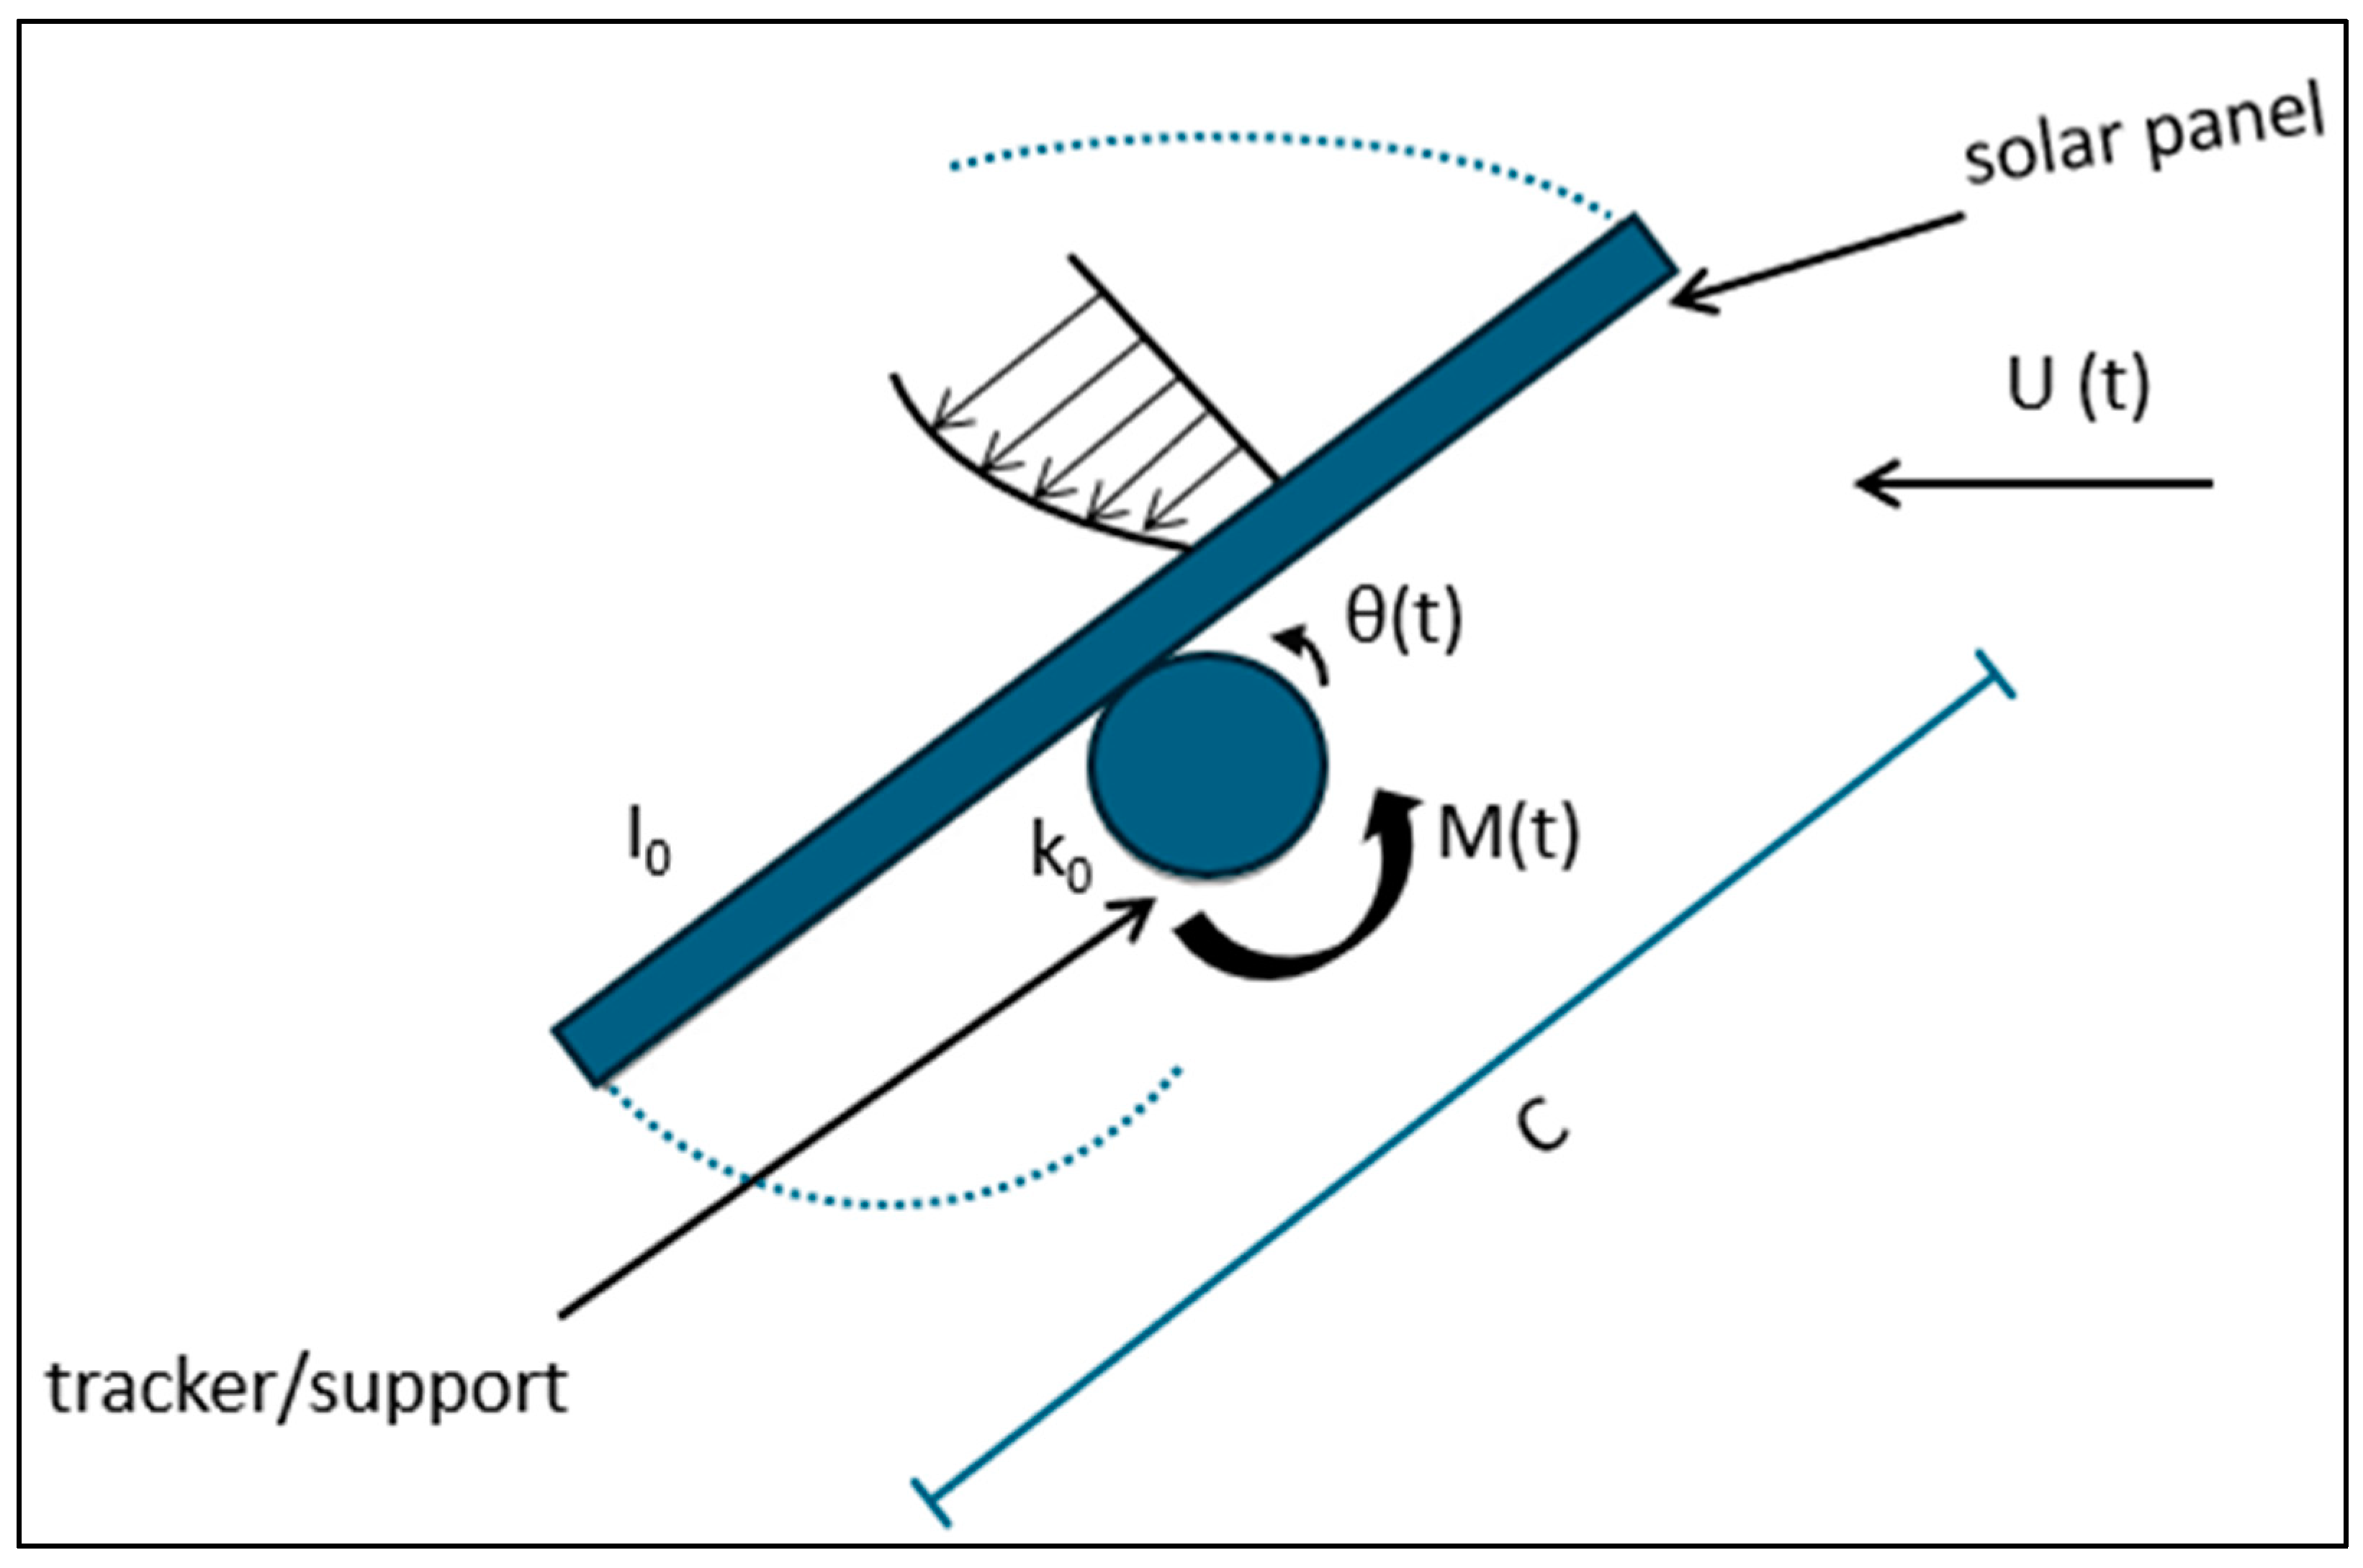
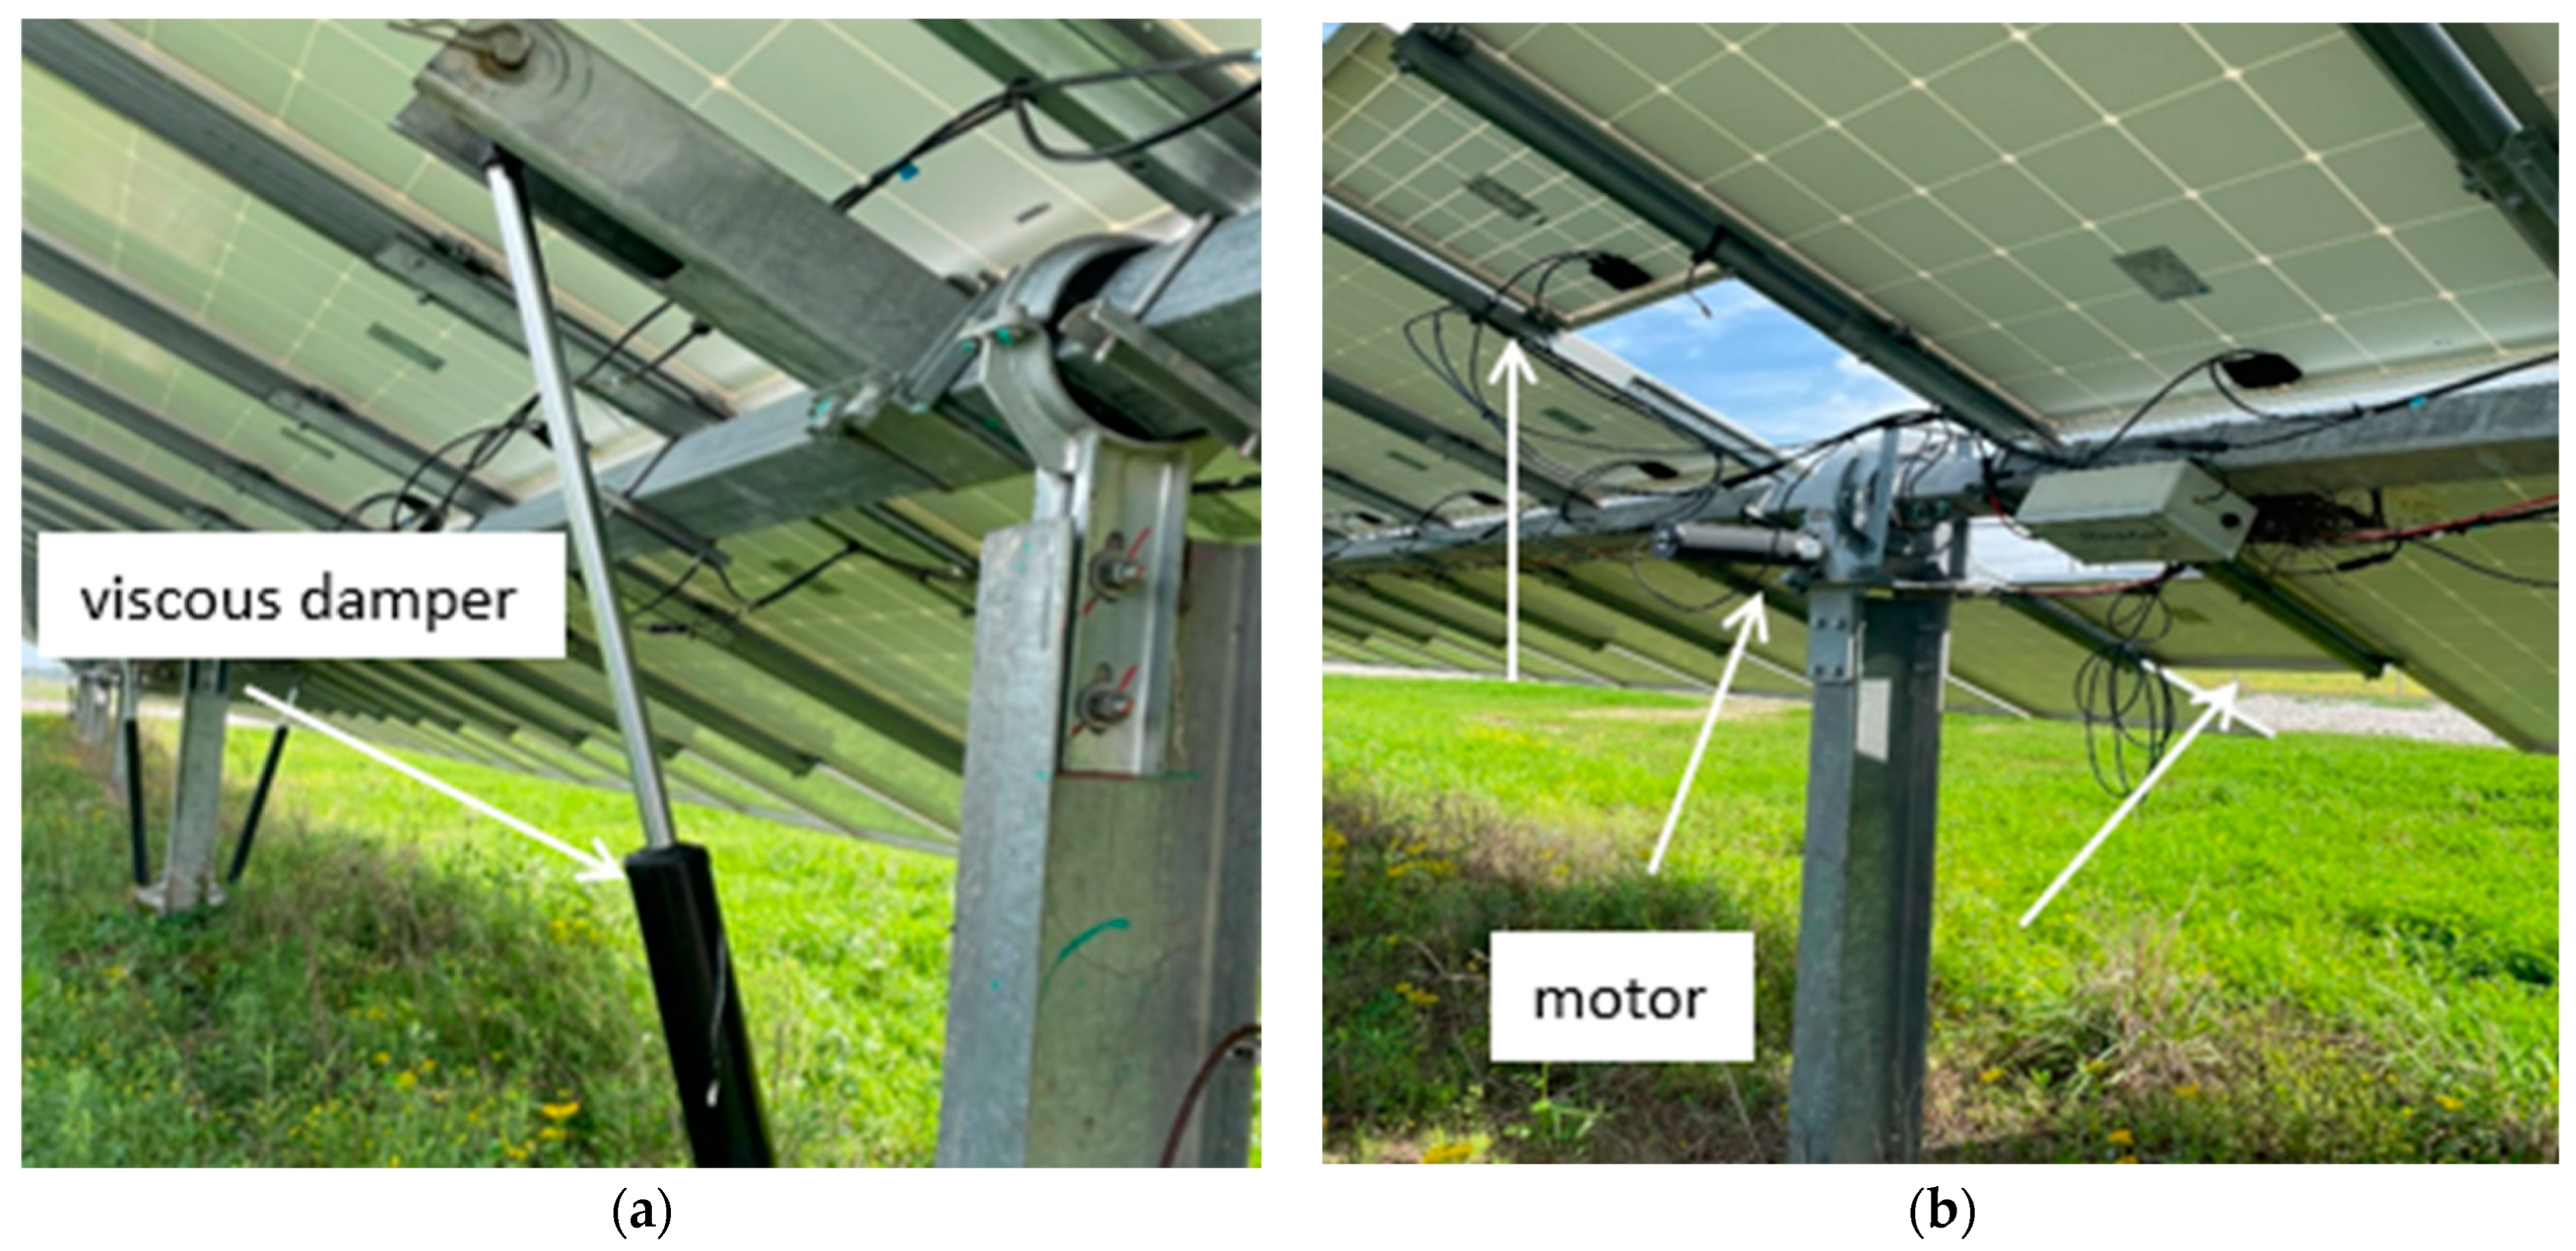
6.4. Dynamic Response of Solar Panel Supports
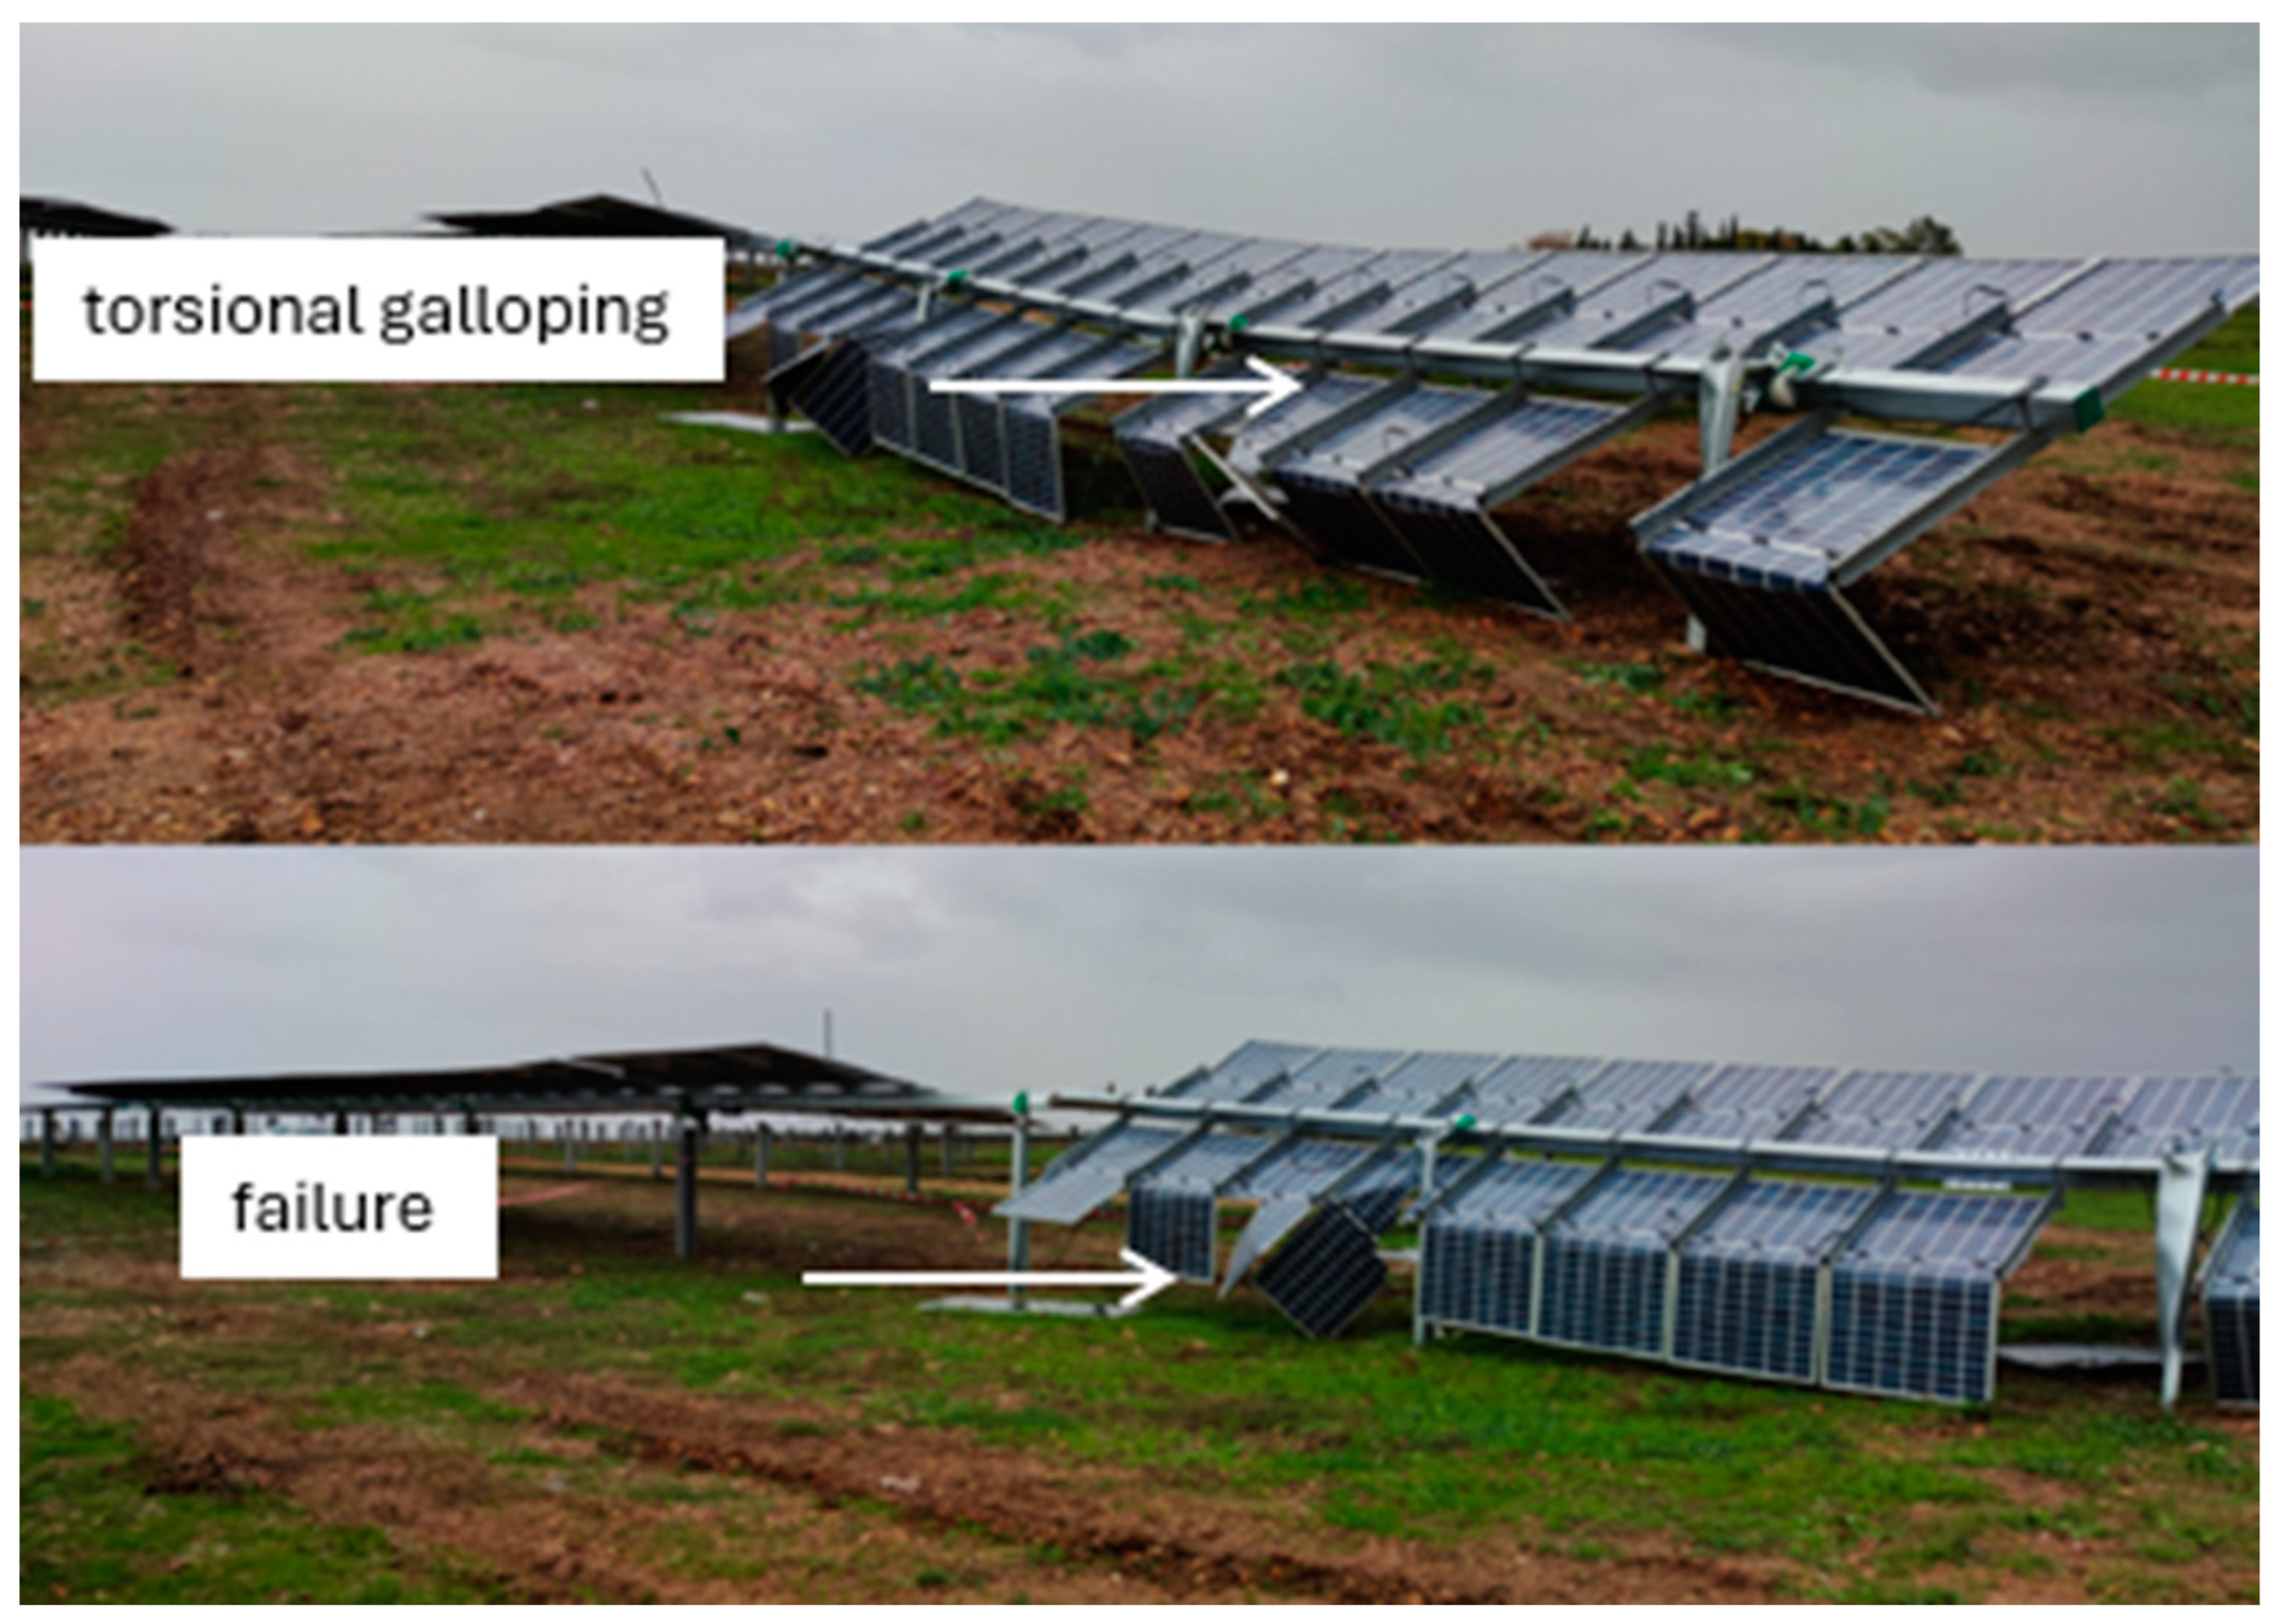
6.4.1. Galloping and Vortex Shedding
6.4.2. Flutter and Fluid–Structure Interaction
7. Factors Affecting Wind Loads
7.1. Increasing Damping and Mass
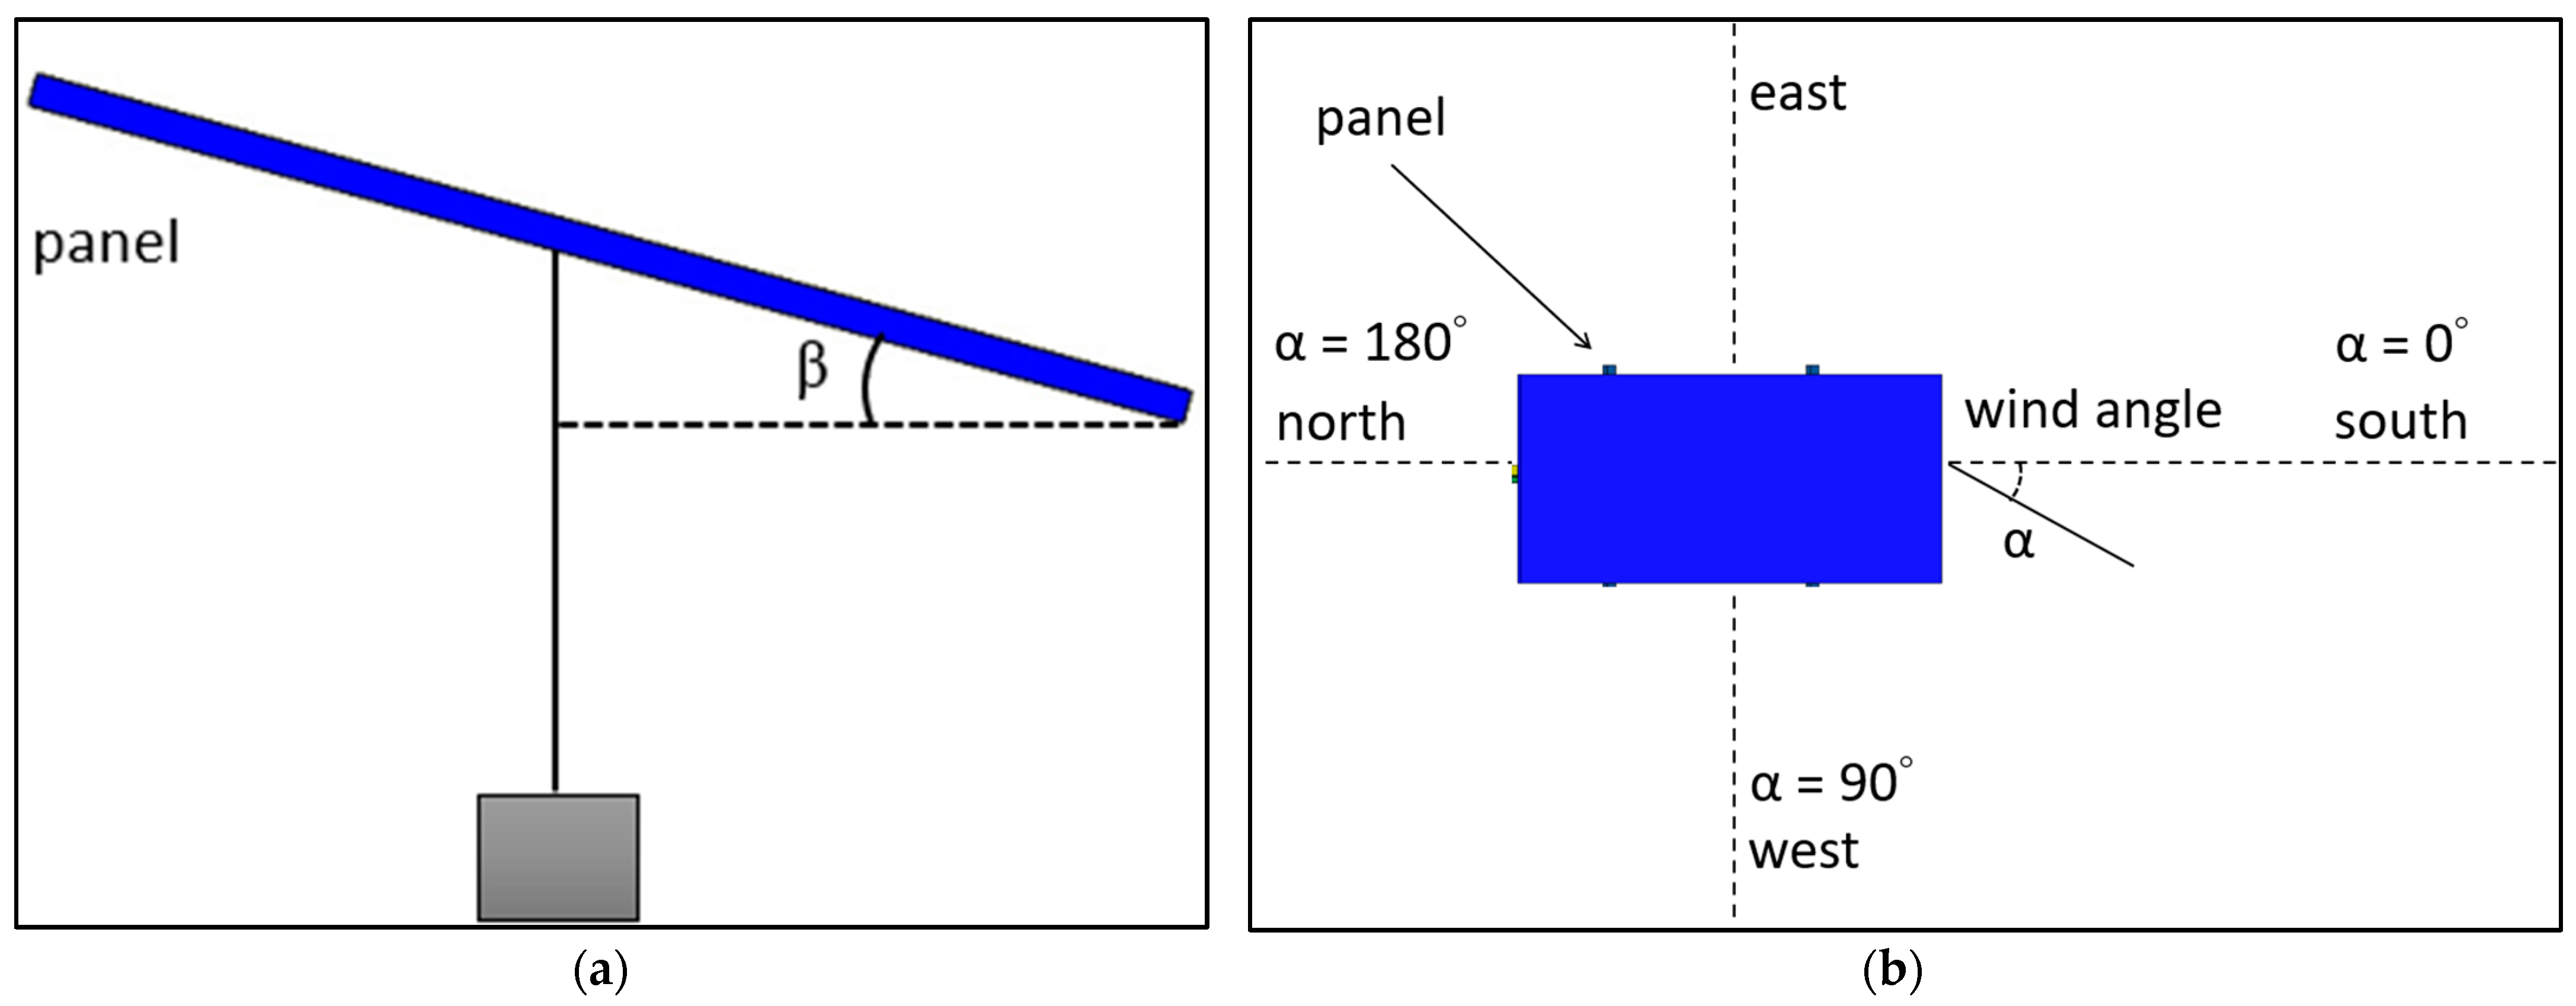
7.2. Wind Direction and Tilt Angles of Solar Panels
7.3. Aerodynamic Edge Modification
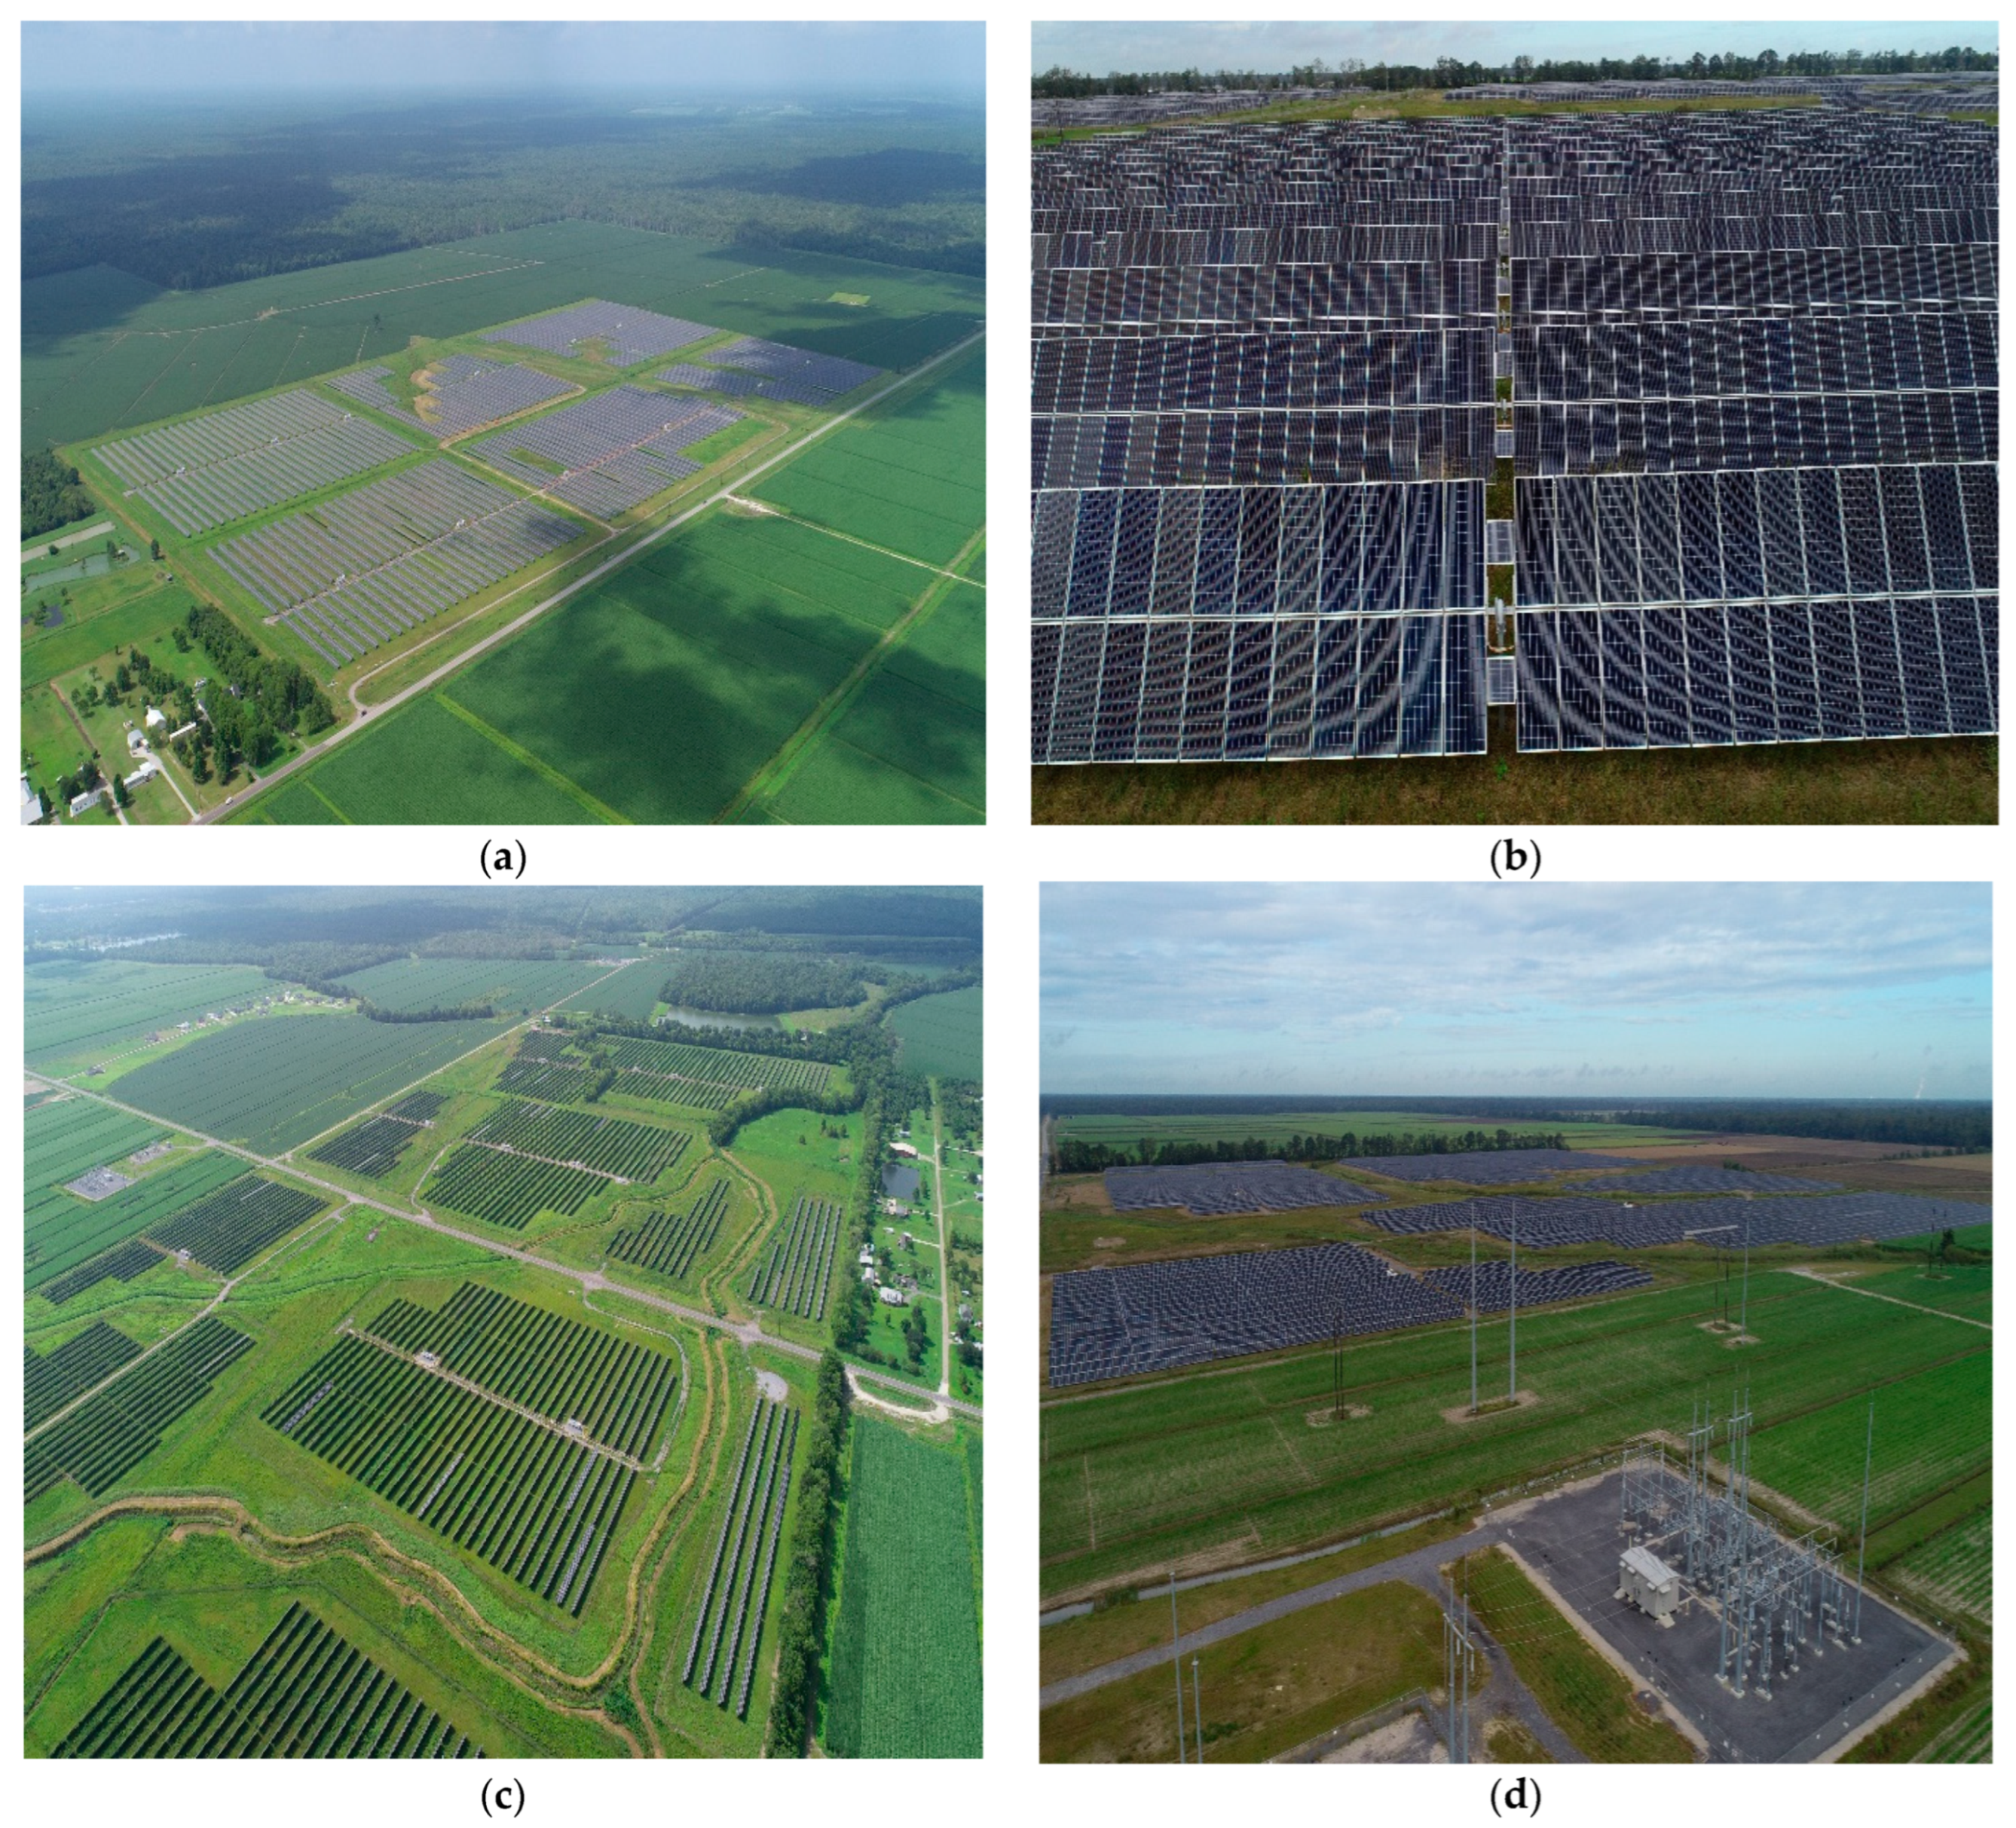
8. Case Study: West Baton Rouge—Port Allen Solar Farm Visit
9. Conclusions
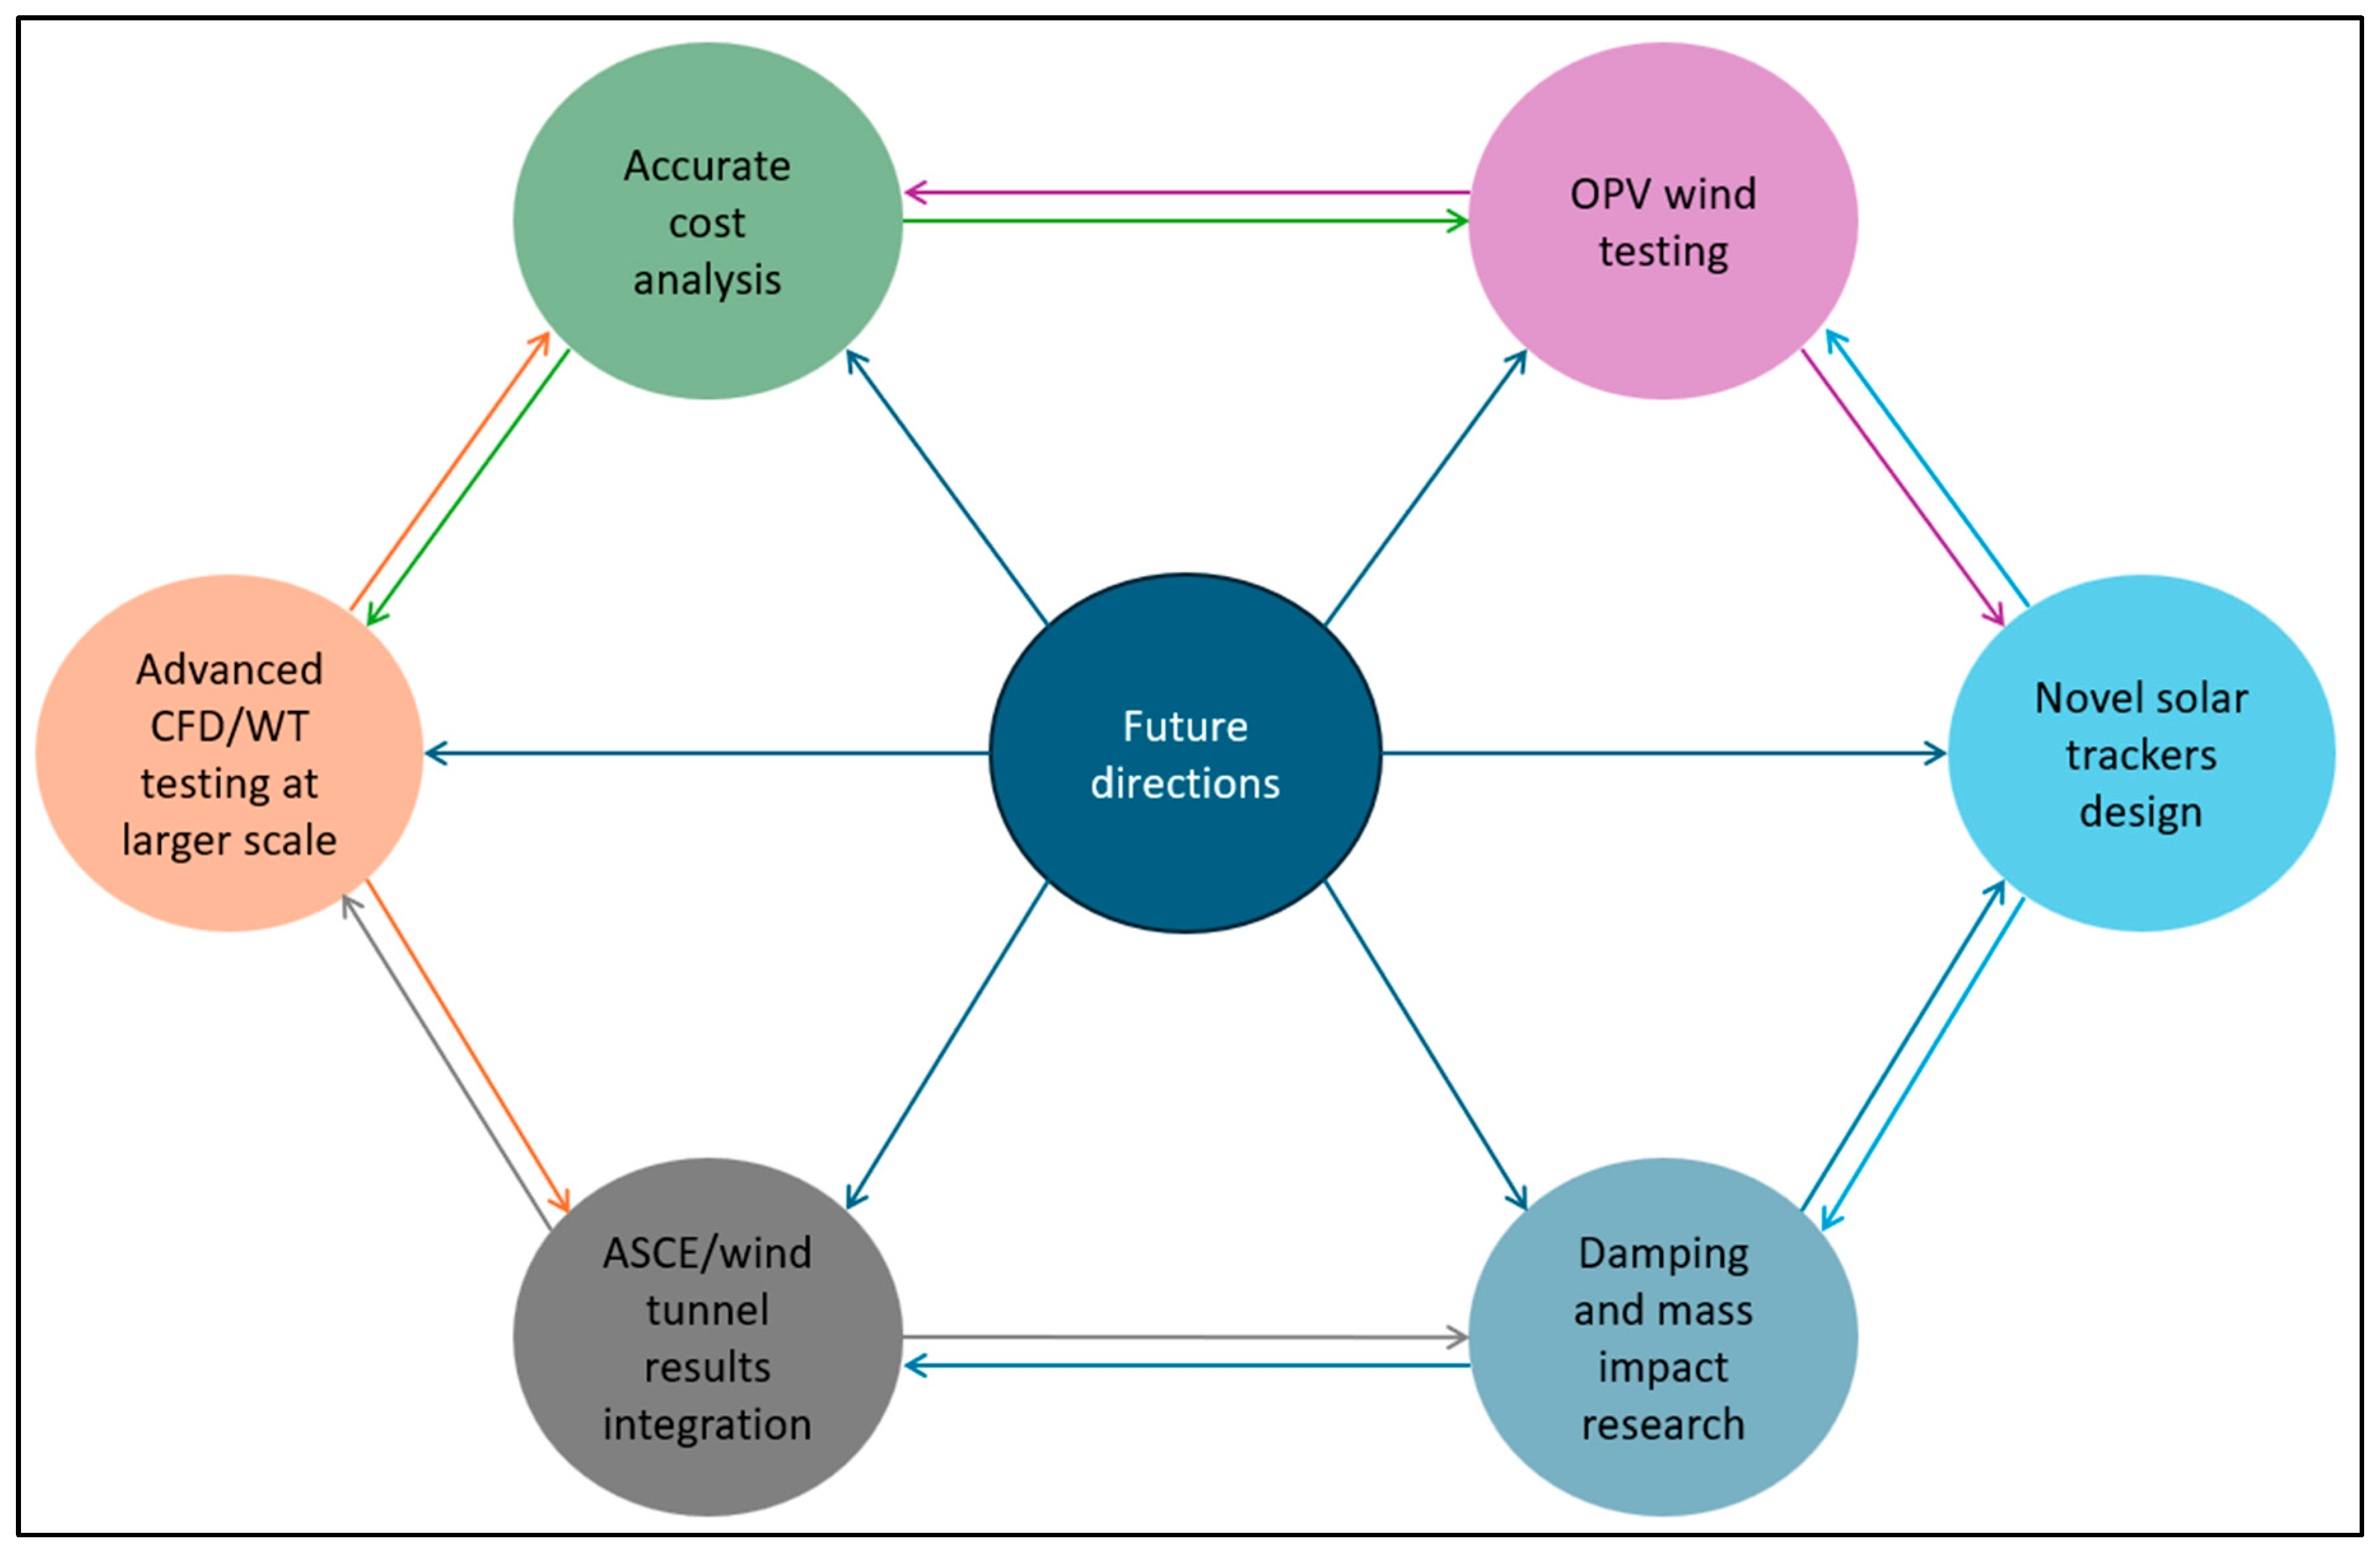
10. Future Directions
- Wind load mitigation methods need to be improved, and more advanced testing must be performed to obtain accurate results regarding the panels in the agrivoltaic systems at larger scales.
- Integrate the wind tunnel test results in the upcoming ASCE versions by specifying a chapter for solar panels in different mounting designs.
- Advanced wind tunnel (WT) testing and CFD simulations are needed on the solar trackers for different phenomena, such as vortex shedding, torsional galloping, and flutter.
- Work and research are required to find the exact cost of energy (COE) in the agrivoltaics lands, considering the amount of electricity provided, energy storage systems (off-grid systems), water consumption, operating and maintenance costs, crop productivity, and land cost. This will help in creating an image of the feasibility of agrivoltaic systems for stakeholders.
- Research might be performed on water consumption and use efficiency to find ways to employ solar panels to create microclimates, such as those found in greenhouses, or to improve irrigation water quality by enhancing runoff from the panels.
- Directing the research for more innovation in transparent or semi-transparent solar panels which could help in shading issues and benefit more in agrivoltaics as they are only used in greenhouses.
- The study of the solar panels on the greenhouse roof contributes to the regulated space inside. The research work should consider the ventilation and thermal management of the solar greenhouse.
- Wind testing is required for the flexible solar panels and OPVs on roofs as they have higher cost and losing them would be costly to replace.
- More work should be performed on the aerodynamic edge modification of the solar panels. New structures would help in safer designs against wind. The modification methods that are performed on the buildings and signboards could inspire solar panel designs.
- Testing the damping and mass for controlling the solar panels and trackers and preventing wind-induced failures.
- Large-scale data collection needs to be performed for solar panels to impact water management, soil, greenhouses, and croplands.
- Perform a cost analysis study on any new materials that would be used in solar panel designs to ensure their viability and reliability.
Author Contributions
Funding
Data Availability Statement
Acknowledgments
Conflicts of Interest
References
- Rahman, M.M.; Khan, I.; Field, D.L.; Techato, K.; Alameh, K. Powering Agriculture: Present Status, Future Potential, and Challenges of Renewable Energy Applications. Renew. Energy 2022, 188, 731–749. [Google Scholar] [CrossRef]
- Yoro, K.O.; Daramola, M.O. CO2 Emission Sources, Greenhouse Gases, and the Global Warming Effect, 8th ed.; Rahimpour, M.R., Faris, M., Makarem, M.A., Eds.; Woodhead Publishing: Cambridge, UK, 2020. [Google Scholar]
- Cruz, R.B. The Politics of Land Use for Distributed Renewable Energy Generation. Urban Aff. Rev. 2018, 54, 524–559. [Google Scholar] [CrossRef]
- Escobar, J.C.; Lora, E.S.; Venturini, O.J.; Yáñez, E.E.; Castillo, E.F.; Almazan, O. Biofuels: Environment, Technology and Food Security. Renew. Sustain. Energy Rev. 2009, 13, 1275–1287. [Google Scholar] [CrossRef]
- Sen, S.; Ganguly, S. Opportunities, Barriers and Issues with Renewable Energy Development—A Discussion. Renew. Sustain. Energy Rev. 2017, 69, 1170–1181. [Google Scholar] [CrossRef]
- Tawalbeh, M.; Al-Othman, A.; Kafiah, F.; Abdelsalam, E.; Almomani, F.; Alkasrawi, M. Environmental Impacts of Solar Photovoltaic Systems: A Critical Review of Recent Progress and Future Outlook. Sci. Total Environ. 2021, 759, 143528. [Google Scholar] [CrossRef]
- Asif, M.; Muneer, T. Energy Supply, Its Demand and Security Issues for Developed and Emerging Economies. Renew. Sustain. Energy Rev. 2007, 11, 1388–1413. [Google Scholar] [CrossRef]
- Goetzberger, A.; Zastrow, A. On the Coexistence of Solar-Energy Conversion and Plant Cultivation. Int. J. Sol. Energy 1982, 1, 55–69. [Google Scholar] [CrossRef]
- Calvert, K.; Mabee, W. More Solar Farms or More Bioenergy Crops? Mapping and Assessing Potential Land-Use Conflicts among Renewable Energy Technologies in Eastern Ontario, Canada. Appl. Geogr. 2015, 56, 209–221. [Google Scholar] [CrossRef]
- Pascaris, A.S.; Schelly, C.; Burnham, L.; Pearce, J.M. Integrating Solar Energy with Agriculture: Industry Perspectives on the Market, Community, and Socio-Political Dimensions of Agrivoltaics. Energy Res. Soc. Sci. 2021, 75, 102023. [Google Scholar] [CrossRef]
- Macknick, J.; Hartmann, H.; Barron-Gafford, G.; Beatty, B.; Burton, R.; Choi, C.S.; Davis, M.; Davis, R.; Figueroa, J.; Garrett, A.; et al. The 5 Cs of Agrivoltaic Success Factors in the United States: Lessons from the InSPIRE Research Study; National Renewable Energy Lab. (NREL): Golden, CO, USA, 2015.
- Cossu, M.; Murgia, L.; Ledda, L.; Deligios, P.A.; Sirigu, A.; Chessa, F.; Pazzona, A. Solar Radiation Distribution inside a Greenhouse with South-Oriented Photovoltaic Roofs and Effects on Crop Productivity. Appl. Energy 2014, 133, 89–100. [Google Scholar] [CrossRef]
- Marucci, A.; Cappuccini, A. Dynamic Photovoltaic Greenhouse: Energy Balance in Completely Clear Sky Condition during the Hot Period. Energy 2016, 102, 302–312. [Google Scholar] [CrossRef]
- Amaducci, S.; Yin, X.; Colauzzi, M. Agrivoltaic Systems to Optimise Land Use for Electric Energy Production. Appl. Energy 2018, 220, 545–561. [Google Scholar] [CrossRef]
- Weselek, A.; Ehmann, A.; Zikeli, S.; Lewandowski, I.; Schindele, S.; Högy, P. Agrophotovoltaic Systems: Applications, Challenges, and Opportunities. A Review. Agron. Sustain. Dev. 2019, 39, 35. [Google Scholar] [CrossRef]
- Emmott, C.J.M.; Röhr, J.A.; Campoy-Quiles, M.; Kirchartz, T.; Urbina, A.; Ekins-Daukes, N.J.; Nelson, J. Organic Photovoltaic Greenhouses: A Unique Application for Semi-Transparent PV? Energy Environ. Sci. 2015, 8, 1317–1328. [Google Scholar] [CrossRef]
- Baker, C.J. Wind Engineering-Past, Present and Future. J. Wind Eng. Ind. Aerodyn. 2007, 95, 843–870. [Google Scholar] [CrossRef]
- Buckley Biggs, N.; Shivaram, R.; Acuña Lacarieri, E.; Varkey, K.; Hagan, D.; Young, H.; Lambin, E.F. Landowner Decisions Regarding Utility-Scale Solar Energy on Working Lands: A Qualitative Case Study in California. Environ. Res. Commun. 2022, 4, 055010. [Google Scholar] [CrossRef]
- Shirley, R.; Kammen, D. Renewable Energy Sector Development in the Caribbean: Current Trends and Lessons from History. Energy Policy 2013, 57, 244–252. [Google Scholar] [CrossRef]
- Charles, H.; Godfray, J.; Beddington, J.R.; Crute, I.R.; Haddad, L.; Lawrence, D.; Muir, J.F.; Pretty, J.; Robinson, S.; Thomas, S.M.; et al. Food Security: The Challenge of Feeding 9 Billion People. Science 2010, 327, 812–818. [Google Scholar]
- Adeh, E.H.; Good, S.P.; Calaf, M.; Higgins, C.W. Solar PV Power Potential Is Greatest Over Croplands. Sci. Rep. 2019, 9, 1–6. [Google Scholar] [CrossRef]
- Tilman, D.; Balzer, C.; Hill, J.; Befort, B.L. Global Food Demand and the Sustainable Intensification of Agriculture. Proc. Natl. Acad. Sci. USA 2011, 108, 20260–20264. [Google Scholar] [CrossRef]
- Batra, G. Renewable Energy Economics: Achieving Harmony between Environmental Protection and Economic Goals. Soc. Sci. Chron. 2023, 2, 1–32. [Google Scholar] [CrossRef]
- Wagner, M.; Lask, J.; Kiesel, A.; Lewandowski, I.; Weselek, A.; Högy, P.; Trommsdorff, M.; Schnaiker, M.A.; Bauerle, A. Agrivoltaics: The Environmental Impacts of Combining Food Crop Cultivation and Solar Energy Generation. Agronomy 2023, 13, 299. [Google Scholar] [CrossRef]
- Agostini, A.; Colauzzi, M.; Amaducci, S. Innovative Agrivoltaic Systems to Produce Sustainable Energy: An Economic and Environmental Assessment. Appl. Energy 2021, 281, 116102. [Google Scholar] [CrossRef]
- Willockx, B.; Lavaret, C.; Cappelle, J. Performance Evaluation of Vertical Bifacial and Single-Axis Tracked Agrivoltaic Systems on Arable Land. Renew. Energy 2023, 217, 119181. [Google Scholar] [CrossRef]
- Oikonomou, K.; Parvania, M. Optimal Coordinated Operation of Interdependent Power and Water Distribution Systems. IEEE Trans. Smart Grid 2020, 11, 4784–4794. [Google Scholar] [CrossRef]
- Fthenakis, V.; Kim, H.C. Life-Cycle Uses of Water in U.S. Electricity Generation. Renew. Sustain. Energy Rev. 2010, 14, 2039–2048. [Google Scholar] [CrossRef]
- Aman, M.M.; Solangi, K.H.; Hossain, M.S.; Badarudin, A.; Jasmon, G.B.; Mokhlis, H.; Bakar, A.H.A.; Kazi, S.N. A Review of Safety, Health and Environmental (SHE) Issues of Solar Energy System. Renew. Sustain. Energy Rev. 2015, 41, 1190–1204. [Google Scholar] [CrossRef]
- Yavari, R.; Zaliwciw, D.; Cibin, R.; McPhillips, L. Minimizing Environmental Impacts of Solar Farms: A Review of Current Science on Landscape Hydrology and Guidance on Stormwater Management. Environ. Res. Infrastruct. Sustain. 2022, 2, 032002. [Google Scholar] [CrossRef]
- Marrou, H.; Wéry, J.; Dufour, L.; Dupraz, C.; Marrou, H.; Wery, J.; Dufour, L.; Dupraz, C. Productivity and Radiation Use Efficiency of Lettuces Grown in the Partial Shade of Photovoltaic Panels. Eur. J. Agron. 2013, 44, 54–66. [Google Scholar] [CrossRef]
- Touil, S.; Richa, A.; Fizir, M.; Bingwa, B. Shading Effect of Photovoltaic Panels on Horticulture Crops Production: A Mini Review. Rev. Environ. Sci. Biotechnol. 2021, 20, 281–296. [Google Scholar] [CrossRef]
- Elamri, Y.; Cheviron, B.; Lopez, J.M.; Dejean, C.; Belaud, G. Water Budget and Crop Modelling for Agrivoltaic Systems: Application to Irrigated Lettuces. Agric. Water Manag. 2018, 208, 440–453. [Google Scholar] [CrossRef]
- Barron-Gafford, G.A.; Pavao-Zuckerman, M.A.; Minor, R.L.; Sutter, L.F.; Barnett-Moreno, I.; Blackett, D.T.; Thompson, M.; Dimond, K.; Gerlak, A.K.; Nabhan, G.P.; et al. Agrivoltaics Provide Mutual Benefits across the Food–Energy–Water Nexus in Drylands. Nat. Sustain. 2019, 2, 848–855. [Google Scholar] [CrossRef]
- Dupraz, C.; Marrou, H.; Talbot, G.; Dufour, L.; Nogier, A.; Ferard, Y. Combining Solar Photovoltaic Panels and Food Crops for Optimising Land Use: Towards New Agrivoltaic Schemes. Renew. Energy 2011, 36, 2725–2732. [Google Scholar] [CrossRef]
- Chae, S.H.; Kim, H.J.; Moon, H.W.; Kim, Y.H.; Ku, K.M. Agrivoltaic Systems Enhance Farmers’ Profits through Broccoli Visual Quality and Electricity Production without Dramatic Changes in Yield, Antioxidant Capacity, and Glucosinolates. Agronomy 2022, 12, 1415. [Google Scholar] [CrossRef]
- Valle, B.; Simonneau, T.; Sourd, F.; Pechier, P.; Hamard, P.; Frisson, T.; Ryckewaert, M.; Christophe, A. Increasing the Total Productivity of a Land by Combining Mobile Photovoltaic Panels and Food Crops. Appl. Energy 2017, 206, 1495–1507. [Google Scholar] [CrossRef]
- Dinesh, H.; Pearce, J.M. The Potential of Agrivoltaic Systems. Renew. Sustain. Energy Rev. 2016, 54, 299–308. [Google Scholar] [CrossRef]
- Ali Khan Niazi, K.; Victoria, M. Comparative Analysis of Photovoltaic Configurations for Agrivoltaic Systems in Europe. Prog. Photovolt. Res. Appl. 2023, 31, 1101–1113. [Google Scholar] [CrossRef]
- Majumdar, D.; Pasqualetti, M.J. Dual Use of Agricultural Land: Introducing ‘Agrivoltaics’ in Phoenix Metropolitan Statistical Area, USA. Landsc. Urban. Plan. 2018, 170, 150–168. [Google Scholar] [CrossRef]
- Masson, V.; Bonhomme, M.; Salagnac, J.L.; Briottet, X.; Lemonsu, A. Solar Panels Reduce Both Global Warming and Urban Heat Island. Front. Environ. Sci. 2014, 2, 14. [Google Scholar] [CrossRef]
- Zheng, Y.; Weng, Q. Modeling the Effect of Green Roof Systems and Photovoltaic Panels for Building Energy Savings to Mitigate Climate Change. Remote Sens. 2020, 12, 2402. [Google Scholar] [CrossRef]
- Ferrara, G.; Boselli, M.; Palasciano, M.; Mazzeo, A. Effect of Shading Determined by Photovoltaic Panels Installed above the Vines on the Performance of Cv. Corvina (Vitis vinifera L.). Sci. Hortic. 2023, 308, 111595. [Google Scholar] [CrossRef]
- Zhao, Y.; Qiao, J.; Feng, Y.; Wang, B.; Duan, W.; Zhou, H.; Wang, W.; Cui, L.; Yang, C. The Optimal Size of a Paulownia-Crop Agroforestry System for Maximal Economic Return in North China Plain. Agric. Meteorol. 2019, 269–270, 1–9. [Google Scholar] [CrossRef]
- Widmer, J.; Christ, B.; Grenz, J.; Norgrove, L. Agrivoltaics, a Promising New Tool for Electricity and Food Production: A Systematic Review. Renew. Sustain. Energy Rev. 2024, 192, 114277. [Google Scholar] [CrossRef]
- Thompson, E.P.; Bombelli, E.L.; Shubham, S.; Watson, H.; Everard, A.; D’Ardes, V.; Schievano, A.; Bocchi, S.; Zand, N.; Howe, C.J.; et al. Tinted Semi-Transparent Solar Panels Allow Concurrent Production of Crops and Electricity on the Same Cropland. Adv. Energy Mater. 2020, 10, 2001189. [Google Scholar] [CrossRef]
- Song, W.; Ge, J.; Xie, L.; Chen, Z.; Ye, Q.; Sun, D.; Shi, J.; Tong, X.; Zhang, X.; Ge, Z. Semi-Transparent Organic Photovoltaics for Agrivoltaic Applications. Nano Energy 2023, 116, 108805. [Google Scholar] [CrossRef]
- Pérez-Alonso, J.; Pérez-García, M.; Pasamontes-Romera, M.; Callejón-Ferre, A.J. Performance Analysis and Neural Modelling of a Greenhouse Integrated Photovoltaic System. Renew. Sustain. Energy Rev. 2012, 16, 4675–4685. [Google Scholar] [CrossRef]
- Hassanien, R.H.E.; Li, M.; Yin, F. The Integration of Semi-Transparent Photovoltaics on Greenhouse Roof for Energy and Plant Production. Renew. Energy 2018, 121, 377–388. [Google Scholar] [CrossRef]
- Yuan, J.; Zhang, Y.; Zhou, L.; Zhang, G.; Yip, H.L.; Lau, T.K.; Lu, X.; Zhu, C.; Peng, H.; Johnson, P.A.; et al. Single-Junction Organic Solar Cell with over 15% Efficiency Using Fused-Ring Acceptor with Electron-Deficient Core. Joule 2019, 3, 1140–1151. [Google Scholar] [CrossRef]
- Trommsdorff, M.; Dhal, I.S.; Özdemir, Ö.E.; Ketzer, D.; Weinberger, N.; Rösch, C. Agrivoltaics: Solar Power Generation and Food Production; Elsevier: Amsterdam, The Netherlands, 2022; pp. 159–210. [Google Scholar]
- Casares de la Torre, F.J.; Varo-Martinez, M.; López-Luque, R.; Ramírez-Faz, J.; Fernández-Ahumada, L.M. Design and Analysis of a Tracking / Backtracking Strategy for PV Plants with Horizontal Trackers after Their Conversion to Agrivoltaic Plants. Renew. Energy 2022, 187, 537–550. [Google Scholar] [CrossRef]
- Sarr, A.; Soro, Y.M.; Tossa, A.K.; Diop, L. Agrivoltaic, a Synergistic Co-Location of Agricultural and Energy Production in Perpetual Mutation: A Comprehensive Review. Processes 2023, 11, 948. [Google Scholar] [CrossRef]
- Williams, H.J.; Hashad, K.; Wang, H.; Max Zhang, K. The Potential for Agrivoltaics to Enhance Solar Farm Cooling. Appl. Energy 2023, 332, 120478. [Google Scholar] [CrossRef]
- Guarino, J.; Swanson, T. Emerging Agrivoltaic Regulatory Systems: A Review of Solar Grazing’. Chic.-Kent J. Environ. Energy Law 2022, 12, 1–30. [Google Scholar]
- Andrew, A.C.; Higgins, C.W.; Bionaz, M.; Smallman, M.A.; Ates, S. Pasture Production and Lamb Growth in Agrivoltaic System. In Proceedings of the AIP Conference Proceedings, Perpignan, France, 14–16 October 2020; American Institute of Physics Inc.: College Park, ML, USA, 2021; Volume 2361. [Google Scholar]
- Maia, A.S.C.; Culhari, E.d.A.; Fonsêca, V.d.F.C.; Milan, H.F.M.; Gebremedhin, K.G. Photovoltaic Panels as Shading Resources for Livestock. J. Clean. Prod. 2020, 258, 120551. [Google Scholar] [CrossRef]
- Lytle, W.; Meyer, T.K.; Tanikella, N.G.; Burnham, L.; Engel, J.; Schelly, C.; Pearce, J.M. Conceptual Design and Rationale for a New Agrivoltaics Concept: Pasture-Raised Rabbits and Solar Farming. J. Clean. Prod. 2021, 282, 124476. [Google Scholar] [CrossRef]
- Panwar, N.L.; Kaushik, S.C.; Kothari, S. Solar Greenhouse an Option for Renewable and Sustainable Farming. Renew. Sustain. Energy Rev. 2011, 15, 3934–3945. [Google Scholar] [CrossRef]
- Wang, T.; Wu, G.; Chen, J.; Cui, P.; Chen, Z.; Yan, Y.; Zhang, Y.; Li, M.; Niu, D.; Li, B.; et al. Integration of Solar Technology to Modern Greenhouse in China: Current Status, Challenges and Prospect. Renew. Sustain. Energy Rev. 2017, 70, 1178–1188. [Google Scholar] [CrossRef]
- Gorjian, S.; Bousi, E.; Özdemir, Ö.E.; Trommsdorff, M.; Kumar, N.M.; Anand, A.; Kant, K.; Chopra, S.S. Progress and Challenges of Crop Production and Electricity Generation in Agrivoltaic Systems Using Semi-Transparent Photovoltaic Technology. Renew. Sustain. Energy Rev. 2022, 158, 112126. [Google Scholar] [CrossRef]
- Hollingsworth, J.A.; Ravishankar, E.; O’Connor, B.; Johnson, J.X.; DeCarolis, J.F. Environmental and Economic Impacts of Solar-Powered Integrated Greenhouses. J. Ind. Ecol. 2020, 24, 234–247. [Google Scholar] [CrossRef]
- Torrente, C.J.; Reca, J.; López-Luque, R.; Martínez, J.; Casares, F.J. Simulation Model to Analyze the Spatial Distribution of Solar Radiation in Agrivoltaic Mediterranean Greenhouses and Its Effect on Crop Water Needs. Appl. Energy 2024, 353, 122050. [Google Scholar] [CrossRef]
- Carreño-Ortega, A.; Galdeano-Gómez, E.; Pérez-Mesa, J.C.; Galera-Quiles, M.D.C. Policy and Environmental Implications of Photovoltaic Systems in Farming in Southeast Spain: Can Greenhouses Reduce the Greenhouse Effect? Energies 2017, 10, 761. [Google Scholar] [CrossRef]
- Ureña-Sánchez, R.; Callejón-Ferre, Á.J.; Pérez-Alonso, J.; Carreño-Ortega, Á. Greenhouse Tomato Production with Electricity Generation by Roof-Mounted Flexible Solar Panels. Sci Agric 2012, 69, 233–239. [Google Scholar] [CrossRef]
- Esmaeli, H.; Roshandel, R. Optimal Design for Solar Greenhouses Based on Climate Conditions. Renew. Energy 2020, 145, 1255–1265. [Google Scholar] [CrossRef]
- Bai, X.; Gao, J.; Wang, S.; Cai, H.; Chen, Z.; Zhou, J. Excessive Nutrient Balance Surpluses in Newly Built Solar Greenhouses over Five Years Leads to High Nutrient Accumulations in Soil. Agric. Ecosyst. Environ. 2020, 288, 106717. [Google Scholar] [CrossRef]
- Tereci, A.; Atmaca, M. Integrating Renewable Energy Systems into Urban Furniture for Recreational Spaces: A Design Proposal for Konya Adalet Park. Gazi Univ. J. Sci. 2020, 33, 1–12. [Google Scholar] [CrossRef]
- Sattler, S.; Zluwa, I.; Österreicher, D. The “PV Rooftop Garden”: Providing Recreational Green Roofs and Renewable Energy as a Multifunctional System within One Surface Area. Appl. Sci. 2020, 10, 1791. [Google Scholar] [CrossRef]
- Guoqing, L.; Hernandez, R.R.; Blackburn, G.A.; Davies, G.; Hunt, M.; Whyatt, J.D.; Armstrong, A. Ground-Mounted Photovoltaic Solar Parks Promote Land Surface Cool Islands in Arid Ecosystems. Renew. Sustain. Energy Transit. 2021, 1, 100008. [Google Scholar] [CrossRef]
- Edenhofer, O. Climate Change 2014: Mitigation of Climate Change; Cambridge University Press: Cambridge, UK, 2015; Volume 3. [Google Scholar]
- Veerendra Kumar, D.J.; Deville, L.; Ritter, K.A.; Raush, J.R.; Ferdowsi, F.; Gottumukkala, R.; Chambers, T.L. Performance Evaluation of 1.1 MW Grid-Connected Solar Photovoltaic Power Plant in Louisiana. Energies 2022, 15, 3420. [Google Scholar] [CrossRef]
- Pearce, J.M.; Sommerfeldt, N. Economics of Grid-Tied Solar Photovoltaic Systems Coupled to Heat Pumps: The Case of Northern Climates of the U.S. and Canada. Energies 2021, 14, 834. [Google Scholar] [CrossRef]
- Morris, J.; Calhoun, K.; Goodman, J.; Seif, D. Reducing Solar PV Soft Costs: A Focus on Installation Labor. In Proceedings of the 2014 IEEE 40th Photovoltaic Specialist Conference, PVSC 2014, Denver, CO, USA, 8–13 June 2014; Institute of Electrical and Electronics Engineers Inc.: Piscataway, NJ, USA, 2014; pp. 3356–3361. [Google Scholar]
- Ravi, S.; Macknick, J.; Lobell, D.; Field, C.; Ganesan, K.; Jain, R.; Elchinger, M.; Stoltenberg, B. Colocation Opportunities for Large Solar Infrastructures and Agriculture in Drylands. Appl. Energy 2016, 165, 383–392. [Google Scholar] [CrossRef]
- Ghenai, C.; Bettayeb, M. Design and Optimization of Grid-Tied and off-Grid Solar PV Systems for Super-Efficient Electrical Appliances. Energy Effic. 2020, 13, 291–305. [Google Scholar] [CrossRef]
- Mensah, L.D.; Yamoah, J.O.; Adaramola, M.S. Performance Evaluation of a Utility-Scale Grid-Tied Solar Photovoltaic (PV) Installation in Ghana. Energy Sustain. Dev. 2019, 48, 82–87. [Google Scholar] [CrossRef]
- Besharati Fard, M.; Moradian, P.; Emarati, M.; Ebadi, M.; Gholamzadeh Chofreh, A.; Klemeŝ, J.J. Ground-Mounted Photovoltaic Power Station Site Selection and Economic Analysis Based on a Hybrid Fuzzy Best-Worst Method and Geographic Information System: A Case Study Guilan Province. Renew. Sustain. Energy Rev. 2022, 169, 112923. [Google Scholar] [CrossRef]
- Barbón, A.; Bayón-Cueli, C.; Bayón, L.; Carreira-Fontao, V. A Methodology for an Optimal Design of Ground-Mounted Photovoltaic Power Plants. Appl. Energy 2022, 314, 118881. [Google Scholar] [CrossRef]
- McCall, J.; Macdonald, J.; Burton, R.; Macknick, J. Vegetation Management Cost and Maintenance Implications of Different Ground Covers at Utility-Scale Solar Sites. Sustainability 2023, 15, 5895. [Google Scholar] [CrossRef]
- Alam, H.; Alam, M.A.; Butt, N.Z. Techno Economic Modeling for Agrivoltaics: Can Agrivoltaics Be More Profitable Than Ground Mounted PV? IEEE J. Photovolt. 2023, 13, 174–186. [Google Scholar] [CrossRef]
- Sacchelli, S.; Havrysh, V.; Kalinichenko, A.; Suszanowicz, D. Ground-Mounted Photovoltaic and Crop Cultivation: A Comparative Analysis. Sustainability 2022, 14, 8607. [Google Scholar] [CrossRef]
- Sojib Ahmed, M.; Rezwan Khan, M.; Haque, A.; Ryyan Khan, M. Agrivoltaics Analysis in a Techno-Economic Framework: Understanding Why Agrivoltaics on Rice Will Always Be Profitable. Appl. Energy 2022, 323, 119560. [Google Scholar] [CrossRef]
- Garrod, A.; Hussain, S.N.; Ghosh, A. The Technical and Economic Potential for Crop Based Agrivoltaics in the United Kingdom. Sol. Energy 2024, 277, 112744. [Google Scholar] [CrossRef]
- Chudinzow, D.; Klenk, M.; Eltrop, L. Impact of Field Design and Location on the Techno-Economic Performance of Fixed-Tilt and Single-Axis Tracked Bifacial Photovoltaic Power Plants. Sol. Energy 2020, 207, 564–578. [Google Scholar] [CrossRef]
- Mansour, R.B.; Mateen Khan, M.A.; Alsulaiman, F.A.; Mansour, R. Ben Optimizing the Solar PV Tilt Angle to Maximize the Power Output: A Case Study for Saudi Arabia. IEEE Access 2021, 9, 15914–15928. [Google Scholar] [CrossRef]
- Bogdan, O.; Creţu, D. Wind Load Design of Photovoltaic Power Plants by Comparison of Design Codes and Wind Tunnel Tests. Math. Model. Civ. Eng. 2019, 15, 13–27. [Google Scholar] [CrossRef]
- Aly, M.A.; Whipple, J. Wind Forces on Ground-Mounted Photovoltaic Solar Systems: A Comparative Study. Appl. Sol. Energy 2021, 57, 444–471. [Google Scholar]
- Browne, M.T.L.; Taylor, Z.J.; Li, S.; Gamble, S. A Wind Load Design Method for Ground-Mounted Multi-Row Solar Arrays Based on a Compilation of Wind Tunnel Experiments. J. Wind. Eng. Ind. Aerodyn. 2020, 205, 104294. [Google Scholar] [CrossRef]
- Yemenici, O.; Aksoy, M.O. An Experimental and Numerical Study of Wind Effects on a Ground-Mounted Solar Panel at Different Panel Tilt Angles and Wind Directions. J. Wind. Eng. Ind. Aerodyn. 2021, 213, 104630. [Google Scholar] [CrossRef]
- Charney, F.; Heausler, T.; Marshall, J. Minimum Design Loads and Associated Criteria for Buildings and Other Structures; American Society of Civil Engineers (ASCE): Resto, VA, USA, 2017. [Google Scholar]
- Solari, G. Wind Science and Engineering Origins, Developments, Fundamentals and Advancements; Springer: Berlin/Heidelberg, Germany, 2019. [Google Scholar]
- Ginger, J.D.; Bodhinayake, G.G.; Ingham, S. Wind Loads for Designing Ground-Mounted Solar-Panel Arrays. Aust. J. Struct. Eng. 2019, 20, 204–218. [Google Scholar] [CrossRef]
- Abdollahi, R. Impact of Wind on Strength and Deformation of Solar Photovoltaic Modules. Environ. Sci. Pollut. Res. 2021, 28, 21589–21598. [Google Scholar] [CrossRef]
- Chen, F.; Zhu, Y.; Wang, W.; Shu, Z.; Li, Y. A Review on Aerodynamic Characteristics and Wind-Induced Response of Flexible Support Photovoltaic System. Atmosphere 2023, 14, 731. [Google Scholar] [CrossRef]
- Irtaza, H.; Agarwal, A. CFD Simulation of Turbulent Wind Effect on an Array of Ground-Mounted Solar PV Panels. J. Inst. Eng. (India) Ser. A 2018, 99, 205–218. [Google Scholar] [CrossRef]
- Johansson, F.; Gustafsson, B.E.; Stridh, B.; Campana, P.E. 3D-Thermal Modelling of a Bifacial Agrivoltaic System: A Photovoltaic Module Perspective. Energy Nexus 2022, 5, 100052. [Google Scholar] [CrossRef]
- Alhadidi, A.H.; Khazaaleh, S.; Daqaq, M.F. Suppression of Galloping Oscillations by Injecting a High-Frequency Excitation. Philos. Trans. R. Soc. A Math. Phys. Eng. Sci. 2021, 379, 20200244. [Google Scholar] [CrossRef]
- Sen, D.; Mohan, S.; Ananthasuresh, G.K. (Eds.) Lecture Notes in Mechanical Engineering Mechanism and Machine Science Select Proceedings of Asian MMS 2018; Springer Nature: Berlin/Heidelberg, Germany, 2018. [Google Scholar]
- García, E.M.; Marigorta, E.B.; Gayo, J.P.; Navarro-Manso, A. Experimental Determination of the Resistance of a Single-Axis Solar Tracker to Torsional Galloping. Struct. Eng. Mech. 2021, 78, 519–528. [Google Scholar]
- Valentín, D.; Valero, C.; Egusquiza, M.; Presas, A. Failure Investigation of a Solar Tracker Due to Wind-Induced Torsional Galloping. Eng. Fail. Anal. 2022, 135, 106137. [Google Scholar] [CrossRef]
- Rohr, C.; Bourke, P.A.; Banks, D. Torsional Instability of Single-Axis Solar Tracking Systems. In Proceedings of the 14th International Conference on Wind Engineering, Porto Alegre, Brazil, 21 June 2015. [Google Scholar]
- Enshaei, P.; Chowdhury, J.; Sauder, H.; Banks, D. Wind Tunnel Testing of Torsional Instability in Single-Axis Solar Trackers: Summary of Methodologies and Results. In Proceedings of the 21st Australasian Wind Engineering Society Workshop, Sydney, Australia, 2–3 February 2023. [Google Scholar]
- Fukuda, K.; Balachandar, R.; Barron, R.M. Analysis of the Ground Effect on Development of Flow Structures around an Inclined Solar Panel. Environ. Fluid Mech. 2020, 20, 1463–1489. [Google Scholar] [CrossRef]
- Suárez, J.L.; Cadenas, D.; Rubio, H.; Ouro, P. Vortex Shedding Dynamics Behind a Single Solar PV Panel Over a Range of Tilt Angles in Uniform Flow. Fluids 2022, 7, 322. [Google Scholar] [CrossRef]
- Meehan, P.A. Prediction and Suppression of Chaos Following Flutter in Wind Turbines. Nonlinear Dyn. 2023, 111, 22153–22176. [Google Scholar] [CrossRef]
- Caracoglia, L.; Jones, N.P. Time Domain vs. Frequency Domain Characterization of Aeroelastic Forces for Bridge Deck Sections. J. Wind. Eng. Ind. Aerodyn. 2003, 91, 371–402. [Google Scholar] [CrossRef]
- Wang, Z.; Dragomirescu, E. Flutter Derivatives Identification and Aerodynamic Performance of an Optimized Multibox Bridge Deck. Adv. Civ. Eng. 2016, 2016, 8530154. [Google Scholar] [CrossRef]
- Matsumoto, M.; Mizuno, K.; Okubo, K.; Ito, Y.; Matsumiya, H. Flutter Instability and Recent Development in Stabilization of Structures. J. Wind. Eng. Ind. Aerodyn. 2007, 95, 888–907. [Google Scholar] [CrossRef]
- Liu, H.; Zhang, P.; Lai, Z.; Dong, X.; Wang, Z.; Zhou, S. Fluid Structure Interaction Based Structure Stress and Modal Analysis of a Flat Type Solar Panel Supporting System. E3S Web Conf. 2021, 248, 02018. [Google Scholar] [CrossRef]
- Young, E.; He, X.; King, R.; Corbus, D. A Fluid-Structure Interaction Solver for Investigating Torsional Galloping in Solar-Tracking Photovoltaic Panel Arrays. J. Renew. Sustain. Energy 2020, 12, 063503. [Google Scholar] [CrossRef]
- Pantua, C.A.J.; Calautit, J.K.; Wu, Y. A Fluid-Structure Interaction (FSI) and Energy Generation Modelling for Roof Mounted Renewable Energy Installations in Buildings for Extreme Weather and Typhoon Resilience. Renew. Energy 2020, 160, 770–787. [Google Scholar] [CrossRef]
- Quintela, J.; Jurado, J.A.; Rapela, C.; Álvarez, A.J.; Roca, M.; Hernández, S.; Cid Montoya, M.; López, J.M.; Ruiz, A.J.; Moreno, I.; et al. Experimental and Computational Studies on the Performance of Solar Trackers under Vortex Shedding, Torsional Divergence, and Flutter. Int. J. Comput. Methods Exp. Meas. 2020, 8, 387–404. [Google Scholar] [CrossRef]
- Kong, Y.; Huang, H. Design and Experiment of a Passive Damping Device for the Multi-Panel Solar Array. Adv. Mech. Eng. 2017, 9, 1687814016687965. [Google Scholar] [CrossRef]
- Liu, C.; Li, H.; Zhang, F.; Wang, X. Improvement on the Passive Method Based on Dampers for the Vibration Control of Spacecraft Solar Panels. Adv. Mech. Eng. 2022, 14, 16878132221080596. [Google Scholar] [CrossRef]
- Chung, P.H.; Chou, C.C.; Yang, R.Y.; Chung, C.Y. Wind Loads on a PV Array. Appl. Sci. 2019, 9, 2466. [Google Scholar] [CrossRef]
- Lave, M.; Kleissl, J. Optimum Fixed Orientations and Benefits of Tracking for Capturing Solar Radiation in the Continental United States. Renew. Energy 2011, 36, 1145–1152. [Google Scholar] [CrossRef]
- Vasel, A.; Iakovidis, F. The Effect of Wind Direction on the Performance of Solar PV Plants. Energy Convers. Manag. 2017, 153, 455–461. [Google Scholar] [CrossRef]
- Stathopoulos, T.; Zisis, I.; Xypnitou, E. Local and Overall Wind Pressure and Force Coefficients for Solar Panels. J. Wind. Eng. Ind. Aerodyn. 2014, 125, 195–206. [Google Scholar] [CrossRef]
- Jubayer, C.M.; Hangan, H. Numerical Simulation of Wind Effects on a Stand-Alone Ground Mounted Photovoltaic (PV) System. J. Wind. Eng. Ind. Aerodyn. 2015, 134, 56–64. [Google Scholar] [CrossRef]
- Nan, B.; Chi, Y.; Jiang, Y.; Bai, Y. Wind Load and Wind-Induced Vibration of Photovoltaic Supports: A Review. Sustainability 2024, 16, 2551. [Google Scholar] [CrossRef]
- Du, H.; Xu, H.W.; Zhang, Y.L.; Lou, W.J. Wind Pressure Characteristics and Wind Vibration Response of Long-Span Flexible Photovoltaic Support Structure. J. Harbin Inst. Technol. 2022, 54, 67–74. [Google Scholar]
- Yin, M.Z.; Zou, Y.F.; Li, Q.T.; He, X.; Yan, L.; Han, G. Wind Tunnel Test Study on Wind Load of Single Row Tracking Photovoltaic Structure. J. Railw. Sci. Eng. 2020, 17, 2354–2361. [Google Scholar]
- Xu, N.; Li, X.; Gao, C.; Zhu, C.; Zhou, Z.; Zhu, X. Analysis of Shape Coefficients of Wind Loads of Photovoltaic System. Acta Energiae Solaris Sin. 2021, 42, 17–22. [Google Scholar]
- Shademan, M.; Barron, R.M.; Balachandar, R.; Hangan, H. Numerical Simulation of Wind Loading on Ground-Mounted Solar Panels at Different Flow Configurations. Can. J. Civ. Eng. 2014, 41, 728–738. [Google Scholar] [CrossRef]
- Kopp, G.A.; Farquhar, S.; Morrison, M.J. Aerodynamic Mechanisms for Wind Loads on Tilted, Roof-Mounted, Solar Arrays. J. Wind. Eng. Ind. Aerodyn. 2012, 111, 40–52. [Google Scholar] [CrossRef]
- Smith, S.; Calaf, M.; Djeridi, H.; Obligado, M.; Cal, R.B. Vortex Generators Alter Particle Transport in Solar Photovoltaics. Bulletin of the American Physical Society; APS. 2024. Available online: https://meetings.aps.org/Meeting/DFD24/Session/A33.10 (accessed on 15 September 2024).
- Connor, L.; Roig, C. Louisiana Land Market Report Irrigated Cropland in Louisiana. 2020. Available online: https://www.lsuagcenter.com/~/media/system/2/c/5/c/2c5c5c848ffdc196425606181d10f786/irrigated%20cropland%20values%20reportpdf.pdf (accessed on 1 August 2024).
- Deshpande, S.; Bhasme, N.R. A Review of Topologies of Inverter for Grid Connected PV Systems. In Proceedings of the 2017 Innovations in Power and Advanced Computing Technologies (i-PACT), Vellore, India, 21–22 April 2017; Institute of Electrical and Electronics Engineers: Piscataway, NJ, USA, 2017; pp. 1–6. [Google Scholar]
- Dogga, R.; Pathak, M.K. Recent Trends in Solar PV Inverter Topologies. Sol. Energy 2019, 183, 57–73. [Google Scholar] [CrossRef]
- Zamora Zapata, M.; Lappalainen, K.; Kankiewicz, A.; Kleissl, J. Comparing Solar Inverter Design Rules to Subhourly Solar Resource Simulations. J. Renew. Sustain. Energy 2023, 15, 053501. [Google Scholar] [CrossRef]


| Agrivoltaics Type | Advantages | Disadvantages |
|---|---|---|
| Crops |
|
|
| Animals |
|
|
| Greenhouses |
|
|
| Different applications |
|
|
| LER = 1 | The agrivoltaics and the normal condition are showing the same results. |
| LER > 1 | Agrivoltaics is showing better results than normal conditions. |
| LER < 1 | The normal conditions are showing better results than agrivoltaics. |
| Risk | Category I |
|---|---|
| Terrain | Category II |
| Panel Width (Wp) | 1.55 m = 5.08 ft |
| Panel Length (Lp) | 3.3 m = 10.82 ft |
| Panel Mounting Height | 1.44 m = 4.59 ft |
| Tilt Angle | 25–45° |
| Parameter | Assumption | ASCE Chapter |
|---|---|---|
| Risk category | I | Table 1.5-1 |
| V, basic wind speed (mph) | 84.15 | Example wind speed |
| Exposure Category | C | Section 26.7 |
| Kd, the wind directionality factor | 0.85 | Table 26.6-1 |
| Ke, the ground elevation factor | 0.982 | Table 26.9-1 |
| Khg, the topographic factor | 1 | Figure 26.8-1 |
| Kh, the velocity pressure exposure coefficient | 0.85 | Table 26.10-1 |
| G, Gust Factor | 0.85 | Section 26.11 |
| Tilt Angle | Load Case | γ = 0° | γ = 180° | ||
|---|---|---|---|---|---|
| CNW | CNL | CNW | CNL | ||
| 25° | A | −1.60 | −1.67 | 1.83 | 1.90 |
| B | −2.43 | −0.36 | 2.33 | 0.79 | |
| 45° | A | −1.60 | −1.80 | 2.20 | 2.50 |
| B | −2.30 | −0.70 | 2.60 | 1.40 | |
| Tilt Angle β | Wind Direction Angle α | Impact on Wind Loads | Reference |
|---|---|---|---|
| 25°, 45° | 0°, 180° | The maximum positive pressure at 0° while maximum negative pressure at 180° | [90] |
| 45° | 0 | Maximum drag coefficient. | [90] |
| 25° | 120° | Minimum drag coefficient | [90] |
| 45° | 0°, 180° | Highest positive and negative lift coefficient | [90] |
| 25 ° | 60°, 120° | Lowest positive and negative lift coefficient | [90] |
| 25°, 45° | 30°, 150° | Maximum and minimum x-overturning moments at wind angles, respectively (higher at β = 45°) | [90] |
| 25°, 45° | 0°, 180° | Highest positive and negative values y-overturning moments | [90] |
| 25° | 30°, 150° | BLUE-peak values 29.4% and 25.7%, respectively | [90] |
| 45° | 30°, 150° | BLUE-peak values 24.1% and 23.5%, respectively | [90] |
| 30 ° | 0° | Maximum negative pressure coefficient | [102] |
| 10°–40° | 30°, 45°, 135° | Maximum negative and positive pressure coefficient | [102] |
| ≥50° | 30°, 45°, 135° | Pressure coefficient is almost constant, and higher tilt angle cause higher values | [102] |
| Location | West Parish Baton Rouge—Port Allen (Former Sugar Cane Land) |
|---|---|
| Area Covered | 600 acres |
| #Number of Panels | 197,000 |
| Target Region | Southwest of Louisiana |
| Anticipated Finish Date | September (Fall 2024) |
| Power Generation | 50 MW |
| #Number of Homes Powered | 9600 daily consumption basis |
| Director of Resource Planning | Jonathan Bourg |
| Solar Panels Type | Tracking–axis 30% light captured more than the fixed. |
| Capital Cost | USD 240 million |
| Tilt angle of the panels | Changing over the day to track the sun |
| Land cost | Lease (113 USD/Acre) [128] |
| Height of solar panels from the ground | 2.1 m (7ft) |
Disclaimer/Publisher’s Note: The statements, opinions and data contained in all publications are solely those of the individual author(s) and contributor(s) and not of MDPI and/or the editor(s). MDPI and/or the editor(s) disclaim responsibility for any injury to people or property resulting from any ideas, methods, instructions or products referred to in the content. |
© 2024 by the authors. Licensee MDPI, Basel, Switzerland. This article is an open access article distributed under the terms and conditions of the Creative Commons Attribution (CC BY) license (https://creativecommons.org/licenses/by/4.0/).
Share and Cite
Zahrawi, A.A.; Aly, A.M. A Review of Agrivoltaic Systems: Addressing Challenges and Enhancing Sustainability. Sustainability 2024, 16, 8271. https://doi.org/10.3390/su16188271
Zahrawi AA, Aly AM. A Review of Agrivoltaic Systems: Addressing Challenges and Enhancing Sustainability. Sustainability. 2024; 16(18):8271. https://doi.org/10.3390/su16188271
Chicago/Turabian StyleZahrawi, Amro A., and Aly Mousaad Aly. 2024. "A Review of Agrivoltaic Systems: Addressing Challenges and Enhancing Sustainability" Sustainability 16, no. 18: 8271. https://doi.org/10.3390/su16188271
APA StyleZahrawi, A. A., & Aly, A. M. (2024). A Review of Agrivoltaic Systems: Addressing Challenges and Enhancing Sustainability. Sustainability, 16(18), 8271. https://doi.org/10.3390/su16188271