Article

Ground Surface Effect of Earth Pressure Balance Tunnelling in Deltaic Deposits: A Case Study of Line 9 of the Barcelona Metro

Department of Mining Engineering, Industrial and ICT, Polytechnic University of Catalonia (UPC), Avenue Bases de Manresa, 61-73, 08242 Manresa, Spain
*
Author to whom correspondence should be addressed.
Sustainability 2024, 16(18), 8275; https://doi.org/10.3390/su16188275
Submission received: 22 August 2024 / Revised: 17 September 2024 / Accepted: 18 September 2024 / Published: 23 September 2024
(This article belongs to the Section Sustainable Chemical Engineering and Technology)

Abstract

:
The 47.8 km long Line 9 of the Barcelona Metro is one of Europe’s longest urban metro lines. Its southern section connects the city to the airport, being entirely excavated through soft deltaic deposits, promoting more sustainable mobility by reducing significant road traffic. This study identifies the most accurate method for predicting surface settlements caused by tunnel excavation using ground movement monitoring data. Several methodologies were assessed, with the Mean Absolute Error (MAE) and Mean Relative Error (MRE) calculated to evaluate their performances. The methods considered were Peck’s Gaussian curve method, Sagaseta’s method, and Verruijt and Booker’s method, with MAE values of 0.66 mm, 0.50 mm, and 0.48 mm and MRE values of 49%, 45%, and 36%, respectively. Verruijt and Booker’s method proved the most effective for predicting settlement, minimising surface impacts, improving building sustainability, and reducing environmental contamination from chemical injections. A sensitivity analysis was also conducted by comparing the monitoring data from Line 9 with data from 45 other tunnels excavated worldwide in deltaic soils. This analysis aimed to develop rapid predictive models applicable to different locations. The methodologies proposed for estimating ground settlements relied on specific parameters, particularly the K value, which was consistent across all deltaic soil locations, with values ranging from 0.45 to 0.55.

1. Introduction and Engineering Background

Throughout history, the mechanical industry has developed a wide variety of tunnelling equipment to cover a wide range of society’s needs.
The use of integral machines and, in particular, the use of earth pressure machines (EPBs) is becoming more and more frequent in the process of urban tunnelling. Some examples of tunnels built using a TBM in urban environments can be found in the extension of the Jubilee Line [1], the Channel Tunnel Rail Link in London [2], the Mass Rapid Transit Authority of Thailand (MRTA) project in Bangkok [3], the extension of Line 1 and Line 5 in the city of Milan [4,5], Taipei Rapid Transit System (TRTS) CA450A in Taiwan [6], the research project by Imperial College London to investigate the effect of tunnelling using modern earth pressure balance tunnel boring machines (EPBs) on existing tunnels [7], or the Crossrail Project in London [8].
In recent years, major projects have been carried out in Spain using this type of TBM. An example of this would be the extension of the Madrid metro [9] or the construction of Line 9 of the Barcelona metro [10,11], which is still under construction. During 2009, only in the metropolitan area of Barcelona, fourteen TBMs were excavating the Catalan subsoil, and twelve of them were of the EPB type (Table 1).
Throughout history, numerous investigations have been conducted in response to the increasing use of these machines, driven not only by their growing application but also by the need to develop more versatile and competitive tunnelling equipment. Specifically, research has focused on studying the ground movements generated by EPBMs during tunnelling processes, as well as on optimising the control mechanisms of TBMs to minimise such movements. Some of these studies are presented in [1,12,13,14,15,16,17,18,19,20].
It is worth noting that short-term and long-term tunnelling-induced ground surface displacements are still frequently predicted using empirical approaches [21].
The analysis of the tunnelling-induced vertical displacements of the ground surface is conducted using the empirical approach of a Gaussian formulation curve [22]. More precisely, the shape of the curve is defined by the maximum settlement and by the horizontal distance to the inflexion point (i). Likewise, for tunnels in undrained clay soils, where the soil conforms to constant-volume conditions, generally, there exists a good understanding of the relationship between tunnel construction and the resulting deformations of the ground in greenfield conditions [23]. In these cases, the Gaussian curve, proposed by Peck [22], provides a good adjustment of the settlement data.
Specifically, this provides a case study involving the least-squares method, which is used to fit the Gaussian curve to data in 43 surface settlement through profiles. For this reason, a discussion about whether Gaussian distribution provides a good adjustment to the settlement trough profiles’ data is also presented in this paper. Sagaseta and Verruitj modified the equation and introduced the ovalisation effect. In this paper, the greenfield ground response is compared with Sagaseta’s and Verruitj’s expressions and with the Gaussian curve results.
Consequently, the width of the surface trough (i) and the Vloss against the tunnel depth (z0) determined using the monitoring system data in Section 1 are represented. Then, these results are compared with the width of the surface trough (i) and also with the volume loss findings recorded in other cases in the International Tunnelling History.

2. Study Area and Tunnelling Details

2.1. Project Overview

One clear example of EPB tunnelling would be the case of Line 9 (under construction) of the Barcelona Metro. Once this line is finished, it will be one of the longest lines in Europe, with a total length of 47.8 km built mostly in an urban setting, out of which nearly 44 km corresponds to tunnelling with 47 stations. Moreover, the last 2.8 km corresponds to viaduct construction with 5 stations [10,11,24,25,26]. To illustrate this, Figure 1 has been added to present the layout of Line 9 and its various interconnections with important infrastructures in the metropolitan area.
To begin with, tunnelling is performed by five TBMs with three different diameters: the first one of 12.06 m; the second one of 9.40 m, corresponding to the EPB machine type [26], which are used for both soft and hard ground tunnelling; and the third one of 11.95 m, which corresponds to a TBM/EPB. In other words, it is a dual machine used for weathered rocks [27,28,29].
Considering the entirety of the underground construction of Line 9, this paper focuses on the excavation layout between Terminal 1 of El Prat Airport and the industrial zone known as “Parc Logístic”. Accordingly, in the construction design, this 12.5 km section is designated as Section 1 within the Line 9 project, as illustrated in Figure 1. Moreover, the section is entirely situated beneath the Quaternary alluvial deposits of the Llobregat River delta.
Thus, the total length of Section 1 is 12.5 km, and it has been divided into 5 sub-sections (T1D, T1A, T1B, T1E, and T1C) to make the management, monitoring, and control of the work easier. Moreover, the tunnel construction was carried out with two earth pressure tunnel boring machines (EPBs) excavating in opposite directions from the Mas Blau station (Figure 2). To illustrate, both EPSs, one called Hades (S-269) and the other Guster (S-461), have an excavation diameter of 9.43 m and the inner diameter, once the ring of segments is in place, is 8.43 m. Moreover, the cutter wheel opening represents 31.4%.
Initially, the tunnel was constructed with precast concrete lining, which was composed of 6 + 1 segmented concrete pieces, 6 precast concrete segments of the same size, plus a key that formed a complete ring of 0.32 m thick. Subsequently, the length of each lining section was 1.5 m.
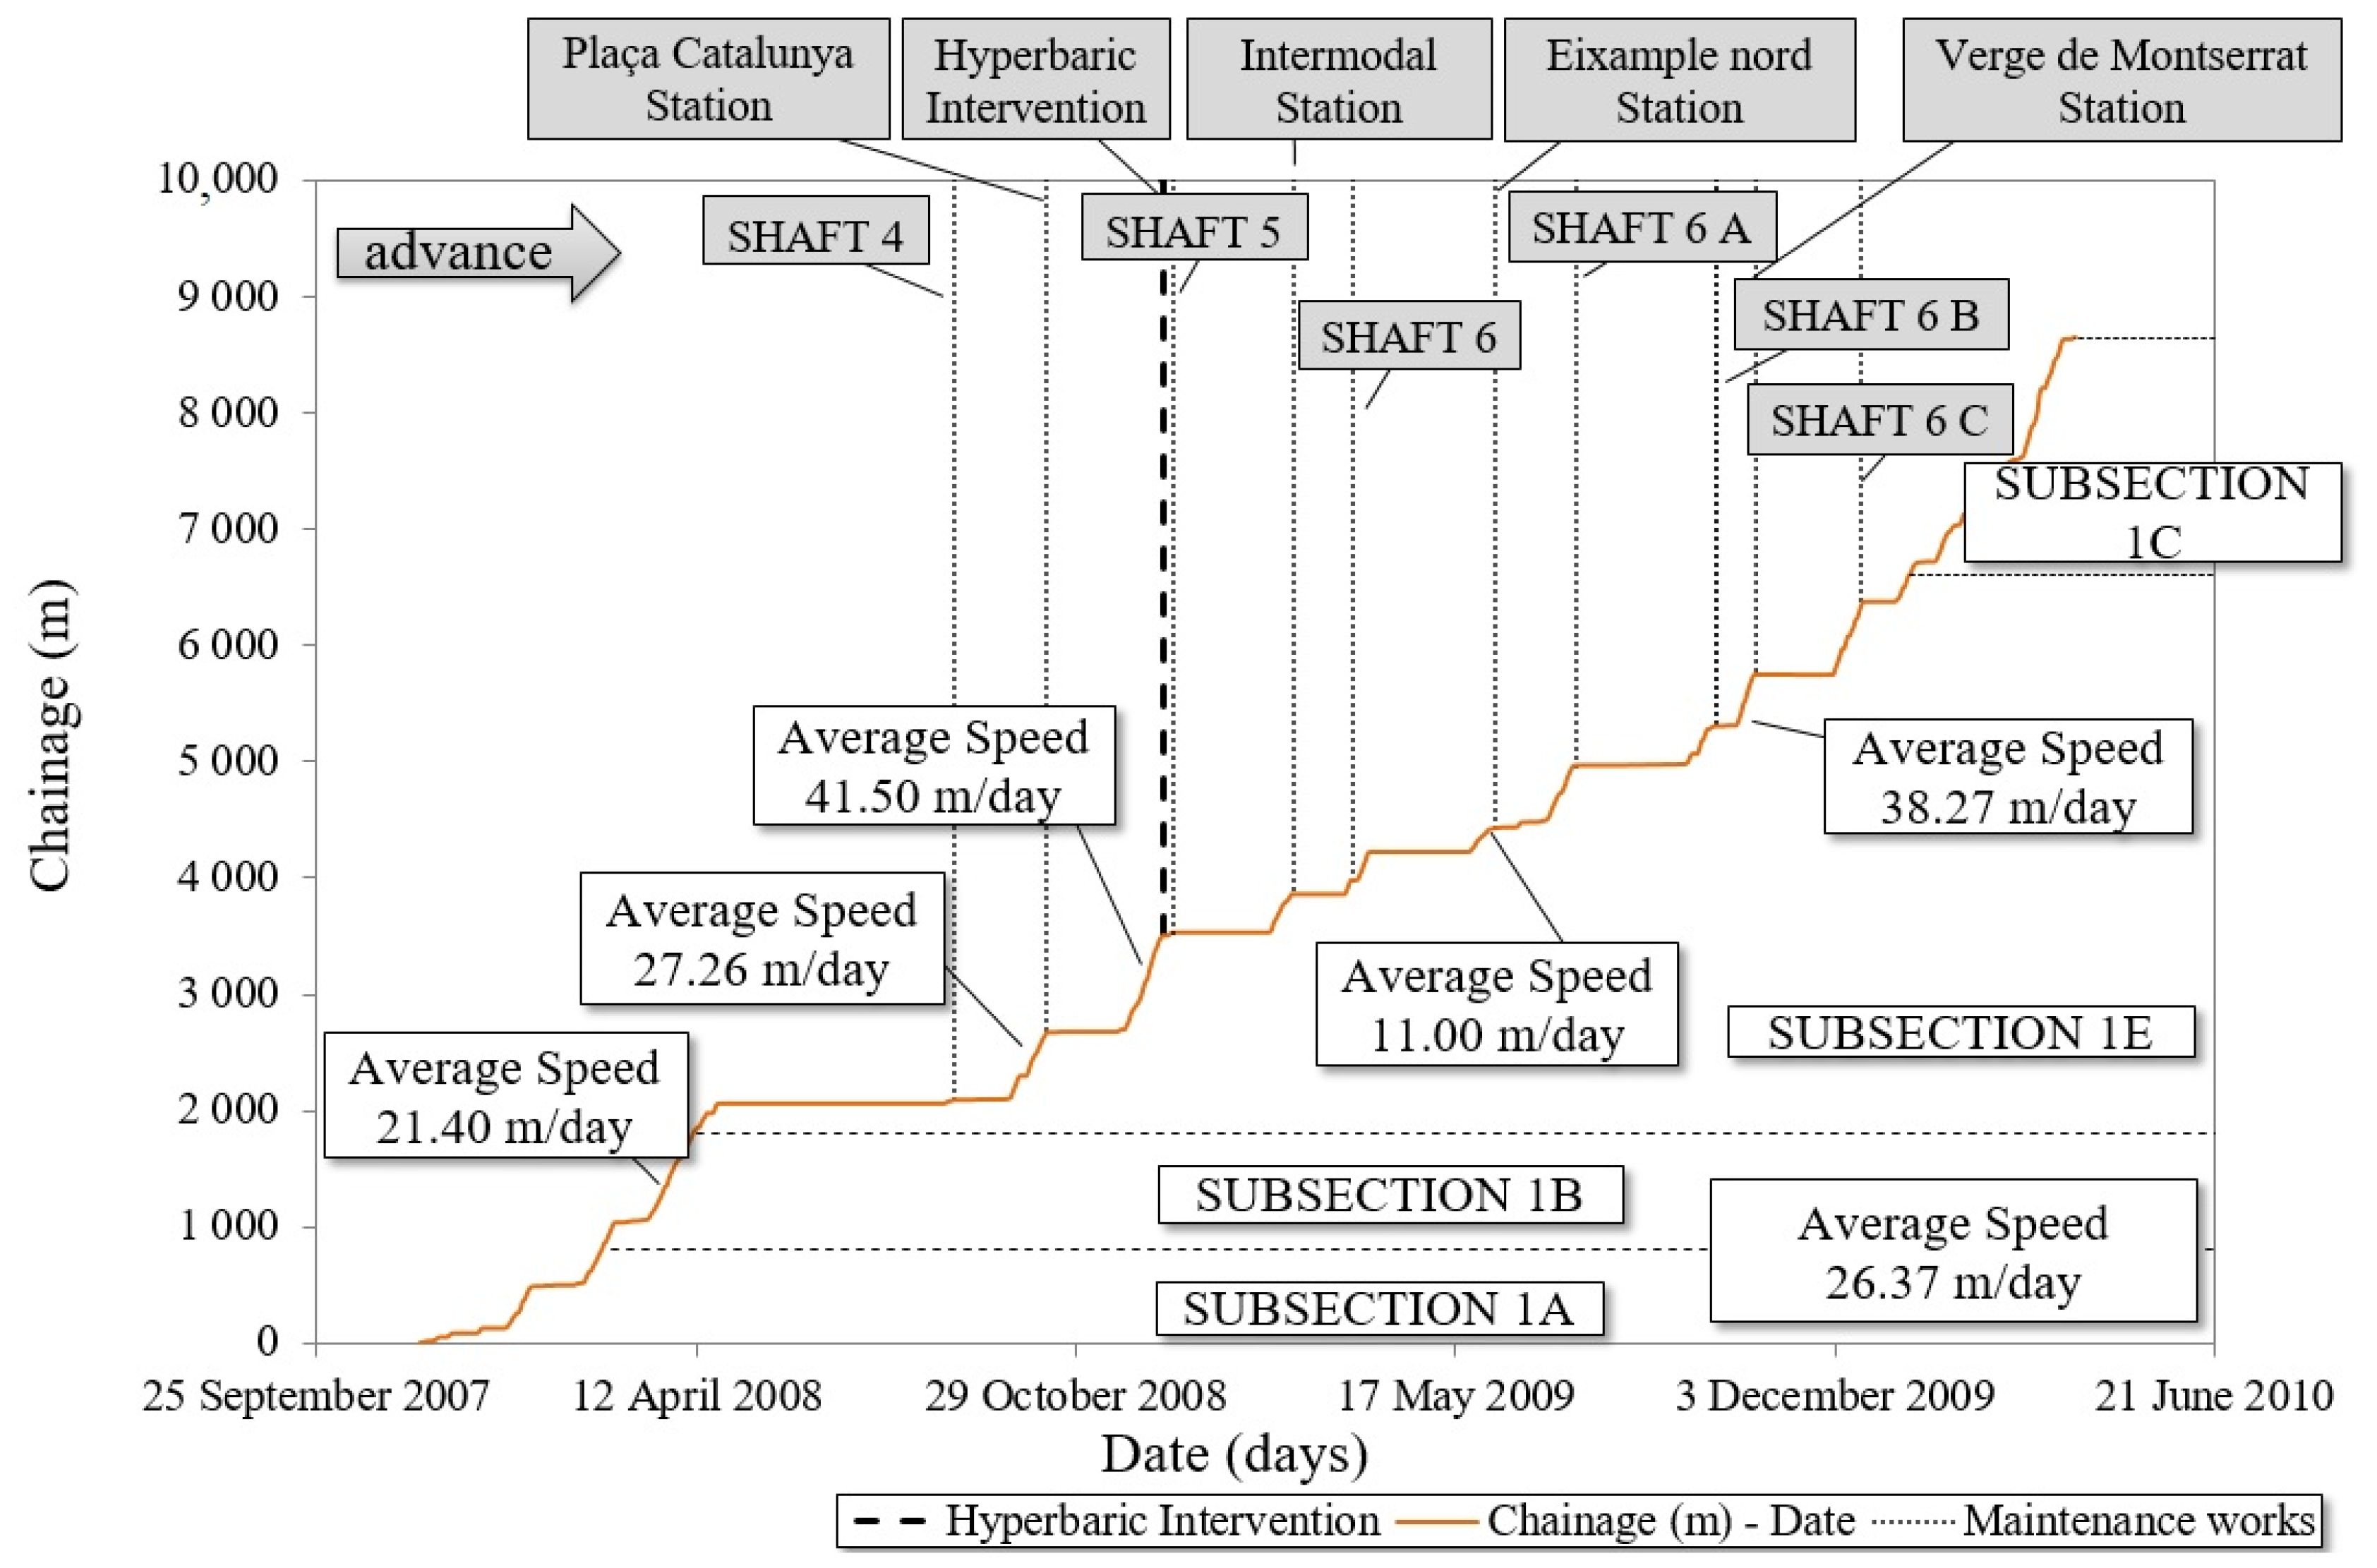
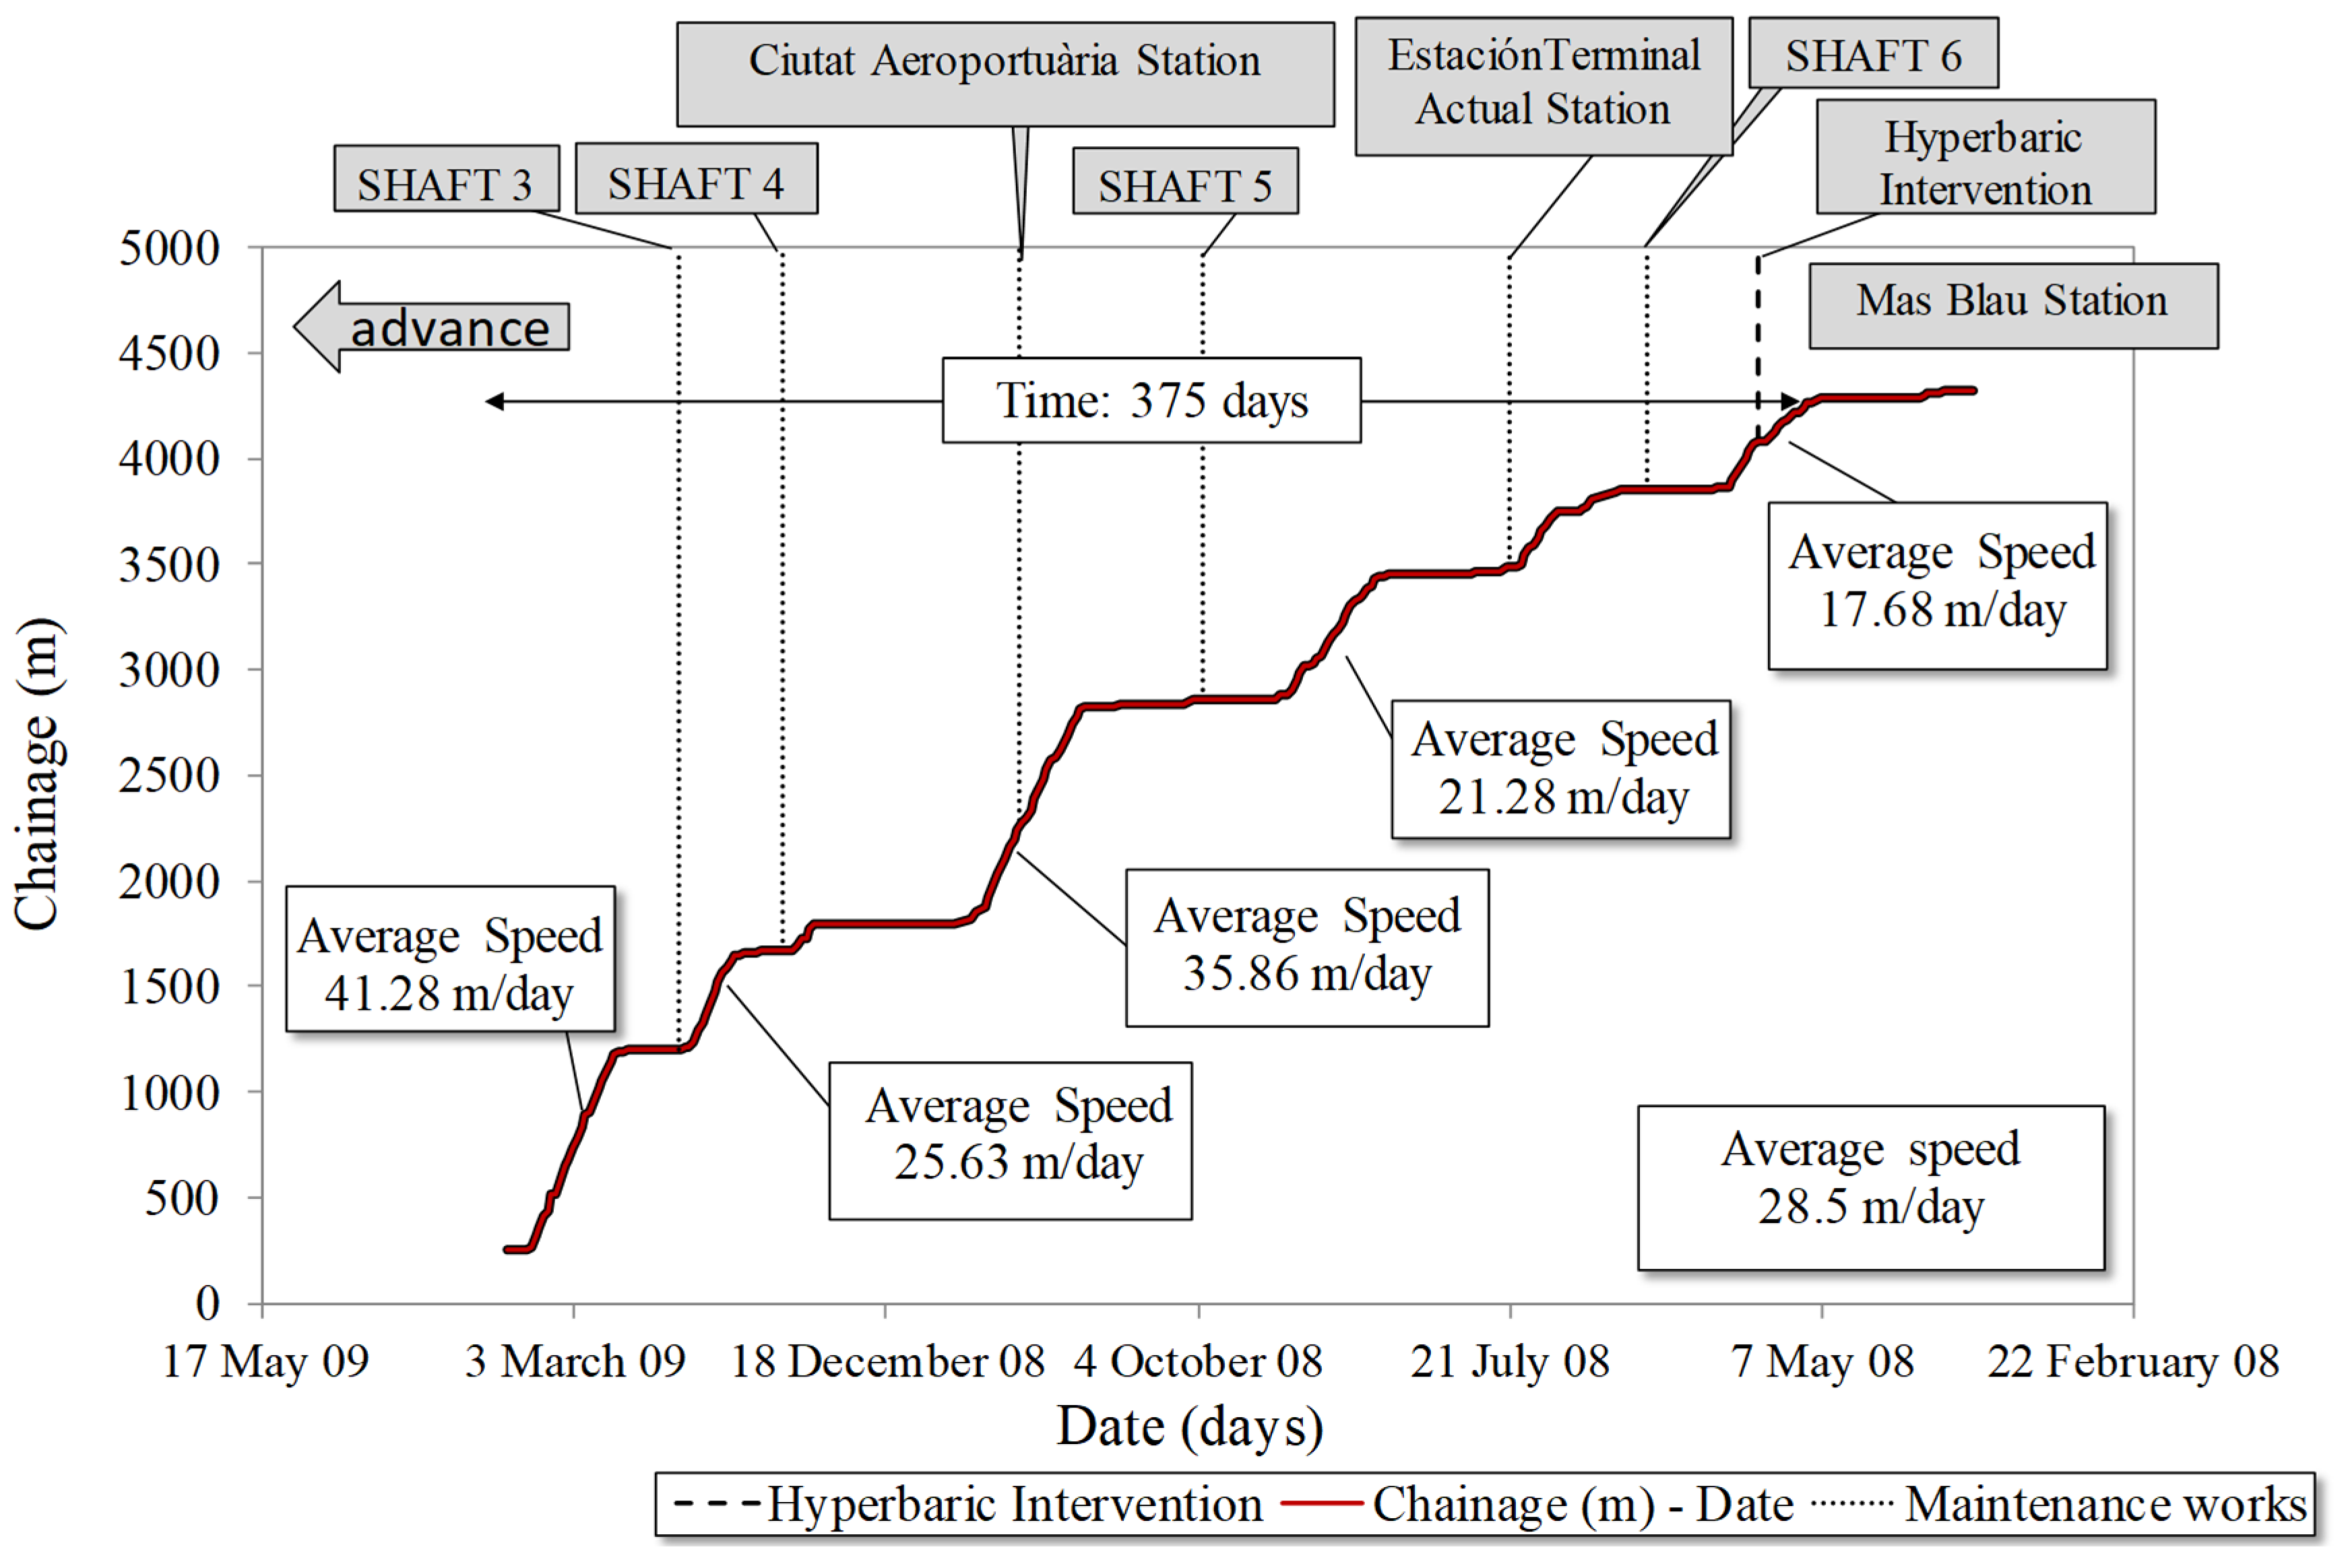
The tunnel between Mas Blau station and Parc Logistic was built first, followed by the southern route between the Mas Blau and Terminal entre Pistes stations, which were built 5 months later. Meanwhile, the progress of the EPB front over time is presented in Figure 3 and Figure 4.
To begin with, the first EPB called Hades (S-279) excavated 8174.48 m. Hence, the average advance rate was approximately 26.37 m/day, i.e., 18 rings per day. Nevertheless, shutdown periods are not included in these values. Thus, the maximum daily breakthrough recorded was 72 m/day, i.e., 48 rings (Figure 3). Then, the second EPB called Guster (S-461) must also be mentioned. It excavated 4325.52 m, and its average rate was about 28.5 m/day, i.e., 19 rings per day. Not only was the maximum daily breakthrough recorded at 90 m, i.e., 60 rings (Figure 4), but it was also a world record. So, it showed a high performance compared to the data obtained from similar ground conditions in EPB tunnelling, as in the case of the Bangkok subway, where the best speed was about 20 m/day [3].
In fact, on the 42 occasions that the Hades EPB was stopped for more than one day, it was due to logistical problems such as the dismantling of structures and infrastructure (representing 607 days in total). In addition, 19 of them included maintenance and repair work on the machine. Furthermore, of these 19 shutdowns, only 9 were hyperbaric interventions, but tool changes were not made in any of them. Overall, the low abrasiveness of the soft ground allowed the cutting head tools to be maintained without tool changes until the EPB reached the programmed stations or shafts. Additionally, there was no need for many hyperbaric interventions, reducing the costs and saving time. Figure 3 shows the progress of the EPBs versus time and the Hades EPB stops for maintenance work during tunnelling between the Mas Blau and Parc Logistic stations.
On the other hand, EPB Guster excavated from Mas Blau station to Terminal 1. Hence, over the 4325.52 m, there were 14 occasions where the EPB Guster was stopped. In summary, this represented 192 days in total, of which 5 were due to maintenance works performed in shafts and stations plus a hyperbaric intervention. To show this, Figure 4 presents the progress of the Guster EPBs versus time, and also, the machine stops for maintenance work during tunnelling between the “Mas Blau” and “Terminal entre Pistes” stations.
Additionally, the area is considered to be in greenfield conditions in most of the routes of Section 1. As a result, there are only some superficial constructions between the Plaça Catalunya and Verge de Montserrat stations.

2.2. Operational Control Parameters Used in EPBs

To minimise potential movements caused by excavation, TBMs (tunnel boring machines) are equipped with various mitigation systems related to the control of pressures and injection volumes. In the case of movements at the excavation face, these are reduced by the use of closed-face TBMs [30,31]. Ground deformation ahead of the face with such machines can be controlled by maintaining the pressures in the excavation chamber similar to those originally present in the undisturbed ground. Although, in theory, operations should remain within the defined pressure range, it is clear that applying the maximum pressure will result in the least settlement but will cause greater wear on the cutting tools of the cutterhead. For this reason, if there are no surface structures, it is advisable to operate within the lower end of the face pressure range [32].
In clayey soils, the ground itself can serve as a supporting medium within the TBM’s earth pressure chamber [33], especially after the addition of conditioning agents such as polymers, foams, or bentonite [32].
Regarding movements at the shield’s tail, tail grouting is a highly effective method for controlling ground deformation [34,35,36,37]. The consolidation of tail grouting relieves stress in the soil surrounding the tunnel, which may lead to ground deformation [38,39,40]. Tail grouting involves injecting specific grout materials into the tail void, thus minimising disturbances to the surrounding ground [41,42,43,44]. However, grout consolidation can lead to ground volume loss, contributing to surface settlement. Figure 5 shows the pressures and volumes applied using the TBM.

2.2.1. Face Pressure (P1)

Also, at the face of the excavation, a pressure called P1 is applied. Hereafter, P1 represents the pressure at which the excavated material is in the excavation chamber. Furthermore, it is measured at all times by seven pressure sensors or pressure-measuring cells located at the rear of the EPB machine’s cutter wheel. Thus, the pressure is controlled by the forward speed of the shield, the rate of removal of the excavated material, and the density of the material in the earth chamber (Figure 5).
Then, the values of the face pressure (P1) along Section 1 vary approximately between 1.00 and 3.50 bar, with an average pressure of 2.60 bar. In areas where the TBM was stopped, bentonite was injected to maintain this face pressure.

2.2.2. Bentonite Slurry Pressure around the Shield (P2) and (V2)

It should also be kept in mind that in some areas of Line 9 of the Barcelona Metro, the difference between the excavation diameter and the outer diameter of the shield tail can reach up to 6 cm of separation [32], causing large movements in the ground. To solve this problem, the first thought was to inject a product with a gel structure that would harden over time. Subsequently, the initial tests carried out on Line 9 of the Barcelona Metro enabled the successful filling of this “gap” with a bentonite slurry at a pressure similar to that existing in the chamber, a pressure controlled using cells attached to the inner face of the metal shield wall [29], which is referred to as P2.
Afterwards, the main reason for this volume of injected bentonite slurry (V2) is to provide additional support in the middle area between the cutter wheel and the tail of the shield. In addition, by reducing the friction between the shield and the surrounding ground, the total thrust that the TBM has to exert in advance is also reduced.
To conclude on this point, the bentonite injection pressure system of both the HADES TBM and the GUSTER TBM is regulated by 6 pressure-measuring cells fixed to the inside face of the metal shield wall. As a result, the bentonite injection pressure in the shield varies between 1.5 and 2.5 bar.

2.2.3. Pressure and Volume of Grout Injected into the Shield Tail (P3) and (V3)

The excavation section of both the HADES as well as GUSTER TBMs is 69.84 m2 (Ø maximum diameter = 9.43 m), and the external section of the lining ring once placed is 64.61 m2 (Ø = 9.07 m). Then, considering that the advance per ring is 1.5 m, a gap or a maximum theoretical space is formed, and it must have a maximum volume of 7.85 m3 for each ring installed. Consequently, to this theoretical gap, a correction factor of 1.15 must be applied, since it has been prescribed by the site management due to the loss of pressure in the injection lines, the waste of water from the ground, and also, the amount of injected material through the shield, which means a volume lower than 8.26 m3.
In fact, the EPB TBMs in charge of the excavation of Section 1 of Line 9 have 6 injection points for the grouting injection. Although they are distributed around the perimeter of the shield tail, the working queue pressure ranges between 2.5 and 3.5 bars.
In addition, Figure 6 shows a detail of the gap filling, between the excavated soil, by injecting bentonite. Thus, this gap filling between the soil and the tunnel lining is already in place by injecting grout into the shield’s tail.
Moreover, TBMs record other parameters such as the thrust made by the machine to advance, the torque of the cutting wheel, and so on. Therefore, Table 2 summarises the average values of the most relevant operational parameters about the generation of possible movements in the ground of the two EPB machines used in the excavation of Section 1 of Line 9.

3. Geological Conditions

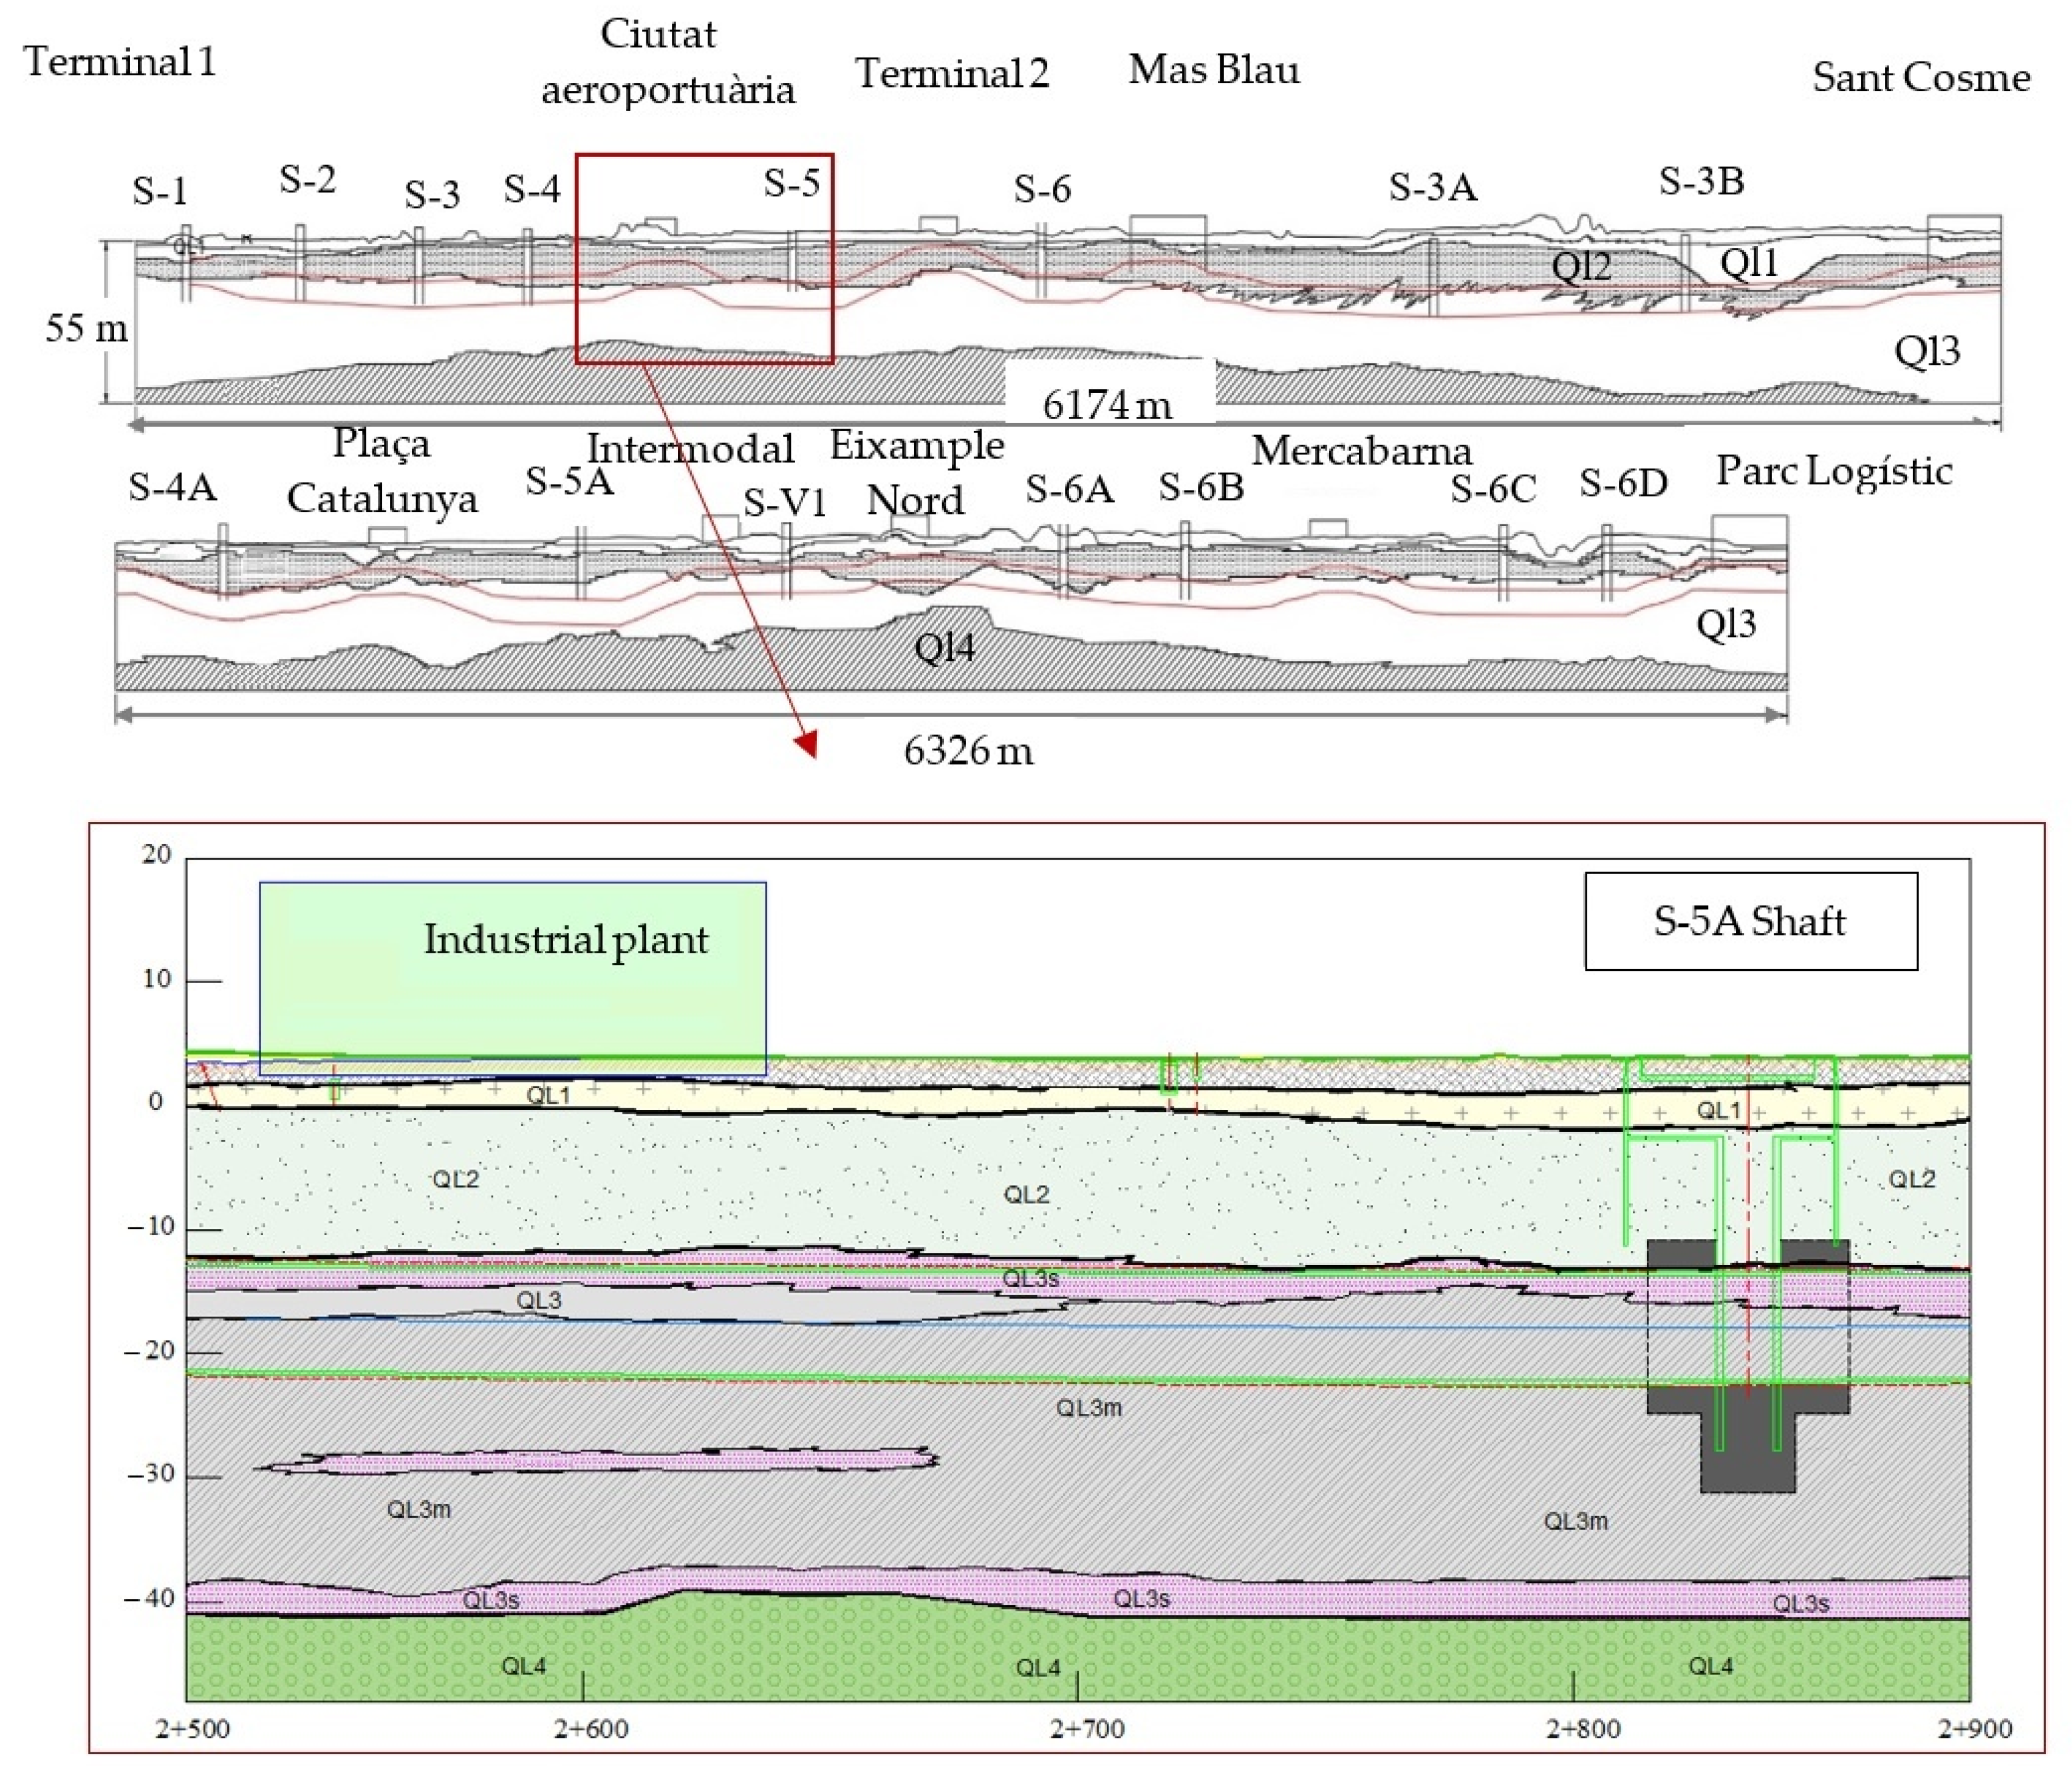
Actually, the subsurface conditions along Section 1 can be generally described as typical Holocene deltaic deposits that have been characterised by an extensive geotechnical investigation, which consisted of laboratory tests on the samples extracted by drilling. Indeed, the stratigraphy, which consists of several layers, is presented below and also in Figure 7.
To begin with, near Mas Blau station, the upper layer is found. It is formed by tilled soil (R) of variable thicknesses (0–3 m) overlain by a thin stratum of fine brown silt (Ql1) extending up to 2–5 m. Then, under the tilled soil, there are fine grey sands, with some gravel inclusions (Ql2) that constitute the upper aquifer, which, in turn, are underlain by a grey layer (Ql3) of a mixed composition consisting mainly of silty clays with some interbedded sands, sandy silts, clays, and silts. As a result, the Ql3 layer is the main soft deposit and reaches depths of approximately 50 m below ground level. It overlies the base gravels (Ql4) where a confined aquifer is found. Consequently, all these materials are of Quaternary age, and layers Ql2 to Ql4 belong to the deltaic deposits of the Llobregat River [11]. Moreover, the water table is almost horizontal, and it is located between 1 and 4 m deep in the layer Ql2 and belongs to the level of the first aquifer. Thus, the confined aquifer is found in both the layer Ql4 and at 6 m under the first level too. For this reason, the route of Line 9 mainly crosses the Ql3 layer except for the area where the stations are located. Hence, in these cases, the route crosses the Ql2 layer.
Evidently, the tunnel depth coverage is approximately between 5 and 16 m, with an average coverage/diameter ratio (C/D) of 1.7. However, around the stations, the ratio decreases, reaching a minimum value of 2.0 m, with a C/D of 0.21. In addition, Figure 7 shows the actual terminal station area.
Overall, the basic soil properties are summarised in Table 3.

4. In Situ Measurement Equipment

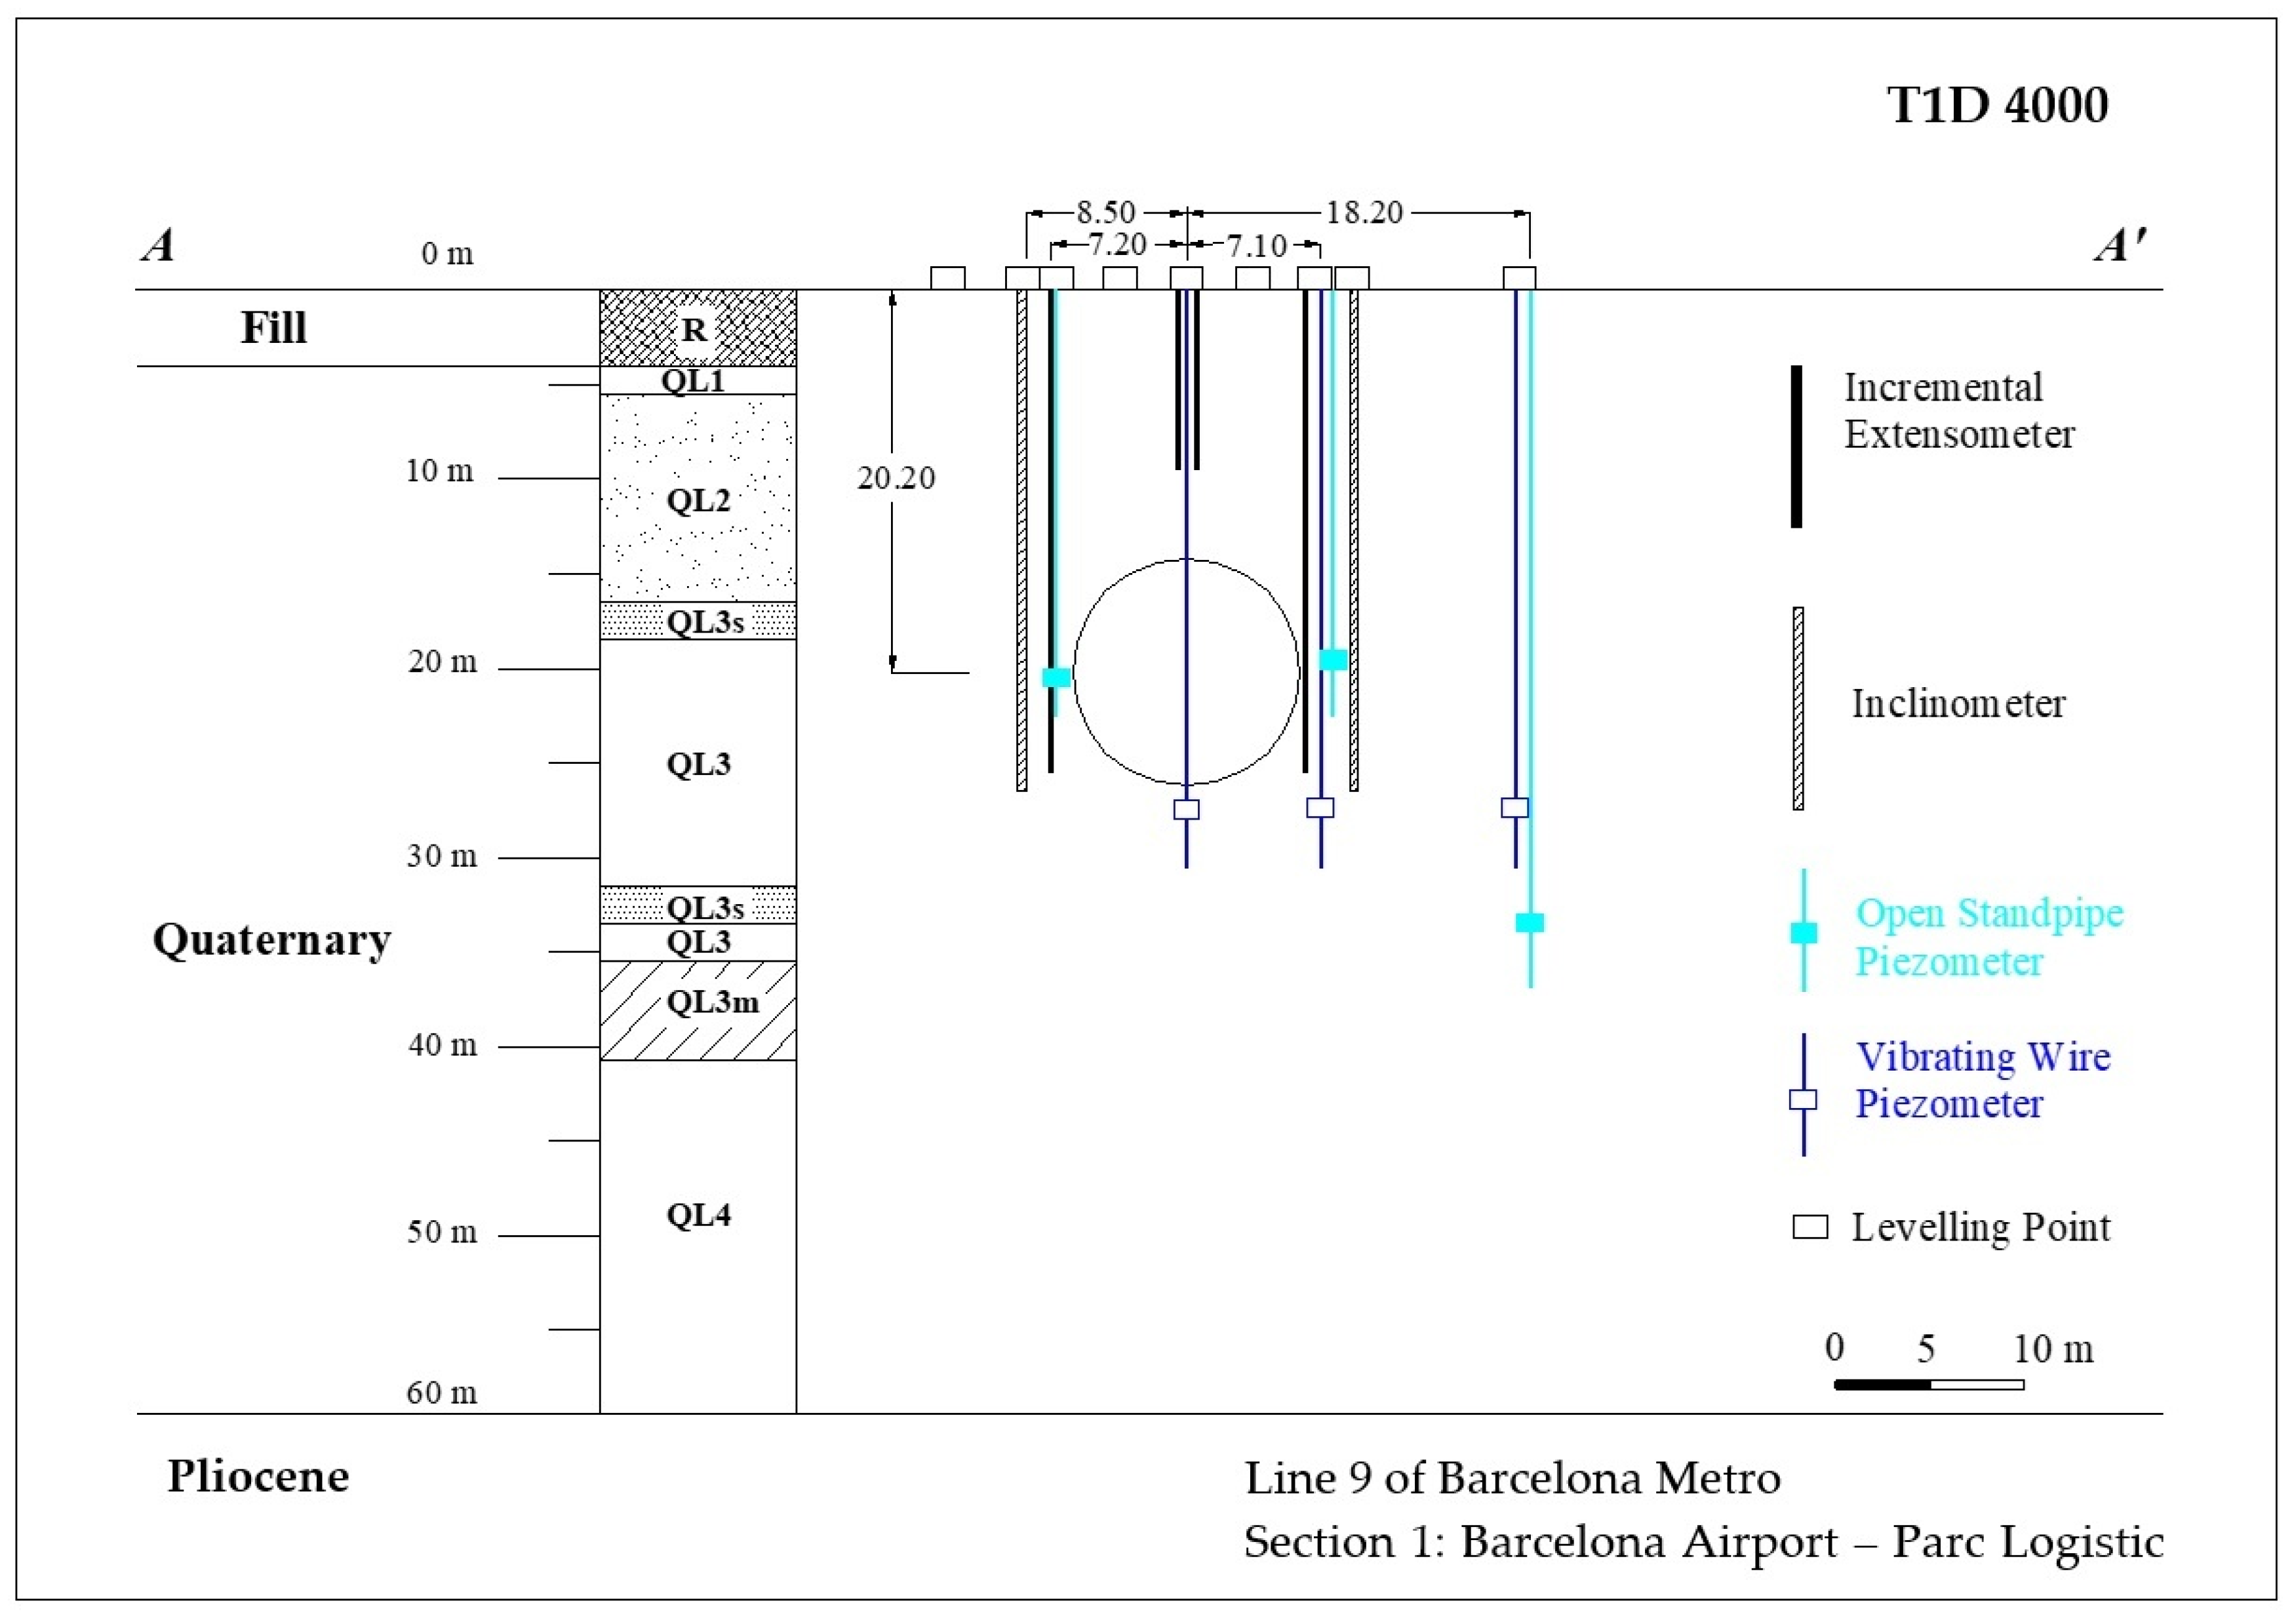
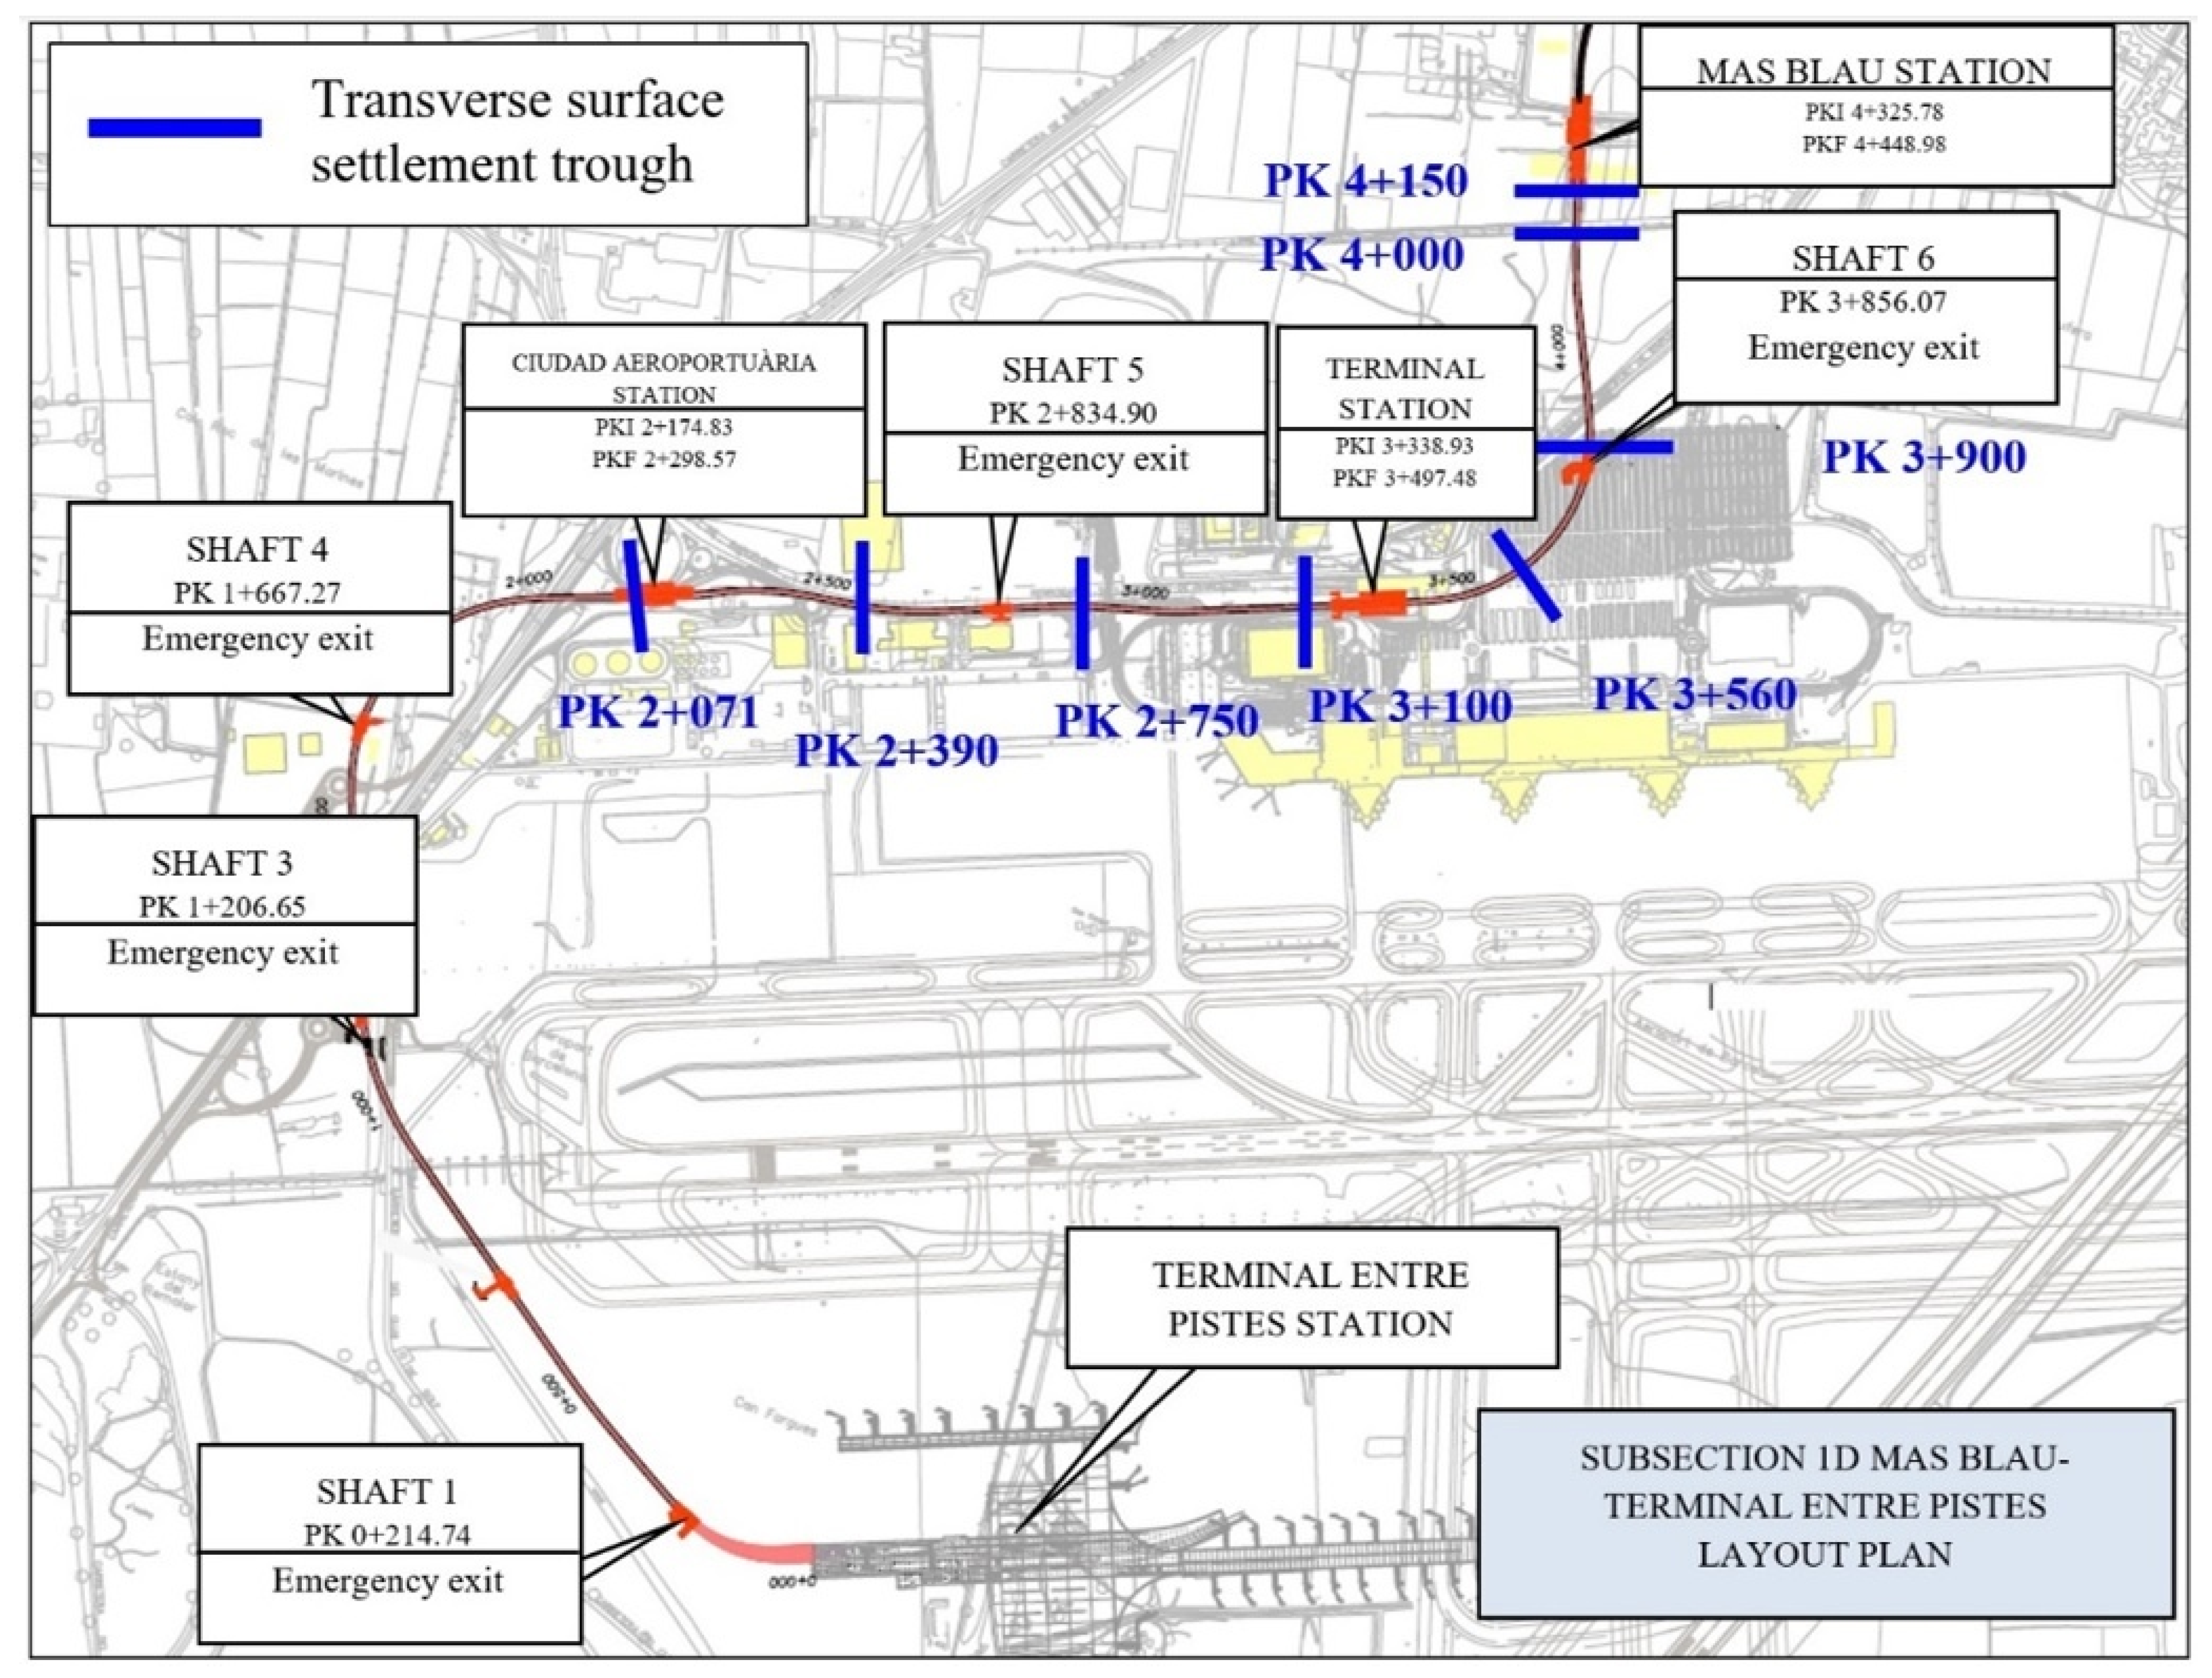
Evidently, vertical surface movements due to excavation were measured with extensive instrumentation along the Line 9 route [25]. So, to measure both the movements of nearby buildings and the surface and subsurface movements, as well as pore water pressures, instrumentation was set up. Furthermore, the longitudinal route and transverse sections of the tunnel had levelling points and automatic sensors installed to monitor surface movements. Additionally, forty-three instrumented reference sections were installed to monitor the surface/deep ground movements at sections in greenfield situations where there are no buildings nearby. Furthermore, the length of this section ranges from 80 m to 120 m. Figure 8 shows, as an example, the instrumented section at chainage 4000 m.
To give an example, Figure 8 exhibits the standard section at a chainage of 4000 m. Consequently, the following instrumentation is deployed: First, nine levelling points are implemented along the transverse section of the tunnel. The tunnel section is the second thing to consider. In the third place, there are three extensometers (left, right, and central). Fourth, two inclinometers (one on the left and one on the right) are applied. The fifth category includes four open standpipe piezometers and, finally, three vibrating mwire piezometers.
It is worth mentioning that in this article, only the ground movements collected using surface instrumentation (levelling points and automatic sensors) are considered. In a later article, the ground response will be analysed in depth.
Furthermore, the reading frequency of the monitoring instruments has been determined based on the type of instrument and the distance from the excavation face. Additionally, TBM excavation with EPB requires the definition of four reading interval zones: Zone A, Zone B, Zone C, and Zone D. Firstly, Zone A, the area before the TBM passage (approximately 300 to 100 m ahead of the TBM face), is where instrumentation readings must be taken daily for at least three days before the EPB passes through each section. Secondly, Zone B, the passage of the TBM through the instrumentation (from 100 m ahead to 200 m behind the TBM face), is where the area experiences the most significant movements. During the passage of the shield through the installed instrumentation, readings are taken daily, and once the EPB has passed, readings are taken every 3 to 6 days. Thirdly, Zone C refers to once the TBM has passed (between 200 and 400 m behind the excavation face). In this case, the reading frequency is variable. Additionally, the instrumentation was read daily in areas with surface buildings or airport facilities. Lastly, Zone D, which is beyond 400 m, is the area is considered sufficiently distant from the influence zone, where the ground is assumed to have stabilised.
Additionally, the water table control was monitored twice weekly. However, after one month, the readings were reduced to once a week. Subsequently, after two months, a new reading was taken to verify if the level remained consistent. Two weekly readings were conducted until it was confirmed that the levels were stable.

5. Results of Surface Control and Discussions

5.1. Vertical Displacements Parallel to the Tunnel Axis

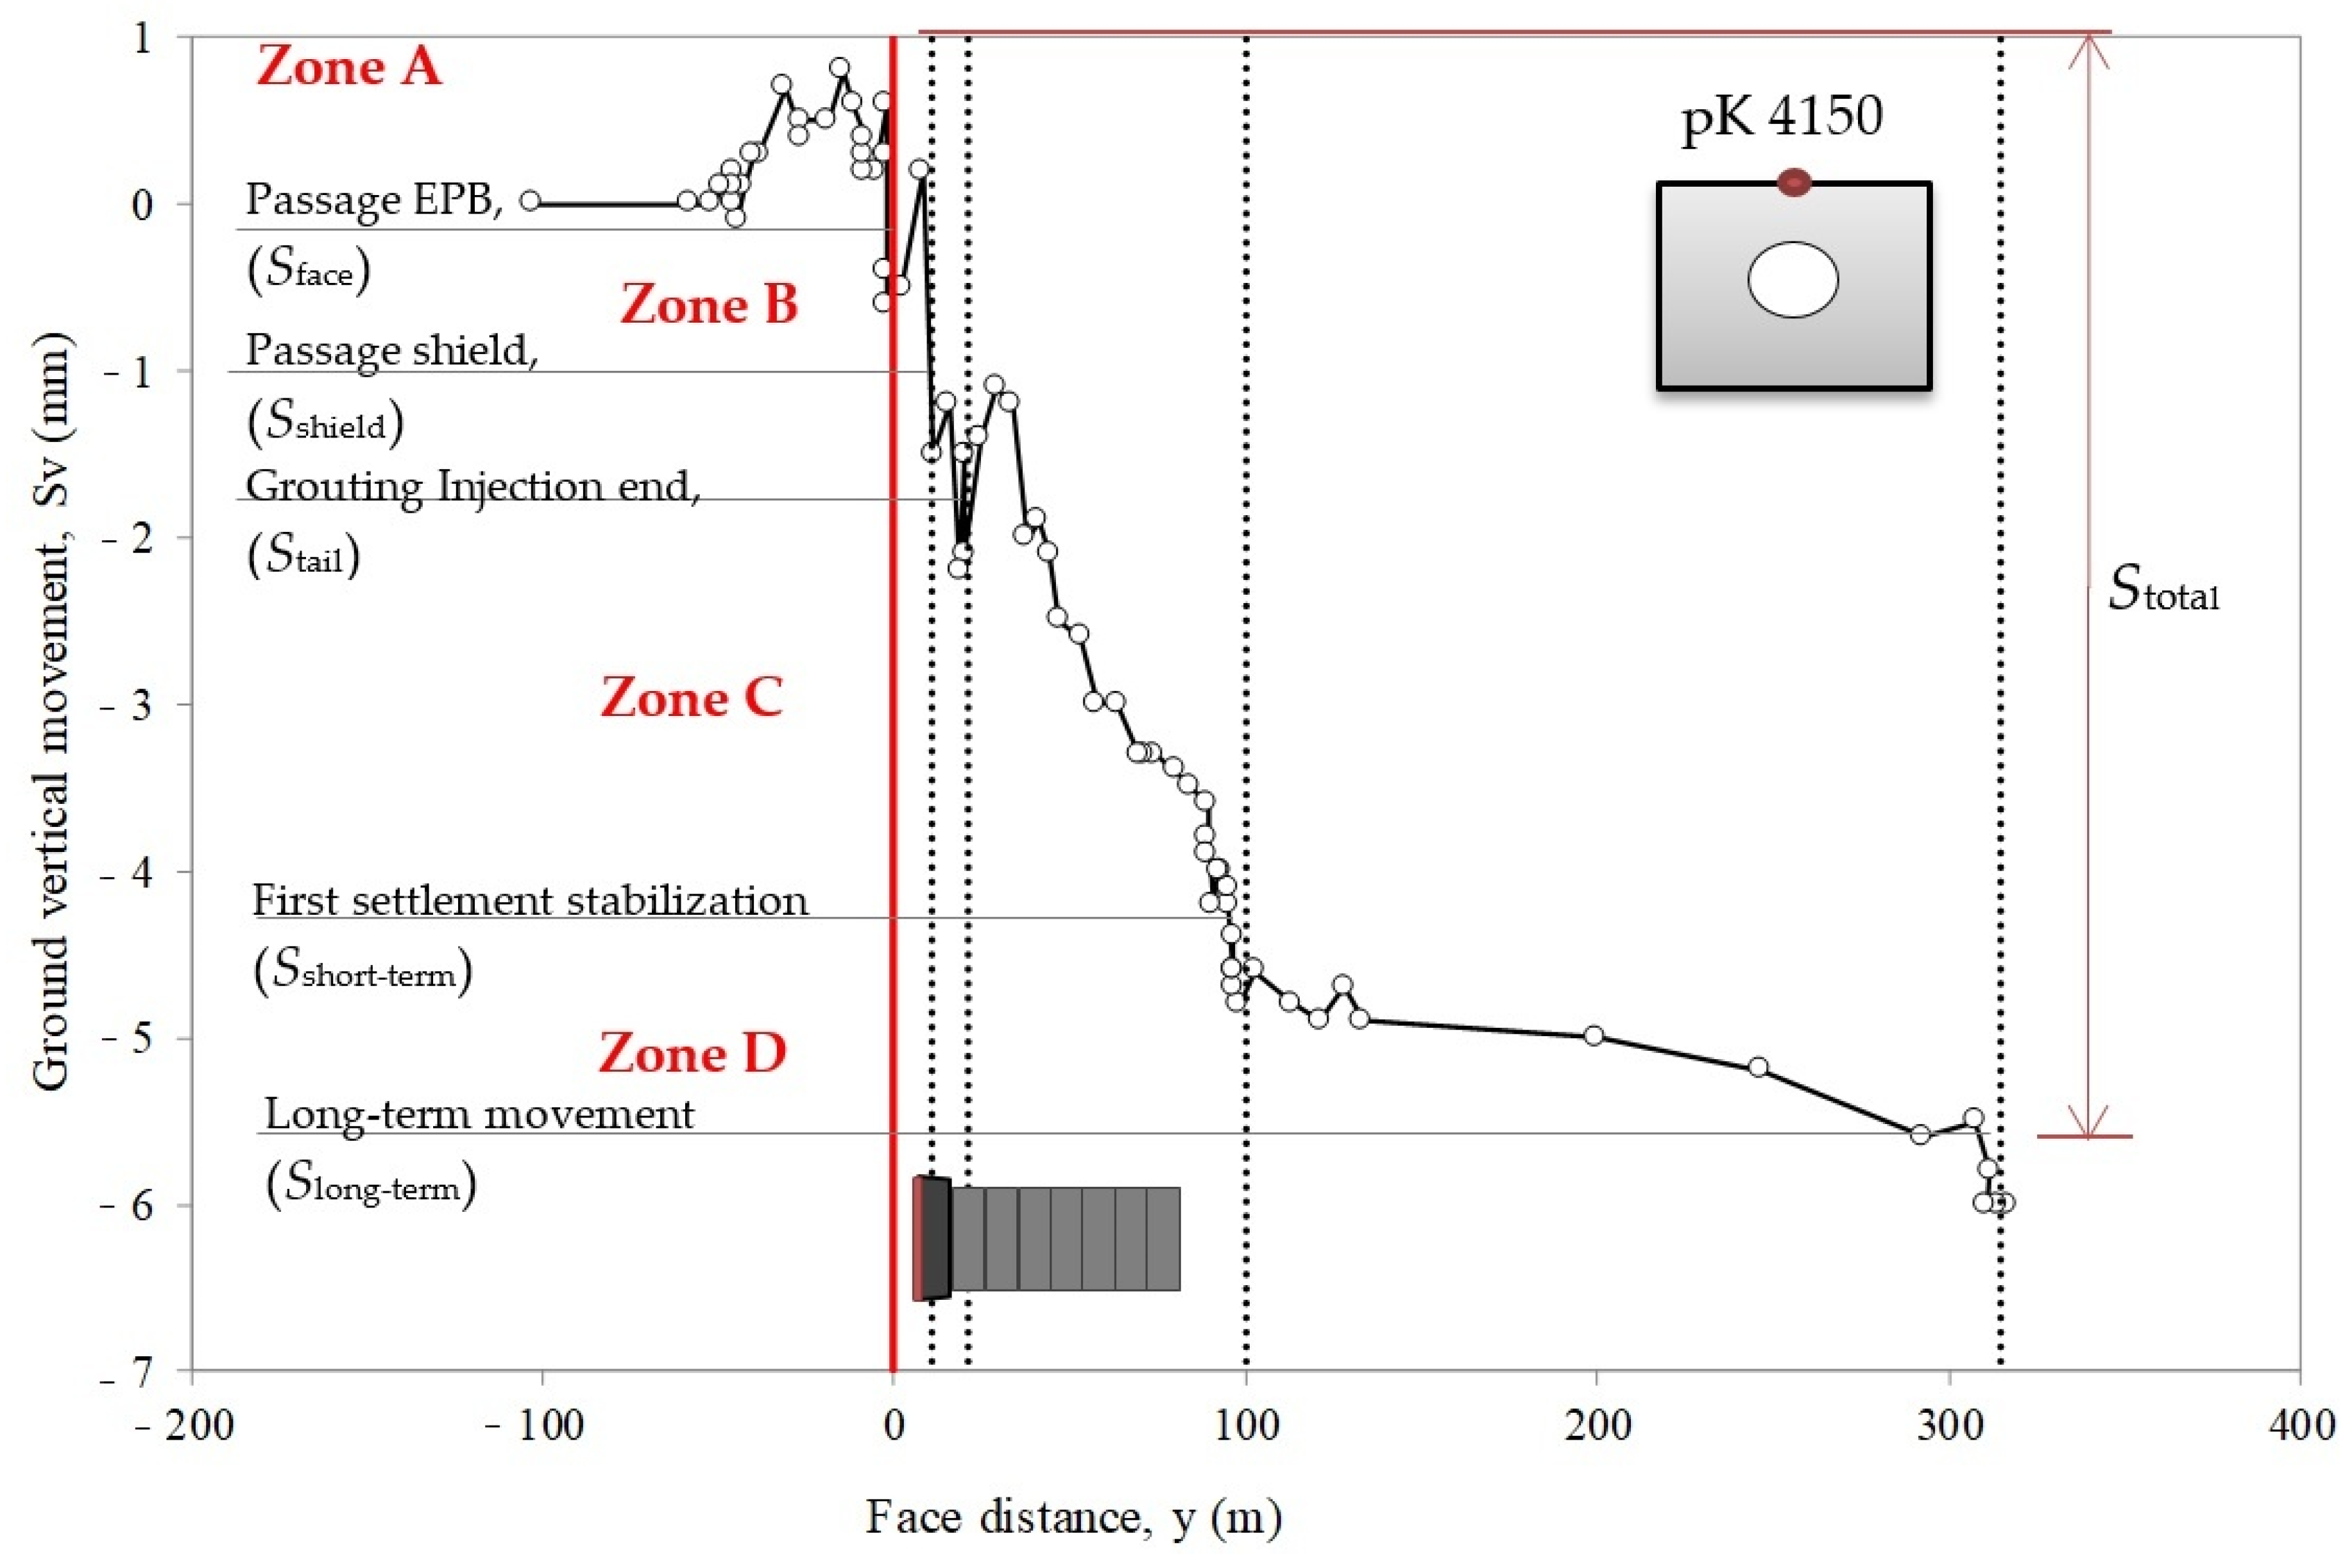
The main sources of settlement associated with EPB tunnelling are usually associated with (1) stress relief at the face, (2) the overcutting edge around the shield, (3) the closure of the tail void behind the shield, (4) lining deflection, and (5) the consolidation of the ground around the tunnel [1,14,16,17,37,45]. Five settlement components have been defined based on ground movements: firstly, the vertical ground movement at the face excavation (Sface); secondly, the settlement around the shield due to the shield passage (Sshield); thirdly, the settlement component due to the closure of the tail gap behind the shield and possible deflection of the lining (Stail); fourthly, the vertical stabilisation ground movements, which occurred at the first settlement and are defined as short term (Sshort-term); and fifthly, the settlement that occurs due to long-term consolidation processes (Slong-term). Moreover, the total settlement (Stotal) has been defined as the sum of the five previous components.
A clear example of the above data is shown in Figure 9 and Figure 10, which show the variation of vertical ground movement with the distance from the tunnel face at a chainage of 4150.
Thus, the movements have been monitored through a surface levelling point installed over the crown of the tunnel. Although the scale of the operation is very small, it is sufficient to determine the individual reactions of the EPB tunnelling process. The operations were therefore monitored from a surface-level point over the crown of the tunnel.
Furthermore, ground displacements start when the EPB machine approaches the area 50 m in front of the monitoring area. Occasionally, the arrival of the EPB faces causes a small surge of less than 3.2 mm. Furthermore, in this case, the movement at the tunnel face (Sface) is less than 2 mm (Figure 10), which represents approximately 10% of the total settlement; it is a lower value than the 25% in the London Jubilee Line layout [1].
Overall, the Sface-to-Stotal ratio in the route of Section 1 of Line 9 is quite low and often less than 10%. In addition, the vertical displacement due to the passage of the shield (Sshield) and the back passage of the Stail is only 1 mm and 0.6 mm, respectively, at a chainage of 4150 (Figure 10). Hence, the proportion of the shield with respect to Stotal will vary significantly along the route depending on several factors, such as the type of material being excavated, the effectiveness of the injection of bentonite, and the rate of advance of the EPB. In that case, we observed that while the shield is over the section (Sshield) and above 10 to 20 m after the passage of the EPB by the monitored section (Stail), the settlements lessen and can only be fixed in the case of injecting bentonite around the shield and grout in the back of the shield.
In any case, the largest proportion of settlement corresponds to the closure of the tail void and the deflection of the lining, until the first settlement stabilisation occurred (Sshort-term), specifically, once 100 to 150 m achieved passage of the EPB. Additionally, in the chainage 4150, the settlement that represents the short-term value was 2.7 mm. From the 107 sections studied, this settlement reaches, in some cases, 80% of the total settlement, which is slightly higher than the values of 40–50% proposed by Wongsaroj [17]. Therefore, settlement due to long-term consolidation processes (Slong-term) occurs between 300 and 500 m after the passage of the EPB by the monitored section and represents 1.2 mm at 4150, as illustrated in Figure 10.

5.2. Volume Loss

Additionally, the information on the settlement troughs is obtained from the instrumented sections, which are perpendicular to the layout of Section 1 of L9. For vertical movement, we consider ground uplift, positive values of vertical movement (+) and ground settlement, and negative values of vertical movement (−).
To begin with, the shape of the vertical displacement profile can be reasonably approximated using the Gaussian distribution curve proposed by Peck [22] with the following equation:
S v x = S v m a x · e x p x 2 2 i 2
Hence, in this equation, Sv is the vertical settlement of a point located at a horizontal distance x. Smax represents the maximum vertical settlement above the tunnel axis, and (i) is the distance of the curve inflection point with respect to the tunnel axis.
Meanwhile, the settlement caused by tunnelling is usually characterised by volume loss or soil loss (Vloss), which is the volume Vs expressed as a percentage of the theoretical excavated volume of the tunnel, and D is the tunnel diameter:
V l o s s = V S π · D 2 4
Hence, O’Reilly and New [46] showed that the trough width parameter at the surface level (i) can be estimated with the following expression:
i = K · z 0
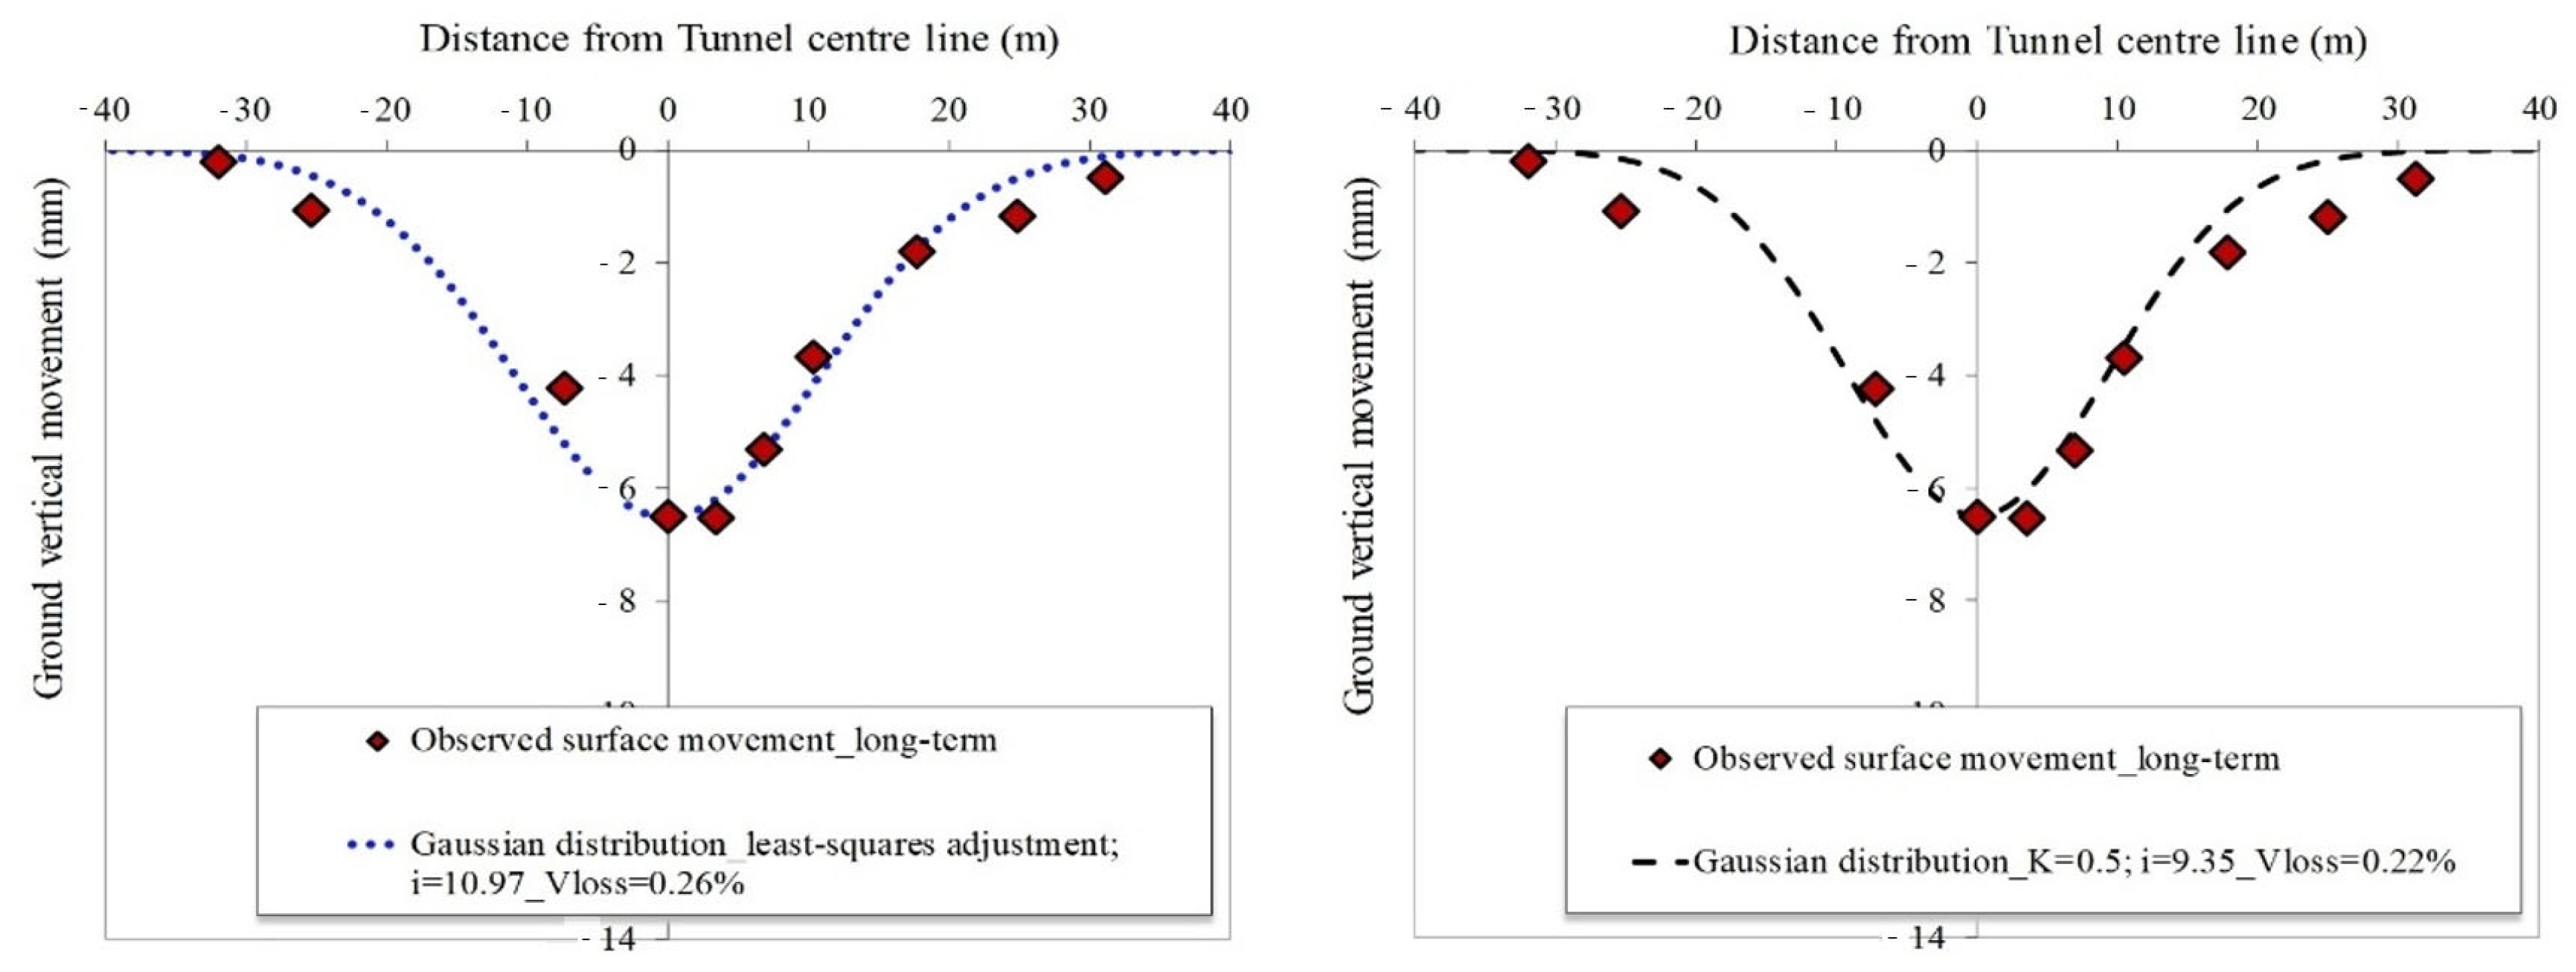
Subsequently, in this expression, where the parameter K depends on the soil type and z0 is the depth of the tunnel axis, the parameter (i) has been fitted using least squares and considering K = 0.5 as far as possible to the surface soil movements collected via auscultation in 43 settlement trough profiles. Clearly, the adjustment gives a real value of the parameter K, which depends on the type of soil and on the real value of the volume loss.
From the adjusted parameter (i) and from the maximum settlement recorded by the installed monitoring data at the time considered in the short term (Svmax) and in the long term (Svmax), we obtain the loss of soil volume or volume loss according to Equation (2). Of course, the loss of soil volume, in this case, will be calculated from the (i) estimated in the adjustment, so that the real volume loss will be obtained.
Evidently, a second adjustment method had been used. To illustrate this, a value of K = 0.5 has been thoroughly considered. In the case of cohesive materials and conditions of deformation at a constant volume and also following the indications of O’Reilly and New [46], the value of K acquires rates close to K ≈ 0.5. Concerning the studied Section 1 of Line 9, it runs mainly under clayey material, so it is pondered that the value of K = 0.5 can be a good reference rate for the calculation of the parameter “i”, which is the width of the settlement trough.
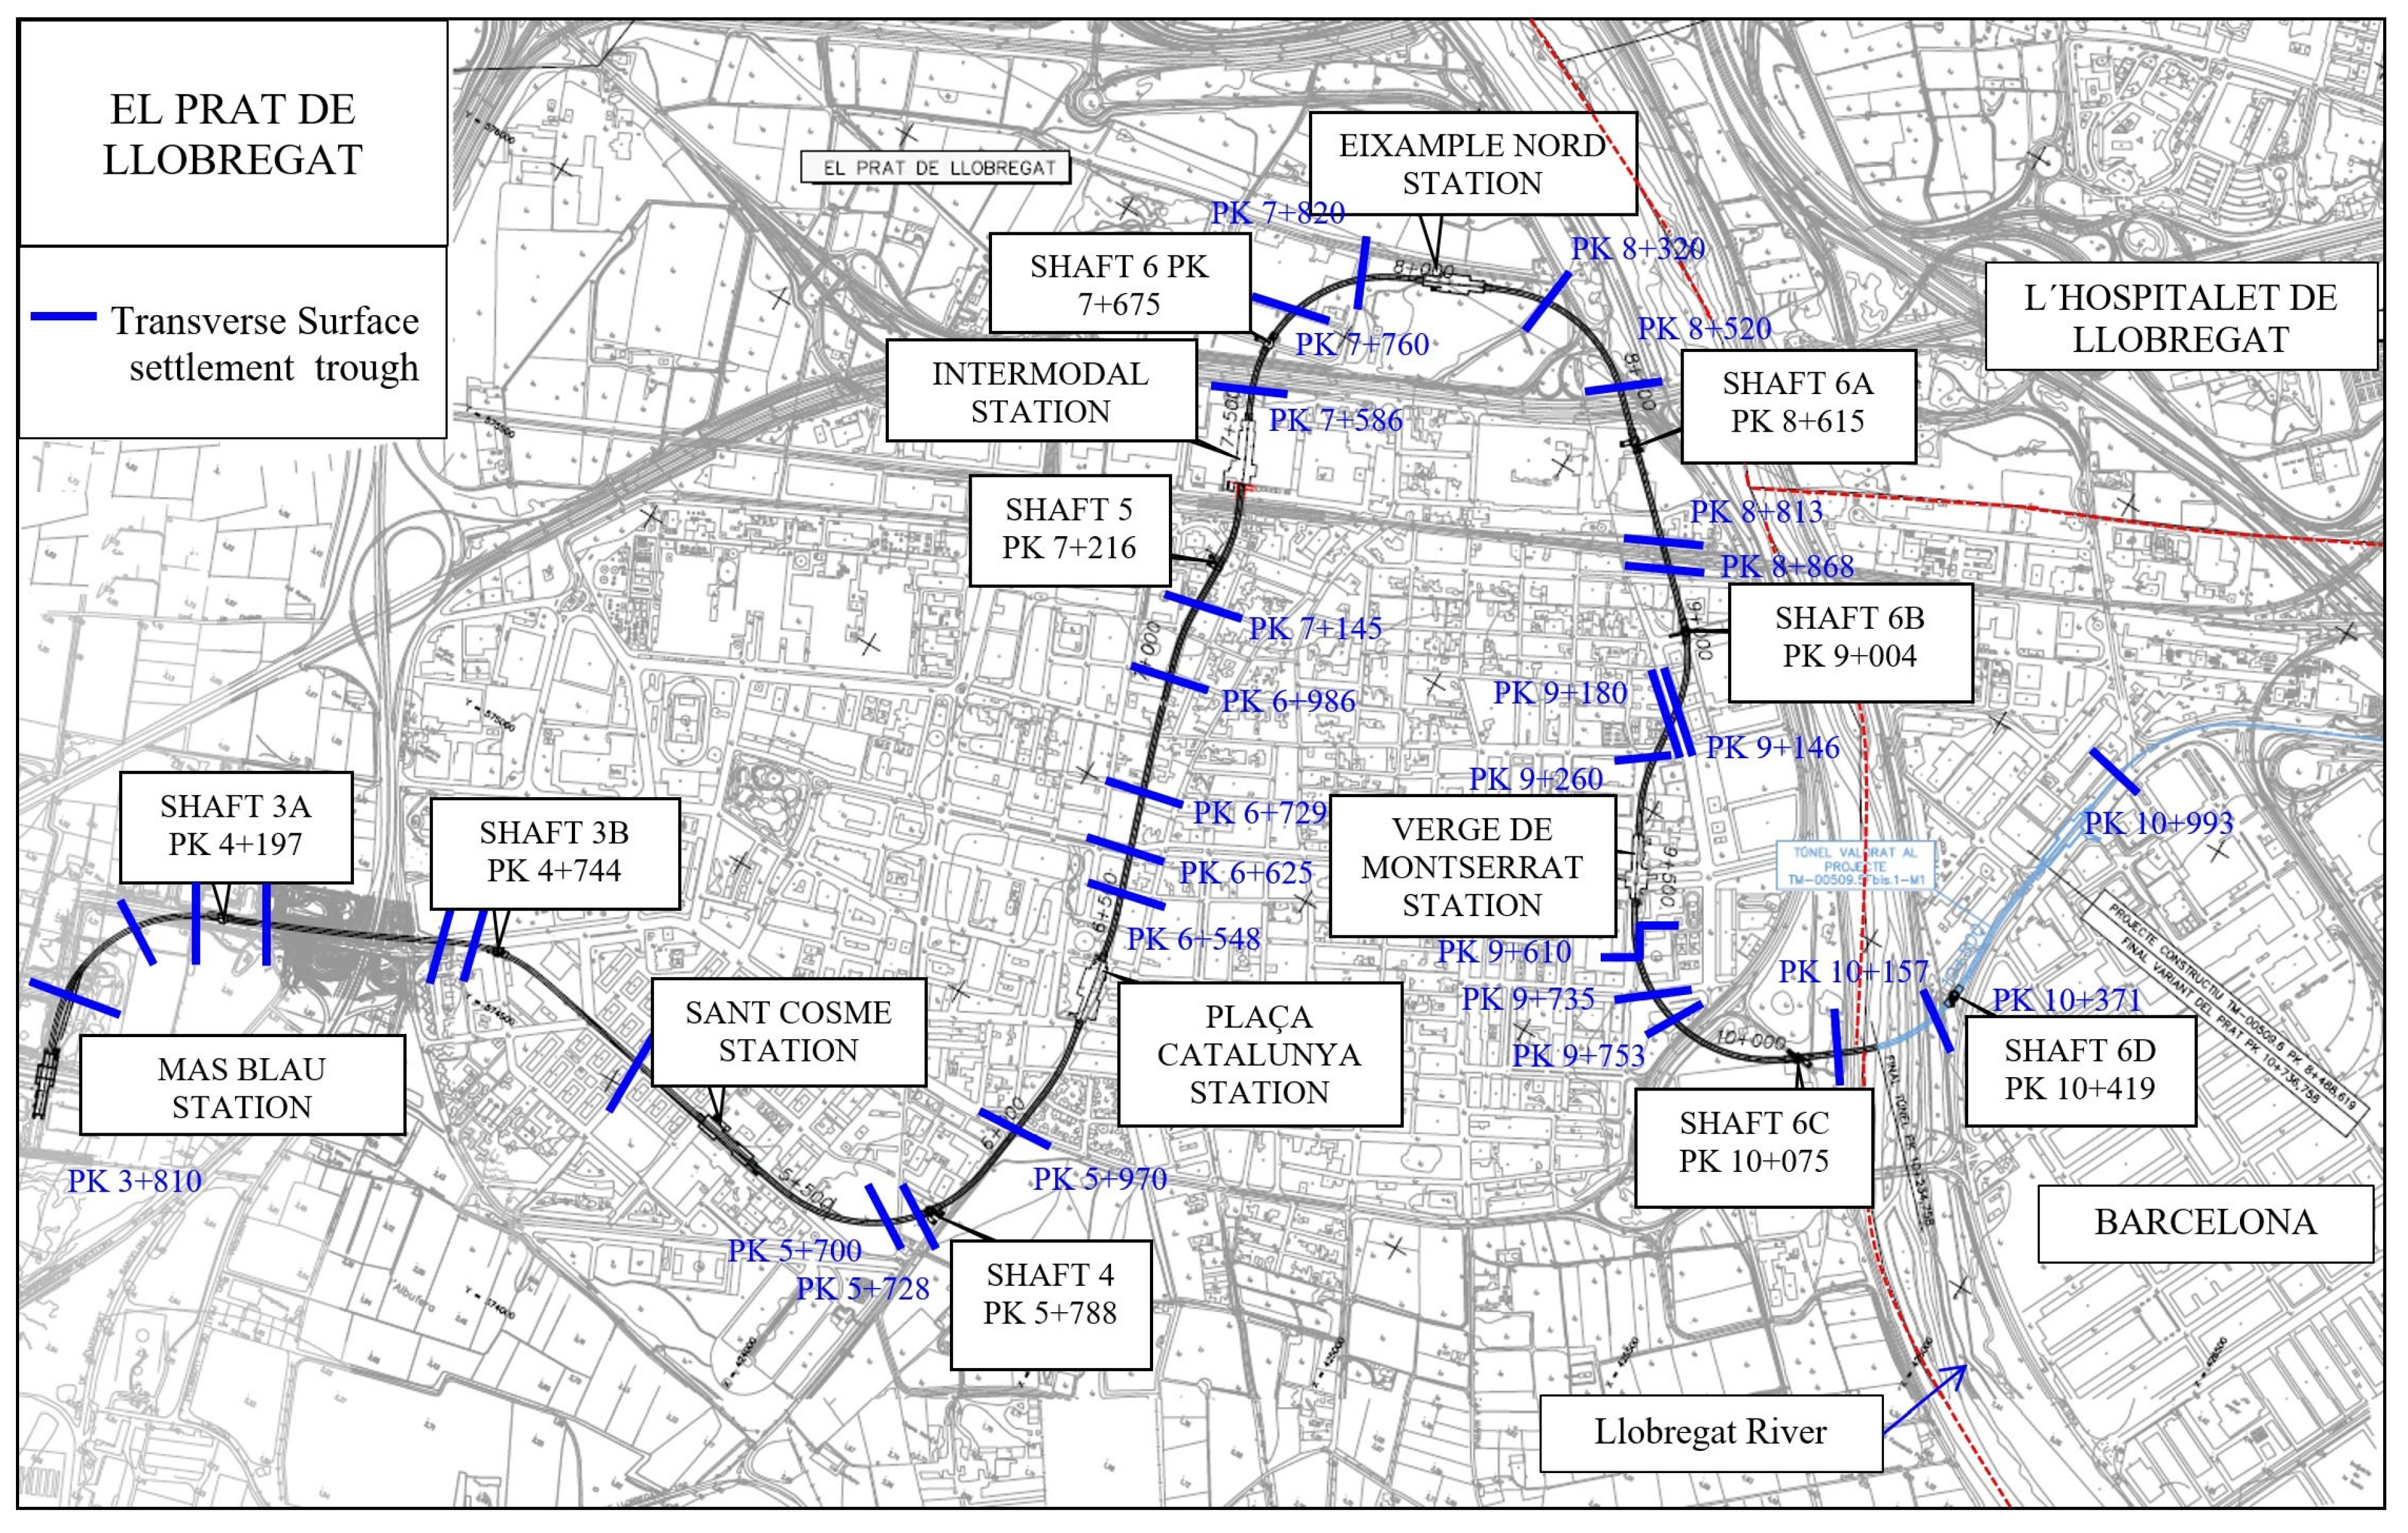
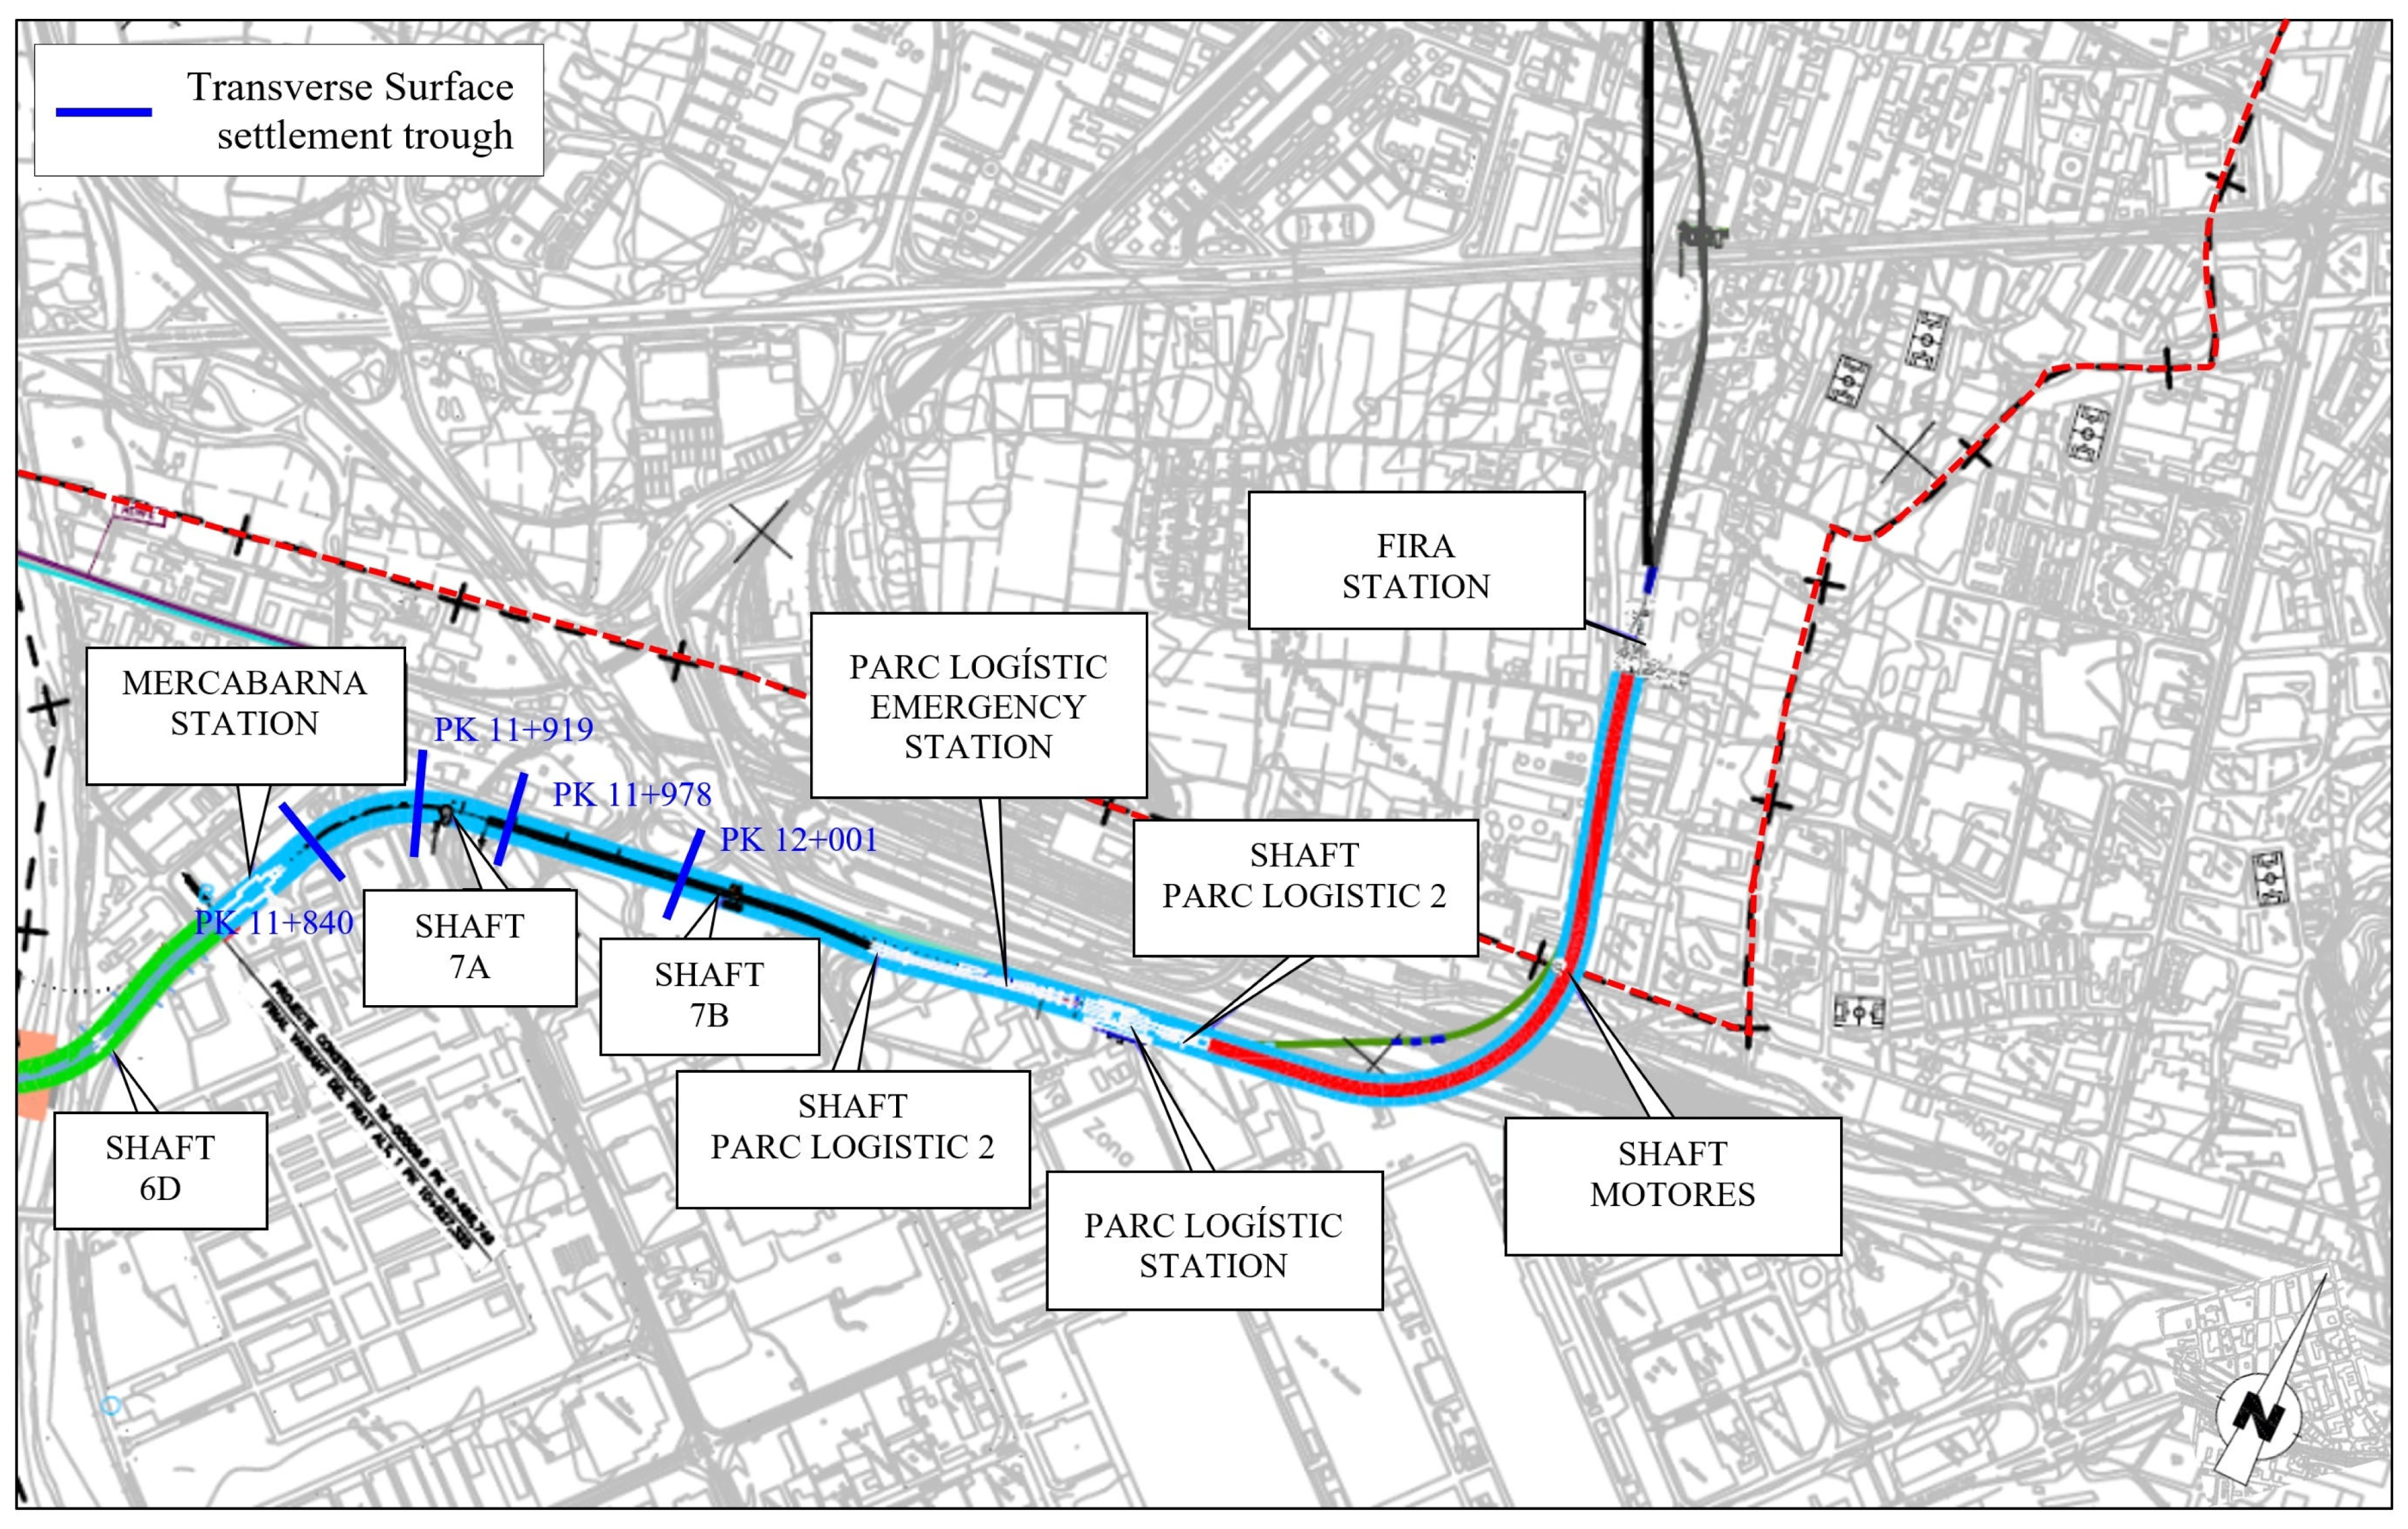
Indeed, this second adjustment method has given us an adjusted (i). Considering this, using Equation (3), we obtain a value for the real K of the surface soil in addition to the method using K = 0.5, where we impose the value of the K parameter. Figure 11, Figure 12 and Figure 13 demonstrate the situation of the 43 settlement trough profiles studied for the three adjustment methods considered.

5.3. Vertical Displacements Perpendicular to the Tunnel Axis

In fact, the study was carried out using 43 surface settlement troughs perpendicular to the tunnel route along the entire length of Section 1. Furthermore, these sections are mostly in greenfield situations, and they are approximately 80 m to 120 m long. To show this, there is a section between Plaza Catalunya and Verge de Montserrat stations (Figure 12) where the tunnel crosses an urban area. In this area, the crossing of streets and non-travelled areas has been employed to place the instrumentation. Thus, the settlements studied have been the ones that occur up to the first stabilisation, and they have been named the short-term settlement (Sshort-term) and long-term settlement (Slong-term). In the long-term settlement, the movement of the soil is already completely stabilised, and the consolidation process (Slong-term) is considered. Clearly, Figure 11, Figure 12 and Figure 13 illustrate the position of the 43 surface settlement trough profiles studied.
Therefore, for the adjustment of these settlements, both in the short and long terms, the Gaussian curve has been applied using the adjustments described in Section 5.1. This results in an adjustment using least squares and considering a K = 0.5. To show this, in Figure 14 and Figure 15, for the field data of a surface settling trough with short- and long-term settlements, the Gaussian curve is adjusted using the two proposed methods. Additionally, the maximum settlements recorded were always below the centreline of the tunnel axis as the EPB proceeded.
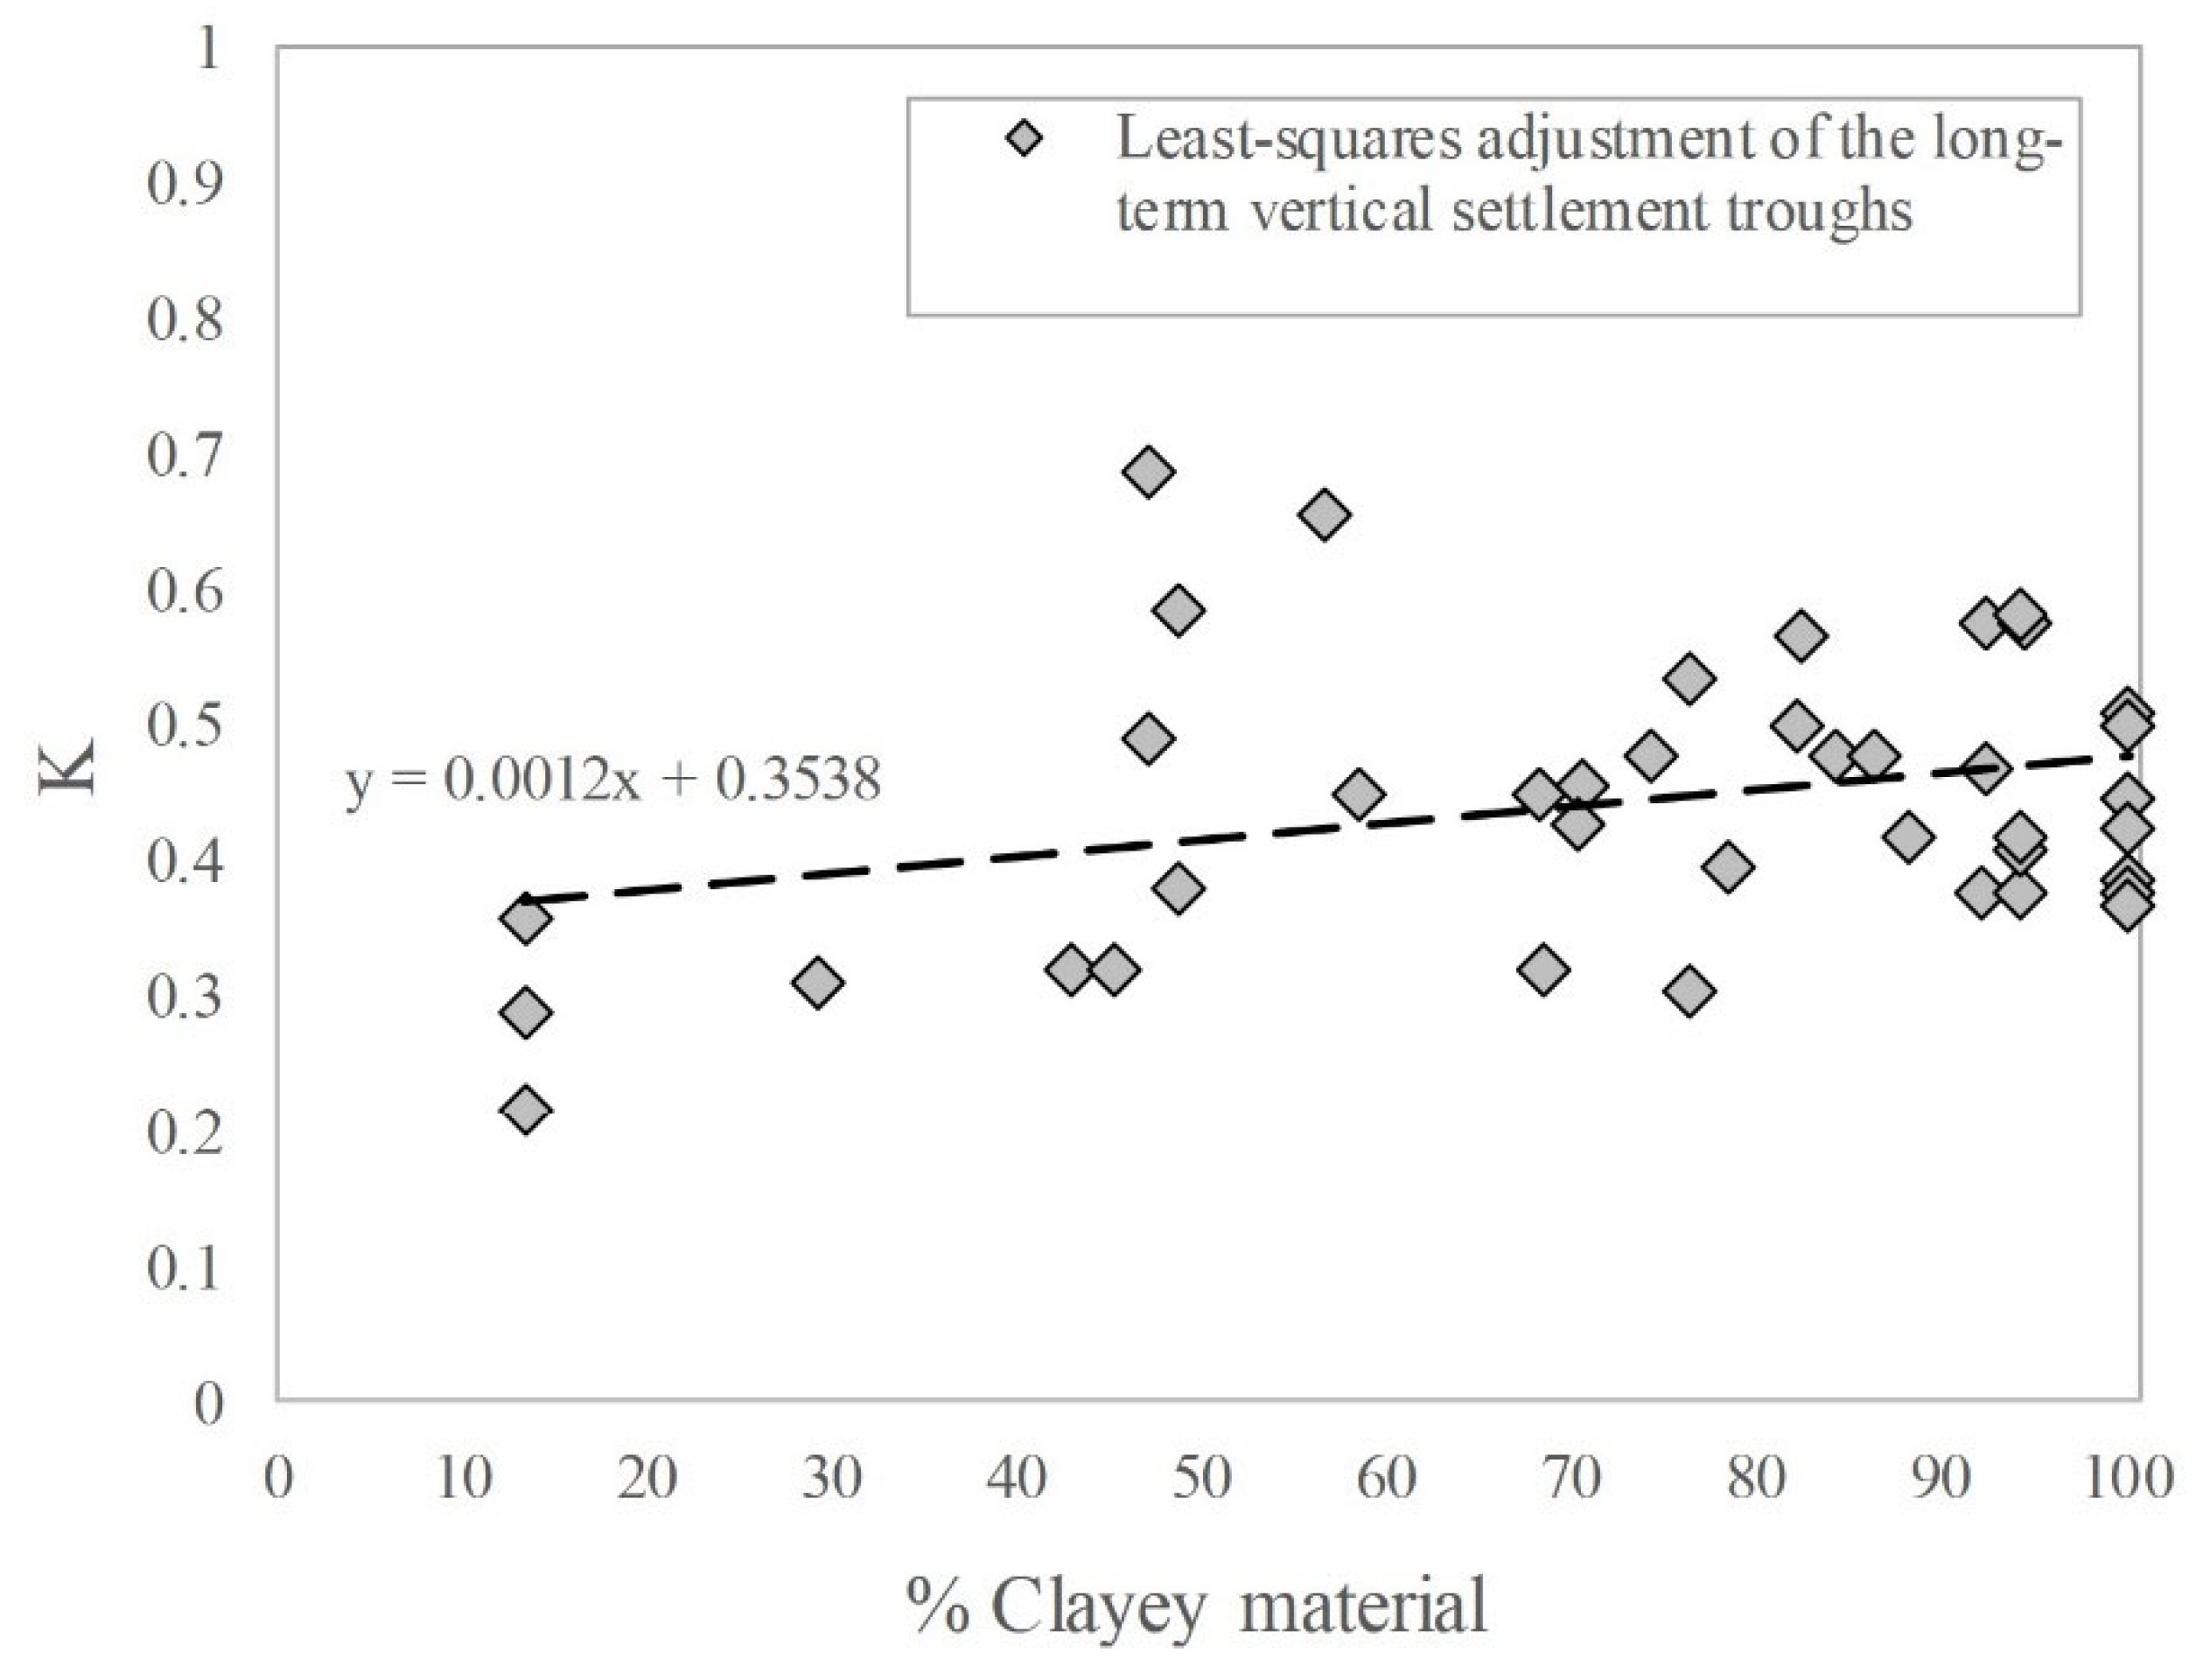
Additionally, once the 43 short- and long-term settlement trough profiles were analysed, it was observed that the range of values of the Kreal parameter, extracted from the least-squares adjustment, oscillates between 0.30 and 0.58. In some cases, it was found that where sandier materials predominate, for instance, the thickness of the Ql2 layer is larger (see Section 3). Moreover, the value of K is somewhat lower than K = 0.5. Additionally, in sections where more clayey materials predominate (Ql3, see Section 3), the value of K is very close to K = 0.5 or slightly higher.
Clearly, the loss of ground volume, which was calculated from the K fitted using least squares and considering a K = 0.5, for the case of the trough Pk 4150 shown with short-term settlements was Vloss = 0.20% and Vloss = 0.20%, respectively, and Vloss = 0.26% and Vloss = 0.22% for the case of considering long-term movements.
Thus, once we analysed all the settlement troughs, we saw that the two proposed settings led to a sufficiently approximated solution.
Overall, the least-squares adjustment is, in most cases, the best option to fit the Gaussian curve to ground data due to its ease of implementation. However, a notable issue arises when no data are available at the centre of the excavation. While it is possible to adjust both parameters of the curve (Svmáx and the parameter i), the accuracy of the fit is worse with two unknown variables than with one variable. Consequently, in our case, we have, as in most cases, maximum settlements below the centre line of the tunnel axis. Furthermore, we also compared it with other methods such as non-linear regression, logarithmic adjustment, or the consideration of a K = 0.5, and all three methods led to sufficiently approximated solutions. Evidently, due to its simplicity, we consider that it is the best option to fit the Gaussian curve to the terrain data.
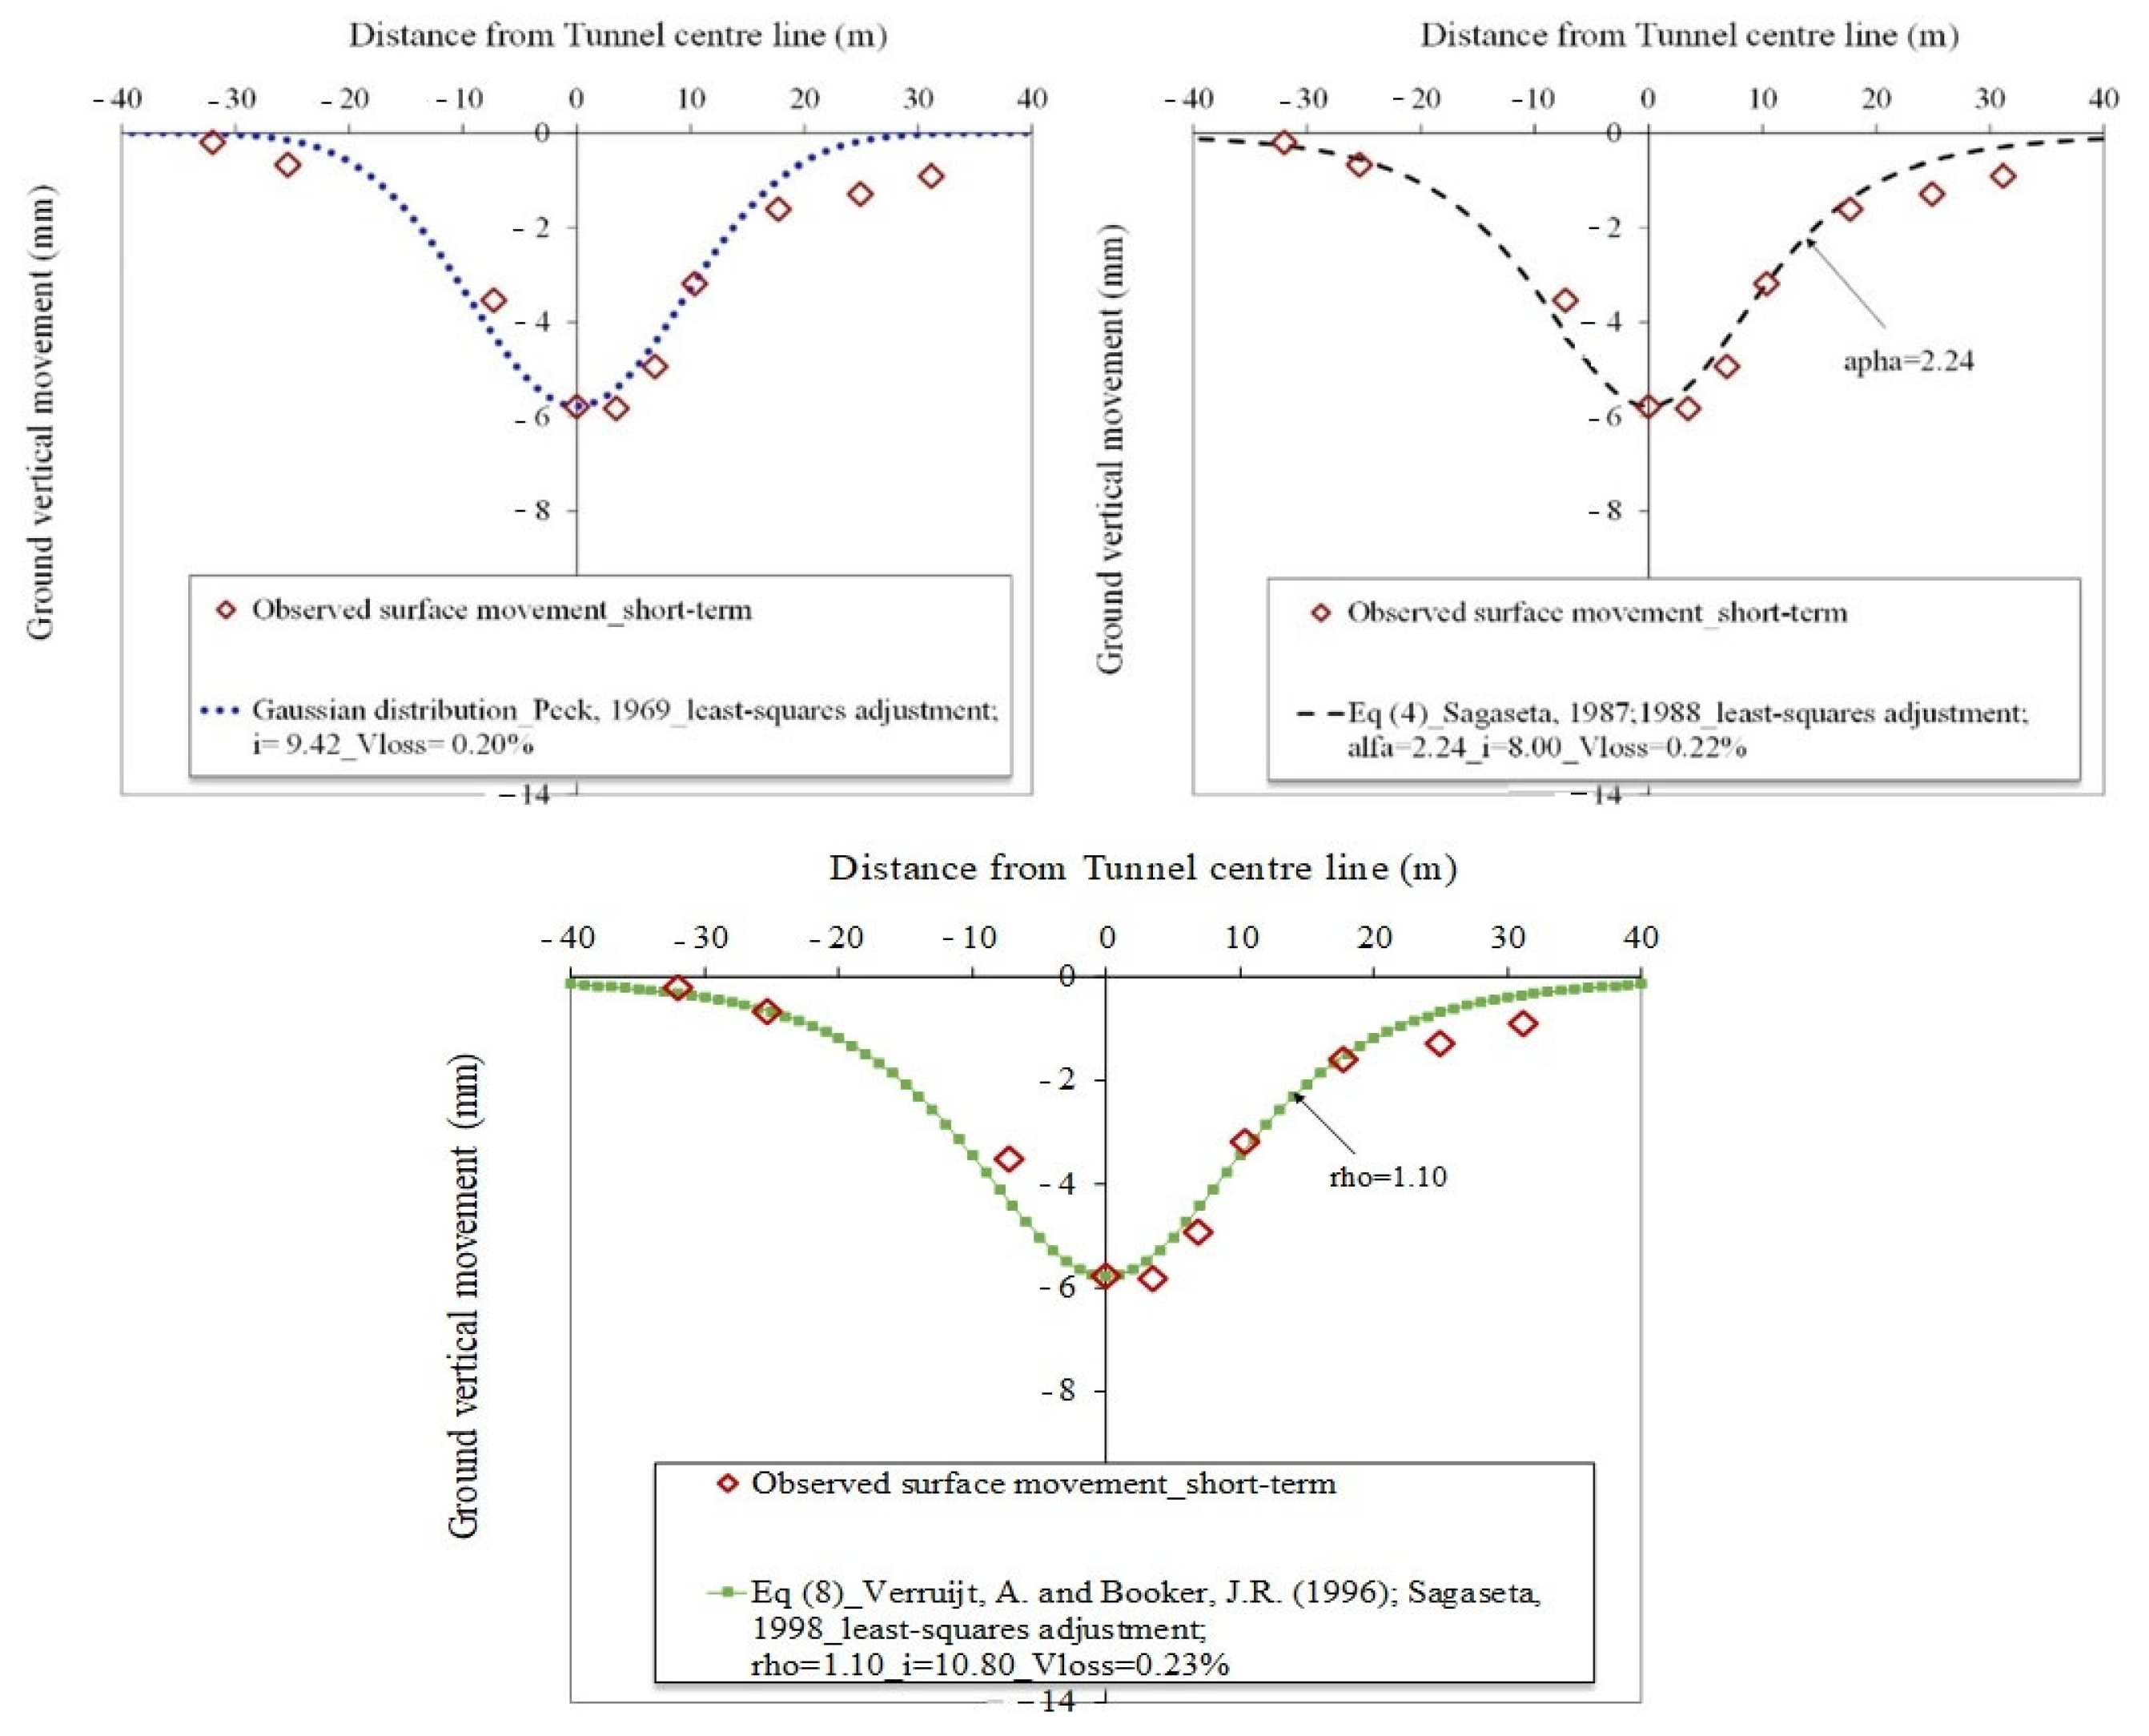
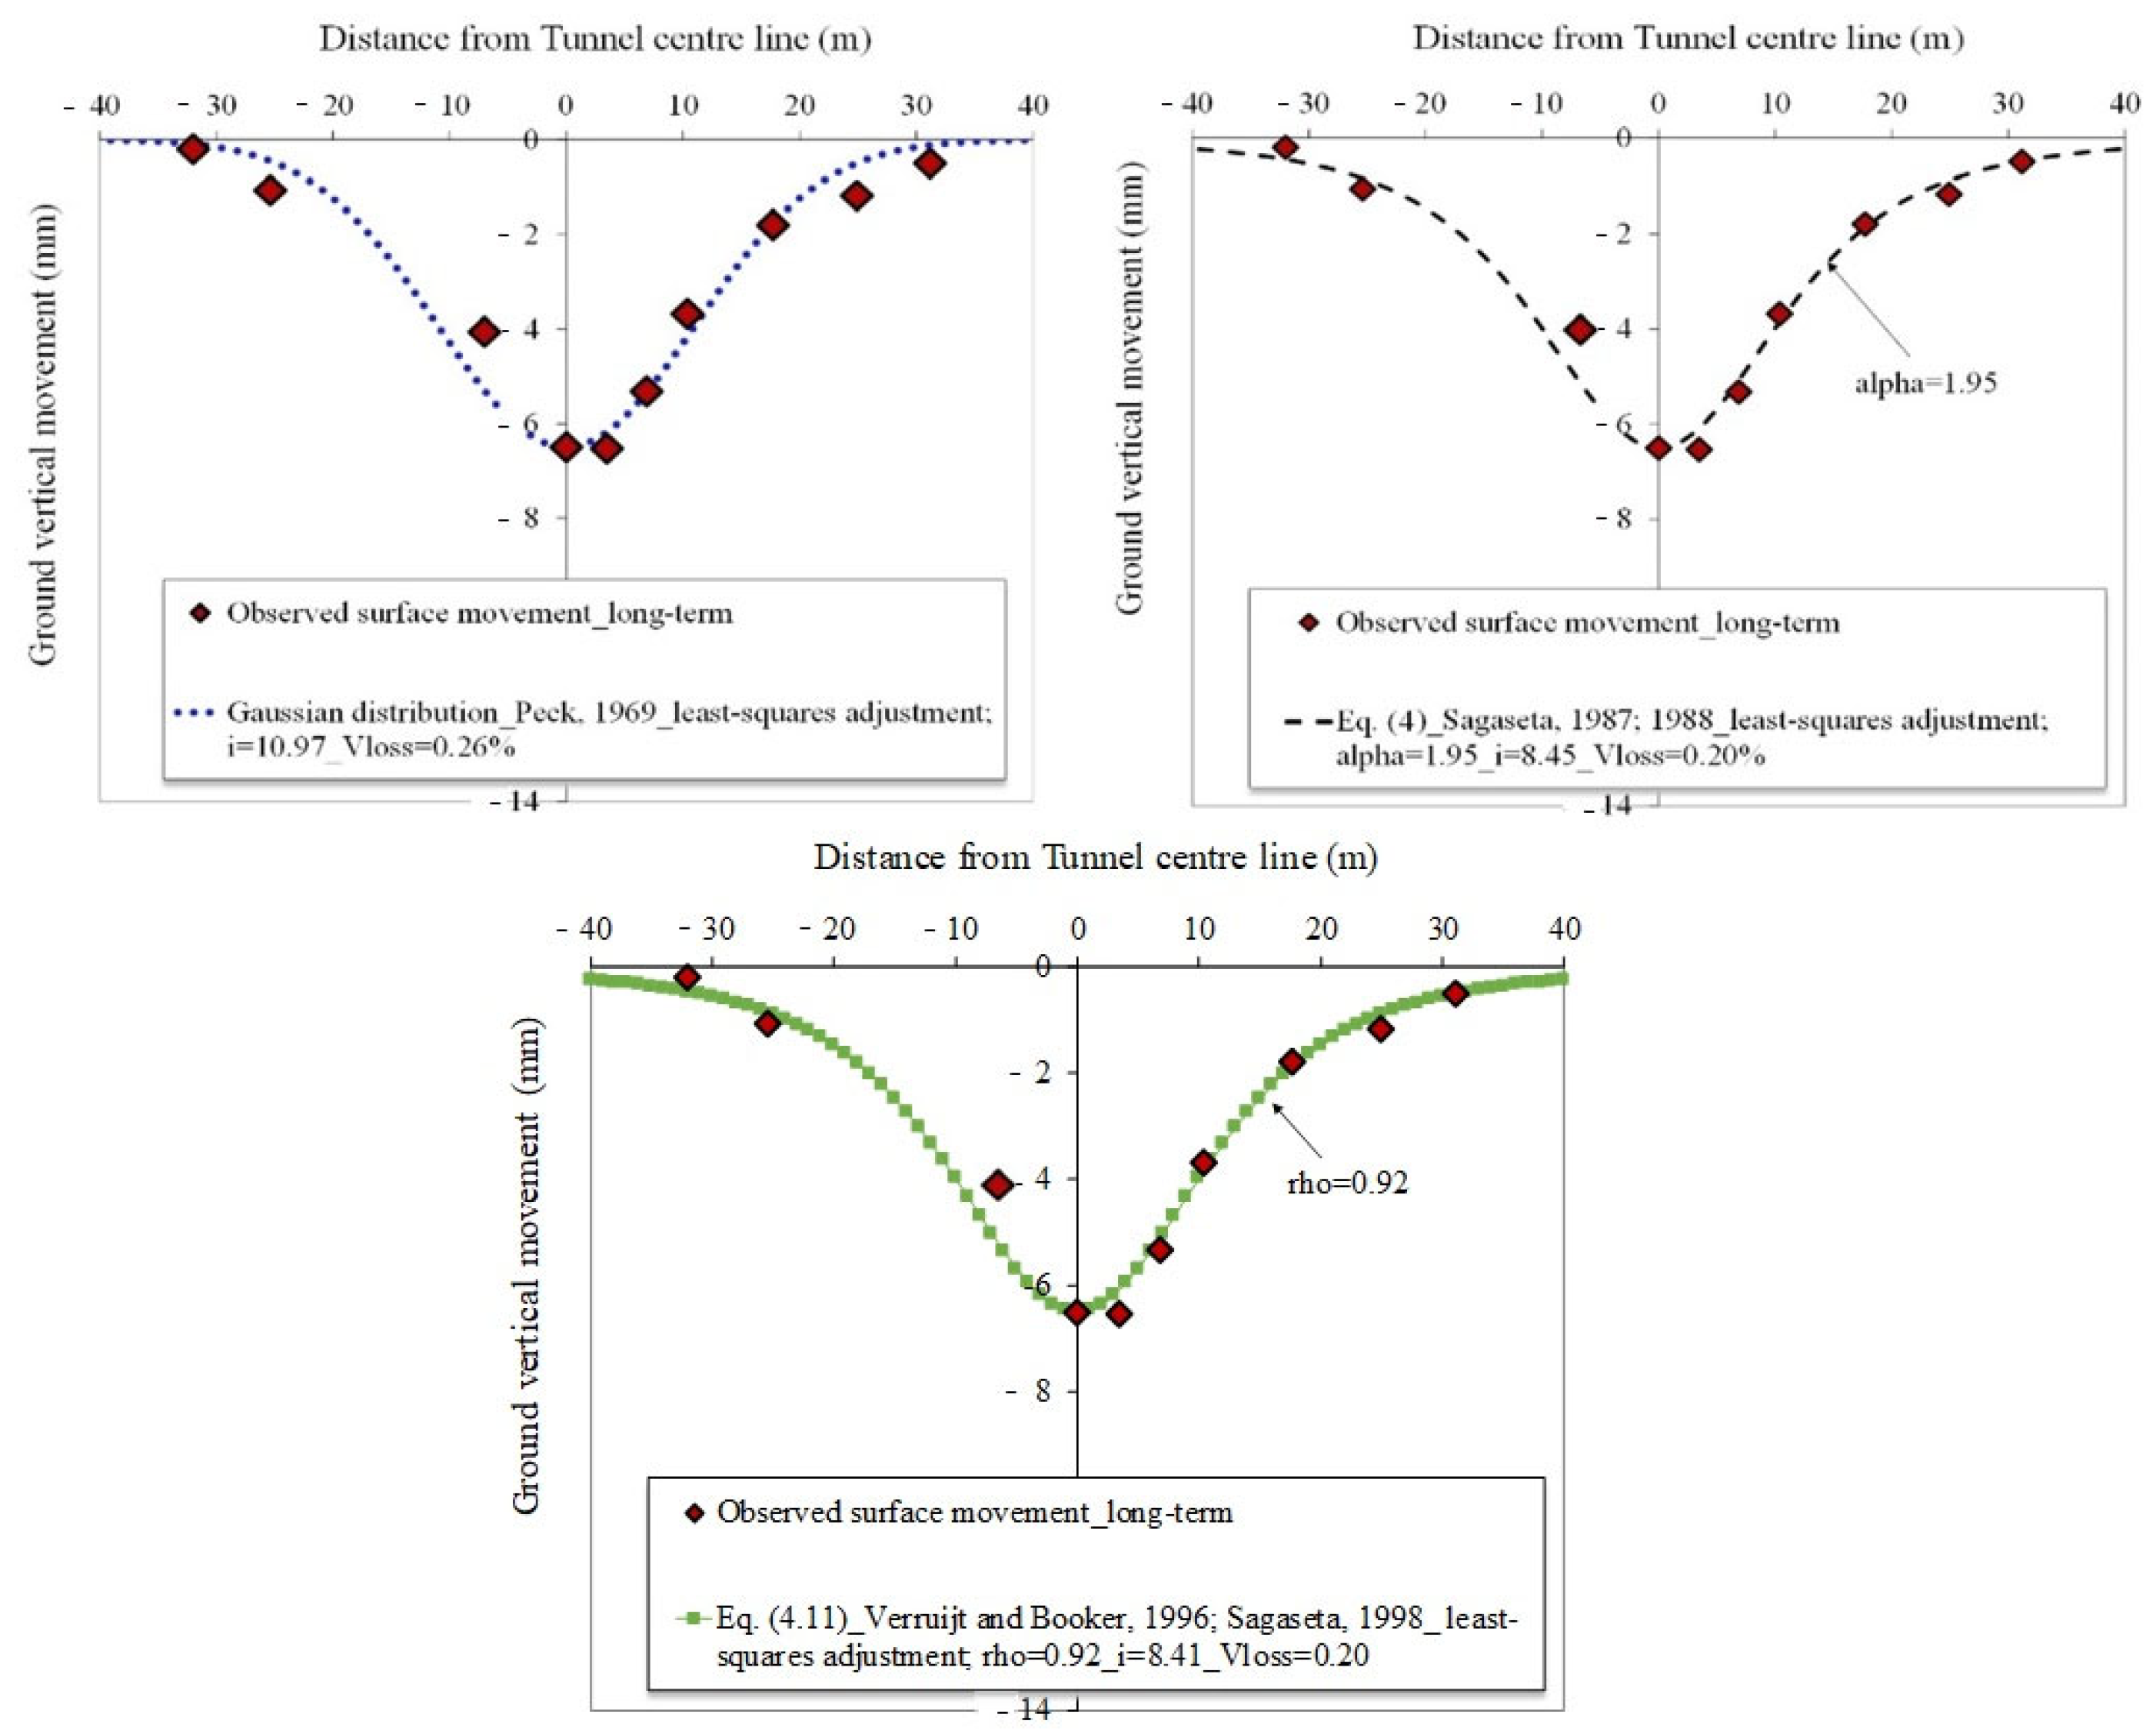
Additionally, a relevant fact is that there are movements of the ground in the furthest zone of the tunnel, and they are higher than the adjustment provided by the settlement trough represented by the Gaussian curve, as shown in Figure 15. Wongsaroj [2] indicates that the settlement profile at the surface evolves due to the consolidation process, making it unsuitable to represent this new profile using the Gaussian curve. Then, according to the field data collected in Line 9, it can be seen that these discrepancies between the ground movements and the Gaussian curve are not necessarily due to the inherent movements of the consolidation process or in the long term, since it has been observed that these discrepancies also occur in the short term (Figure 12 and Figure 14).
In addition to this, it is believed that the measurements of the installed instrumentation are very close to the excavation axis, where the Gaussian curve provides a good adjustment for the instrumentation data. Thus, in cases where instrumentation is available far from the centre of the tunnel (±30 m; ±40 m), for example, pk 4150 (Figure 14 and Figure 15), the Gaussian curve cannot fit well to the field data and to the closure of the settlement trough.
Again, the K value has been calculated from the 43 vertical surface settlement troughs. Figure 16 shows the results of the K values and the percentage of clayey material of which the material passing through the tunnel is composed. Evidently, when more than the 50% of the tunnel’s trace is made up of clayey material, the value of K = 0.5 is a representative value for the calculation of the volume of the ground loss. Moreover, the same figure shows the values of K and the % of clayey material, as well as the adjustment of the values to a linear regression line.

6. Theoretical Approach with Analytics Solutions

6.1. Tunnel Non-Symmetric Deformation: Ovalisation

Nevertheless, an alternative to the empirical approach, proposed by Peck [22] with the Gaussian curve, is the analytical solutions developed by Sagaseta [47] for undrained deformations caused by a loss of ground. In general, this solution leads to settlement troughs with a larger lateral extent than those observed because a radial deformation of the tunnel contour is implicitly assumed. Then, in a later discussion [48], Sagaseta proposes a modification of the original expression to consider possible change in the volume and dilatancy of the ground.
In this case, the surface settlement is given by:
S S v m a x = 1 1 + x h 2 α
Hence, in this equation, where the exponent α incorporates the effects of volumetric deformation (α > 1 for dilatant soils and α < 1 for compressive soils), Sagaseta [48] recommends using α = 1 for clayey soils and for granular soils when h exceeds 4D. For a depth where h is less than 2D, α = 2 is suggested.
Clearly, Smax is the maximum settlement in the centre of the tunnel, x is the distance to the excavation axis, and h is the depth where the centre of the tunnel is located.
In contrast, the inflection point of the settlement profile corresponds to the horizontal distance where the second derivative of Equation (4) is zero:
i h = 1 1 + 2 α
Afterwards, Verruitjt and Booker [49] updated the method proposed by Sagaseta [47] to include compressible soils (through a Poisson coefficient) and the ovalisation of the tunnel section, even though they must appeal to the use of elastic solutions, which decreases the generality of the solution. Therefore, the mechanisms of ground deformation during excavation are now two: radial displacements (related to the loss of ground volume) and the ovalisation of the tunnel section.
Hence, the resulting expression is:
S = 4 ε R 2 1 µ h x 2 + h 2 2 δ h x 2 h 2 x 2 + h 2 2
Consequently, in this expression, where µ is the Poisson’s coefficient, ε is the radial shrinkage, and δ is the degree of ovalisation, in the undrained case, the variable ε is directly related to the volume loss.
In this context, the ovalisation of a circular tunnel due to the K0 value of the ground had already been analysed by Uriel and Sagaseta [50]. The resulting values of ε (radial shrinkage) and δ (ovalisation) are:
ε = p 0 2 G   1 + k 0 2 δ = p 0 2 G   1 k 0   2   4 1 μ k = μ 1 μ
Therefore, where μ is the Poisson’s coefficient, in any case, Sagaseta [51] warned that multiple factors in addition to the value of K0 can contribute to the ovalisation of the tunnel section.
In Sagaseta’s study [51], Equation (6) is reformulated in a particularly useful way:
S S v m a x = 1 1 + ρ   1 1 + x h 2 1 + ρ 1 x h 2 1 + x h 2
Likewise, where ρ = (1/2(1 − µ)), δ/ε is the relative degree of ovality. However, for ρ = 0, the tunnel cavity contracts horizontally and vertically in the same way, and there is no ovalisation. Alternatively, if ρ > 0, the horizontal convergence is less than the vertical convergence, while the tunnel expands more horizontally for ρ > 1.
The inflection point of the settlement profile is calculated by making the second derivative of Equation (8) equal to zero:
3 ρ + 3 i h 4 + 18 ρ + 2 i h 2 3 ρ 1 = 0
Then, the measured settlement troughs will be represented by Equation (4) [47,48] and Equation (8) [49,50,51] using a least-squares adjustment. Even though Equation (4) was originally developed in relation to volume and dilatancy changes, in this paper, it will also be applied to short- and long-term movements. Thus, the α parameter will be treated as an adjustment variable. Of course, it should also be considered that all sections contain at least one granular layer (Ql2) (see Section 3) that is subject to volume changes.

6.2. Results from Analytics Solutions

In particular, once the adjustments were made, the parameter α was provided, which included the effects of volumetric deformations in compressible plastic soils (positive or negative soil dilatancy) using Sagaseta’s method [48]. Thus, the parameter α has been determined for the 43 troughs of transverse settlement with short- and long-term movements, and it has also been observed that in all cases, it acquires positive α values and that these values oscillate in a range between 0.98 and 2.56.
Clearly, Sagaseta [48] proposes α = 1 for clayey soils and for granular grounds when H > 4D. However, when this depth is h < 2D, he assigns α = 2. In our case of study, the tunnel depth is between 1.19D and 2.5D, so it fits with the indications proposed by Sagaseta. Meanwhile, the fact that the parameter α corresponds to typical values of granular soils is believed to be, at least partially, due to the fact that along the entire route of Line 9 studied, there is a layer of drained granular material, which forms the upper aquifer, and which we have called Ql2 (see Section 3). Obviously, sometimes the tunnel crosses this drained layer.
Additionally, in the case of the parameter ρ, once adjusted to the L9 data, it is observed that it acquires values between 0.18 and 2.07. In areas of the ground with higher sand content, the values approach the upper limit, while in sections excavated with higher clay content, the value of ρ is close to 1 or lower. Thus, according to Sagaseta [51], for values of ρ = 0, the tunnel cavity contracts horizontally and vertically in the same way; there is no ovalisation. In particular, if ρ > 0, the horizontal convergence decreases with respect to the vertical, and it becomes negative (the tunnel expands horizontally) for ρ > 1. In our case, an evident ovalisation is observed, reaching, in many cases, values of ρ > 1.
In addition, considering the undrained case (μ = 0.5) and adopting a value of K0 = 0.5, a representative value for the types of soils is studied in this work. The degree of ovalisation (the ratio between the oval shape of the tunnel section and the radial deformation) can be expressed as ρ = [1/2 (1 − μ)] (δ/ε), where a value of ρ = 2/3 is obtained. Furthermore, as we can see in the excavation of Line 9, a wide range of values for this parameter are obtained. This fact confirms that the degree of ovalisation depends on other factors besides the value of K0, as pointed out by Uriel and Sagaseta [50].
As revealed in Figure 17 and Figure 18, a particular case of a studied settlement trough (Pk 4150) is exhibited with both short- and long-term movements considered, respectively, and with the solutions proposed by Sagaseta [47,48], as well as by Verruijt and Booker [49] and Sagaseta [51]. Thus, these solutions have been fitted using least squares, and there is a slight improvement in the fit of both curves proposed by Sagaseta [47,48], as well as considering the solutions proposed by Verruijt and Booker [49] and Sagaseta [51]. Then, there is modest upgrading of the data provided by the instrumentation with respect to the Gaussian curve proposed by Peck [22].
In this context, ground surface settlements were estimated by calculating the Mean Absolute Error (MAE) and Mean Relative Error (MRE). The Gaussian curve proposed by Peck, Sagaseta’s method, and the Verruijt and Booker method were evaluated, yielding MAE values of 0.66 mm, 0.50 mm, and 0.48 mm, respectively, and MRE values of 49%, 45%, and 36%, respectively. Among these, the Verruijt and Booker method proved to be the most effective for predicting the tunnel excavation behaviour, helping to minimise impacts on surface assessments, improve building sustainability, and reduce environmental contamination from chemical product injection.
In this sense, there are several authors who proposed specific numerical methods such as material point in order to estimate pipe–soil interaction, such as Tian-Cheng [52], and to properly estimate surface settlement for tunnel excavation.
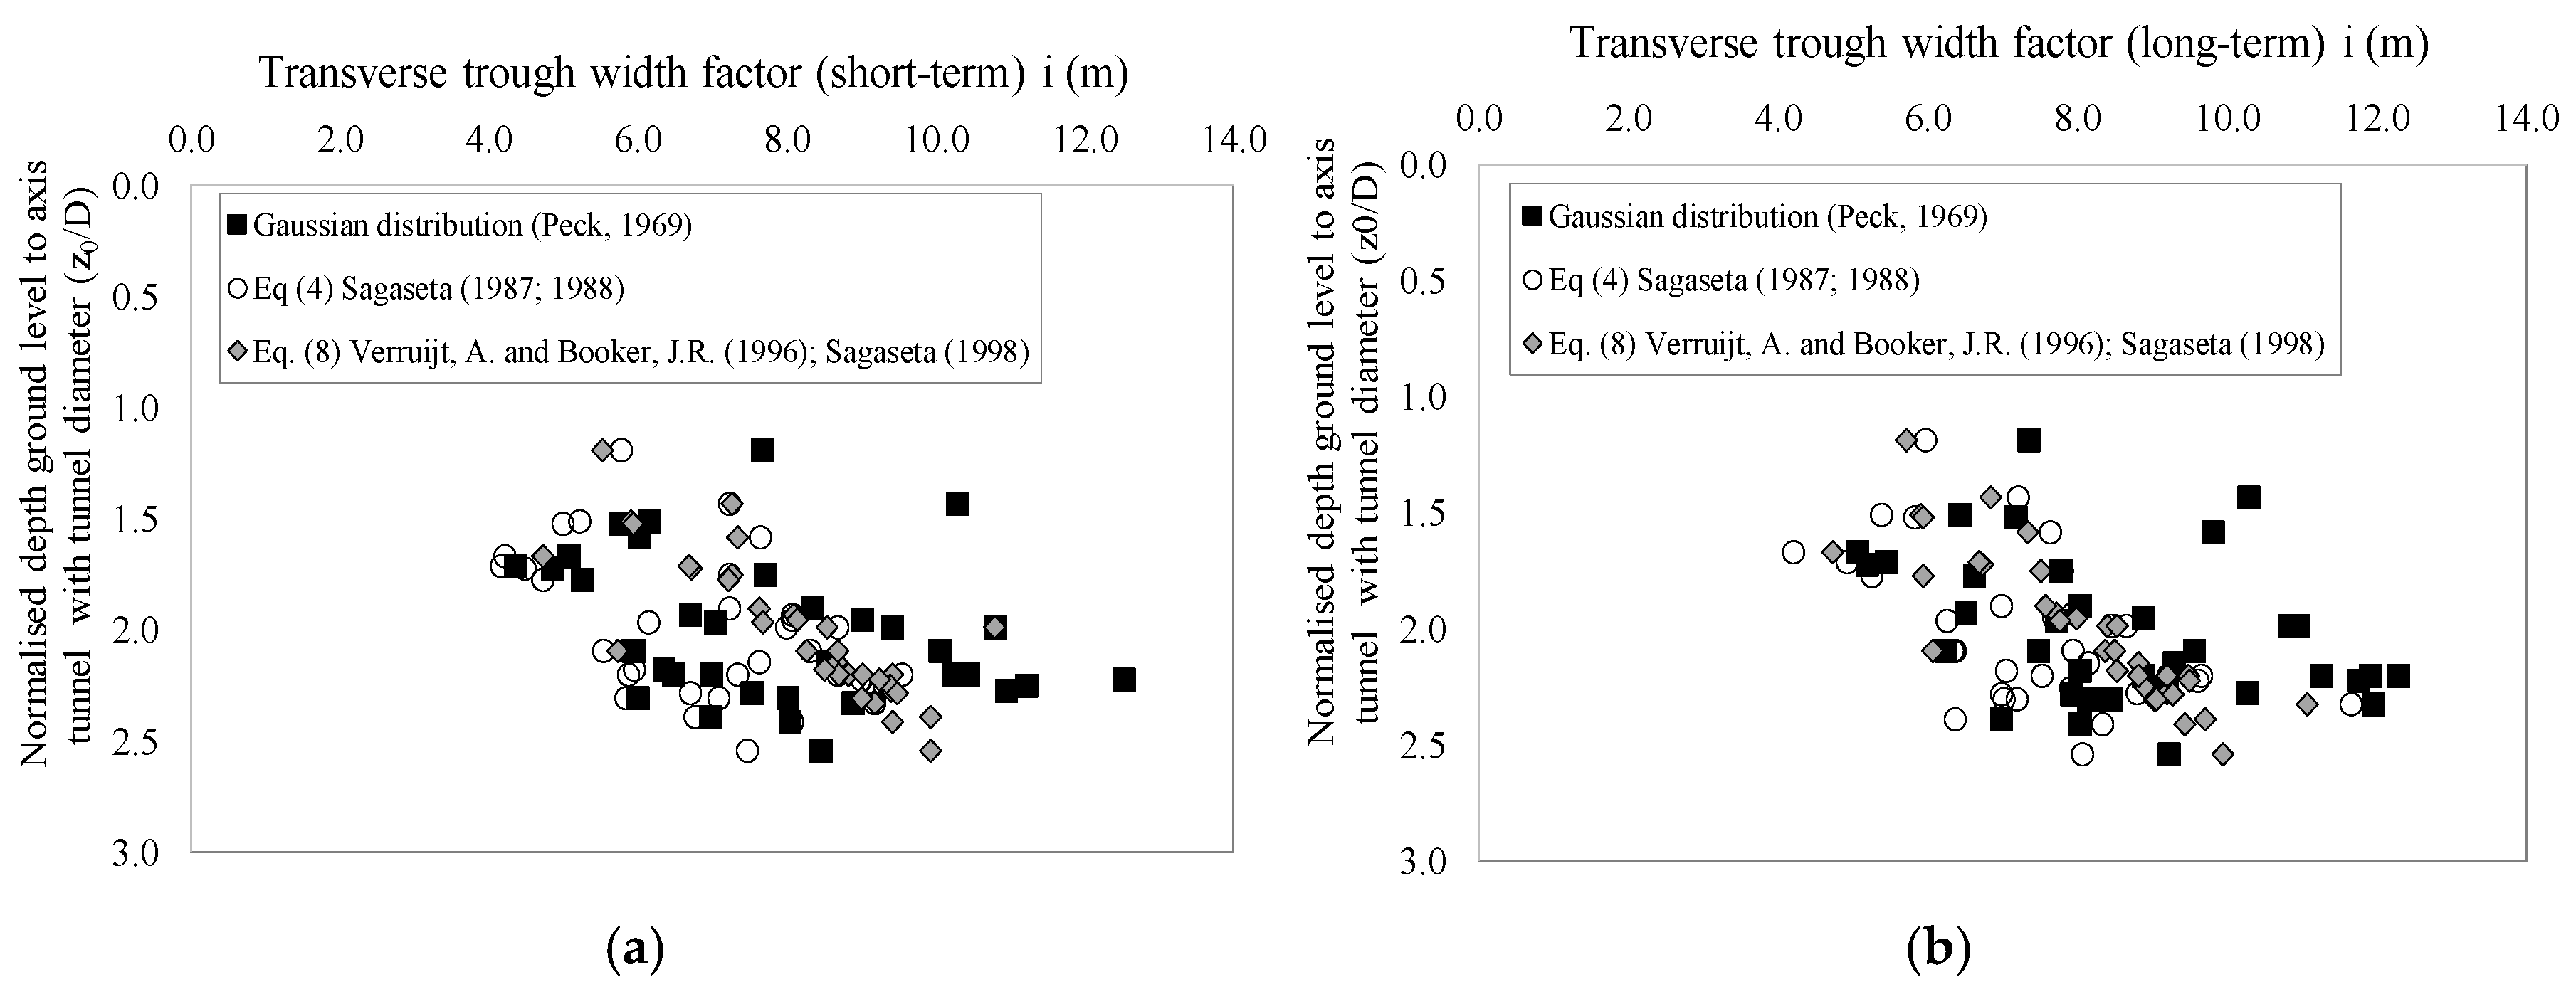
As a result of the information outlined above, Figure 19a,b represent the results of the inflection point of the 43 surface vertical settlement troughs studied from the Gaussian curve fitted using least squares and from the curve proposed by Sagaseta [47,48] and the solution proposed by Verruijt and Booker [49], which was also fitted using least squares to the field data. Figure 19a refers to the field data considered as short-term movements, and Figure 19b refers to field data considered as long-term movements.
In addition to this, Sugiyama [53], on his own, was based on data from the southeast of London, as well as O’Reilly and New [46], Clough and Schmidt [54], and Moh [55]. These data manifest that the value of “i” tends to increase with the tunnel depth. Additionally, in the case of the data presented in this article, the excavation depth has been normalised as a function of the diameter, and a slight tendency to increase the width of the settlement trough with the tunnel depth is also observed, corroborating what was suggested by Sugiyama [53]. Indeed, it is true that in our case, there is little variation in the excavation elevation, and this makes it difficult to see, in more detail, this more accentuated tendency.
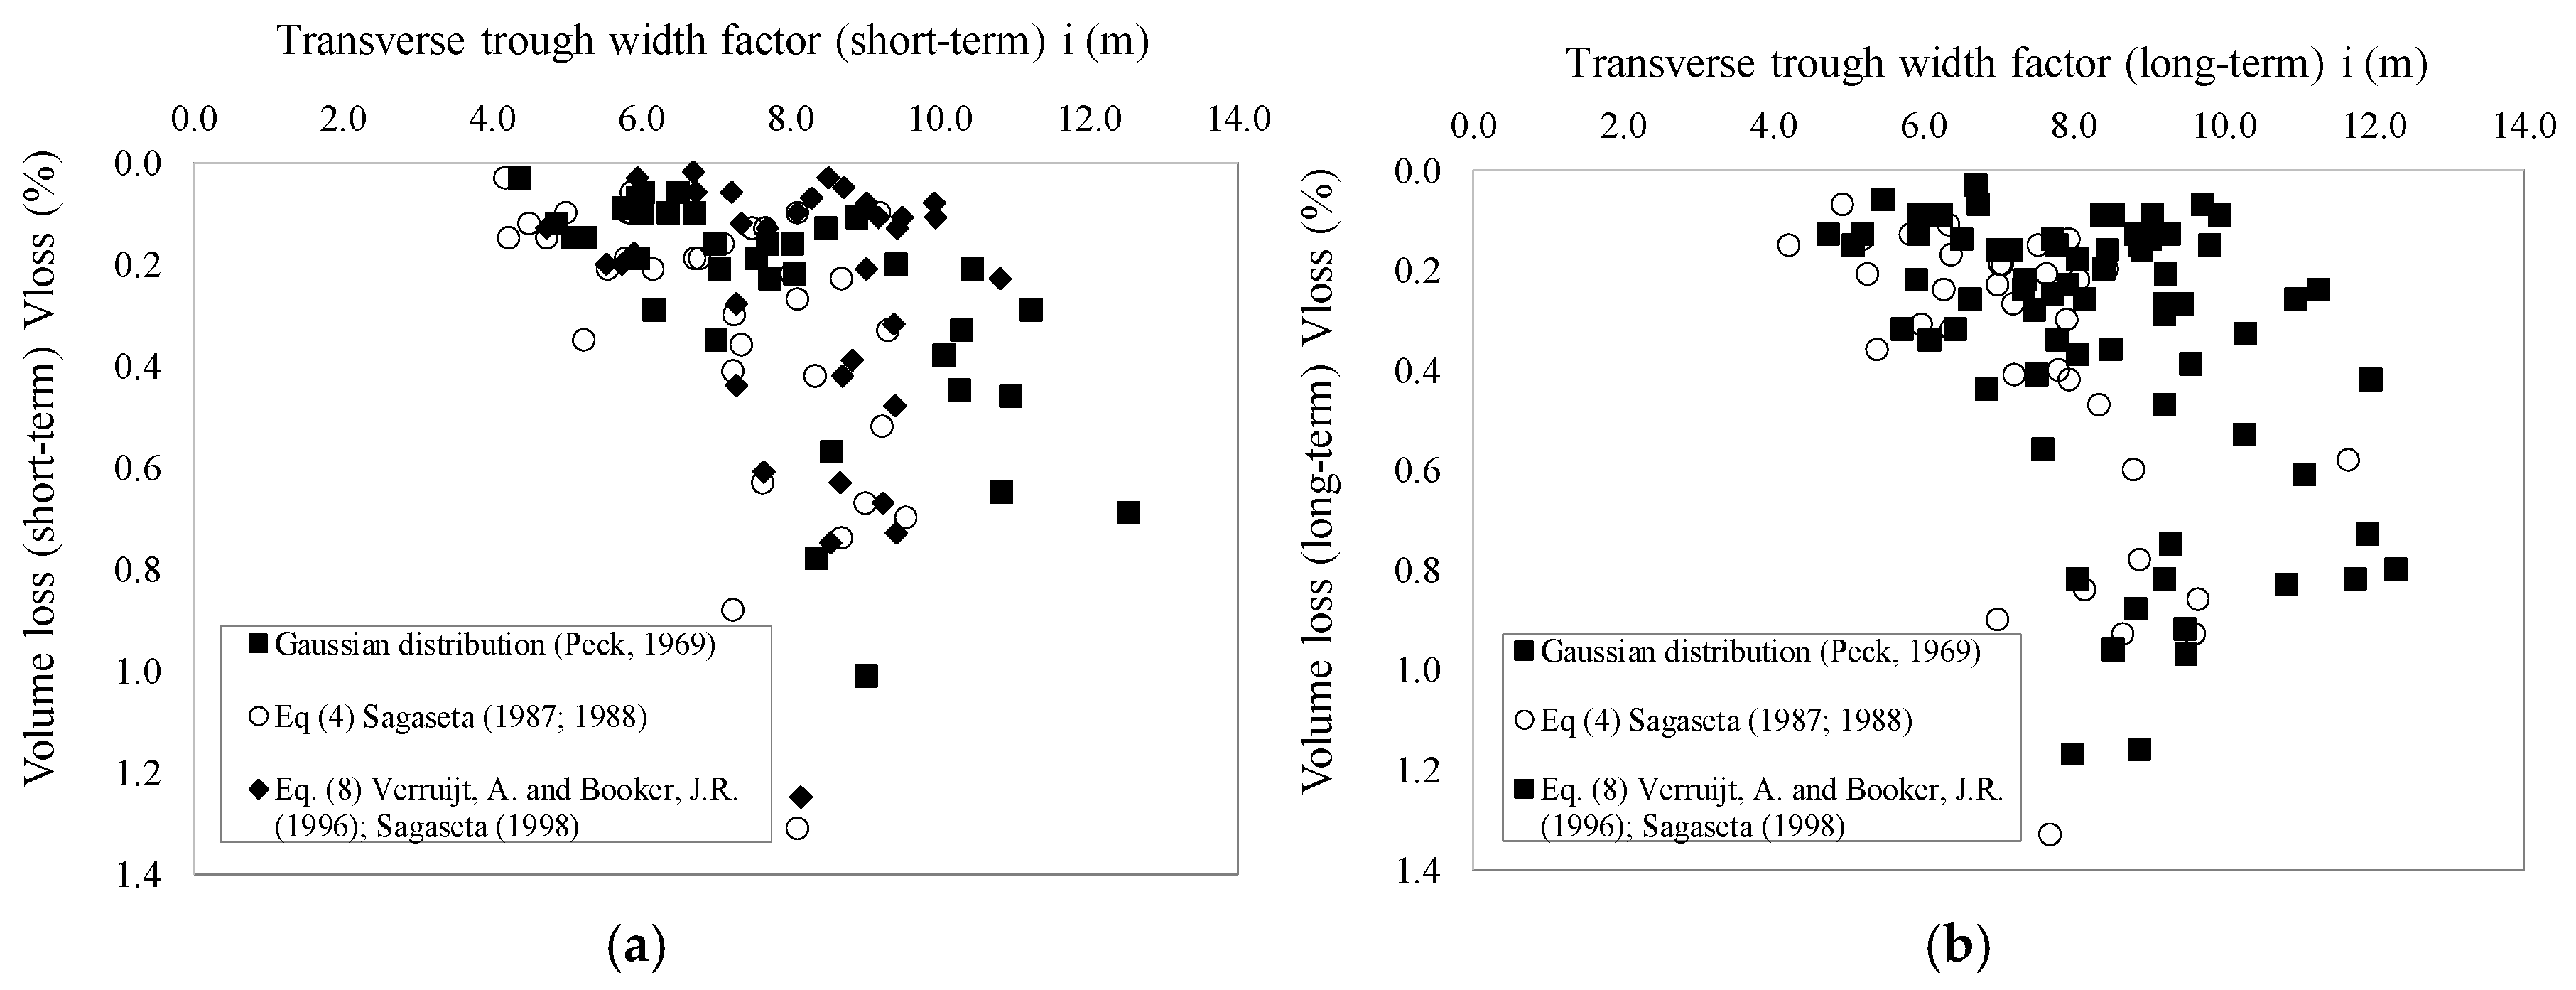
In contrast, from the inflection point data “i” calculated using Gaussian curve fitting for a settlement considered in the short and long terms, the ground volume loss has been calculated. Hergarden [56], Jacobsz [57], and Vorster [58] established that the value of “i” grew with the magnitude of the volume loss. As an example, in Figure 20, the short- and long-term volume losses of the settlement troughs are shown depending on the inflection point calculated using the least-squares fit and the depth of the tunnel axis. Then, in Figure 20, it can also be seen that for settlement troughs of value i > 8, in very few cases, the ground volume loss exceeds 1%.

7. Comparison with Other Surface Settlement Cases

Likewise, once the parameters that make up the surface settling basin along Section 1 of Line 9 of the Barcelona Metro have been adjusted and analysed, they can now compared with other Metro works carried out in similar soft grounds. Hence, the tunnels compared are as follows: (1) Contract CR3 (Up-track) and (Down-track) in Kaohsiung (Taiwan), (2) Taipei Rapid Transit System (TRTS) CA450 in Taipei (Taiwan), (3) MRT (CH218) in Taipei (Taiwan), (4) MRTA, Bangkok Sewer Tunnel in Bangkok (Thailand), (5) Hangzhou Metro, Right Line and Left Line in Hangzhou (China), (6) Line 5 in Milan (Italy), (7) Line 1 in Milan (Italy), (8) Railway Link in Milan (Italy), and (9) Line 2 in Cairo (Egypt).
Certainly, Table 4 shows several characteristics related to the geological and geometrical features, the method used for the excavation, and the parameters that refer to the results of the surface settling basins. Moreover, soft material is considered, from the point of view of tunnel execution, as that which requires support. Thus, in all the tunnels that have been compared with the Line 9 tunnel, a tunnel boring machine of EPB type or shield with the use of slurry has been used.
In contrast, Figure 21 presents a comparison between the results of the surface transverse settlement trough K value and the total ground volume loss in the two tunnels, comprising the Kaohsiung Metro CR3 project in Hsiung [59], the high-speed CH218 project excavation [55], the CA450A project [6] in Taipei (Taiwan), Qiantan River [60] in China, and Milan Metro Line 5 [5] compared with the results determined in Section 1 of Line 9 of the Barcelona Metro. In addition, as is observed in this figure, the volume loss data, in this case, are higher than the data calculated in the excavation of Section 1 of Line 9 of the Barcelona Metro, especially in the case of the excavation CA450A in Taipei, which, being a DOT-type excavation, resulted in the earth pressure applied on the excavation face adopted in the circular section being ineffective in controlling the settlement on the ground surface [6].
Likewise, in the case of Qiantang River Tunnel [60], the width of the transverse settlement trough is narrower than for the case of Line 9 of the Barcelona Metro. In regard to Line 9, the range of these K values oscillates between 0.30 and 0.58. In some cases, it has been found that where sandier materials predominate, the value of K is slightly higher than K = 0.5. Thus, in both cases, the coverage is similar. However, in the case of Line 9, the traversed material is somewhat sandier, so the value of K is slightly higher than K = 0.5. Clearly, this indicates that the excavated material may have some influence on the width of the transverse settlement trough. Furthermore, as can be grasped in this figure, there are a lot of scattered points in the data, so that there is no clear trend between the resulting K values and the total land volume loss values for the cases studied.
Figure 21. Relationship between K parameters and total ground volume loss during soft-ground tunnel construction. Hsiung [59], the high-speed CH218 project excavation, Moh [55], the CA450A project, Gui [6] in Taipei (Taiwan), Channel Tunnel Rail Link, Wongsaroj [17], Qiantan River, Lin [60] in China, and Milan Metro Line, Fargnoli [5].
Sustainability 16 08275 g021
In addition, Figure 22 represents the width of the settlement trough (i) as a function of the tunnel depth z0 for the cases of the Bangkok subway, Milan Metro Line 1 and Railway Link, Cairo Metro Line 2, and the data on Section 1 of Line 9 of the Barcelona Metro. Moreover, in the case of the Bangkok subway excavation (MRTA_Single Tunnel and MRTA_Twin Tunnel), most of the points represented are in a range between i = 0.5z and 0.6z in cases where the excavation is located under the stiff to soft clays and i < 0.4z for the cases where the excavation traverses the sandier material [3,4,5,6,7,8,9,10,11,12,13,14,15,16,17,18,19,20,21,22,23,24,25,26,27,28,29,30,31,32,33,34,35,36,37,38,39,40,41,42,43,44,45,46,47,48,49,50,51,52,53,54,55,56,57,58,59,60,61,62].
The width of the settlement trough has also been analysed for the case of Metro Line 1 and the Railway Link in the city of Milan [4], and in these cases, the data are around the regression line proposed by O’Reilly and New [46] (Equation (3)), with a range of K values between 0.43 and 0.46, showing to be a very uniform ground. However, for the Cairo Line 2 project [63], a non-homogeneous terrain has been considered. In contrast, it can be recognised that both in the case of Cairo Line 2 and in the case of Section 1 of Line 9 of the Barcelona Metro, the values have a large dispersion.
Indeed, in the case of Line 9 of the Barcelona Metro, it is observed that the values of the width of the transverse settlement trough oscillate between i = 0.3 and 0.7z.
Figure 22. Variation of surface transverse settlement trough width (i) with depth (z0) for different soft-ground tunnels, MRTA_Single Tunnel and MRTA_Twin Tunnel, Phiwnwej [3], Tunnel Line 1, Antiga y Chiorboli [4], Cairo Line 2 project, Hanza [63] and Section 1 of Line 9, in relation to O’Reilly and New’s parameters [46].
Sustainability 16 08275 g022
Table 4. Geological, geometrical, and technical characteristics and parameter relation of the transverse troughs on the surface of the Line and other tunnel cases.
Case
LocationGeologyMethod UsedProf
z0 (m)
Diameter
D (m)
Width iz (m)Máx. Settlement Svmax (mm)KVloss (%)References
0Line 9, Barcelona (Spain)Fine sand, silty clays, sandy silts, and silty sandsEPB20.79.4011.1018.100.540.73
1Contract CR3, (Up-track), Kaohsiung, TaiwanAlluvial: silt, sand, and clayEPB13.0–20.06.37.5227.00.35–0.550.20–1.05[59]
Contract CR3, (Down-track), Kaohsiung, TaiwanAlluvial: silt, sand, and clayEPB13.0–20.06.37.6027.00.35–0.540.18–1.27[59]
2Taipei Rapid Transit System (TRTS) CA450A, Taipei, TaiwanSilty clay and silty sandEPB5.0–25.06.426.050.9N/A0.71–1.82[6]
3MRT, CH218, Taipei, TaiwanSilty clay and silty sandEPB18.56.08.925.00.401.3[55]
4MRTA, Bangkok Sewer Tunnel, ThailandSoft clay, very stiff clay, hard clay, and dense sandEPB8.0–25.06.39.5 0.3–0.60.5–2.5[3]
5Hangzhou Metro, Right Line, Hangzhou, ChinaAlluvial deposits (sandy silt, silty clay, fine sand, and rounded gravel)Mud shield21.0–26.511.30N/A6.0–20.00.26–0.300.093–0.32[60]
6Line 5, Milan (Italy)Glacial and alluvial deposits (sands, gravels, and silt)EPB15.06.695.6012.40.35–0.400.50[5]
7Line 1, Milan (Italy)Glacial and alluvial deposits (sands, gravels, and silt)EPB10–206.564.0–10.0N/AN/AN/A[4]
8Passante Ferroviario, Milan (Italy)Glacial and alluvial deposits (sands, gravels, and silt)EPB4–168.034.0–6.0N/A0.43–0.46N/A[4]
9Line 2, El Cairo (Egypt)Alluvial deposits followed by layers of clay, silt, and silty sandsEscudo de lodos16–189.484.0–10.020.00.52–1.220.5–0.8[63]
Decidedly, after analysing the parameters that make up the surface settling basin along Section 1 of Metro Line 9 and compared with other Metro works carried out on similar soft grounds, we have been able to verify that these parameters are within global values.
Developing further based on the methodologies evaluated for predicting surface settlements in the Line 9 tunnel excavation, which highlighted effective approaches for minimising surface impacts, Wang’s [64] research on the stability of masses around subsurface openings using a hybrid FEM approach further elucidates the complex interactions and failure mechanisms.
Together, these studies emphasise the critical role of precise modelling in both predicting surface impacts and ensuring the stability of subsurface conditions.
Finally, the study of Wang’s [64] complementary research underscores the need for advanced modelling techniques to address both surface and subsurface challenges in tunnelling projects, which is the subject of our future research on Line 9.

8. Conclusions

The control of ground movements is essential for executing excavations and underground works. In this article, the analysis of tunnelling-induced vertical displacements of the ground surface is predicted using Peck’s method with the Gaussian curve, Sagaseta’s method, and the Verruijt and Booker method. This manuscript aims to identify the best method for predicting surface settlements caused by tunnel excavation based on the monitoring data of ground surface movements in deltaic soils. The research findings are as follows:
  • The observed settlement troughs can be reasonably modelled using the empirical Gaussian formulation, adjusted using least squares with K (an empirical proportionality constant, depending on the soil type, with value of 0.5).
  • The parameter K for the original ground, determined through least-squares fitting, ranges from 0.30 to 0.58.
  • In sections where the tunnel alignment consists of more than 50% clayey materials, a value of K = 0.5 is representative for calculating ground loss volume.
  • The analytical solution provided by Sagaseta (1988) and the expression (Sv/Svmax) by Sagaseta [52], derived from the analytical solution by Verruijt and Booker [49], have also been applied.
  • The values of the parameter α from the Sagaseta [48] method is positive and range between 0.98 and 2.56, aligning with the guidelines for sandy soils.
  • The degree of the ovalisation parameter ρ ranges from 0.18 to 2.07, indicating some degree of ovalisation (ρ > 0).
  • The analysis of the 43 settlement troughs and the corresponding calculation of ground loss volume show that all methods yield very similar results, with only a few exceptions where the ground loss volume exceeds 1%.
  • A slight tendency for the settlement trough width to increase with the tunnel depth is observed, although the variation in excavation depth is minimal, making it difficult to corroborate this trend.
This article contributes to the field by establishing relationships between the excavation process at its various stages—before, during, and after the passage of the EPB—and the resulting ground movement. This knowledge is crucial for maximizing the feasibility of constructing future tunnels in urban environments under similar conditions. Additionally, these data have allowed for a thorough characterization of the main parameters governing the shape of the settlement troughs.

Author Contributions

Conceptualisation, M.T.Y. and E.B.; Validation, E.B.; Investigation, M.T.Y.; Data curation, M.T.Y.; Writing—original draft, M.T.Y.; Writing—review and editing, E.B. All authors have read and agreed to the published version of the manuscript.

Funding

This research was funded by ALECTORS−2023, UPC grant number [R−02394] And The APC was funded by [ALECTORS−2023, UPC].

Institutional Review Board Statement

Not applicable.

Informed Consent Statement

Not applicable.

Data Availability Statement

The data presented in this study are available upon request from the corresponding author due to privacy concerns. Infrastructure data from the Generalitat de Catalunya (Infraestructures.cat) can be accessed with permission.

Acknowledgments

The authors would like to thank Infraestructures de la Generalitat de Catalunya (Infraesructures.cat) under the collaboration of the International Centre for Numerical Methods in Engineering (CIMNE).

Conflicts of Interest

The authors declare no conflict of interest.

References

  1. Dimmock, P.S. Tunnelling-Induced Ground and Building Movement on the Jubilee Line Extension; University of Cambridge: Cambridge, UK, 2003. [Google Scholar]
  2. Wongsaroj, J. Three-Dimensional Finite Element Analysis of Short and Long-Term Ground Response to Open-Face Tunnelling in Stiff Clay. PhD Thesis, University of Cambridge, Cambridge, UK, 2005. [Google Scholar]
  3. Phienwej, N.; Sirivachiraporn, A.; Timpong, S.; Tavaranum, S. Characteristics of Ground Movements from Shield Tunnelling of the First Bangkok Subway Line. In Proceedings of the International Symposium on Underground Excavation and Tunnelling, Bangkok, Thailand, 2–4 February 2006; pp. 319–330. [Google Scholar]
  4. Antiga, A.; Chiorboli, M. Tunnel face stability and settlement control using earth pressure balance shield in cohesionless soil. In Geotechnical Aspects Underground Construction Soft Ground, Balkema, Shanghai (China); Ng, C.W.W., Huang, H.W., Liu, G.B., Eds.; Taylor & Francis Group: Shanghai, China, 2009; pp. 365–371. [Google Scholar]
  5. Fargnoli, V.; Boldini, D.; Amorosi, A. TBM tunnelling-induced settlements in coarse-grained soils: The case of the new Milan underground line 5. Tunn. Undergr. Space Technol. 2013, 38, 336–347. [Google Scholar] [CrossRef]
  6. Gui, M.-W.; Chen, S.-L. Estimation of transverse ground surface settlement induced by DOT shield tunneling. Tunn. Undergr. Space Technol. 2013, 33, 119–130. [Google Scholar] [CrossRef]
  7. Standing, J.R.; Selemetas, D.; Shirlaw, J.N. Greenfield ground response to EPBM tunnelling in London Clay. Géotechnique 2014, 64, 581–583. [Google Scholar] [CrossRef]
  8. Wan, M.S.P.; Standing, J.R.; Potts, D.M.; Burland, J.B. Mesured short-term ground surface response to EPBM tunnelling in London Clay. Géotechnique 2017, 67, 420–445. [Google Scholar] [CrossRef]
  9. Díez, F. Nuevo Modelo Madrid para la Estimación de Asientos en Túneles con Tuneladoras EPB de Gran Diámetro. Ph.D. Thesis, Universidad Politécnica de Madrid, E.T.S.I. Caminos, Canales y Puertos (UPM), Madrid, Spain, 2010. [Google Scholar]
  10. Gens, A.; Persio, R.; Di Mariano, A.; Castellanza, R.; Arroyo Alvarez de Toledo, M. Relación enre parámetros de una tuneladora EPB y los movimientos del terreno. In 3as Jornadas Hispano-Portuguesas de Geotecnia; Cedex: Madrid, Spain, 2009; pp. 433–441. [Google Scholar]
  11. Gens, A. Soil–environment interactions in geotechnical engineering. Géotechnique 2010, 60, 3–74. [Google Scholar] [CrossRef]
  12. Clough, G.W.; Sweeney, B.P.; Finno, R.J. Measured soil response to EPB shield tunnelling. ASCE J. Geotech. Eng. 1983, 109, 131–149. [Google Scholar] [CrossRef]
  13. Lee, K.M.; Ji, H.W.; Shen, C.K.; Liu, J.H.; Bai, T.H. Ground response to the construction of Shanghai Metro Tunnel-Line 2. Soil Found. 1999, 39, 113–134. [Google Scholar] [CrossRef]
  14. Cording, E.J. Control of ground movements around tunnels in soil. In Proceedings of the 9th Pan American Conference, Vina del Mar, Chile, 26–30 August 1991; pp. 2195–2244. [Google Scholar]
  15. Matsushita, Y.; Iwasaki, Y.; Ashimoto, T.; Imanishi, H. Behaviour of subway tunnel driven by large slurry shield. Underground Construction in Soft Ground. From CiNNII Researh, Balkema: Rotterdam, The Netherlands, 1995; 253–256. [Google Scholar]
  16. Mair, R.J.; Taylor, R.N. “Theme Lecture: Bored tunnelling inthe urban environment” Plenar Session 4. In Proceedings of the 14th International Conference on Soil Mechanics and Foundation Engineering (Hamburg), Hamburg, Germany, 6–12 September 1997; Volume 4, pp. 2353–2385. [Google Scholar]
  17. Wongsaroj, A.; Borghi, F.X.; Soga, K.; Mair, R.J.; Sugiyama, T.; Hagiwara, T.; Bowers, K.H. Effect of TBM driving parameters on ground surface movements: Channel Tunnel Rail Link Contract 220. In Geothecnicak Aspects of Underground Construction in Soft Ground; Bakken, K.J., Bezuijen, A., Broere, W., Kwast, E.A., Eds.; Taylor & Francis Group: London, UK, 2006; ISBN 0-415-39124-5. [Google Scholar]
  18. Gens, A.; Di Mariano, A.; Yubero, M.T. EPB tunneling in deltaic deposits: Observations of ground movements. In Geotechnical Aspects of Underground Construction in Soft Ground; Viggiani, G., Ed.; Taylor & Francis Group: Abingdon, UK, 2011. [Google Scholar]
  19. Nyren, R.J. Field Measurements above Twin Tunnels in London Clay. Ph.D. Thesis, Imperial College, Universtiy of London, London, UK, 1998. [Google Scholar]
  20. Selemetas, D. The Response of Ful-Scale Piles and Piled Structures to Tunnelling. Ph.D. Thesis, University of Cambridge, Cambridge, UK, 2005. [Google Scholar]
  21. Attewell, P.; Farmer, I. Ground Deformations Resulting from Shield Tunnelling in London Clay. Can. Geotech. J. 1974, 11, 380–395. [Google Scholar] [CrossRef]
  22. Peck, R.B. Deep Excavations and Tunneling insoft Ground. In Proceedings of the 7th International Conference on Soil Mechanics and Foundation Engineering, Mexico City, Mexico, 28 August–3 September 1969; pp. 225–290. [Google Scholar]
  23. Marshall, A.M.; Farrell, R.; Klar, A.; Mair, R. Tunnels in sands: The effect of size, depth and volume loss on greenfield displacements. Géotechnique 2012, 62, 385–399. [Google Scholar] [CrossRef]
  24. Di Mariano, A.; Gesto, J.M.; Gens, A.; Schwarz, H. Ground deformation and mitigating measures associated with the excavation of a new Metro line. In Proceedings of the 14th European Conference on Soil Mechanics and Geotechnical Engineering, Madrid, Spain, 24–27 September 2007; pp. 1901–1906. [Google Scholar]
  25. Deulofeu, C.; Schwarz, H.; Comulada, M. Data management for highly mechanized shield tunnelling in the construction of the Line 9 Metro Barcelona. In Underground Space, Proceedings of the 33rd ITA-AITES World Tunnel Congress, Prague, Czech Republic, 5–10 May 2007; Barták, J., Hrdina, I., Romancov, G., Ziámal, J., Eds.; Taylor and Francis Group: London, UK, 2007; pp. 1603–1608, ISBN 978-0-415-40807-3. [Google Scholar]
  26. Gens, A.; Di Mariano, A.; Gesto, J.M.; Schwarz, H. Ground movement control in the construction of a new metro line in Barcelona. In International Symposium Geothecnical Aspects of Underground Construction in Soft Ground; Bakker, K.J., Bezuijen, W., Kwast, E.A., Eds.; Balkema: Rotterdam, The Netherlands, 2006; pp. 389–395. [Google Scholar]
  27. Borràs, X.; Boté, R.; Maidl, B.; Della Valle, N. Metro Barcelona Línea 9-Europe’s greatest metro project with shield tunnel boring machines of large diameters. In (Re) Claiming the Underground Space; Saveur, J., Ed.; Routledge: Amsterdam, The Netherlands, 2003; pp. 637–643. [Google Scholar]
  28. Schwarz, H.; Bote, R.; Gens, A. Construction of a new Metro line in Barcelona: Design criteria, excavation and monitoring system. In Geotechnical Aspects of Underground Construction in Soft Ground—Proceedings of the 5th International Conference of TC28 of the ISSMGE, Netherlands, 15–17 June 2005; Bakker, K.J., Bezuijen, A., Kwast, E.A., Eds.; Taylor & Francis Group: London, UK, 2006; pp. 757–762. [Google Scholar] [CrossRef]
  29. Mendaña, F. La construcción de túneles en terrenos mixtos con tuneladoras de gran diámetro. Experiencias recientes de algunas obras Boring of tunnels in mixed face conditions with large diameter TBMs. Rev. Obras Públicas 2009, 65–78, ISSN 0034-8619. [Google Scholar]
  30. Naitoh, K. The development of earth pressure balanced shields in Japan. Tunn. Tunn. 1985, 17, 15–18. [Google Scholar]
  31. Krause, T. Schildvortrieb mit Flüssigkeits-Underdgestütxter Ortsbrust. Ph.D. Thesis, Technische Universitaet Braunschweig, Institut fuer Grundbau und Bodenmechanik, Bergisch Gladbach, Germany, 1987. (In German). [Google Scholar]
  32. Bono, R.; Ortu, M.; Valdemarin, F. Surface settlement minimization in soft soil when excavating with an earth pressure balance shield. Jornada Técnica: Túneles con EPB Simulacion y Control de la Tuneladora; Universitat Politècnica de Catalunya: Barcelona, Spain, 2008; pp. 129–148. Available online: https://deca.upc.edu/ca/el-departament/seccions/etcg/docencia/aula-paymacotas/pdf/publicacions/EPB.pdf (accessed on 20 August 2024).
  33. Maidl, B.; Herrenknecht, M.; Anheuser, L. Mechanised Shield Tunnelling; Wiley VCH: Weinheim, Germany, 1996; ISBN 343301292X. [Google Scholar]
  34. Shah, R.; Lavasan, A.A.; Peila, D.; Todaro, C.; Luciani, A.; Schanz, T. Numerical Study on Backfilling the Tail Void Using a Two-Component Grout. J. Mater. Civ. Eng. 2018, 30, 04018003. [Google Scholar] [CrossRef]
  35. Kravitz, B.; Mooney, M.; Karlovsek, J.; Danielson, I.; Hedayat, A. Void detection in two-component annulus grout behind a pre-cast segmental tunnel liner using Ground Penetrating Radar. Tunn. Undergr. Space Technol. 2019, 83, 381–392. [Google Scholar] [CrossRef]
  36. Wang, S.; He, C.; Nie, L.; Zhang, G. Study on the long-term performance of cement-sodium silicate grout and its impact on segment lining structure in synchronous backfill grouting of shield tunnels. Tunn. Undergr. Space Technol. 2019, 92, 1–13. [Google Scholar] [CrossRef]
  37. Shao, X.; Yang, Z.; Jiang, Y.; Yang, X.; Qi, W. Field test and numerical study of the effect of shield tail-grouting parameters on surface settlement. Geomech. Eng. 2022, 29, 509–522. [Google Scholar]
  38. Loganathan, N.; Poulos, H.G. Analytical prediction for tunneling-induced ground movements in clays. J. Geotech. Geoenviron. Eng. ASC 1998, 124, 846–856. [Google Scholar]
  39. Komiya, K.; Soga, K.; Akagi, H. Soil consolidation associated with grouting during shield tunnelling in soft clayey ground. Geotechnique 2001, 53, 447–448. [Google Scholar] [CrossRef]
  40. Liu, X.X.; Shen, S.L.; Xu, Y.S.; Zhou, A.N. Non-linear spring model for backfill grout-consolidation behind shield tunnel lining. Comput. Geotech. 2021, 136, 104235. [Google Scholar] [CrossRef]
  41. Zheng, G.; Zhang, T.; Diao, Y. Mechanism and countermeasures of preceding tunnel distortion induced by succeeding EPBS tunnelling in close proximity. Comput. Geotech. 2015, 66, 53–65. [Google Scholar] [CrossRef]
  42. He, S.; Lai, J.; Wang, L.; Wang, K. A literature review on properties and applications of grouts for shield tunnel. Constr. Build. Mater. 2020, 239, 117782. [Google Scholar] [CrossRef]
  43. Mao, J.; Yuan, D.; Jin, D.; Zeng, J. Optimization and application of backfill grouting material for submarine tunnel. Constr. Build. Mater. 2020, 265, 120281. [Google Scholar] [CrossRef]
  44. Cui, Y.; Tan, Z.; Han, D.; Song, J. Investigation and application of a high-performance grouting material in water-rich silty fine sand stratum. Constr. Build. Mater. 2022, 329, 127100. [Google Scholar] [CrossRef]
  45. Wongsaroj, J.; Soga, K.; Mair, R.J. Tunnelling-induced consolidation settlements in London Clay. Geotechnique 2013, 63, 1103–1115. [Google Scholar] [CrossRef]
  46. O’Reilly, M.P.; New, B.M. Settlements above tunnels in the United Kingdom-their magnitude and prediction. In Tunnelling’82; The Institution of Mining and Metallurgy: London, UK, 1982; pp. 173–181. [Google Scholar]
  47. Sagaseta, C. Analysis of undrained soil deformation due to ground loss. Géotechnique 1987, 37, 301–320. [Google Scholar] [CrossRef]
  48. Sagaseta, C. Author’s reply to Schmidt (1988). Géotechnique 1988, 38, 647–649. [Google Scholar] [CrossRef]
  49. Verruijt, A.; Booker, J.R. Surface settlements due deformation of a tunnel in an elastic half plane. Géotechnique 1996, 46, 753–756. [Google Scholar] [CrossRef]
  50. Uriel, A.O.; Sagaseta, C. Selection of Parameters for Underground Construction. AA Balkema: Rotterdam, The Netherlands, 1989; Volume 4, pp. 2521–2551. [Google Scholar]
  51. Sagaseta, C. Discusion to Verruijt and Booker (1996). Géotechnique 1998, 48, 709–713. [Google Scholar]
  52. Xie, T.-C.; Zhu, H.-H.; Tan, D.-Y.; Shukla, S.K. Modeling pipe-soil interaction under surface loading using material point method. Tunn. Undergr. Space Technol. 2024, 147, 105709. [Google Scholar] [CrossRef]
  53. Sugiyama, T.; Hagiwara, T.; Nomoto, T.; Nomoto, M.; Ano, Y.; Mair, R.J.; Bolton, M.D.; Soga, K. Observations of Ground Movements During Tunnel Construction by Slurry Method at the Docklands Light Railway Lewisham Extension-East London. Soils Found. 1999, 39, 99–112. [Google Scholar] [CrossRef]
  54. Clough, G.W.; Schmidt, B. Design and performance of excavation and tunnels in soft clay. In Soft Clay Engineering; Cording, E.J., Ed.; Developments in Geotechnical Engineering; Elsevier: Amsterdam, The Netherlands, 1981; Volume 20, pp. 569–634. [Google Scholar]
  55. Moh, Z.C.; Ju, D.H.; Hwang, R.N. Ground movements around tunnels in soft ground. In Proceedings of the International Symposium on Geotechnical Aspects of Underground Construction in Soft Ground, London, UK, 15–17 April 1996; pp. 15–17. [Google Scholar]
  56. Hergarden, H.J.A.M.; Van der Poel, J.T.; Vand der Schrier, J.S. Ground movements due to tunneling: Influence on pile foundations. In Proceedings of the 2nd International Symposium on Geotechnical Aspects of Underground Construction in Soft Ground, London, UK, 15–17 April 1996; AA Balkema: Rotterdam, The Netherlands; pp. 519–524. [Google Scholar]
  57. Jacobsz, S.W.; Standing, J.R.; Mair, R.J.; Hagiwara, T.; Sugiyama, T. Centrifuge modelling of tunnelling near driven piles. Soils Found. 2004, 44, 49–56. [Google Scholar] [CrossRef]
  58. Vorster, T.E.B.; Klar, A.; Soga, K.; Mair, R.J. Estimating the Effects of Tunneling on Existing Pipelines. J. Geotech. Geoenvironmental Eng. 2005, 131, 1399–1410. [Google Scholar] [CrossRef]
  59. Hsiung, B.C.B. Analysis of Ground Movements Induced by Tunnels in Sand Based on Contract CR3 in Kaohsiung Metro. Geotechnical Aspects of Underground Construction in Soft Ground. 2011, pp. 869–875. Available online: http://www.scopus.com/inward/record.url?eid=2-s2.0-84867157741&partnerID=tZOtx3y1 (accessed on 20 August 2024).
  60. Lin, C.G.; Zhang, Z.M.; Wu, S.M.; Yu, F. Key techniques and important issues for slurry shield under-passing embankments: A case study of Hangzhou Qiantang River Tunnel. Tunn. Undergr. Space Technol. 2013, 38, 306–325. [Google Scholar] [CrossRef]
  61. Wu, P.C.; Hsieh, M.B.; Yang, W.; Liu, P.E. Study on Double-O-Tube tunnel construction. Tunn. Constr. China 2011, 31, 265–273. [Google Scholar]
  62. Sirivachiraporn, A.; Phienwej, N. Ground movements in EPB shield tunneling of Bangkok subway project and impacts on adjacent buildings. Tunn. Undergr. Space Technol. 2012, 30, 10–24. [Google Scholar] [CrossRef]
  63. Hamza, M.; Ata, A.; Roussin, A. Ground Movements Due to the Constuction of Cut-and-Cover Structures and Slurry Shield Tunnel of the Cairo Metro. Tunn. Undergr. Space Technol. 1999, 14, 281–289. [Google Scholar] [CrossRef]
  64. Wang, L.; Chen, W.; Tan, X.; Tan, X.; Yang, J.; Yang, D.; Zhang, X. Numerical investigation on the stability of deforming fractured rocks using discrete fracture networks: A case study of underground excavation. Bull. Eng. Geol. Environ. 2020, 79, 133–151. [Google Scholar] [CrossRef]
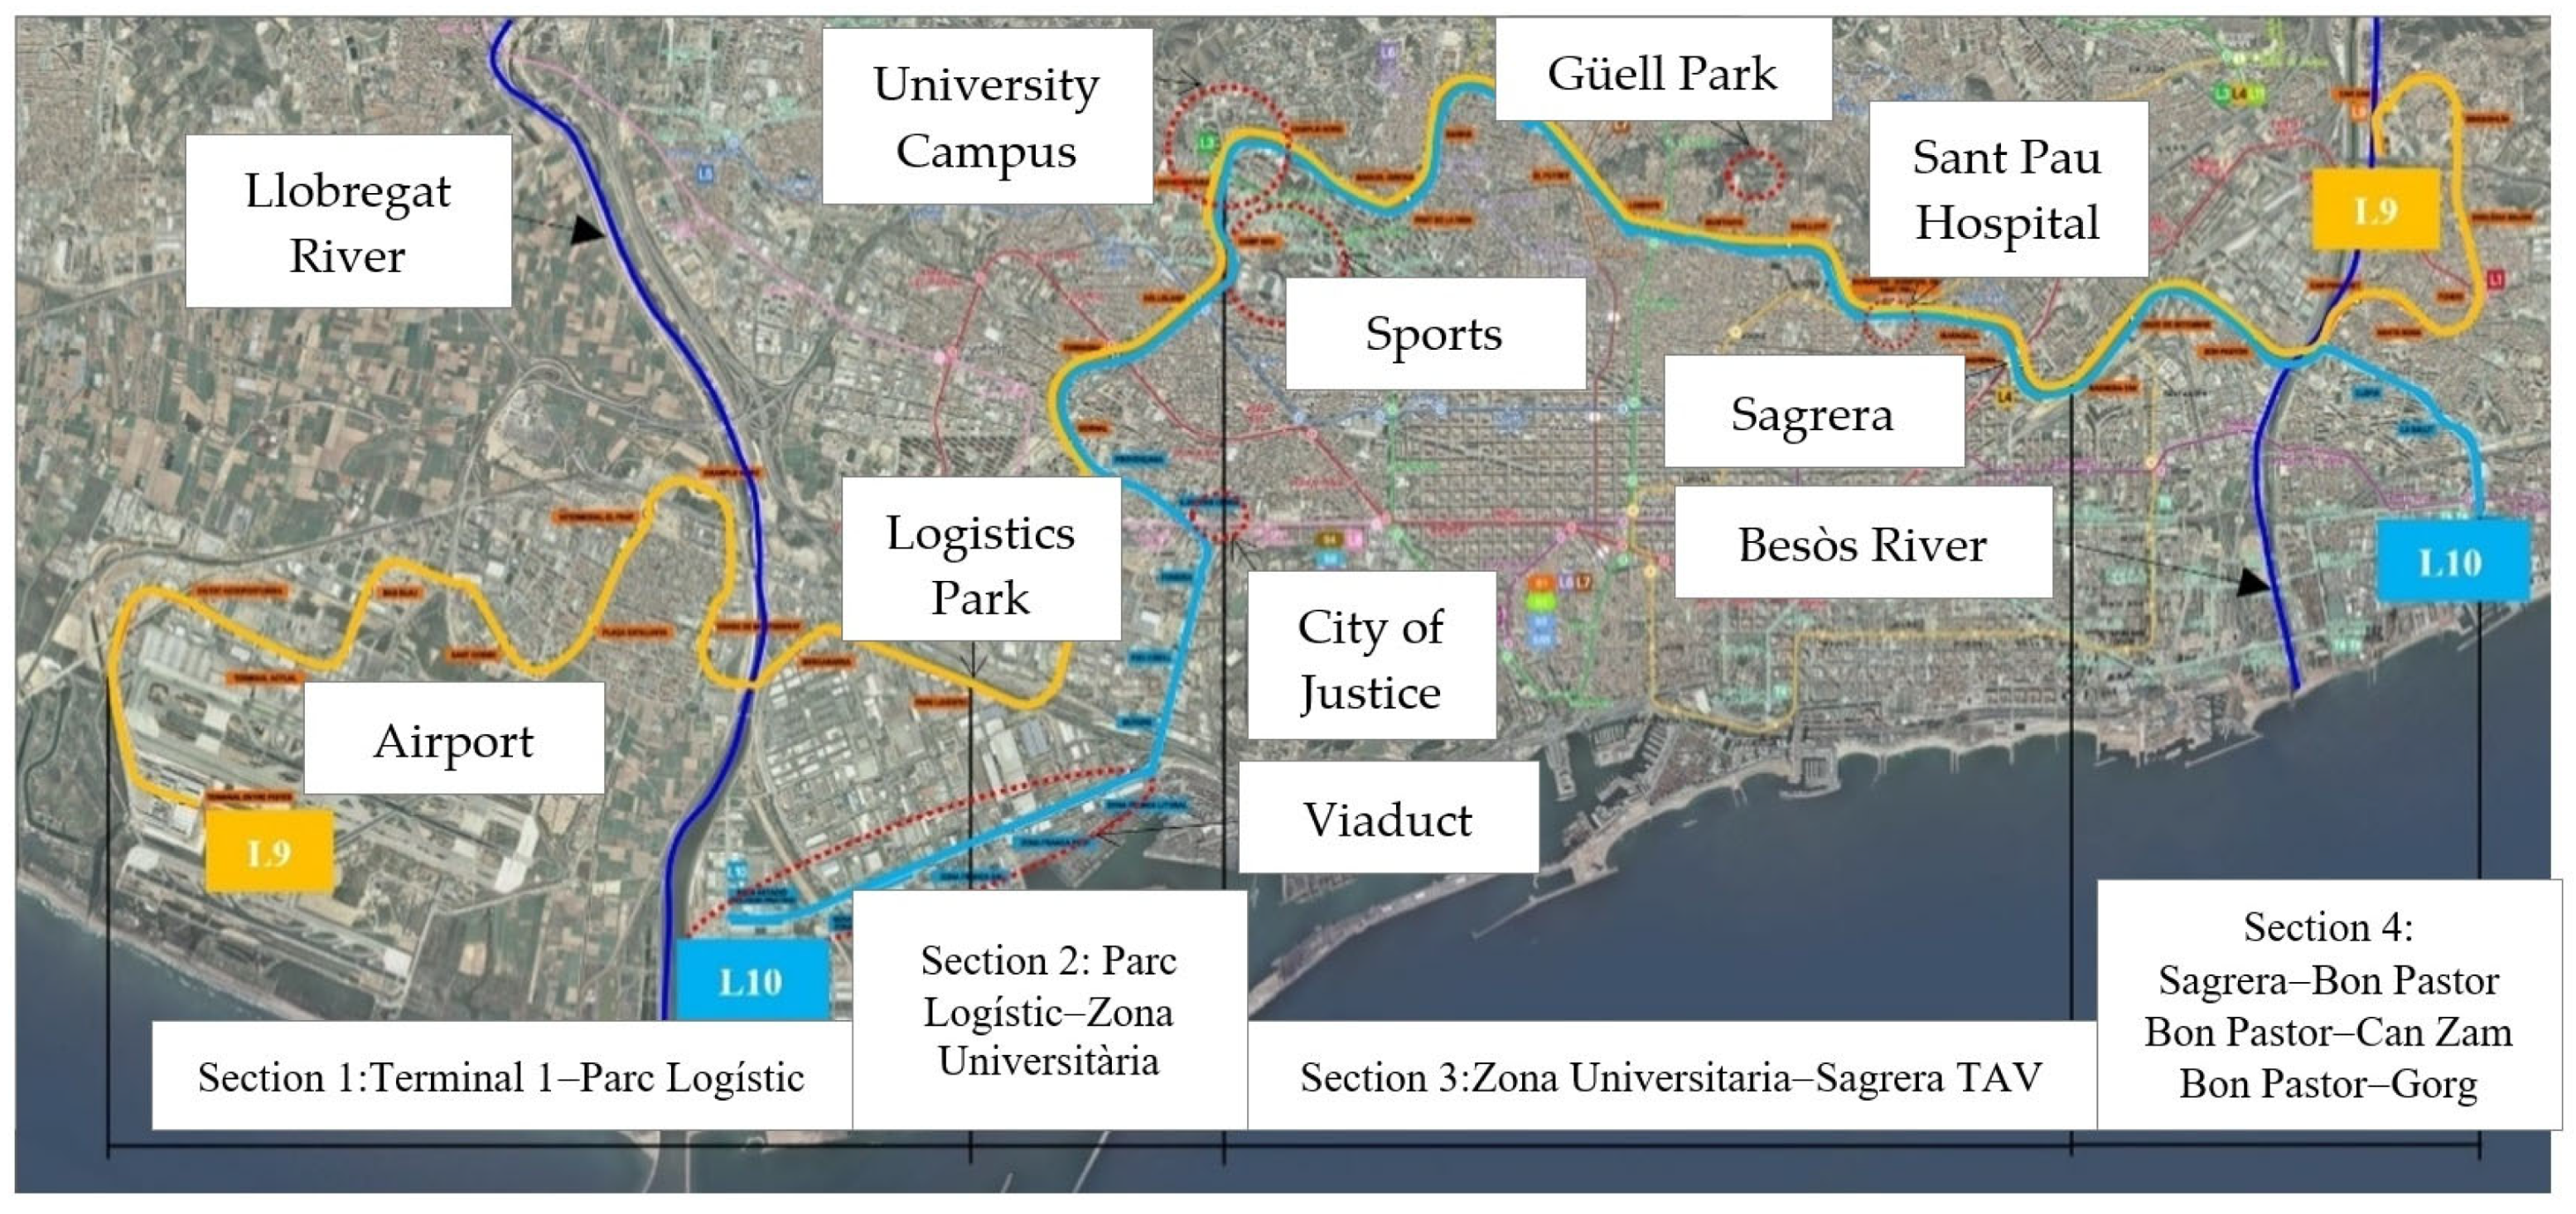
Figure 1. Line 9 and Line 10 layouts of Barcelona Metro.
Sustainability 16 08275 g001
Figure 2. Location of Section 1 between Terminal entre Pistes station and Parc Logistic station of Line 9 route.
Sustainability 16 08275 g002
Figure 3. Progress on Section 1 excavation between Mas Blau and Parc Logistic stations on Line 9.
Sustainability 16 08275 g003
Figure 4. Progress on Section 1 between Mas Blau and Terminal entre Pistes stations on Line 9.
Sustainability 16 08275 g004
Figure 5. Seating control systems through applied pressures (Paymacotas, 2008) [32].
Sustainability 16 08275 g005
Figure 6. Bentonite and grout injections into the shield and tail.
Sustainability 16 08275 g006
Figure 7. Sketch of geological profile along the tunnel route of Contract T1.
Sustainability 16 08275 g007
Figure 8. Surface and subsurface greenfield for the Control Section of Line 9 tunnel alignment: Section 4000.
Sustainability 16 08275 g008
Figure 9. Ground vertical movement versus face distance at pK 4150 (3945 excavated meters) and settlement components.
Sustainability 16 08275 g009
Figure 10. Ground vertical movement versus face distance at pK 4150 (3945 excavated meters) and settlement components of settlement values.
Sustainability 16 08275 g010
Figure 11. Layout plan of Section 1D (Mas Blau–Aeroport del Prat) and locations of the transverse settlement troughs.
Sustainability 16 08275 g011
Figure 12. Locations of transverse settlement troughs in subsections T1A, T1B, T1E, and T1C.
Sustainability 16 08275 g012
Figure 13. Continuation of the locations of the transverse settlement troughs in the T1C subsection.
Sustainability 16 08275 g013
Figure 14. Settlement trough chainage of 4150. Short term ground vertical movement.
Sustainability 16 08275 g014
Figure 15. Settlement trough chainage of 4150. Long term ground vertical movement.
Sustainability 16 08275 g015
Figure 16. Relationship between % clayey material in the excavation and parameter K.
Sustainability 16 08275 g016
Figure 17. Example of short term settlement troughs, Gaussian curve proposed by Peck [22] and solutions proposed by Sagaseta [47,48], as well as by Verruijt and Booker [49] and Sagaseta [51]. Particular case of Section T1D PK 4150.
Sustainability 16 08275 g017
Figure 18. Example of long term settlement troughs, Gaussian curve proposed by Peck [22] and solutions proposed by Sagaseta [47,48], as well as by Verruijt and Booker [49] and Sagaseta [51]. Particular case of Section T1D PK 4150.
Sustainability 16 08275 g018
Figure 19. (a) Values of short term settlement troughs and (b) values of long-term settlement troughs with Gaussian distribution by Peck [22], Sagaseta [47,48], and Verruijt and Booker [49] and Sagaseta [51].
Sustainability 16 08275 g019
Figure 20. (a) Values of short term volume loss and (b) values of long-term volume loss with Gaussian distribution by Peck [22], Sagaseta [47,48], and Verruijt and Booker [49] and Sagaseta [51].
Sustainability 16 08275 g020
Table 1. Tunnelling machines in operation in Catalonia (Spain) in the year 2009 (source: EUROPA PRESS, 16 May 2010).
ClientCivil WorkConstruction CompanyShield TypeDiameter (m)
Generalitat de CatalunyaL9 MetroUTE TriangleEPB11.90
Generalitat de CatalunyaL9 MetroUTE Gorg 1EPB12.00
Generalitat de CatalunyaL9 MetroUTE Gorg 2EPB12.00
Generalitat de CatalunyaL9 MetroUTE Airport 1EPB9.40
Generalitat de CatalunyaL9 MetroUTE Airport 2EPB9.40
FCGTerrassa RailwayUTE Terrassa2 EPB6.40
FCGSabadell RailwayAcciona2 EPB6.40
AdifHigh-Speed RailUTE MontcadaEPB11.90
AdifHigh-Speed RailUTE Sagrada FamiliaEPB11.90
AdifHigh-Speed RailUTE GironaEPB10.00
Table 2. Average excavation values recorded during tunnel construction.
Excavation ParameterAverage Value
Pressure at the excavation face (bar)2.6
Bentonite injection pressure (bar)2.0
Bentonite injection volume (m3)1.0–2.5
Tail pressure (bar)3.1
Grouting injection volume (m3)8.23
Foam expansion rate (FER)min 25
Foam Injection rate (FIR)min 20
Work density chamber (ton/m3)1.60–1.80
Machine stops/ring (min)178
Installation ring time (min)19
Drilling time/ring (min)28
Cycle time/ring (min)225
Wheel thrust force (kN)6217.57
Propulsion force (kN)25,600
PAR (kNm)4475
Ratio advance (mm/min)63
Penetration (mm/rpm)53
Table 3. Summary of soil properties at research site.
Geological Unit RQL1QL2QL3QL3sQL3m
Granulometry% fines91.3528.5528.6190.8181.591.62
% sands8.6167.6763.549.1418.398.36
% gravel0.043.787.850.050.110.03
LimitsLL30.13925.925.833–21.623.7
LP19–2321.418.7216.2–2512.4–21.917.9
Humidity%181821262527
Density (γn)g/cm32.061.952.531.91.61.83
Dry
Density (γd)
g/cm31.751.471.751.541.471.44
NSPTAverage14.448.1613.512.769.811.55
Simple
Compression
qu (Kg/cm2)0.841.050.240.650.350.25
Direct Cuttingc (Kg/cm2)0.13–0.370.15–0.200.15–0.400.30–0.070.2
φ (0)2638.134.728.52826.7
Oedometere00.50.650.70.670.730.62
Cc0.090.080.150.120.090.09
mv0.010.010.0020.0010.0020.01
Triaxialc 0–1.500.470.380.32
φ (0) 31–39.0017.1924.821.01
Sulphates%0.12<0.10.1–0.480.1–0.260.19–0.590.1–0.26
Organic Material%0.120.1–0.330.22–0.400.29–1.20.07–0.910.74
Pressure MeterMPa 10.314.215.211.915.1
Permeabilitycm/s 5.71 × 10−52.29 × 10−41.29 × 10−84.27 × 10−62.79 × 10⁻⁷
Disclaimer/Publisher’s Note: The statements, opinions and data contained in all publications are solely those of the individual author(s) and contributor(s) and not of MDPI and/or the editor(s). MDPI and/or the editor(s) disclaim responsibility for any injury to people or property resulting from any ideas, methods, instructions or products referred to in the content.