Article

Thermodynamic Analysis of Gas Turbine Systems Fueled by a CH4/H2 Mixture

Institute of Thermal Engineering, Poznan University of Technology, 60-965 Poznan, Poland
*
Author to whom correspondence should be addressed.
Sustainability 2024, 16(2), 531; https://doi.org/10.3390/su16020531
Submission received: 23 November 2023 / Revised: 22 December 2023 / Accepted: 6 January 2024 / Published: 8 January 2024
(This article belongs to the Section Energy Sustainability)

Abstract

:
In the coming years, as a result of changing climate policies and finite fossil fuel resources, energy producers will be compelled to introduce new fuels with lower carbon footprints. One of the solutions is hydrogen, which can be burned or co-fired with methane in energy generation systems. Therefore, this study presents a thermodynamic and emission analysis of a gas turbine fueled by a mixture of CH4 and H2, as well as pure hydrogen. Numerical studies were conducted for the actual operating parameters of the LM6000 gas turbine in both simple and combined cycles. Aspen Hysys and Chemkin-Pro 2023R1 commercial software were used for the calculations. It was demonstrated that with a constant turbine inlet temperature set at 1723 K, the thermal efficiency increased from 39.4% to 40.2% for the gas turbine cycle and from 49% to 49.4% for the combined cycle gas turbine. Nitrogen oxides emissions were calculated using the reactor network, revealing that an increase in H2 content above 20%vol. in the fuel leads to a significant rise in nitric oxides emissions. In the case of pure H2, emissions are more than three times higher than for CH4. The main reason for this increase in emissions was identified as the greater presence of H, O, and OH radicals in the reaction zone, causing an acceleration in the formation of nitric oxides.

1. Introduction

Due to increasing energy demand and stricter carbon dioxide reduction regulations, as highlighted by the UN Framework Convention on Climate Change [1], the imperative need to transition to clean energy has become evident. This transition must rapidly reduce greenhouse gas emissions to net zero over the coming decades to meet the goals of the 2015 Paris Agreement. More specifically, efforts should focus on limiting temperature increases to 1.5 °C above pre-industrial levels and keeping the global average temperature increase significantly below 2 °C. The energy sector’s ambitious goal of achieving net-zero CO2 emissions necessitates compensating for emissions persisting from specific global regions or industries where abatement is technically challenging or not economically viable. This can be achieved through carbon minimization and storage in other energy-related areas [2]. Additionally, due to the discontinuous and fluctuating nature of renewable energy sources (RES), there is a compelling need for highly effective and dependable energy storage to offer continuous, on-demand energy around the clock. These challenges pose a significant hurdle for both the industry and research sectors, achievable only through a continuous mix of alternative fuels and breakthrough technologies. Clean alternative fuels like hydrogen and biofuels have been proposed as solutions to address these challenges, particularly in gas turbines (GT). Hydrogen, with an energy content of 120 MJ/kg on a mass basis—much higher than traditional fuels like natural gas (48 MJ/kg)—becomes more desirable in certain scenarios. It holds promise as an energy source that can be stored and converted back into electricity. During times of energy surplus, hydrogen can be generated and used as a fuel, further converted back to energy. Notably, hydrogen, burned in air to produce high-temperature water vapor, can be harnessed as a clean and environmentally beneficial fuel.
One potential application of H2 in the power industry lies in its use in gas turbines, known for their highest thermal efficiencies. While the fundamentals of gas turbine cycles have been extensively studied for most simple cycle gas turbine modifications, only a few have effectively made it to commercial use [3,4,5,6] The gas turbine’s need for highly specialized and technologically advanced components presents a challenge compared to alternative systems performing similar functions. Gas turbines have been instrumental in power generation over the last three decades [7]. These heavy-duty gas turbines must deliver high power output, exhibit no weight issues, and maintain excellent efficiency to compete with alternative power generation systems like steam cycles. During this time, the significant development of combined heat and power (cogeneration) systems leveraged the gas turbine’s advantageous property of delivering substantial heat at high temperatures in the turbine exhaust without compromising performance [8]. The combined gas-steam cycle, utilizing emitted heat to generate power, represents a significant innovation in this field, referred to as the heavy-duty gas utilized by gas turbines. However, the most effective technology for large-scale power generation systems remains combined cycles [9]. The choice of fuel used in the combustion chamber significantly impacts the effectiveness of combustion and emissions in these processes. Presently, the primary fuels employed in these cycles are fossil fuels like oil and gas [10]. Despite the benefits and appeal of gas turbine systems (GTs) for electricity production, their drawback remains the release of greenhouse gases due to fossil fuel use. Reducing GHG emissions from GT combustion chambers can be achieved by burning pure “green hydrogen” (green hydrogen refers to hydrogen produced from the electrolysis of water with renewable electricity) or blending it with other fuels. However, operating gas turbines on hydrogen presents various challenges compared to natural gas. Firstly, careful design is necessary to ensure safe hydrogen combustion due to its maximum burning velocity, potentially seven times faster than that of natural gas. Secondly, the broader flammability limits and shorter ignition delay time of H2 blends may lead to the flashback phenomenon. These factors can impose mechanical stress on the combustor’s components, causing flame instability and undesired pressure fluctuations [11]. Another crucial aspect is the emission of toxic compounds, especially nitrogen oxides. This is primarily due to the higher combustion temperature of H2 and changes in flame size and shape, leading to increased heat release per unit volume. Research evaluating the impact of adding hydrogen to natural gas in a swirl-stabilized model combustor showed in lean, premixed experimental conditions that the addition of hydrogen can decrease NOx emissions and expand the stability limit [12]. Moreover, it has been demonstrated that introducing pilot injection when adding hydrogen to natural gas can enhance the system’s capability to regulate emissions. Therkelsen et al. [13] demonstrated that adding hydrogen to natural gas in a gas turbine improves fuel-air mixing, leading to lower NO emissions. In another study by Reale et al. [14], blending methane-hydrogen in GTs was found to enhance the combustion process’s regularity through steam injection. According to Liu et al. [15], the effects of hydrogen-enriched methane-air were influenced by the hydrogen enrichment and equivalency ratio, both affecting the flame structure. Additionally, Yoshimura et al. [16] indicated that the interaction between hydrogen and natural gas can decrease NOx emissions through the hydrogenation of natural gas. Ditaranto et al. [17] found that the influence of pure hydrogen significantly reduces nitrogen oxide emissions. In the gas turbine system, the use of nitrogen dilution of hydrogen could replace exhaust gas recirculation. Several studies indicate that converting low-NOx gas turbine burners from methane to pure hydrogen can double or even triple NOx emissions [18]. The high flame temperature characteristic of hydrogen combustion is well known. One of the primary chemical pathways contributing to the creation of NOx involves a kinetic pathway where the nitrogen in the air is oxidized by oxygen at high temperatures. This mechanism, highly sensitive to temperature, is known as the thermal NOx mechanism or Zeldovitch’s mechanism [19]. An association between stoichiometric flame temperature (SFT) and NOx emissions for various fuels in typical gas turbine settings was documented by Todd and Battista in [20]. Their findings revealed that undiluted H2 leads to unacceptable emission levels, necessitating a significant reduction in SFT to achieve emissions comparable to power industry standards. Similar observations have been reported when co-firing H2 mixtures with other fuels, for instance, in reciprocating engines [21,22] and heating boilers [23,24]. As shown in the literature review, there are contradictions regarding the effect of H2 content in fuel on nitrogen oxide emissions. This is related to the predominant pathways of NOx formation in different combustion regimes and flame types. For example, nitric oxides emission decreases with increasing hydrogen share in laminar flames at a given combustion temperature, while for turbulent flames the trend is opposite. This necessitates the need for further in-depth study of NOx formation mechanisms for the respective combustion regimes found in various energetic applications.
In addition to this, hydrogen, in comparison to natural gas, produces a lower mass flow rate and distinct product gases with higher water content, subsequently affecting the mixture’s molecular weight and specific heat. The fluctuation of enthalpy drop during expansion significantly impacts a gas turbine’s operation. Variations in the flow rate at the turbine’s inlet affect the compressor and turbine compatibility, while changes in the heat-transfer coefficient on the turbine blades’ exterior impact the effectiveness of the cooling system [25]. The study demonstrates that as the volumetric percentage of hydrogen increases, the radius of the maximum temperature zone decreases, yet the temperature peak and NOx emissions rise. Notably, the combustion characteristics of the flame remain largely unchanged at low volumetric hydrogen percentages (less than 10%). It is illustrated that, although the addition of hydrogen leads to a reduction in flame length, a limited concentration of hydrogen causes an increased flame length (similar to that associated with pure methane). This occurs as low volumetric hydrogen concentrations result in a smaller mixing region on the lateral side [26].
This paper presents three gas turbine systems: simple cycle, combined cycle, and modified combined cycle, each of which allow the use of hydrogen as fuel. The calculations regarding the impact of hydrogen content in the fuel on efficiency and emissions were conducted using data from actual gas turbine power plants provided by GE Gas Power LM 6000, which is a novelty in contrast to previous work based on theoretical data. The sensitivity analysis considers the effect of H2 on thermal efficiency, specific work, thermodynamic parameters of the cycle, and emissions.

2. Materials and Methods

2.1. Thermodynamic Analysis

The hydrogen power cycles underwent sensitivity analyses to examine how the proportion of hydrogen affects thermal efficiency, the temperature of the combustion chamber, and the available work in the power plant. The power outputs and turbine inlet temperature (TIT) are influenced by varying mass flow rates of fuel and air, consequently affecting the exhaust gas and its composition. This results in a different heat capacity of the exhaust gas.
The simulation solutions for oil and gas operations where thermodynamic cycle modeling was required were performed in the component-based program Aspen HYSYS. The program includes a component library where users can select and specify the attributes of components, including combustion chambers, turbines, pumps, compressors, etc. The Aspen HYSYS model was subsequently solved using a specific method. Finally, the simulation results of the model were compared to those of studies in order to assess its effectiveness. Energy balances are applied to program the components, and streams connect these components. The material composition of each stream can be selected from a component list, along with its attributes such as temperature, pressure, mass flow, etc. Aspen HYSYS has the capability to replicate both the steady-state and dynamic performance of complex chemical/hydrocarbon fluid-based processes by connecting various components through material and energy streams [27,28,29,30,31]. This enables the simulation of power plants and related energy options or systems. In Aspen HYSYS, all plant components must be solved sequentially rather than simultaneously. Aspen HYSYS encounters significant challenges due to the highly complex steam circuits involving mass and energy recycling in CCGT plants, necessitating simultaneous solutions. The Peng-Robinson fluid package was utilized for air, fuel, and exhaust gas, while the ASME steam table was employed for water and steam. The combustor was simulated using the Conversion Reactor module. Tailored to the project’s needs, certain library components have been created and integrated. For instance, the combustion chamber has been modified and programmed to facilitate the combustion of hydrogen, replacing natural gas or a CH4/H2 mixture. Fuel combustion was specified through a set of conversion reactions with 100% efficiency, and heat loss from the combustion chamber was assumed to be constant for all fuels under study. The mass of air supplied to the compressor was calculated based on the combustion reaction of the CH4 and H2 mixture (Equation (1)), considering the equivalence ratio. The choice of the equivalence ratio was determined through iterative processes to achieve a consistent turbine inlet temperature (TIT) of 1723 K for all tested fuels. For pure methane, the turbine’s isentropic efficiency was set to 0.86 to match the published flue gas temperature. An isentropic of compressor efficiency of 0.88 was selected to obtain a simple cycle efficiency of 36.4%, according to data presented in [32].
m a i r = m f ·   ( 2 x C H 4 + 0.5 x H 2 ) ρ a i r 0.209 φ
where xCH4, and xH2 denote the molar fraction of CH4 and H2 in the fuel, φ denotes the equivalence ratio, and ρair is air density in standard conditions. Mass flow rates of fuel were calculated with a constant input power Qin = 50 MW, according to Formula (2).
m f = Q i n ( g C H 4 · L H V m , C H 4 + g H 2 · L H V m ,   H 2 )
where gCH4 and gH2 are mass fraction of fuel components and LHVm is the low heating value.
Fuel characterizations are presented in Table 1, while the most important initial parameters for studied cycles are listed in Table 2.
Thermal efficiency for the GT, CCGT, and CCGTP plants was computed as follows:
η = W n e t Q i n
where the power outputs for GT cycle was calculated according to Formula (4) and for CCGT, CCGTP to Formula (5).
W n e t , G T = W t W c
W n e t , C C G T ( C C G T P ) = W t + W s t W c W p
The water pump was simulated by the Pump module in Aspen HYSYS and the power (Wp) required to drive it was determined for 95 bar and 378 K.

2.2. Toxic Compounds Emission Modelling

The combustion process of CH4/H2 fuel in a rich-quench-lean (RQL) combustor was modeled using ANSYS Chemkin-Pro 2023R1 software. The system, characterized by multi-stage combustion at various equivalence ratios, was represented by a chemical reactor network (CRN), as illustrated in Figure 1 [36]. The mass of recirculated exhaust gas was determined based on findings from Valera-Medina [37] and Mashruk [38], amounting to 30% of the mass. Subsequently, the recirculated exhaust gas stream was divided into two parts: 30% of the exhaust mass was fed to the mixing zone and the remaining part to the flame zone. The outlet from the flame zone was supplied to the plug flow reactor (PFR) to simulate reactions in the post-flame zone. The quenching/mixing zone was modeled using a partially stirred reactor (PaSR) and the lean-burning zone was modeled using another PFR.
The reaction mechanism GRI-Mech 3.0 0 was relied upon to predict chemical species formation, especially nitric oxides (NO, NO2, and N2O), for investigated fuels. Simulations were performed for six fuels: pure methane, pure hydrogen, and four CH4/H2 mixtures (Table 1). The other parameters for the calculations were adopted according to the data obtained during the gas turbine cycle calculations in Aspen HYSYS as well as on the basis of other previous research works (Table 3).
Different hydrogen properties such as increased diffusivity and SFT resulted in changing some boundary conditions. For example, in the calculations, the residence time of reactants in the flame zone was reduced, and the amount of air supplied to the lean-burn zone was increased to maintain the published temperature.

3. Results and Discussion

3.1. Gas Turbine Operation Analysis

All cycles are modeled under the assumption that air can be freely supplied, and hydrogen is delivered as pressurized fuel from high-temperature electrolysis. For the thermodynamic analysis of gas turbine cycles, three CH4/H2 fuels were chosen, containing 20%, 40%, and 50% vol. of H2. Additionally, pure methane and hydrogen were used as supplementary fuels. The gas turbine consists of an air compressor (C) and a turbine (T) operating on a common shaft, with a combustor (CC) situated in between. The model incorporates direct combustion, where fuels react with compressed air at 823 K and 2.83 MPa in the combustion chamber, undergoing a constant-pressure process to produce gases at the required temperature TIT = 1723 K. The TIT is achieved at an equivalence air ratio of 0.4 for CH4/H2 mixture and 0.36 for 100% hydrogen fuel. The adopted model assumes no air mass loss between the compressor and the combustion chamber.

3.1.1. Simple Gas Turbine System

Figure 2 presents a simplified schematic picture of the modeled gas turbine cycle, with the thermodynamic parameters detailed in Table 4. Under the assumption of a constant compression ratio, initial parameters for air and fuel, and a constant turbine inlet temperature (TIT), the variable parameters in the cycle include the exhaust gas temperature, as well as the operation of the compressor and turbine.
As the proportion of H2 in the fuel increases, the work required for air compression decreases. This is attributed to the lower specific air demand for energy delivered with hydrogen fuels. Conversely, the turbine power (WT) shows a downward trend with increasing H2 content in the fuel, influenced by decrease of mass flue gases passing through the turbine. This effect is diminished by an increase in the heat capacity of the flue gas resulting from an increase in the share of water vapor. Consequently, a higher energy value available for the turbine per unit mass and temperature difference is achieved. Based on the above observations, the highest thermal efficiency, calculated using Equation (3), was achieved with pure hydrogen at 40.2%, surpassing the pure methane-fueled cycle by 0.8%. The thermal efficiency and Wnet values for the analyzed fuels are illustrated in Figure 3.

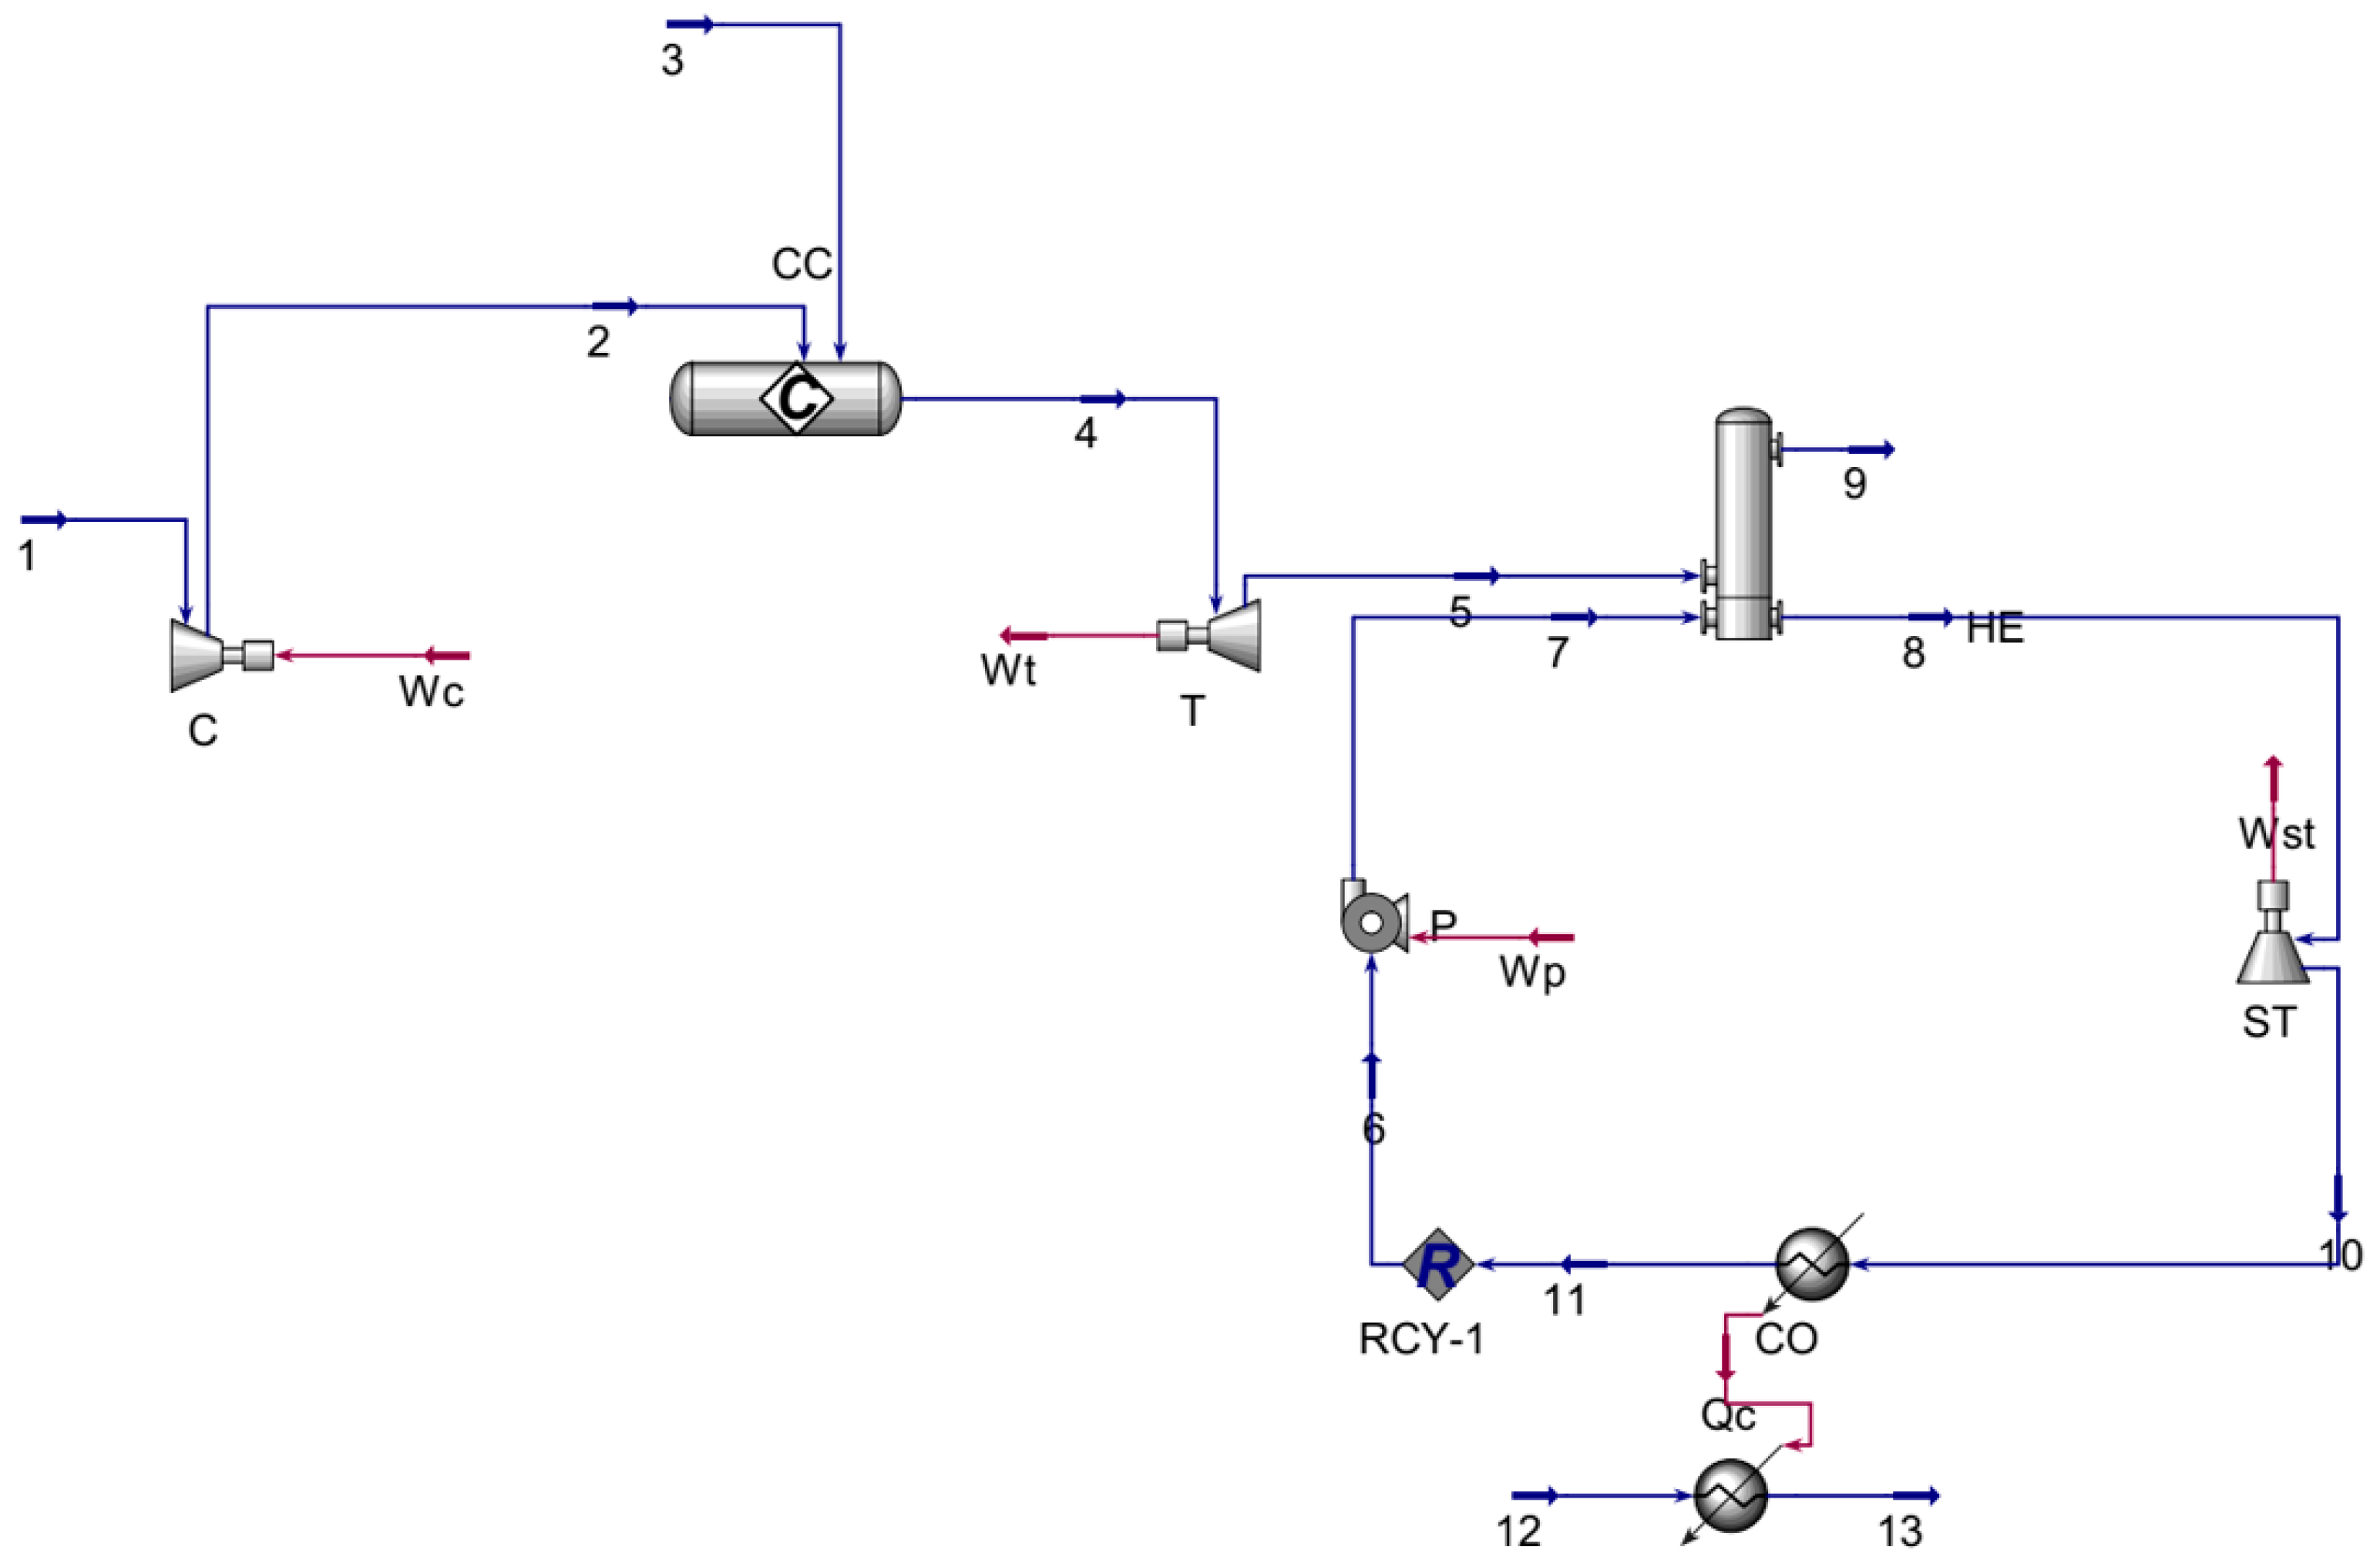
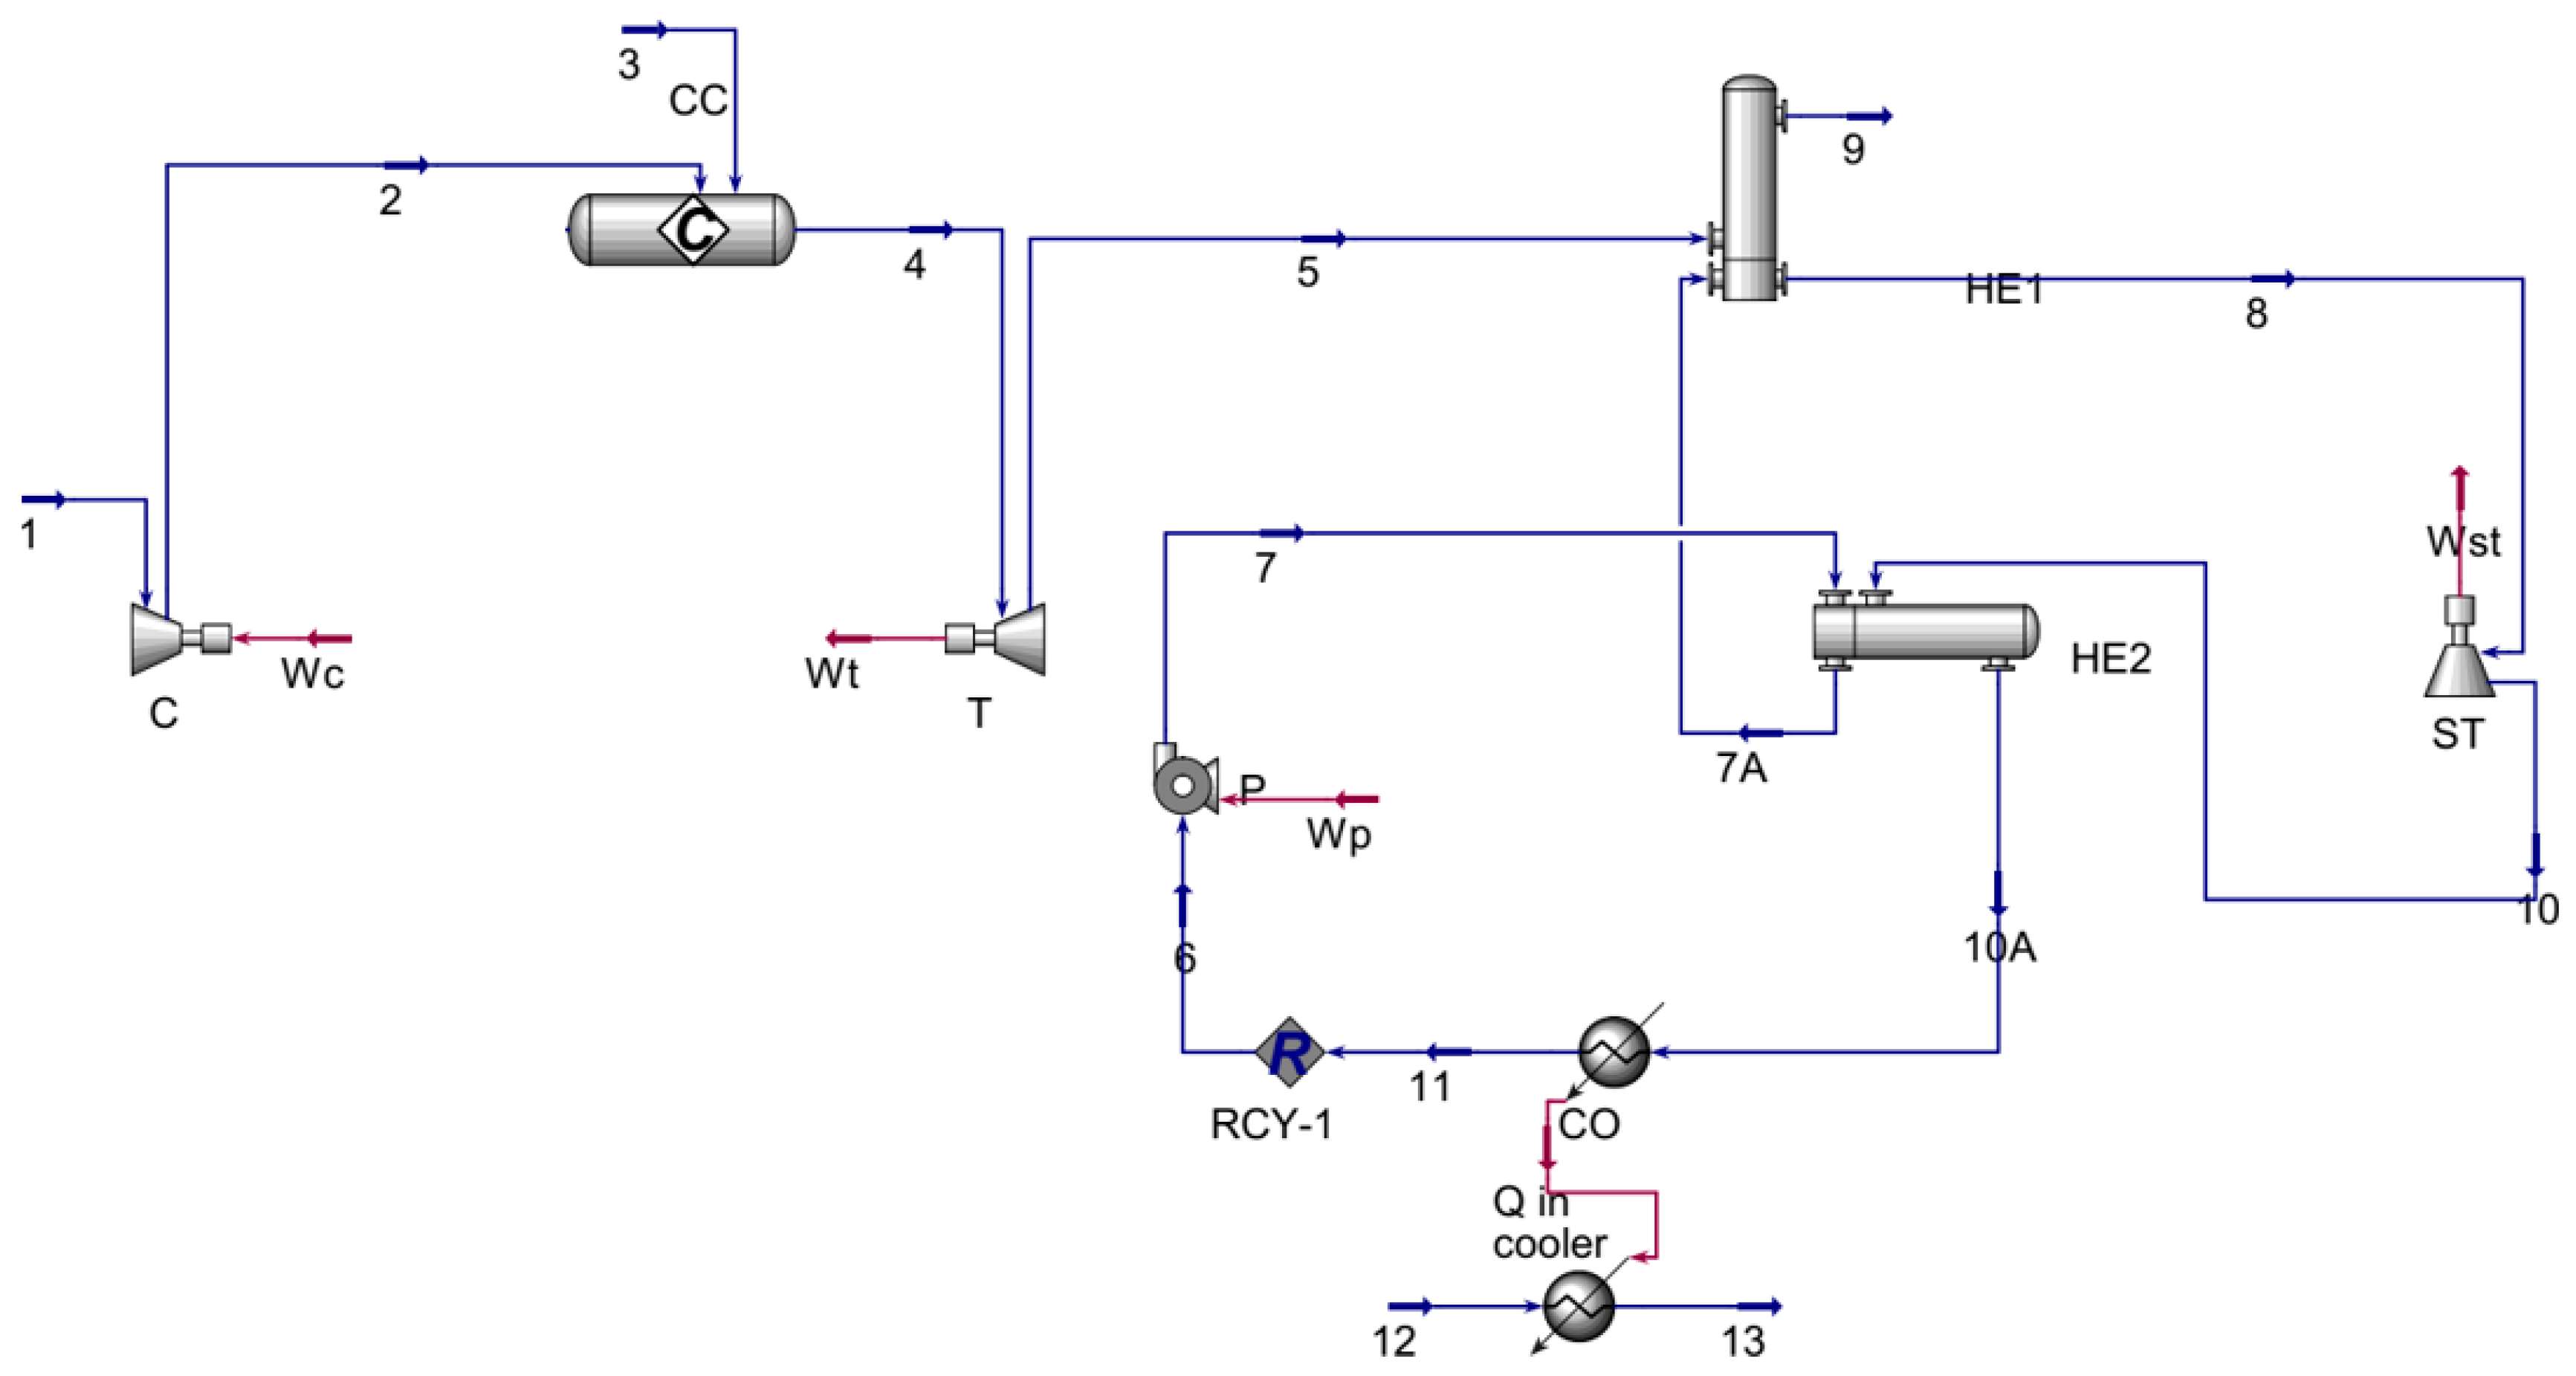
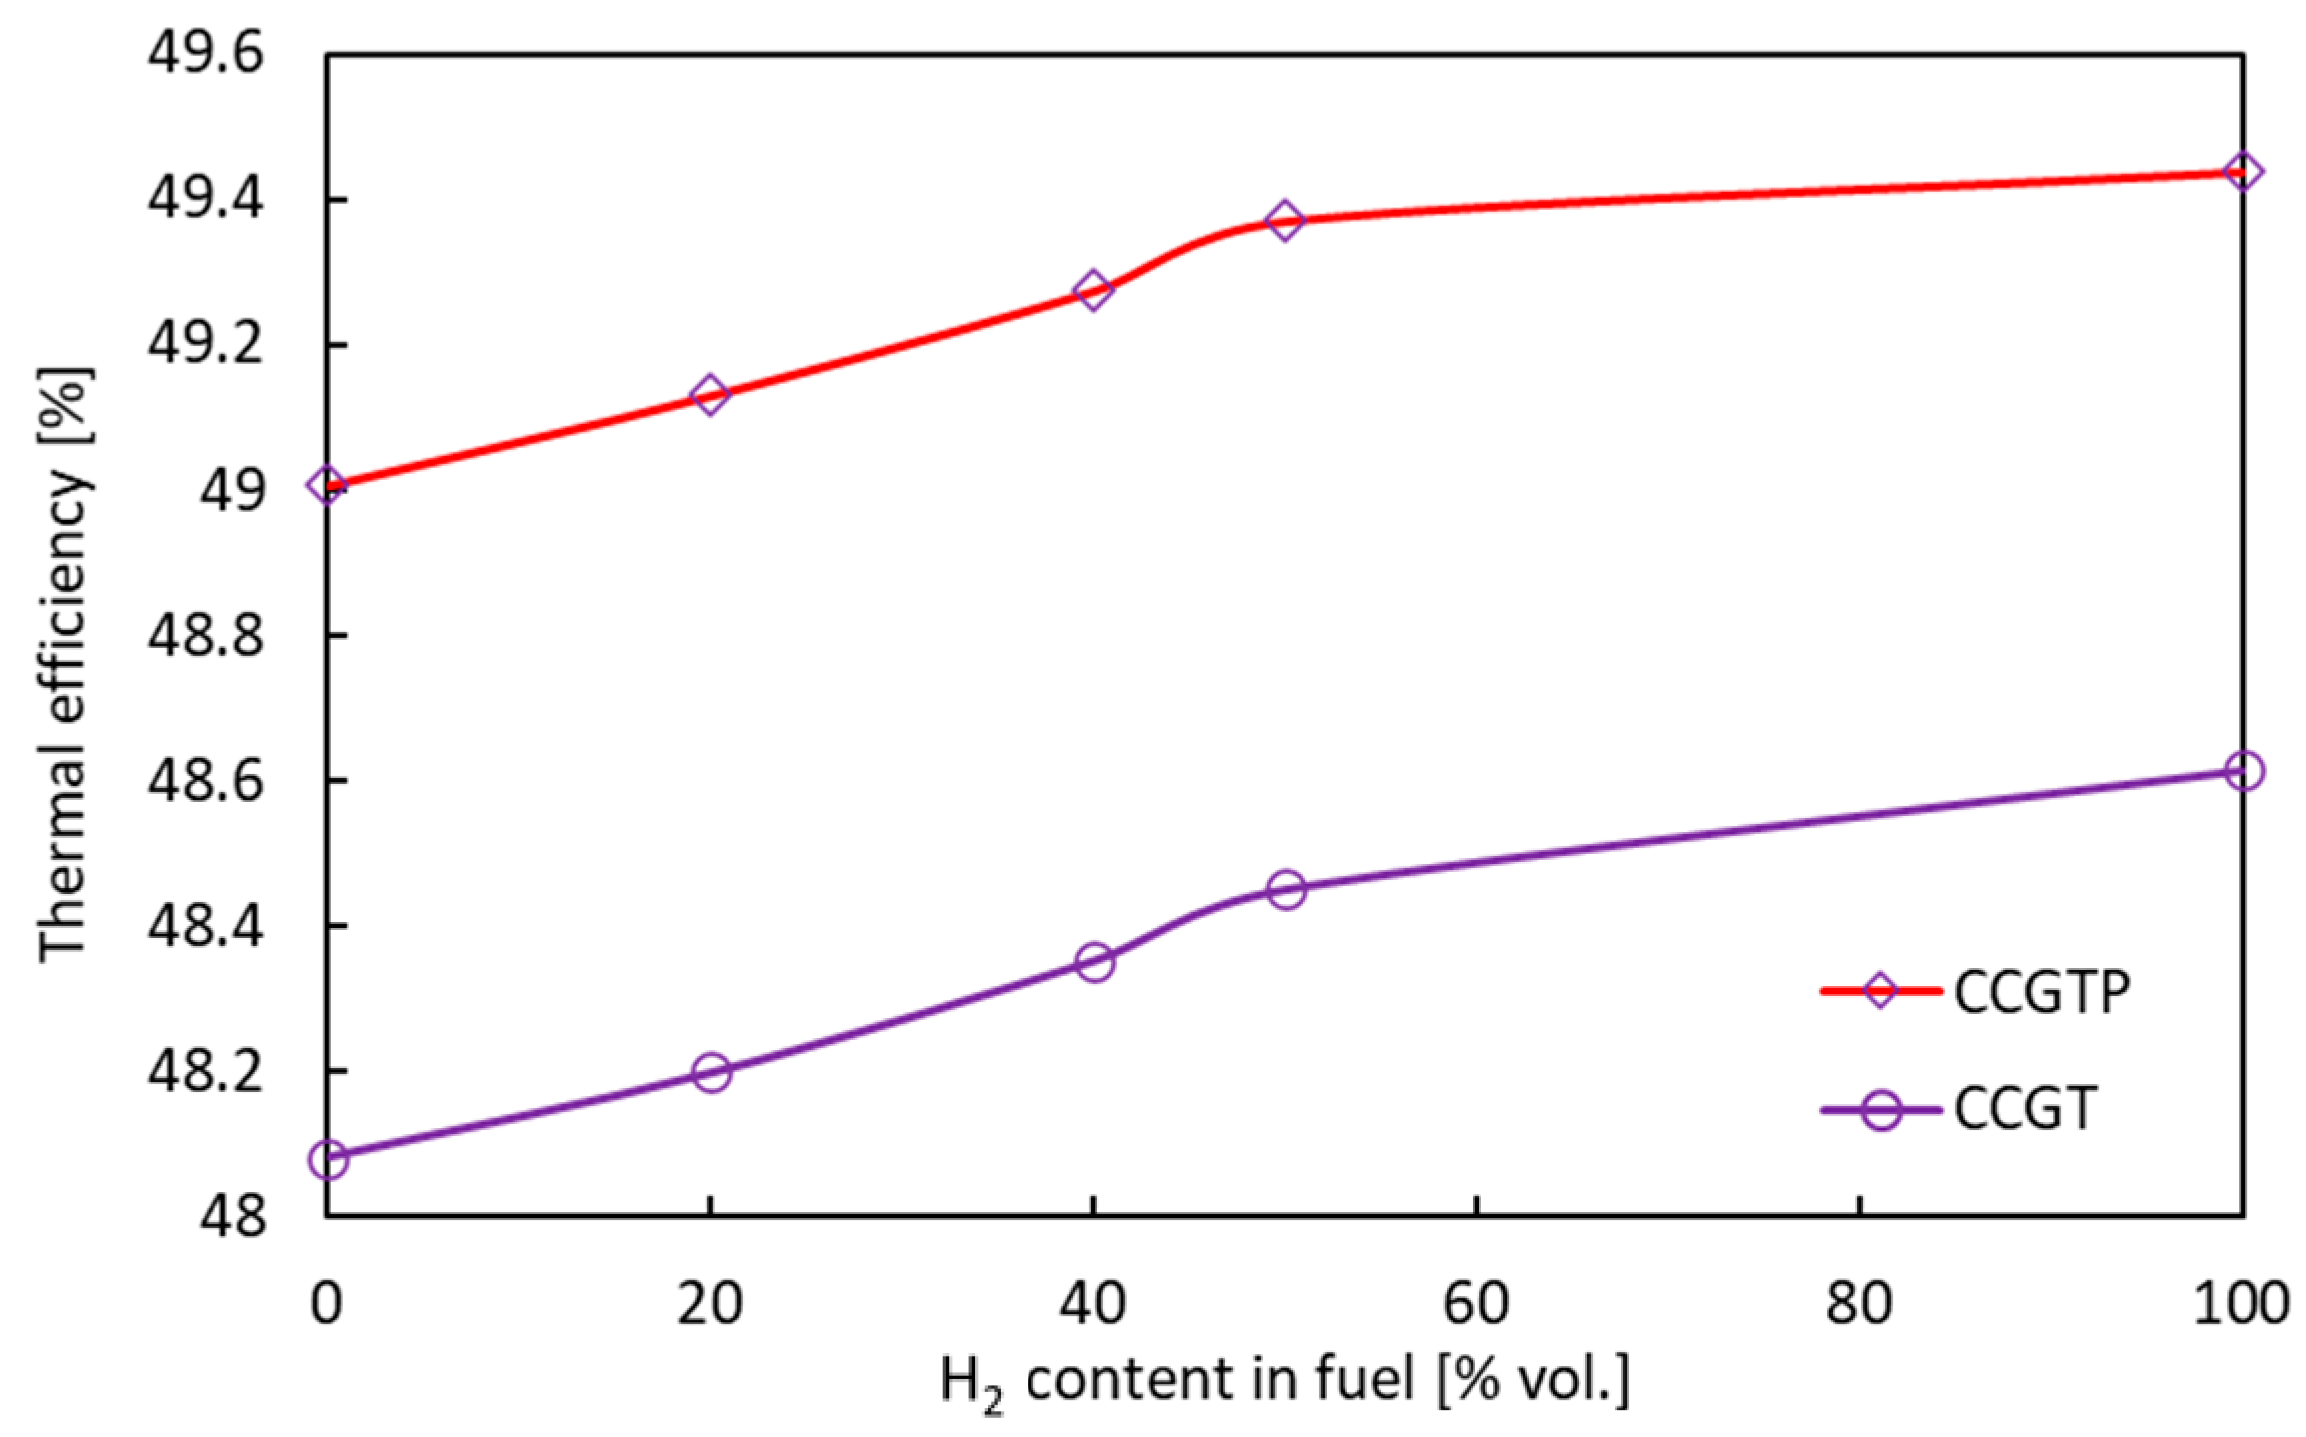
3.1.2. Combined Cycle Gas Turbine CCGT

Given that the temperature of the flue gas exiting the gas turbine is approximately 930 K, there is an additional opportunity to enhance the primary energy utilization by implementing a wet cycle. The conducted analysis evaluated the impact of the fuel composition supplied to the upper cycle on the thermodynamic parameters of the combined cycle gas turbine system. The studies were conducted for two systems: the conventional combined cycle gas turbine (CCGT) system (Figure 4) and the CCGT system with additional heat recovery, denoted as CCGTP (Figure 5).
The exhaust gas from the gas turbine then passes through the heat recovery steam boiler (HE) before being released into the environment as flue gas. The HE extracts the remaining heat from the exhaust gas to produce steam. The CCGTP model incorporates an additional HE2 exchanger, which reheats the water using the energy received from the steam exiting the steam turbine. For the analyses of both CCGT and CCGTP, the recovery boiler was assumed to produce steam at a pressure of 9.5 MPa and a temperature of 803 K. The HE was supplied with water at 9.5 MPa and 378 K. The flue gas temperature (T9 in Figure 4 and Figure 5) leaving the boiler was kept constant for all investigated fuels at 503 K. The heat transfer process occurred without pressure losses, and a device efficiency of 100% was assumed to maximize the power generated from the system.
The heat generated in the heat recovery steam generator is influenced by key thermodynamic parameters of the flue gas, including temperature, specific heat, and the mass of the flue gas. Altering the fuel composition consequently impacts the available energy. An increase in the proportion of hydrogen in the fuel leads to a higher amount of water vapor in the flue gases, reducing the share of carbon dioxide. At the same temperature of the exhaust gas (TOT), this elevation in water vapor content raises its enthalpy, approximately by 3.2 for pure H2. However, the combustion of pure hydrogen results in a reduction in the mass flux of flue gas flowing through the HRSG (a reduction of about 9% for pure H2), which reduces the amount of steam produced with the required parameters. This leads to a decrease in the generated power on the steam turbine for pure H2 by approximately 3% compared to CH4 as a fuel. The incorporation of an additional recuperative heat exchanger in the CCGTP system results in an increase in power generated on the steam turbine by 0.46 MW for CH4 and 0.41 MW for pure H2. The results of the calculated steam turbine power and cycle power output for the CCGT and CCGTP systems are presented in Table 5, while Figure 6 illustrates the impact of fuel composition on the efficiency of the CCGT and CCGTP systems.
Analyzing the data presented in Figure 6, it is evident that the impact of H2 on the efficiency of the CCGT and CCGTP system is less pronounced than in the case of the simple system. Despite this, an improvement in efficiency is still achieved with an increase in H2 content. This improvement is linked to the greater power generated in the gaseous part of the cycle. However, in the wet part of the cycle, higher power generation values are obtained for hydrocarbon fuels.
Incorporating hydrogen into gas turbine systems (GT and CCGT) additionally contributes to the reduction of greenhouse gas emissions. For the systems studied, substituting methane with hydrogen could result in a reduction of CO2 emissions by over 86 million tons per year.

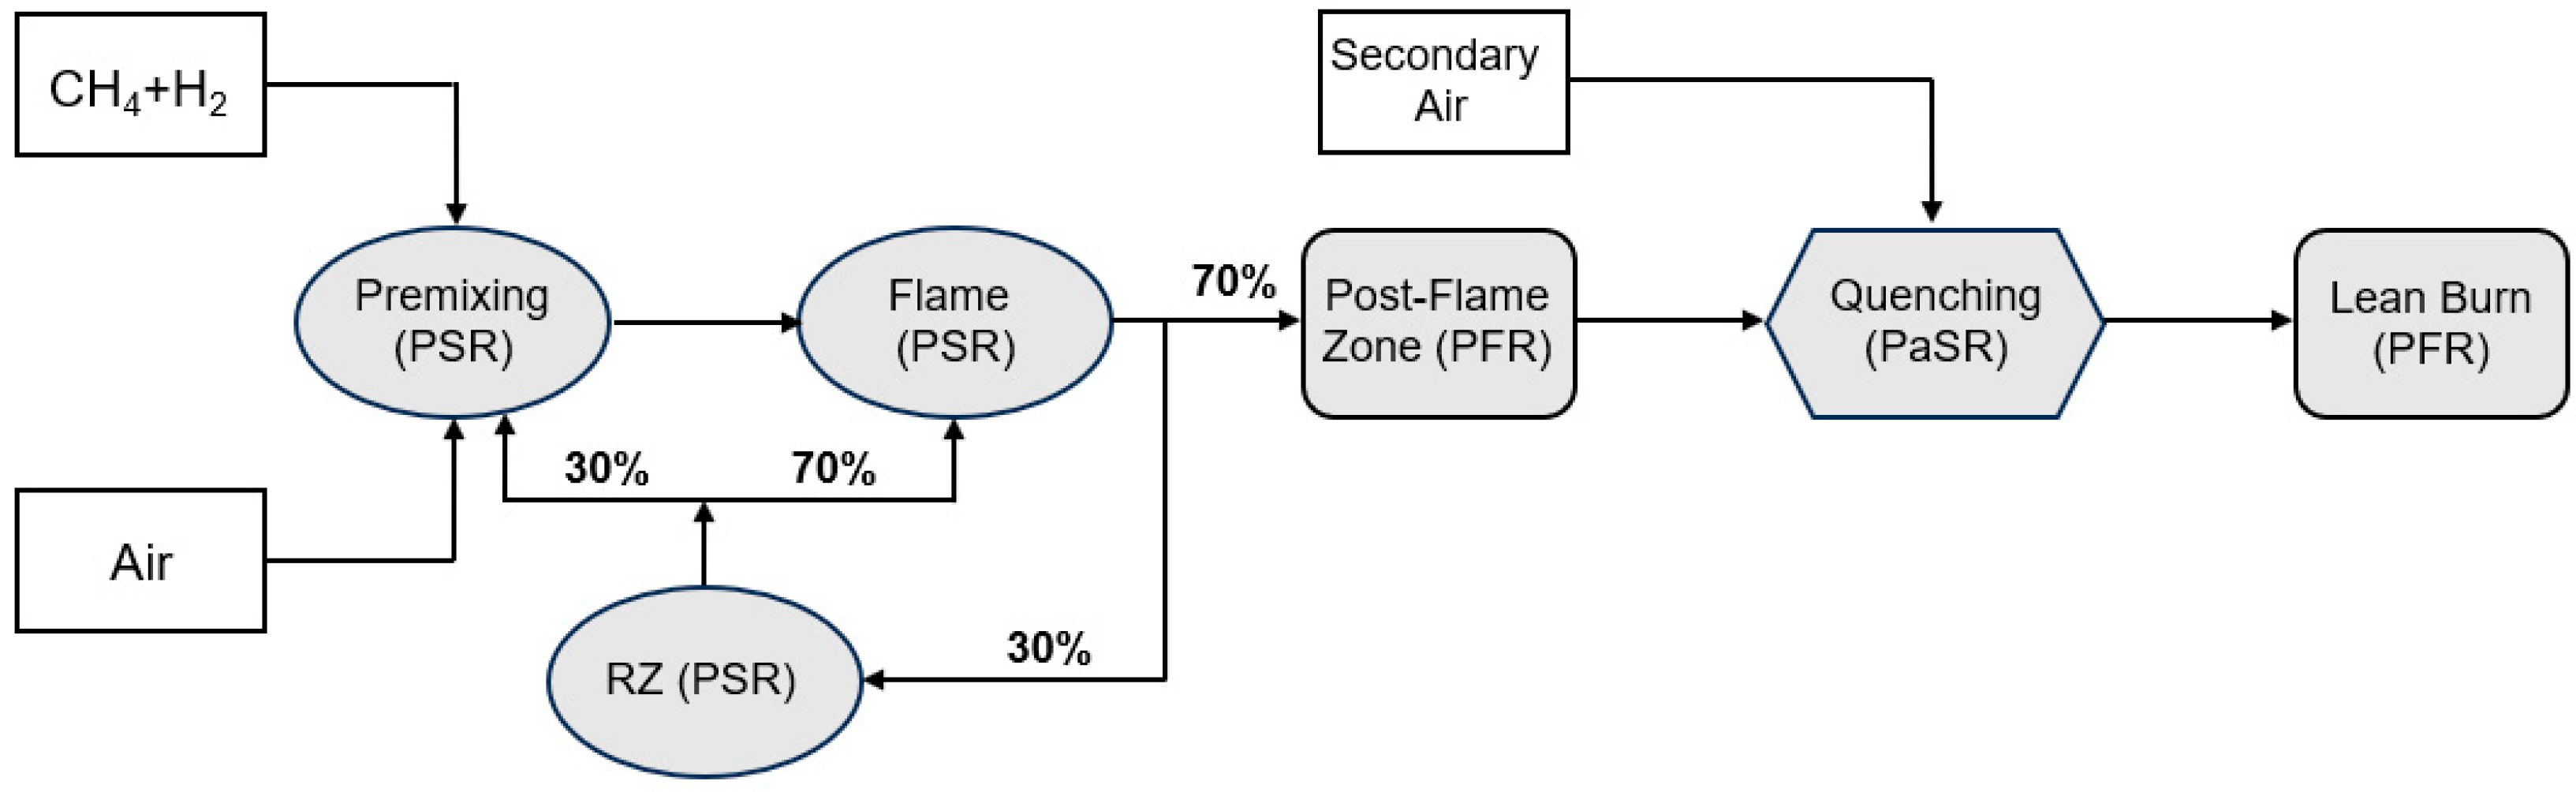
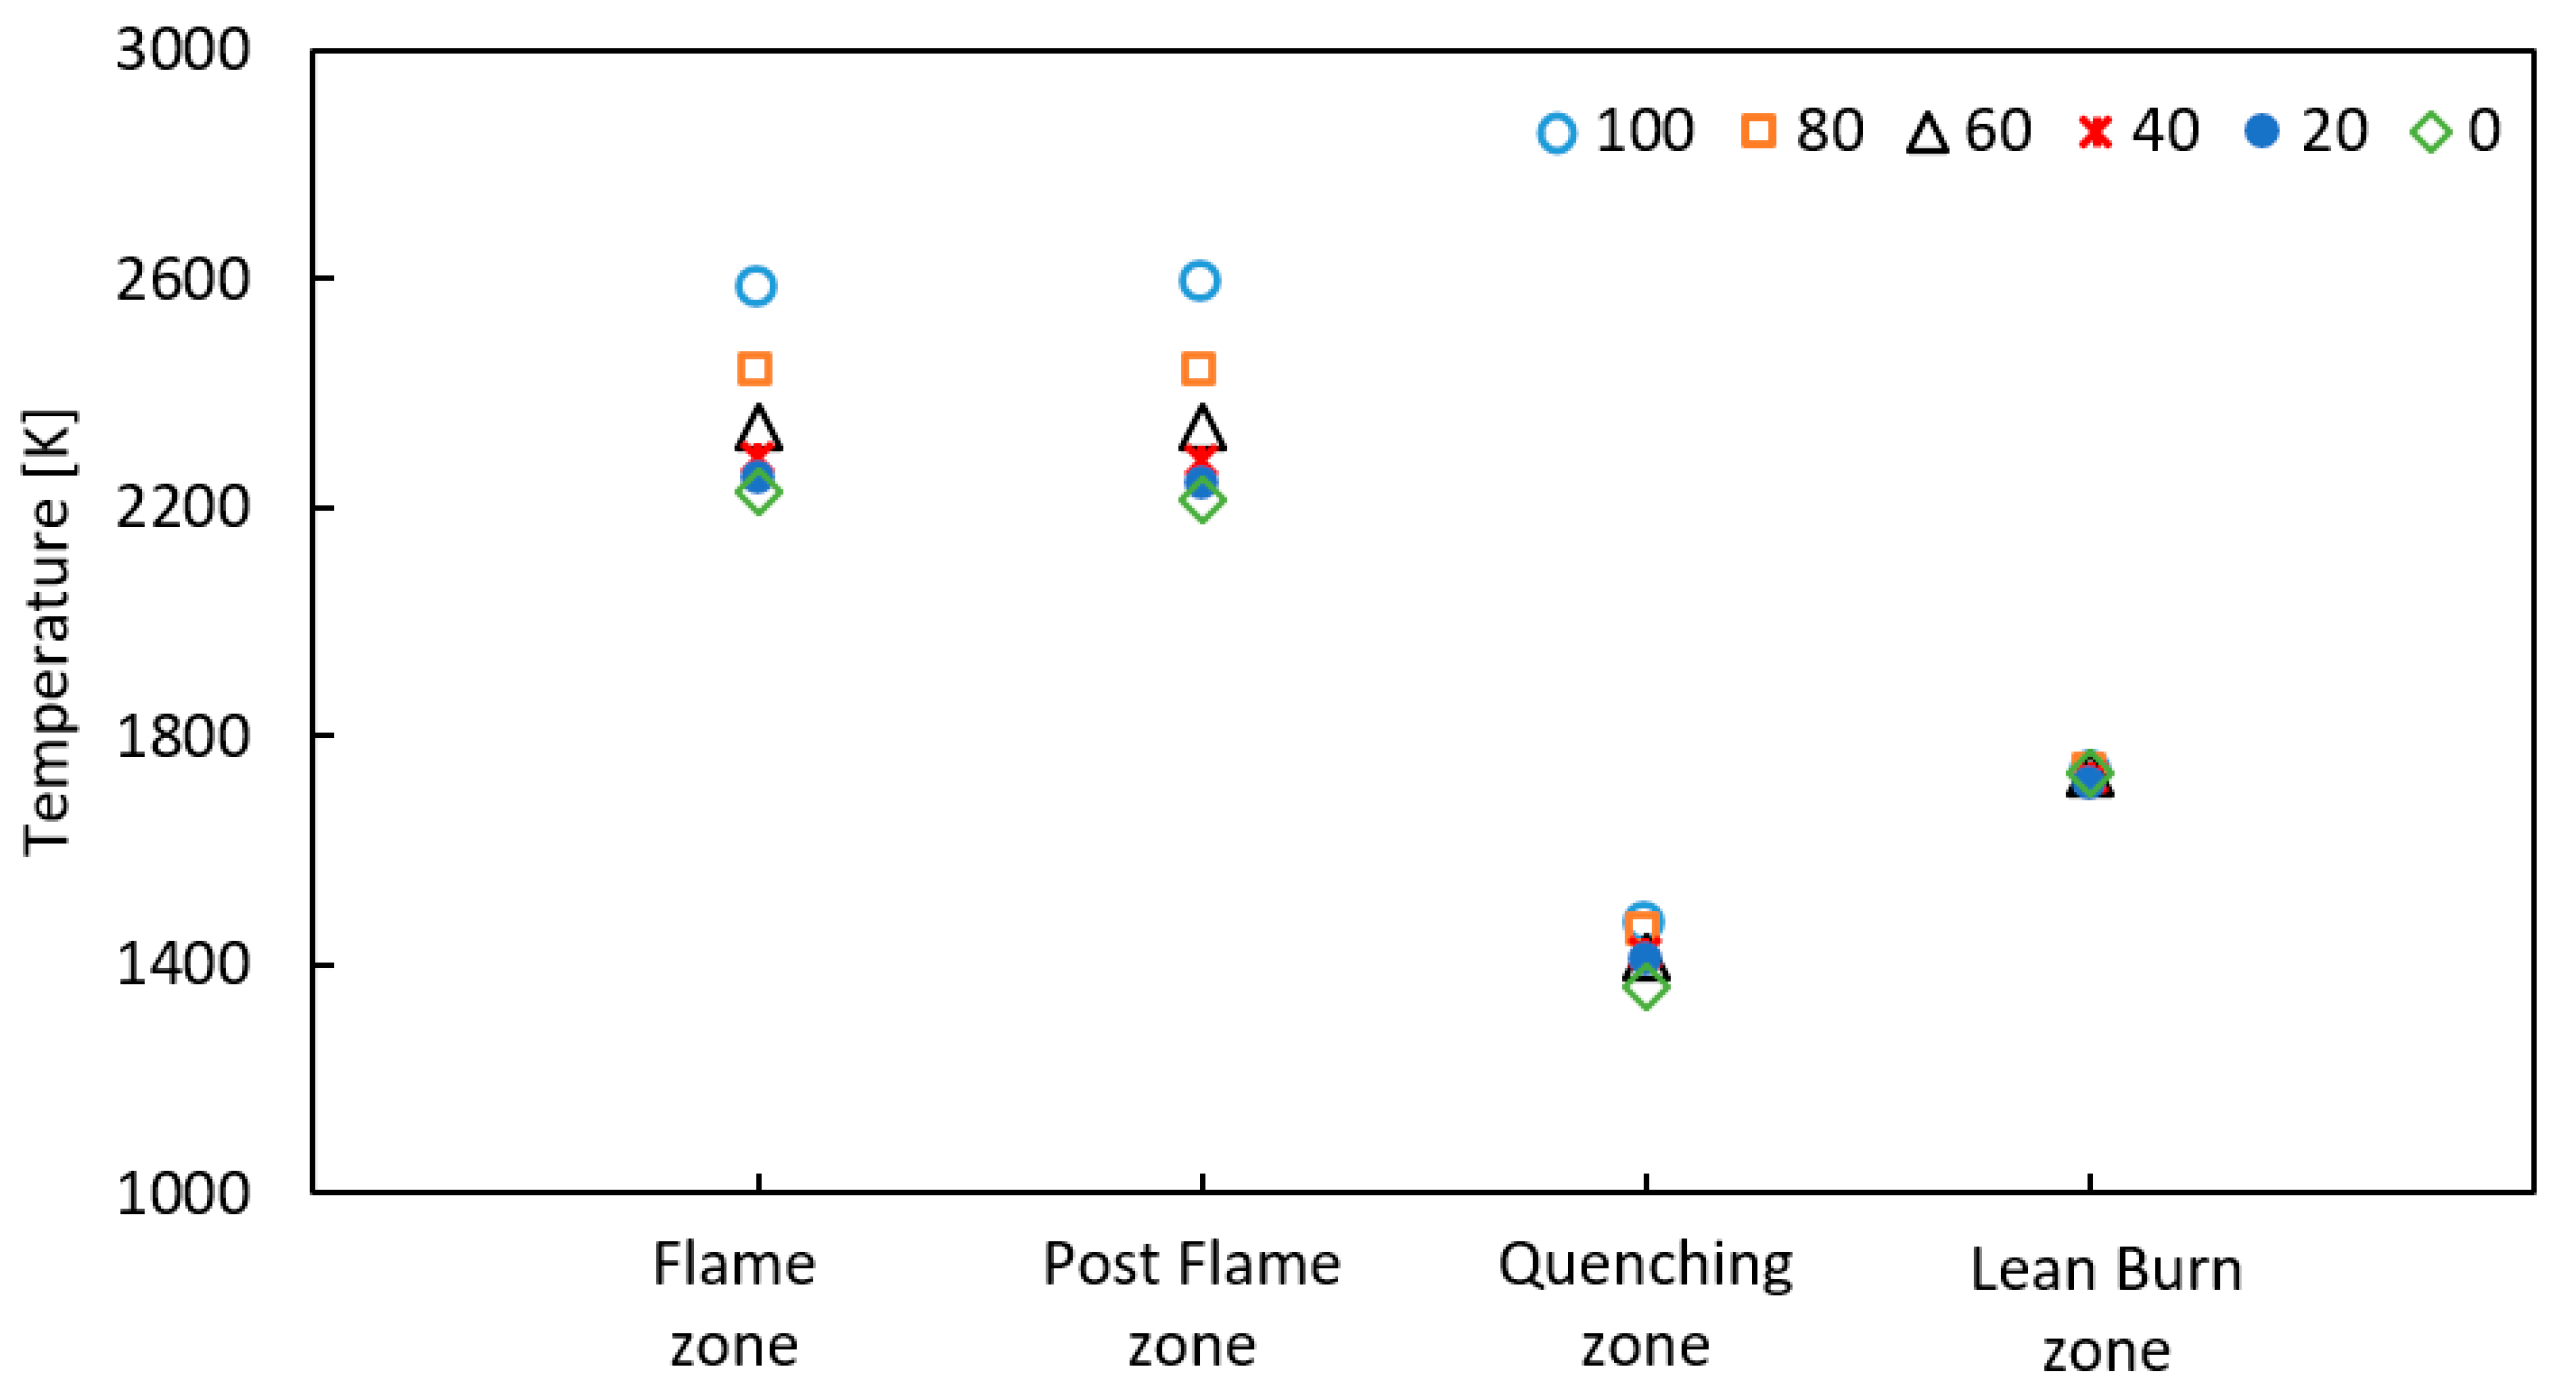
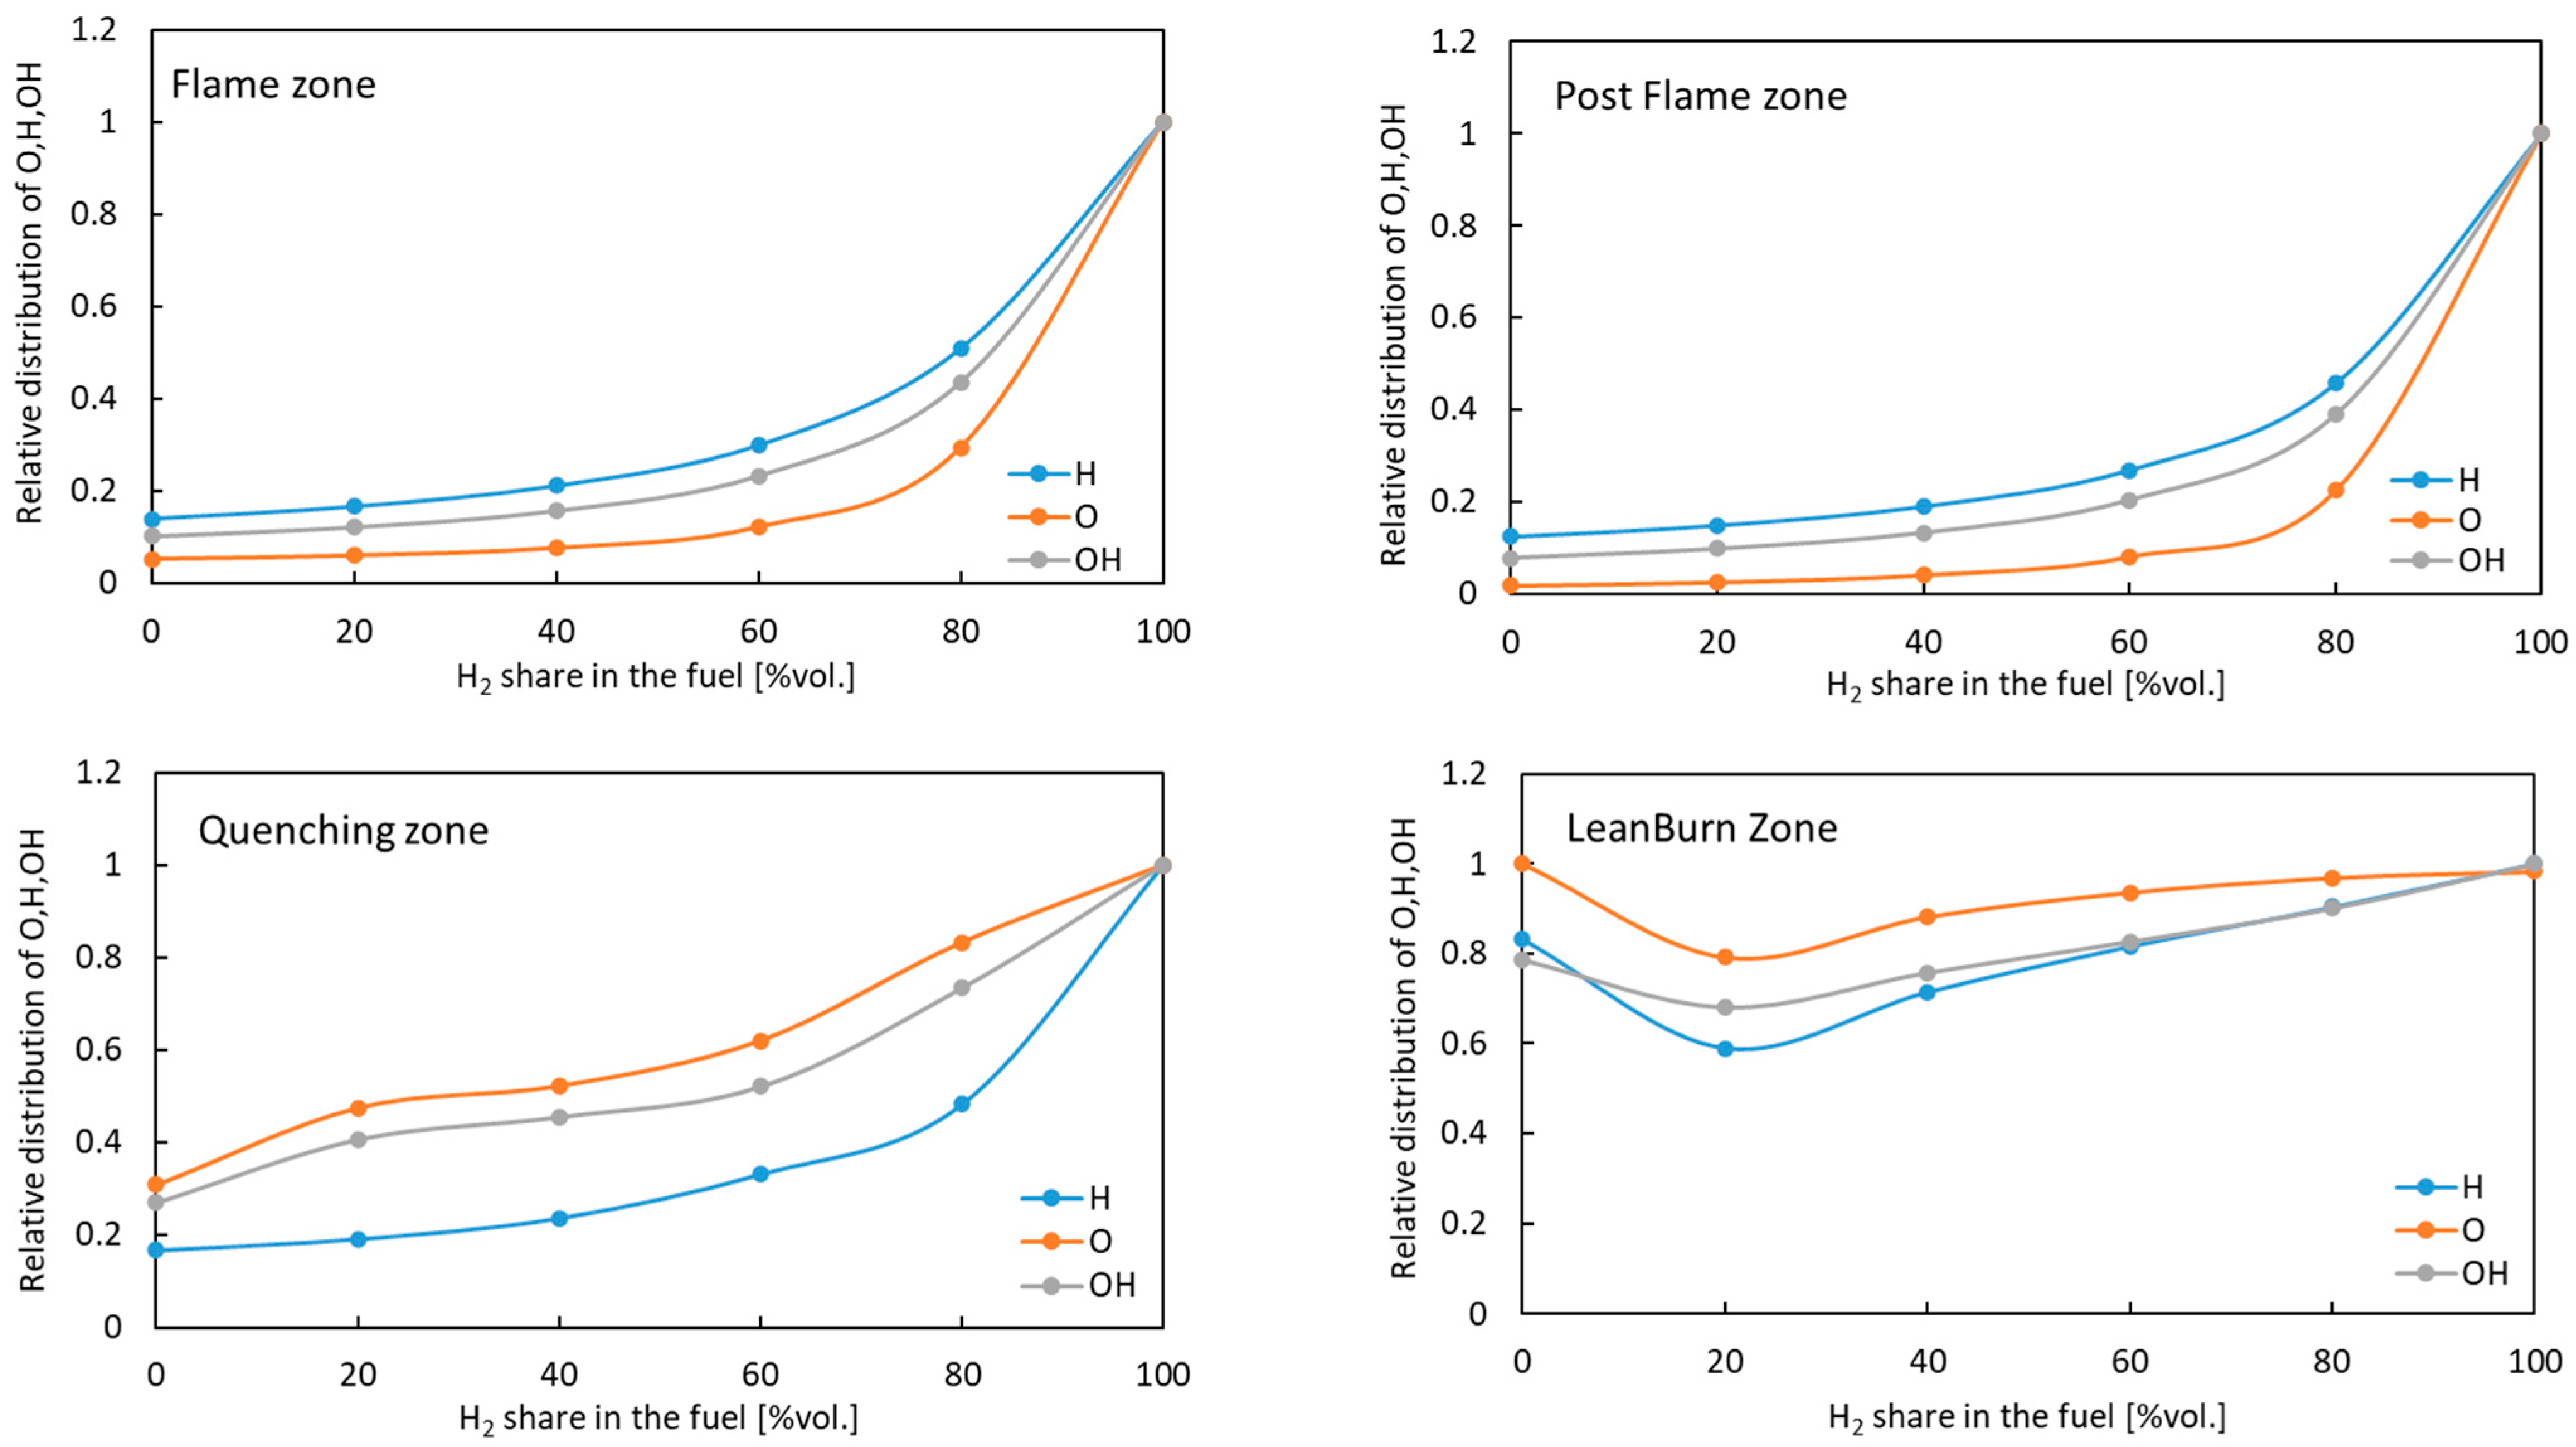
3.2. Numerical Results from the Chemical Reaction Network

One crucial parameter during fuel combustion, including hydrogen fuels, is the emission of toxic compounds, particularly nitrogen oxides (NOx). Their contribution to the overall emission is influenced by factors such as process temperature, oxygen quantity, and the presence of radicals. This subsection presents the results of numerical calculations for NOx emissions during the combustion of CH4/H2 mixtures in the rich-quench-lean (RQL) combustor, using input parameters similar to those in previous analyses. Figure 7 depicts the results of temperature distribution in the RQL combustor for the investigated fuels.
Temperature of the flame increases significantly at the flame zone, where the effect of the hydrogen content in the fuel is the most visible. The value of the maximum temperature increases with increasing H2 and reaches values of 2587 K for pure hydrogen. For fuels with significant H2 content, a further temperature increase of several degrees is noticeable in the post-flame zone. Temperature is then reduced to the required turbine entry temperature via mixing with significantly cooler secondary air at the quenching zone. The further temperature rise in the lean-burn zone is due to the oxidation of combustible compounds contained in the flue gas, such as unburned hydrocarbons and carbon monoxide. The molar fractions of selected chemical compounds are summarized in Table 6 and Table 7.
Analysis of the data shows that the effect of hydrogen in the fuel on NO formation occurs in every zone of the combustion chamber. In the highest-temperature area (the flame zone and post-flame zone), increasing the share of H2 raises the amount of NO, even despite the absence of oxygen (φ = 1.8). The largest increase in nitrogen oxides (tripling the value) is recorded in the quenching zone. This area is characterized by the lowest temperature but with the highest proportion of oxygen and free radicals (OH, O, and H). The amount of O, H, and OH radicals in the quenching zone rises with the increase in the molar percentage of H2 in the fuel and is, respectively, six times higher for H and 3.5 times higher for O and OH radicals when burning pure hydrogen. This zone produces a negligible amount of nitrogen dioxide, which is partially reduced in the lean-burn zone. The relative distribution of the free radical content (H, O, and OH) in specific zones of the RQL combustor with respect to the H2 content in the fuel is shown in Figure 8. A value of 1 indicates the highest concentration of radicals in the investigated zones. The largest increase in the proportion of O, H, and OH free radicals is noticeable for fuel hydrogen content above 60% vol. in three of the analyzed RQL zones. This results in an intensification of the formation of nitrogen oxides, especially in the quenching zone (an 83% increase in emissions after increasing the share of H2 from 60 to 80%). The reaction pathway of nitric oxide formation in the quenching zone is presented in Figure 9. In the lean-burn zone, the amount of radicals is at a similar level regardless of fuel composition.
Sensitivity analysis of formation mechanism of nitrogen oxides in the quenching zone (PaSR reactor) showed that for all fuels analyzed, the main reaction is that of HNO + H ↔ H2 + NO. Increasing the share of hydrogen in the fuel to 100% vol. results in an increase in net reaction rate by several times compared to methane, mainly through increased supply of H radicals. In addition, the increased availability of oxygen and O and HO radicals in the quenching zone also affects minor reactions of NO formation, such as HNO + O ↔ NO + OH, HNO + O2 ↔ HO2 + NO and HNO + OH ↔ NO + H2O. The further increase in NO emissions formed in the lean-burn zone reactor is based on the oxidation reaction of nitrogen N through OH radicals (N + OH ↔ NO + H) and O2 (N + O2 ↔ NO + O). For fuels with 80 and 100% vol. H2 content, the amine radical oxidation reaction also contributes to the increase in NO production (NH + O ↔ NO + H and NH + O2 ↔ NO + OH).
Final normalized NOx emissions (which have been normalized to 15% oxygen in accordance with gas turbine standards) are presented in Figure 10.
The final emissions values obtained exceed the permissible limits under the legislation [39]. However, they clearly show the effect of hydrogen on NOx formation. Any addition of H2 to the fuel raises the final NOx emissions, which must be taken into account when modifying combustion systems in gas turbines in the decarbonization of electricity production by introducing green hydrogen.

4. Conclusions

In the present work, numerical investigation has been carried out to examine the effects of hydrogen addition to methane fuel on gas turbine operation parameters like efficiency, work output, and toxic compound emissions. The following is concluded:
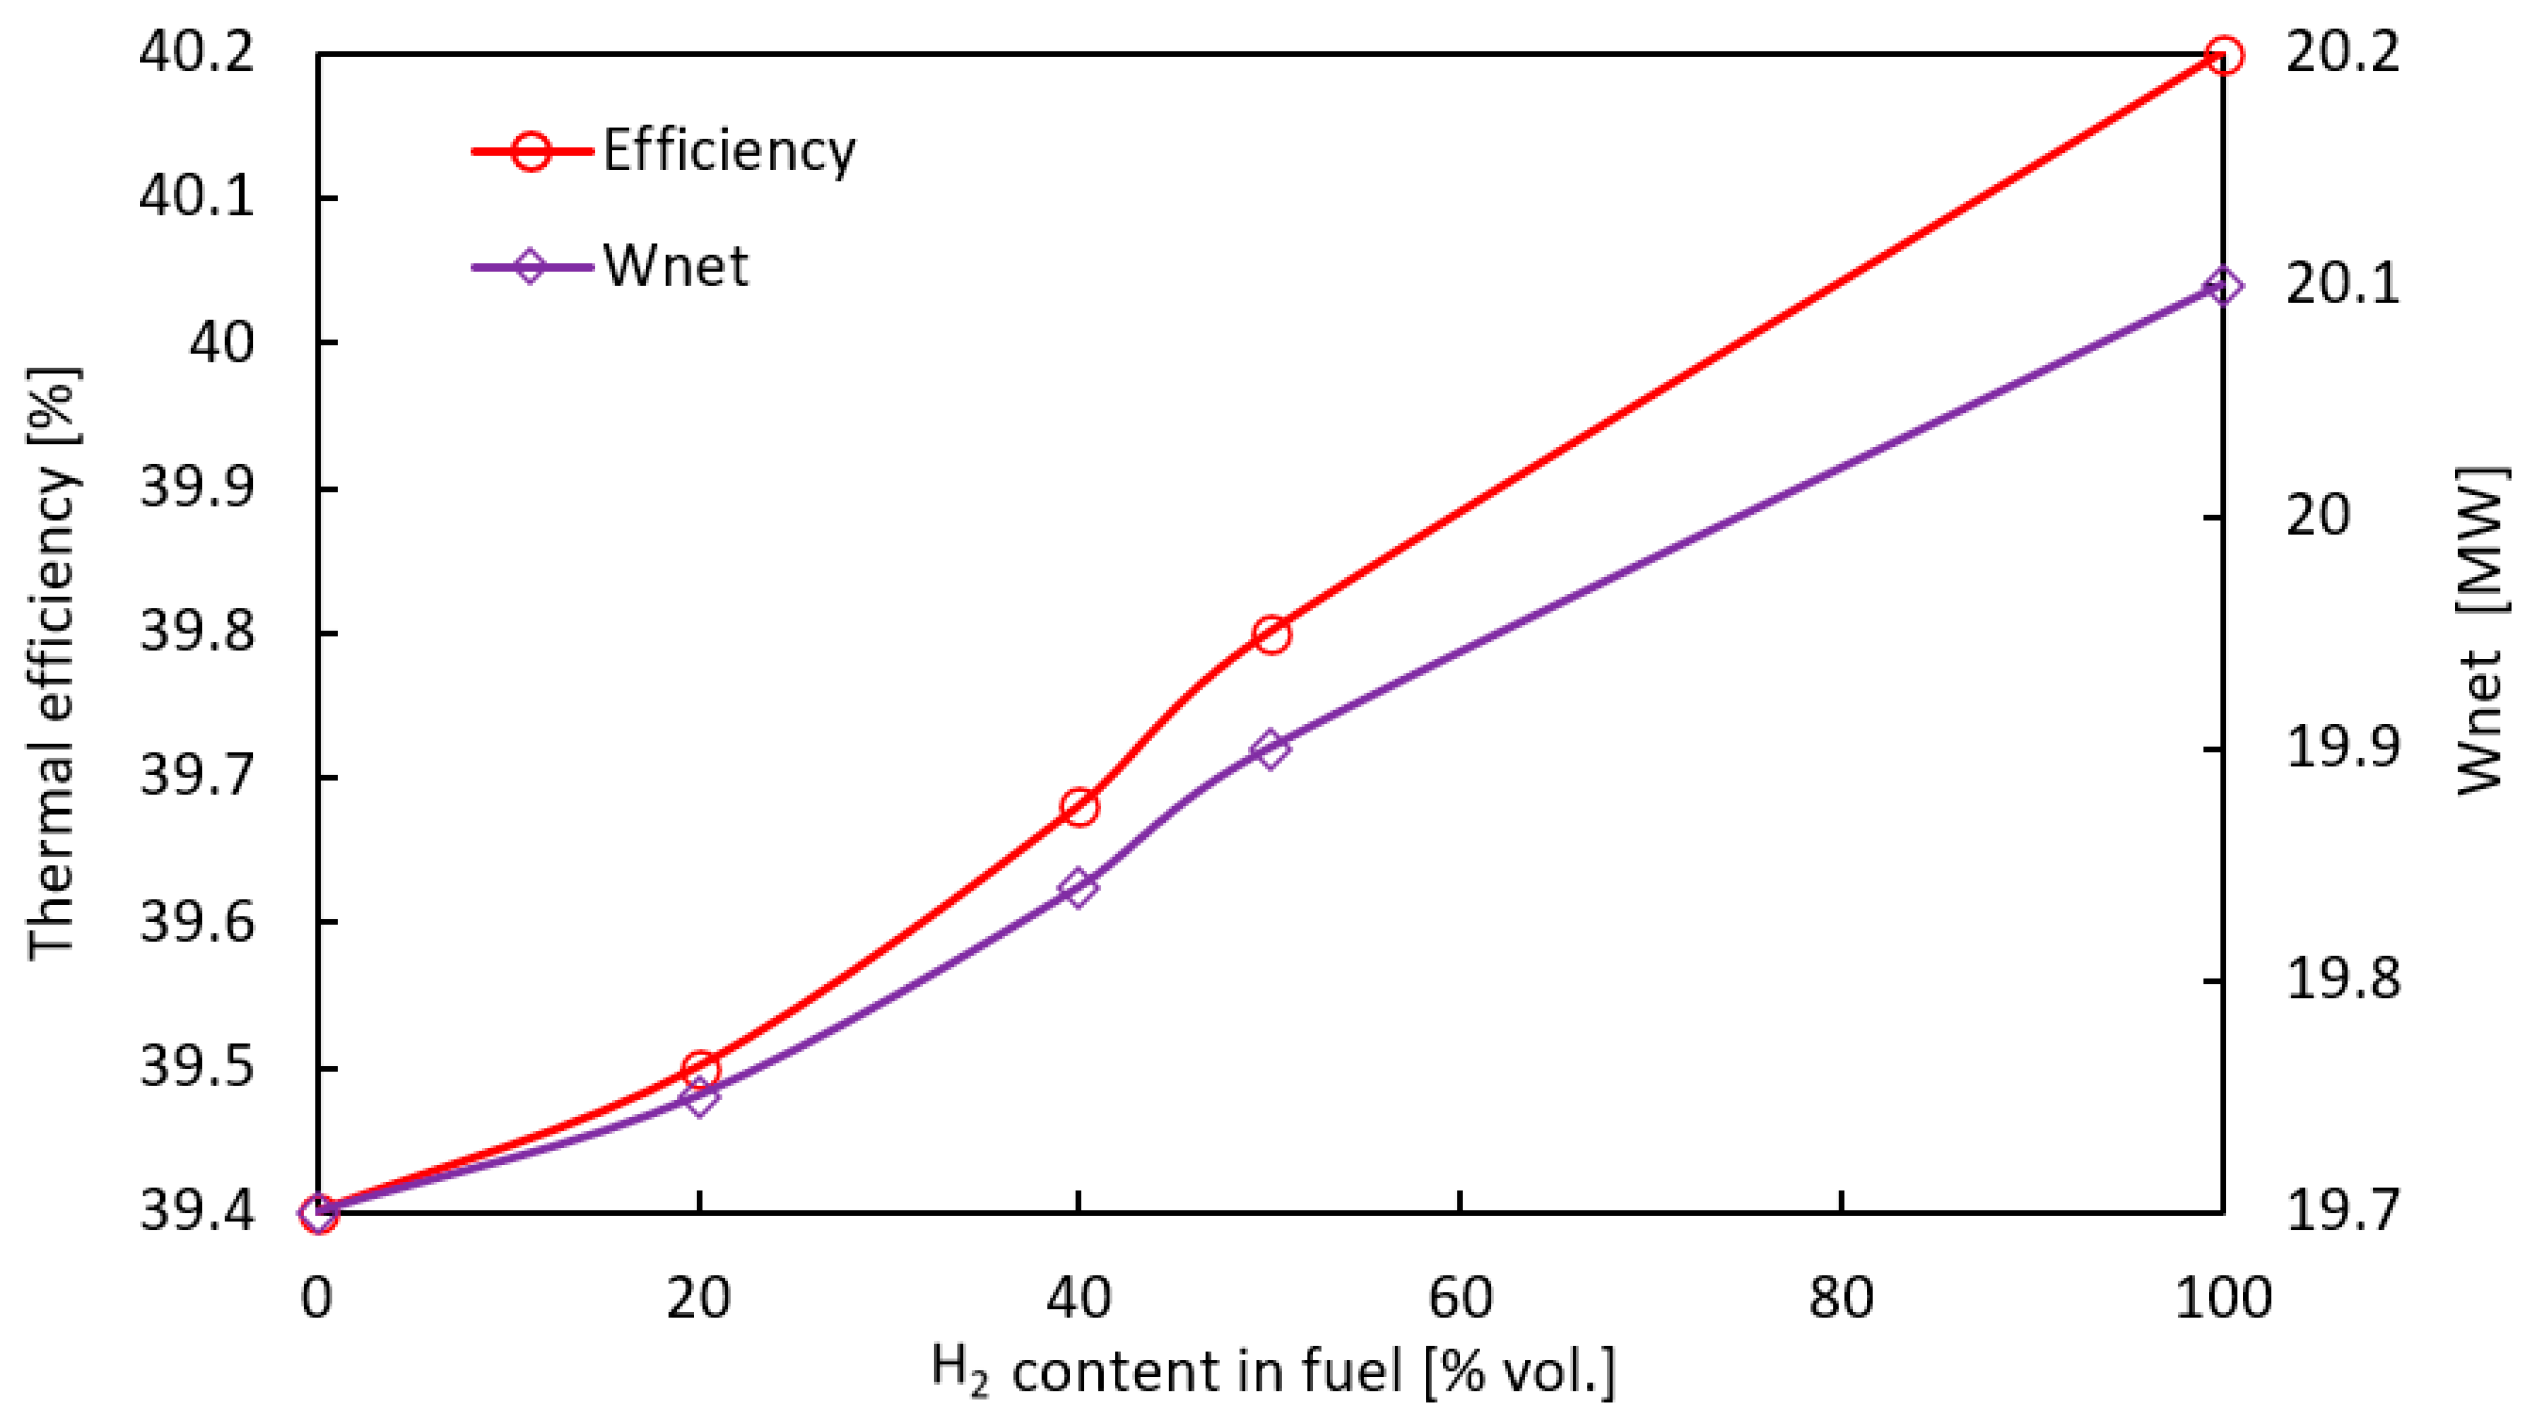
  • Substitution of hydrocarbon fuels with hydrogen contributed to increased efficiency and generated power in both GT and CCGT thermodynamic cycles. The main reason is an increase in the enthalpy of the flue gas due to an increase in the share of water vapor in the flue gas. This allows efficiency gains of 0.8% and 0.53% for the TG and CCGT systems, respectively. The lower growth for the combined system is due to lower power output of the steam turbine as a result of the reduction of the exhaust gas mass flux by about 9% when changing the fuel from CH4 to H2.
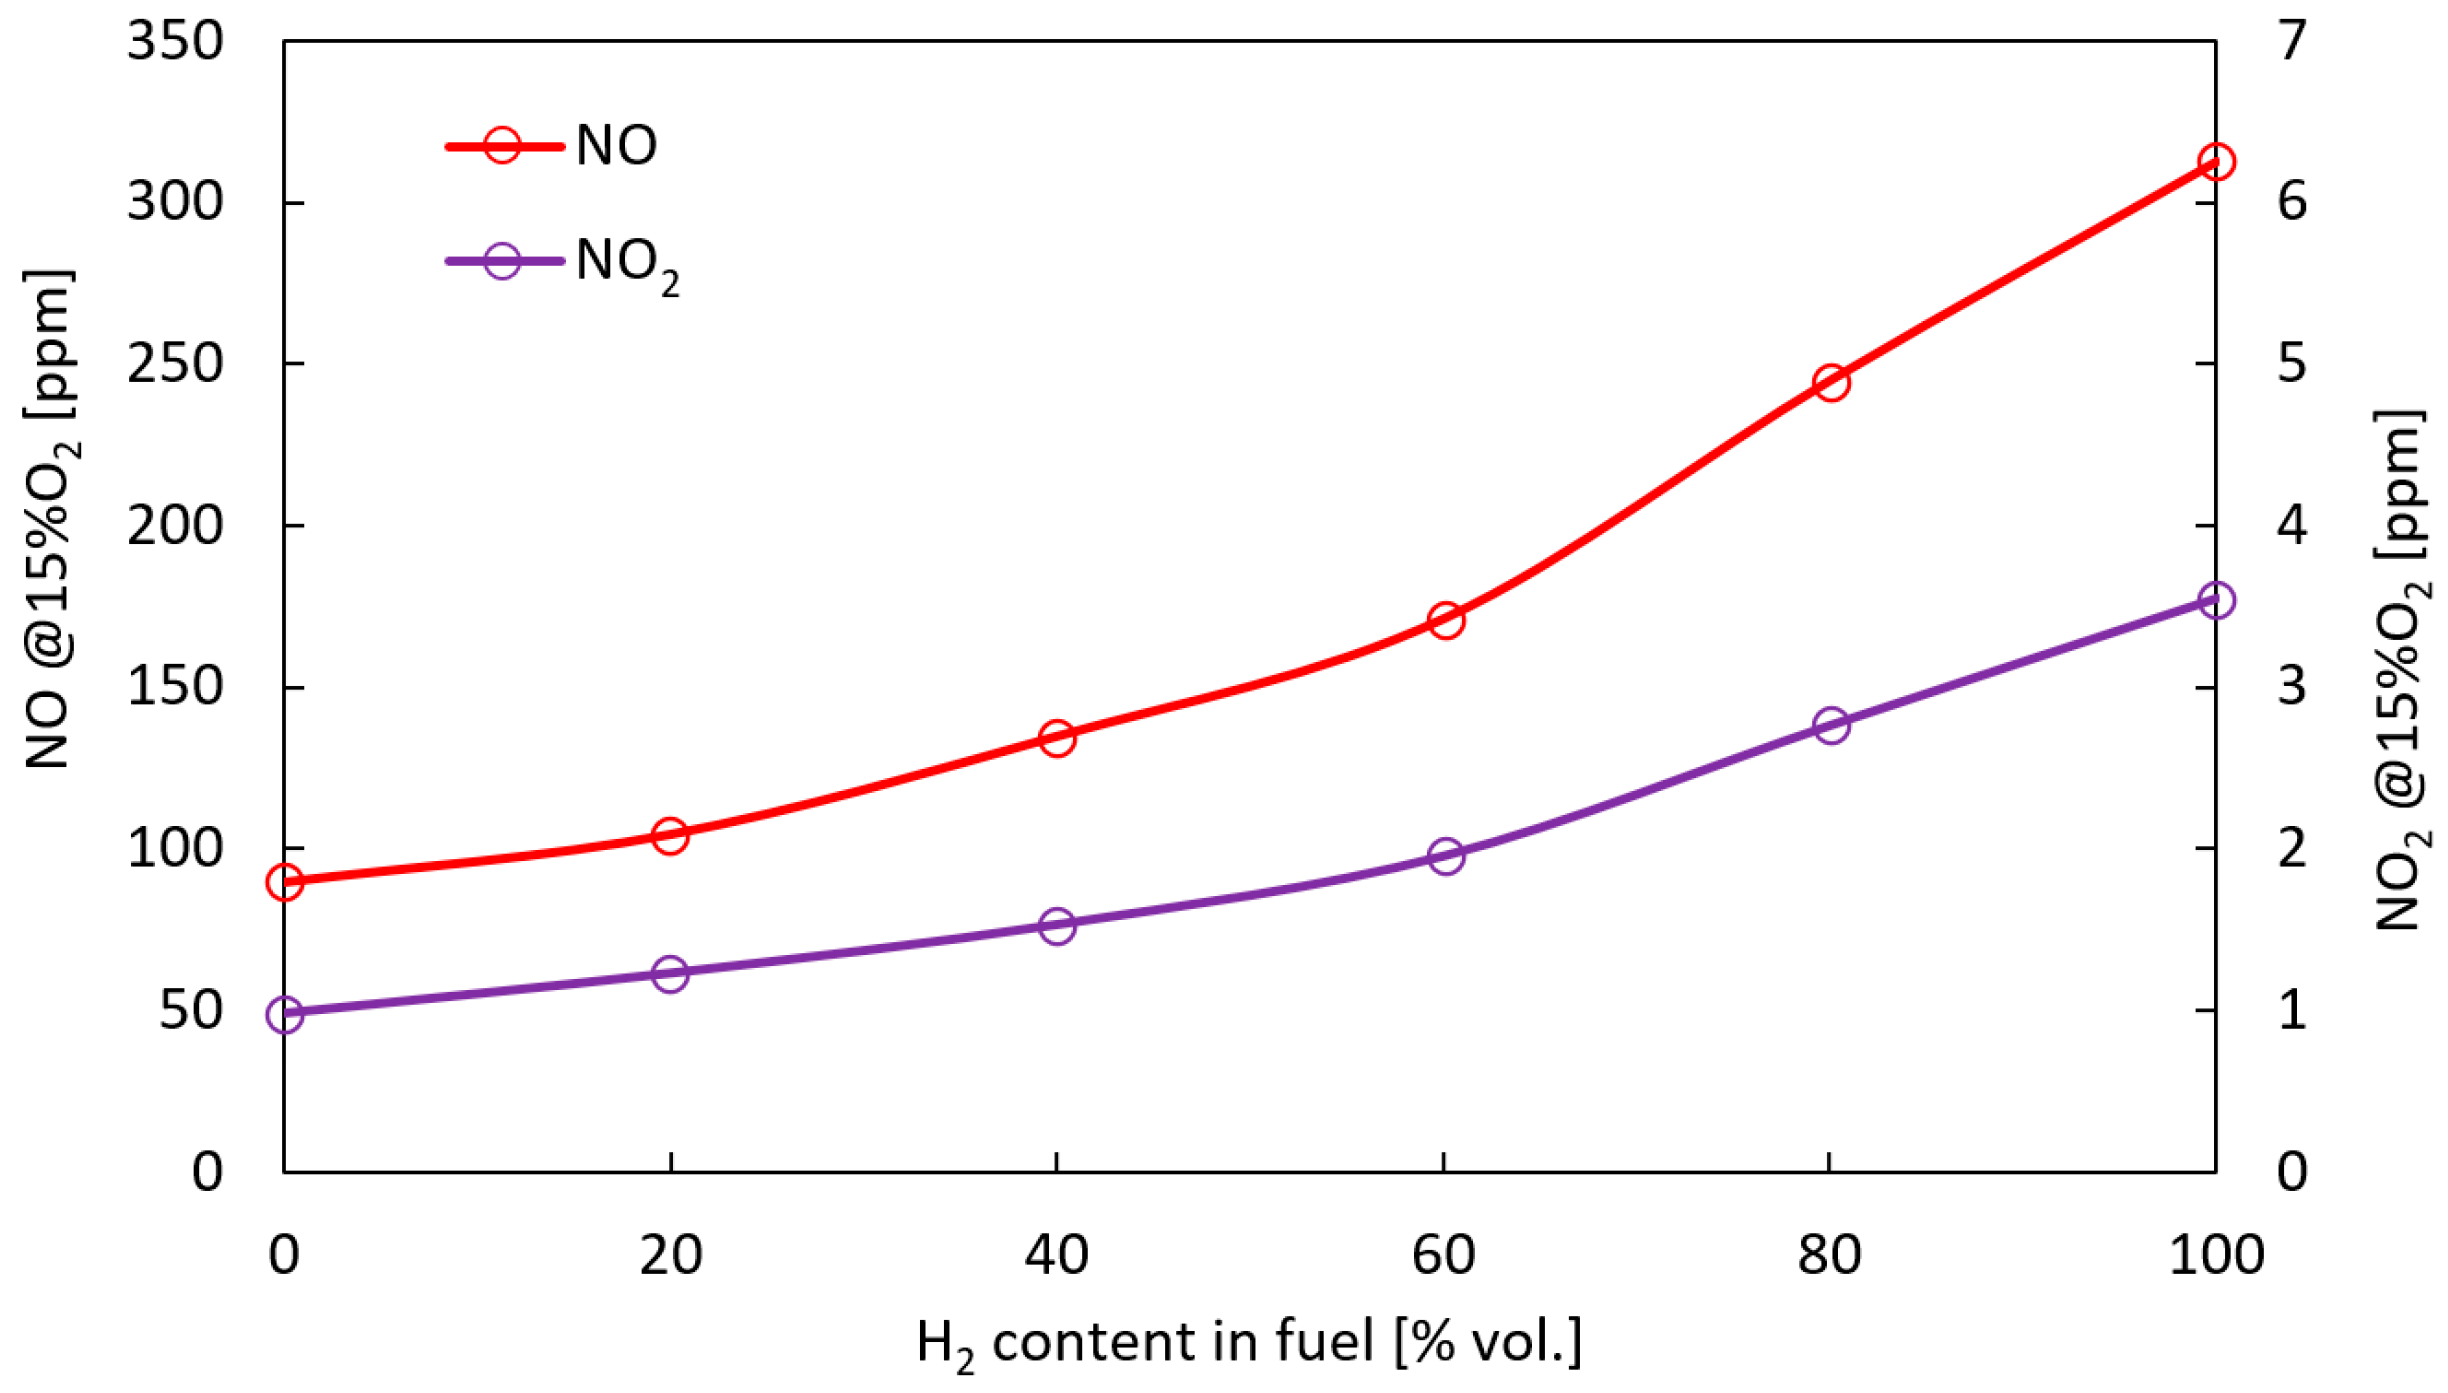
  • The results indicate that the addition of H2 increases NO and NO2 emission. Emissions more than three times higher were recorded for pure hydrogen than for methane. The significant increase of NOx formation was the result of the reactions taking place in the in quenching zone, where the highest values of free radicals (O, H, and OH) were obtained. Increasing the share of H2 in the fuel raises the amount of radicals, resulting in a growth in the net reaction rate for NOx formation by several times compared to methane fuels.
The results of this work show that hydrogen fuels can be effectively used in gas turbine systems; however, further research is needed to reduce the higher emissions of nitric oxides.

Author Contributions

Conceptualization, L.M. and R.Ś.; methodology, L.M. and R.Ś.; formal analysis, L.M. and R.Ś.; investigation, L.M., R.Ś. and R.J.; resources, L.M.; data curation, L.M. and R.J.; writing—original manuscript, L.M. and R.Ś.; writing—review and editing, L.M., R.Ś. and R.J.; supervision, R.Ś. and R.J. All authors have read and agreed to the published version of the manuscript.

Funding

This research received no external funding.

Institutional Review Board Statement

Not applicable.

Informed Consent Statement

Not applicable.

Data Availability Statement

The data are available on request from the corresponding author for reasonable reasons.

Conflicts of Interest

The authors declare no conflict of interest.

Nomenclature

A/Fair to fuel ratio
A/Qair to energy coefficient
Ccompressor
CCcombustion chamber
CCGTcombined cycle gas turbine
CCGTPpreheated combined cycle gas turbine
cpspecific heat at constant pressure
CRNchemical reactor network
GTgas turbine
GTsgas turbine systems
HRSGheat recovery steam generator
NGnatural gas
PaSRpartially stirred reactor
PFRplug flow reactor
PSRperfectly stirred reactors
Qininput power
RESrenewable energy sources
RQLrich-quench-lean combustor
RZrecirculation zone
STFstoichiometric flame temperature
TITturbine inlet temperature
TOTturbine outlet temperature
WCcompressor power
Wnetgas turbine system power
Wppump work
WSTsteam turbine power
WTturbine power
φequivalence ratio
ηgas turbine efficiency

References

  1. UN. Kyoto Protocol to the United Nations Framework Convention on Climate Change; UN: New York, NY, USA, 1998. [Google Scholar]
  2. United Nations. Summary of the Paris Agreement. United Nations Framework Convention on Climate Change; United Nations: New York, NY, USA, 2015. [Google Scholar]
  3. Saravanamuttoo, H.; Roger, G.F.C.; Cohen, H.; Straznicky, P.V. Gas Turbine Theory, 6th ed.; Pearson Education Ltd.: London, UK, 2009. [Google Scholar]
  4. Lozza, G. Turbine a Gas e Cicli Combinati; Societ à Editrice Esculapio: Bologna, Italy, 2006. [Google Scholar]
  5. Han, J.C.; Dutta, S.; Ekkad, S. Gas Turbine Heat Transfer and Cooling Technology; Taylor & Francis: Abingdon, UK, 2012. [Google Scholar]
  6. Bathie, W.W. Fundamentals of Gas Turbines, 2nd ed.; John Wiley & Sons: Hoboken, NJ, USA, 1996. [Google Scholar]
  7. Horlock, J.H. Advanced Gas Turbine Cycles; Elsevier Science Ltd.: Amsterdam, The Netherlands, 2003. [Google Scholar]
  8. Rogers, G.F.C.; Mayhew, Y.R. Engineering Thermodynamics Work and Heat Transfer, 3rd ed.; Longmans, Green: London, UK, 1980. [Google Scholar]
  9. Desideri, U. Fundamentals of Gas Turbine Cycles: Thermodynamics, Efficiency and Specific Power. In Modern Gas Turbine Systems: High Efficiency, Low Emission, Fuel Flexible Power Generation; Woodhead Publishing: Sawston, UK, 2013; pp. 44–85. [Google Scholar] [CrossRef]
  10. Maslennikov, V.M.; Shterenberg, V.J. Advanced Gas Turbine System Utilizing Partial Oxidation Technology for Ecologically Clean Power Generation. Int. J. Low-Carbon Technol. 2011, 6, 55–63. [Google Scholar] [CrossRef]
  11. Nishimura, M. Hydrogen Gas Turbine Offers Promise of Clean Electricity. Nat. J. 2023. Available online: https://www.nature.com/articles/d42473-022-00211-0?fbclid=IwAR2UVeGGeV9LvKHcs_TTsMrJV5JN0yWV_aSX2q-0-i59T_yb_NMO7qRAKIk (accessed on 3 November 2023).
  12. Dehghanimadvar, M.; Shirmohammadi, R.; Sadeghzadeh, M.; Aslani, A.; Ghasempour, R. Hydrogen Production Technologies: Attractiveness and Future Perspective. Int. J. Energy Res. 2020, 44, 8233–8254. [Google Scholar] [CrossRef]
  13. Therkelsen, P.; Werts, T.; McDonell, V.; Samuelsen, S. Analysis of NOx Formation in a Hydrogen-Fueled Gas Turbine Engine. J. Eng. Gas Turbine Power 2009, 131, 031507. [Google Scholar] [CrossRef]
  14. Reale, F.; Sannino, R. Numerical Modeling of Energy Systems Based on Micro Gas Turbine: A Review. Energies 2022, 15, 900. [Google Scholar] [CrossRef]
  15. Liu, X.; Bertsch, M.; Subash, A.A.; Yu, S.; Szasz, R.Z.; Li, Z.; Petersson, P.; Bai, X.S.; Aldén, M.; Lörstad, D. Investigation of Turbulent Premixed Methane/Air and Hydrogen-Enriched Methane/Air Flames in a Laboratory-Scale Gas Turbine Model Combustor. Int. J. Hydrogen Energy 2021, 46, 13377–13388. [Google Scholar] [CrossRef]
  16. Yoshirnura, T.; McDonell, V.; Samuelsen, S. Evaluation of Hydrogen Addition to Natural Gas on the Stability and Emissions Behavior of a Model Gas Turbine Combustor. Proc. ASME Turbo Expo 2008, 2, 573–581. [Google Scholar] [CrossRef]
  17. Ditaranto, M.; Li, H.; Hu, Y. Evaluation of a Pre-Combustion Capture Cycle Based on Hydrogen Fired Gas Turbine with Exhaust Gas Recirculation (EGR). Energy Procedia 2014, 63, 1972–1975. [Google Scholar] [CrossRef]
  18. Dutka, M.; Ditaranto, M.; Løvås, T. NOx Emissions and Turbulent Flow Field in a Partially Premixed Bluff Body Burner with CH4 and H2 Fuels. Int. J. Hydrogen Energy 2016, 41, 12397–12410. [Google Scholar] [CrossRef]
  19. Turns, S.R. An Introduction to Combustion: Concepts and Applications, 2nd ed.; McGraw-Hill: Boston, MA, USA, 2000. [Google Scholar]
  20. Todd, D.; Battista, R. Demonstrated Applicability of Hydrogen Fuel for Gas Turbines. Eng. Environ. Sci. 2001, 4, 741–748. [Google Scholar]
  21. Ahmed, S.A.; Zhou, S.; Tsegay, S.; Ahmad, N.; Zhu, Y. Effects of Hydrogen-Enriched Biogas on Combustion and Emission of a Dual-Fuel Diesel Engine. Energy Sources Part A Recovery Util. Environ. Eff. 2020, 1–16. [Google Scholar] [CrossRef]
  22. Alnaeli, M.; Alnajideen, M.; Navaratne, R.; Shi, H.; Czyzewski, P.; Wang, P.; Eckart, S.; Alsaegh, A.; Alnasif, A.; Mashruk, S.; et al. High-Temperature Materials for Complex Components in Ammonia/Hydrogen Gas Turbines: A Critical Review. Energies 2023, 16, 6973. [Google Scholar] [CrossRef]
  23. Wright, M.L.; Lewis, A.C. Emissions of NOx from Blending of Hydrogen and Natural Gas in Space Heating Boilers. Elementa 2022, 10, 00114. [Google Scholar] [CrossRef]
  24. Boulahlib, M.S.; Medaerts, F.; Boukhalfa, M.A. Experimental Study of a Domestic Boiler Using Hydrogen Methane Blend and Fuel-Rich Staged Combustion. Int. J. Hydrogen Energy 2021, 46, 37628–37640. [Google Scholar] [CrossRef]
  25. Rohani, B.; Saqr, K.M. Effects of Hydrogen Addition on the Structure and Pollutant Emissions of a Turbulent Unconfined Swirling Flame☆. Int. Commun. Heat Mass Transf. 2012, 39, 681–688. [Google Scholar] [CrossRef]
  26. Kashir, B.; Tabejamaat, S.; Jalalatian, N. On Large Eddy Simulation of Blended CH4–H2 Swirling Inverse Diffusion Flames: The Impact of Hydrogen Concentration on Thermal and Emission Characteristics. Int. J. Hydrogen Energy 2015, 40, 15732–15748. [Google Scholar] [CrossRef]
  27. Taimoor, A.A.; Muhammad, A.; Saleem, W.; Zain-ul-abdein, M. Humidified Exhaust Recirculation for Efficient Combined Cycle Gas Turbines. Energy 2016, 106, 356–366. [Google Scholar] [CrossRef]
  28. Wang, Y.; Tang, Q.; Wang, M.; Feng, X. Thermodynamic Performance Comparison between ORC and Kalina Cycles for Multi-Stream Waste Heat Recovery. Energy Convers. Manag. 2017, 143, 482–492. [Google Scholar] [CrossRef]
  29. Mehrpooya, M.; Zonouz, M.J. Analysis of an Integrated Cryogenic Air Separation Unit, Oxy-Combustion Carbon Dioxide Power Cycle and Liquefied Natural Gas Regasification Process by Exergoeconomic Method. Energy Convers. Manag. 2017, 139, 245–259. [Google Scholar] [CrossRef]
  30. Alobaid, F.; Starkloff, R.; Pfeiffer, S.; Karner, K.; Epple, B.; Kim, H.G. A Comparative Study of Different Dynamic Process Simulation Codes for Combined Cycle Power Plants—Part B: Start-up Procedure. Fuel 2015, 153, 707–716. [Google Scholar] [CrossRef]
  31. Alobaid, F.; Starkloff, R.; Pfeiffer, S.; Karner, K.; Epple, B.; Kim, H.G. A Comparative Study of Different Dynamic Process Simulation Codes for Combined Cycle Power Plants—Part A: Part Loads and off-Design Operation. Fuel 2015, 153, 692–706. [Google Scholar] [CrossRef]
  32. Lm6000 Fact Sheet Product Specifications. Available online: https://www.ge.com/content/dam/gepower/global/en_US/documents/gas/gas-turbines/aero-products-specs/lm6000-fact-sheet-product-specifications.pdf (accessed on 21 December 2023).
  33. Aydin, H. Exergetic Sustainability Analysis of LM6000 Gas Turbine Power Plant with Steam Cycle. Energy 2013, 57, 766–774. [Google Scholar] [CrossRef]
  34. Barigozzi, G.; Perdichizzi, A.; Gritti, C.; Guaiatelli, I. Techno-Economic Analysis of Gas Turbine Inlet Air Cooling for Combined Cycle Power Plant for Different Climatic Conditions. Appl. Therm. Eng. 2015, 82, 57–67. [Google Scholar] [CrossRef]
  35. Bhargava, R.K.; Bianchi, M.; De Pascale, A.; Negri Di Montenegro, G.; Peretto, A. Gas Turbine Based Power Cycles-A State-of-the-Art Review. In Challenges of Power Engineering and Environment; Springer: Berlin/Heidelberg, Germany, 2007; pp. 309–331. [Google Scholar]
  36. Guteša Božo, M.; Mashruk, S.; Zitouni, S.; Valera-Medina, A. Humidified Ammonia/Hydrogen RQL Combustion in a Trigeneration Gas Turbine Cycle. Energy Convers. Manag. 2021, 227, 113625. [Google Scholar] [CrossRef]
  37. Valera-Medina, A.; Syred, N.; Bowen, P. Central Recirculation Zone Visualization in Confined Swirl Combustors for Terrestrial Energy. J. Propuls. Power 2013, 29, 195–204. [Google Scholar] [CrossRef]
  38. Mashruk, S. Nitric Oxide Formation Analysis Using Chemical Reactor Modelling and Laser Induced Fluorescence Measurements on Industrial Swirl Flames. Ph.D. Thesis, Cardiff University, Cardiff, UK, 2022. [Google Scholar]
  39. Directive 2010/75/EU of the European Parliament and of the Council on Industrial Emissions (Integrated Pollution Prevention and Control). 2010. Official Journal of the European Union. Available online: https://eur-lex.europa.eu/LexUriServ/LexUriServ.do?uri=OJ:L:2010:334:0017:0119:en:PDF (accessed on 21 December 2023).
Figure 1. Chemical reactor network for the simulation of RQL combustor.
Sustainability 16 00531 g001
Figure 2. Scheme of simple gas turbine cycle; C—compressor, CC—combustion chamber, and T—turbine.
Sustainability 16 00531 g002
Figure 3. Gas turbine thermal efficiency versus H2 content in the fuel.
Sustainability 16 00531 g003
Figure 4. Schematic of modeled combined cycle gas turbine CCGT; C—compressor, CC—combustion chamber, T—turbine, HE—heat recovery steam boiler, P—pump, and ST—steam turbine.
Sustainability 16 00531 g004
Figure 5. Schematic of modeled combined cycle gas turbine with heat recovery CCGTP; C—compressor, CC—combustion chamber, T—turbine, HE1—heat recovery steam boiler, P—pump, ST—steam turbine, and HE2—recuperative heat exchanger.
Sustainability 16 00531 g005
Figure 6. Effect of H2 content in fuel on the thermal efficiency of analyzed combined cycle gas turbine systems.
Sustainability 16 00531 g006
Figure 7. Temperature distribution in RQL combustor for studied hydrogen content in the fuel.
Sustainability 16 00531 g007
Figure 8. Relative distribution of O, H, and OH radicals in parts of RQL combustor.
Sustainability 16 00531 g008
Figure 9. Reaction pathway of nitric oxide formation in the quenching zone.
Sustainability 16 00531 g009
Figure 10. Nitric oxides emissions versus hydrogen share in fuel.
Sustainability 16 00531 g010
Table 1. Fuel characteristics.
H2 [% vol.]CH4 [% vol.]LHVm [MJ/kg]LHVv [MJ/m3]SFT [K]A/F [-]
010050.035.8222417.1
208052.230.8223317.6
406055.425.8224718.4
604061.120.8226819.1
802073.415.8230422.8
1000120.010.8237934.1
Table 2. Cycle inputs and parameters inserted in Aspen HYSYS [33,34,35].
ParameterUnitValue
Ambient temperatureK300
Ambient pressureMPa0.1
Compression ratio-28
Fuel inlet temperatureK300
Fuel inlet pressureMPa3.0
Compressor isentropic efficiency-0.88
Turbine isentropic efficiency-0.86
Steam inlet temperatureK803
Flue gas outlet temperatureK503
Combustion chamber efficiency-0.99
Table 3. Boundary conditions for the toxic compound emission modeling process.
ParameterSymbolUnitValue
Mixing zone
PressureP0MPa28.3
TemperatureTK823
Residence time in premixing zoneτps0.0005
Recirculation zone
PressureP0MPa28.3
Temperature in recirculation zoneTRK1600
Residence time in recirculation zoneτRs0.0015
Fraction of recirculating massmrecwt.%30
Flame zone
PressurePMPa28.3
TemperatureTFK1600
Residence time in flame zoneτFs0.0011–0.0015
Equivalence ratio in flame zoneφF-1.8
Post-flame zone
PressurePMPa28.3
Starting axial positionx0cm0
Ending axial position x1cm5
Quenching zone
PressurePMPa28.3
TemperatureTQK1600
Residence time in quenching zoneτQs0.0012
Secondary air temperatureTsK823
Lean-burn zone
PressurePMPa28.3
Starting axial positionx0cm0
Ending axial position x1cm5
Equivalence ratio in lean-burn zoneφLB-0.36–0.4
Table 4. GT cycle characteristic parameters vs. fuel composition.
H2
[% vol.]
CH4
[% vol.]
T5 (TOT) [K]WC
[MW]
WT
[MW]
A/Q
[kg/MJ]
Cp
[kJ/kgK]
Adiabatic
Index
010092823.743.40.8601.3281.253
208093623.042.80.8471.3321.252
406093523.142.90.8321.3381.252
505093422.842.70.8261.3421.251
100093222.442.50.7981.3821.248
Table 5. CCGT and CCGTP cycles’ characteristic parameters vs. fuel composition.
H2
[% vol.]
CH4
[% vol.]
CCGTCCGTP
WST [MW]Wnet [MW]WST [MW]Wnet [MW]
01004.3424.044.8024.50
20804.3524.104.8224.57
40604.3424.184.8024.64
50504.3324.234.7924.69
10004.2124.304.6224.72
Table 6. Molar fractions of O2 and CO in RQL combustor.
H2 Content in Fuel [% vol.]Flame ZonePost-Flame ZoneQuenching ZoneLean-Burn Zone
O2 [%]CO [%]O2 [%]CO [%]O2 [%]CO [%]O2 [%]CO [ppm]
00.039.45010.0113.112.6611.332.9
200.028.9909.3813.012.0911.292.0
400.028.2608.4913.141.9211.212.0
600.017.0407.1413.071.7311.191.8
800.014.8004.8313.141.0711.311.2
1000.0000013.26011.510
Table 7. Molar fraction of NO and NO in RQL combustor (data presented in ppm).
H2 Content in Fuel [% vol.]Flame ZonePost-Flame ZoneQuenching ZoneLean-Burn Zone
NO NO2NONO2NONO2NONO2
036.00.042.20.0135.82.2150.61.7
2043.60.043.40.0157.43.7169.22.0
4054.70.043.60.0177.44.1210.62.5
6069.80.043.60.0210.92.9281.02.8
8085.40.054.50.0385.45.6395.44.5
100127.70.0131.10.0483.47.5495.45.6
Disclaimer/Publisher’s Note: The statements, opinions and data contained in all publications are solely those of the individual author(s) and contributor(s) and not of MDPI and/or the editor(s). MDPI and/or the editor(s) disclaim responsibility for any injury to people or property resulting from any ideas, methods, instructions or products referred to in the content.

