Article

Utilization of Earthquake Demolition Wastes and Afşin–Elbistan Fly Ash for Soil Improvement after the Kahramanmaraş Earthquake (6 February 2023)

Department of Civil Engineering, Faculty of Engineering and Architecture, Kahramanmaras Sutcu Imam University, Kahramanmaras 46050, Türkiye
Sustainability 2024, 16(2), 538; https://doi.org/10.3390/su16020538
Submission received: 29 November 2023 / Revised: 28 December 2023 / Accepted: 5 January 2024 / Published: 8 January 2024
(This article belongs to the Special Issue Risk Analysis, Prevention and Control of Ground-Based Hazards)

Abstract

:
Türkiye is surrounded by active faults that have the potential to produce big earthquakes. Recently, one of these faults has become active. Two earthquakes of magnitude 7.7 and 7.6 occurred 9 h apart on 6 February 2023 in Kahramanmaraş. It is reported that 150 million tons of earthquake demolition waste (EDW) is estimated to be produced as a result of those natural hazards. This waste poses a serious risk to both the environment and human health. Its use in geotechnical applications will provide serious environmental benefits. In this study, Afşin–Elbistan fly ash (AEFA) and EDW were used to stabilize weak clayey soils in different proportions. Samples were prepared by separately adding 5, 10, 15, and 20% AEFA and EDW to high-plasticity clay. The AEFA used in this study was used because the production of AEFA is too high, and it is not used in concrete production because it does not comply with the standards and causes serious environmental problems for the region. The Atterberg limit, standard compaction, unconfined compression strength (UCS), triaxial, and California bearing ratio (CBR) tests were performed on soil samples, and samples were prepared from soil mixtures with various proportions of AEFA and EDW added. In addition, clay mixtures were prepared with EDW by keeping the AEFA ratio constant at 15% and their effects were also investigated. According to Atterberg test results, the natural soil class was determined as high-plasticity clay, the soil class of the mixtures created by adding EDW and AEFA was determined as low-plasticity clay, and all ternary mixtures were determined as low-plasticity silt. In addition, the maximum dry density increased for all mixtures, while the optimum water content decreased. A significant increase was observed in UCS test results, especially in ternary mixtures. While cohesion increased in AEFA mixtures, it decreased in ternary mixtures as the EDW ratio increased. It was observed that the internal friction angle increased in all mixtures. According to CBR test results, it was determined that the binary AEFA mixture ratio was 20%, the binary EDW mixture ratio was 10% and above, and all ratios of the ternary AEFA + EDW mixtures could be used as road sub-base material. After the major earthquake disaster, the use of EDW is of great importance for the environment. As a result, AEFA and EDW were found to enhance the geotechnical properties of clay.

1. Introduction

Soil stabilization is a process that includes modifying the features of soil to improve its durability, strength, and overall engineering performance. This is often performed to make the soil suitable for construction purposes or to enhance its load-bearing capacity. Various techniques and materials can be used for soil stabilization, depending on the specific features of the soil and the intended use of the stabilized ground [1,2,3]. Soil stabilization is crucial in construction projects, particularly in areas with weak or problematic soils. This helps prevent settlement, erosion, and other issues that could compromise the integrity of structures built on or in the soil. The choice of stabilization method depends on factors such as the soil type, project requirements, and environmental considerations [1].
Nowadays, due to the increase in waste materials and by-products, the use of these products in soil stabilization has become a very important point. Soil stabilization using waste materials involves the utilization of industrial by-products or other waste materials to enhance the engineering features of the soil. This practice not only addresses environmental concerns associated with waste disposal but also provides a cost-effective and sustainable solution for soil improvement in construction projects. According to the specific requirements and properties of the soil, several waste materials can be utilized for soil stabilization. The effectiveness of waste materials in soil stabilization depends on factors such as the type of waste, soil features, and intended use of the stabilized soil. Careful testing and engineering analyses are typically conducted to determine the appropriate dosage and mixing procedures to achieve the desired stabilization results. Utilizing waste materials for soil stabilization not only provides a sustainable solution but also contributes to reducing the environmental impact associated with waste disposal [2].
An earthquake is a violent and sudden shaking of the ground, often induced by movement along geological faults or volcanic activity. It is a natural phenomenon resulting from the energy released into the Earth’s crust, which creates seismic waves. These waves propagate outward from the fault or seismic source, causing the ground to shake. Earthquakes have significant and often devastating effects that cause damage to buildings, infrastructure, and landscapes. The severity of the impact depends on factors such as the earthquake depth, proximity to populated areas, building construction standards, and local geological conditions [4,5,6].
Kahramanmaraş and its surroundings, located in the zone where the Arabian and Anatolian plates are intertwined, have soil and rock types that show significant differences in terms of age, environment, and lithology. In general, Kahramanmaraş province and its vicinity were formed due to the closure of the ocean between the Anatolian plate and the Arabian plate. Therefore, rock assemblages belonging to the continental crust of the Toros belt and the oceanic crust of the Neotethys in between are observed [7,8,9,10]. There are very important faults that have the potential to produce earthquakes in and around Kahramanmaraş. The southwestern part of the Gölbaşı–Türkoğlu segment of the the East Anatolian Fault System and the northeastern part of the Türkoğlu–Antakya segment pass through the Kahramanmaraş city borders, and these two segments merge with each other in an area very close to the city center. Figure 1 shows a simplified view of Gölbaşı–Türkoğlu segment and Türkoğlu–Antakya segment of the Eastern Anatolian Fault System [9].
In Türkiye, on 6 February 2023, earthquakes of magnitude 7.6 and 7.7 happened in the Elbistan (Location 1) and Pazarcık (Location 2) districts of Kahramanmaraş, respectively, and thousands of aftershocks were recorded [10] (Figure 2). Because of these major earthquakes, it is clear that disasters pose significant risks to public health and the environment. One of the most widely publicized of these is the management of large amounts of earthquake demolition waste (EDW) generated by earthquakes, in accordance with regulations. According to the Doğdu and Alkan [11] studies, around 350 to 580 million tons of EDW will be caused as a result of the Kahramanmaraş earthquake, and 60% of this waste will be concrete waste.
Coal-fired power plants generate electricity by burning coal, and one of the by-products of this combustion process is fly ash (FA). FA is formed of fine particles that are carried away in the flue gases produced during the burning of coal. It is a type of coal combustion residue. The composition of FA can vary depending on the type of coal being burned, the combustion conditions, and the collection methods. Generally, it consists of fine, spherical particles that are carried out of the combustion chamber in the flue gas. There are two main types of FA. Class F fly ash is generated from burning anthracite or bituminous coal and typically includes a higher percentage of silica, alumina, and iron. Class C fly ash is generated from burning sub-bituminous or lignite coal and includes a higher percentage of calcium oxide. According to 2022 data, coal-fired power plants represent the largest share of global electricity production with 39%. Similarly, Türkiye produces 37 percent of its electricity from coal [12].
In this experimental work, EDW and Afşin–Elbistan fly ash (AEFA) were used together to enhance the engineering and geotechnical features of clayey soil in the Kahramanmaraş region, and experiments were conducted on the use of alternative materials for soil stabilization.
Afşin–Elbistan Thermal Power Plant, located in Kahramanmaraş, is the eighth-largest power plant in Turkey and the second-largest in Kahramanmaraş with its installed capacity. The facility is also Turkey’s third-largest lignite thermal power plant [13]. Samples taken from the Afşin–Elbistan Thermal Power Plant were chemically analyzed, and controls were ensured according to ASTM C618 standards [14]. According to the chemical analysis results, it is out of class because the reactive CaO ratio (54%) is over 10%, the total value of Fe2O3+ Al2O3+ SiO2 (30%) is under fifty percent, and it was also stated to be out of class because the SiO2 ratio (18.5%) was below 25% (Table 1) [12,13]. Moreover, Afşin–Elbistan Thermal Power Plant has the highest capacity to generate energy and produce FA as a by-product in Turkey. Since the produced FA does not comply with the standard due to the high free CaO, low SiO2, and high SO3 rates it contains, it is not widely used as a concrete additive and for cement production. For this reason, the consumption rate remains low, and storage is used as a solution.
When previous studies were investigated, it was observed that construction demolition waste and fly ash were studied separately for soil stabilization [15,16,17,18,19,20,21]. It has been observed in the literature that Afşin–Elbistan fly ash, which is out of standard, is limited in use for soil stabilization. Additionally, there is no study on soil stabilization by mixing FA with EDW.
Vural et al. [15] researched the impact of construction demolition waste on soil stabilization in clayey soils in their experimental study. From the results of experiments performed on samples prepared from construction demolition waste and kaolin clay, it was concluded that construction demolition waste increases the UCS strength of clay and can be used as an additive in the improvement of clayey soils. Çimen et al. [16] worked on the impact of construction demolition waste on the engineering features of a high-plasticity clay. For this purpose, mixtures were prepared with various ratios of soil by weight. As a result, it was found that by adding construction demolition waste to the ground, the swelling potential decreased, and the unconfined compressive strength increased. Additionally, it has been determined that the ideal ratio of construction demolition waste is between 10% and 20%. Sharma et. al. [17] used certain proportions of construction demolition waste for the stabilization of clay soils. Adding the construction demolition waste content in un-stabilized soil increased the pH value of the composite. The addition of construction demolition waste content in the un-stabilized soil decreased the plastic limit, liquid limit, and plasticity index. The stress–strain features improved by 24% waste material content. With the increase in waste rate, the cohesion value decreased, and the friction angle increased. Carlos et al. [18] conducted infiltration tests of materials produced from construction waste and showed that there was no harm to the environment.
When previous studies were investigated, fly ashes were often substituted for cement. The major cause for this is that FA has a pozzolanic feature because of the high CaO content in it. AEFA cannot be used instead of cement because it is non-classified. There are also very limited studies in the AEFA literature.
Sari et al. [19] and Hakan [20] added FA to cohesive soils at ratios of 0 to 25%. In the study, FA added to cohesive soil increased plasticity. In addition, flocculation increased in the prepared mixture, and this is because of the pozzolanic features of FA. In this experimental study, it was determined that the maximum dry density (MDD), optimum moisture content (OMC), and UCS increased. The optimum FA content was found to be between 15% and 20% by weight. Çimen and Keleş’s study [21], 5% to 30% by weight of FA was added to high-plasticity clay, and compaction tests, Atterberg limit tests, UCS tests, and swelling pressure tests were performed. Then, the same series of tests were repeated by keeping the lime content constant at 6% by weight. In the experiments, it was determined that the plasticity index, liquid limit value, and swelling pressure decreased with an increasing additive amount, while the plastic limit value, MDD, OMC, and UCS increased. The optimum FA ratio additive amount was found to be 15% by weight.
In this study, samples were prepared by separately adding 5%, 10%, 15%, and 20% AEFA and EDW to high-plasticity clay. The Atterberg limit, standard proctor compaction, unconfined compression strength (UCS), triaxial, and California bearing ratio (CBR) tests were performed on the samples. In addition, clay mixtures were prepared with EDW by keeping the AEFA ratio constant at 15%, and their effects were also investigated. Consequently, the impacts of AEFA and EDW on the engineering and geotechnical features of clay were determined. The major innovation of this study is the use of waste concrete material generated after a major earthquake disaster for soil stabilization to minimize the damage to the environment, and the use of Afşin–Elbistan fly ash for soil stabilization, which is abundant in the region and of limited use due to its non-standardization. In addition, the study investigated the effect of EDW in combination with non-standard AEFA to achieve a more effective soil improvement, and the feasibility of using AEFA and EDW in soil stabilization was investigated.

2. Materials and Methods
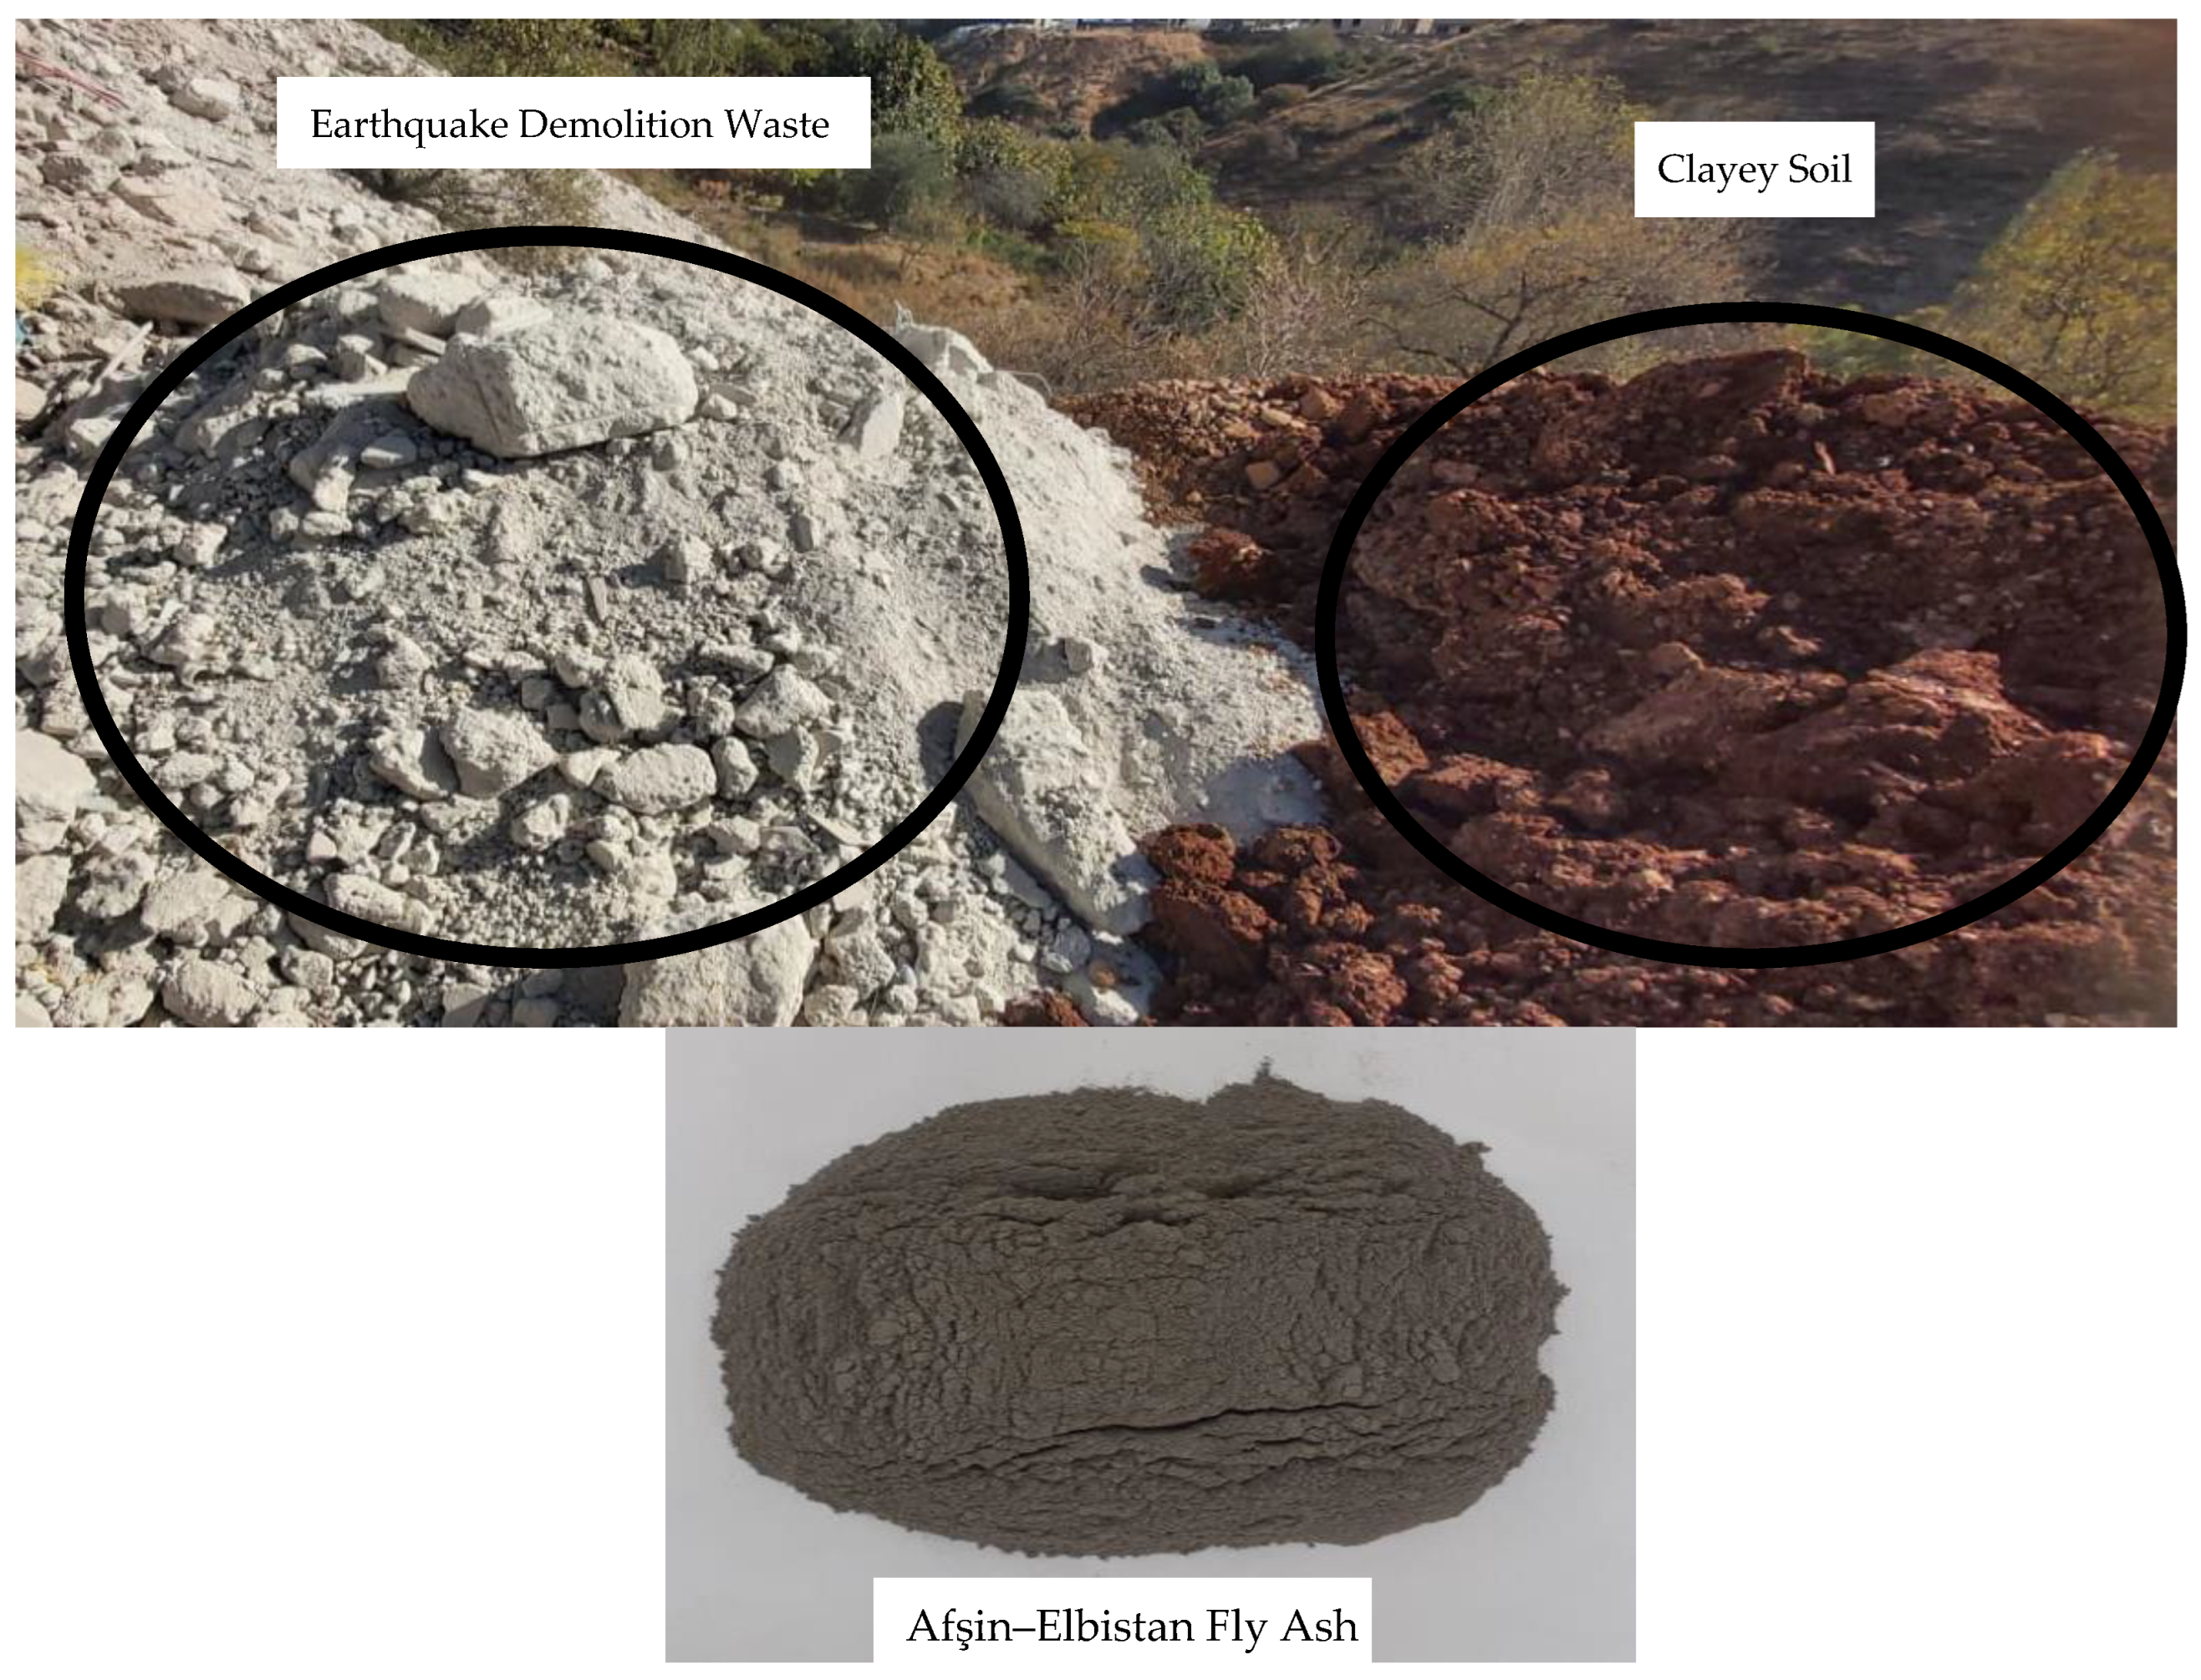
2.1. Material

Cohesive soils generally change in volume due to increases and decreases in water content. Volume change is expressed as shrinkage with a decrease in water content and swelling with an increase in water content. In regions with dry and rainy seasons, large volumetric changes are often observed. The properties of clayey soils that significantly affect structures are settlement, strength, swelling, and shrinkage.
In this study, a clay sample obtained from the construction site in the city center of Kahramanmaraş province was used (Figure 2). Sieve analysis and Atterberg limit, hydrometer, and standard proctor tests were performed on the sample. In accordance with the Unified Soil Classification System, it was determined that the soil was in the CH (high-plasticity clay) class [22] (Table 2).
High-plasticity clay refers to a type of clay with a high degree of plasticity, which is the ability of soil to deform and change shape without cracking. Plasticity is a key property of clay soils and is influenced by the clay’s mineral composition, particle size, and water content. Clay soils are classified based on their plasticity index (PI), which measures the moisture content range over which the soil exhibits plastic behavior. High-plasticity clays have a high PI, indicating that they can undergo significant changes in volume and shape with changes in water content.
EDW waste used in the study was taken from a building collapsed in Kahramanmaraş during the 6 February 2023 earthquake. Especially, concrete waste was preferred as EDW. The concrete stones were crushed with a crusher and only the part passing through the 0.06 mm sieve was used in the work [23].
In this study, FA obtained from the Afşin–Elbistan Thermal Power Plant was used. Afşin–Elbistan Thermal Power Plant uses lignite coal as fuel. This lignite coal is produced in an area of 120 km2 within the borders of the Afşin and Elbistan districts of Kahramanmaraş province. (Figure 2) The physical appearance of clay, EDW, and AEFA is given in Figure 3; their chemical contents are shown in Table 1 and their engineering features are shown in Table 2.

2.2. Methods

To investigate the impact of clayey soil on geotechnical and engineering features, AEFA and EDW were added separately at the rate of 5–10–15–20% by weight. Then, the change in the engineering properties of the clay was determined by keeping the AEFA rate constant at 15% and adding EDW at the rate of 5–10–15–20% by weight. After completing the binary-mixture clay-AEFA and clay-EDW experiments, the ternary-mixture clay-AEFA (15% constant)-EDW experiments were carried out. The proportions of all mixtures are shown in Table 3. The nomenclature in this study is as follows for binary mixtures: clay + AEFA and clay + EDW; high-plasticity clay is named as CH, AEFA as FA, and earthquake demolition waste as EDW. The proportions added to the clay sample are shown as CH0FA or CH0EDW. The proportion of AEFA constant at 15% in the ternary mixture is shown as CH15FA5EDW. Table 3 shows all mixture ratios.
Clayey soil mixtures, the proportions of which are stated in Table 3, were prepared, and the Atterberg limit test, standard proctor compaction test, UCS test, triaxial test, and CBR test were performed. All laboratory tests were conducted in accordance with ASTM standards. The Atterberg limit test is used to determine the critical moisture content levels at which fine-grained soils transition between different states, primarily between liquid, plastic, and solid states. The Atterberg limits define important consistency states (Liquid Limit (LL, wLL) and Plastic Limit (PL, wPL)) for fine-grained soils. The difference between PL and LL is known as the “plasticity index” (PI, IP) and represents the range of moisture content over which the soil exhibits plastic behavior. The plasticity index is an important property in soil classification, as it helps categorize soils into various groups according to their behavior and engineering characteristics. The tests were realized according to the standards ASTM D4318-17e1 [24].
The Standard Proctor Compaction Test, often simply referred to as the Proctor Test, is used to determine the optimum moisture content (OMC, wopt) at which a given type of soil exhibits its maximum dry density (MDD, ɣd,max) when compacted. The experiment is performed 3 times with different water contents on the same proportion of soil sample. A graph is drawn with the results obtained, and the peak of the graph gives OMC and MDD. The tests were realized in accordance with the standards ASTM D698 [25].
The Uniaxial Compressive Strength (UCS) test is used to determine the maximum compression strength of a cohesive soil sample without the need for confining pressure or a confining stress. This test is widely used in geotechnical engineering and soil mechanics to assess the strength properties of soils, particularly those that exhibit cohesive behavior like clay and silty soils. The samples prepared for the test were wrapped in plastic bags and kept at room temperature for 7 and 28 curing days. Experiments were performed according to ASTM D2166/D2166M-16 [26].
Triaxial tests are used to determine the mechanical features of soils and rocks, specifically their strength and deformation characteristics under different stress conditions. These tests are important in the field of civil engineering, geotechnical engineering, and soil mechanics for designing foundations, retaining walls, slopes, and other structures. In this study, the unconsolidated undrained (UU) test method was used. UU triaxial compression tests were realized in accordance with ASTM Standard D 2850-15 [27], and the samples were tested under confining pressure pressures of 100, 200, and 400 kPa at an axial strain rate equal to 1 mm/min. According to ASTM Standard D 2850-15, the axial strain rate value should be between 0.3 to 1%/min, which was taken as 1%/min in this study. Tests were completed when the maximum deviator stress was achieved or the axial strain reached the 10–15% limit specified by ASTM Standard D 2850-15.
The California Bearing Ratio (CBR) test is used to evaluate the mechanical strength and load-bearing capacity of subgrade soils and base coarse materials for the design of road and pavement systems. The CBR test provides valuable information about the strength and stiffness of the soil, particularly in terms of its load-bearing capacity. CBR values determine the appropriate thickness of pavement layers required to support anticipated traffic loads. Soils with higher CBR values are better able to withstand traffic loads and require thinner pavement sections, while soils with lower CBR values necessitate thicker pavement sections or additional stabilization measures. The CBR loading frame used in this experimental study had a load transducer with a capacity of 28 kN and a dial gauge with an accuracy of 0.01 mm for deformation readings. The CBR test calculation of the bearing capacity of the samples prepared was based on the previously determined MDD and OMC, through the load-penetration connection found by pushing a piston with an area of 1935 mm2 (50 mm in diameter) into the ground at a speed of 1.27 mm/min. The test is performed in accordance with the ASTM D1883-16 standard [28]. The CBR value found as a result of the experiment is the percentage expression of the result obtained by dividing the load value applied for the piston to sink 2.5 mm and 5 mm into the ground by the load value applied for the piston to sink to the same depth in the standard crushed stone sample.

3. Results

To improve the geomechanical properties of clay soil, waste EDW generated after the earthquake and AEFA, which is not used in the concrete industry due to its chemical content, was used in different proportions. The mixtures were prepared, and the Atterberg limit test, standard proctor compaction test, UCS test, triaxial compression test and CBR test were performed.

3.1. Atterberg Limit Tests

The LL of the clay sample taken from the field was found to be 52.1%, the plastic limit was 21.3%, and the plasticity index was 30.7%. The results of the mixtures consisting of AEFA and EDW are shown in Table 4. Also, the change in soil classification of the clay mixture formed with waste materials is shown in Figure 4.
In the binary clay and AEFA mixture, the highest LL value was found to be 42.1% in the 5% mixture. The LL values of the other mixtures were 41.5%, 40%, 40.1%, respectively. The PL values were 23.3%, 25.5%, 25.9% and 26.3%, respectively. In the binary clay and EDW mixture, the highest LL value was found to be 39.5% in the 5% mixture. It was found to be 38.4%, 37.2%, 36.5% in other mixtures, respectively. The PL value was found to be 24%, 23.5%, 23.1% and 22.8%, respectively. In the ternary mixture of clay, EDW, and 15% AEFA, the highest LL value was found to be 38.1% in the 5% mixture. It was found to be 37.4%, 35%, 34.5% in the other mixtures, respectively. The PL values were 27%, 28.1%, 28.5%, 28.5%, and 28.8%, respectively.
Figure 4 demonstrates the classification of clayey soils from the Casagrande plasticity chart according to their LL and PI values. According to the Casagrande plasticity chart, soils with an LL value greater than 50% between line A and line U are referred to as high-plasticity clay (CH). If the LL value is below 50%, it is expressed as low-plasticity clay (CL). Soils between line A and line U with PI values between 4 and 7 are defined as low-plasticity clay and silt (CL-ML). If the LL value is below line A and the LL value is greater than 50%, it is referred to as high-plasticity silt (MH) and if the LL value is less than 50%, it is referred to as low-plasticity silt (ML) [29].

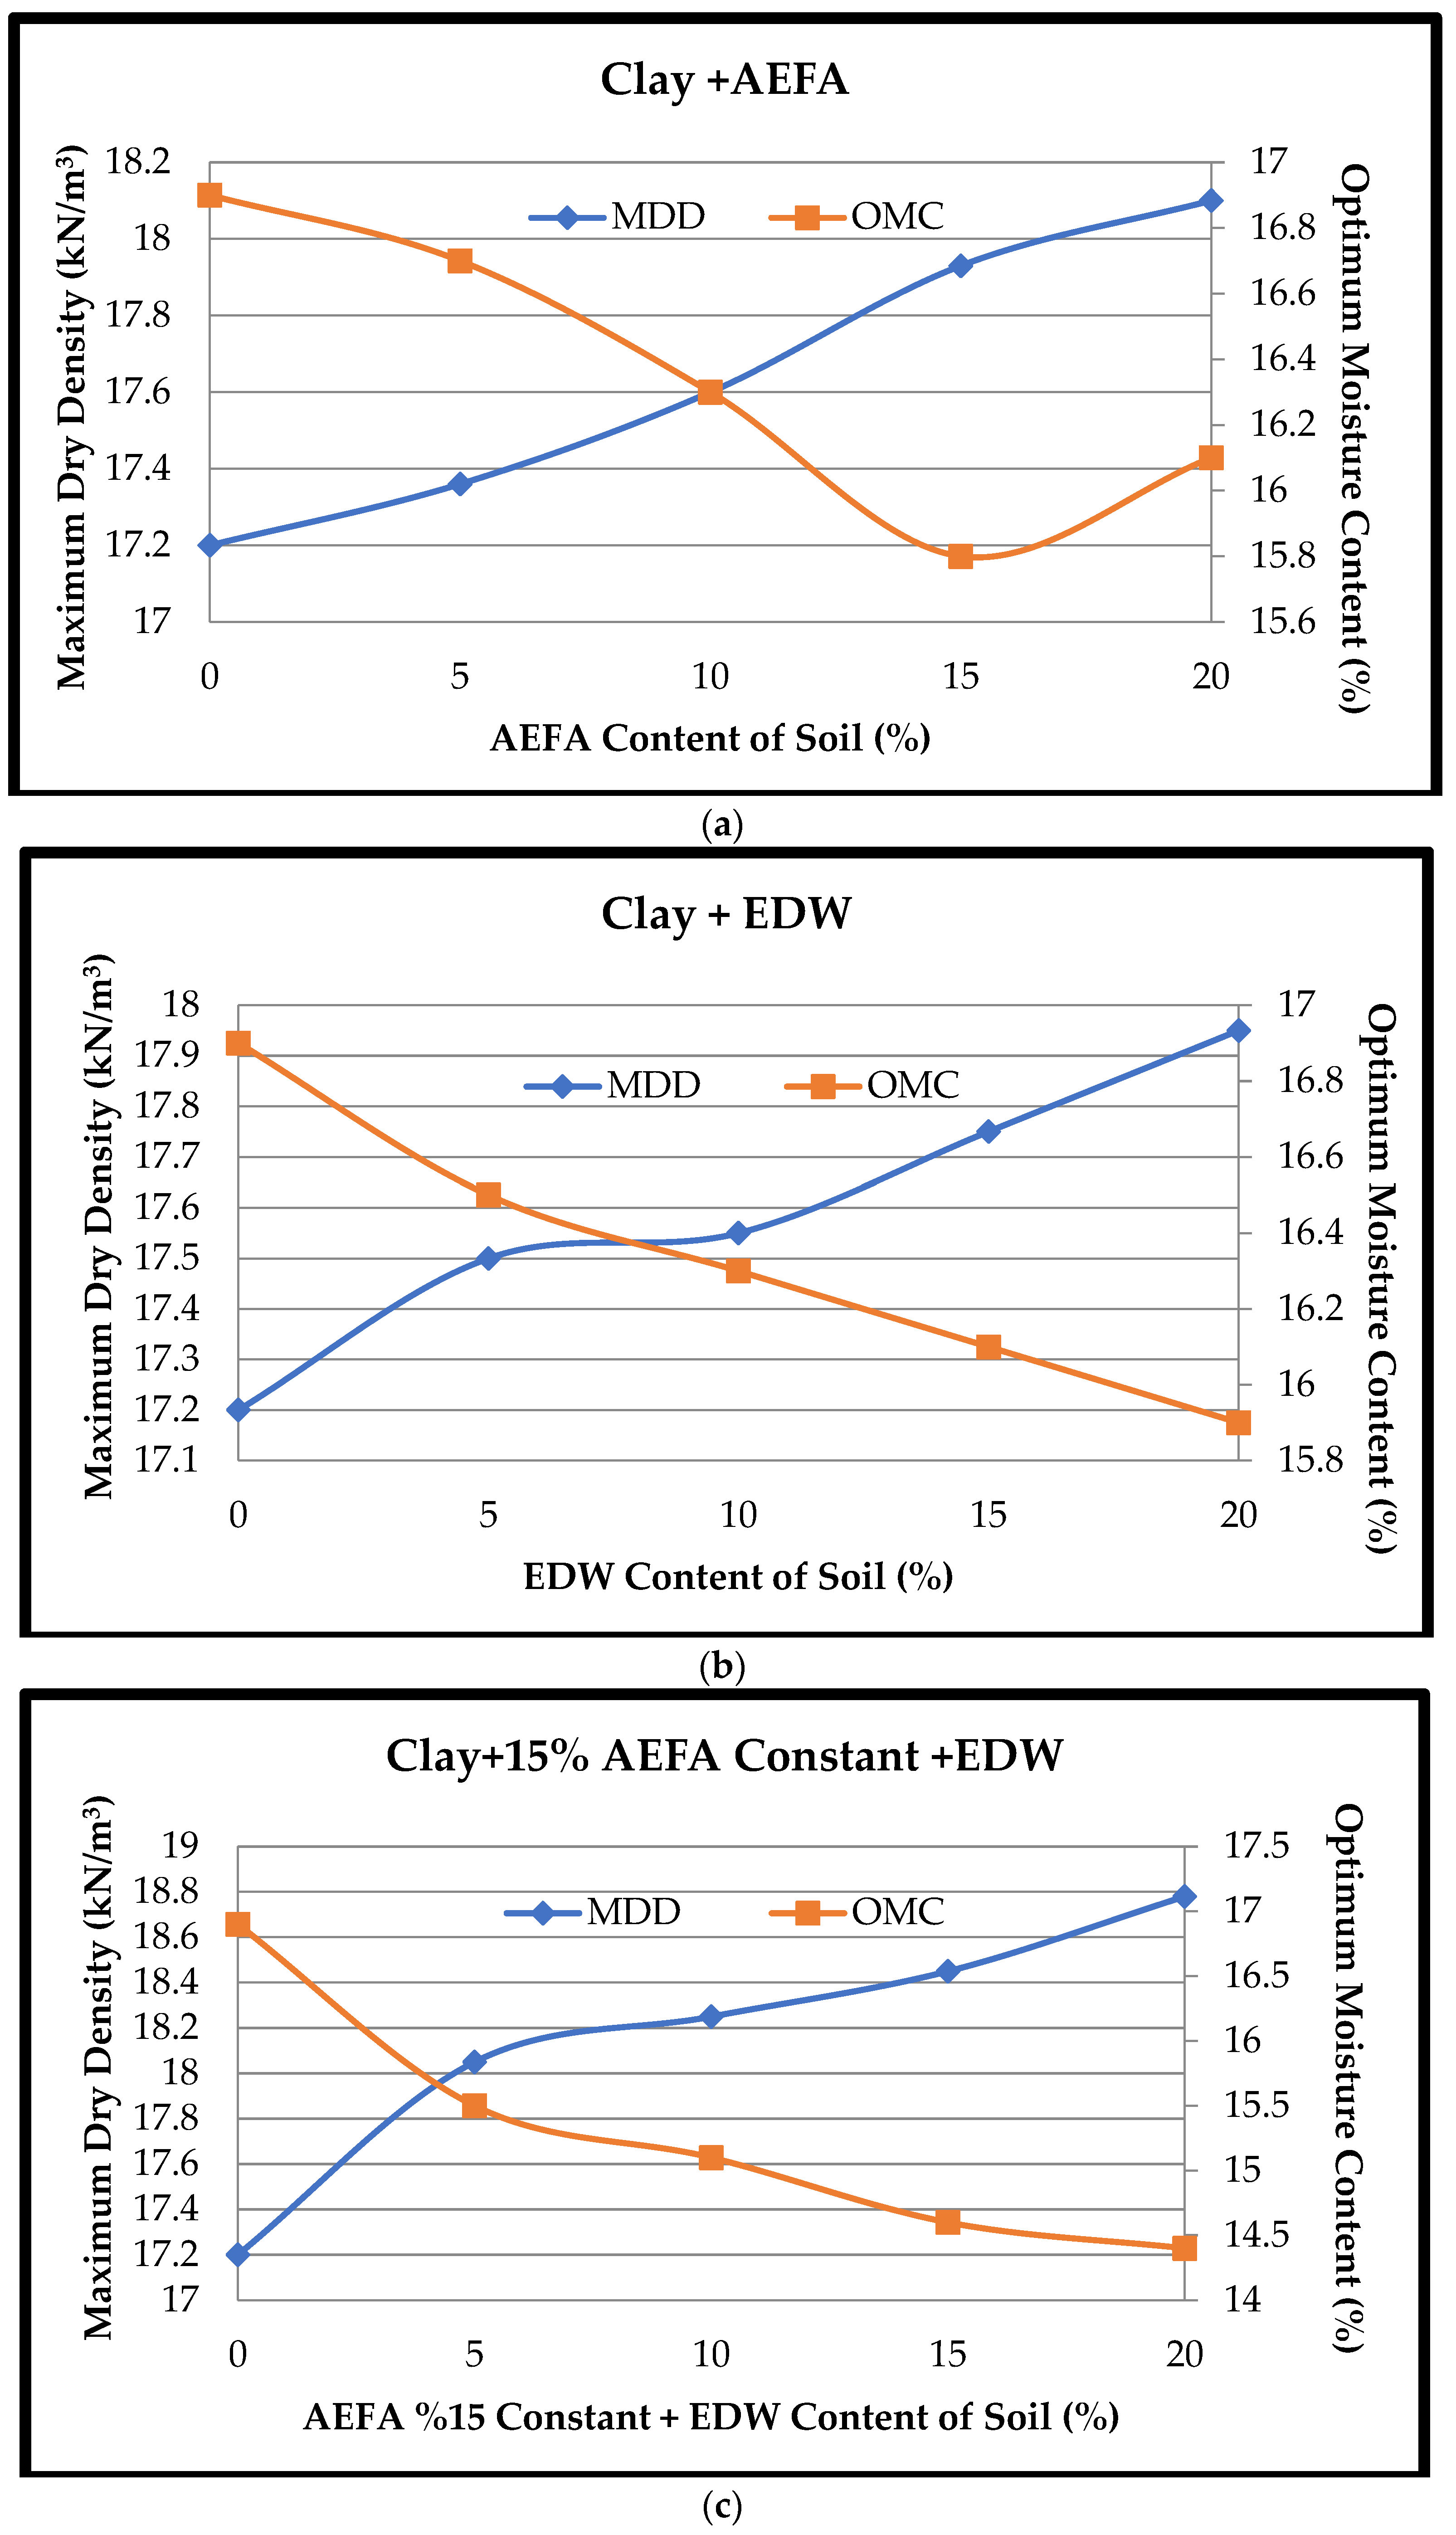
3.2. Compaction Tests

The MDD and OMC of the natural clay sample and mixtures prepared at the specified ratios were defined by a standard proctor test. As a result of the experiment, the OMC and MDD results of the natural clay sample were found to be 16.9% and 17.2 kN/m3, respectively. According to the results of the binary mixture of clay and AEFA standard proctor test, the MDD values were found to be 17.36, 17.6, 17.93, and 18.1 kN/m3, respectively. The OMC values were found to be 16.7%, 16.3%, 15.8% and 16.1%. The MDD values of the binary mixtures of clay and EDW were found to be 17.5, 17.55, 17.75, and 17.95 kN/m3, respectively. The OMC values were found to be 16.5%, 16.5%, 16.3%, 16.1%, and 15.9%, respectively. The MDD values of the ternary mixtures of clay, AEFA, and EDW were found to be 18.05, 18.25, 18.45, and 18.78 kN/m3, respectively. The OMC values were found to be 15.5%, 15.1%, 14.6%, and 14.4%, respectively. The results of the EDW and AEFA mixtures are shown in Figure 5.

3.3. Uniaxial Compressive Strength (UCS) Tests
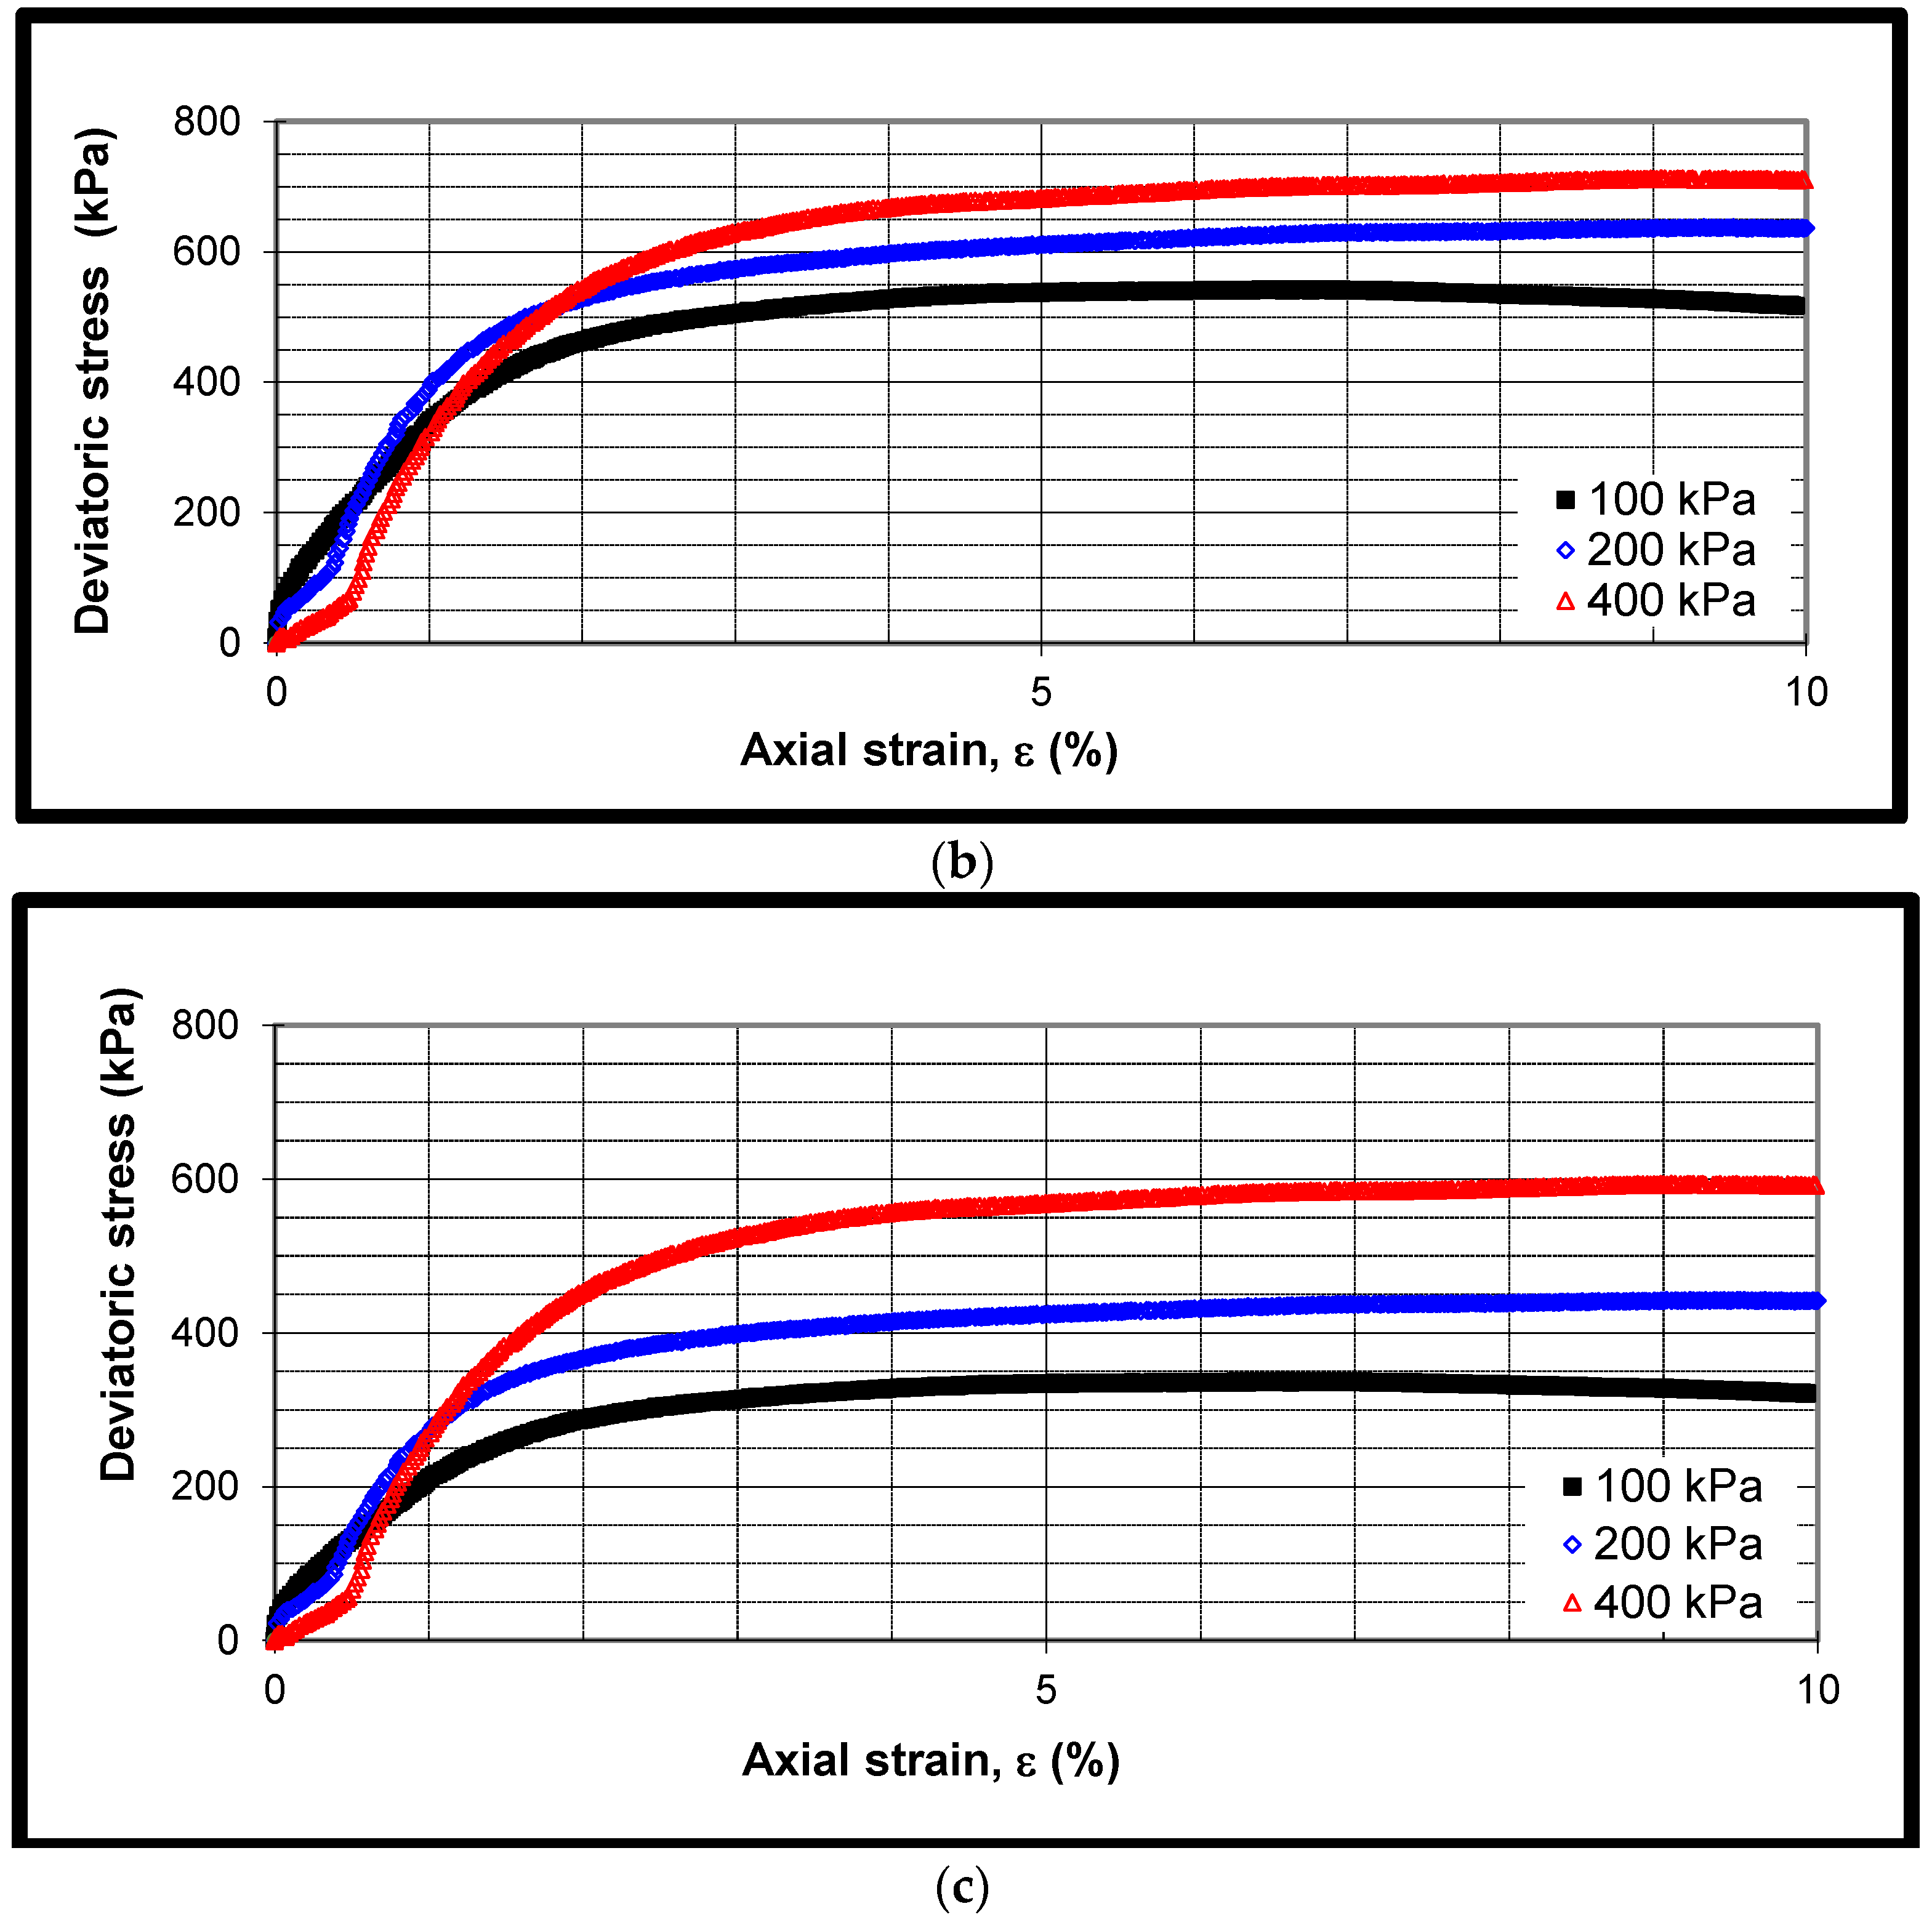
The compressive strength of the natural clay sample was 184 kPa for 7 days’ curing and 215 kPa for 28 days’ curing. The 7-day UCS results of clay + AEFA and clay + EDW in binary mixtures were 205, 230, 260, and 280 kPa for mixtures with AEFA addition and 372, 512, 595, and 648 kPa for mixtures with EDW addition, respectively. The binary mixture clay + AEFA and clay + EDW 28-day UCS results were 215, 235, 280, and 305 kPa for mixtures with AEFA addition and 430, 545, 635, and 710 kPa for mixtures with EDW addition, respectively. The 7- and 28-day UCS results of clay + AEFA and EDW in the triple mixture were 755, 868, 1024, and 1166 kPa for 7 days and 800, 890, 1100, and 1250 for 28 days. Uniaxial Compressive Strength (UCS) test results are shown in Figure 6 for 7- and 28-day curing times.

3.4. Triaxial Tests

The triaxial test provides valuable information about the shear strength (cohesion (c) and internal friction angle (ϕ)), stress-strain behavior, and deformation characteristics of soils [30]. Figure 7a–c demonstrate the deviator stress–axial strain (εa) behavior of the clay sample and the soil samples stabilized with 20% AEFA and 15% AEFA + 20% EDW, cured for 28 days, at 100 kPa, 200 kPa, and 400 kPa confining pressure (σc).
The Mohr–Coulomb failure criterion is found by the shear strength parameters of the soil. The Morh circle is drawn with three different confining pressures for control and stabilized soil samples. Figure 8 demonstrates the Mohr circles drawn for the clay, 20% AEFA, and clay + 15% AEFA + 20% EDW samples.
The values of the cohesion (c) and internal friction angle (ϕ) are shown in Table 5 for the clay sample and the samples of soil stabilized with EDW and AEFA at 28 days of curing.

3.5. California Bearing Ratio (CBR) Tests

The CBR test was implemented on unsoaked specimens and soaked specimens. The results of the experiment are shown in Table 6. When the results on the natural soil sample were examined, it was found to be 2% for the soaked specimen and 5% for the unsoaked specimen. The highest CBR test result was found in the 15% FA + 20% EDW mixture, at 20.1% in the unsoaked specimen.

4. Discussion

When the above results are examined, it is clearly seen that AEFA and EDW additives have improved the geotechnical and engineering properties of the clay.

4.1. Atterberg Limit Tests

Table 4 shows that the LL and PI values decrease and PL value increases as the waste material ratio increases. When the PL, LL, and PI values of the natural clay soil sample were compared after the addition of FA, it was observed that the LL value decreased by 23.18%, the PI value decreased by 55.10%, and the PL value increased by 23.35%. In EDW mixed clay samples, the LL value decreased by 29.88%, the PI value decreased by 55.42%, and the PL value increased by 12.56%. In the ternary mixture (15% AEFA constant + EDW + clayey soil), the LL value decreased by 33.72%, the PI value decreased by 81.45%, and the PL value increased by 35.07%. The plasticity index also decreased because of the dramatic decrease in the LL. This was thought to be because of the decrease in clay particle content. Moreover, the addition of EDW and AEFA reduced the clay size fraction of the soils due to flocculation of clay particles through cementation. Therefore, EDW and AEFA treatment made the soil more granular [20,31,32,33]. Additionally, decreasing PI increased the workability of the soils.
The Figure 4 classification of clayey soil taken from the field, according to LL and PI values, was determined as CH. The classification of the clay samples mixed with AEFA was found to be CL for mixtures of 5 and 10% and ML for mixtures of 15 and 20%. The classification of EDW-mixed clay samples was found to be CL. In the ternary mixture (AEFA 15% constant + EDW + clay), the classification was found to be ML for all ratios. As the percentage of AEFA and EDW increased in clay samples, LL and PI decreased because the additive EDW particles were non-cohesive and mostly granular materials. The soil class changed with the effect of AEFA and EDW when added to the clay samples. Similar results were found in the literature [16,29,33].

4.2. Compaction Tests

When Figure 5a is examined, it is seen that OMC decreases and MDD increases in AEFA-added samples. Additionally, it was observed that the sample with 15% AEFA additive gave the best results. According to the standard proctor test result, the MDD value increased by 5% and OMC decreased by 6% in mixtures with AEFA addition. The main reason for the increase in MDD and decrease in OMC in the clay sample mixed with AEFA is that it has a fine particle structure. Therefore, it fills the spaces between the clay particles and forms a denser structure. In Figure 5b, MDD increased and OMC decreased similarly in the EDW mixture. According to the test results, the MDD value increased by 4.3% and OMC decreased by 5.8% in mixtures with EDW addition. Also, Figure 5c shows that the highest MDD value was reached in the mixture with 15% fixed AEFA + 20% EDW ratio. According to the test result, the MDD value increased by 9.2% and OMC decreased by 14.5% in mixtures with EDW + 15% fixed AEFA. The main reason for the increase in MDD in mixtures made with EDW is that it has more angular particle properties. In addition, it is thought that AEFA + EDW mixtures give the best results due to the interlocking of EDW particles and the pozzolanic properties of AEFA [16,34,35].

4.3. Uniaxial Compressive Strength (UCS) Tests

UCS test results are shown in Figure 6 for 7- and 28-day curing times. The 28-day UCS test result for natural clay was 215 kPa, the highest result in the mixture with AEFA addition was 305 kPa at 20% mixture ratio, and the highest result in the EDW mixture was found to be 710 kPa at 20% mixture ratio. In addition, the highest UCS test result in the ternary mixture was found in the 15% AEFA + 20% EDW mixture ratio, at 1250 kPa. According to the natural clay 28-day UCS test results, when the results mixed with AEFA and EDW are compared, a 42% increase was observed in AEFA mixtures and a 230% increase was observed in EDW mixtures. The reason for the high UCS results of EDW mixtures is thought to be EDW binder properties due to the high CaO content [36]. An approximately 10% increase in compressive strength was seen between 7 days’ and 28 days’ curing time for all mixtures. An increase in compressive strength was seen in all specimens as the curing time increased. One of the main variables affecting the UCS of soil stabilized with FA is the curing time, which is due to the pozzolanic reaction. The pozzolanic reaction depends on the time and moisture content and chemical components of AEFA. Similarly, the reason for the significant increase in UCS results in the ternary mixture with EDW + AEFA is that it has both pozzolanic and binding properties since the amount of calcium oxide is high [17,36,37]. The results obtained from UCS tests have shown that EDW and AEFA are effective alternatives for stabilization of clayey soils to increase the bearing capacity of the soil.

4.4. Triaxial Tests

Figure 7a–c show that the deviator stress of the clay soil stabilized with both EDW and AEFA increased with the increase in the confining pressure. This is mostly due to the fact that the higher confining pressure during the consolidation stage reduces the void ratio and thus increases the strength of the soil. Clay specimens stabilized with AEFA illustrated ductile stress–strain response with increasing confining pressure. In EDW-stabilized specimens, the stress–strain behavior transformed from ductile to brittle behavior with increasing confining pressure. A brittle strain-softening behavior was observed for samples stabilized with EDW + AEFA. The brittle strain-softening response is due to a slight structural degradation occurring in the EDW + AEFA-stabilized soil during the consolidation stage, leading to behavior governed by cementitious bonds and friction. Similar outcomes have also been observed in the literature, especially in clay stabilization using fly ash and building demolition waste separately [17,37,38].
The Mohr circle is used to determine important engineering parameters such as cohesion and friction angle of the soil. Figure 8 demonstrates the Mohr circles drawn for the clay sample, 20% AEFA, and 15% AEFA + 20% EDW. According to the results of the triaxial test, the Mohr circle is formed, and the line intersecting the y-axis gives the cohesion, and the slope of the line gives the angle of internal friction. Table 5 shows that as the AEFA content increases, the cohesion also increases. The main reason for the increase in cohesion with AEFA is that fly ash has pozzolanic properties. The cohesion of EDW-added clay samples initially increased but then decreased. In the ternary mix with AEFA + EDW admixture, cohesion increased at low mix proportions and then decreased in admixtures of 15% and above. This is mainly due to the decrease in clay content and the addition of EDW with angular particles, which decreased cohesion [37,38,39].
The internal friction angle increased for EDW and AEFA binary and ternary mixture ratios. EDW and AEFA mixtures reduced the clay fraction and increased the average grain size of the mixture. Furthermore, this effect may be caused by the internal friction angle of the AEFA being more than that of the pure soil [20]. In particular, it contributed to the improvement of the shear resistance angle due to EDW. The Casagranda chart in Figure 4 demonstrates that the clay classification changes (from CH to CL and ML) due to the additional EDW and AEFA, supporting the increase in the angle of internal friction.
According to the results of the experiment, it was observed that EDW and AEFA contributed positively to the shear strength parameters (internal friction angle and cohesion) added to the clay soil. Especially in ternary mixtures (EDW and 15% AEFA ratio constant), both the cohesion values decreased, and the internal friction angle increased. It is understood that it increased soil strength and contributed positively to the bearing capacity. This is mainly due to the pozzolanic reaction and self-cementing behavior of the EDW and AEFA-added soil under the influence of AEFA [20]. It is thought that there will be more improvement with an increase in the curing time of the samples.

4.5. California Bearing Ratio (CBR) Tests

Table 6 demonstrates the increase in CBR test results for all ratios of AEFA and EDW added to clay samples. The increase in CBR value in the clay sample with AEFA added is relatively less than in the clay sample with EDW added. The general reason for this is that EDW has a more angular grain structure. At the beginning of the CBR test, it is divided into two: the elastic deformation phase and the shear phase. As penetration begins, elastic deformation appears in the sample and static friction between particles is the main force. At this moment, it can be said that cohesion has an effect on strength. As the penetration increases during the experimental phase, the sample enters the shearing phase. Meanwhile, the particles are compressed and sliding friction occurs. At this stage of the experiment, all the force generated is mainly covered by the friction force. The CBR value is essentially concerned with the friction of the material, as the elastic phase is often a shear phase because it is a short time.
The addition of AEFA and EDW increases the CBR value which occurs due to interlocking of the coarser particles and variation in the cohesive nature of the soil–AEFA composite. The increase in CBR is due to the presence of angular particles in the EDW, which mobilizes the angle of internal friction, resulting in an increase in strength. Similar behavior was observed by several researchers [15,17,20,31,33].
The CBR test is a universal standard used in road construction and includes various conditions. There are values indicating usability determined in the standards of various countries and in previous studies [40,41]. One of the most important studies is the work done by Look [41]. According to Look’s study [41], the ranges of CBR test results are as follows: if the soaked CBR strength value is determined as <1%, Extremely weak; 1–2%, Very weak; 2–3%, Weak; 3–10%, Fair; 10–30%, Strong Good; and >30%, Extremely strong. According to Table 6, it was determined that an AEFA mixture ratio of 20%, EDW mixture ratios of 10% and above, and all ratios for AEFA + EDW mixtures can be used as road sub-base material.

5. Conclusions

The general purpose of this study was to ensure that the building demolition waste generated after a major earthquake disaster is disposed of without harming the environment. Similarly, Afşin–Elbistan fly ash, which reaches very large masses and has limited usage areas because it does not comply with standards, was used to improve the engineering properties of clayey soils. With the mixtures created in different proportions, both waste disposal and the geotechnical properties of the weak soil were improved.
  • For all mixtures, as the waste material ratio increases, LL and PI values decrease and the PL value increases. Clayey soil taken from the field, according to LL and PI values, was determined as CH. The classification of the clay samples mixed with AEFA was found to be CL for mixtures of 5 and 10%, ML for mixtures of 15 and 20%. The classification of EDW-mixed clay samples was found to be CL. In the ternary mixture (AEFA 15% constant + EDW + clay), the classification was found to be ML for all ratios.
  • According to the compression test results, MDD increases and OMC decreases in samples with AEFA added. Additionally, it was observed that the sample with 15% AEFA additive gave the best results. MDD increased and OMC decreased similarly in the EDW mixture. Also shown was that the highest MDD value was reached in the mixture with 15% fixed AEFA + 20% EDW ratio.
  • The 28-day UCS test result for natural clay was 215 kPa, the highest result in the mixture with AEFA addition was 305 kPa at 20% mixture ratio, and the highest result in the EDW mixture was found to be 710 kPa with 20% mixture ratio. In addition, the highest UCS test result in the ternary mixture was found in the 15% AEFA + 20% EDW mixture ratio, at 1250 kPa. According to the natural clay 28-day UCS test results, when the results mixed with AEFA and EDW are compared, a 42% increase was observed in AEFA mixtures and a 230% increase was observed in EDW mixtures.
  • Clay specimens stabilized with AEFA illustrated ductile stress–strain response with increasing confining pressure. In EDW-stabilized samples, the stress–strain behavior transformed from ductile to brittle response with increasing confining pressure. A brittle strain-softening behavior was observed for samples stabilized with EDW + AEFA. The brittle strain-softening behavior is due to a slight structural degradation that occurs in the EDW + AEFA-stabilized soil during the consolidation phase, leading to behavior governed by cementitious bonds and friction.
  • The cohesion of EDW-added clay samples initially increased but then decreased. In the ternary mix with AEFA + EDW admixture, cohesion increased at low mix proportions and then decreased in admixtures of 15% and above. The internal friction angle increased for EDW and AEFA binary and ternary mixture ratios. EDW and AEFA mixtures reduced the clay content and increased the average particle size of the mixture. In particular, it contributed to the improvement of the shear resistance angle due to EDW.
  • The CBR test results increased for all ratios of AEFA and EDW added to clay samples. The increase in CBR value in the clay sample with AEFA added was relatively less than in the clay sample with EDW added. It was determined that an AEFA mixture ratio of 20%, EDW mixture ratios of 10% and above, and all ratios for AEFA + EDW mixtures can be used as road sub-base material.
  • After the major earthquake disaster, the use of EDW is of great importance for the environment. AEFA and EDW were found to improve the engineering and geotechnical characteristics of the clay. As a consequence, this experimental work demonstrated an environmentally friendly and sustainable approach.

Funding

This research received no external funding.

Institutional Review Board Statement

Not applicable.

Informed Consent Statement

Not applicable.

Data Availability Statement

The data used are available to the corresponding author upon request.

Acknowledgments

The experimental work of this article was carried out at Kahramanmaraş Sütçü İmam University, Civil Engineering Laboratory.

Conflicts of Interest

The author declares no conflicts of interest.

References

  1. Çınar, M.; Karpuzcu, M.; Çanakçı, H. The measurement of fresh properties of cement-based grout containing waste marble powder. Measurement 2020, 150, 106833. [Google Scholar] [CrossRef]
  2. Çelik, F.; Çınar, M.; Akcuru, O. Utilization of waste bottom ash as mineral additive with partial replacement of cement in geotechnical grouting works based on mechanical features. Arab. J. Geosci. 2022, 15, 1290. [Google Scholar] [CrossRef]
  3. Kumar, P.G.; Harika, S. Stabilization of expansive subgrade soil by using fly ash. Mater. Today Proc. 2021, 45, 6558–6562. [Google Scholar] [CrossRef]
  4. Purchase, C.K.; Al Zulayq, D.M.; O’Brien, B.T.; Kowalewski, M.J.; Berenjian, A.; Tarighaleslami, A.H.; Seifan, M. Circular Economy of Construction and DemolitionWaste: A Literature Review on Lessons, Challenges, and Benefits. Materials 2022, 15, 76. [Google Scholar] [CrossRef] [PubMed]
  5. Wang, L.; Zhou, Y.; Nagarajaiah, S.; Shi, W. Bi-directional semi-active tuned mass damper for torsional asymmetric structural seismic response control. Eng. Struct. 2023, 294, 116744. [Google Scholar] [CrossRef]
  6. Zhang, H.; Wang, L.; Shi, W. Seismic control of adaptive variable stiffness intelligent structures using fuzzy control strategy combined with LSTM. J. Build. Eng. 2023, 78, 107549. [Google Scholar] [CrossRef]
  7. Ceyhan, Z.N.; Diş, M.Ö. Çoklu Projeksiyon Yöntemleri ile Kahramanmaraş’ın Gelecek Nüfusunun Belirlenmesi. Çukurova Üniversitesi Mühendislik Fakültesi Dergisi 2022, 37, 1155–1164. [Google Scholar] [CrossRef]
  8. Akgönen, A.İ.; Özbek, A. A CASE study on pile design of wind turbine foundation (Kahramanmaras-Turkey). Eskişehir Tech. Univ. J. Sci. Technol. A-Appl. Sci. Eng. 2020, 21, 407–420. [Google Scholar] [CrossRef]
  9. Kop, A.; Ezer, M.; Bodur, M.N.; Darbaş, G.; Inan, S.; Ergintav, S.; Seyis, C.; Yalçin, C. Geochemical Monitoring Along the Türkoğlu (Kahramanmaraş)-Gölbaşı (Adıyaman) Segments of the East Anatolian Fault System. Arab. J. Sci. Eng. 2014, 39, 5521–5536. [Google Scholar] [CrossRef]
  10. Över, S.; Demirci, A.; Özden, S. Tectonic implications of the February 2023 Earthquakes (Mw7. 7, 7.6 and 6.3) in south-eastern Türkiye. Tectonophysics 2023, 866, 230058. [Google Scholar] [CrossRef]
  11. Doğdu, G.; Alkan, S.N. Deprem Sonrası Oluşan İnşaat ve Yıkıntı Atıklarının Değerlendirilmesi: 6 Şubat 2023 Kahramanmaraş Depremleri. Artvin Çoruh Üniversitesi Mühendislik ve Fen Bilimleri 2023, 1, 38–50. [Google Scholar]
  12. Temiz, H.; Tandirci, E. Investigation of mechanical and insulation properties of Sorel cement binding light concrete. Constr. Build. Mater. 2023, 379, 131270. [Google Scholar] [CrossRef]
  13. Türker, P.; Erdoğan, B.; Katnaş, F.; Yeğinobalı, A. Türkiye’deki Uçucu Küllerin Siniflandirilmasi Ve Özellikleri; Tçmb: Ankara, Turkey, 2009. [Google Scholar]
  14. ASTM C618-19; Standard Specification for Coal Fly Ash and Raw or Calcined Natural Pozzolan for Use in Concrete. American Society of Testing Materials: West Conshohocken, PA, USA, 2019.
  15. Vural, I.; Akgül, T.; Aydin, E. İnşaat Yıkıntı Atıkları Kullanılarak Zeminlerin Serbest Basınç Dayanımının Iyilestirilmesi. In Proceedings of the 5th International Symposium on Innovative Technologies in Engineering and Science, Baku, Azerbaijan, 29–30 September 2017. [Google Scholar]
  16. Çimen, Ö.; Günaydin, H.İ.; Keskin, S.N. Yüksek plastisiteli kil zeminin mühendislik özelliklerine inşaat atıklarının etkisi. Pamukkale Üniversitesi Mühendislik Bilimleri Dergisi 2017, 23, 250–253. [Google Scholar]
  17. Sharma, A.; Sharma, R.K. Effect of addition of construction–demolition waste on strength characteristics of high plastic clays. Innov. Infrastruct. Solut. 2019, 4, 27. [Google Scholar] [CrossRef]
  18. Leiva, C.; Solís-Guzmán, J.; Marrero, M.; García Arenas, C. Recycled blocks with improved sound and fire insulation containing construction and demolition waste. Waste Manag. 2013, 33, 663–671. [Google Scholar] [CrossRef] [PubMed]
  19. Sari, A.B.; Gadouri, H.; Ghrici, M.; Harichane, K. Best-fit models for predicting the geotechnical properties of FA–stabilised problematic soils used as materials for earth structures. Int. J. Pav. Eng. 2020, 21, 939–953. [Google Scholar] [CrossRef]
  20. Hakan, G. Influence of Afşin-Elbistan highly lime fly ash on engineering behavior of a cohesive soil. Sci. Res. Essays 2010, 5, 1307–1316. [Google Scholar]
  21. Çimen, Ö.; Keleş, E. Yüksek Plastisiteli Bir Kilin Mühendislik Özelliklerine Uçucu Kül ve Kireç Katkılarının Etkisi. İleri Müh. Çalış. Tek. Derg. 2020, 1, 80–90. [Google Scholar]
  22. ASTM C136/C136M; Standard Test Method for Sieve Analysis of Fine and Coarse Aggregates. ASTM International: West Conshohocken, PA, USA, 2019.
  23. ASTM D422; Standard Test Method for Particle-Size Analysis of Soils. ASTM International: West Conshohocken, PA, USA, 2007.
  24. ASTM D4318-17e1; Standard Test Methods for Liquid Limit, Plastic Limit, and Plasticity Index of Soils. American Society for Testing and Materials: Philadelphia, PA, USA, 2018.
  25. ASTMD698; Standard Test Methods for Laboratory Compaction Characteristics of Soil Using Standard Effort. ASTM International: West Conshohocken, PA, USA, 2021.
  26. ASTM D2166/D2166M-16; Standard Test Method for Unconfined Compressive Strength of Cohesive Soil. ASTM International: West Conshohocken, PA, USA, 2016.
  27. ASTM D2850-15; Standard Test Method for Uncosnolidated-Undrained Triaxial Compression Test on Cohesive Soils. ASTM: West Conshohocken, PA, USA, 2017.
  28. ASTM D1883-16; Standard Test Method for California Bearing Ratio (CBR) of Laboratory Compacted Soil. ASTM International: West Conshohocken, PA, USA, 2016.
  29. Islam, S.; Islam, J.; Hoque, N.M.R. Improvement of consolidation properties of clay soil using fine-grained construction and demolition waste. Heliyon 2022, 8, e11029. [Google Scholar] [CrossRef]
  30. Hu, Q.; Song, W.; Hu, J. Study of the Mechanical Properties and Water Stability of Microbially Cured, Coir-Fiber-Reinforced Clay Soil. Sustainability 2023, 15, 13261. [Google Scholar] [CrossRef]
  31. Turan, C.; Javadi, A.A.; Vinai, R.; Beig Zali, R. Geotechnical Characteristics of Fine-Grained Soils Stabilized with Fly Ash, a Review. Sustainability 2022, 14, 16710. [Google Scholar] [CrossRef]
  32. Tanyıldızı, M.; Uz, V.E.; Gökalp, İ. Utilization of waste materials in the stabilization of expansive pavement subgrade: An extensive review. Constr. Build. Mater. 2023, 398, 132435. [Google Scholar] [CrossRef]
  33. Diallo, M.L.; Ünsever, Y.S. An experimental study on the stabilization of a clay soil with construction wastes and lime. Pamukkale Univ. J. Eng. Sci. 2020, 26, 1030–1034. [Google Scholar] [CrossRef]
  34. Vitales, V.V.; Amaludin, A.E.; Ho, Y.; Amaludin, N.A. Soil plasticity and standard proctor compaction characteristics of stabilized Kota Kinabalu clay using biomass silica (SH-85). IOP Conf. Ser. Mater. Sci. Eng. 2022, 1217, 012006. [Google Scholar] [CrossRef]
  35. Cinar, M. Investigation of Mechanical and Physical Features of Cementitious Jet Grout Applications for Various Soil Types. Buildings 2023, 13, 2833. [Google Scholar] [CrossRef]
  36. Tastan, E.O.; Edil, T.B.; Benson, C.H.; Aydilek, A.H. Stabilization of Organic Soils with Fly Ash. J. Geotech. Geoenviron. Eng. 2011, 137, 819–833. [Google Scholar] [CrossRef]
  37. Lukiantchuki, J.A.; Oliveira, J.R.M.D.S.D.; Almeida, M.D.S.S.D.; dos Reis, J.H.C.; Silva, T.B.; Guideli, L.C. Geotechnical behavior of Construction Waste (CW) as a partial replacement of a lateritic soil in fiber-reinforced cement mixtures. Geotechnol. Geol. Eng. 2021, 39, 919–942. [Google Scholar] [CrossRef]
  38. Sharma, R.K.; Hymavathi, J. Effect of fly ash, construction demolition waste and lime on geotechnical characteristics of a clayey soil: A comparative study. Environ. Earth Sci. 2016, 75, 377. [Google Scholar] [CrossRef]
  39. Binal, A. The Effects of High Alkaline Fly Ash on Strength Behaviour of a Cohesive Soil. Adv. Mater. Sci. Eng. 2016, 2016, 3048716. [Google Scholar] [CrossRef]
  40. National Cooperative Highway Research Program (NCHRP). Guide for Mechanistic-Empirical Design of New and Rehabilitated Pavement Structures; National Cooperative Highway Research Program 1-37 A; NCHRP: Washington, DC, USA, 2004. [Google Scholar]
  41. Look, B.G. Handbook of Geotechnical Investigation and Design Tables; CRC Press: London, UK, 2014. [Google Scholar]
Figure 1. A simplified view of Gölbaşı–Türkoğlu segment and Türkoğlu–Antakya segment of the Eastern Anatolian Fault System [9].
Sustainability 16 00538 g001
Figure 2. Location of Kahramanmaraş in Turkiye and the location of earthquakes in Kahramanmaraş.
Sustainability 16 00538 g002
Figure 3. The physical appearance of clay, EDW, and AEFA.
Sustainability 16 00538 g003
Figure 4. Casagrande plasticity chart of clay, EDW, and AEFA.
Sustainability 16 00538 g004
Figure 5. Standard proctor compaction test result of clay, EDW, and AEFA. (a) Clay+ AEFA (b) Clay + EDW (c) Clay + 15% AEFA + EDW.
Sustainability 16 00538 g005
Figure 6. UCS test result of clay, EDW, and AEFA for 7 and 28 days’ curing time.
Sustainability 16 00538 g006
Figure 7. Stress–strain behavior of (a) Clay sample (b) Clay + 20% AEFA (c) Clay + 15% AEFA + 20% EDW, cured for 28 days, at 100 kPa, 200 kPa, and 400 kPa confining pressure.
Sustainability 16 00538 g007aSustainability 16 00538 g007b
Figure 8. Shear strength parameter Mohr–Coulomb (Mohr stress circle at 100 kPa, 200 kPa, and 400 kPa confining pressure) (a) Clay (b) Clay + 20% AEFA (c) Clay + 15% AEFA + 20% EDW.
Sustainability 16 00538 g008aSustainability 16 00538 g008b
Table 1. Chemical content of clay, AEFA, and EDW samples.
Chemical Content (%)ClayAEFAEDW
Al2O312.108.4010.25
CaO6.3754.3022.10
Cl-0.010.05
Cr2O3--0.03
Fe2O35.052.367.23
K2O1.120.451.79
MgO1.151.541.48
Na2O0.390.091.03
NiO--0.01
P2O5-0.540.10
SO30.1011.203.15
SiO262.1018.5042.43
TiO2-0.250.48
LOI11.622.369.87
Table 2. Engineering features of clay, AEFA, and EDW samples.
ParametersClayAEFAEDW
Plasticity Index (%)30.7--
Plastic limit (%)21.3--
Liquid limit (%)52.1--
MDD (kN/m3)17.211.5215.65
OMC (%)16.92013
Specific Gravity (%)2.702.752.55
Finer Component (%)52.50--
USCS ClassificationCH--
Table 3. The proportions of clay, AEFA, and EDW mixtures.
Soil (%)AEFA (%)EDW (%)
CH0FA10000
CH5FA9550
CH10FA90100
CH15FA85150
CH20FA80200
CH5EDW9505
CH10EDW90010
CH15EDW85015
CH20EDW80020
CH15FA5EDW80155
CH15FA10EDW751510
CH15FA15EDW701515
CH15FA20EDW651520
Table 4. Changes in the liquid limit, plastic limit, and plasticity index by adding EDW and AEFA to the clay sample.
LL (%)PL (%)PI (%)
CH0FA52.121.330.7
CH5FA42.123.318.8
CH10FA41.525.516.0
CH15FA4025.914.1
CH20FA40.126.313.8
CH5EDW39.52415.5
CH10EDW38.423.514.9
CH15EDW37.223.114.1
CH20EDW36.522.813.7
CH15FA5EDW38.127.710.4
CH15FA10EDW37.428.19.3
CH15FA15EDW3528.56.5
CH15FA20EDW34.528.85.7
Table 5. Shear strength parameters of clay, EDW, and AEFA.
c (kPa)ø (Deg.)
CH0FA1073.5
CH5FA1657
CH10FA17510.5
CH15FA19913
CH20FA18211
CH5EDW14011.2
CH10EDW12511.9
CH15EDW11012.4
CH20EDW10313.5
CH15FA5EDW198.114.2
CH15FA10EDW17610.6
CH15FA15EDW13515.6
CH15FA20EDW95.817.4
Table 6. CBR results of clay, EDW, and AEFA.
Unsoaked Samples (%)Soaked Samples (%)
CH0FA52
CH5FA5.83.5
CH10FA10.55.9
CH15FA12.48.5
CH20FA14.210.5
CH5EDW9.47.6
CH10EDW12.610.1
CH15EDW13.912.5
CH20EDW15.513.4
CH15FA5EDW13.510.9
CH15FA10EDW14.212.4
CH15FA15EDW14.613.1
CH15FA20EDW20.115.6
Disclaimer/Publisher’s Note: The statements, opinions and data contained in all publications are solely those of the individual author(s) and contributor(s) and not of MDPI and/or the editor(s). MDPI and/or the editor(s) disclaim responsibility for any injury to people or property resulting from any ideas, methods, instructions or products referred to in the content.

