1. Introduction
Soil stabilization is a process that includes modifying the features of soil to improve its durability, strength, and overall engineering performance. This is often performed to make the soil suitable for construction purposes or to enhance its load-bearing capacity. Various techniques and materials can be used for soil stabilization, depending on the specific features of the soil and the intended use of the stabilized ground [
1,
2,
3]. Soil stabilization is crucial in construction projects, particularly in areas with weak or problematic soils. This helps prevent settlement, erosion, and other issues that could compromise the integrity of structures built on or in the soil. The choice of stabilization method depends on factors such as the soil type, project requirements, and environmental considerations [
1].
Nowadays, due to the increase in waste materials and by-products, the use of these products in soil stabilization has become a very important point. Soil stabilization using waste materials involves the utilization of industrial by-products or other waste materials to enhance the engineering features of the soil. This practice not only addresses environmental concerns associated with waste disposal but also provides a cost-effective and sustainable solution for soil improvement in construction projects. According to the specific requirements and properties of the soil, several waste materials can be utilized for soil stabilization. The effectiveness of waste materials in soil stabilization depends on factors such as the type of waste, soil features, and intended use of the stabilized soil. Careful testing and engineering analyses are typically conducted to determine the appropriate dosage and mixing procedures to achieve the desired stabilization results. Utilizing waste materials for soil stabilization not only provides a sustainable solution but also contributes to reducing the environmental impact associated with waste disposal [
2].
An earthquake is a violent and sudden shaking of the ground, often induced by movement along geological faults or volcanic activity. It is a natural phenomenon resulting from the energy released into the Earth’s crust, which creates seismic waves. These waves propagate outward from the fault or seismic source, causing the ground to shake. Earthquakes have significant and often devastating effects that cause damage to buildings, infrastructure, and landscapes. The severity of the impact depends on factors such as the earthquake depth, proximity to populated areas, building construction standards, and local geological conditions [
4,
5,
6].
Kahramanmaraş and its surroundings, located in the zone where the Arabian and Anatolian plates are intertwined, have soil and rock types that show significant differences in terms of age, environment, and lithology. In general, Kahramanmaraş province and its vicinity were formed due to the closure of the ocean between the Anatolian plate and the Arabian plate. Therefore, rock assemblages belonging to the continental crust of the Toros belt and the oceanic crust of the Neotethys in between are observed [
7,
8,
9,
10]. There are very important faults that have the potential to produce earthquakes in and around Kahramanmaraş. The southwestern part of the Gölbaşı–Türkoğlu segment of the the East Anatolian Fault System and the northeastern part of the Türkoğlu–Antakya segment pass through the Kahramanmaraş city borders, and these two segments merge with each other in an area very close to the city center.
Figure 1 shows a simplified view of Gölbaşı–Türkoğlu segment and Türkoğlu–Antakya segment of the Eastern Anatolian Fault System [
9].
In Türkiye, on 6 February 2023, earthquakes of magnitude 7.6 and 7.7 happened in the Elbistan (Location 1) and Pazarcık (Location 2) districts of Kahramanmaraş, respectively, and thousands of aftershocks were recorded [
10] (
Figure 2). Because of these major earthquakes, it is clear that disasters pose significant risks to public health and the environment. One of the most widely publicized of these is the management of large amounts of earthquake demolition waste (EDW) generated by earthquakes, in accordance with regulations. According to the Doğdu and Alkan [
11] studies, around 350 to 580 million tons of EDW will be caused as a result of the Kahramanmaraş earthquake, and 60% of this waste will be concrete waste.
Coal-fired power plants generate electricity by burning coal, and one of the by-products of this combustion process is fly ash (FA). FA is formed of fine particles that are carried away in the flue gases produced during the burning of coal. It is a type of coal combustion residue. The composition of FA can vary depending on the type of coal being burned, the combustion conditions, and the collection methods. Generally, it consists of fine, spherical particles that are carried out of the combustion chamber in the flue gas. There are two main types of FA. Class F fly ash is generated from burning anthracite or bituminous coal and typically includes a higher percentage of silica, alumina, and iron. Class C fly ash is generated from burning sub-bituminous or lignite coal and includes a higher percentage of calcium oxide. According to 2022 data, coal-fired power plants represent the largest share of global electricity production with 39%. Similarly, Türkiye produces 37 percent of its electricity from coal [
12].
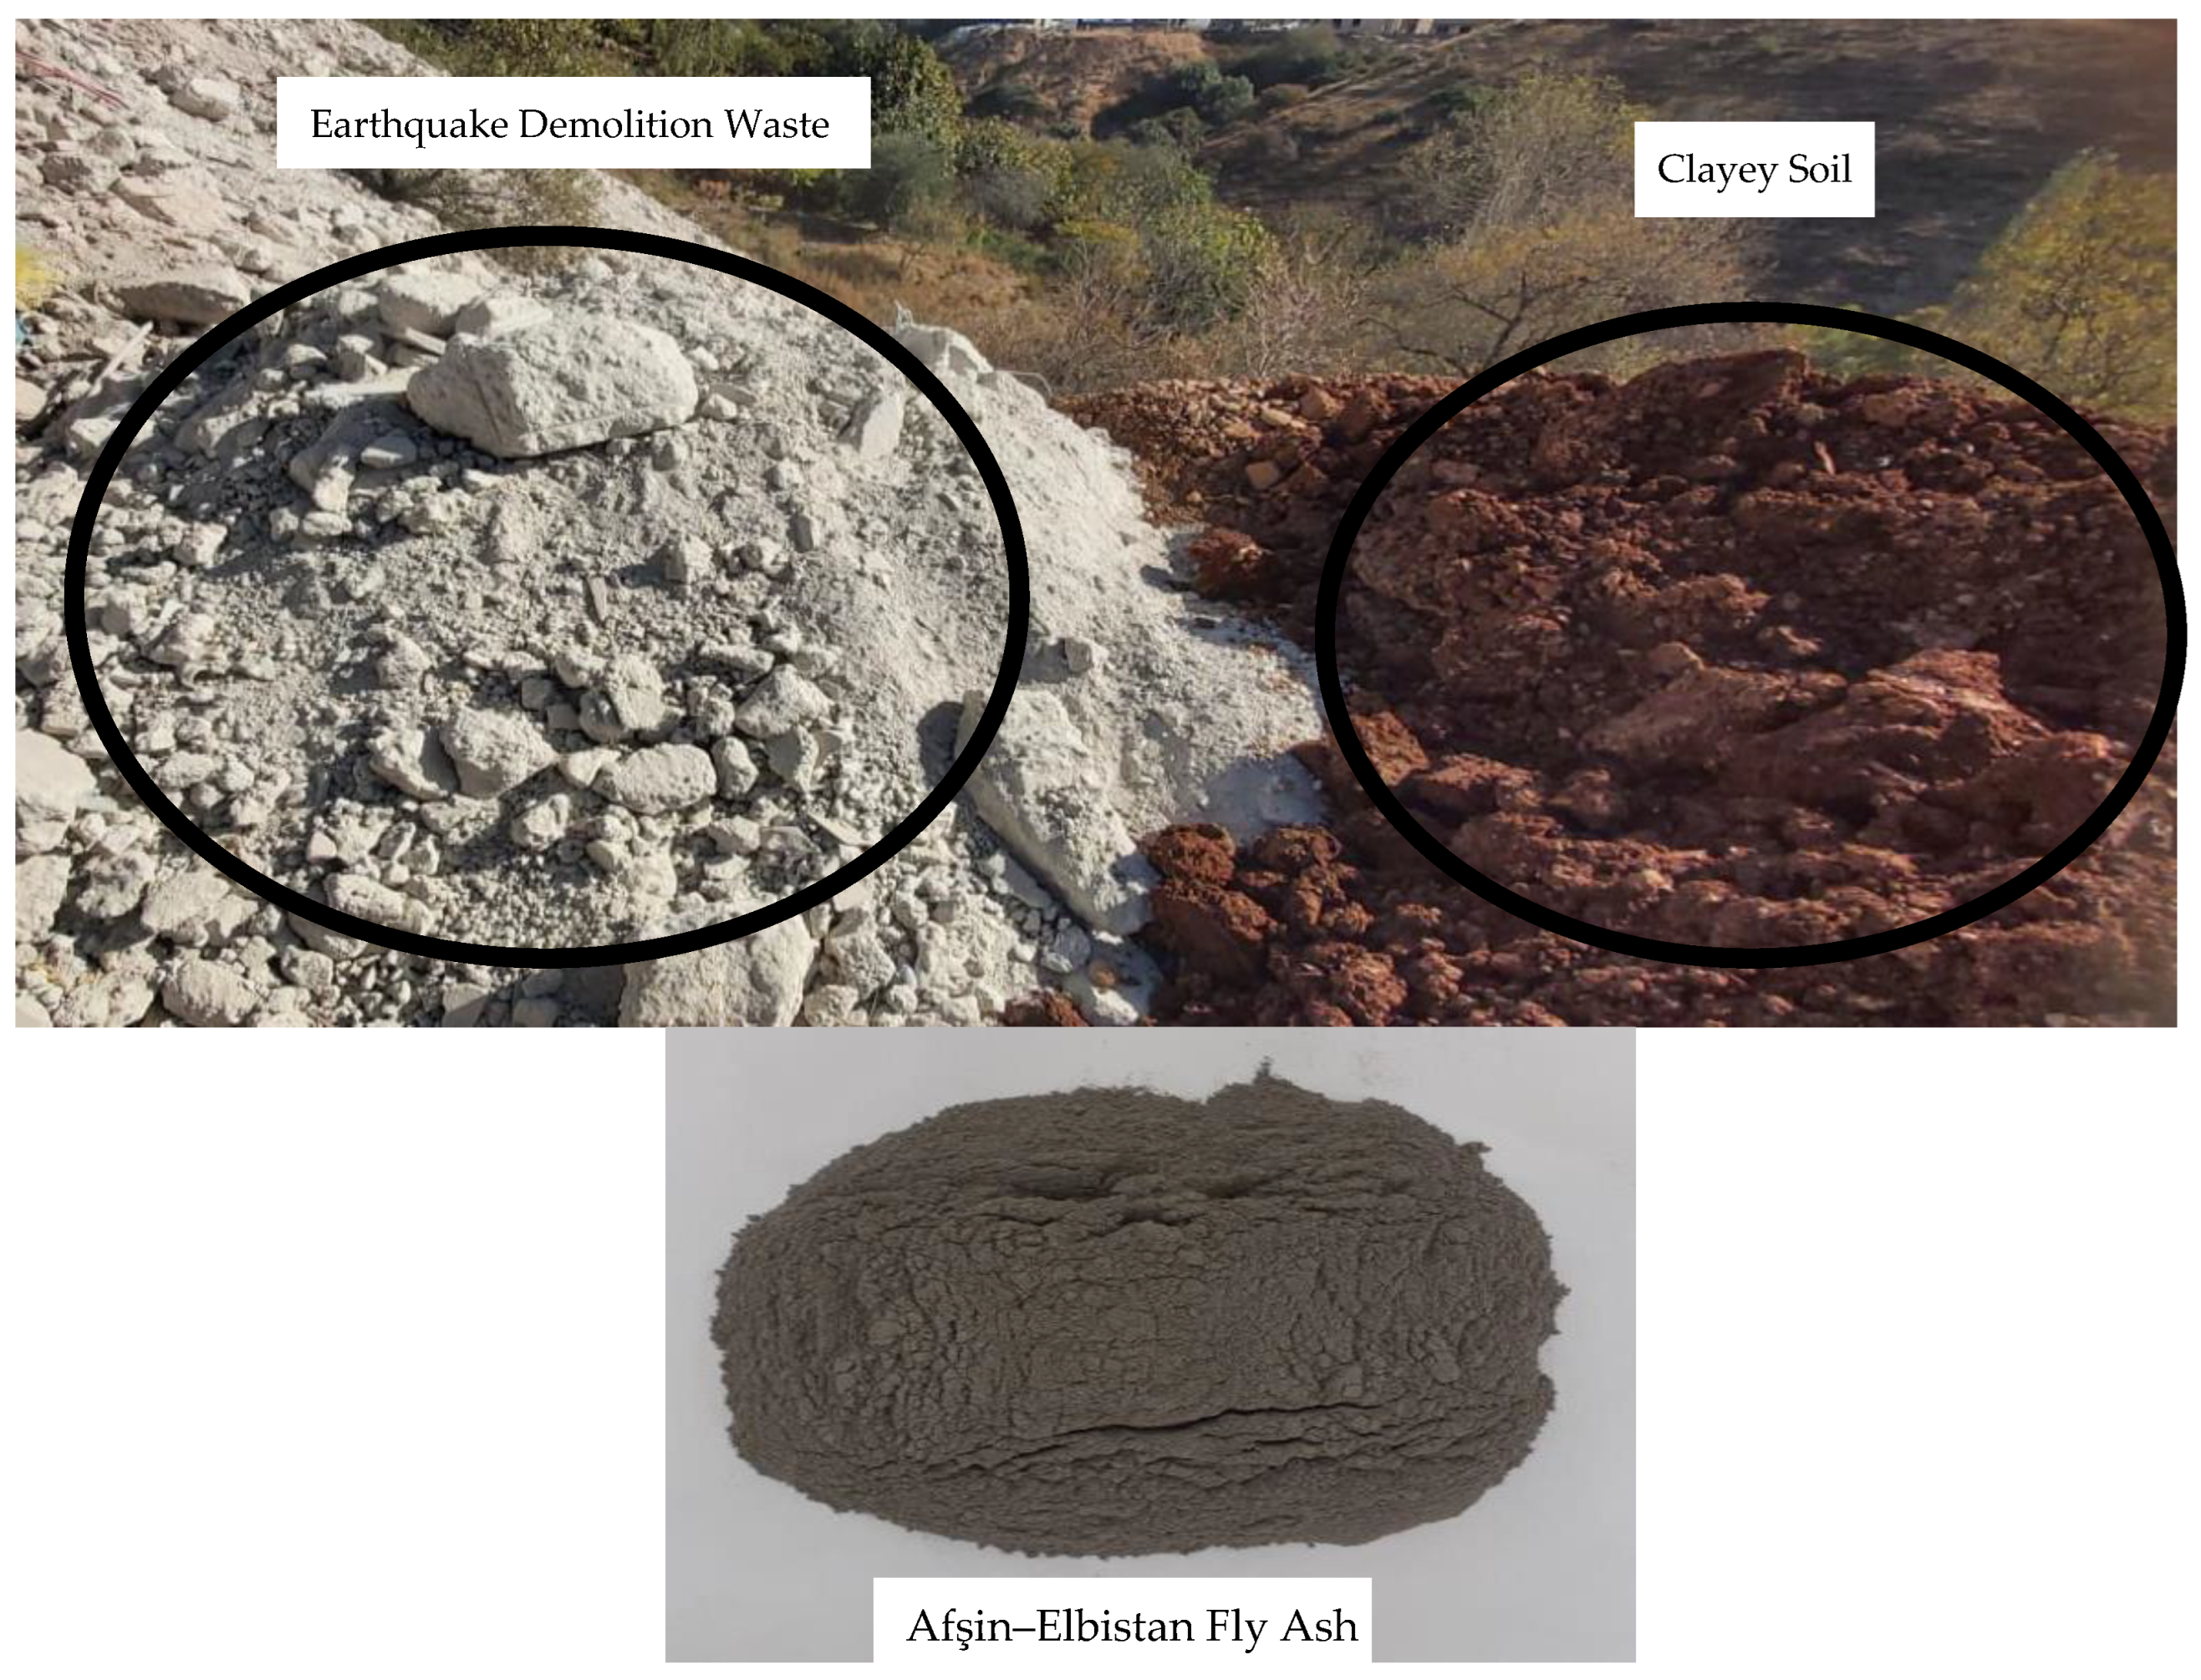
In this experimental work, EDW and Afşin–Elbistan fly ash (AEFA) were used together to enhance the engineering and geotechnical features of clayey soil in the Kahramanmaraş region, and experiments were conducted on the use of alternative materials for soil stabilization.
Afşin–Elbistan Thermal Power Plant, located in Kahramanmaraş, is the eighth-largest power plant in Turkey and the second-largest in Kahramanmaraş with its installed capacity. The facility is also Turkey’s third-largest lignite thermal power plant [
13]. Samples taken from the Afşin–Elbistan Thermal Power Plant were chemically analyzed, and controls were ensured according to ASTM C618 standards [
14]. According to the chemical analysis results, it is out of class because the reactive CaO ratio (54%) is over 10%, the total value of Fe
2O
3+ Al
2O
3+ SiO
2 (30%) is under fifty percent, and it was also stated to be out of class because the SiO
2 ratio (18.5%) was below 25% (
Table 1) [
12,
13]. Moreover, Afşin–Elbistan Thermal Power Plant has the highest capacity to generate energy and produce FA as a by-product in Turkey. Since the produced FA does not comply with the standard due to the high free CaO, low SiO
2, and high SO
3 rates it contains, it is not widely used as a concrete additive and for cement production. For this reason, the consumption rate remains low, and storage is used as a solution.
When previous studies were investigated, it was observed that construction demolition waste and fly ash were studied separately for soil stabilization [
15,
16,
17,
18,
19,
20,
21]. It has been observed in the literature that Afşin–Elbistan fly ash, which is out of standard, is limited in use for soil stabilization. Additionally, there is no study on soil stabilization by mixing FA with EDW.
Vural et al. [
15] researched the impact of construction demolition waste on soil stabilization in clayey soils in their experimental study. From the results of experiments performed on samples prepared from construction demolition waste and kaolin clay, it was concluded that construction demolition waste increases the UCS strength of clay and can be used as an additive in the improvement of clayey soils. Çimen et al. [
16] worked on the impact of construction demolition waste on the engineering features of a high-plasticity clay. For this purpose, mixtures were prepared with various ratios of soil by weight. As a result, it was found that by adding construction demolition waste to the ground, the swelling potential decreased, and the unconfined compressive strength increased. Additionally, it has been determined that the ideal ratio of construction demolition waste is between 10% and 20%. Sharma et. al. [
17] used certain proportions of construction demolition waste for the stabilization of clay soils. Adding the construction demolition waste content in un-stabilized soil increased the pH value of the composite. The addition of construction demolition waste content in the un-stabilized soil decreased the plastic limit, liquid limit, and plasticity index. The stress–strain features improved by 24% waste material content. With the increase in waste rate, the cohesion value decreased, and the friction angle increased. Carlos et al. [
18] conducted infiltration tests of materials produced from construction waste and showed that there was no harm to the environment.
When previous studies were investigated, fly ashes were often substituted for cement. The major cause for this is that FA has a pozzolanic feature because of the high CaO content in it. AEFA cannot be used instead of cement because it is non-classified. There are also very limited studies in the AEFA literature.
Sari et al. [
19] and Hakan [
20] added FA to cohesive soils at ratios of 0 to 25%. In the study, FA added to cohesive soil increased plasticity. In addition, flocculation increased in the prepared mixture, and this is because of the pozzolanic features of FA. In this experimental study, it was determined that the maximum dry density (MDD), optimum moisture content (OMC), and UCS increased. The optimum FA content was found to be between 15% and 20% by weight. Çimen and Keleş’s study [
21], 5% to 30% by weight of FA was added to high-plasticity clay, and compaction tests, Atterberg limit tests, UCS tests, and swelling pressure tests were performed. Then, the same series of tests were repeated by keeping the lime content constant at 6% by weight. In the experiments, it was determined that the plasticity index, liquid limit value, and swelling pressure decreased with an increasing additive amount, while the plastic limit value, MDD, OMC, and UCS increased. The optimum FA ratio additive amount was found to be 15% by weight.
In this study, samples were prepared by separately adding 5%, 10%, 15%, and 20% AEFA and EDW to high-plasticity clay. The Atterberg limit, standard proctor compaction, unconfined compression strength (UCS), triaxial, and California bearing ratio (CBR) tests were performed on the samples. In addition, clay mixtures were prepared with EDW by keeping the AEFA ratio constant at 15%, and their effects were also investigated. Consequently, the impacts of AEFA and EDW on the engineering and geotechnical features of clay were determined. The major innovation of this study is the use of waste concrete material generated after a major earthquake disaster for soil stabilization to minimize the damage to the environment, and the use of Afşin–Elbistan fly ash for soil stabilization, which is abundant in the region and of limited use due to its non-standardization. In addition, the study investigated the effect of EDW in combination with non-standard AEFA to achieve a more effective soil improvement, and the feasibility of using AEFA and EDW in soil stabilization was investigated.
3. Results
To improve the geomechanical properties of clay soil, waste EDW generated after the earthquake and AEFA, which is not used in the concrete industry due to its chemical content, was used in different proportions. The mixtures were prepared, and the Atterberg limit test, standard proctor compaction test, UCS test, triaxial compression test and CBR test were performed.
3.1. Atterberg Limit Tests
The LL of the clay sample taken from the field was found to be 52.1%, the plastic limit was 21.3%, and the plasticity index was 30.7%. The results of the mixtures consisting of AEFA and EDW are shown in
Table 4. Also, the change in soil classification of the clay mixture formed with waste materials is shown in
Figure 4.
In the binary clay and AEFA mixture, the highest LL value was found to be 42.1% in the 5% mixture. The LL values of the other mixtures were 41.5%, 40%, 40.1%, respectively. The PL values were 23.3%, 25.5%, 25.9% and 26.3%, respectively. In the binary clay and EDW mixture, the highest LL value was found to be 39.5% in the 5% mixture. It was found to be 38.4%, 37.2%, 36.5% in other mixtures, respectively. The PL value was found to be 24%, 23.5%, 23.1% and 22.8%, respectively. In the ternary mixture of clay, EDW, and 15% AEFA, the highest LL value was found to be 38.1% in the 5% mixture. It was found to be 37.4%, 35%, 34.5% in the other mixtures, respectively. The PL values were 27%, 28.1%, 28.5%, 28.5%, and 28.8%, respectively.
Figure 4 demonstrates the classification of clayey soils from the Casagrande plasticity chart according to their LL and PI values. According to the Casagrande plasticity chart, soils with an LL value greater than 50% between line A and line U are referred to as high-plasticity clay (CH). If the LL value is below 50%, it is expressed as low-plasticity clay (CL). Soils between line A and line U with PI values between 4 and 7 are defined as low-plasticity clay and silt (CL-ML). If the LL value is below line A and the LL value is greater than 50%, it is referred to as high-plasticity silt (MH) and if the LL value is less than 50%, it is referred to as low-plasticity silt (ML) [
29].
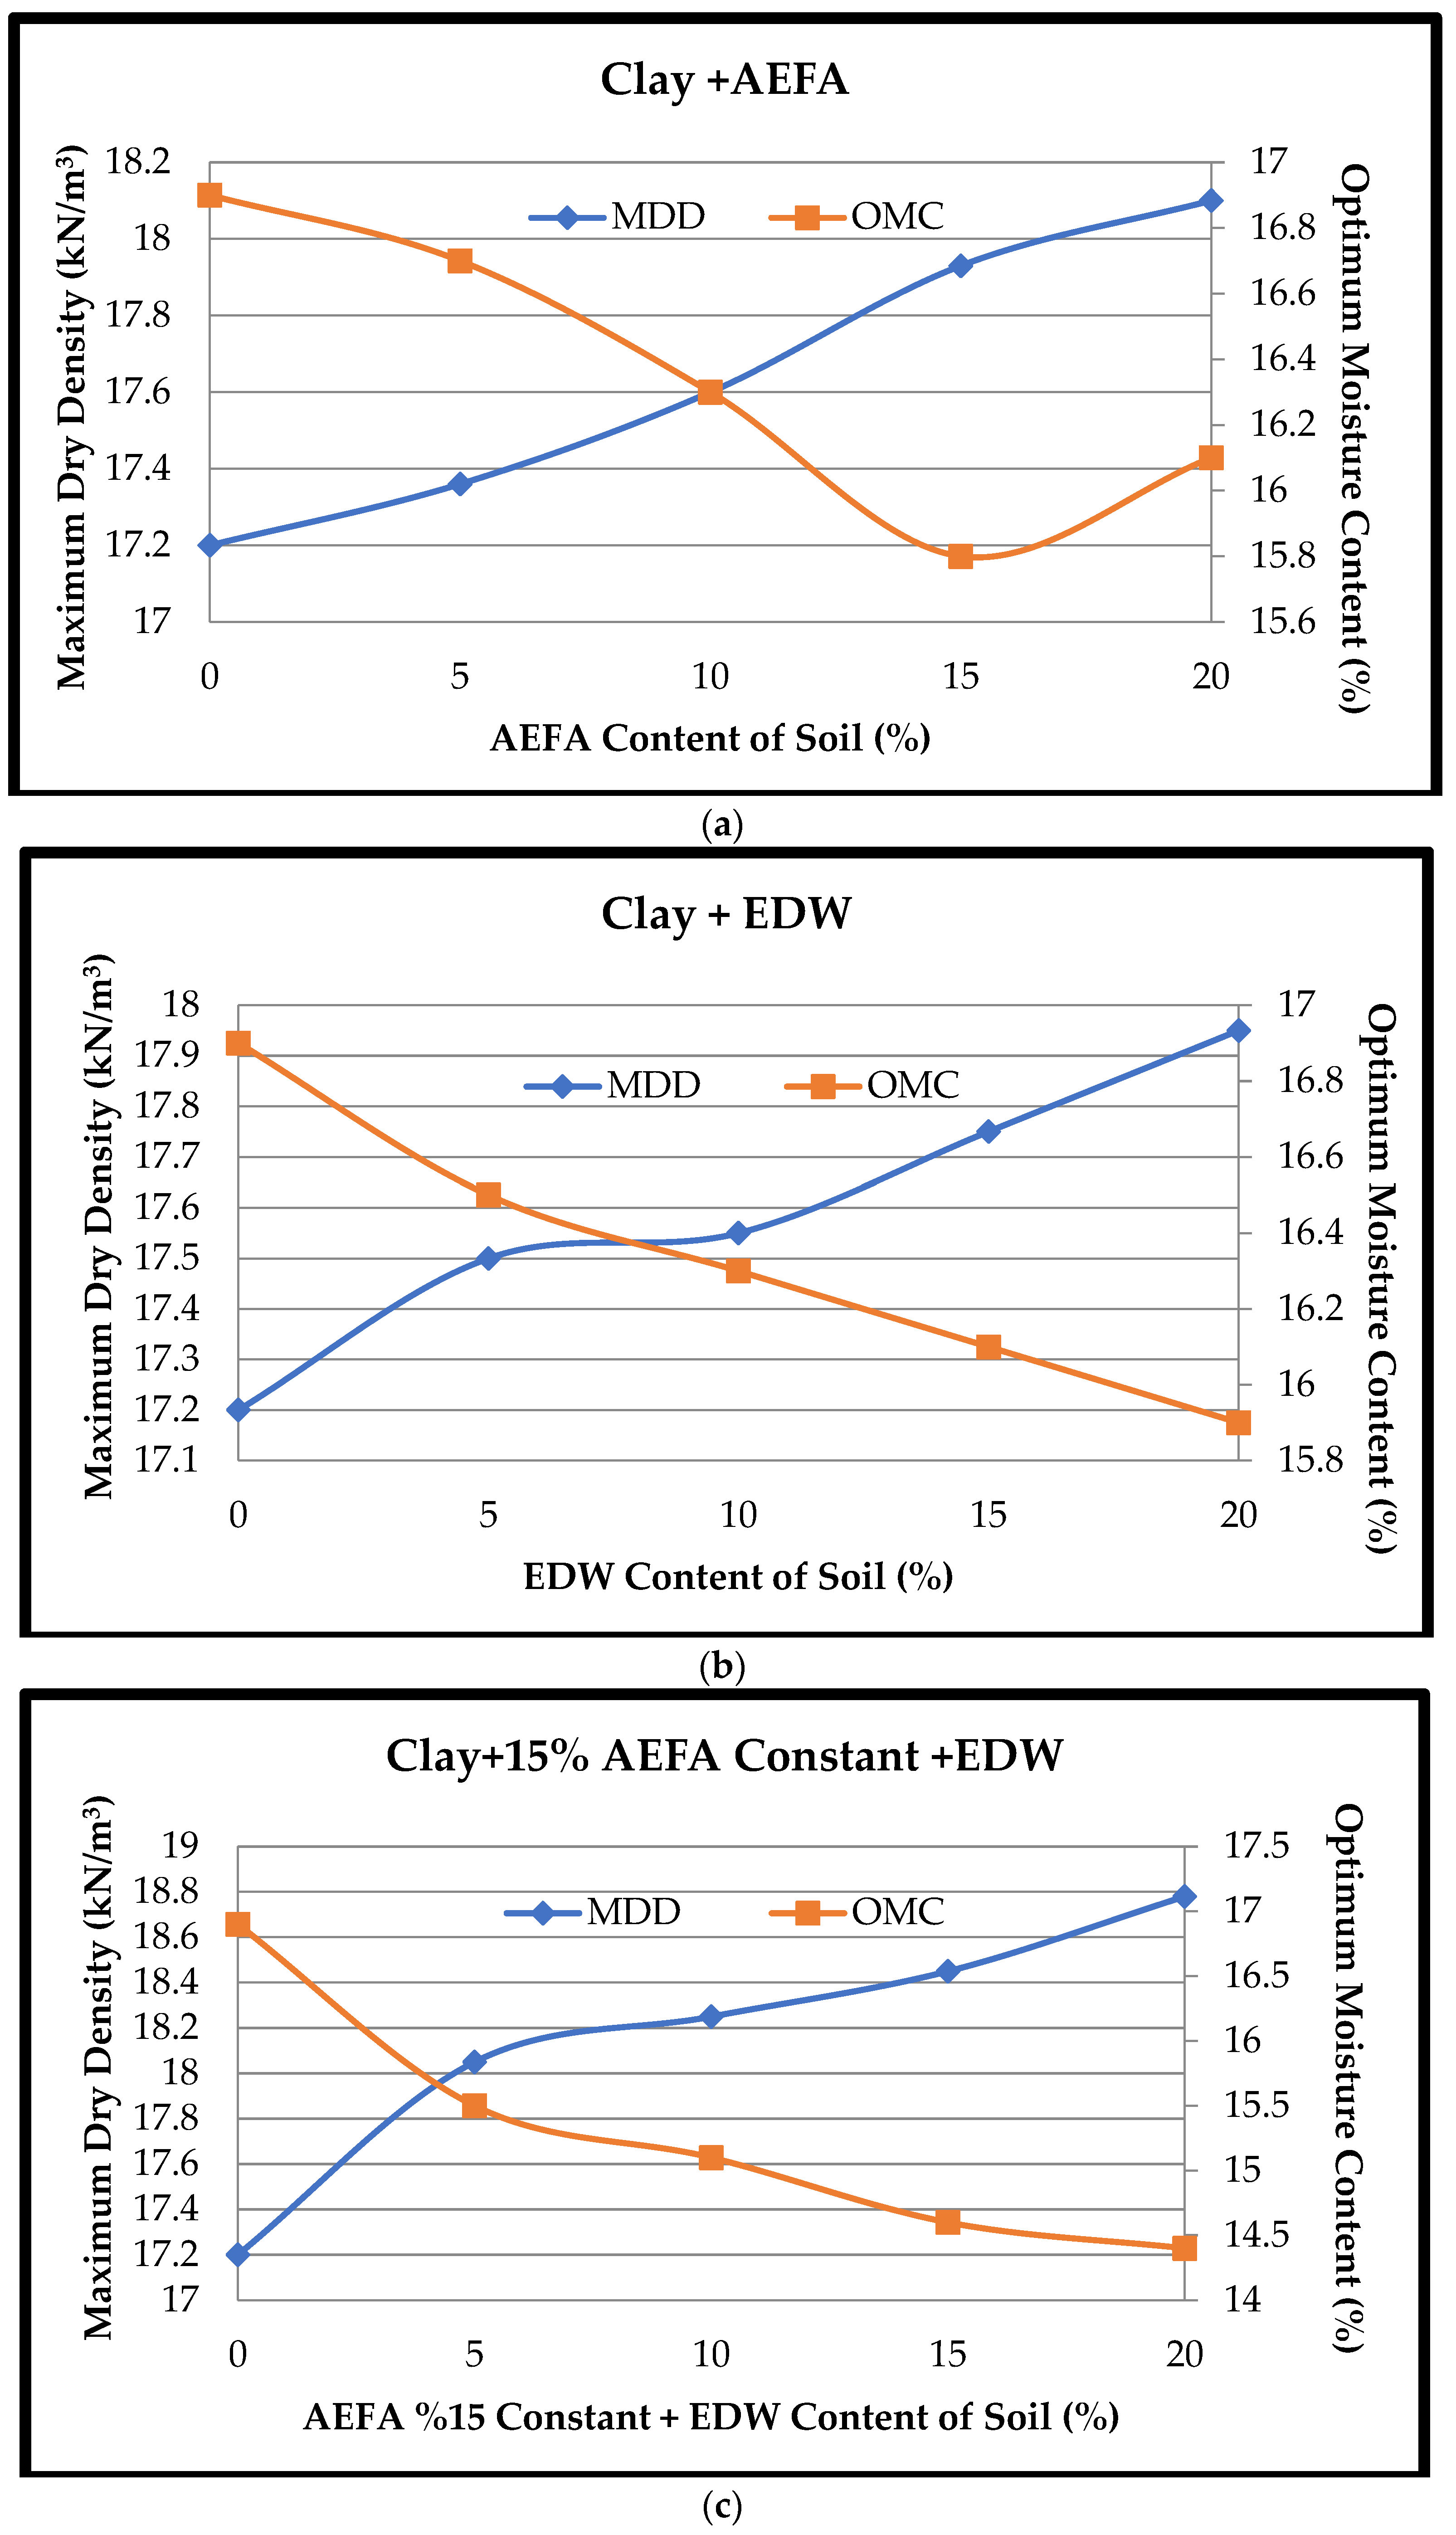
3.2. Compaction Tests
The MDD and OMC of the natural clay sample and mixtures prepared at the specified ratios were defined by a standard proctor test. As a result of the experiment, the OMC and MDD results of the natural clay sample were found to be 16.9% and 17.2 kN/m
3, respectively. According to the results of the binary mixture of clay and AEFA standard proctor test, the MDD values were found to be 17.36, 17.6, 17.93, and 18.1 kN/m
3, respectively. The OMC values were found to be 16.7%, 16.3%, 15.8% and 16.1%. The MDD values of the binary mixtures of clay and EDW were found to be 17.5, 17.55, 17.75, and 17.95 kN/m
3, respectively. The OMC values were found to be 16.5%, 16.5%, 16.3%, 16.1%, and 15.9%, respectively. The MDD values of the ternary mixtures of clay, AEFA, and EDW were found to be 18.05, 18.25, 18.45, and 18.78 kN/m
3, respectively. The OMC values were found to be 15.5%, 15.1%, 14.6%, and 14.4%, respectively. The results of the EDW and AEFA mixtures are shown in
Figure 5.
3.3. Uniaxial Compressive Strength (UCS) Tests
The compressive strength of the natural clay sample was 184 kPa for 7 days’ curing and 215 kPa for 28 days’ curing. The 7-day UCS results of clay + AEFA and clay + EDW in binary mixtures were 205, 230, 260, and 280 kPa for mixtures with AEFA addition and 372, 512, 595, and 648 kPa for mixtures with EDW addition, respectively. The binary mixture clay + AEFA and clay + EDW 28-day UCS results were 215, 235, 280, and 305 kPa for mixtures with AEFA addition and 430, 545, 635, and 710 kPa for mixtures with EDW addition, respectively. The 7- and 28-day UCS results of clay + AEFA and EDW in the triple mixture were 755, 868, 1024, and 1166 kPa for 7 days and 800, 890, 1100, and 1250 for 28 days. Uniaxial Compressive Strength (UCS) test results are shown in
Figure 6 for 7- and 28-day curing times.
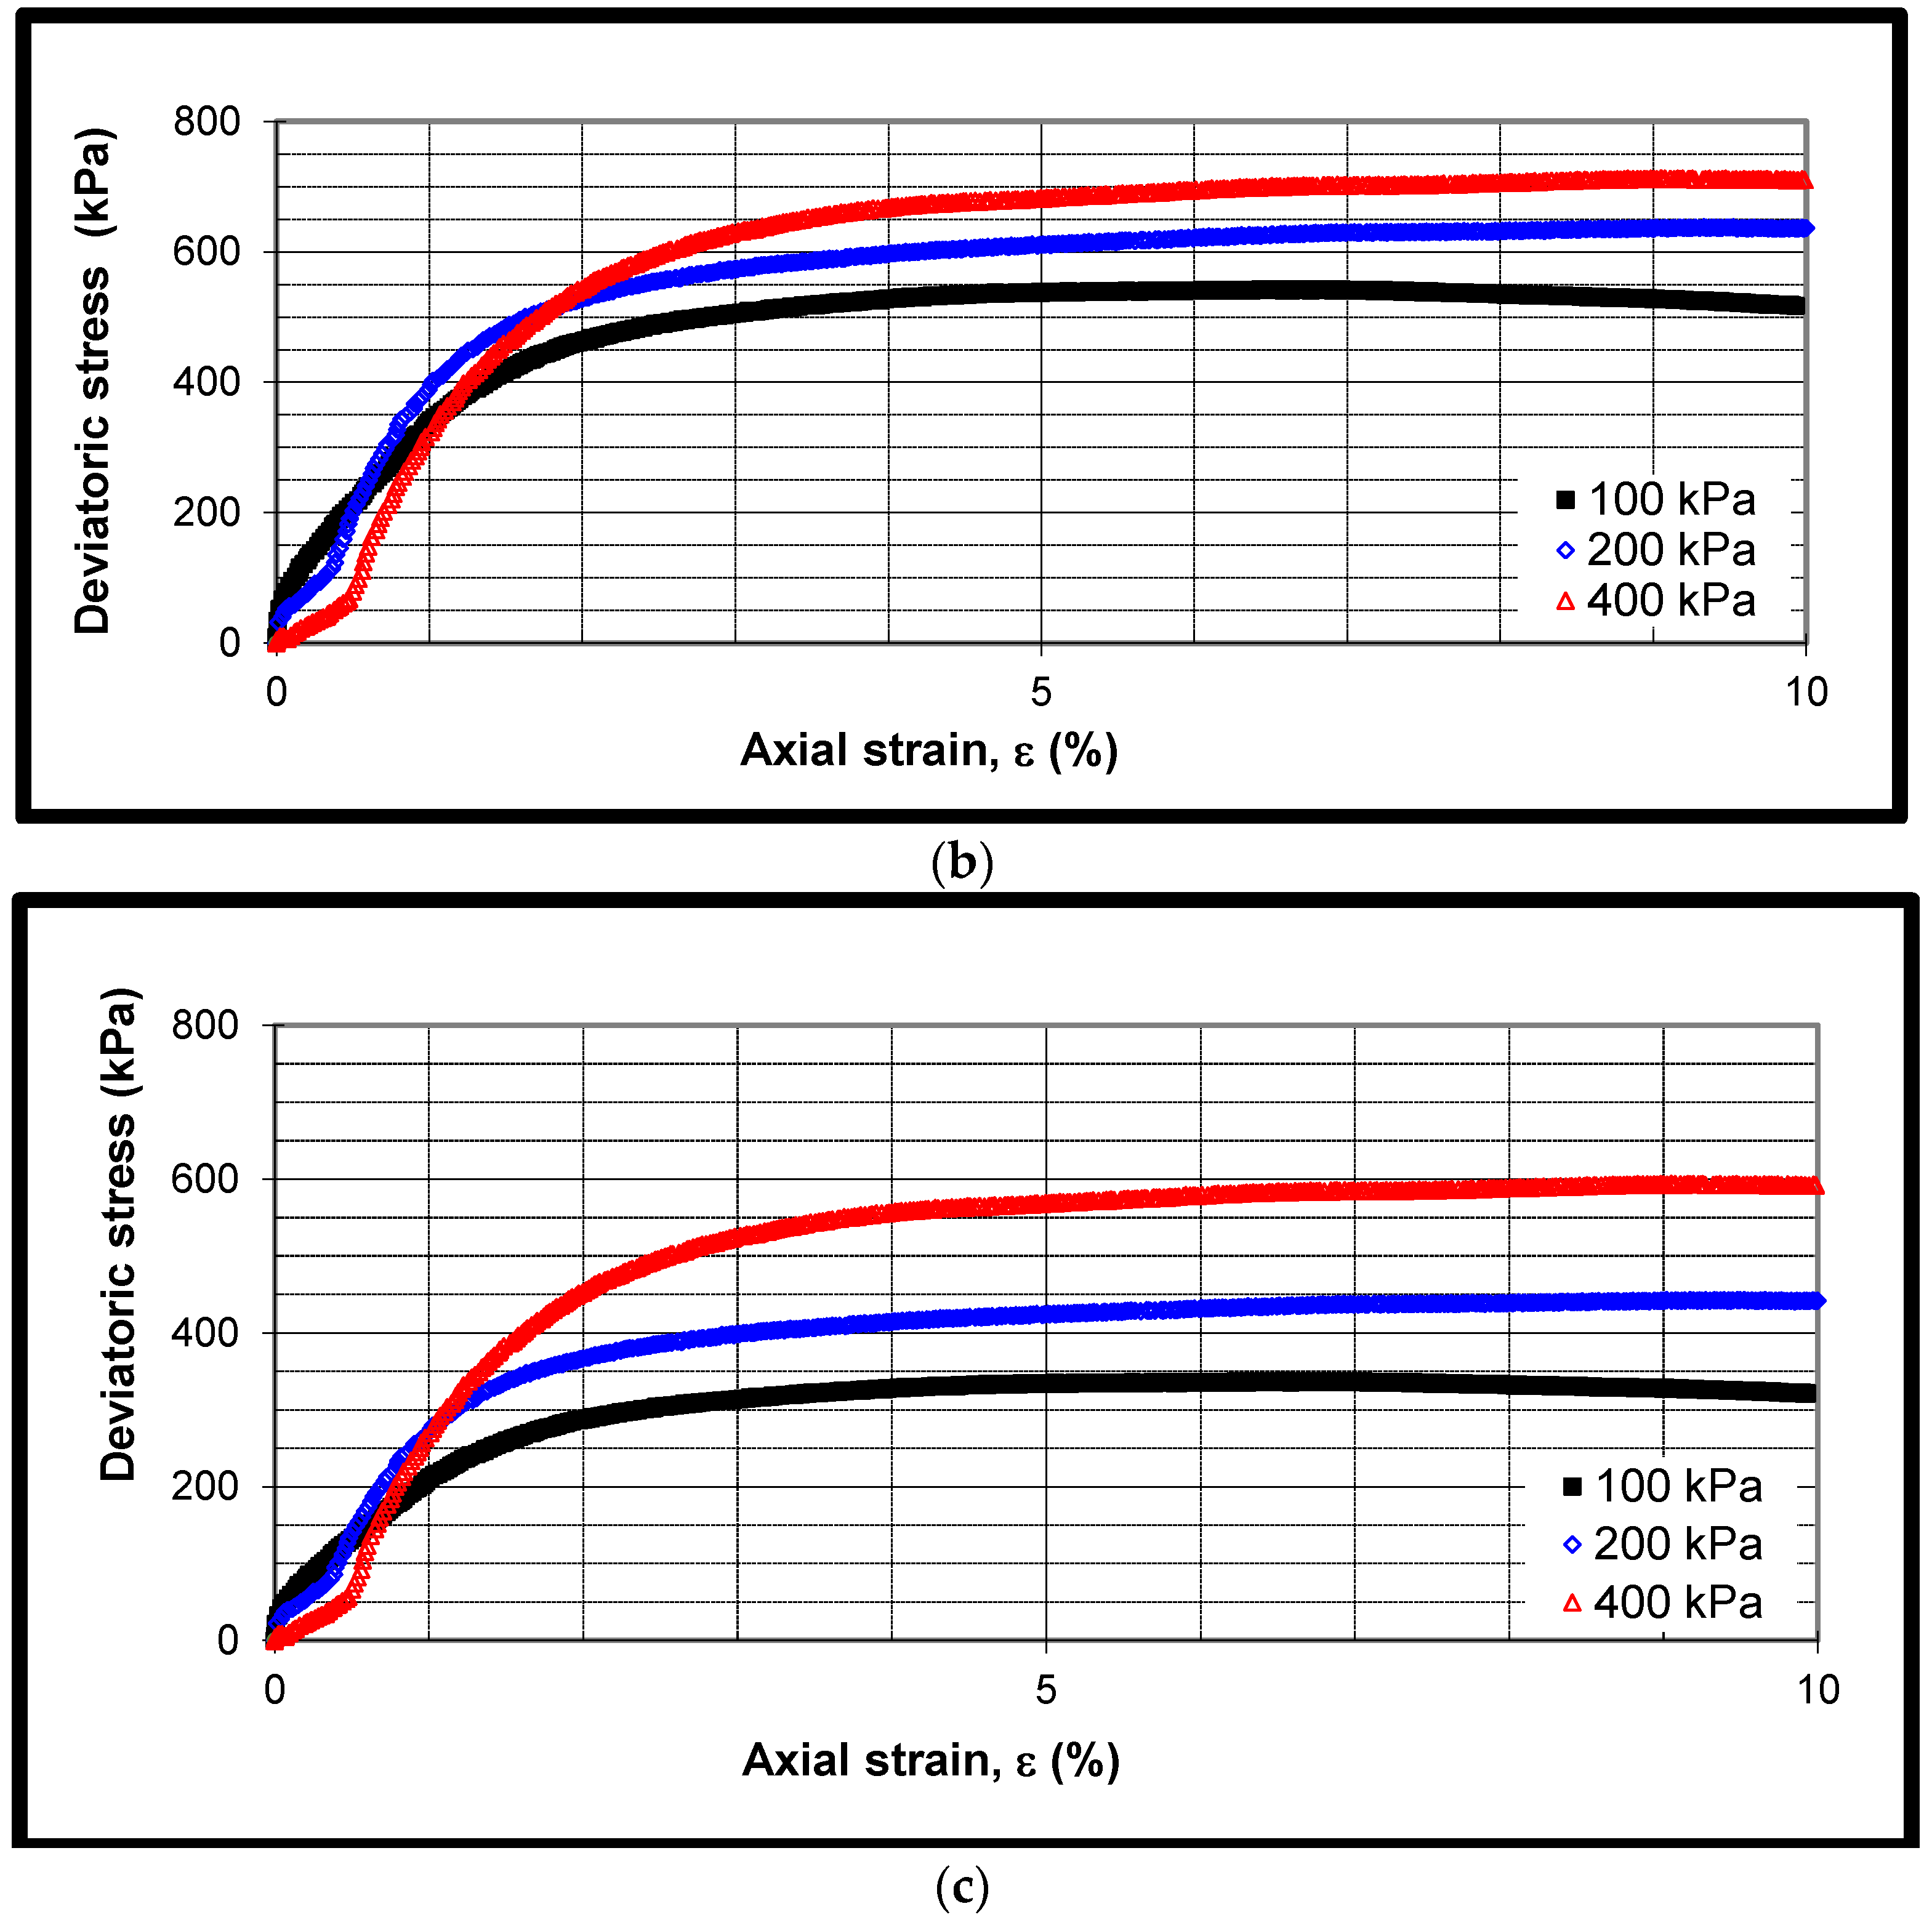
3.4. Triaxial Tests
The triaxial test provides valuable information about the shear strength (cohesion (c) and internal friction angle (ϕ)), stress-strain behavior, and deformation characteristics of soils [
30].
Figure 7a–c demonstrate the deviator stress–axial strain (ε
a) behavior of the clay sample and the soil samples stabilized with 20% AEFA and 15% AEFA + 20% EDW, cured for 28 days, at 100 kPa, 200 kPa, and 400 kPa confining pressure (σ
c).
The Mohr–Coulomb failure criterion is found by the shear strength parameters of the soil. The Morh circle is drawn with three different confining pressures for control and stabilized soil samples.
Figure 8 demonstrates the Mohr circles drawn for the clay, 20% AEFA, and clay + 15% AEFA + 20% EDW samples.
The values of the cohesion (c) and internal friction angle (ϕ) are shown in
Table 5 for the clay sample and the samples of soil stabilized with EDW and AEFA at 28 days of curing.
3.5. California Bearing Ratio (CBR) Tests
The CBR test was implemented on unsoaked specimens and soaked specimens. The results of the experiment are shown in
Table 6. When the results on the natural soil sample were examined, it was found to be 2% for the soaked specimen and 5% for the unsoaked specimen. The highest CBR test result was found in the 15% FA + 20% EDW mixture, at 20.1% in the unsoaked specimen.


