Article

Green Firms, Environmental Hazards, and Investment

by
Tommaso Oliviero
1,
Sandro Rondinella
2 and
Alberto Zazzaro
1,*
1
The Money and Finance Research Group (MoFiR), Centre for Studies in Economics and Finance (CSEF), University of Naples Federico II, 80126 Napoli, Italy
2
Department of Economics and Statistics, University of Naples Federico II, 80126 Napoli, Italy
*
Author to whom correspondence should be addressed.
Sustainability 2024, 16(2), 542; https://doi.org/10.3390/su16020542
Submission received: 19 November 2023 / Revised: 15 December 2023 / Accepted: 26 December 2023 / Published: 8 January 2024

Abstract

:
In this work, we analyze the relation between environmental risks and firms’ investments, and whether this relationship is different for green firms. We merge balance sheet and patenting activity data on Italian firms in manufacturing sectors during the period 2010–2019 with information on environmental risk at the municipality level. We show that investments in capital assets are smaller on average for firms operating in municipalities with higher levels of environmental risk, particularly when the risk is hydrogeological or seismic in nature. This negative impact is significantly lower if firms operate in green sectors. This finding was reinforced after the ratification of the Paris Agreement and the consequent increased awareness of firms, investors, and policymakers about the importance of environmental risks and the ongoing ecological transition process.

1. Introduction

The frequency and severity of extreme climate events have drawn increasing attention to their extensive impacts on ecosystems, humans, infrastructures and, ultimately, the economic activity [1]. When it comes to businesses, natural disasters can physically damage human and non-human factors of production [2,3,4,5]. However, the expected effects of these extreme events on production, investment, and productivity at both the micro and aggregate levels are uncertain. While natural disasters cause destruction, the need for corrective and preventive actions in the face of larger risks can prompt companies to increase investments and modernize facilities, leading to positive outcomes for company performance [6,7,8,9,10,11]. Therefore, the likelihood of a natural disaster can influence the investment policies of companies in different ways. On the one hand, it can lead firms to increase investments to cope with possible adverse events. On the other hand, higher environmental risks can discourage firms from investing in fixed capital investment and may push them towards less capital-intensive technologies.
Apart from the risk of damage to physical capital and labor, environmental risk also encompasses transition risk, which pertains to changes in policies, technologies, and consumer preferences in response to the shift toward a low-carbon economy that may generate economic losses for firms [12]. Over the past few decades, various studies have delved into the concept of resilience. Resilience might involve maintaining output close to its potential [13,14], preserving an entity’s functions [15], or adapting a company’s structure to sustain an acceptable growth path for production following a major shock [16,17]. Therefore, a crucial issue revolves not only around the scale of actual and future disasters and their impacts on businesses activity but, more importantly, around the specific attributes of firms that can enhance their resilience, enabling them to respond effectively and prepare for future shocks [18]. Among the factors that can bolster a firm’s ability to respond to environmental risks are investment strategies [6,19,20,21], operational efficiency [22], measures to prevent damages [11,17,23], and the optimal combination of production factors and types of technology [24,25,26].
In this study, we explore to what extent environmental risk affects firms’ investments and whether the response to such risk differs between firms operating in brown sectors compared to those in greener sectors, where technologies that can swiftly adapt to climate change are more widespread. Indeed, the innovative sector is expected to become more motivated to develop new and more cost-effective technical solutions and technologies for mitigating future disaster risks [27].
We consider a large panel of Italian manufacturing firms spanning from 2010 to 2019 and merge it with the information on the environmental risk of each Italian municipality provided by the Italian Institute of Statistics (ISTAT). We also use the International Patent Classification (IPC) codes specified by the Organization of Economic Cooperation and Development (OECD) and the World Intellectual Property Organization (WIPO) to measure the greenness of each industrial sector.
Our findings indicate that firms invest, on average, less when operating in areas with higher environmental risk. However, this pattern is less pronounced for firms in greener sectors and becomes positive when the degree of sectoral greenness is above the 62nd or 82nd percentile, according to the methodology used to determine the industrial sectors each green patent refers to. Stated differently, green firms show higher levels of investment when there is an increasing level of natural hazard in the area.
In the last part of the paper, we test if the findings are more pronounced after an increase in investor awareness about the importance of environmental risk. Following the literature e.g., [28] we use the time variation induced by the Paris Agreement in 2015. After splitting our sample into before and after 2015, we find that the relationship between environmental risks and firms’ greenness on investments is economically and statistically more significant in the post-agreement period, confirming the importance of public awareness for the green transition of private companies.
The rest of the paper is organized as follows. In Section 2 we introduce our hypotheses and the measures of environmental risk and sectoral greenness. In Section 3 we describe the dataset employed in the econometric analysis and the empirical specification. In Section 4, we discuss the empirical results, while Section 5 presents the conclusion.

2. Environmental Risk and Greenness

2.1. Research Hypotheses

The adaptation of firms to environmental risk involves their response to the actual or anticipated effects of climate change, aiming to reduce climate-related risks and vulnerability by implementing strategies to mitigate those risks [29]. Natural disasters impact on firms’ investment expenditures in two ways: ecological resilience—which refers to a company’s ability to withstand stress—and the ability to adapt to a new environment [30]. Regarding ecological resilience, some researchers argue that different types of assets have varying levels of resilience in the face of disasters [6,31,32]. For example, Ref. [33] demonstrates that firms exposed to floods increase their investments in intangible research and development but reduce their spending on tangible capital. On the other hand, firms can increase investments in research and development (R&D) and innovations in order to increase their ability to adjust to a new environment [34,35,36,37]. Consistently, Ref. [18] finds that earthquakes have prompted the implementation of reconstruction strategies, leading to increased flexibility in production, the exploration of new markets, reduced environmental impacts, enhanced safety measures, and greater compliance with existing regulations. In a similar vein, Ref. [6] presents evidence of a positive correlation between the frequency of natural disasters and the accumulation of human capital, total factor productivity, and economic growth. They hypothesize that disasters can accelerate a ‘quasi-Schumpeterian’ process of creative destruction, particularly in the context of climate-related events such as flooding. Additionally, there is robust empirical evidence showing that natural disasters drive increased innovation in risk mitigation technologies in both manufacturing and agricultural industries [11,34,35,36,37,38,39]. Specifically, the “risk-mitigating innovation” refers to the development of new and more effective technologies that aid individuals in coping better with natural disasters and building resilience against future shocks.
Given the above discussion in the literature, we highlighted two competing predictions about the impact of environmental risk on firms’ investment: (i) an “investment-discouragement” effect, which assumes a negative impact of environmental risk; and (ii) an “investment-preparedness” effect, according to which the likelihood of experiencing natural disasters positively affects investments. Our first contribution was to provide an empirical assessment for the preeminence of one of the two hypotheses. To this end, we analyzed whether firms’ investment expenditures are negatively or positively affected by the environmental risks of the geographical area in which they are located. Second, we tested the hypothesis of a greater “environmental resilience of green technologies”; specifically, we examined whether the relationship between investment and environmental risk varies according to the degree of greenness of the firms’ sector of activity. Finally, we tested the “green awareness” hypothesis by examining whether the moderating effect of technology greenness on firms’ investment sensitivity to environmental risk increased following the Paris Agreement in 2015.

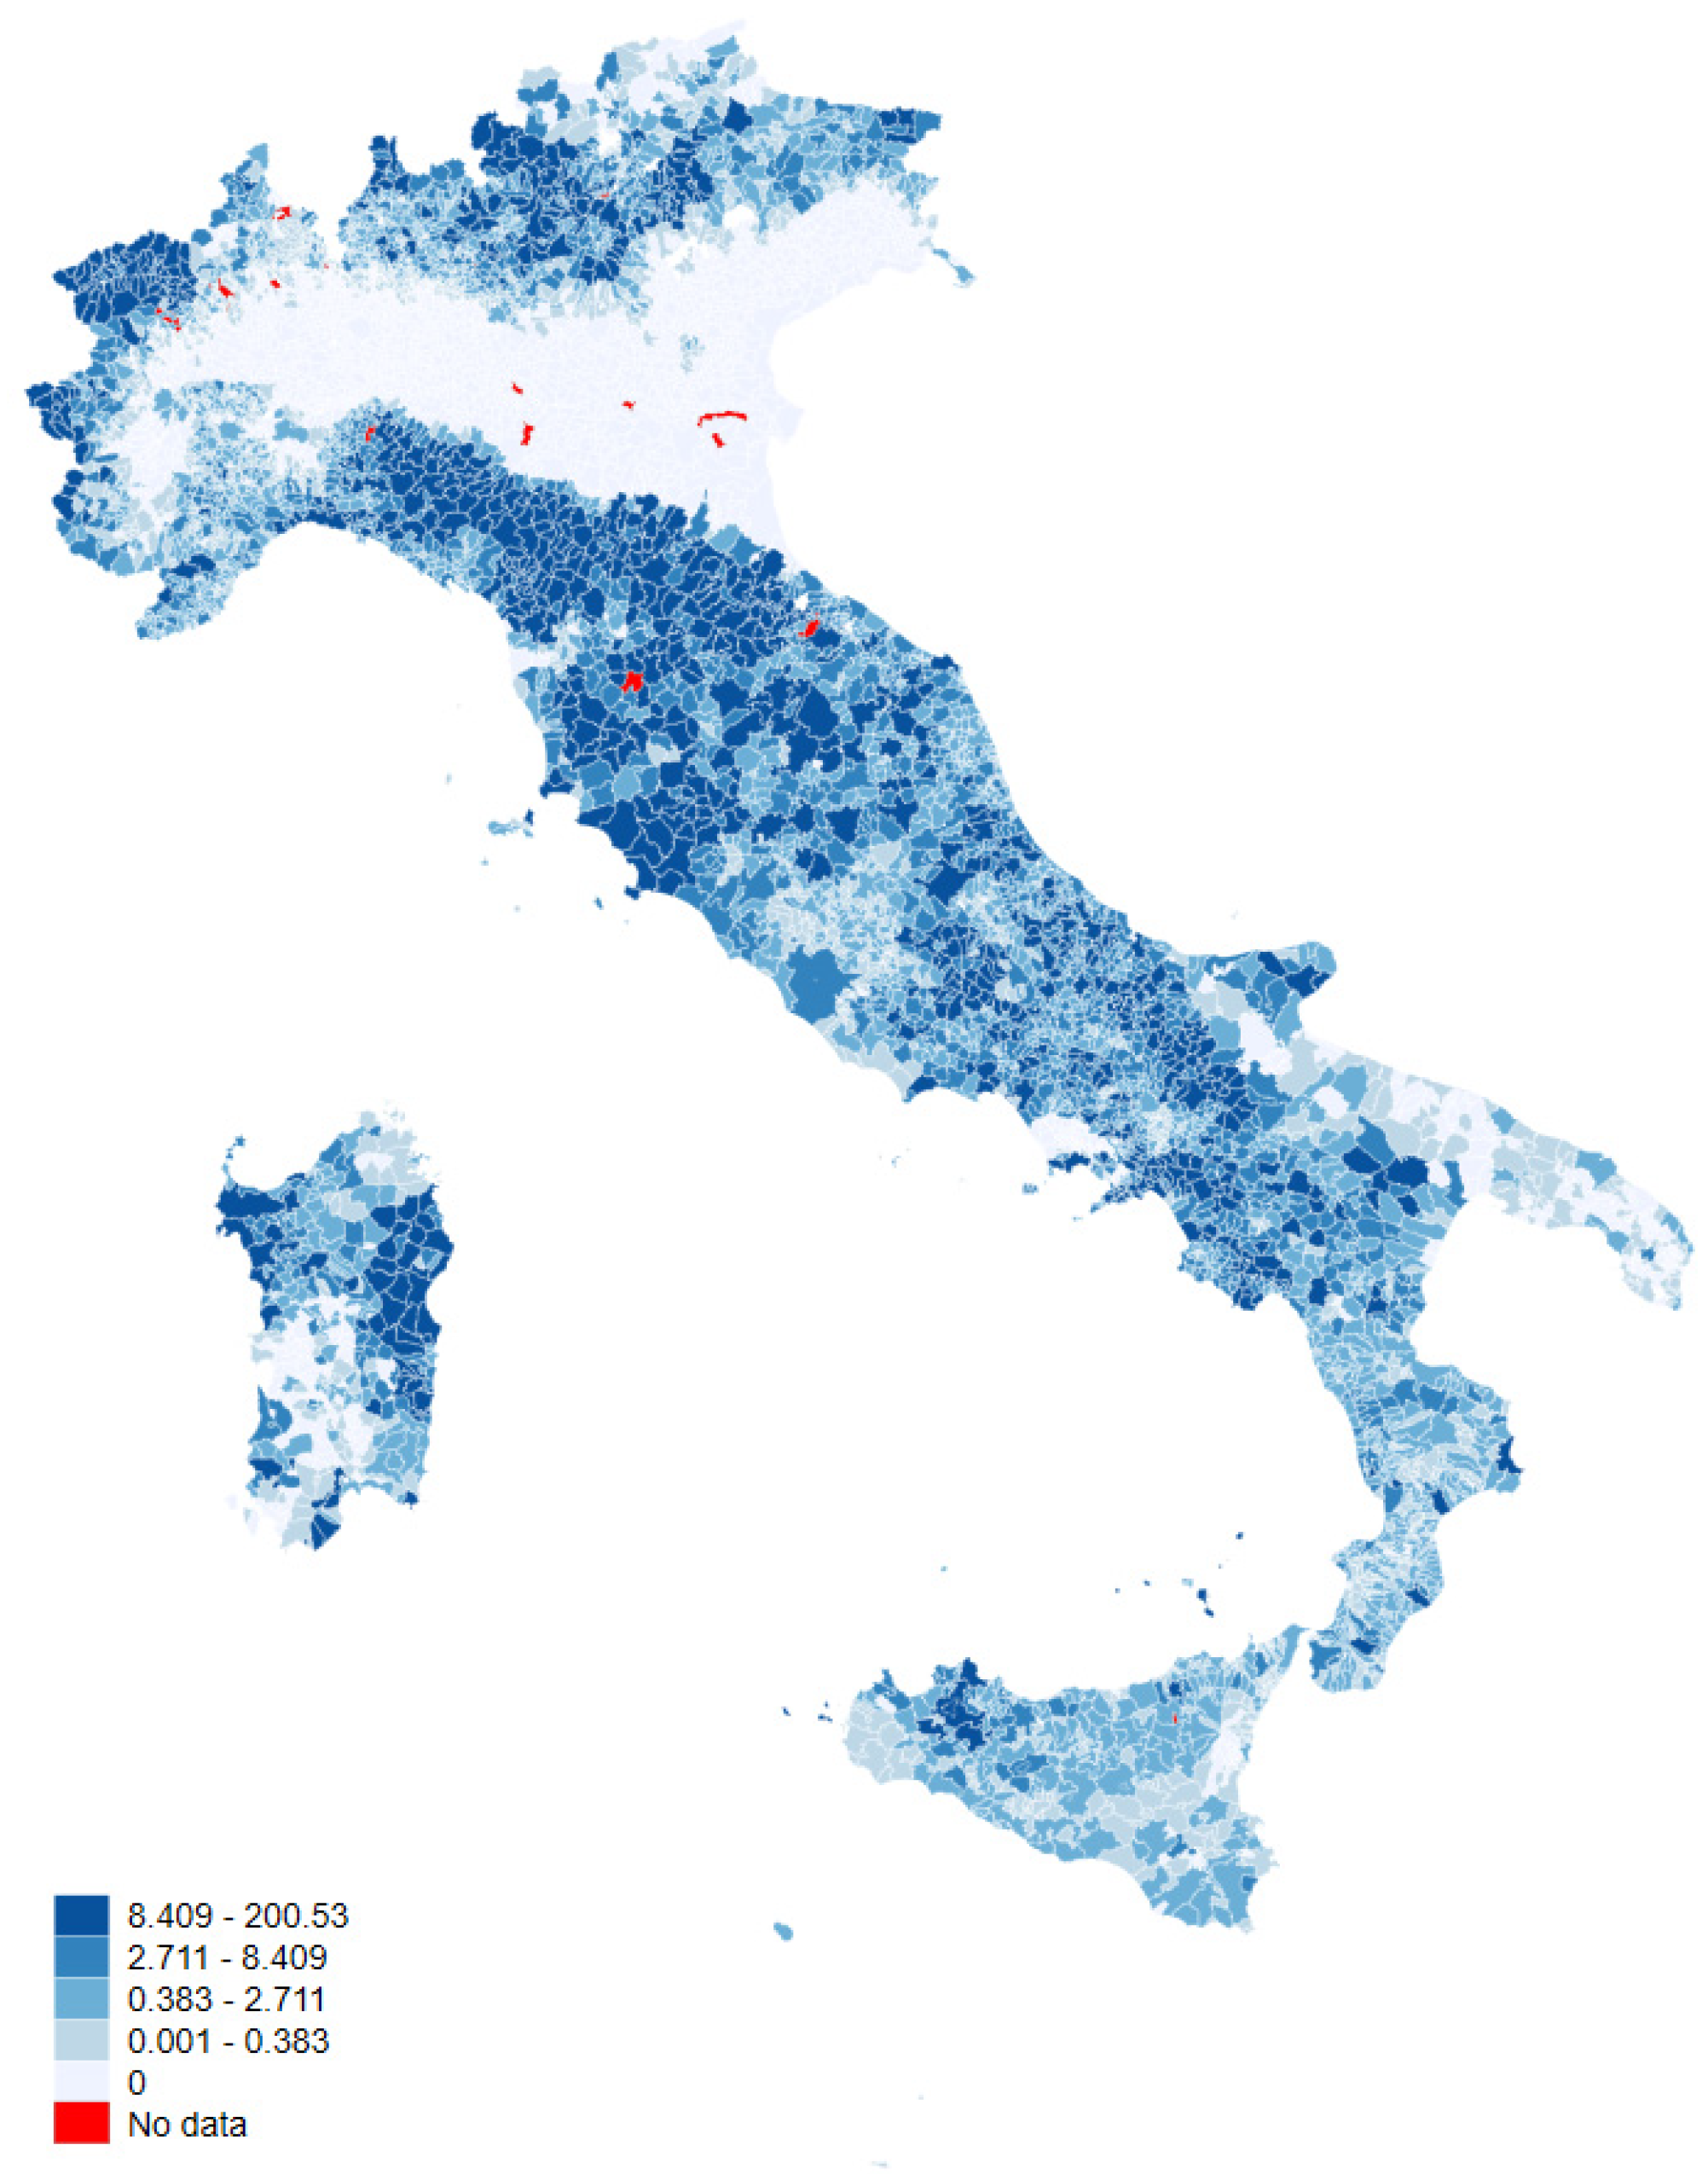
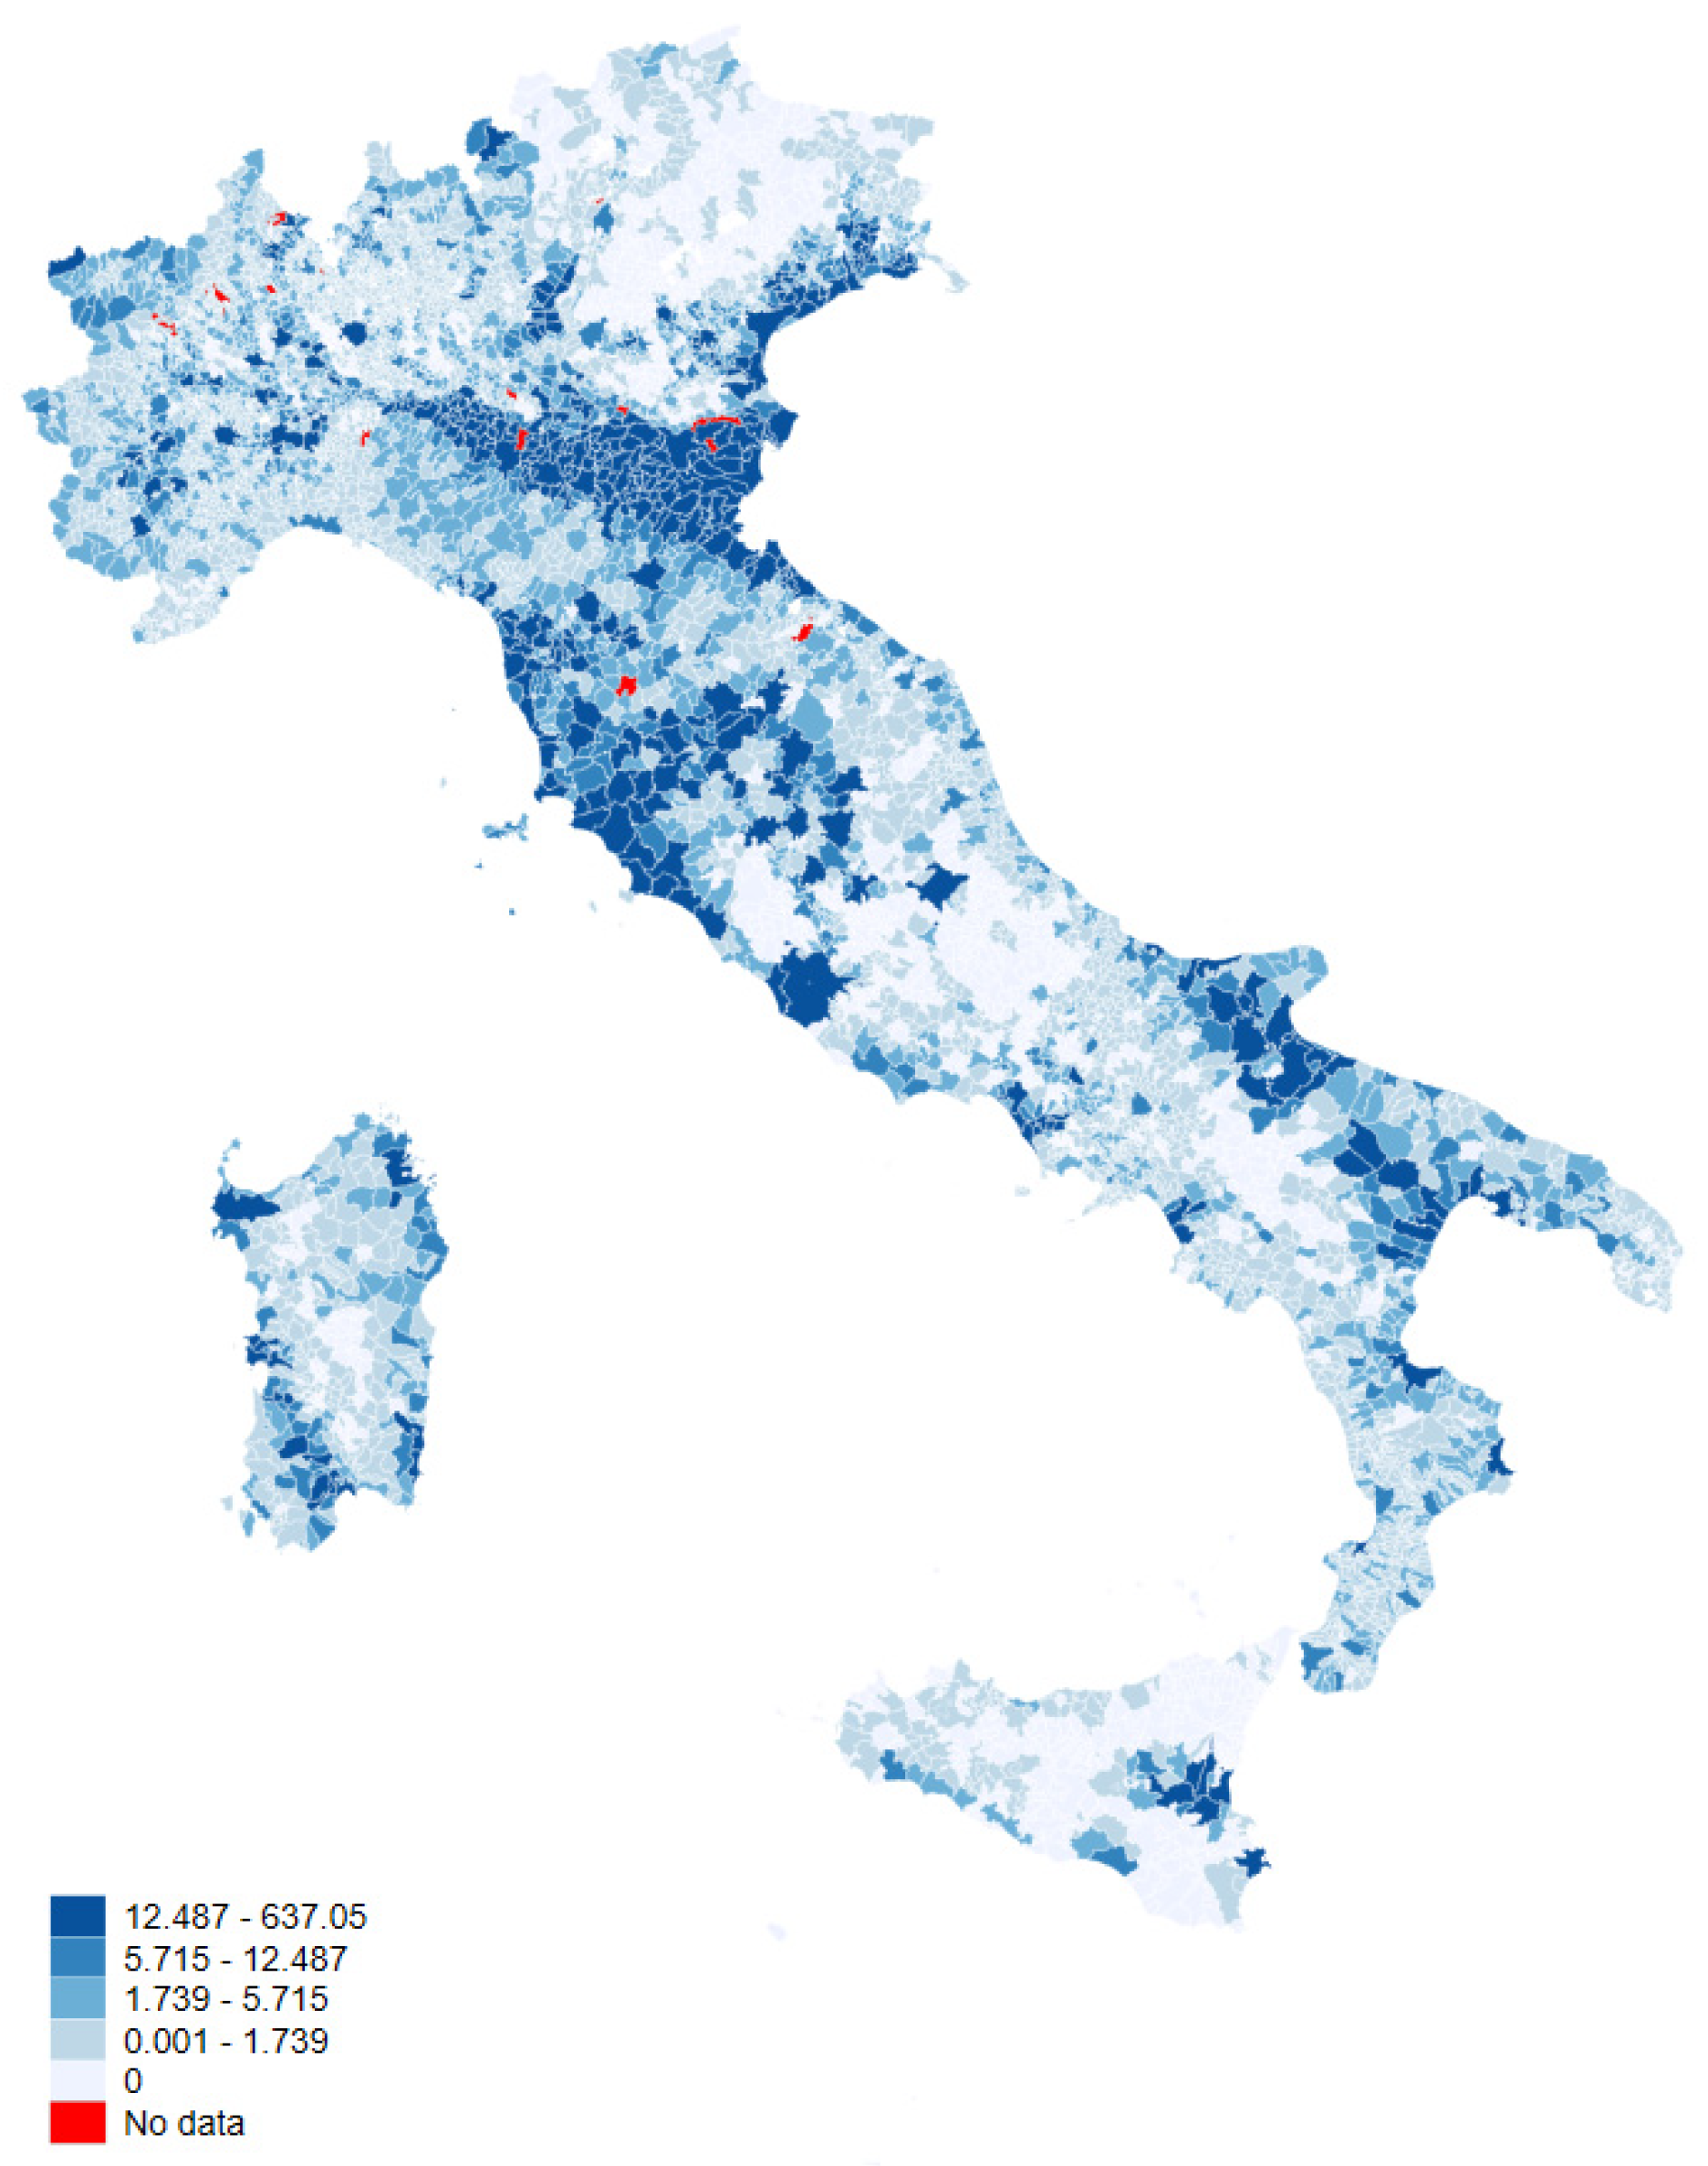
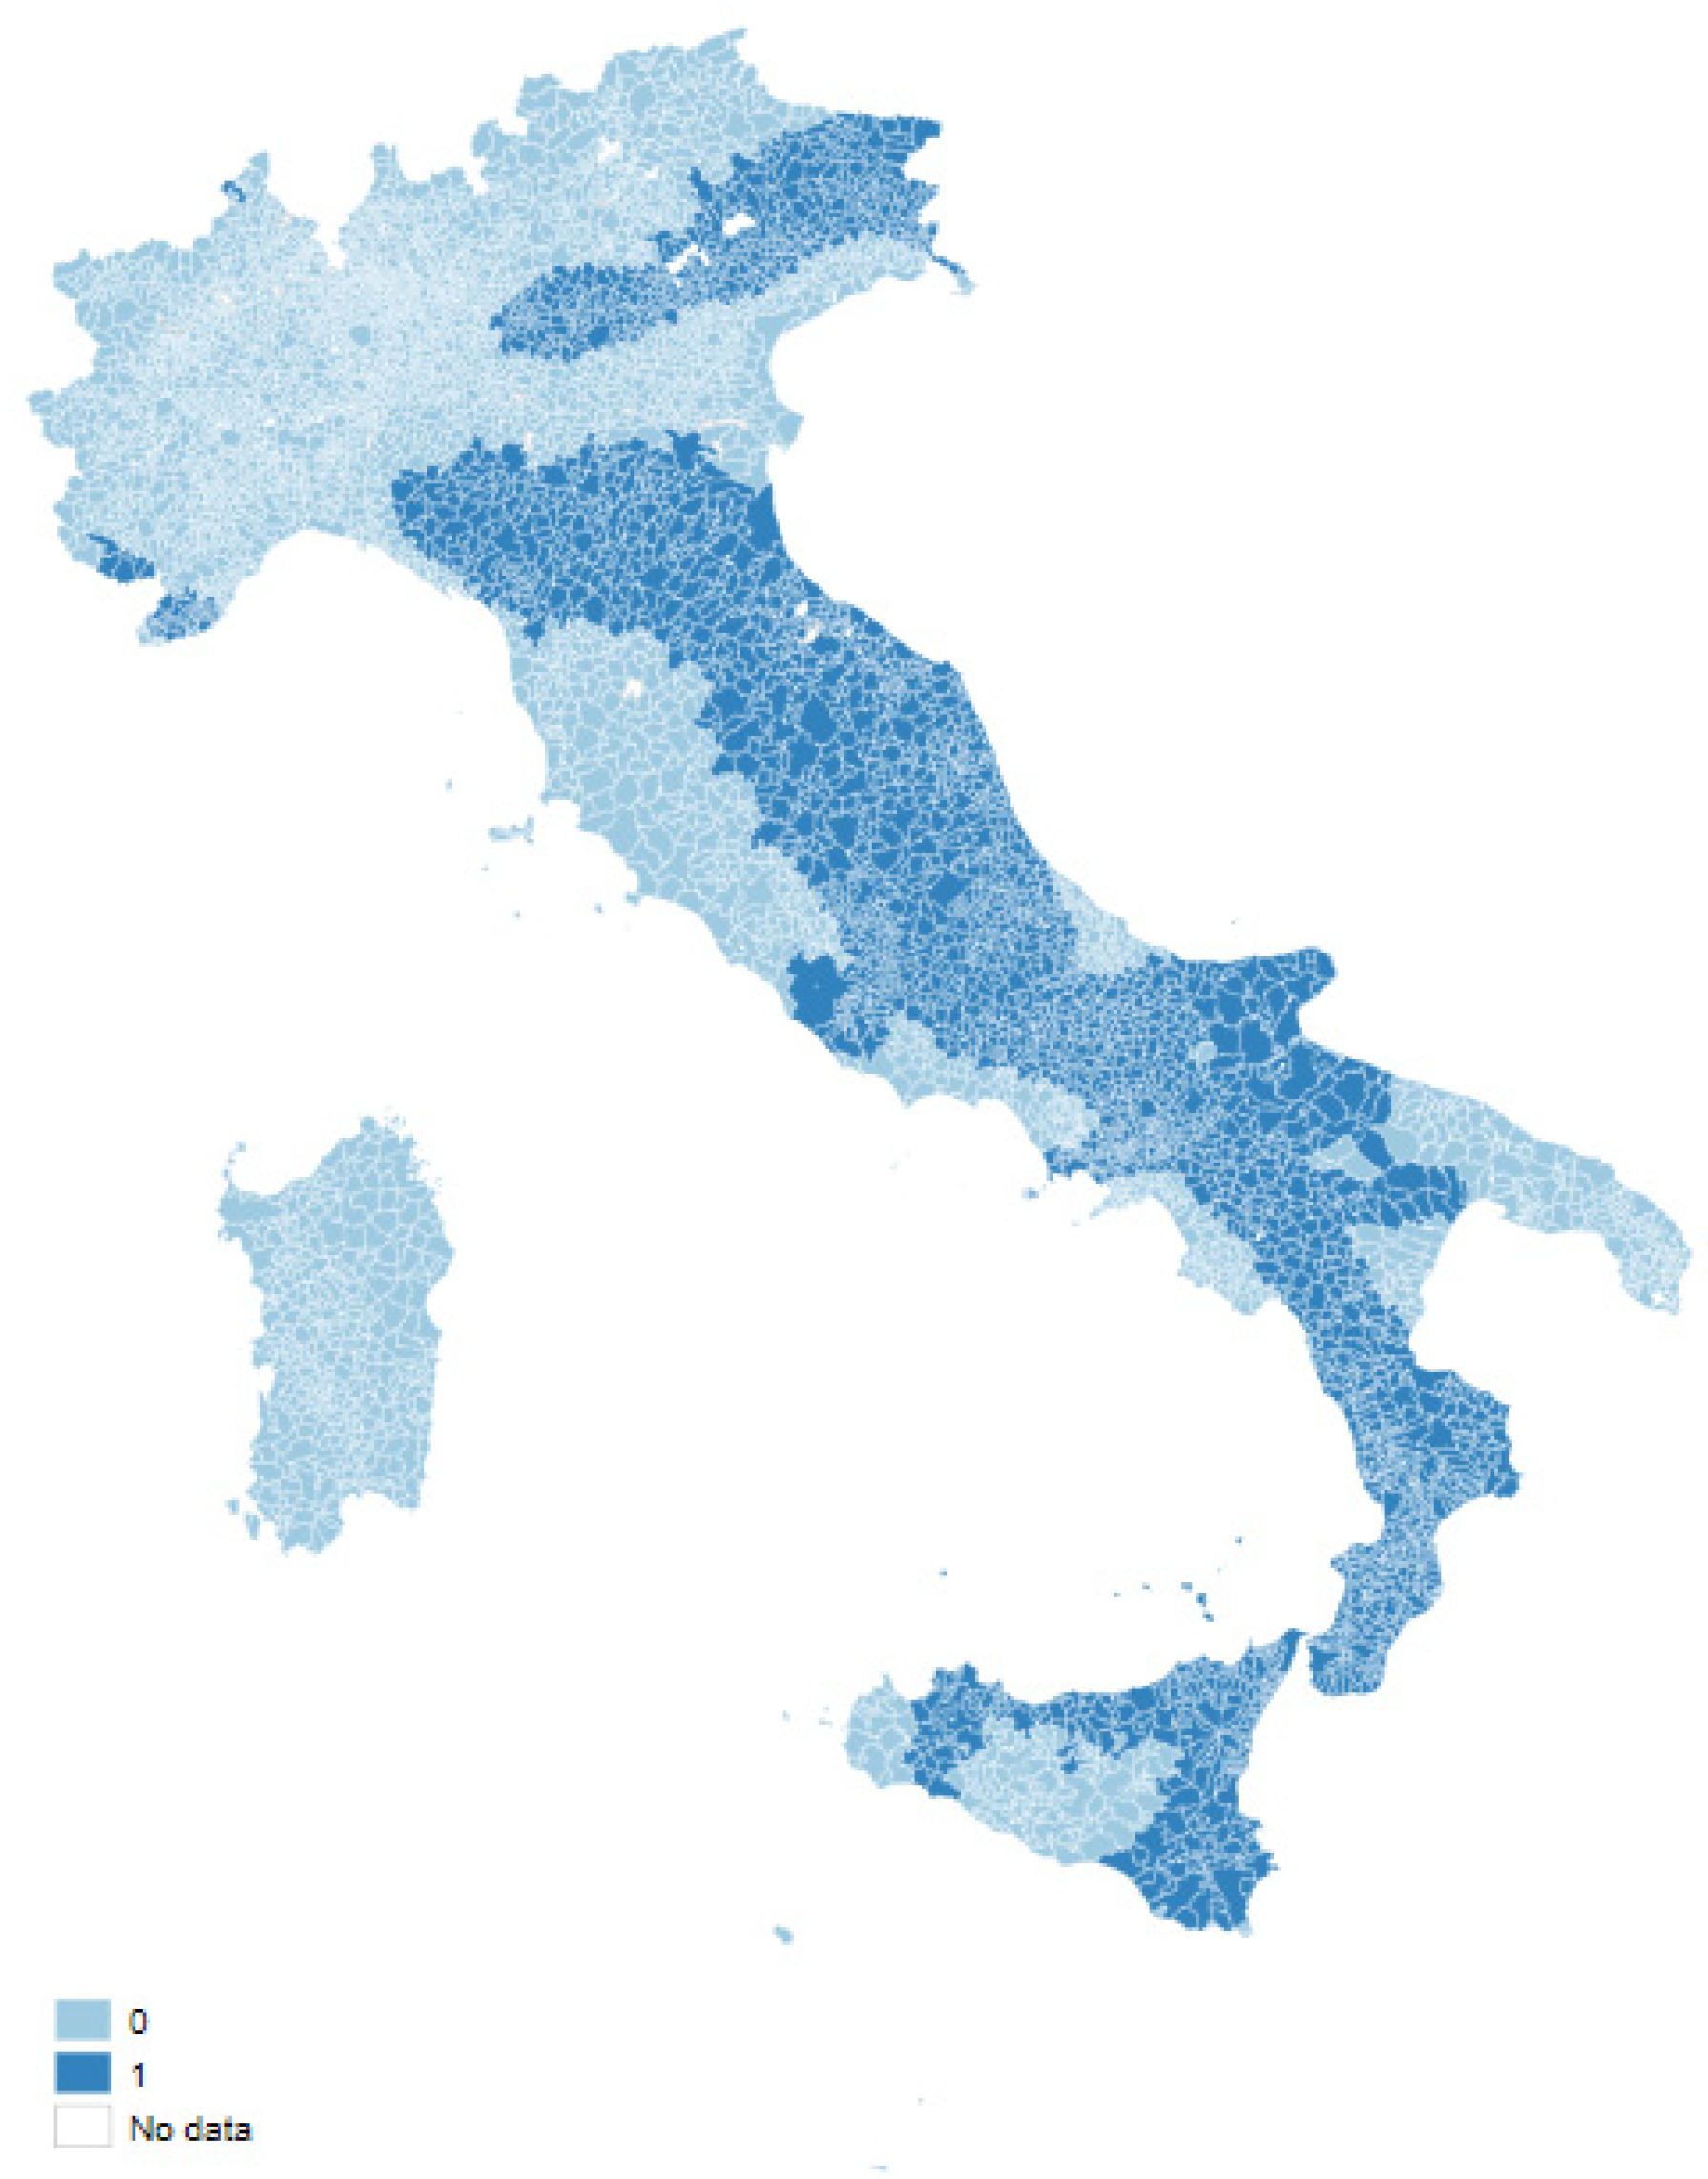
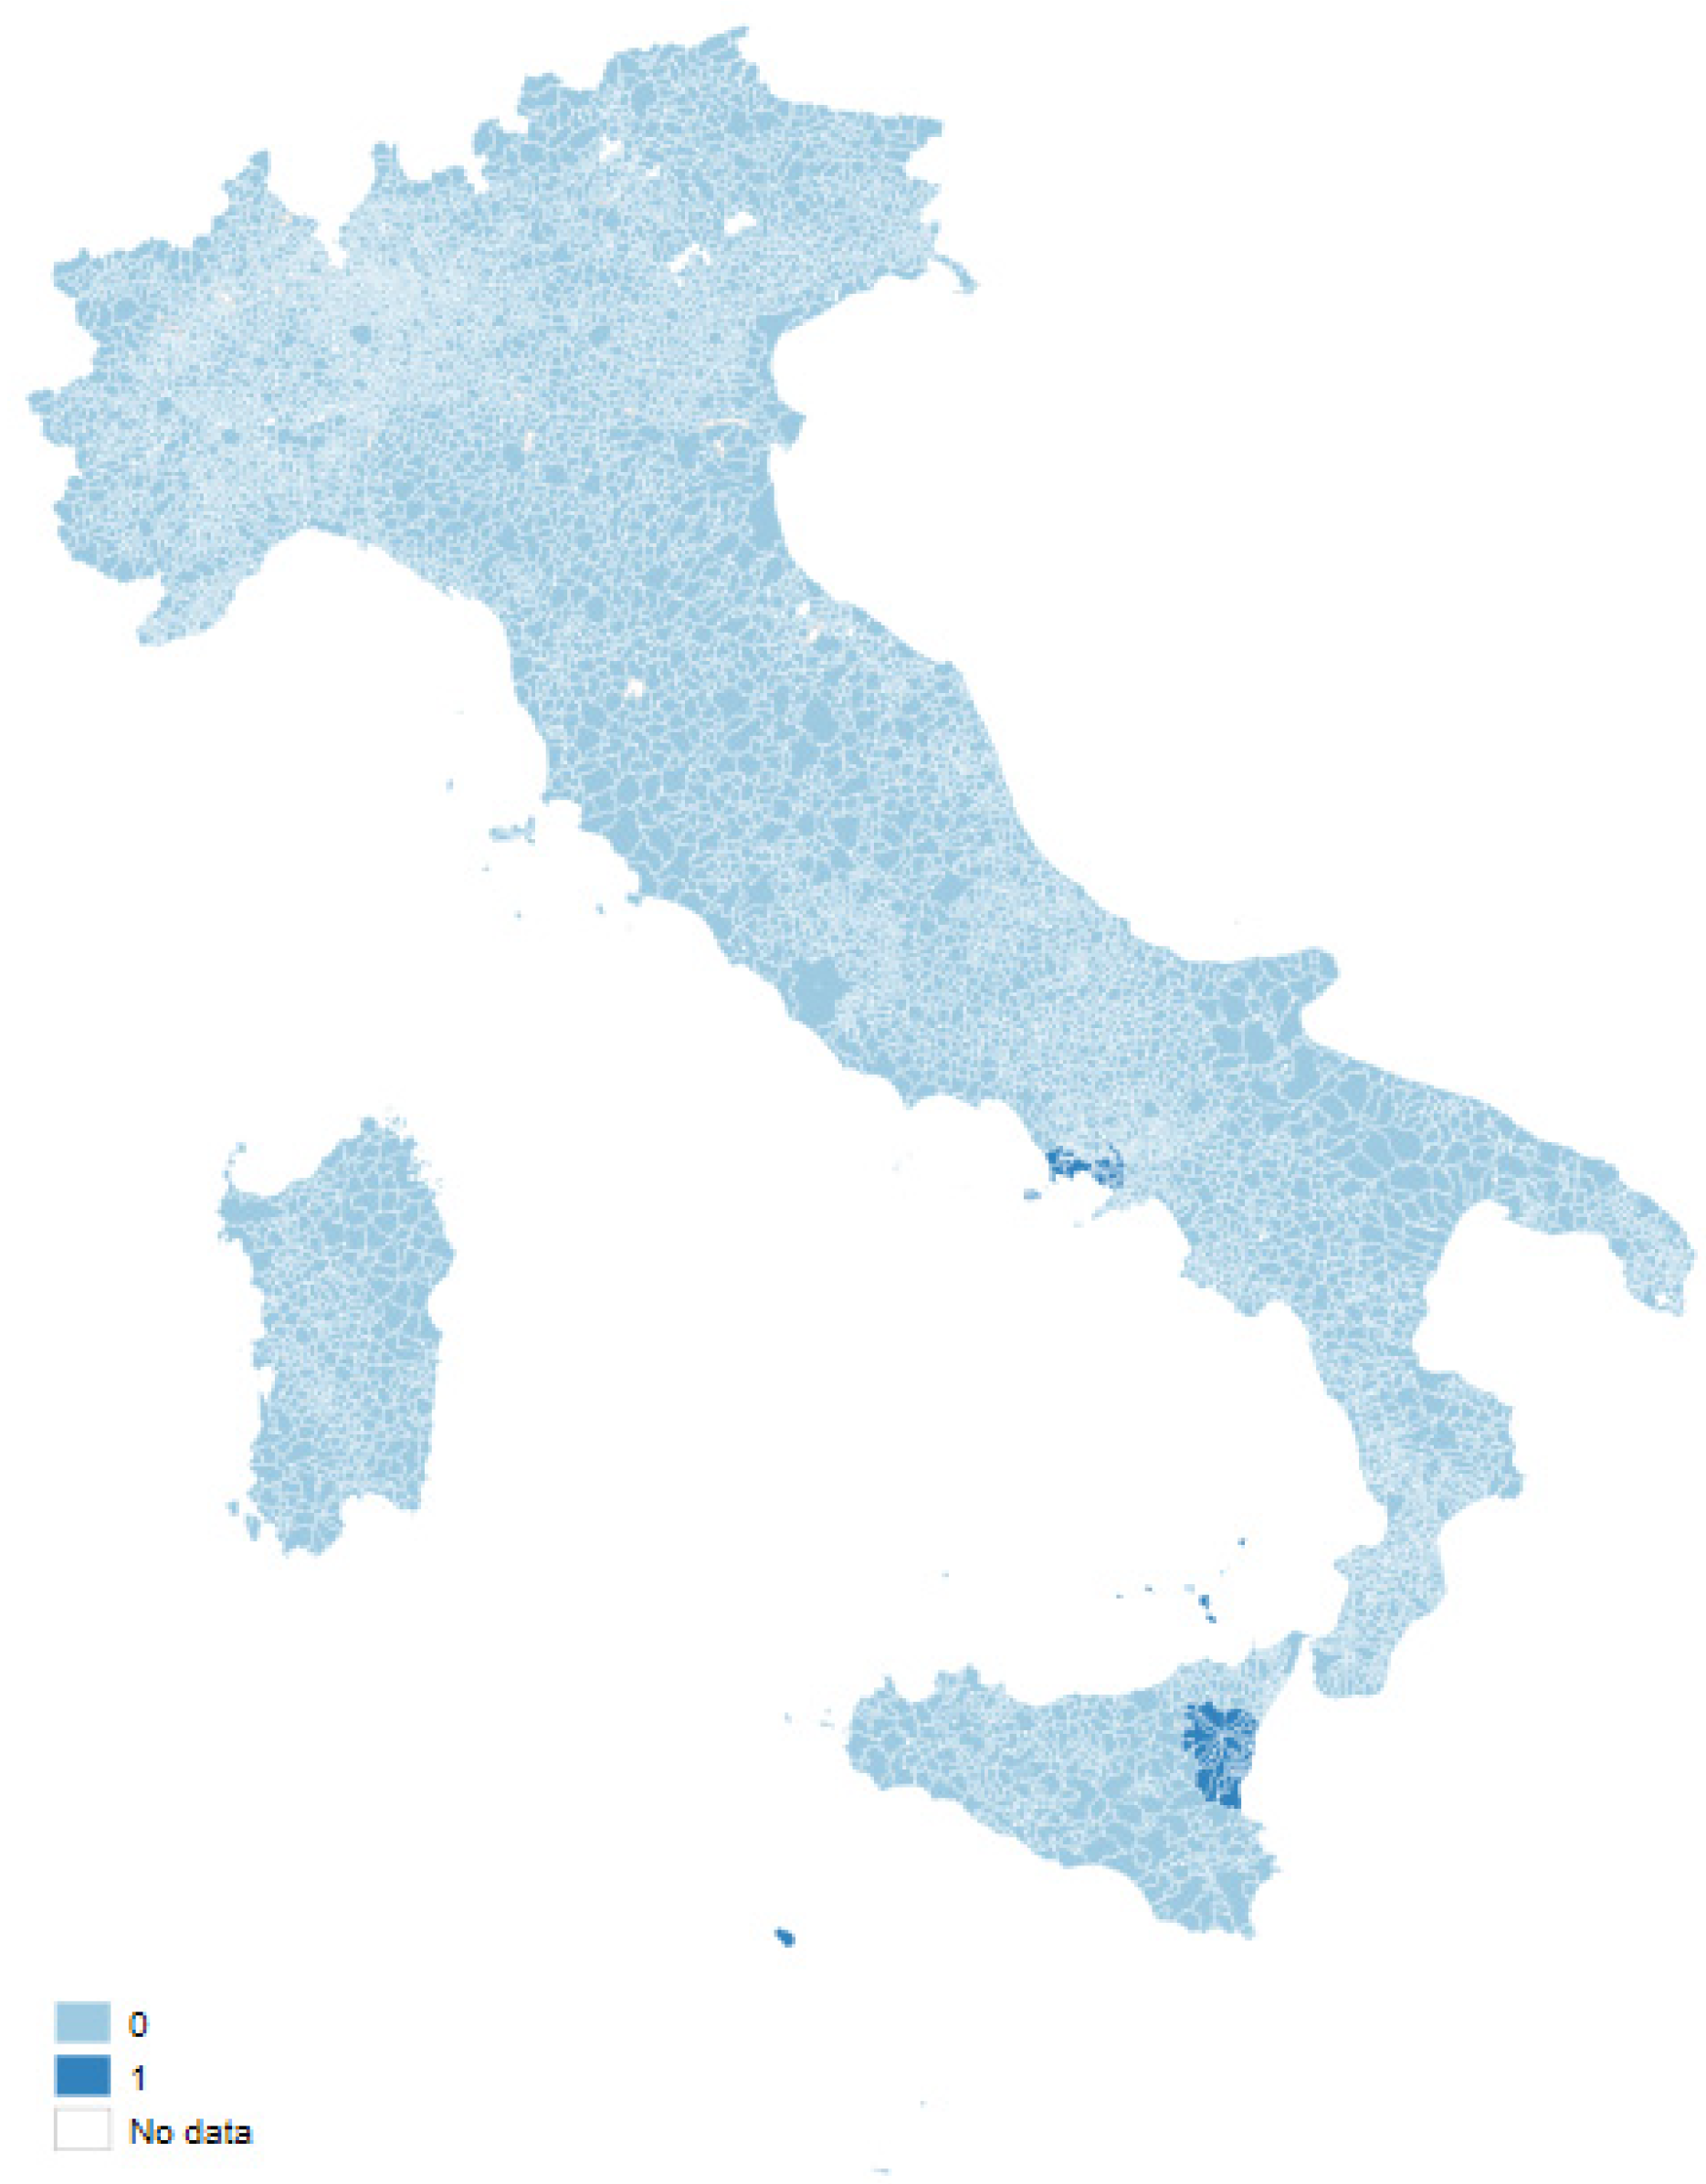
2.2. Local Environmental Risks

The Italian Institute of Statistics (ISTAT) publishes indicators relating to the environmental risk of exposure of Italian municipalities to natural disasters, distinguishing between seismic (EARTHQUAKE), landslide (LANDSLIDE), floods (HYDRAULIC) and volcanic (VOLCANIC) risks. As Table 1 illustrates, LANDSLIDE and HYDRAULIC hazards are measured by the municipality surface (km2) which is under risk, while EARTHQUAKE and VOLCANIC are measured by dummy variables. We proposed an aggregate variable of environmental risk at the municipality level which ranges from 0 to 4 (RISK), where a value equal to 4 indicates exposure to all four sources of risk, while 0 indicates an absence of exposure to any source of environmental risk. Specifically, in defining the variable RISK for the continuous variables, LANDSLIDE and HYDRAULIC, we construct dummy variables at the municipal level that take a value equal to one when their values are above their respective median. Summary statistics of these variables are reported in Table 1.
Figure 1 illustrates the geographical distribution of environmental risk in Italian territory. It shows that the municipalities most susceptible to natural disasters are situated in the central-north region of the country, the northern part of the south, and the Catania area in eastern Sicily.
When examining the landslide hazard, municipalities at elevated risk are found in the extreme north in the area of the Alps, in the center along the Apennines, and north of the Mezzogiorno, with some areas in Sardinia appearing to also be affected (Figure A1 in the Appendix A). The hydraulic hazard is widespread throughout the country, except for the northeastern part and the central region along the Apennines (Figure A2 in the Appendix A). Similarly, municipalities at a heightened risk of earthquakes (Figure A3 in the Appendix A) are concentrated around the Apennines, in Sicily (excluding the central and extreme west parts), and in the northern regions of Friuli Venezia Giulia and Veneto. Indeed, 43% of the firms in our sample are located in these risky municipalities. Finally, 2% of firms are located in municipalities in volcanic areas (Figure A4 in the Appendix A) close to the Vesuvio (Campania) and Etna (Sicily).

2.3. Sectoral Grenness

To measure the greenness of the industrial sector where each firm operates, we relied on the number of green patents registered in OECD countries since 1977 used in each sector. It is worth underlining that each patent might belong to several IPC codes. In this case, if some IPC of the patent belongs to a green classification we consider as a green only a portion of the patent as in [40]. Indeed, when a patent has several IPC codes, the green part of a patent may only be a minor aspect of the patent. For instance, if a patent has 10 IPC codes among which only one is green, giving a full weight of 1 to the green IPC code would tend to overinflate the number of green patents, in addition it is not possible to identify that the green IPC is a main characteristic of the technology [40]. Patents provide rich information about the technological field of innovation, through the text contained in their statements, the content of their abstract, and the classification classes that allow for the identification of firms engaged in green activities. In this paper, we identified a green patent on the basis of the IPC patent classification released by the World Intellectual Property Organization (WIPO), and in particular, following [41,42], we classified an IPC code as green if it was included in the WIPO IPC Green Inventory (IPC-GI) or in the OECD Environmental Policy and Technological Innovation Indicators (ENV-TECH). In 2010, the WIPO released the IPC-GI to highlight environmentally sound technologies within the IPC classification. It contains approximately 200 topics that are relevant to environmentally sound technologies, and each topic is linked to the most relevant IPC classes chosen by experts. A detailed description of the IPC-GI is provided by [43,44]. Similarly, in 2015, the OECD released patent search strategies for the identification of selected environment-related technologies, thus offering a comprehensive methodology for capturing innovation in environment-related technologies.
To relate the green patents to industrial sectors of use, we relied on the ‘Algorithmic Links with Probabilities’ (ALP) concordance table developed by [43] in collaboration with the WIPO. The concordance table allows for patents to be linked through the technology–industry association by 4-digit industrial sectors according to the NACE rev2 classification. For each IPC code, the concordance table provides the list of industrial sectors in which the corresponding technology may be in use and the corresponding probability of this happening. Then, following [40], we counted the number of patents allocated to each sector of use weighted by the corresponding probabilities, and built the variable GREENS1 as the logarithm of 1 plus the number of weighted green patents. Figure 2 presents the 20 greener 4-digit industrial sectors in OECD countries since 1977.
As an alternative measure, we linked the green patent to the owner and/or applicant firm in order to extract the 4-digit sectors where that technology is used. In this case, we assumed, in line with [42], that if a green patent is used by a firm operating in a given sector, the patent contributes to the greenness of that sector. Therefore, we used the frequency of green patents employed in each sector to obtain our measure of sectoral greenness (GREENS2). In Figure 3, we present the 20 greener sectors (at 4-digit) in OECD countries since 1977 according to the GREENS2 measure. Table 1 reports a description and summary statistics of the variables GREENS and GREENS2 as well as the other variables used in the empirical analysis described below.

3. Empirical Strategy

3.1. Data

We used a large sample of Italian private companies belonging to the manufacturing sector (NACE codes from 10 to 33) in the period 2010–2019. Our sample period does not include the years after 2020 to avoid the potential confounding effects of the COVID-19 crisis on firms’ investments. The initial source of data is the Orbis dataset by Bureau van Dijk. It contains yearly granular information on firms’ balance sheets and income statements from official business registers. Each firm is associated to its main 4-digit sector of activity indicated in Orbis. This dataset is linked, by exploiting the Orbis firm identifier, with information on patents from Orbis Intellectual properties (hereafter Orbis IP). It contains company accounting and patent information worldwide, including approximately 115 million patents, and offers information about which firm had ownership of each patent and the date they have been granted. To identify green patents and green sectors we matched this information with the ENV-TECH Indicator, IPC Green Inventory, and the concordance table at the sectoral level developed by [43]. Lastly, data on municipality environmental risk were obtained from ISTAT. This information is available at https://www.istat.it/it/mappa-rischi (last access on 18 November 2023).

3.2. Model and Econometric Methodology

In the empirical analysis, we tested whether environmental risk affects firms’ investment and whether this relationship differs according to their greenness. To this aim, we estimated the following investment model:
I N V E S T M E N T i s m t C A P I T A L i s m t 1   = α + β 2 R I S K i m + β 2 G R E E N S i s + β 3 G R E E N S i s × R I S K i m   + β 4 I N V E S T M E N T i s m t 1 C A P I T A L i s m t 2 + β 5 L N C A P I T A L i s m t 2 L N S A L E S i s m t 2   + β 6 Δ L N S A L E S i s m t + β 7 Δ L N S A L E S i s m t 1 + + β 8 Δ E M P i t 1 + ϕ X i t + φ a t   + ϵ i t ,
where i denotes the firm, s the main sector of activity, m the municipality where the firm is located and t the year of observation. The dependent variable is the investment of firms i at time t, calculated as the change in tangible fixed assets from year t − 1 to year t plus the depreciation in year t divided by the replacement value of a firm’s capital stock [45]. The replacement value of the capital stock was calculated with the perpetual inventory formula [46]. Using tangible fixed assets as the historic value of the capital stock and assuming that in the first period, the historic value equals the replacement cost, we calculated the capital stock at time t as K i t = K i t 1 1 δ p t / p 1 t + I t 1 . with δ denoting the depreciation rate, measured as depreciation over the real capital stock in the previous year [47], and p t the price of investment goods, measured by the price deflator at the 2-digit industry level (using the intermediate inputs price indices retrieved from the EU KLEMS database). On the righthand side of the equation, the variable RISK measures the environmental hazard of the municipality m in which firm i operates. In the baseline specification we employ the aggregated measure of risk described in Section 2.2, while in the subsequent analysis we split the measure of risk according the four sources of environmental hazard. The sectoral greenness is measured alternatively using the two definitions described in Section 2.3. Among the regressors, ΔEMP accounts for firm-level employment growth. It is a proxy for investment opportunities, assuming that firms with more investment opportunities have higher rates of employment growth [46]. The error-correction term L N K i t 2 L N S A L E S i t 2 captures the long-run equilibrium between capital and its target, proxied by sales. X represents a vector of firms’ characteristics, such as age (AGE), the ratio of total liabilities to to total assets (LEVERAGE), the yearly cashflow (CASHFLOW), working capital measured as the difference between current assets and current liabilities over total assets (WORKCAP), and the ratio of interest paid to total assets (DEBTSUST). To control for outliers, we dropped observations in the 1% tails of the distribution of both the level and first difference of the variables used in the analysis. All specifications included the interaction between the year and macro-area dummies (i.e., north, center, and south).
Our estimation strategy is based on a standard error-correction investment model used, among others, by [45,48,49,50]. This model incorporates a long-run specification for the firm’s capital demand in the presence of adjustments costs, enabling a flexible representation of short-run investment dynamics. When these costs are taken into consideration, the firm does not make an immediate adjustment of its capital stock to reach the target levels, which are assumed to be a function of sales. Thus, the model outlines a dynamic adjustment mechanism between capital and sales. Given the use of unlisted firms in our study, the commonly adopted structural q-model of investment cannot be applied [45]. As a result, it is not feasible to construct Tobin’s q with the available data.

4. Results

In this section, we show our estimation results. In the baseline specification, we estimated Equation (1) using the variable RISK as a measure of environmental risk and, alternatively, the variables GREENS or GREENS2 as measures of sectoral greenness. In subsequent analyses, we identified the risk that most affects a firm’s investment by alternatively considering the different measures of risk: LANDSLIDE, HYDRAULIC, EARTHQUAKE and VOLCANIC. Finally, to examine the effect of recent public policies, we split the sample period before and after 2015, the year of the Paris Agreement ratification, which is identified as a turning point in the awareness of firms, investors, and policymakers about the importance of environmental risks and the ecological transition process.

4.1. Baseline Results

Table 2 shows the estimation results of our baseline specification, where the variable RISK is used as measure of environmental risk, while GREENS and GREENS2 are used as measure of sectoral greenness, respectively, in columns (1) and (2). Results show that the variable RISK has a negative and statistically significant coefficient in both specifications, suggesting that firms operating in riskier environments display lower investment. This result is in line with the hypothesis that environmental risks induce firms towards less capital-intensive investments. However, the average result on RISK hides heterogeneity across sectors when looking at their degree of greenness. Indeed, with reference to column (1), the positive and significant coefficient estimate attached to GREENS implies that, the greener the sector, the higher the firm’s investment. The estimated coefficient of interest (0.0041) in column (1) indicates that a 10% increase in the greenness of the sector leads to a 0.04 increase in investment in physical capital. This result is qualitatively confirmed using the alternative measure of green sector (GREENS2) in column (2). Thus, firms operating in greener sectors have demonstrated higher levels of investment in physical capital in recent years, possibly due to higher business dynamism and the presence of investment opportunities.
When looking jointly at the relation between investment, environmental risk. and sectoral greenness, a positive and significant estimate can be observed in the interaction term between RISK and GREENS. This result indicates that the negative relation between RISK and investment is significantly less severe for firms operating in greener sectors; a positive and statistically significant coefficient is estimated also when GREENS2 is used as a regressor or as an alternative regressor (column 2). To more easily interpret these results, Figure 4 plots the marginal impact of RISK on investment against the increasing values of GREENS. Similarly, Figure 5 plots the marginal impact of RISK against GREENS2. Figure 4 and Figure 5 are based on the estimation results reported in columns (1) and (2) of Table 2. The y-axis represents the average marginal effects while the dashed lines define 95% confidence intervals.
According to these figures, the marginal impact of RISK is negative and significant for levels of sectoral greenness around zero. When moving to middle levels of greenness, the marginal impact is close to zero and barely statistically significant. Finally, the marginal impact of RISK on investment becomes positive and significant for firms operating in sectors with very large levels of greenness in the third tercile of the greenness distribution. This finding indicates that operating in the green sector significantly smooths the negative influence of environmental risk on firms’ investment.
Focusing on the other covariates in Table 2, the coefficient on the lagged investment variable is positive. The error correction term always has a significant negative sign, indicating that when capital is lower than its desired level, investment increases, ensuring a return to the equilibrium level. Estimates further indicate a significant positive relationship between sales and employment growth and investment. A positive and statistically significant coefficient is displayed by cash flow, age, and debt sustainability. A negative relationship is detected between working capital and investment, and leverage and investment.

4.2. Decomposing the Environmental Risk

In this section, we separate the sources of environmental risk. Specifically, in Table 3, we report the results after estimating Equation (1) by using GREENS as the main regressor and separately considering the four measures of risk: LANDSLIDE, HYDRAULIC, EARTHQUAKE, and VOLCANIC (columns 1 to 4, respectively). In all specifications, at increasing levels of greenness, the firms’ investment increases, a result consistent with Table 2. Moreover, with the expectation of LANDSLIDE (column 1), we find that the relation between environmental hazard and investment is negative for the other three sources of risk (columns 2 to 4). Interestingly, when examining the interaction terms between the source of risk and sectoral greenness, we find a positive and significant coefficient for green companies operating in areas with greater hydrogeological risk, earthquake risk and volcanic areas. These results confirm that the negative impact of risk on investment is confirmed for HYDRAULIC, EARTHQUAKE, and VOLCANIC risk, and that the smoothing effect for greener companies is present for all three of these sources of environmental hazard.
In Table 4, we replicate the analysis in Table 3 with the alternative measure of the green sector (GREENS2). The above findings were confirmed in the case of hydrogeological and earthquake risks. Moreover, green firms operating in areas with a high risk of landslides demonstrated lower investment in physical capital. Thus, these additional results show that our estimates are mostly driven by hydrogeological and earthquake risks (columns 2 and 3).

4.3. Results Considering the Introduction of the Paris Agreement

In this section, we follow the literature, e.g., [28] and used the time variation of the Paris Agreement in 2015 to test if our results are stronger after the increase in investors’ and policymakers’ awareness about the importance of environmental risks and the consequent ecological transition. Specifically, in Table 5, we replicated our baseline analysis by splitting the sample period into two sub-periods: before and after the Paris Agreement. Given that the ratification of the agreement took place in December 2015, we considered the years before (2010–2015) and (2016–2019) the years after. The positive and statistical significance of the interaction term provides evidence that green firms invested more at increasing levels of risk both before and after the agreement. However, the magnitude of the estimated coefficient is greater after 2016. This result holds true both when comparing the coefficient attached to the interaction term between RISK and GREENS before and after the agreement (columns 1 vs. 2), as well as when considering the interaction between RISK and GREENS2 (columns 3 vs. 4).
To better isolate the effect of the Paris Agreement and take into account the potential anticipation effect due to the long negotiation for its ratification, we changed the time window of the sub-periods to 2010–2014 (before) and 2015–2019 (after). The estimates reported in Table 6 show that the interaction term between GREENS and RISK is positive and statistically different from zero in the post-agreement period, confirming the previous results (columns 1 vs. 2). In columns (3) and (4) we replicated this analysis using the variable GREENS2; in this case, estimated coefficients attached to the interaction term are positive and significant in both sub-periods, even though the magnitude is, again, greater after 2015.
As a further robustness test, in order to avoid the confounding and anticipation effects that might affect the estimates in Table 5 and Table 6, we drop the years 2014 and 2015 and consider the periods 2010–2013 and 2016–2019 for our estimations. Results in Table 7 show that in the period preceding the Paris Agreement ratification, the coefficient on the interaction term is not statistically significant at conventional levels, whereas it becomes significant after 2016.
Taken together, these results show that the increased investment of green firms in environmentally risky areas was stimulated by the environmental agreement, while in the period before the agreement, there was a weaker or null difference among green and non-green firms operating in areas with different levels of environmental risk.

5. Concluding Remarks

In this paper, we used a large panel of Italian firms in the manufacturing sector to analyze the relation between environmental risks and firms’ investments, and to test whether this relationship is different for green firms. Italy represents a good laboratory for this study given the large number of firms and the geographical heterogeneity in terms of environmental risks across the territory. Results from the study are threefold. First, we highlight that firms invest, on average, less when located in municipalities characterized by higher environmental risk. This result confirms the preeminence of an “investment-discouragement” effect of environmental risk on investments. In detail, investments in capital assets are smaller for firms operating in municipalities with higher levels of hydrogeological and seismic risk. Second, we show that the “investment-discouragement” effect is significantly smaller for firms operating in green sectors, thus confirming the presence of greater “environmental resilience of green technologies”. Third, we provide evidence that increasing public awareness on the importance of the transition towards a greener economy reinforces our empirical findings (“green awareness” hypothesis). In particular, after splitting our sample into before and after the Paris Agreement in 2015, we find that the relationship between environmental risks and firms’ greenness on investments is economically and statistically more significant in the post-agreement period.
While these results prove to be robust to different specifications, a potential limit of our study is related to the fact that our empirical analysis does not rely on experimental variation.
Our findings support the idea that green firms, equipped with innovative and sustainable technologies, are better positioned to respond to natural disasters by increasing their investments. Additionally, the increased investment in greener sectors might be a proactive strategy aimed at mitigating the impact of natural hazards, thereby reducing the likelihood of catastrophic events. Lastly, the heightened public awareness of the importance of carbon transition, as reflected in the Paris Agreement, has played a pivotal role in encouraging investments in municipalities facing elevated environmental risks. To the extent that reducing the negative economic consequences of environmental risk is a policy priority, our findings indicate that public subsidies for corporate green transitions and coordination measures among governments, such as the Paris Agreement, could prove to be effective tools.

Author Contributions

Writing—original draft, T.O., S.R. and A.Z. All authors have read and agreed to the published version of the manuscript.

Funding

Ministero dell’Università e della Ricerca PRIN 202259EZSJ and PRIN P20227JN7R.

Informed Consent Statement

Not applicable.

Data Availability Statement

The data presented in this study are available on request from the corresponding author. The data are not publicly available due to copyrights.

Conflicts of Interest

The authors declare no conflict of interest.

Appendix A

Table A1. Pearson Correlation Matrix.
GREENSGREENS2RISKΔSALESDIFFKAPS.ΔEMPAGELEVER.CASHFL.DEBTS.WORKC.
GREENS1
GREENS20.4296 ***1
RISK−0.0426 ***−0.0939 ***1
ΔSALES0.0052 ***−0.0023 **0.0122 ***1
DIFFKAPSALES−0.0154 ***−0.0599 ***−0.0072 ***−0.1241 ***1
ΔEMP0.0037 ***0.0046 ***0.0152 ***0.5534 ***−0.0878 ***1
AGE0.0112 ***−0.0037 ***−0.0929 ***−0.1402 ***0.1885 ***−0.1517 ***1
LEVERAGE−0.0274 ***−0.0094 ***0.0395 ***0.0686 ***−0.1550 ***0.0646 ***−0.2773 ***1
CASHFLOW0.0257 ***0.0485 ***0.0028 ***0.1103 ***−0.3121 ***0.0592 ***−0.0698 ***−0.1252 ***1
DEBTSUST−0.0115 ***−0.0335 ***0.0264 ***−0.0993 ***0.3404 ***−0.1493 ***0.0227 ***0.1622 ***−0.1255 ***1
WORKCAP0.0274 ***0.0560 ***−0.0349 ***−0.0590 ***−0.3679 ***−0.0506 ***0.1680 ***−0.5491 ***0.2037 ***−0.2216 ***1
For the description of the variables see Table 1. Superscripts *** and ** denote statistical significance at the 1 and 5 percent level, respectively.
Figure A1. Municipality surface (km2) at higher landslide hazard.
Sustainability 16 00542 g0a1
Figure A2. Municipality surface (km2) at higher hydraulic hazard.
Sustainability 16 00542 g0a2
Figure A3. Municipality at higher earthquake hazard.
Sustainability 16 00542 g0a3
Figure A4. Municipality in a volcanic area.
Sustainability 16 00542 g0a4

References

  1. IPCC. AR6 Climate Change 2022: Impacts, Adaptation and Vulnerability—Summary for Policy Makers; (AR6); IPCC: Geneva, Switzerland, 2022; Available online: https://www.ipcc.ch/report/ar6/wg2/downloads/report/IPCC_AR6_WGII_SummaryForPolicymakers.pdf?fbclid=IwAR2ObESfzPpubjH3dmiI4y9SA65MQMPNvFIUlDQoJSuccmtRU7pWfvnEAWo (accessed on 7 June 2022).
  2. Albala-Bertrand, J.M. Natural disaster situations and growth: A macroeconomic model for sudden disaster impacts. World Dev. 1993, 21, 1417–1434. [Google Scholar] [CrossRef]
  3. Anbarci, N.; Escaleras, M.; Register, C.A. Earthquake fatalities: The interaction of nature and political economy. J. Public Econ. 2005, 89, 1907–1933. [Google Scholar] [CrossRef]
  4. Kahn, M.E. The death toll from natural disasters: The role of income, geography, and institutions. Rev. Econ. Stat. 2005, 87, 271–284. [Google Scholar] [CrossRef]
  5. Halliday, T. Migration, risk, and liquidity constraints in El Salvador. Econ. Dev. Cult. Change 2006, 54, 893–925. [Google Scholar] [CrossRef]
  6. Skidmore, M.; Toya, H. Do natural disasters promote long-run growth? Econ. Inq. 2002, 40, 664–687. [Google Scholar] [CrossRef]
  7. Hallegatte, S.; Dumas, P. Can natural disasters have positive consequences? Investigating the role of embodied technical change. Ecol. Econ. 2009, 68, 777–786. [Google Scholar] [CrossRef]
  8. Hochrainer, S. Assessing the Macroeconomic Impacts of Natural Disasters: Are There Any? World Bank Policy Research Working Paper. 2009. Available online: https://openknowledge.worldbank.org/entities/publication/deb177e2-35f1-5cb5-8657-7b33ec8137d0 (accessed on 18 November 2023).
  9. Leiter, A.M.; Oberhofer, H.; Raschky, P.A. Creative disasters? Flooding effects on capital, labour and productivity within European firms. Environ. Resour. Econ. 2009, 43, 333–350. [Google Scholar] [CrossRef]
  10. De Mel, S.; McKenzie, D.; Woodruff, C. Enterprise recovery following natural disasters. Econ. J. 2012, 122, 64–91. [Google Scholar] [CrossRef]
  11. Miao, Q.; Popp, D. Necessity as the mother of invention: Innovative responses to natural disasters. J. Environ. Econ. Manag. 2014, 68, 280–295. [Google Scholar] [CrossRef]
  12. Yamamoto, H.; Naka, T. Quantitative analysis of the impact of floods on firms’ financial conditions. Bank Jpn. 2021. Available online: https://www.boj.or.jp/en/research/wps_rev/wps_2021/data/wp21e10.pdf (accessed on 18 November 2023).
  13. Reggiani, A.; De Graaff, T.; Nijkamp, P. Resilience: An evolutionary approach to spatial economic systems. Netw. Spat. Econ. 2002, 2, 211–229. [Google Scholar] [CrossRef]
  14. Duval, R.; Elmeskov, J.; Vogel, L. Structural policies and economic resilience to shocks. Struct. Policies Econ. Resil. Shock. 2007. Available online: https://www.oecd-ilibrary.org/docserver/140152385131.pdf?expires=1704719146&id=id&accname=guest&checksum=AEC5D8AC1ABBEE94A1CFD92FA49AF432 (accessed on 18 November 2023). [CrossRef]
  15. Rose, A. Economic principles, issues, and research priorities in hazard loss estimation. In Modeling Spatial and Economic Impacts of Disasters; Okuyama, Y., Chang, S.E., Eds.; Springer: Berlin/Heidelberg, Germany, 2004; pp. 13–36. [Google Scholar]
  16. Martin, R. Regional economic resilience, hysteresis and recessionary shocks. J. Econ. Geogr. 2012, 12, 1–32. [Google Scholar] [CrossRef]
  17. Li, S. Natural extreme events, government subsidies and corporate environment responsibility: Evidence from China’s energy sector. Energy Econ. 2022, 114, 106278. [Google Scholar] [CrossRef]
  18. Antonioli, D.; Marzucchi, A.; Modica, M. Resilience, performance and strategies in firms’ reactions to the direct and indirect effects of a natural disaster. Netw. Spat. Econ. 2022, 22, 1–25. [Google Scholar] [CrossRef]
  19. Tol, R.S.; Leek, F.P. Economic analysis of natural disasters. In Climate, Change and Risk; Downing, T.E., Olshtoorn, A.J., Tol, R.S.J., Eds.; Routledge: London, UK, 1998; pp. 332–351. [Google Scholar]
  20. Liu, D.; Sun, W.; Zhang, X. Is the Chinese economy well positioned to fight the COVID-19 pandemic? The financial cycle perspective. Emerg. Mark. Financ. Trade 2020, 56, 2259–2276. [Google Scholar] [CrossRef]
  21. Vidya, C.T.; Prabheesh, K.P. Implications of COVID-19 pandemic on the global trade networks. Emerg. Mark. Financ. Trade 2020, 56, 2408–2421. [Google Scholar] [CrossRef]
  22. Uchida, H.; Miyakawa, D.; Hosono, K.; Ono, A.; Uchino, T.; Uesugi, I. Natural Disaster and Natural Selection. RIETI Discussion Paper Series. 2013. Available online: https://www.rieti.go.jp/jp/publications/dp/14e055.pdf (accessed on 18 November 2023). [CrossRef]
  23. Sobel, R.S.; Leeson, P.T. Government’s response to Hurricane Katrina: A public choice analysis. Public Choice 2006, 127, 55–73. [Google Scholar] [CrossRef]
  24. Crespo Cuaresma, J.; Hlouskova, J.; Obersteiner, M. Natural disasters as creative destruction? Evidence from developing countries. Econ. Inq. 2008, 46, 214–226. [Google Scholar] [CrossRef]
  25. Chen, Y.E.; Li, C.; Chang, C.P.; Zheng, M. Identifying the influence of natural disasters on technological innovation. Econ. Anal. Policy 2021, 70, 22–36. [Google Scholar] [CrossRef]
  26. Gries, T.; Naudé, W. Extreme events, entrepreneurial start-ups, and innovation: Theoretical conjectures. Econ. Disasters Clim. Change 2021, 5, 329–353. [Google Scholar] [CrossRef]
  27. O’Connor, R.E.; Bard, R.J.; Fisher, A. Risk perceptions, general environmental beliefs, and willingness to address climate change. Risk Anal. 1999, 19, 461–471. [Google Scholar] [CrossRef]
  28. Degryse, H.; Goncharenko, R.; Theunisz, C.; Vadasz, T. When green meets green. J. Corp. Financ. 2023, 78, 102355. [Google Scholar] [CrossRef]
  29. IPCC; Mach, K.J.; Planton, S.; von Stechow, C. Annex II: Glossary. In Contribution of Working Groups I, II and III to the Fifth Assessment Report of the Intergovernmental Panel on Climate Change; Climate Change 2014: Synthesis Report; Core Writing Team, Pachauri, R.K., Meyer, L.A., Eds.; IPCC: Geneva, Switzerland, 2014; pp. 117–130. [Google Scholar]
  30. Boschma, R. Towards an evolutionary perspective on regional resilience. Reg. Stud. 2015, 49, 733–751. [Google Scholar] [CrossRef]
  31. Okuyama, Y. Economics of natural disasters: A critical review. Reg. Res. Inst. Work. Pap. 2003. Available online: https://researchrepository.wvu.edu/cgi/viewcontent.cgi?article=1123&context=rri_pubs (accessed on 18 November 2023).
  32. Hallegatte, S.; Hourcade, J.C.; Dumas, P. Why economic dynamics matter in assessing climate change damages: Illustration on extreme events. Ecol. Econ. 2007, 62, 330–340. [Google Scholar] [CrossRef]
  33. Pan, X.; Qiu, B. The impact of flooding on firm performance and economic growth. PLoS ONE 2022, 17, e0271309. [Google Scholar] [CrossRef]
  34. Hu, H.; Lei, T.; Hu, J.; Zhang, S.; Kavan, P. Disaster-mitigating and general innovative responses to climate disasters: Evidence from modern and historical China. Int. J. Disaster Risk Reduct. 2018, 28, 664–673. [Google Scholar] [CrossRef]
  35. Botzen, W.W.; Deschenes, O.; Sanders, M. The economic impacts of natural disasters: A review of models and empirical studies. Rev. Environ. Econ. Policy 2019, 13, 167–188. [Google Scholar] [CrossRef]
  36. Auci, S.; Barbieri, N.; Coromaldi, M.; Michetti, M. Climate variability, innovation and firm performance: Evidence from the European agricultural sector. Eur. Rev. Agric. Econ. 2021, 48, 1074–1108. [Google Scholar] [CrossRef]
  37. Noy, I.; Strobl, E. Creatively destructive hurricanes: Do disasters spark innovation? Environ. Resour. Econ. 2023, 84, 1–17. [Google Scholar] [CrossRef]
  38. Koppel, B.M. Induced innovation theory, agricultural research, and Asia’s green revolution: A Reappraisal. In Induced Innovation Theory and International Agricultural Development: A Reassessment; Koppel, B.M., Ed.; Routledge: London, UK; John Hopkins University Press: Baltimore, MD, USA, 1994. [Google Scholar]
  39. Smithers, J.; Blay-Palmer, A. Technology innovation as a strategy for climate adaptation in agriculture. Appl. Geogr. 2001, 21, 175–197. [Google Scholar] [CrossRef]
  40. Wurlod, J.D.; Noailly, J. The impact of green innovation on energy intensity: An empirical analysis for 14 industrial sectors in OECD countries. Energy Econ. 2018, 71, 47–61. [Google Scholar] [CrossRef]
  41. Gagliardi, L.; Marin, G.; Miriello, C. The greener the better? Job creation effects of environmentally-friendly technological change. Ind. Corp. Change 2016, 25, 779–807. [Google Scholar] [CrossRef]
  42. Ghisetti, C.; Quatraro, F. Green technologies and environmental productivity: A cross-sectoral analysis of direct and indirect effects in Italian regions. Ecol. Econ. 2017, 132, 1–13. [Google Scholar] [CrossRef]
  43. Lybbert, T.J.; Zolas, N.J. Getting patents and economic data to speak to each other: An ‘algorithmic links with probabilities’ approach for joint analyses of patenting and economic activity. Res. Policy 2014, 43, 530–542. [Google Scholar] [CrossRef]
  44. Marin, G.; Lotti, F. Productivity effects of eco-innovations using data on eco-patents. Ind. Corp. Chang. 2017, 26, 125–148. [Google Scholar] [CrossRef]
  45. Mulier, K.; Schoors, K.; Merlevede, B. Investment-cash flow sensitivity and financial constraints: Evidence from unquoted European SMEs. J. Bank. Financ. 2016, 73, 182–197. [Google Scholar] [CrossRef]
  46. Blundell, R.; Bond, S.; Devereux, M.; Schiantarelli, F. Investment and Tobin’s Q: Evidence from company panel data. J. Econom. 1992, 51, 233–257. [Google Scholar] [CrossRef]
  47. Bond, S.; Harhoff, D.; Van Reenen, J. Investment, R&D and financial constraints in Britain and Germany. Ann. D’econ. Stat. 2005, 433–460. [Google Scholar] [CrossRef]
  48. Mizen, P.; Vermeulen, P. Corporate Investment and Cash Flow Sensitivity: What Drives the Relationship? European Central Bank Working Paper Series. 2005. Available online: https://www.ecb.europa.eu/pub/pdf/scpwps/ecbwp485.pdf (accessed on 18 November 2023). [CrossRef]
  49. Bloom, N.; Bond, S.; Van Reenen, J. Uncertainty and investment dynamics. Rev. Econ. Stud. 2007, 74, 391–415. [Google Scholar] [CrossRef]
  50. Guariglia, A. Internal financial constraints, external financial constraints, and investment choice: Evidence from a panel of UK firms. J. Bank. Financ. 2008, 32, 1795–1809. [Google Scholar] [CrossRef]
Figure 1. Municipality environmental risk (aggregate measure).
Sustainability 16 00542 g001
Figure 2. Top 20 Green sector in OECD Countries (following the approach by Wurlod and Noailly, 2018) [40].
Sustainability 16 00542 g002
Figure 3. Top 20 Green sector in OECD Countries, by Number of Green Patents.
Sustainability 16 00542 g003
Figure 4. Marginal Effect of RISK on INVESTMENT as GREENS changes.
Sustainability 16 00542 g004
Figure 5. Marginal Effect of RISK on INVESTMENT as GREENS2 changes.
Sustainability 16 00542 g005
Table 1. Description and summary statistics.
MeanStd. Dev.MinMaxObs
INVESTMENTSum of depreciation in year t and the change in fixed assets from year t − 1 to year t diveded by replacement value of the firm’s capital stock.0.511.20−0.7816.41525,957
GREENS (a)Number of green patent at sectoral level (4-digit), following Wurload and Noailly methodology. See Section 2 for details.2.602.410.009.49525,957
GREENS2 (a)Number of green patent at sectoral level (4-digit). See Section 2 for details.4.301.870.008.39525,957
RISKFirm’s municipality enviromental risk (see notes for a detailed description). 1.401.020.004.00525,957
LANDSLIDEFirm’s municipality surface (km2) at higher landslide hazard3.088.680.00200.54525,957
HYDRAULICFirm’s municipality surface (km2) at higher hydraulic hazard15.5944.610.00653.62525,957
EARTHQUAKEDummy = 1 for firm’s municipality at higher earthquake hazard0.430.5001525,957
VOLCANICDummy = 1 for firm’s municipality in a volcanic area0.020.1501525,957
ΔSALESChange in the log of real total sales.0.030.29−4.939.35525,957
DIFFKAPSALESDifference between the log of capital and the log of real total sales.2.561.52−7.1310.34525,952
ΔEMPChange in the log of real total costs of employees0.040.35−7.416.68525,957
AGECurrent year minus firm’s year of establishment20.212.873.0065.0525,957
LEVERAGE(Current plus non-current liabilities) to total assets0.720.210.081.13525,957
CASHFLOWCash flow scaled by its beginning of period capital.0.802.39−23.6333.55525,957
DEBTSUSTInterest paid to total sales 0.020.020.000.50525,957
WORKCAP(Currents assets minus current liabilities) to total assets0.200.25−1.000.95525,957
(a) in logarithm RISK is a variable taking value from zero to four defined as the sum of the risks affecting the municipality. For the variables LANDSLIDE and HYDRAULIC, we consider a municipality to be at risk if the value is above the median.
Table 2. Estimation results: baseline model.
12
GREENS0.0041 ***
0.0010
GREENS2 0.0085 ***
0.0014
RISK−0.0050 **−0.0133 ***
0.00230.0037
GREENS × RISK0.0015 **
0.0006
GREENS2 × RISK 0.0022 ***
0.0008
INVESTMENT_10.0613 ***0.1294 ***
0.00130.0012
ΔSALES0.2306 ***0.2996 ***
0.00600.0058
ΔSALES_10.2596 ***−0.0201 ***
0.00500.0047
DIFFKAPSALES_2−0.2985 ***−0.3559 ***
0.00160.0014
CASHFLOW0.1141 ***0.0956 ***
0.00070.0007
ΔEMP0.1057 ***0.1091 ***
0.00470.0046
AGE−0.00010.0010 ***
0.00010.0001
LEVERAGE−0.4841 ***−0.7779 ***
0.01040.0102
DEBTSUST4.1051 ***5.0442 ***
0.07840.0763
WORKCAP−0.8636 ***−1.1294 ***
0.00890.0087
Observations525,957525,957
Joint significance test (RISK,GREENS)20.7590
P (RISK,GREENS)0.0000
Joint significance test (RISK,GREENS2) 80.4147
P (RISK,GREENS2) 0.0000
For the description of the variables, see Table 1. The dependent variable is always INVESTMENT. Superscripts *** and ** denote statistical significance at the 1 and 5 percent level, respectively. The standard errors (robust to heteroskedasticity and autocorrelation) are given in italics. Year × Area and sector dummies are always included but not reported. GREENS and GREENS2 are in log.
Table 3. Estimation results decomposing the environmental risk measure and considering the green sector.
1234
GREENS0.0041 ***0.0053 ***0.0020 **0.0037 ***
0.00070.00070.00080.0006
LANDSLIDE0.0000
0.0003
GREENS × LANDSLIDE0.0000
0.0001
HYDRAULIC −0.0002 ***
0.0000
GREENS × HYDRAULIC 0.0000 *
0.0000
EARTHQUAKE −0.0153 ***
0.0044
GREENS × EARTHQUAKE 0.0025 **
0.0012
VOLCANIC −0.0732 ***
0.0136
GREENS × VOLCANIC 0.0114 ***
0.0041
INVESTMENT_10.1625 ***0.1296 ***0.1293 ***0.1290 ***
0.00130.00120.00120.0012
ΔSALES0.0127 **0.2997 ***0.2996 ***0.2984 ***
0.00610.00590.00580.0058
ΔSALES_10.0191 ***−0.0206 ***−0.0200 ***−0.0212 ***
0.00500.00470.00470.0047
DIFFKAPSALES_2−0.0535 ***−0.3566 ***−0.3538 ***−0.3545 ***
0.00150.00140.00140.0014
CASHFLOW0.1473 ***0.0956 ***0.0958 ***0.0956 ***
0.00070.00070.00070.0007
ΔEMP0.1318 ***0.1090 ***0.1095 ***0.1091 ***
0.00490.00460.00460.0046
AGE−0.0029 ***0.0010 ***0.0009 ***0.0009 ***
0.00010.00010.00010.0001
LEVERAGE0.3607 ***−0.7812 ***−0.7719 ***−0.7720 ***
0.01080.01020.01020.0102
DEBTSUST0.08715.0470 ***5.0467 ***5.0413 ***
0.08060.07670.07630.0763
WORKCAP−0.1407 ***−1.1335 ***−1.1230 ***−1.1242 ***
0.00940.00880.00870.0087
Observations524,194524,199525,957525,957
Joint significance test (LANDSLIDE, GREENS)17.2185
P (LANDSLIDE, GREENS)0.0000
Joint significance test (HYDRAULIC, GREENS) 41.2984
P (HYDRAULIC, GREENS) 0.0000
Joint significance test (EARTHQUAKE, GREENS) 16.0851
P (EARTHQUAKE, GREENS) 0.0000
Joint significance test (VOLCANIC, GREENS) 33.4271
P (VOLCANIC, GREENS) 0.0000
For the description of the variables, see Table 1. The dependent variable is always INVESTMENT. Superscripts ***, ** and * denote statistical significance at the 1, 5 and 10 percent level, respectively. The standard errors (robust to heteroskedasticity and autocorrelation) are given in italics. Year × Area and sector dummies are always included but not reported. GREENS and GREENS2 are in log.
Table 4. Estimation results: decomposing the environmental risk measure and considering green sector 2.
1234
GREENS20.0038 ***0.0030 ***0.0062 ***0.0063 ***
0.00140.00100.00120.0009
LANDSLIDE0.0009 **
0.0004
GREENS2 × LANDSLIDE−0.0002 **
0.0001
HYDRAULIC −0.0003 ***
0.0001
GREENS2 × HYDRAULIC 0.0000 **
0.0000
EARTHQUAKE −0.0227 ***
0.0074
GREENS2 × EARTHQUAKE 0.0032 **
0.0016
VOLCANIC −0.0738 ***
0.0225
GREENS2 × VOLCANIC 0.0076
0.0054
INVESTMENT_10.0603 ***0.1295 ***0.1289 ***0.1298 ***
0.00130.00120.00120.0012
ΔSALES0.2307 ***0.2976 ***0.2987 ***0.2982 ***
0.00600.00580.00580.0059
ΔSALES_10.2609 ***−0.0212 ***−0.0202 ***−0.0218 ***
0.00500.00470.00470.0047
DIFFKAPSALES_2−0.2994 ***−0.3561 ***−0.3546 ***−0.3566 ***
0.00160.00140.00140.0014
CASHFLOW0.1137 ***0.0956 ***0.0954 ***0.0957 ***
0.00070.00070.00070.0007
ΔEMP0.1061 ***0.1088 ***0.1094 ***0.1087 ***
0.00470.00460.00460.0046
AGE0.00000.0010 ***0.0009 ***0.0010 ***
0.00010.00010.00010.0001
LEVERAGE−0.4885 ***−0.7800 ***−0.7734 ***−0.7797 ***
0.01040.01020.01020.0102
DEBTSUST4.0653 ***5.0653 ***5.0496 ***5.0714 ***
0.07860.07640.07640.0767
WORKCAP−0.8744 ***−1.1327 ***−1.1285 ***−1.1285 ***
0.00890.00880.00880.0088
Observations525,957525,957525,957524,199
Joint significance test (LANDSLIDE, GREENS2)5.2866
P (LANDSLIDE, GREENS2)0.0051
Joint significance test (HYDRAULIC, GREENS2) 13.7480
P (HYDRAULIC, GREENS2) 0.0000
Joint significance test (EARTHQUAKE, GREENS2) 31.7469
P (EARTHQUAKE, GREENS2) 0.0000
Joint significance test (VOLCANIC, GREENS2) 36.2113
P (VOLCANIC, GREENS2) 0.0000
For the description of the variables, see Table 1. The dependent variable is always INVESTMENT. Superscripts *** and ** denote statistical significance at the 1 and 5 percent level, respectively. The standard errors (robust to heteroskedasticity and autocorrelation) are given in italics. Year × Area and sector dummies are always included but not reported. GREENS and GREENS2 are in log.
Table 5. Estimation results: baseline model before and after Paris.
1234
GREENS0.0042 ***0.0037 **
0.00130.0018
GREENS2 0.0085 ***0.0087 ***
0.00170.0024
RISK−0.0025−0.0089 **−0.0108 **−0.0168 ***
0.00280.00400.00450.0064
GREENS × RISK0.0012 *0.0021 **
0.00070.0010
GREENS2 × RISK 0.0019 **0.0026 *
0.00090.0013
INVESTMENT_10.0817 ***0.0363 ***0.1462 ***0.1091 ***
0.00170.00220.00160.0019
ΔSALES0.2275 ***0.2386 ***0.2934 ***0.3157 ***
0.00700.01090.00680.0107
ΔSALES_10.2417 ***0.2960 ***−0.0327 ***0.0108
0.00570.00960.00540.0092
DIFFKAPSALES_2−0.2909 ***−0.3104 ***−0.3472 ***−0.3705 ***
0.00190.00270.00170.0025
CASHFLOW0.1120 ***0.1165 ***0.0940 ***0.0968 ***
0.00090.00110.00090.0011
ΔEMP0.0991 ***0.1153 ***0.1013 ***0.1208 ***
0.00560.00840.00550.0083
AGE0.0002−0.0004 **0.0012 ***0.0006 ***
0.00020.00020.00010.0002
LEVERAGE−0.4832 ***−0.4952 ***−0.7748 ***−0.7906 ***
0.01260.01810.01230.0178
DEBTSUST3.8681 ***4.9110 ***4.7418 ***5.9973 ***
0.08630.17150.08390.1673
WORKCAP−0.8136 ***−0.9444 ***−1.0798 ***−1.2083 ***
0.01070.01560.01050.0154
Observations326,037199,920326,037199,920
Joint significance test (RISK, GREENS)10.76959.6814
P (RISK, GREENS)0.00000.0001
Joint significance test (RISK, GREENS2) 47.709732.6813
P (RISK, GREENS2) 0.00000.0000
Periodbefore 2015after 2015before 2015after 2015
For the description of the variables, see Table 1. The dependent variable is always INVESTMENT. Superscripts ***, ** and * denote statistical significance at the 1, 5 and 10 percent level, respectively. The standard errors (robust to heteroskedasticity and autocorrelation) are given in italics. Year × Area and sector dummies are always included but not reported. GREENS and GREENS2 are in log.
Table 6. Estimation results: baseline model before and after 2014.
1234
GREENS0.0046 ***0.0034 **
0.00140.0016
GREENS2 0.0087 ***0.0084 ***
0.00180.0021
RISK−0.0034−0.0066 *−0.0112 **−0.0151 ***
0.00300.00350.00480.0057
GREENS × RISK0.00100.0021 **
0.00080.0009
GREENS2 × RISK 0.0017 *0.0027 **
0.00100.0012
INVESTMENT_10.0761 ***0.0489 ***0.1415 ***0.1193 ***
0.00190.00190.00170.0017
ΔSALES0.2280 ***0.2359 ***0.2919 ***0.3125 ***
0.00750.00950.00730.0094
ΔSALES_10.2399 ***0.2888 ***−0.0364 ***0.0075
0.00600.00840.00570.0080
DIFFKAPSALES_2−0.2923 ***−0.3052 ***−0.3464 ***−0.3667 ***
0.00200.00240.00190.0022
CASHFLOW0.1128 ***0.1153 ***0.0953 ***0.0954 ***
0.00100.00100.00100.0010
ΔEMP0.0958 ***0.1157 ***0.0982 ***0.1203 ***
0.00610.00730.00590.0072
AGE0.0001−0.00020.0011 ***0.0008 ***
0.00020.00020.00020.0002
LEVERAGE−0.5018 ***−0.4734 ***−0.7859 ***−0.7760 ***
0.01360.01590.01330.0156
DEBTSUST3.9099 ***4.5673 ***4.7450 ***5.6523 ***
0.09130.14220.08860.1386
WORKCAP−0.8077 ***−0.9236 ***−1.0678 ***−1.1944 ***
0.01150.01370.01130.0135
Observations270,828255,129270,828255,129
Joint significance test (RISK, GREENS)11.73898.7204
P (RISK, GREENS)0.00000.0002
Joint significance test (RISK, GREENS2) 43.490237.0981
P (RISK, GREENS2) 0.00000.0000
Periodbefore 2014after 2014before 2014after 2014
For the description of the variables, see Table 1. The dependent variable is always INVESTMENT. Superscripts ***, ** and * denote statistical significance at the 1, 5 and 10 percent level, respectively. The standard errors (robust to heteroskedasticity and autocorrelation) are given in italics. Year × Area and sector dummies are always included but not reported. GREENS and GREENS2 are in log.
Table 7. Estimation results: baseline model before 2013 and after 2016.
1234
GREENS0.0050 ***0.0037 **
0.00150.0018
GREENS2 0.0090 ***0.0061 ***
0.00200.0024
GREENF
RISK−0.0027−0.0089 **−0.0106 **−0.0170 ***
0.00340.00400.00540.0064
GREENS × RISK0.00070.0021 **
0.00090.0010
GREENS2 × RISK 0.00160.0027 **
0.00110.0013
INVESTMENT_10.0682 ***0.0363 ***0.1354 ***0.1092 ***
0.00210.00220.00190.0019
ΔSALES0.2219 ***0.2386 ***0.2847 ***0.3139 ***
0.00820.01090.00800.0107
ΔSALES_10.2395 ***0.2960 ***−0.0395 ***0.0099
0.00660.00960.00620.0092
DIFFKAPSALES_2−0.2942 ***−0.3104 ***−0.3477 ***−0.3697 ***
0.00230.00270.00210.0025
CASHFLOW0.1146 ***0.1165 ***0.0968 ***0.0969 ***
0.00110.00110.00110.0011
ΔEMP0.1050 ***0.1153 ***0.1076 ***0.1207 ***
0.00670.00840.00650.0083
AGE0.0002−0.0004 **0.0012 ***0.0006 ***
0.00020.00020.00020.0002
LEVERAGE−0.5044 ***−0.4952 ***−0.7883 ***−0.7857 ***
0.01510.01810.01480.0178
DEBTSUST3.9291 ***4.9110 ***4.7568 ***5.9982 ***
0.10120.17150.09830.1673
WORKCAP−0.8076 ***−0.9444 ***−1.0663 ***−1.2052 ***
0.01280.01560.01260.0153
Observations216,097199,920216,097199,920
Joint significance test (RISK, GREENS)10.49559.6814
P (RISK, GREENS)0.00000.0001
Joint significance test (RISK, GREENS2) 35.865423.7677
P (RISK, GREENS2) 0.00000.0000
Periodbefore 2013after 2016before 2013after 2016
For the description of the variables, see Table 1. The dependent variable is always INVESTMENT. Superscripts *** and ** denote statistical significance at the 1 and 5 percent level, respectively. The standard errors (robust to heteroskedasticity and autocorrelation) are given in italics. Year × Area and sector dummies are always included but not reported. GREENS and GREENS2 are in log.
Disclaimer/Publisher’s Note: The statements, opinions and data contained in all publications are solely those of the individual author(s) and contributor(s) and not of MDPI and/or the editor(s). MDPI and/or the editor(s) disclaim responsibility for any injury to people or property resulting from any ideas, methods, instructions or products referred to in the content.

