

Toward Sustainable Indoor Environments: Assessing the Impact of Thermal Insulation Measures on Air Quality in Buildings—A Case Study in Temuco, Chile

 ,
,  ,
,  ,
,  and
and
Abstract
:1. Introduction
2. Data and Methods
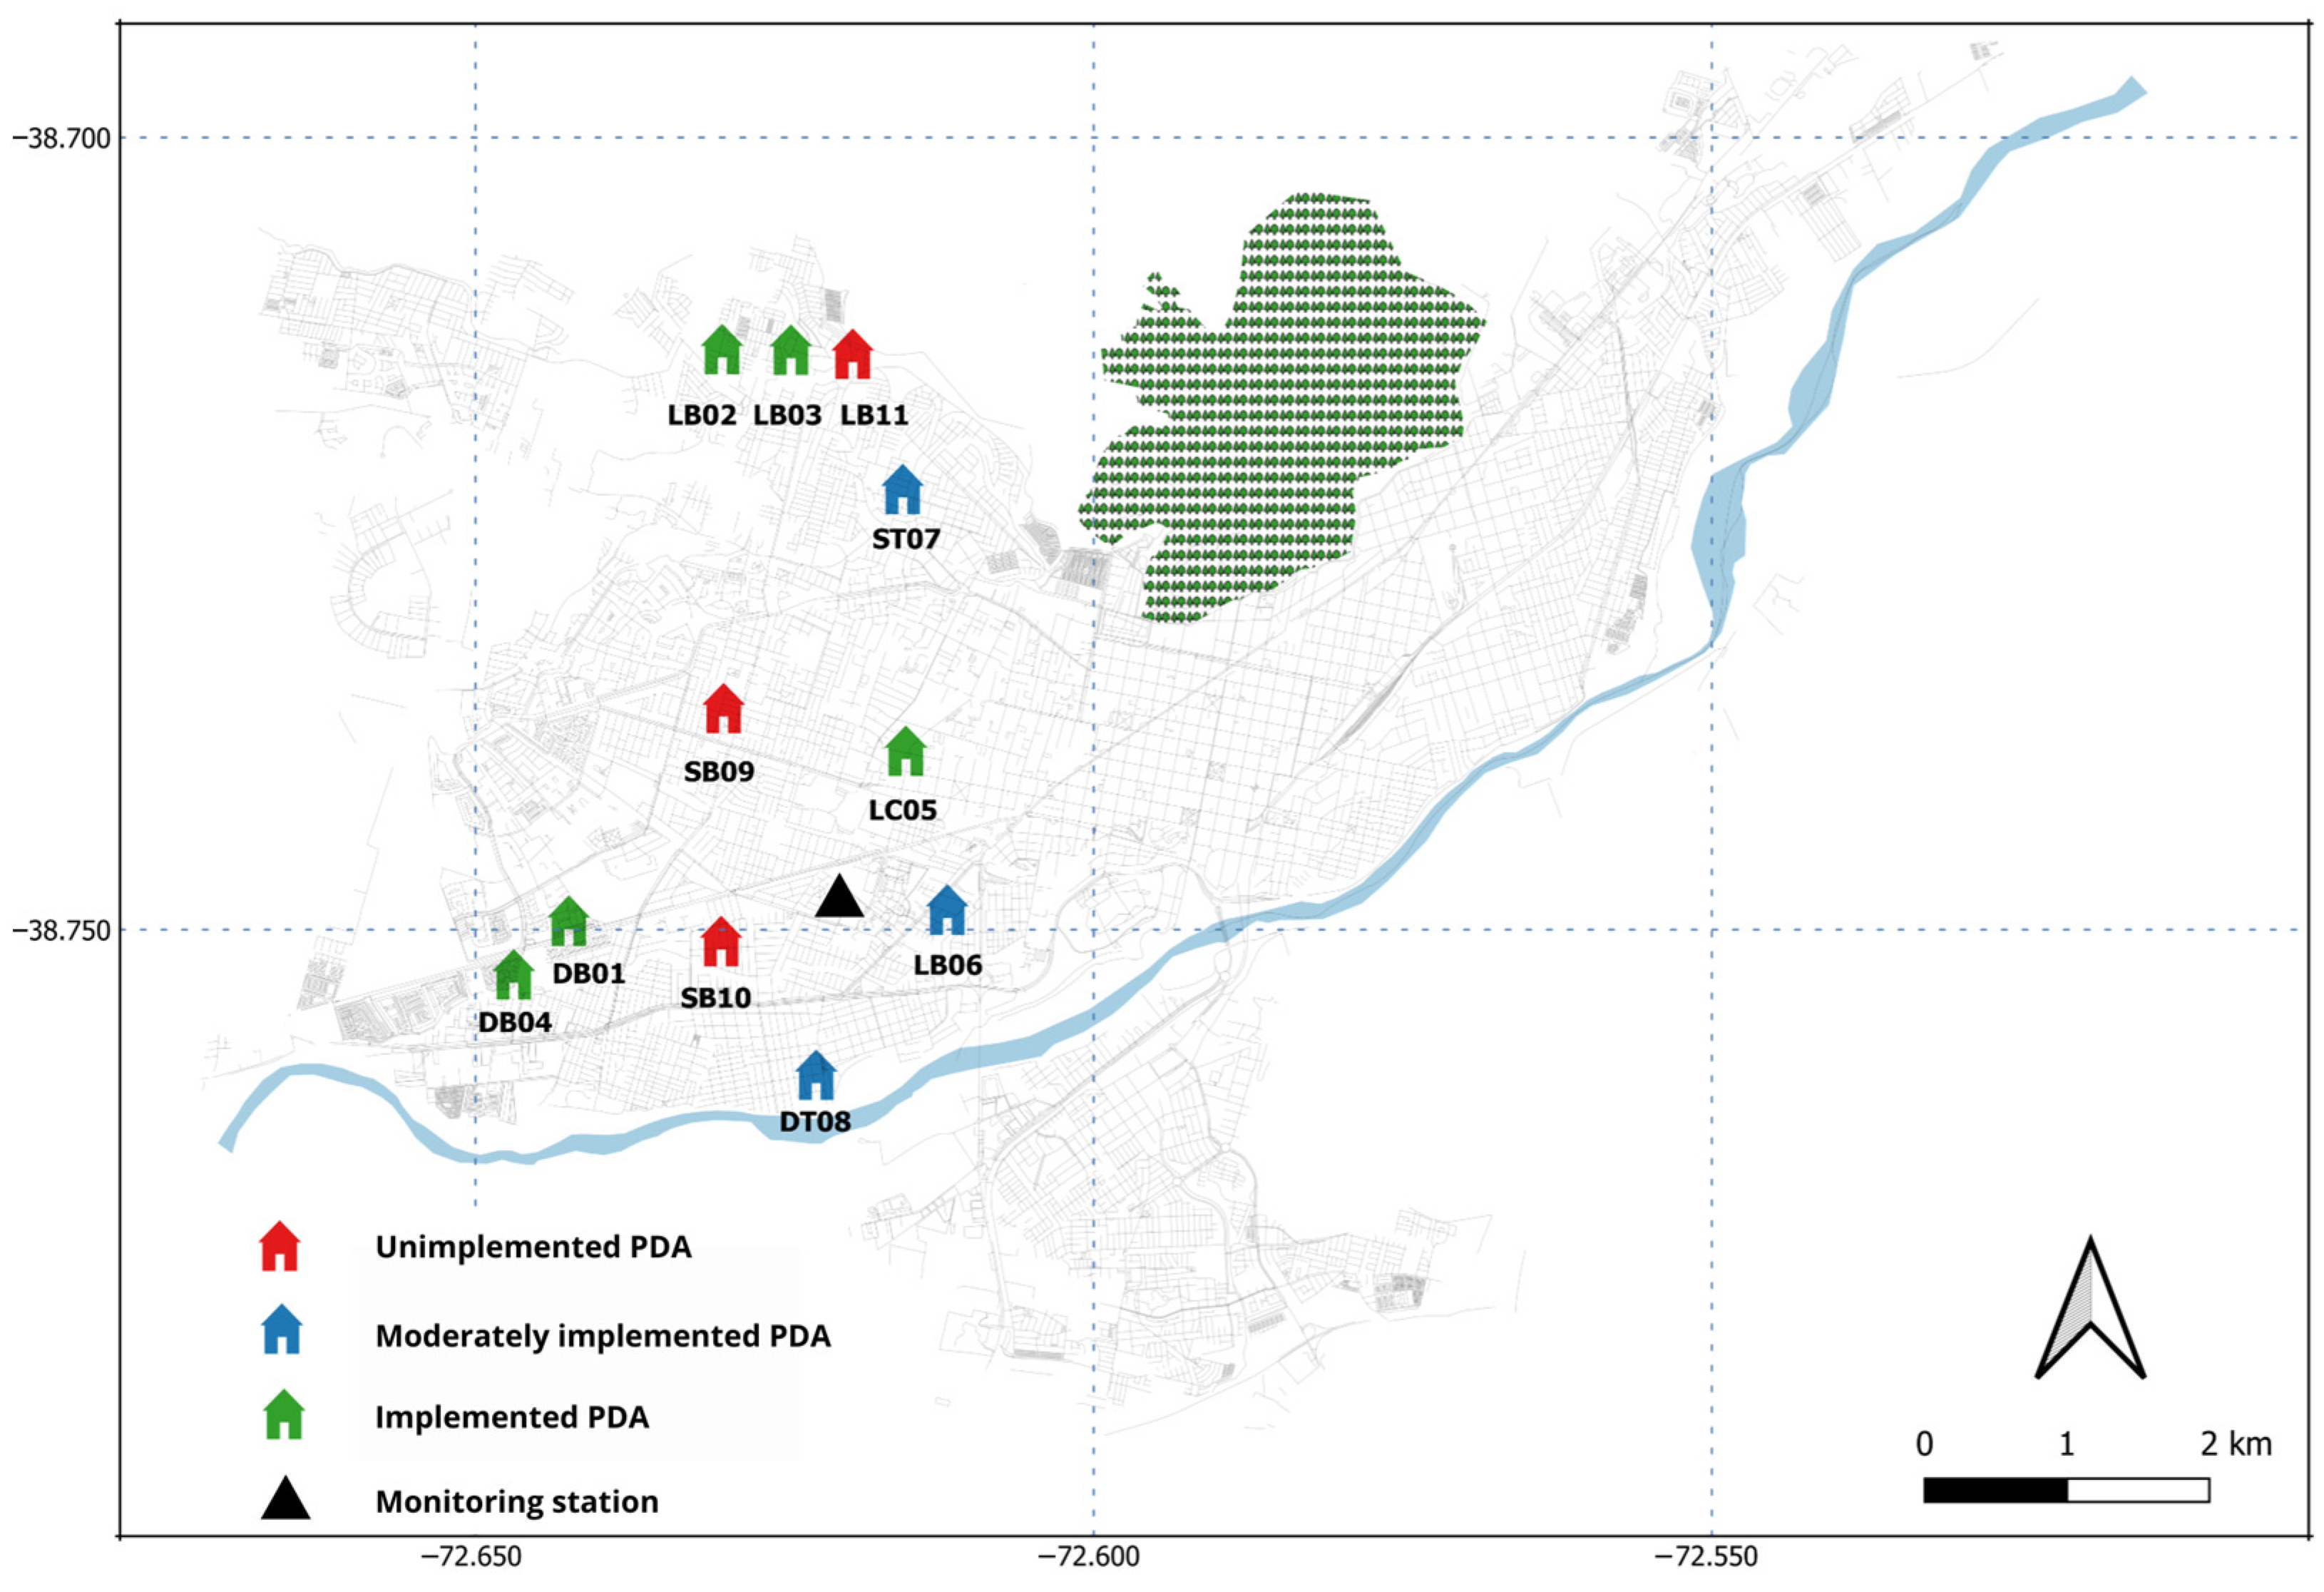
2.1. Data
2.2. Data Cleaning and Processing
2.3. Analysis Method
3. Results
3.1. Results of Thermal Comfort Monitoring
3.1.1. Temperature
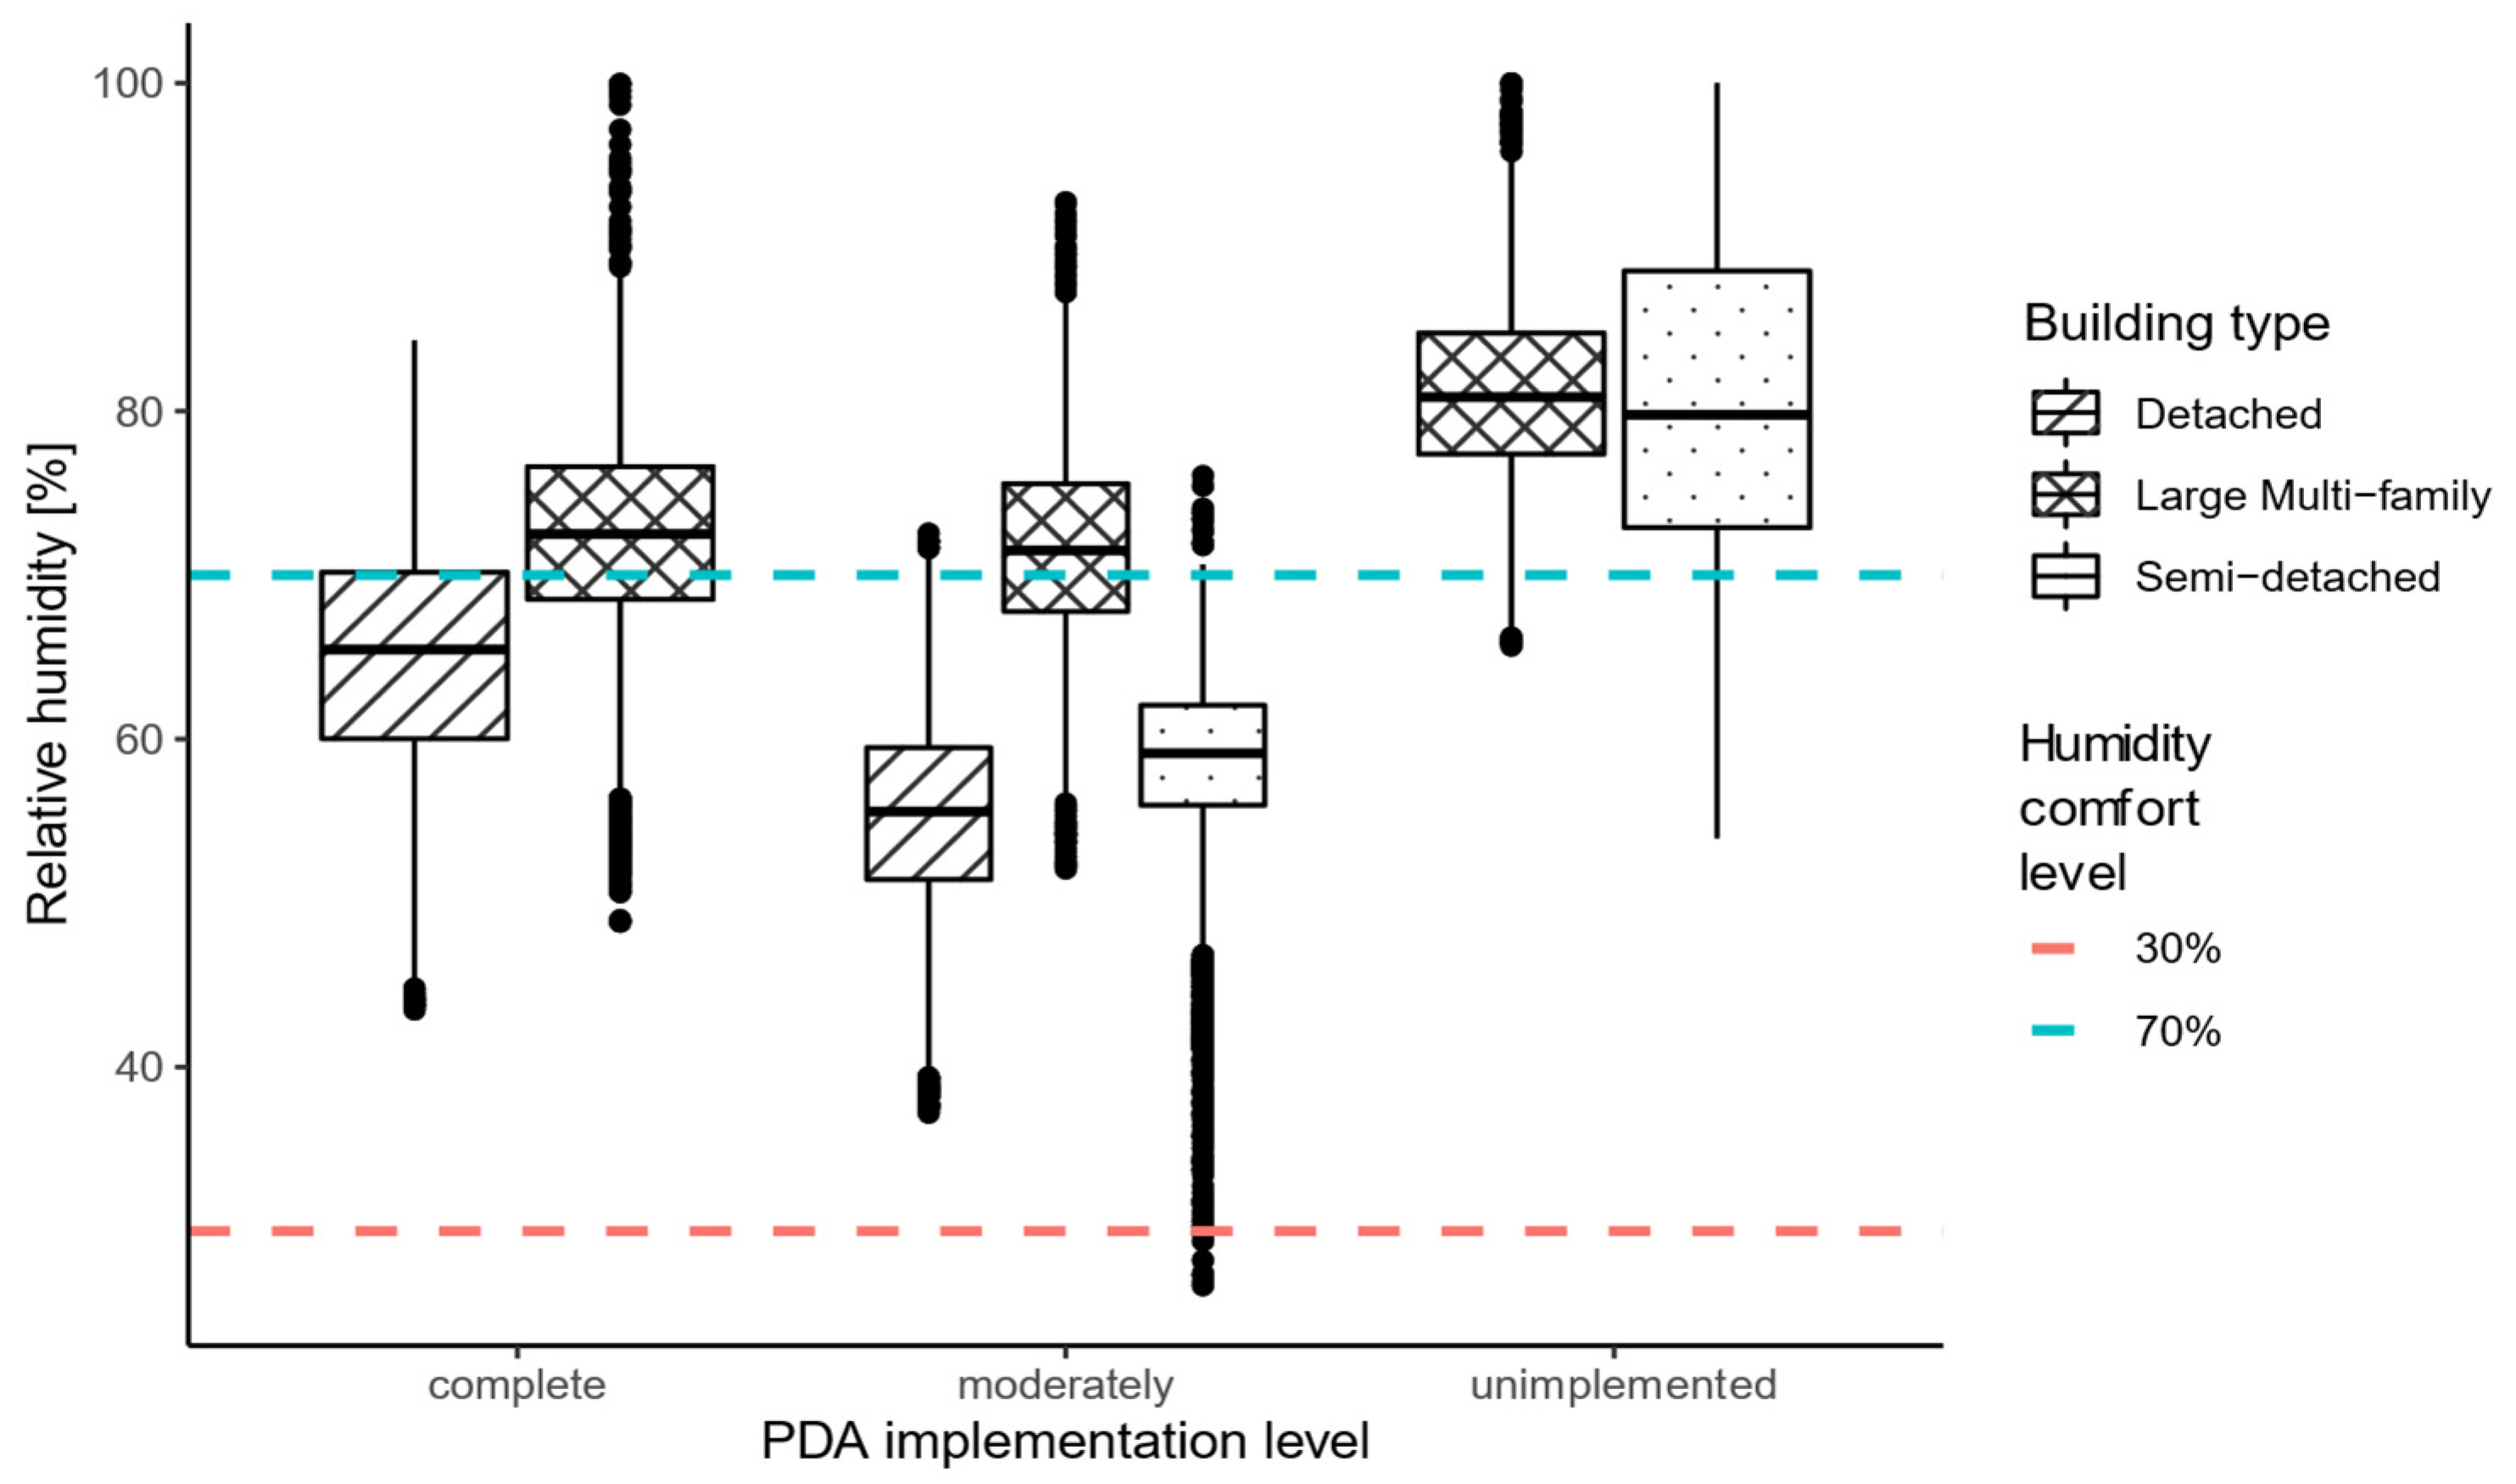
3.1.2. Humidity
3.2. Indoor Air Quality Monitoring Results
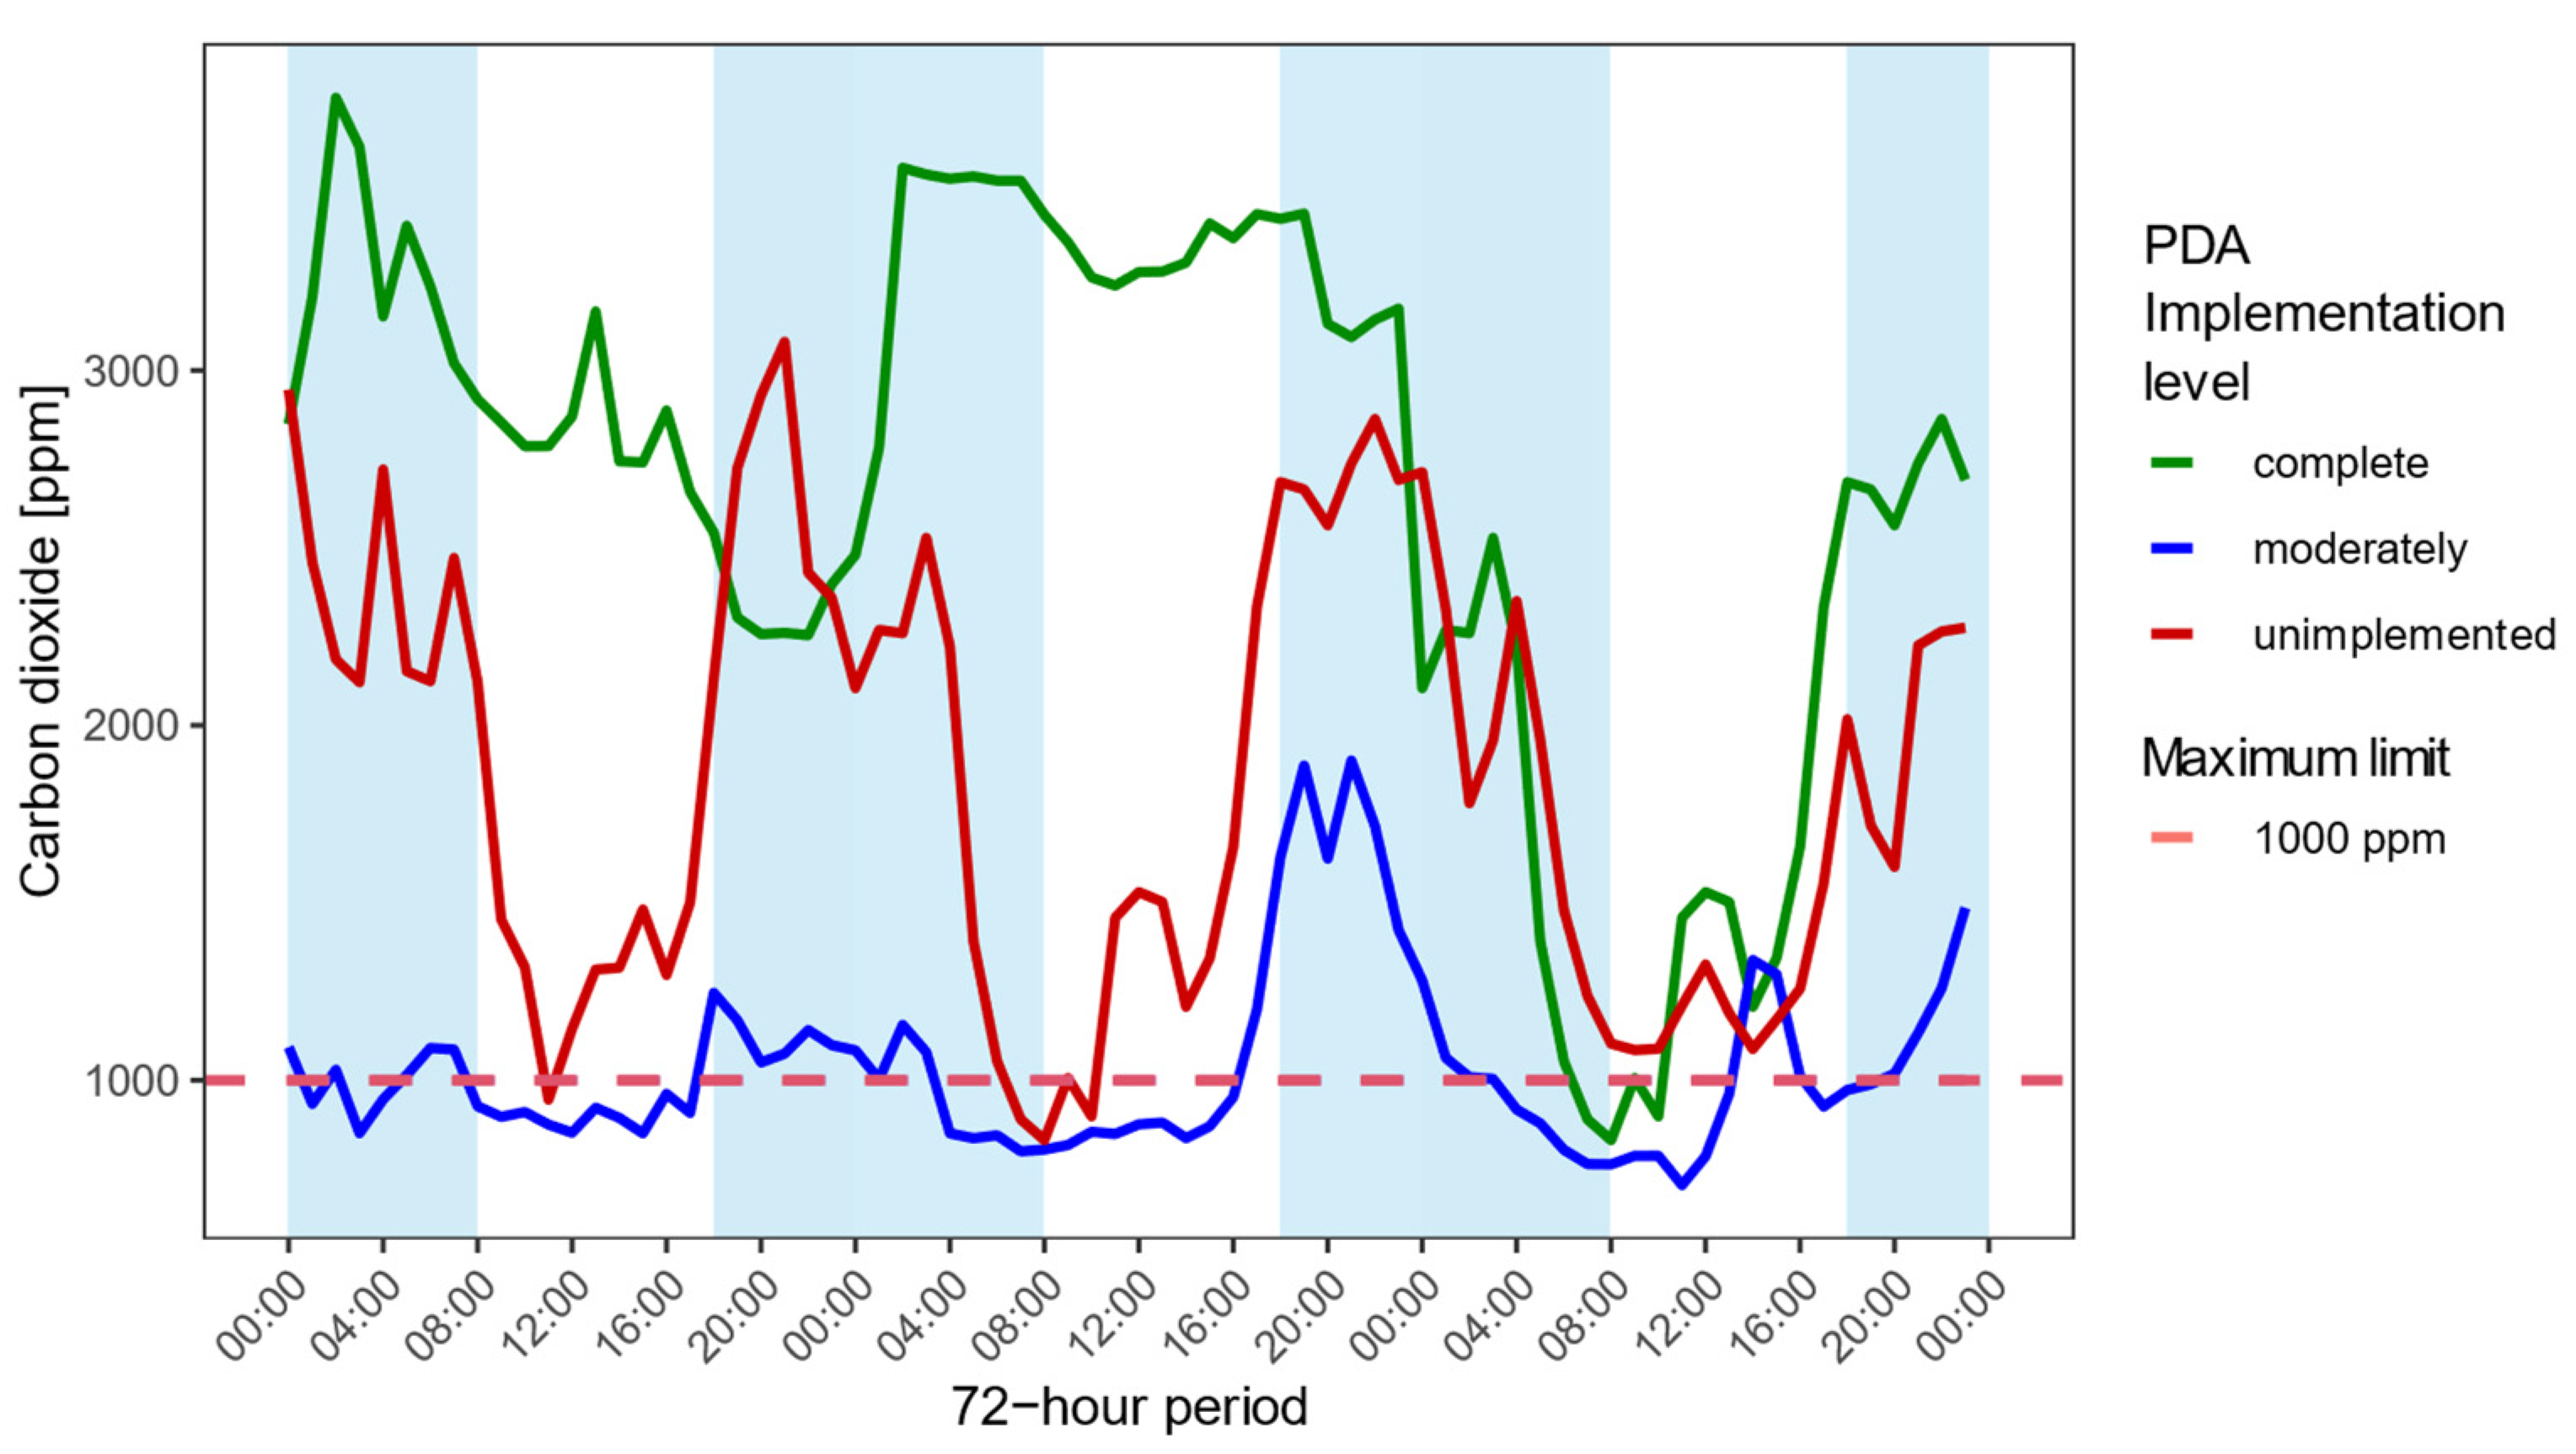
3.2.1. Carbon Dioxide
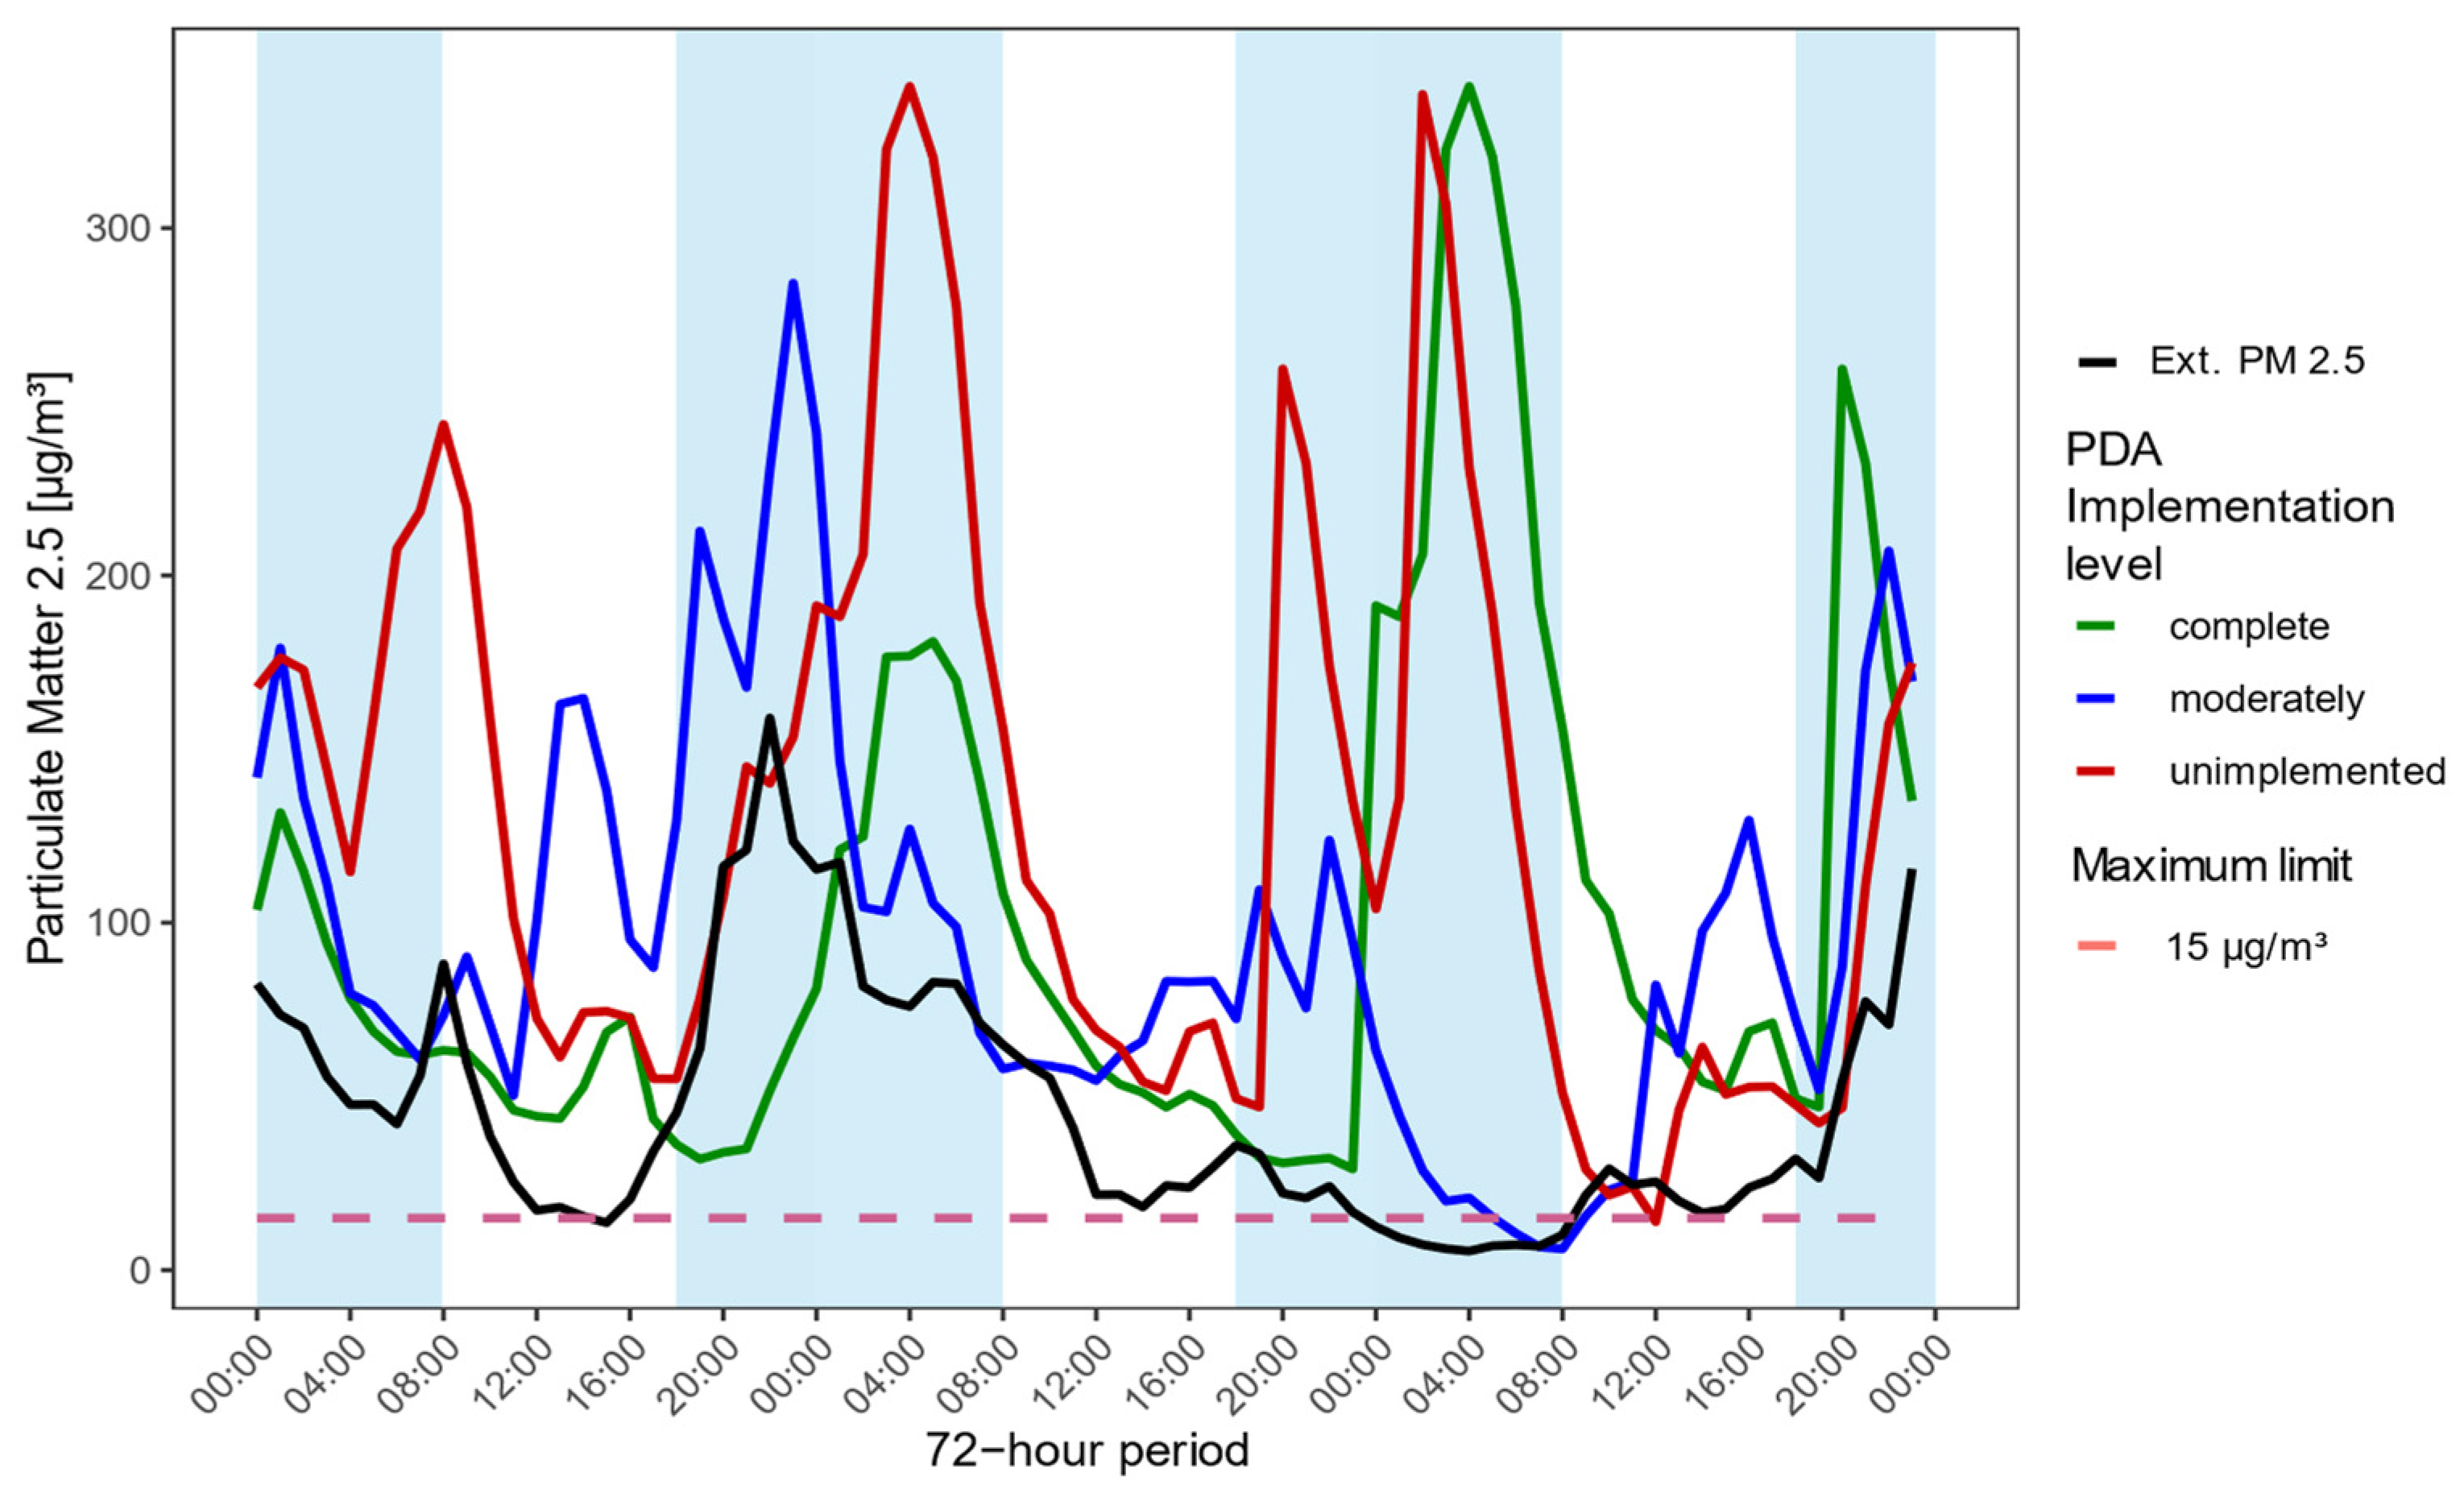
3.2.2. Particulate Matter 2.5 (PM 2.5)
4. Discussion
4.1. Hygrothermal Conditions
4.2. Indoor Air Quality Conditions
5. Conclusions
Author Contributions
Funding
Institutional Review Board Statement
Informed Consent Statement
Data Availability Statement
Conflicts of Interest
References
- Pylsy, P.; Lylykangas, K.; Kurnitski, J. Buildings’ Energy Efficiency Measures Effect on CO2 Emissions in Combined Heating, Cooling and Electricity Production. Renew. Sustain. Energy Rev. 2020, 134, 110299. [Google Scholar] [CrossRef]
- Li, J.; Colombier, M. Managing Carbon Emissions in China through Building Energy Efficiency. J. Environ. Manag. 2009, 90, 2436–2447. [Google Scholar] [CrossRef] [PubMed]
- Mostafavi, F.; Tahsildoost, M.; Zomorodian, Z.S. Energy Efficiency and Carbon Emission in High-Rise Buildings: A Review (2005–2020). Build. Environ. 2021, 206, 108329. [Google Scholar] [CrossRef]
- Ahmed, A.; Ge, T.; Peng, J.; Yan, W.C.; Tee, B.T.; You, S. Assessment of the Renewable Energy Generation towards Net-Zero Energy Buildings: A Review. Energy Build. 2022, 256, 111755. [Google Scholar] [CrossRef]
- Wang, Z.; Zhao, J.; Li, M. Analysis and Optimization of Carbon Trading Mechanism for Renewable Energy Application in Buildings. Renew. Sustain. Energy Rev. 2017, 73, 435–451. [Google Scholar] [CrossRef]
- Chel, A.; Kaushik, G. Renewable Energy Technologies for Sustainable Development of Energy Efficient Building. Alex. Eng. J. 2018, 57, 655–669. [Google Scholar] [CrossRef]
- Kuwahara, R.; Kim, H.; Sato, H. Evaluation of Zero-Energy Building and Use of Renewable Energy in Renovated Buildings: A Case Study in Japan. Buildings 2022, 12, 561. [Google Scholar] [CrossRef]
- Poortinga, W.; Jiang, S.; Grey, C.; Tweed, C. Impacts of Energy-Efficiency Investments on Internal Conditions in Low-Income Households. Build. Res. Inf. 2018, 46, 653–667. [Google Scholar] [CrossRef]
- Martínez-Molina, A.; Tort-Ausina, I.; Cho, S.; Vivancos, J.L. Energy Efficiency and Thermal Comfort in Historic Buildings: A Review. Renew. Sustain. Energy Rev. 2016, 61, 70–85. [Google Scholar] [CrossRef]
- Hama Radha, C. Retrofitting for Improving Indoor Air Quality and Energy Efficiency in the Hospital Building. Sustainability 2023, 15, 3464. [Google Scholar] [CrossRef]
- Brasche, S.; Bischof, W. Daily Time Spent Indoors in German Homes—Baseline Data for the Assessment of Indoor Exposure of German Occupants. Int. J. Hyg. Environ. Health 2005, 208, 247–253. [Google Scholar] [CrossRef]
- Gonzalo, F.D.A.; Griffin, M.; Laskosky, J.; Yost, P.; González-lezcano, R.A. Assessment of Indoor Air Quality in Residential Buildings of New England through Actual Data. Sustainability 2022, 14, 739. [Google Scholar] [CrossRef]
- Van Tran, V.; Park, D.; Lee, Y.C. Indoor Air Pollution, Related Human Diseases, and Recent Trends in the Control and Improvement of Indoor Air Quality. Int. J. Environ. Res. Public Health 2020, 17, 2927. [Google Scholar] [CrossRef]
- Moreno-Rangel, A.; Sharpe, T.; McGill, G.; Musau, F. Indoor Air Quality in Passivhaus Dwellings: A Literature Review. Int. J. Environ. Res. Public Health 2020, 17, 4749. [Google Scholar] [CrossRef]
- Fernández-Agüera, J.; Dominguez-Amarillo, S.; Fornaciari, M.; Orlandi, F. TVOCs and PM 2.5 in Naturally Ventilated Homes: Three Case Studies in a Mild Climate. Sustainability 2019, 11, 6225. [Google Scholar] [CrossRef]
- Schibuola, L.; Tambani, C. Indoor Environmental Quality Classification of School Environments by Monitoring PM and CO2 Concentration Levels. Atmos. Pollut. Res. 2020, 11, 332–342. [Google Scholar] [CrossRef]
- Raymenants, J.; Geenen, C.; Budts, L.; Thibaut, J.; Thijssen, M.; De Mulder, H.; Gorissen, S.; Craessaerts, B.; Laenen, L.; Beuselinck, K.; et al. Indoor Air Surveillance and Factors Associated with Respiratory Pathogen Detection in Community Settings in Belgium. Nat. Commun. 2023, 14, 1332. [Google Scholar] [CrossRef] [PubMed]
- López, L.R.; Dessì, P.; Cabrera-Codony, A.; Rocha-Melogno, L.; Kraakman, B.; Naddeo, V.; Balaguer, M.D.; Puig, S. CO2 in Indoor Environments: From Environmental and Health Risk to Potential Renewable Carbon Source. Sci. Total Environ. 2023, 856, 159088. [Google Scholar] [CrossRef]
- Allen, J.G.; MacNaughton, P.; Satish, U.; Santanam, S.; Vallarino, J.; Spengler, J.D. Associations of Cognitive Function Scores with Carbon Dioxide, Ventilation, and Volatile Organic Compound Exposures in Office Workers: A Controlled Exposure Study of Green and Conventional Office Environments. Environ. Health Perspect. 2016, 124, 805–812. [Google Scholar] [CrossRef]
- Campos, P.M.D.; Esteves, A.F.; Leitão, A.A.; Pires, J.C.M. Design of Air Quality Monitoring Network of Luanda, Angola: Urban Air Pollution Assessment. Atmos. Pollut. Res. 2021, 12, 101128. [Google Scholar] [CrossRef]
- World Health Organization. WHO Global Air Quality Guidelines; World Health Organization: Geneva, Switzerland, 2021; ISBN 9789240034228. [Google Scholar]
- Haleem, A.; Al-Obaidy, A.H.; Haleem, S. Air Quality Assessment of Some Selected Hospitals within Baghdad City. Eng. Technol. J. 2019, 37, 59–63. [Google Scholar] [CrossRef]
- Nurhafizhah, T.; Susilowati, I.H.; Hasiholan, B.P.; Tulaeka, A.R. The Chemical and Physical Parameters as Indicator of Office Air Quality at PT X Coal Mining Company. Indian J. Forensic Med. Toxicol. 2021, 15, 1596–1599. [Google Scholar] [CrossRef]
- Konduracka, E.; Rostoff, P. Links between Chronic Exposure to Outdoor Air Pollution and Cardiovascular Diseases: A Review. Environ. Chem. Lett. 2022, 20, 2971–2988. [Google Scholar] [CrossRef]
- Manisalidis, I.; Stavropoulou, E.; Stavropoulos, A.; Bezirtzoglou, E. Environmental and Health Impacts of Air Pollution: A Review. Front. Public Health 2020, 8, 14. [Google Scholar] [CrossRef] [PubMed]
- Münzel, T.; Hahad, O.; Daiber, A.; Lelieveld, J. Air Pollution and Cardiovascular Diseases. Herz 2021, 46, 120–128. [Google Scholar] [CrossRef] [PubMed]
- Kim, K.H.; Jahan, S.A.; Kabir, E. A Review on Human Health Perspective of Air Pollution with Respect to Allergies and Asthma. Environ. Int. 2013, 59, 41–52. [Google Scholar] [CrossRef] [PubMed]
- Wimalasena, N.N.; Chang-Richards, A.; Wang, K.I.K.; Dirks, K.N. Housing Risk Factors Associated with Respiratory Disease: A Systematic Review. Int. J. Environ. Res. Public Health 2021, 18, 2815. [Google Scholar] [CrossRef]
- Rumchev, K.; Zhao, Y.; Spickett, J. Health Risk Assessment of Indoor Air Quality, Socioeconomic and House Characteristics on Respiratory Health among Women and Children of Tirupur, South India. Int. J. Environ. Res. Public Health 2017, 14, 429. [Google Scholar] [CrossRef]
- Macmillan, A.; Davies, M.; Shrubsole, C.; Luxford, N.; May, N.; Chiu, L.F.; Trutnevyte, E.; Bobrova, Y.; Chalabi, Z. Integrated Decision-Making about Housing, Energy and Wellbeing: A Qualitative System Dynamics Model. Environ. Health 2016, 15, 23–34. [Google Scholar] [CrossRef]
- Ferguson, L.; Taylor, J.; Zhou, K.; Shrubsole, C.; Symonds, P.; Davies, M.; Dimitroulopoulou, S. Systemic Inequalities in Indoor Air Pollution Exposure in London, UK. Build. Cities 2021, 2, 425–448. [Google Scholar] [CrossRef]
- Taylor, J.; Shrubsole, C.; Symonds, P.; Mackenzie, I.; Davies, M. Application of an Indoor Air Pollution Metamodel to a Spatially-Distributed Housing Stock. Sci. Total Environ. 2019, 667, 390–399. [Google Scholar] [CrossRef]
- Ministerio de Vivienda y Urbanismo—MINVU. Construcción + PDA Temuco y Padre Las Casas; Ministerio de Vivienda y Urbanismo—MINVU: Santiago, Chile, 2018.
- Ministerio del Medio Ambiente. PDA Para Las Comunas de Temuco y Padre Las Casas; MMA: Santiago, Chile, 2015.
- Ministerio de Vivienda y Urbanismo—MINVU. Estándares de Construcción Sustentable Para Viviendas, Tomo I: Salud y Bienestar; MINVU: Santiago, Chile, 2018; ISBN 9789569432521.
- Hattori, S.; Iwamatsu, T.; Miura, T.; Tsutsumi, F.; Tanaka, N. Investigation of Indoor Air Quality in Residential Buildings by Measuring CO2 Concentration and a Questionnaire Survey. Sensors 2022, 22, 7331. [Google Scholar] [CrossRef]
- Martinez-Soto, A.; Avendaño Vera, C.C.; Boso, A.; Hofflinger, A.; Shupler, M. Energy Poverty Influences Urban Outdoor Air Pollution Levels during COVID-19 Lockdown in South-Central Chile. Energy Policy 2021, 158, 112571. [Google Scholar] [CrossRef]
- Boso, À.; Martínez, A.; Somos, M.; Álvarez, B.; Avedaño, C.; Hofflinger, Á. No Country for Old Men. Assessing Socio-Spatial Relationships between Air Quality Perceptions and Exposures in Southern Chile. Appl. Spat. Anal. Policy 2022, 15, 1219–1236. [Google Scholar] [CrossRef]
- Mardones, C.; Cornejo, N. Ex-Post Evaluation of Environmental Decontamination Plans on Air Quality in Chilean Cities. J. Environ. Manag. 2020, 256, 109929. [Google Scholar] [CrossRef]
- Chakraborty, R.; Heydon, J.; Mayfield, M.; Mihaylova, L. Indoor Air Pollution from Residential Stoves: Examining the Flooding of Particulate Matter into Homes during Real-World Use. Atmosphere 2020, 11, 1326. [Google Scholar] [CrossRef]
- Reyes, R.; Schueftan, A.; Ruiz, C.; González, A.D. Controlling Air Pollution in a Context of High Energy Poverty Levels in Southern Chile: Clean Air but Colder Houses? Energy Policy 2019, 124, 301–311. [Google Scholar] [CrossRef]
- Peng, P.; Gong, G.; Mei, X.; Liu, J.; Wu, F. Investigation on Thermal Comfort of Air Carrying Energy Radiant Air-Conditioning System in South-Central China. Energy Build. 2019, 182, 51–60. [Google Scholar] [CrossRef]
- Yang, B.; Wu, M.; Li, Z.; Yao, H.; Wang, F. Thermal Comfort and Energy Savings of Personal Comfort Systems in Low Temperature Office: A Field Study. Energy Build. 2022, 270, 112276. [Google Scholar] [CrossRef]
- Yang, L.; Zhao, S.; Gao, S.; Zhang, H.; Arens, E.; Zhai, Y. Gender Differences in Metabolic Rates and Thermal Comfort in Sedentary Young Males and Females at Various Temperatures. Energy Build. 2021, 251, 111360. [Google Scholar] [CrossRef]
- Lim, A.Y.; Yoon, M.; Kim, E.H.; Kim, H.A.; Lee, M.J.; Cheong, H.K. Effects of Mechanical Ventilation on Indoor Air Quality and Occupant Health Status in Energy-Efficient Homes: A Longitudinal Field Study. Sci. Total Environ. 2021, 785, 147324. [Google Scholar] [CrossRef] [PubMed]
- Ogbuagu, T.C.C.; Linden, E.; MacCutcheon, D.; Nilsson, E.; Persson, T.; Kabanshi, A. On the Performance of Diffuse Ceiling Ventilation in Classrooms: A Pre-Occupancy Study at a School in Southern Sweden. Sustainability 2023, 15, 2546. [Google Scholar] [CrossRef]
- López-Chao, V.; Lorenzo, A.A.; Saorín, J.L.; De La Torre-Cantero, J.; Melián-Díaz, D. Classroom Indoor Environment Assessment through Architectural Analysis for the Design of Efficient Schools. Sustainability 2020, 12, 2020. [Google Scholar] [CrossRef]
- Vukmirovic, M.; Salaj, A.T.; Sostaric, A. Challenges of the Facilities Management and Effects on Indoor Air Quality. Case Study “Smelly Buildings” in Belgrade, Serbia. Sustainability 2021, 13, 240. [Google Scholar] [CrossRef]
- Yang, S.; Mahecha, S.D.; Moreno, S.A.; Licina, D. Integration of Indoor Air Quality Prediction into Healthy Building Design. Sustainability 2022, 14, 7890. [Google Scholar] [CrossRef]


| ID | Living Area [m2] | Building Type | Heating Systems | Energy Consumption for Heating [kWh/m2a] | PDA Implementation Level |
|---|---|---|---|---|---|
| DB01 | 128 | Detached | Pellet stove | 40 | Implemented |
| LB02 | 42 | Large Multi-Family | Electric heater | 82 | Implemented |
| LB03 | 42 | Large Multi-Family | Electric heater | 51 | Implemented |
| DB04 | 50 | Detached | Wood stove | 71 | Implemented |
| LC05 | 128 | Large Multi-Family | Portable gas heater | 48 | Implemented |
| LB06 | 60 | Large Multi-Family | Portable kerosene heater | 55 | Moderately implemented |
| ST07 | 55 | Semi-Detached | Wood stove | 331 | Moderately implemented |
| DT08 | 90 | Detached | Pellet stove | 77 | Moderately implemented |
| SB09 | 50 | Semi-Detached | Wood stove | 342 | Unimplemented |
| SB10 | 50 | Semi-Detached | Wood stove | 513 | Unimplemented |
| LB11 | 52 | Large Multi-Family | Electric heater | 59 | Unimplemented |
| Classification | Nomenclature | Variable | Limits |
|---|---|---|---|
| Hygrothermal comfort | T | Temperature | 19–25 °C |
| HR | Humidity | 30−70% | |
| Air pollutant concentrations | CO2 | Carbon dioxide | <1000 ppm |
| PM 2.5 | Fine particulate matter | <15 µg/m3 |
| PDA | Detached | LMF | Semi-Detached | |||||||||
|---|---|---|---|---|---|---|---|---|---|---|---|---|
| Implementation Level | Mean | sd | Skew | cv (%) | Mean | sd | Skew | cv (%) | Mean | sd | Skew | cv (%) |
| Complete | 18.03 | 2.17 | −0.90 | 12.04 | 16.21 | 2.22 | 0.01 | 13.71 | n/a | n/a | n/a | n/a |
| Moderately | 20.60 | 3.52 | 0.26 | 17.08 | 16.12 | 0.87 | −0.06 | 5.41 | 18.92 | 2.44 | 2.29 | 12.90 |
| Unimplemented | n/a | n/a | n/a | n/a | 14.57 | 1.71 | −0.32 | 11.75 | 14.57 | 2.86 | −0.50 | 19.62 |
| PDA Implementation Level | Detached | LMF | Semi-Detached | |||||||||
|---|---|---|---|---|---|---|---|---|---|---|---|---|
| Mean | sd | Skew | cv (%) | Mean | sd | Skew | cv (%) | Mean | sd | Skew | cv (%) | |
| Complete | 64.82 | 7.19 | −0.34 | 11.09 | 72.40 | 6.01 | −0.19 | 8.30 | n/a | n/a | n/a | n/a |
| Moderately | 55.60 | 6.11 | 0.07 | 10.99 | 71.73 | 5.89 | 0.05 | 8.21 | 58.47 | 5.74 | −1.30 | 9.82 |
| Unimplemented | n/a | n/a | n/a | n/a | 80.95 | 5.35 | −0.03 | 6.61 | 81.80 | 11.06 | 0.41 | 13.53 |
| PDA Implementation Level | Detached | LMF | Semi-Detached | |||||||||
|---|---|---|---|---|---|---|---|---|---|---|---|---|
| Mean | sd | Skew | cv (%) | Mean | sd | Skew | cv (%) | Mean | sd | Skew | cv (%) | |
| Complete | 4494.9 | 674.9 | −1.02 | 15.0 | 1936.4 | 1387.8 | 1.1 | 71.7 | n/a | n/a | n/a | n/a |
| Moderately | 995.2 | 410.5 | 4.09 | 41.3 | 999.6 | 533.8 | 2.60 | 53.4 | 981.8 | 314.1 | 1.9 | 31.99 |
| Unimplemented | n/a | n/a | n/a | n/a | 1851.2 | 1348.8 | 0.89 | 72.8 | 1762 | 1004.8 | 0.77 | 57.01 |
| PDA Implementation Level | Detached | LMF | Semi-Detached | |||||||||
|---|---|---|---|---|---|---|---|---|---|---|---|---|
| Mean | sd | Skew | cv (%) | Mean | sd | Skew | cv (%) | Mean | sd | Skew | cv (%) | |
| Complete | 44.40 | 42.95 | 2.26 | 96.74 | 63.19 | 64.63 | 2.18 | 102.28 | n/a | n/a | n/a | n/a |
| Moderately | 64.66 | 48.19 | 2.16 | 74.52 | 98.81 | 102.84 | 1.90 | 104.08 | 73.95 | 52.22 | 1.52 | 70.61 |
| Unimplemented | n/a | n/a | n/a | n/a | 70.48 | 70.60 | 1.90 | 100.17 | 130.00 | 159.37 | 2.40 | 122.59 |
Disclaimer/Publisher’s Note: The statements, opinions and data contained in all publications are solely those of the individual author(s) and contributor(s) and not of MDPI and/or the editor(s). MDPI and/or the editor(s) disclaim responsibility for any injury to people or property resulting from any ideas, methods, instructions or products referred to in the content. |
© 2024 by the authors. Licensee MDPI, Basel, Switzerland. This article is an open access article distributed under the terms and conditions of the Creative Commons Attribution (CC BY) license (https://creativecommons.org/licenses/by/4.0/).
Share and Cite
Martinez-Soto, A.; Jimenez-Gallardo, C.; Villarroel-Lopez, A.; Reyes-Riveros, A.; Höhl, J. Toward Sustainable Indoor Environments: Assessing the Impact of Thermal Insulation Measures on Air Quality in Buildings—A Case Study in Temuco, Chile. Sustainability 2024, 16, 547. https://doi.org/10.3390/su16020547
Martinez-Soto A, Jimenez-Gallardo C, Villarroel-Lopez A, Reyes-Riveros A, Höhl J. Toward Sustainable Indoor Environments: Assessing the Impact of Thermal Insulation Measures on Air Quality in Buildings—A Case Study in Temuco, Chile. Sustainability. 2024; 16(2):547. https://doi.org/10.3390/su16020547
Chicago/Turabian StyleMartinez-Soto, Aner, Carlos Jimenez-Gallardo, Andrés Villarroel-Lopez, Alejandro Reyes-Riveros, and Johanna Höhl. 2024. "Toward Sustainable Indoor Environments: Assessing the Impact of Thermal Insulation Measures on Air Quality in Buildings—A Case Study in Temuco, Chile" Sustainability 16, no. 2: 547. https://doi.org/10.3390/su16020547