Article

Does New Urbanization Promote Urban Metabolic Efficiency?

College of Management, Guizhou University, Guiyang 550025, China
Sustainability 2024, 16(2), 564; https://doi.org/10.3390/su16020564
Submission received: 5 November 2023 / Revised: 30 November 2023 / Accepted: 12 December 2023 / Published: 9 January 2024

Abstract

:
Existing studies have paid less attention to the impact of new urbanization (NU) on urban metabolic efficiency (UME). This paper empirically tests the mechanism and the effect of NU on UME based on China’s panel data from 2008 to 2020, using China’s NU pilot as a quasi-natural experiment. The study draws the following conclusions: (1) NU can significantly promote UME. (2) NU can promote UME for cities in neighboring regions. (3) The effect of NU on UME presents the heterogeneous characteristics of eastern region > central region > western region, non-urban agglomeration cities > urban agglomeration cities, and is greater in central cities than in non-central cities. (4) Mechanism analysis shows that NU can promote UME through six paths: promoting urban–rural integration and regional synergistic development, reducing urban sprawl and energy mismatch, strengthening urban–rural population mobility, and green innovation division of labor. The above results are not only conducive to incorporating UME into NU’s appraisal system but also to making UME, which can reflect the quality of urban development in a more comprehensive and systematic way, a performance measurement tool for NU.

1. Introduction

The search for an economic growth model that utilizes resources more efficiently and sustainably has become a focus of interest in the academic community due to the dual pressures of increasing global environmental degradation and the issue of resource depletion [1]. Cities are the main arenas for promoting low-carbon economic development, addressing environmental pollution, and mitigating resource wastage, as they aggregate 70% of the world’s industrial activity, providing 75% of the world’s natural resource output and emitting 75% of the world’s carbon dioxide [2]. In order to assess and optimize the resource use performance of cities, many scholars have focused on topics such as urban green sustainable development and urban low-carbon transformation and upgrading [3,4]. Scholars represented by Wolman (1965) proposed the idea of urban metabolic efficiency (UME) and attempted to view the city as an organism with metabolic functions [5]. In this context, the functioning of the city is defined as the process by which the urban system acquires material and energy inputs, transforms them into the basic substances needed for urban development, and discharges waste. The introduction of UME provides a clear perspective for the analysis of the resource conversion process in cities, which is of great significance for further exploring the bottlenecks in resource utilization and reducing pollution emissions; therefore, it has been frequently used as an important tool for measuring the sustainable development capability of cities and assessing the superiority of urban development models in recent years [6,7].
There are two main branches of existing literature on UME. The first one uses UME as an important tool for analyzing urban ecosystems and explores the analysis of metabolic fluxes, metabolic efficiency, and metabolic process disorders to identify the main causes of unhealthy urban systems [8,9,10]. The second strand of literature uses UME as a proxy variable for sustainable urban development and explores a range of factors that influence UME, such as economic development and industrial integration [11,12]. Obviously, these studies have laid an important foundation for academics to use UME to explore the issue of sustainable urban development, but there are still shortcomings, because these studies only focus on the impact of individual micro-factors within the city on UME, and fewer studies pay attention to the impact of urban development policy on UME. New urbanization (NU) is a special policy for China’s urban development, aimed at compensating for the crude economic growth and the urban–rural dichotomy caused by the “material-based” traditional urbanization, the specific content of which includes promoting the citizenship of the agricultural transfer population, and facilitating coordinated development with urban agglomerations as the main form, as well as large, medium-sized, and small cities, and medium-sized and small towns [13,14,15]. Although NU was developed by the Chinese government, its connotations are similar to those of green urbanization in Singapore [16], the newest towns in Poland and Hungary [17], and re-urbanization in regenerated areas of Manchester and Glasgow [18], i.e., urban development policies that emphasize the intensive use of land elements, sustainable use of resources, and the requirement for urban–rural integration. In fact, a large number of Chinese experiences have shown that the unidirectional flow of factors due to the urban–rural dichotomy structure and the crude economic growth model with heavy industry as the dominant industry may be the key to the serious waste of urban resources and environmental pollution [19,20]. At the same time, the important role of NU in breaking the urban–rural dichotomy, changing the crude economic growth model, and promoting the development of urban agglomerations has also been widely recognized by academics [21,22,23]. However, there is still a gap in research on the impact of NU on UME. Therefore, it is necessary to further empirically examine the importance of the NU’s impact effect on UME [15,24,25].
The aim of this paper was to answer the question of how NU affects UME. To answer this question, this paper uses China’s NU pilot policy as a quasi-natural experiment, and comprehensively examines the direct impact effects, spatial effects, heterogeneity characteristics, and mechanisms of NU affecting UME, using panel data for 284 Chinese cities from 2008 to 2020. The marginal contribution of this paper is as follows: First, this paper reveals the effect of NU on UME, which not only verifies the effectiveness of China’s NU policy but also provides Chinese solutions for other countries facing sustainable urbanization problems. Second, this paper reveals the mechanism by which NU promotes UME by facilitating urban–rural integration and regional synergy, reducing urban sprawl and energy mismatch, accelerating urban–rural population mobility, and greening the innovative division of labor, and these findings are conducive to providing a basic pathway to optimize UME for China and other countries relying on NU. Finally, this paper contributes to the use of UME as a tool to test the performance of NU pilot policies, complementing the limitations of existing research in academia that analyses the effects of NU from a single eco-economic or environmental perspective.

2. Policy Background and Theoretical Analysis

2.1. Policy Context

To cope with the severe challenges posed by crude urbanization and achieve the goal of “people-oriented“ urbanization, the report of the 18th Party Congress in 2012 put forward for the first time the development idea of “new urbanization” and established it as a new driving force for China’s future economic growth. In the same year, the Central Economic Work Conference listed “actively and steadily advancing urbanization and striving to improve the quality of urbanization” as one of the six major tasks of the economic work in 2013. In 2014, the State Council promulgated the National New Urbanization Plan (2014–2020) and for the first time set “ecological civilization, green and low-carbon” as the basic principle to formulate the development path, main objectives, and strategic tasks of China’s new urbanization, which has since set off a wave of NU nationwide. In 2014, the National Development and Reform Commission and 11 other departments jointly issued a list of the first batch of NU pilot cities, requiring 62 cities (towns) to achieve stage-by-stage results in each pilot task by 2017 and to form replicable and scalable experiences. In 2015 and 2016, 59 cities (towns) and 111 cities (towns) were approved as the second and third batch of NU pilot areas, respectively, accumulating successful pilot experiences for the nationwide rollout of NU in 2020. Since then, all three batches of NU pilot cities have entered the pilot construction phase, and unlike the first batch of pilot cities, the selection of the second and third batches of pilot cities has focused more on tilting towards the central-western and northeastern regions. Promoting sustainable urban development has been an important element of the National 14th Five-Year Plan for New Urbanization. The fifth major task of the Comprehensive Pilot Program for National New Urbanization also explicitly states that it is necessary to achieve the construction of low-carbon cities as an important goal and to comprehensively promote the reform and innovation of institutional mechanisms. According to China’s NU pilot construction experience published by the National Development and Reform Commission, in recent years, China’s various NU pilots have actively promoted local energy conservation and emission reduction, and have achieved significant results in controlling the construction of high-energy-consuming projects, introducing green and high-quality projects, improving the efficiency of resource utilization, and improving the quality of the eco-environment.

2.2. Theoretical Analysis

2.2.1. Impact of NU on UME

By definition, the ability of an urban system to process inputs and outputs determines UME. Meanwhile, reviewing China’s traditional “material-oriented” urbanization development history demonstrates that inefficient UME is mostly caused by unequal public services, constrained factor flows, and unclear principal purposes [26,27,28]. Therefore, this paper analyzes the impact of NU on UME from both the input and output side of the urban system. On the input side of the urban system, both resource scarcity and resource redundancy prevent the urban system’s UME from reaching the Pareto optimum plane [29,30]. However, inequality in public services will contribute to the continued flow of basic factors of production, such as capital and labor, from the countryside to the towns and cities, ultimately leading to resource redundancy in the cities [31,32,33]. At the same time, low factor returns in less developed cities reinforce barriers to factor mobility and thus contribute to the scarcity of resources in some cities [34,35,36]. On the output side of the urban system, the lack of clarity in the main functions between urban and rural areas will lead to a lack of industrial support functions within the city [37,38] and intensify regional industrial homogeneous competition [39,40], thus reducing the expected output. NU is urbanization with urban–rural integration, industrial interaction, conservation and intensification, ecological livability, and harmonious development as its basic features [41,42]. In the process of NU policy implementation, national-level financial transfer payments [43,44], government subsidies [45,46], and tax incentives [47,48] will continue to enhance the degree of equalization of public services, the level of free flow of factors, and the supporting capacity of the main functions for the cities, and ultimately optimize the UME on the input side and the output side of the bidirectional [49,50,51]. In summary, hypothesis 1 is proposed.
Hypothesis 1: 
NU can promote UME.

2.2.2. Spillover Effects of NU on UME

Numerous studies have shown that pilot policies have some spatial spillover effects [52,53]. According to the “polarization-trickle-down” theory [54,55], the high demand for labor, capital, and other resources in the NU pilot cities will create a “siphon effect”, which will deprive the surrounding areas of resources for urban development [56,57]. At the same time, however, the management experience, advanced technology, and important policy implementation knowledge of the NU pilot cities will be transferred to the peripheral regions through the “trickle-down effect”, which will reduce the cost of trial and error in the surrounding areas [58,59]. According to the theory of externalities, on the one hand [60,61], the NU pilot cities may eliminate a large number of heavily polluting industries through industrial upgrading in the process of enhancing their own UME, thus reducing the UME of the surrounding areas through pollution transfer [62,63,64]; on the other hand, the improvement of public infrastructure and transport infrastructure in the NU pilot cities will reduce the cost of knowledge flow, thereby better serving as exemplary models and catalyzing agents, and thus enhancing the UME of the surrounding areas [65,66,67]. In summary, hypothesis 2 is proposed.
Hypothesis 2: 
There is a spatial spillover effect of NU on UME.

2.2.3. Mechanism of the NU Effect on UME

Deconstructing the National New Urbanization Plan (2014–2020) issued by the State Council based on the system science perspective reveals that NU is a major national systematic project with urban–rural integrated development and regional synergistic development as the goal orientation, smart growth theory and sustainable development concept as the outline guideline, and urban–rural factor mobility and regional innovation division of labor as the basic scheme [68,69]. Based on this logic, this paper tries to analyze the role mechanism of NU affecting UME from these three dimensions.
In terms of the target layer of NU, on the one hand, NU advocates breaking down the urban–rural dichotomy, strengthening urban–rural economic ties and interdependence, and eliminating the disparity between urban and rural areas by improving the rural social security system and strengthening the construction of service systems in the areas of education, culture, and health care [70,71]. On the other hand, NU aims to realize synergistic development of regional industries, infrastructure connectivity, and sharing of public service resources by strengthening regional cooperation and exchanges and giving full play to the advantages and characteristics of different regions [72,73]. Therefore, promoting urban–rural integration and fostering regional synergy is an important goal of new urbanization. Raising the level of urban–rural integration can speed up the creation of an integrated urban–rural ecological recycling system, enable resource sharing and recycling between urban and rural areas, reduce resource waste and consumption, and enhance the effectiveness of energy use and the ecological environment [74,75]. Increasing the level of regional synergistic development can strengthen the industrial division of labor and cooperation between cities and neighboring regions, create value chains with complementary advantages, encourage structural adjustment, transformation, and upgrading of the urban economy, and increase the total factor productivity of cities [76,77].
In terms of the standardized layer of NU, NU is a “people-oriented“ urbanization that follows a new path of intensification, energy conservation, and ecology. By putting the principles of smart growth and sustainable development into practice in NU, it is possible to manage urban land resources intensively [78,79,80] and use energy effectively [81,82,83], hence avoiding urban sprawl and energy mismatch. Urban sprawl reduction minimizes the efficiency of the urban metabolism in terms of outputs and inputs [84,85], while energy mismatch correction minimizes non-essential inputs into the urban system [86].
In terms of NU’s program layer, on the one hand, NU can narrow the gap between urban and rural areas through equalization of public services and benchmarking integration, encourage interactive dialogues between urban and rural populations, and guide the transfer and agglomeration of urban labor to rural areas [87,88]; on the other hand, NU can improve the level of interconnection of transportation, energy, information, and other elements between cities, thus promoting the green innovation division of labor between regions [89,90]. The increase in green innovation division of labor is conducive to sharing the costs of innovation and R&D, sharing the results of innovation, reducing the waste of urban innovation resources, and increasing the output of green technologies [91,92,93]. The increase in factor flows between urban and rural areas reduces the demand for energy, water resources, and raw materials in cities, thus reducing the pressure of resource consumption in cities [94,95].
Hypothesis 3: 
NU can promote UME through six paths: promoting urban–rural integration and regional synergistic development, reducing urban sprawl and energy mismatch, strengthening urban–rural population mobility, and green innovation division of labor.

3. Modeling and Variable Selection

3.1. Modeling

In this paper, we use an asymptotic double difference model to estimate the effect of NU on UME with the following baseline model setting:
U M E i t = β 0 + β 1 N U i t + β 2 C i t + σ i + γ t + ε i t
where the explained variable U M E i t denotes the UME of city i in year t . N U i t is a dummy variable that takes the value of 1 if city i is a NU pilot city in year t , and 0 otherwise. C i t denotes a series of control variables, including the level of urbanization, economic development, population density, public transportation, and fiscal decentralization. ε i t denotes the area fixed effect, γ t denotes the time fixed effect, and ε _ i t is the random disturbance term. β 0 is the regression coefficient of the constant term. β 1 reflects the effect of NU on UME. β 2 is the regression coefficient of the control variables.
To test the mechanism of NU on UME, the following regression model was constructed:
M i t = β 0 + β 1 N U i t + Z i t β + σ i + γ t + ε i t
where M i t is the mechanism variable and includes six variables in three dimensions. The rest of the variables have the same meaning as above.
To test the spatial spillover effect of NU, the following measurement equation is constructed based on Equation (1).
U M E i t = β 0 + β 1 N U i t + α j W i j N U j t + β 2 C i t + σ i + γ t + ε i t
where W i j denotes the spatial weight distance matrix. In order to improve the robustness of the results, this paper introduces a spatial neighboring geographic matrix, an inverse geographic distance matrix, and an economic–geographic nested geographic distance matrix, and the rest of the variables have the same meaning as above.

3.2. Variable Selection

3.2.1. Explained Variables

The explained variable in this paper is UME. The academic community has not reached a consensus on the measurement method of UME. This paper constructs the indicator system of UME from the three parts of resource inputs, desired outputs, and non-desired outputs [96], as shown in Table 1. Subsequently, the SBM model is used to measure the UME with the following equations:
ρ = 1 m i = 1 m x ¯ x i k 1 s 1 + s 2 l = 1 s 1 y l d ¯ y l 0 d ¯ + k = 1 s 2 y k u d ¯ y k 0 u ¯ s . t . x ¯ j = 1 , j j 0 n x i j λ i ;   y d ¯ j = 1 , j j 0 n y l j d λ j ; y u ¯ j = 1 , j j 0 n y k j d λ j ;   λ j 0 .   i = 1,2 , , m ; j = 1,2 , , n ; l = 1,2 , , s 1 ; k = 1,2 , , s 2
where n denotes the number of decision-making units, i.e., the number of cities, each DMU consists of inputs m, desired outputs s 1 and non-desired outputs s 2 ;   x , y d , and y u represent elements in the input matrix, desired output matrix, and non-desired output matrix, respectively. ρ is the UME.

3.2.2. Explanatory Variables

The main explanatory variables in this paper are the time dummy variable for the treatment period and the interaction term of the grouping variable for whether or not it is a pilot for NU. Specifically, with reference to the general practice of existing pilot analyses [97,98] the N U i t of city i in year t and subsequent years takes the value of 1 if city i is selected in the list of Wen’s new urbanization pilots in year t, and 0 otherwise.

3.2.3. Mechanism Variables

The mechanism variables of interest in this paper include urban–rural integrated development (URI), regional synergistic development (RSD), urban sprawl (US), Energy mismatch (EM), urban–rural population mobility (URPM), and inter-district green innovation division of labor (IDGIDL). Among them, the URI is expressed as the reciprocal of the urban–rural binary coefficient [99]. The measurement of RSD is completed by applying the efficiency value-added model [100]. The measurement of US is expressed through the ratio of the population growth rate to the land use growth rate [101]. The measurement of EM is expressed through the energy mismatch coefficient [102]. The level of URPM is expressed as the proportion of the non-rural population to the total household population [103]. IDGIDL is expressed as the Krugman index of green innovation patents [104].

3.2.4. Control Variables

This paper sets urbanization level (UB), economic development (ED), population density, (PD) public transportation (PT), and fiscal decentralization (FD) as control variables. UB can increase the level of infrastructure development and urban material utilization capacity, thus increasing UME, which is expressed in this paper as the ratio of non-farm employed population to all employed population. ED will increase the capacity of technological innovation and the intensity of environmental regulation, which contributes to optimizing energy efficiency and resource efficiency, thereby increasing UME, which is expressed in this paper using GDP per capita. PD improves the utilization of urban public facilities and promotes compactness in urban planning and sustainability in urban transportation, which helps to reduce resource wastage and environmental pollution, thereby increasing UME, which is expressed in this paper as the ratio of year-end household population to the size of the administrative area. PT reduces personal vehicle use and road congestion, reduces carbon emissions and air pollution, and thus promotes UME, which is expressed in this paper as the ratio of the number of buses to the resident population. FD increases the government’s financial autonomy and economic autonomy, which enables better deployment of public resources and thus promotes UME, which is expressed in this paper as the ratio of general government fiscal expenditures to general fiscal revenues.

3.3. Data Sources

The research object of this paper is 284 prefecture-level cities in China from 2008 to 2020, and the study area and division are shown in Figure 1. The green patent classification data come from the website of Wisdom Sprout, and the rest of the data come from the EPS database of the corresponding year, China Urban Statistical Yearbook, China Urban Construction Statistical Yearbook, statistical yearbooks of provinces and cities, statistical bulletins of cities and statistical bulletins of social development, and the database of GuoTaiAn. For a small amount of missing data, the linear trend method was utilized to fill in the gaps, and the indicators involving finance were deflated by the corresponding indices. Descriptive statistics of the relevant variables are shown in Table 2.

4. Analysis of Results

4.1. Trend Analysis of UME

After measuring UME using the SBM model, Figure 2 demonstrates the trend of UME over the study period. Overall, China’s UME shows a dynamic upward trend, which implies that it is meaningful to use China as an effective optimization tool for case-study UME. In terms of sub-region, China’s UME shows a graded differentiation pattern of eastern region > central region > western region, which is similar to China’s economic differentiation pattern and in line with China’s actual situation, indicating that the UME measured in this paper is relatively reasonable.

4.2. Benchmark Regression Results

Table 2 displays the regression results for the impact of NU on UME. The regression results with the stepwise inclusion of control variables are displayed in columns (1) through (6) of Table 3. According to the findings, whether or not control factors are included, NU is always significant at 1%. From column (1), it can be seen that UME is higher in the treatment group than in the control group by about 0.021 before and after being shocked by this policy of NU when other factors affecting UME are not controlled. From column (6), it can be seen that after controlling for other factors affecting UME, the treatment group’s UME is higher than the control group’s before and after being shocked by the policy of NU by about 0.024. This suggests that NU significantly promotes UME and hypothesis 1 is partially tested.

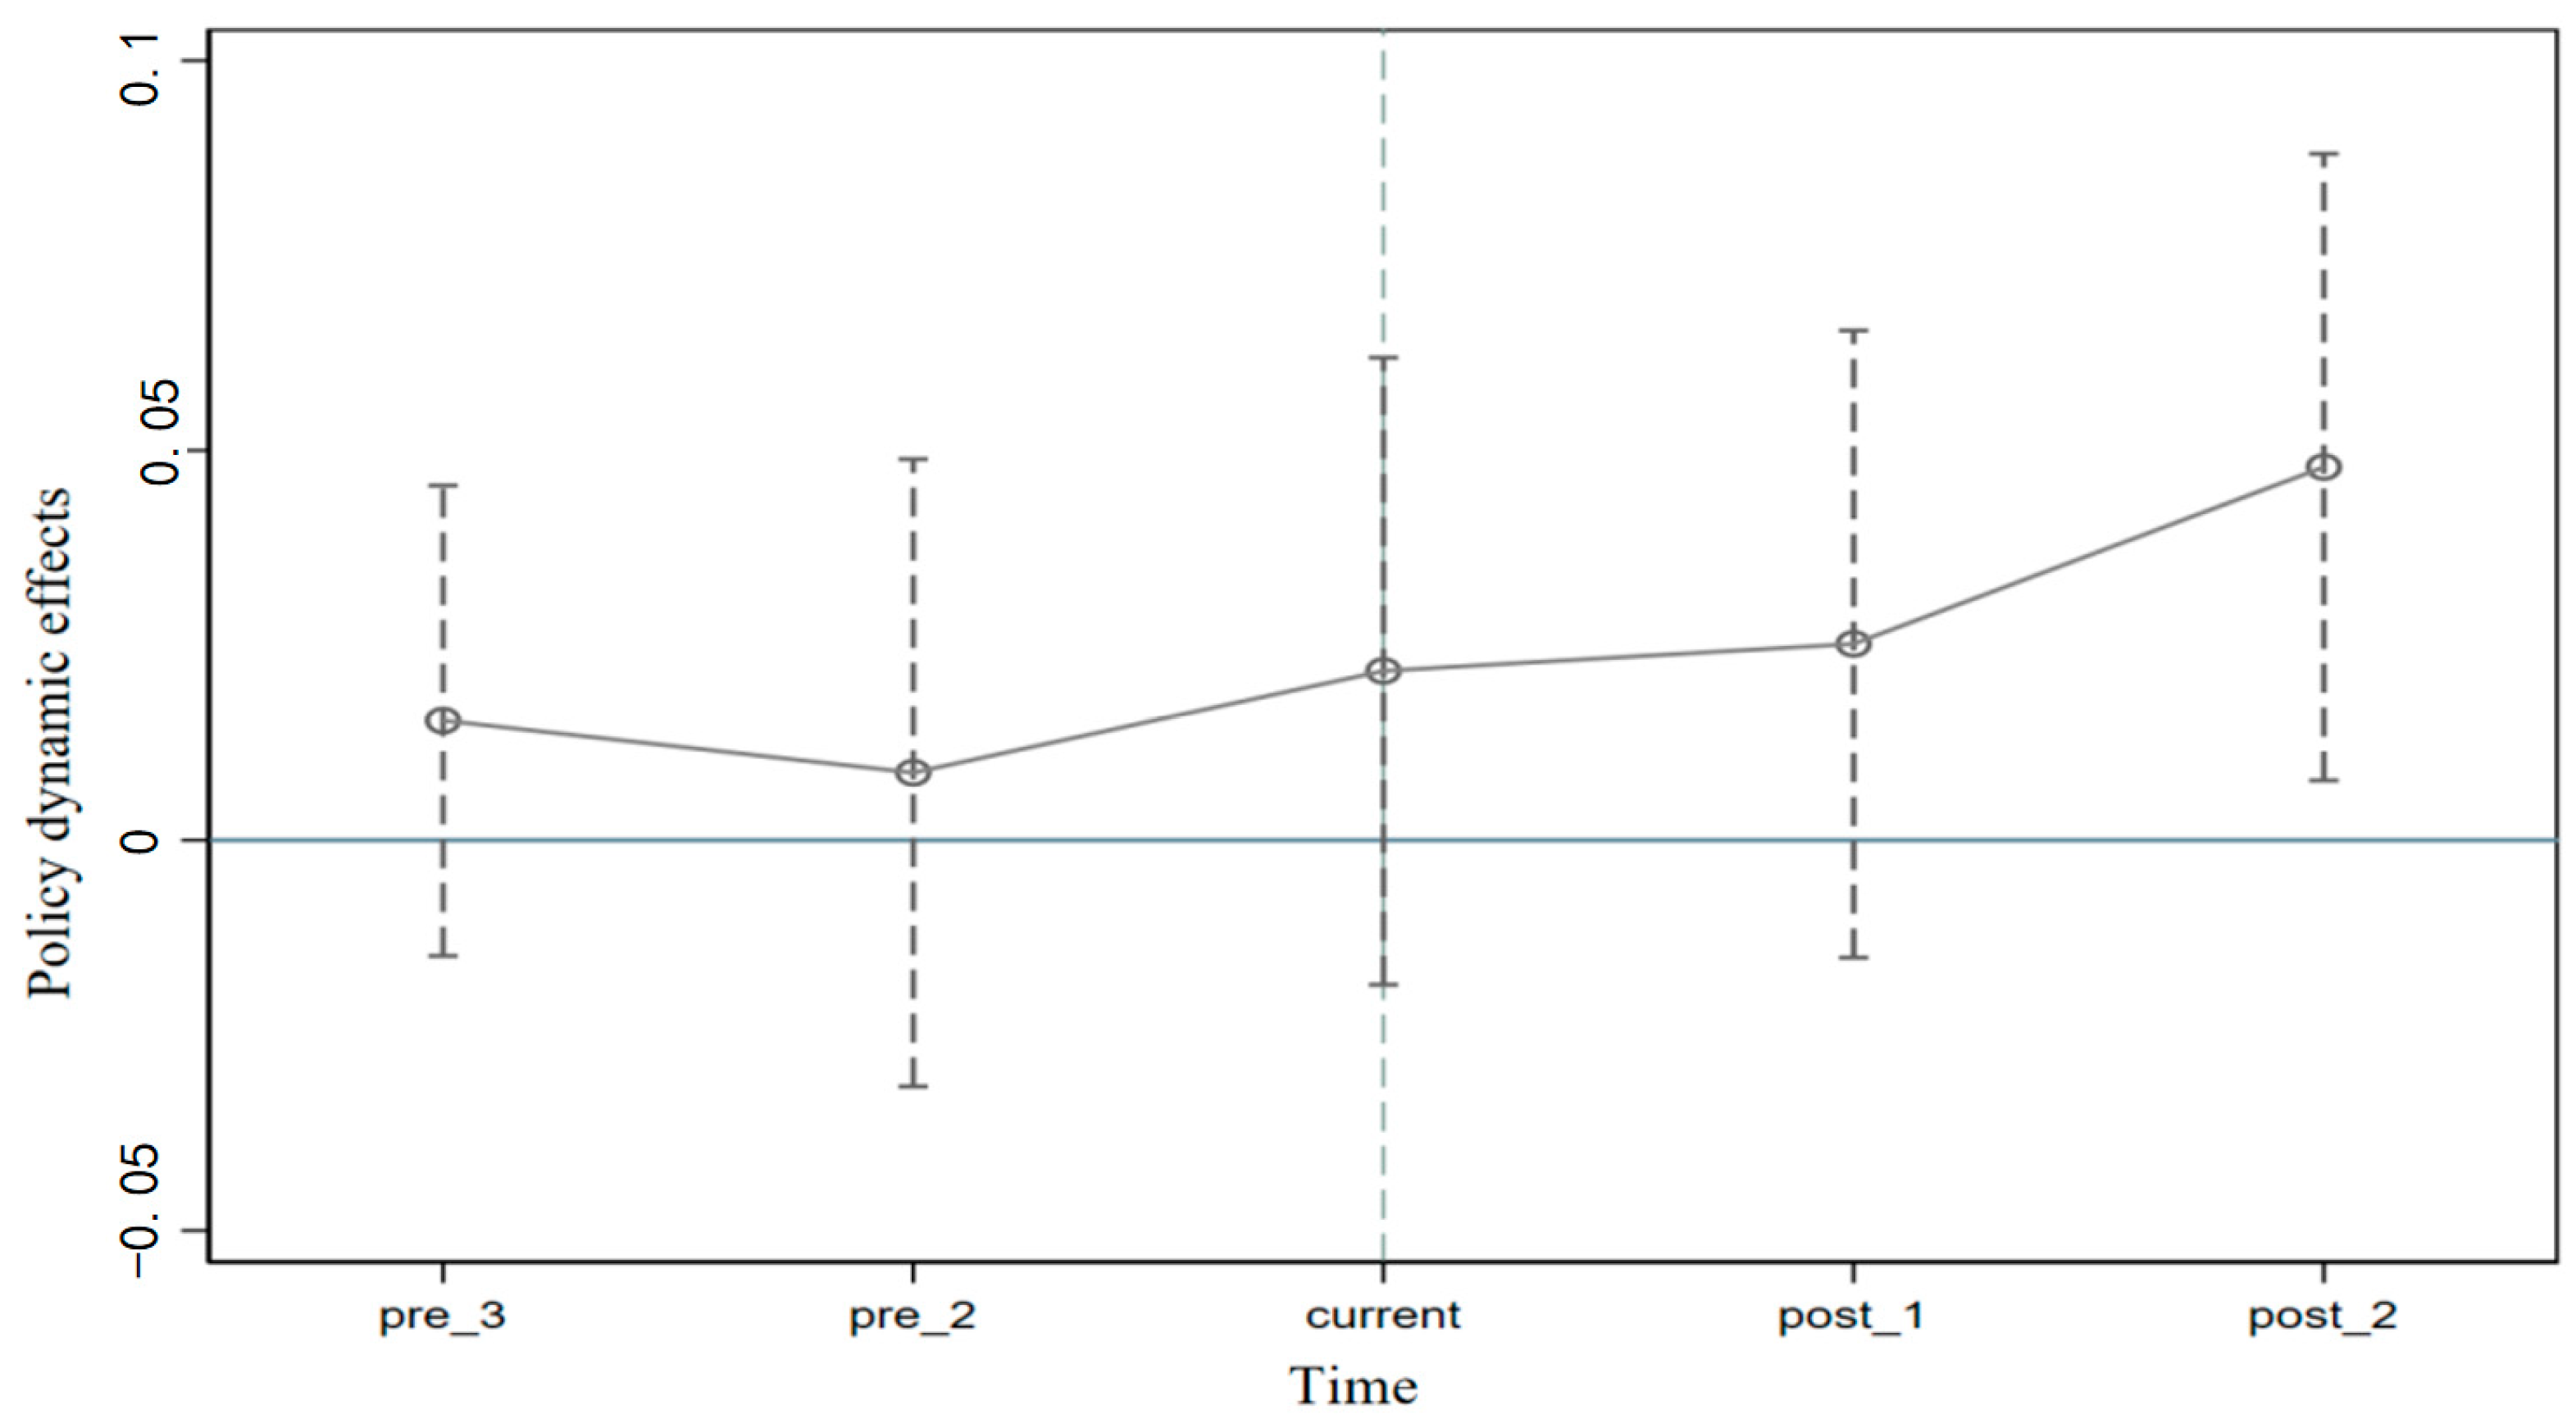
4.3. Parallel Trend Test

The use of a double differencing model requires that there is no significant difference in UME between the treatment and control groups prior to the implementation of the policy. Therefore, this paper constructs a series of dummy variables for NU. pre_3 and pre_2 denote the dummy variables for the third and second year before the implementation of the NU policy, respectively; current denotes the current period of the implementation of the NU policy; and post_1, post_2, and post_3 denote the dummy variables for the first, second, and third year after the implementation of the NU policy, respectively [105]. To avoid the problem of multicollinearity, this paper uses the year before the policy as the benchmark group. The results in Figure 3 show that none of the coefficients before the implementation of the NU policy is significant, indicating that there is no statistically significant difference between the UME of the treatment group and the control group before the implementation of the NU policy, which satisfies the assumption of the parallelism trend.

4.4. Robustness Tests

4.4.1. Placebo Test

Considering the differences in the timing of policy shocks in the pilot districts in the multi-period DID, in order to avoid non-policy exogenous impacts on the pilots due to the early knowledge of the signal that the policy is going to be implemented, it is necessary to randomize both the pseudo-treatment group dummy and the pseudo-policy shock dummy to conduct a placebo effect test [106]. Therefore, in this paper, we first use Stata17.0 software to construct a pseudo-NU policy to conduct 500 random shocks on 284 samples, each time randomly selecting cities as the experimental group, with the time of the policy randomly given, to obtain 500 sets of dummy variables; subsequently, the 500 dummy variable regression coefficients are used as horizontal coordinates, and the p-value of the regression coefficients and the kernel density distribution are used as vertical coordinates to generate the placebo test results. The results in Figure 4 show that the mean value of the estimated coefficients for the randomly generated treatment group is 0.000103, which is near 0 and far from the baseline regression result of 0.024. This is a further indication that the promotion of UME by NU is relatively robust.

4.4.2. PSM-DID

Whether a city can be selected as a NU pilot has a certain endogeneity. Therefore, this paper further utilizes the PSM-DID method for regression validation [107]. First, this paper performs propensity score matching by year based on matching variables. Subsequently, the data are merged for the districts successfully matched in each year. Then, the merged data are subjected to a multi-period double-difference regression. The regression results are presented in column (1) of Table 4. The results show that the effect of NU on UME is significantly positive. After the implementation of the policy, UME in the pilot districts is on average 0.050 per year higher than in the non-pilot districts. The regression results of the PSM-DID are basically of the same magnitude and in the same direction as the results of the multi-period DID.

4.4.3. Adding Predetermined Variables

According to the plan, the basic requirements for being selected as a NU pilot are a solid foundation for development, stronger financial strength, and a lower government debt ratio, so cities with a high initial general budget revenue from local finance are more likely to be NU pilots. To further exclude the self-selection problem, this paper uses the cross-multiplier term of the 2008 urban local finance general budget revenue and the time trend term t, which is added to the model as a predetermined variable to control the disturbance of the regression results caused by the differences in the regional local finance general budget revenue. Column (2) of Table 4 shows that the DID coefficient is 0.015 after the addition of the antecedent variable, and its magnitude and significance are not significantly changed from the baseline regression.

4.4.4. Replacement of the Econometric Model

Since the UME data are truncated, the highest value is 1. In this regard, the Tobit model is used instead of the baseline regression model to re-examine the effect of NU on UME. As can be seen in column (3) of Table 4, there is no significant change in the magnitude and significance of the DID coefficients after changing the regression model.

4.4.5. Exclusion of Contemporaneous Policies

Policy implementation during the same period may also affect UME, which leads to biased estimates in this paper. This paper analyzes the remaining urban pilot policies during the study period and finds that the state implemented the Smart City Pilot (SMC). At the same time, there is an overlapping area between the NU pilot and the SMC pilot [108], and in order to try to exclude the effect of the SMC policy on UME, this paper relies on the conventional practice of including a dummy variable for SMC in the model. Column (4) of Table 4 shows that after excluding the effect of the SMC pilot, the UME for the NU pilot drops to 0.017, but remains significant.

4.4.6. Changing the Clustering Hierarchy

In the benchmark regression, the standard errors are clustered at the city level, but this ignores the fact that cities in the same province tend to have strong economic and industrial linkages between them, which may affect the UME. We therefore re-clustered the standard errors at the provincial level and used it as a robustness test. Column (5) of Table 4 shows that the results remain robust after replacing the standard error clustering level.

4.5. Tests for Heterogeneity

4.5.1. Regional Heterogeneity

There is significant economic differentiation between different regions in China. Thus, in order to test the regional heterogeneity of the effect of NU on UME, a split-sample regression is conducted after dividing the study sample into eastern, central, and western regions, and the results are shown in columns (1)–(3) of Table 5. The estimated coefficients of NU on UME are positive in all three regions, but only the eastern and central region samples pass the significance test. In terms of impact effect values, UME increases by 0.027 for the eastern region sample, 0.015 for the central region sample, and 0.005 for the western region compared to the pilot cities.

4.5.2. Administrative Districts Heterogeneity

Urban agglomeration is an important strategy for countries to optimize urban distribution and improve regional competitiveness. Whether or not a city belongs to an urban agglomeration greatly affects the strength of policy implementation and urban linkages, which may lead to differentiated policy effects. In this paper, the sample is divided into urban agglomeration cities and non-urban agglomeration cities according to urban agglomeration zoning, and then regressed on the sample. The results are shown in columns (4)–(5) of Table 5. The effect of NU on UME is significantly positive regardless of whether it belongs to an urban cluster or not. In terms of the magnitude of the coefficients, NU contributes more to UME in non-urban agglomerations. After the implementation of the policy, compared to the non-pilot areas, the UME of the urban agglomeration cities increased by 0.017, which is lower than that of the non-urban agglomeration cities (0.048).

4.5.3. Urban Hierarchical Heterogeneity

Differences in the administrative hierarchy of cities may lead to differences in the administrative resources and financial support they receive. For this reason, this paper conducts a split-sample regression after dividing the sample into central and non-central cities. The results are shown in columns (6)–(7) of Table 5. For both central and general cities, the effect of NU on UME is significantly positive. The magnitude of the coefficients suggests that NU contributes more to UME in central cities. After the implementation of the policy, UME increased by 0.092 in central cities compared to non-pilot areas, which is higher than in general cities (0.018).

4.6. Spatial Spillover Effects

In order to test theoretical hypothesis 2, this paper examines whether there is a spatial spillover effect of NU by using the inverse geographic distance matrix and the economic–geographic nested matrix, and the results are shown in columns (1)–(3) of Table 6—(3) columns. It can be seen that regardless of the spatial weight matrix used, the spatial spillover effect coefficient of W*NU is significantly positive and passes at least the 5% significance test, which means that NU can increase UME in the surrounding area, and hypothesis 2 is tested.

4.7. Mechanism Testing

Based on the theoretical analysis in the previous section, the mechanisms of URI, RSD, US, EM, URPM, and IDGIDL were tested for their respective roles in the process of NU influencing UME. The results are shown in Table 7. The results are as follows: NU significantly improves URI and RSD; NU significantly mitigates US and EM; NU significantly improves URPM and IDGIDL. In summary, NU can promote UME by realizing the two objectives of URI and RSD, implementing the two concepts of SGI and SDC, and relying on the two schemes of URPM and IDGIDL, and hypothesis 3 is tested.

5. Discussion

This paper systematically examines the effects of NU on UME and the mechanism of action. Compared with existing studies, the contribution and innovation of this paper need to be further clarified.

5.1. NU Has a Promoting Effect and a Positive Spatial Spillover Effect on UME

This paper finds that NU not only promotes local UME but also promotes the UME of neighboring areas through the spatial spillover effect, which enriches the academic knowledge on the environmental protection effect of NU, and echoes the research viewpoints of Lin and Zhu (2021) [109]. The reason for this is that NU is urbanization with urban–rural integration, industrial interaction, conservation and intensification, ecological livability, and harmonious development as its basic features and therefore is conducive to enhancing the capacity of urban environmental regulation [110,111], promoting the green transformation of industries [112], improving the capacity of urban resource utilization [113,114], and optimizing the spatial structure of the city [115], which in turn reduces the input resources for urban operation, enhances the performance outputs of urban operation, and ultimately improves the UME [116]. At the same time, the findings of this study provide China’s answer to the real-life dilemma of “how to urbanize with the goal of sustainable urban development in mind”, which is faced by many countries [117,118,119], and will help countries and alliances such as the Caribbean region [120], UNESCO biosphere reserves [121], Singapore [16], India [122], and Australia [123] to better address sustainable development in the process of urbanization.

5.2. Heterogeneous Characterization of the Impact of NU on UME

The analyses in this paper find regional heterogeneity, administrative district heterogeneity, and city class heterogeneity in the effect of NU on UME. The causes of the three kinds of heterogeneity are discussed below. There are two possible reasons for the regional heterogeneity: first, from the viewpoint of economic differences, China’s regional economic development level presents a gradient difference of eastern region > central region > western region; regions with higher economic development levels have better public infrastructure, and thus the eastern and central regions release the promotion effect of NU on UME earlier [124]; second, from the viewpoint of the density of the policy pilots, the number of cities selected for NU pilots shows a gradient difference of eastern region > central region > western region, thus leading to regional heterogeneity of NU’s impact effect on UME under the effect of scale and agglomeration effects [125]. Possible reasons for the heterogeneity of administrative districts are as follows: on the one hand, cities in urban agglomerations are more susceptible to the siphoning effect of the central city, which leads to a large concentration of talent, capital, and other factors within the urban agglomerations in the central city; this is coupled with the weak trickle-down effect of the central city at the current stage, which leads to a scarcity of resources used for NU in the other cities in the agglomerations, and a poor flow of factors between urban and rural areas, thus impeding the role of NU policies in promoting UME [126]. On the other hand, the integration process of urban agglomerations may intensify urban sprawl, thus leading to wasted resources, increased pollution, and declining urban total factor productivity, thus hindering the promotion of UME by NU [127]. Possible causes of urban hierarchical heterogeneity are as follows: in the process of implementing the NU policy nationwide, the central government tends to dispatch resources for NU to central cities that already have advantages in the concentration and allocation of high-quality factor resources before the implementation of the pilot policy, and thus central cities can obtain more financial and tax support, government subsidies, and policy benefits, and are therefore more conducive to relying on NU to promote UME [92,128].

5.3. Deconstructing the NU in Three Dimensions: Target Level, Standard Level, and Program Level, and Building a Systematic Conduction Framework for NU to Influence UME

This paper verifies the role of the transmission mechanism of URI, RSD, SGI, SDC, URPM, and IDGIDL in NU affecting UME from both theoretical and empirical aspects. The idea of finding mechanism variables presented in this paper is worthwhile, compared with the lack of systematization in existing studies exploring the mechanism of action of NU affecting other variables, and the chosen mechanism variables are too arbitrary [129]. This paper systematically builds a mechanism framework of NU affecting UME from three dimensions and six variables, and comprehensively examines the issue of how NU actually affects UME. This framework is also highly generalizable and can be used to address the urbanization–sustainability paradox in Ghana [130], to achieve low-carbon targeted urbanization in the African region [131], and to promote sustainable urbanization in India [132].

6. Conclusions and Policy Recommendations

NU, as an important element in the reform of China’s urban development model, has great potential to improve UME, but there is a relative gap in research on how NU affects UME. This paper empirically investigates the impact of NU on UME using the Chinese NU pilot policy as a quasi-natural experiment. The findings are as follows: (1) NU effectively promotes UME. (2) NU can promote UME for cities in neighboring regions. (3) The effect of NU on UME presents the heterogeneous characteristics of eastern region > central region > western region, non-urban agglomeration cities > urban agglomeration cities, and is greater in central cities than in non-central cities. (4) NU can promote UME by facilitating URI and RSD, reducing US and EM, and enhancing URPM and IDGIDL.
Accordingly, this paper puts forward the following policy recommendations: (1) Given that NU can improve UME, the Chinese government is encouraged to actively implement the policy, summarize the relevant experience, enhance the universality of the policy, and provide replicable Chinese solutions for more countries with similar urban development problems as China. (2) In view of the mechanism of NU’s role in influencing UME, in the process of relying on NU to reduce and optimize UME, urban–rural integration and regional synergy should be clarified as the basic goal, smart growth and sustainable development as the basic principle, and urban–rural population mobility and inter-regional green innovation division of labor as the basic scheme. (3) In view of the heterogeneity of NU’s promotion of UME, firstly, it is encouraged to build a cross-regional linkage NU cooperation and assistance platform, to promote the sharing and exchange of policy implementation programs and implementation effects between regions, to reduce the cost of trial-and-error implementation of NU policies, and to accelerate the effectiveness of policies in the west region. Secondly, it is encouraged to improve the institutional mechanism for the integrated construction of urban agglomerations, accelerate the breaking down of barriers to factor flows within urban agglomerations, reduce the excessive waste of land resources, and reduce the problem of masking the effects of NU policies within urban agglomerations due to the factor polarization effect and the phenomenon of urban sprawl. Finally, it is necessary to improve the industrial cooperation mechanism, talent flow mechanism, financial mutual assistance mechanism, and infrastructure sharing mechanism between central cities and general cities, and to strengthen the radiation-driven effect of central cities, so as to reduce the differences of NU policy effects among cities. (4) In view of the positive spatial spillover effect of NU on UME, first, it is recommended to introduce preferential investment policies, financial support policies, and talent introduction policies for industries related to the construction of new towns and cities from a higher administrative level to accelerate the spatial agglomeration of important resources needed for NU, and then promote the upgrading of UME in the whole region relying on the spatial spillover effect. Secondly, it is encouraged to establish a sound regional coordination mechanism, promote market integration, break down administrative barriers, accelerate the construction of cross-regional transportation infrastructure, develop Internet information exchange and cooperation platforms, and accelerate the free flow of factors related to the new NU, so as to broaden the boundary of the radiation scope of the spatial spillover effect of policies.
Although this paper tests the effect of NU on UME in a more systematic way, there is still a lot of room for improvement: First of all, this paper only analyses the sample of China, and the variability of the effect of NU on UME across countries can be analyzed based on a comparative perspective in future studies. Secondly, although this paper reveals the spatial spillover effect of NU on UME, the decay boundary of the spillover effect is also worth exploring in depth. Finally, regarding the measurement of UME, the selection of more micro household data to construct an indicator system to assess UME is also encouraged.

Funding

This research received no external funding.

Institutional Review Board Statement

Not applicable.

Informed Consent Statement

Not applicable.

Data Availability Statement

The data presented in this study are available on request from the corresponding author.

Conflicts of Interest

The authors declare no conflict of interest.

References

  1. István, B. Does market value maximization affect the order of resource exploitation? Econ. Model. 2005, 22, 1090–1104. [Google Scholar] [CrossRef]
  2. Liao, B.; Li, L. How can urban agglomeration market integration promote urban green development: Evidence from China’s Yangtze River Economic Belt. Environ. Sci. Pollut. Res. 2022, 29, 10649–10664. [Google Scholar] [CrossRef] [PubMed]
  3. Ikram, M.; Ferasso, M.; Sroufe, R.; Zhang, Q. Assessing green technology indicators for cleaner production and sustainable investments in a developing country context. J. Clean. Prod. 2021, 322, 129090. [Google Scholar] [CrossRef]
  4. Ding, L.; Zhuang, Y.; Jiang, S. Green credit and high-quality sustainable development of banks. Environ. Sci. Pollut. Res. 2022, 29, 80871–80881. [Google Scholar] [CrossRef] [PubMed]
  5. Wolman, A. The metabolism of cities. Sci. Am. 1965, 213, 178–193. [Google Scholar] [CrossRef]
  6. Broto, V.C.; Allen, A.; Rapoport, E. Interdisciplinary Perspectives on Urban Metabolism. J. Ind. Ecol. 2012, 16, 851–861. [Google Scholar] [CrossRef]
  7. D’Amico, G.; Taddeo, R.; Shi, L.; Yigitcanlar, T.; Ioppolo, G. Ecological indicators of smart urban metabolism: A review of the literature on international standards. Ecol. Indic. 2020, 118, 106808. [Google Scholar] [CrossRef]
  8. Chen, S.Q.; Chen, B. Network Environ Perspective for Urban Metabolism and Carbon Emissions: A Case Study of Vienna, Austria. Environ. Sci. Technol. 2012, 46, 4498–4506. [Google Scholar] [CrossRef]
  9. Zhang, Y.; Yang, Z.; Yu, X. Evaluation of urban metabolism based on emergy synthesis: A case study for Beijing (China). Ecol. Model. 2009, 220, 1690–1696. [Google Scholar] [CrossRef]
  10. Zhang, Y. Urban metabolism: A review of research methodologies. Environ. Pollut. 2013, 178, 463–473. [Google Scholar] [CrossRef]
  11. McKinnon, I.; Hurley, P.T.; Myles, C.C.; Maccaroni, M.; Filan, T. Uneven urban metabolisms: Toward an integrative (ex)urban political ecology of sustainability in and around the city. Urban Geogr. 2019, 40, 352–377. [Google Scholar] [CrossRef]
  12. Cao, L.; Li, L.; Wu, Y.; Zeng, W.P. Does industrial convergence promote regional metabolism? Evidence from China. J. Clean. Prod. 2020, 273, 123010. [Google Scholar] [CrossRef]
  13. Hu, B.; Chen, C. New Urbanisation under Globalisation and the Social Implications in China. Asia Pac. Policy Stud. 2015, 2, 34–43. [Google Scholar] [CrossRef]
  14. Wang, Z.; Sun, Y.; Wang, B. How does the new-type urbanisation affect CO2 emissions in China? An empirical analysis from the perspective of technological progress. Energy Econ. 2019, 80, 917–927. [Google Scholar] [CrossRef]
  15. Governa, F.; Sampieri, A. Urbanisation processes and new towns in contemporary China: A critical understanding from a decentred view. Urban Stud. 2020, 57, 366–382. [Google Scholar] [CrossRef]
  16. Han, H. Governance for green urbanisation: Lessons from Singapore’s green building certification scheme. Environ. Plan. C-Politics Space 2019, 37, 137–156. [Google Scholar] [CrossRef]
  17. Konecka-Szydlowska, B.; Trócsányi, A.; Pirisi, G. Urbanisation in a formal way? The different characteristics of the ‘newest towns’ in Poland and Hungary. Reg. Stat. 2018, 8, 135–153. [Google Scholar] [CrossRef]
  18. Seo, J.K. Re-urbanisation in regenerated areas of Manchester and Glasgow—New residents and the problems of sustainability. Cities 2002, 19, 113–121. [Google Scholar] [CrossRef]
  19. Yan, J.; Chen, H.; Xia, F. Toward improved land elements for urban-rural integration: A cell concept of an urban-rural mixed community. Habitat Int. 2018, 77, 110–120. [Google Scholar] [CrossRef]
  20. Onyebueke, V.; Walker, J.; Lipietz, B.; Ujah, O.; Ibezim-Ohaeri, V. Urbanisation-induced displacements in peri-urban areas: Clashes between customary tenure and statutory practices in Ugbo-Okonkwo Community in Enugu, Nigeria. Land Use Policy 2020, 99, 104884. [Google Scholar] [CrossRef]
  21. Ma, H.; Chou, N.T.; Wang, L. Dynamic coupling analysis of urbanization and water resource utilization systems in China. Sustainability 2016, 8, 1176. [Google Scholar] [CrossRef]
  22. Zeng, C.; Zhang, A.L.; Xu, S. Urbanization and administrative restructuring: A case study on the Wuhan urban agglomeration. Habitat Int. 2016, 55, 46–57. [Google Scholar] [CrossRef]
  23. Chen, M.; Gong, Y.; Lu, D.; Ye, C. Build a people-oriented urbanization: China’s new-type urbanization dream and Anhui model. Land Use Policy 2019, 80, 1–9. [Google Scholar] [CrossRef]
  24. Sorace, C.; Hurst, W. China’s Phantom Urbanisation and the Pathology of Ghost Cities. J. Contemp. Asia 2016, 46, 304–322. [Google Scholar] [CrossRef]
  25. Abubakar, I.R.; Doan, P.L. Building new capital cities in Africa: Lessons for new satellite towns in developing countries. Afr. Stud. 2017, 76, 546–565. [Google Scholar] [CrossRef]
  26. Gripaios, P.; Bishop, P. Spatial inequalities in UK GDP per head: The role of private and public services. Serv. Ind. J. 2005, 25, 945–958. [Google Scholar] [CrossRef]
  27. Aksztejn, W. Local Territorial Cohesion: Perception of Spatial Inequalities in Access to Public Services in Polish Case-Study Municipalities. Soc. Incl. 2020, 8, 253–264. [Google Scholar] [CrossRef]
  28. Chu, Y.W. China’s new urbanization plan: Progress and structural constraints. Cities 2020, 103, 102736. [Google Scholar] [CrossRef]
  29. Penazzi, S.; Accorsi, R.; Manzini, R. Planning low carbon urban-rural ecosystems: An integrated transport land-use model. J. Clean. Prod. 2019, 235, 96–111. [Google Scholar] [CrossRef]
  30. Khalil, H.A.E.E.; Al-Ahwal, A. Reunderstanding Cairo through urban metabolism: Formal versus informal districts resource flow performance in fast urbanizing cities. J. Ind. Ecol. 2021, 25, 176–192. [Google Scholar] [CrossRef]
  31. Bhattacharya, S.; Saha, S.; Banerjee, S. Income inequality and the quality of public services: A developing country perspective. J. Dev. Econ. 2016, 123, 1–17. [Google Scholar] [CrossRef]
  32. Aaberge, R.; Eika, L.; Langorgen, A.; Mogstad, M. Local governments, in-kind transfers, and economic inequality. J. Public Econ. 2019, 180, 103966. [Google Scholar] [CrossRef]
  33. Matallah, S. Public service delivery, corruption and inequality: Key factors driving migration from North Africa to the developed world. J. Soc. Econ. Dev. 2020, 22, 328–354. [Google Scholar] [CrossRef]
  34. Kuijs, L.; Wang, T. China’s pattern of growth: Moving to sustainability and reducing inequality. China World Econ. 2006, 14, 1–14. [Google Scholar] [CrossRef]
  35. Niu, G.; Zhao, G. Living condition among China’s rural-urban migrants: Recent dynamics and the inland-coastal differential. Hous. Stud. 2018, 33, 476–493. [Google Scholar] [CrossRef]
  36. Menashe-Oren, A.; Stecklov, G. Age-specific sex ratios: Examining rural–urban variation within low-and middle-income countries. Popul. Stud. 2023, 77, 539–558. [Google Scholar] [CrossRef] [PubMed]
  37. Lee, D.; Kim, K. National Investment Framework for Revitalizing the R&D Collaborative Ecosystem of Sustainable Smart Agriculture. Sustainability 2022, 14, 6452. [Google Scholar]
  38. Chanieabate, M.; He, H.; Guo, C.; Abrahamgeremew, B.; Huang, Y. Examining the Relationship between Transportation Infrastructure, Urbanization Level and Rural-Urban Income Gap in China. Sustainability 2023, 15, 8410. [Google Scholar] [CrossRef]
  39. Syverson, C. Prices, spatial competition and heterogeneous producers: An empirical test. J. Ind. Econ. 2007, 55, 197–222. [Google Scholar] [CrossRef]
  40. Bernal, H. Intra-industry agglomeration and the external economies of scale model: Empirical evidence from Colombia. Spat. Econ. Anal. 2022, 17, 332–353. [Google Scholar] [CrossRef]
  41. Jiang, J.; Zhu, S.; Wang, W.; Li, Y.; Li, N. Coupling coordination between new urbanisation and carbon emissions in China. Sci. Total Environ. 2022, 850, 158076. [Google Scholar] [CrossRef] [PubMed]
  42. Lee, H.S.; Arestis, P.; Chong, S.C.; Yap, S.; Sia, B.K. The heterogeneous effects of urbanisation and institutional quality on greenhouse gas emissions in Belt and Road Initiative countries. Environ. Sci. Pollut. Res. 2022, 29, 1087–1105. [Google Scholar] [CrossRef] [PubMed]
  43. Obstfeld, M. Regional non-adjustment and fiscal policy. Econ. Policy 1998, 13, 205–259. [Google Scholar] [CrossRef]
  44. Kessler, A.S.; Hansen, N.A.; Lessmann, C. Interregional Redistribution and Mobility in Federations: A Positive Approach. Rev. Econ. Stud. 2011, 78, 1345–1378. [Google Scholar] [CrossRef]
  45. Velayudhan, P.K.; Singh, A.; Srinivasa, A.K. Effect of Direct Benefit Transfer Policy on Fertilizer Sales in India. Natl. Acad. Sci. Lett.-India 2022, 45, 481–484. [Google Scholar] [CrossRef]
  46. Xu, X.; Cui, X.; Chen, X.; Zhou, Y. Impact of government subsidies on the innovation performance of the photovoltaic industry: Based on the moderating effect of carbon trading prices. Energy Policy 2022, 170, 113216. [Google Scholar] [CrossRef]
  47. Williams, D.M.; Lee, H.H.; Connell, L.; Boyle, H.; Emerson, J.; Strohacker, K.; Galárraga, O. Small sustainable monetary incentives versus charitable donations to promote exercise: Rationale, design, and baseline data from a randomized pilot study. Contemp. Clin. Trials 2018, 66, 80–85. [Google Scholar] [CrossRef]
  48. Santos, G.; Davies, H. Incentives for quick penetration of electric vehicles in five European countries: Perceptions from experts and stakeholders. Transp. Res. Part A-Policy Pract. 2020, 137, 326–342. [Google Scholar] [CrossRef]
  49. D’Amico, G.; Arbolino, R.; Shi, L.; Yigitcanlar, T.; Ioppolo, G. Digital Technologies for Urban Metabolism Efficiency: Lessons from Urban Agenda Partnership on Circular Economy. Sustainability 2021, 13, 6043. [Google Scholar] [CrossRef]
  50. Pena, D.O.; Perrotti, D.; Mohareb, E. Advancing urban metabolism studies through GIS data: Resource flows, open space networks, and vulnerable communities in Mexico City. J. Ind. Ecol. 2022, 26, 1333–1349. [Google Scholar] [CrossRef]
  51. Zhao, C.; Wang, B. How does new-type urbanization affect air pollution? Empirical evidence based on spatial spillover effect and spatial Durbin model. Environ. Int. 2022, 165, 107304. [Google Scholar] [CrossRef] [PubMed]
  52. Pan, S.; Lu, X.; Chai, Y.; Huang, D.; Cai, Y. Low carbon city and FDI inflows: Evidence from China. Environ. Sci. Pollut. Res. 2023, 1–15. [Google Scholar] [CrossRef] [PubMed]
  53. Zhang, X.; He, P.; Liu, X.; Lu, T. The effect of low-carbon transportation pilot policy on carbon performance: Evidence from China. Environ. Sci. Pollut. Res. 2023, 30, 54694–54722. [Google Scholar] [CrossRef] [PubMed]
  54. Cutrini, E. Specialization and Concentration from a Twofold Geographical Perspective: Evidence from Europe. Reg. Stud. 2010, 44, 315–336. [Google Scholar] [CrossRef]
  55. Holgersen, S.; Baeten, G. Beyond a liberal critique of ‘trickle down’: Urban Planning in the City of Malmo. Int. J. Urban Reg. Res. 2016, 40, 1170–1185. [Google Scholar] [CrossRef]
  56. Yuan, H.; Zhang, T.; Feng, Y.; Liu, Y.; Ye, X. Does financial agglomeration promote the green development in China? A spatial spillover perspective. J. Clean. Prod. 2019, 237, 117808. [Google Scholar] [CrossRef]
  57. Feng, Y.; Zou, L.; Yuan, H.; Dai, L. The spatial spillover effects and impact paths of financial agglomeration on green development: Evidence from 285 prefecture-level cities in China. J. Clean. Prod. 2022, 340, 130816. [Google Scholar] [CrossRef]
  58. Li, Z.; Bai, T.; Tang, C. How does the low-carbon city pilot policy affect the synergistic governance efficiency of carbon and smog? Quasi-experimental evidence from China. J. Clean. Prod. 2022, 373, 133809. [Google Scholar] [CrossRef]
  59. Tan, J.; Chen, L. Spatial Effect of Digital Economy on Particulate Matter 2.5 in the Process of Smart Cities: Evidence from Prefecture-Level Cities in China. Int. J. Environ. Res. Public Health 2022, 19, 14456. [Google Scholar] [CrossRef]
  60. Dijkstra, J. Externalities in exchange networks an adaptation of existing theories of exchange networks. Ration. Soc. 2009, 21, 395–427. [Google Scholar] [CrossRef]
  61. Mildenberger, C.D. A liberal theory of externalities? Philos. Stud. 2018, 175, 2105–2123. [Google Scholar] [CrossRef]
  62. Caplan, A.J.; Silva, E.C.D. An equitable, efficient and implementable scheme to control global carbon dioxide emissions. Int. Tax Public Financ. 2007, 14, 263–279. [Google Scholar] [CrossRef]
  63. Naoto, A.; Silva, E.C.D. Correlated pollutants, interregional redistribution and labor attachment in a federation. Environ. Resour. Econ. 2008, 41, 111–131. [Google Scholar] [CrossRef]
  64. Boadway, R.; Song, Z.; Tremblay, J.-F. Non-cooperative pollution control in an inter-jurisdictional setting. Reg. Sci. Urban Econ. 2013, 43, 783–796. [Google Scholar] [CrossRef]
  65. Velaga, N.R.; Beecroft, M.; Nelson, J.D.; Corsar, D.; Edwards, P. Transport poverty meets the digital divide: Accessibility and connectivity in rural communities. J. Transp. Geogr. 2012, 21, 102–112. [Google Scholar] [CrossRef]
  66. Risimati, B.; Gumbo, T.; Chakwizira, J. Spatial Integration of Non-Motorized Transport and Urban Public Transport Infrastructure: A Case of Johannesburg. Sustainability 2021, 13, 11461. [Google Scholar] [CrossRef]
  67. Saikia, A.; Kar, B.K. Impact of road connectivity on urbanisation: A case study of Central Brahmaputra Valley, Assam, India. Geojournal 2023, 88, 3923–3934. [Google Scholar] [CrossRef]
  68. Bhatt, V.; Chandrasekhar, S.; Sharma, A. Regional Patterns and Determinants of Commuting Between Rural and Urban India. Indian J. Labour Econ. 2020, 63, 1041–1063. [Google Scholar] [CrossRef]
  69. Ye, C.; Pan, J.; Liu, Z. The historical logics and geographical patterns of rural-urban governance in China. J. Geogr. Sci. 2022, 32, 1225–1240. [Google Scholar] [CrossRef]
  70. Chen, M.; Zhou, Y.; Huang, X.; Ye, C. The Integration of New-Type Urbanization and Rural Revitalization Strategies in China: Origin, Reality and Future Trends. Land 2021, 10, 207. [Google Scholar] [CrossRef]
  71. Liu, J.; Ma, X.; Jia, W.; Zhang, S. Can New-Type Urbanization Construction Narrow the Urban-Rural Income Gap? Evidence from China. Sustainability 2022, 14, 14725. [Google Scholar] [CrossRef]
  72. Batubara, B.; Kooy, M.; Zwarteveen, M. Uneven Urbanisation: Connecting Flows of Water to Flows of Labour and Capital Through Jakarta’s Flood Infrastructure. Antipode 2018, 50, 1186–1205. [Google Scholar] [CrossRef]
  73. Cowan, T. The village as urban infrastructure: Social reproduction, agrarian repair and uneven urbanisation. Environ. Plan. E-Nat. Space 2021, 4, 736–755. [Google Scholar] [CrossRef]
  74. Allawi, A.H.; Al-Jazaeri, H.M.J. A new approach towards the sustainability of urban-rural integration: The development strategy for central villages in the Abbasiya District of Iraq using GIS techniques. Reg. Sustain. 2023, 4, 28–43. [Google Scholar] [CrossRef]
  75. Chen, H.; Hua, Y.; Xu, Y. Spatial-Temporal Evolution Patterns and Obstacle Factors of Urban-Rural “Economy-Society-Ecology” Coordination in the Yangtze River Delta. Sustainability 2023, 15, 13839. [Google Scholar] [CrossRef]
  76. Vaz, D.M.; Matos, M.J. Regional Polycentrism in a Mountainous Territory: The Case of Covilha (Portugal) and Alpine Cities. Eur. Plan. Stud. 2015, 23, 379–397. [Google Scholar] [CrossRef]
  77. Oedl-Wieser, T.; Hausegger-Nestelberger, K.; Dax, T.; Bauchinger, L. Formal and Informal Governance Arrangements to Boost Sustainable and Inclusive Rural-Urban Synergies: An Analysis of the Metropolitan Area of Styria. Sustainability 2020, 12, 10637. [Google Scholar] [CrossRef]
  78. Chotpantarat, S.; Boonkaewwan, S. Impacts of land-use changes on watershed discharge and water quality in a large intensive agricultural area in Thailand. Hydrol. Sci. J. 2018, 63, 1386–1407. [Google Scholar] [CrossRef]
  79. Aktas, N.K.; Donmez, N.Y. Effects of urbanisation and human activities on basin ecosystem: Sapanca lake basin. J. Environ. Prot. Ecol. 2019, 20, 102–112. [Google Scholar]
  80. Ji, X.; Han, M.; Ulgiati, S. Optimal allocation of direct and embodied arable land associated to urban economy: Understanding the options deriving from economic globalization. Land Use Policy 2020, 91, 104392. [Google Scholar] [CrossRef]
  81. Fang, G.; Tian, L.; Fu, M.; Sun, M.; Du, R.; Lu, L.; He, Y. The effect of energy construction adjustment on the dynamical evolution of energy-saving and emission-reduction system in China. Appl. Energy 2017, 196, 180–189. [Google Scholar] [CrossRef]
  82. Chang, X.; Ma, T.; Wu, R. Impact of urban development on residents’ public transportation travel energy consumption in China: An analysis of hydrogen fuel cell vehicles alternatives. Int. J. Hydrogen Energy 2019, 44, 16015–16027. [Google Scholar] [CrossRef]
  83. Chlond, B.; Gavard, C.; Jeuck, L. How to Support Residential Energy Conservation Cost-Effectively? An analysis of Public Financial Schemes in France. Environ. Resour. Econ. 2023, 85, 29–63. [Google Scholar] [CrossRef]
  84. Huang, S.-L.; Chen, C.-W. Urbanization and Socioeconomic Metabolism in Taipei. Journal of Industrial Ecology 2009, 13, 75–93. [Google Scholar] [CrossRef]
  85. Davoudi, S.; Sturzaker, J. Urban form, policy packaging and sustainable urban metabolism. Resour. Conserv. Recycl. 2017, 120, 55–64. [Google Scholar] [CrossRef]
  86. Roy, M.; Curry, R.; Ellis, G. Spatial allocation of material flow analysis in residential developments: A case study of Kildare County, Ireland. J. Environ. Plan. Manag. 2015, 58, 1749–1769. [Google Scholar] [CrossRef]
  87. Royuela, V. The role of urbanisation on international migrations: A case study of EU and ENP countries. Int. J. Manpow. 2015, 36, 469–490. [Google Scholar] [CrossRef]
  88. Miller, J.D.; Hutchins, M. The impacts of urbanisation and climate change on urban flooding and urban water quality: A review of the evidence concerning the United Kingdom. J. Hydrol.-Reg. Stud. 2017, 12, 345–362. [Google Scholar] [CrossRef]
  89. Fafchamps, M.; Shilpi, F. Cities and specialisation: Evidence from South Asia. Econ. J. 2005, 115, 477–504. [Google Scholar] [CrossRef]
  90. Scott, A.J. The constitution of the city and the critique of critical urban theory. Urban Stud. 2022, 59, 1105–1129. [Google Scholar] [CrossRef]
  91. Lachapelle, E.; MacNeil, R.; Paterson, M. The political economy of decarbonisation: From green energy ‘race’ to green ‘division of labour’. New Political Econ. 2017, 22, 311–327. [Google Scholar] [CrossRef]
  92. Liao, B.; Li, L. Spatial division of labor, specialization of green technology innovation process and urban coordinated green development: Evidence from China. Sustain. Cities Soc. 2022, 80, 103778. [Google Scholar] [CrossRef]
  93. Liao, B.; Li, L. Urban green innovation efficiency and its influential factors: The Chinese evidence. Environ. Dev. Sustain. 2023, 25, 6551–6573. [Google Scholar] [CrossRef]
  94. Lu, D. Rural-urban income disparity: Impact of growth, allocative efficiency, and local growth welfare. China Econ. Rev. 2002, 13, 419–429. [Google Scholar] [CrossRef]
  95. Carver, A.; Timperio, A.F.; Crawford, D.A. Young and free? A study of independent mobility among urban and rural dwelling Australian children. J. Sci. Med. Sport 2012, 15, 505–510. [Google Scholar] [CrossRef]
  96. Luo, X.X.; Liu, Y.; Liao, B. Does Urban Sprawl Affect Urban Metabolic Efficiency? --An empirical study based on panel data of 285 prefecture-level cities. China Popul. Resour. Environ. 2023, 33, 113–123. [Google Scholar]
  97. Muniba, M.; Yu, B. Does Innovative City Pilot Policy Stimulate the Chinese Regional Innovation: An Application of DID Model. Int. J. Environ. Res. Public Health 2023, 20, 1245. [Google Scholar] [CrossRef]
  98. Xiao, Y.; Huang, H.; Qian, X.-M.; Chen, L. Can carbon emission trading pilot facilitate green development performance? Evidence from a quasi-natural experiment in China. J. Clean. Prod. 2023, 400, 136755. [Google Scholar] [CrossRef]
  99. Zhou, J.; Qin, F.; Liu, J.; Zhu, G.L.; Zou, W. Measuring the Level of Urban-Rural Integration, Spatial and Temporal Evolution, and Influence Mechanisms in China under a Multidimensional Perspective. China Popul. Resour. Environ. 2019, 29, 166–176. [Google Scholar]
  100. Liao, B.; Li, L.; Luo, X.; Liu, Y. Urban sprawl, innovation network connectivity and regional synergy. China Popul. Resour. Environ. 2023, 33, 128–137. [Google Scholar]
  101. Wang, J.; Ma, H.; Jiang, M.; Zang, J. Urban sprawl, land resource mismatch and agglomeration economies. Explor. Econ. Issues 2021, 10, 62–73. [Google Scholar]
  102. Chen, Y.; Hu, W. Price distortions, factor mismatches and efficiency losses: Theory and applications. Economics 2011, 10, 1401–1422. [Google Scholar]
  103. Liu, X.; Wang, C. How does urban-rural population mobility promote rural revitalization?—An Empirical Study Based on County-level Panel Data in China. Zhejiang J. 2023, 160–170. [Google Scholar]
  104. Jiang, X.; Sun, Q.; Wu, F. Division of technological specialization, evolution of regional innovation capacity and coordinated regional development. Urban Issues 2022, 23–33. [Google Scholar]
  105. Beck, T.; Levine, R.; Levkov, A. Big Bad Banks? The Winners and Losers from Bank Deregulation in the United States. J. Financ. 2010, 65, 1637–1667. [Google Scholar] [CrossRef]
  106. Lu, X.H.; Chen, D.L.; Kuang, B.; Zhang, C.Z.; Cheng, C. Is high-tech zone a policy trap or a growth drive? Insights from the perspective of urban land use efficiency. Land Use Policy 2020, 95, 104583. [Google Scholar] [CrossRef]
  107. Tang, C.J.; Huang, K.Q.; Liu, Q.R. Robots and skill-biased development in employment structure: Evidence from China. Econ. Lett. 2021, 205, 109960. [Google Scholar] [CrossRef]
  108. Quitzow, L.; Rohde, F. Imagining the smart city through smart grids? Urban energy futures between technological experimentation and the imagined low-carbon city. Urban Stud. 2022, 59, 341–359. [Google Scholar] [CrossRef]
  109. Lin, B.; Zhu, J. Impact of China’s new-type urbanization on energy intensity: A city-level analysis. Energy Econ. 2021, 99, 105292. [Google Scholar] [CrossRef]
  110. Kara, E.; Ribaudo, M.; Johansson, R.C. On how environmental stringency influences adoption of best management practices in agriculture. J. Environ. Manag. 2008, 88, 1530–1537. [Google Scholar] [CrossRef] [PubMed]
  111. Korpela, K.M.; Pasanen, T.; Repo, V.; Hartig, T.; Staats, H.; Mason, M.; Alves, S.; Fornara, F.; Marks, T.; Saini, S.; et al. Environmental Strategies of Affect Regulation and Their Associations With Subjective Well-Being. Front. Psychol. 2018, 9, 562. [Google Scholar] [CrossRef] [PubMed]
  112. Komninos, N. Transformation of Industry Ecosystems in Cities and Regions: A Generic Pathway for Smart and Green Transition. Sustainability 2022, 14, 9694. [Google Scholar] [CrossRef]
  113. Nkambwe, M.; Sekhwela, M.B.M. Utilization characteristics and importance of woody biomass resources on the rural-urban fringe in Botswana. Environ. Manag. 2006, 37, 281–296. [Google Scholar] [CrossRef] [PubMed]
  114. Arbabi, H.; Punzo, G.; Meyers, G.; Tan, L.M.; Li, Q.; Tingley, D.D.; Mayfield, M. On the use of random graphs in analysing resource utilization in urban systems. R. Soc. Open Sci. 2020, 7, 200087. [Google Scholar] [CrossRef] [PubMed]
  115. Burger, M.J.; de Goei, B.; van der Laan, L.; Huisman, F.J.M. Heterogeneous development of metropolitan spatial structure: Evidence from commuting patterns in English and Welsh city-regions, 1981–2001. Cities 2011, 28, 160–170. [Google Scholar] [CrossRef]
  116. Yu, B. Ecological effects of new-type urbanization in China. Renew. Sustain. Energy Rev. 2021, 135, 110239. [Google Scholar] [CrossRef]
  117. Cobbinah, P.B.; Erdiaw-Kwasie, M.O.; Amoateng, P. Africa’s urbanisation: Implications for sustainable development. Cities 2015, 47, 62–72. [Google Scholar] [CrossRef]
  118. Klos-Adamkiewicz, Z.; Szaruga, E.; Gozdek, A.; Kogut-Jaworska, M. Links between the Energy Intensity of Public Urban Transport, Regional Economic Growth and Urbanisation: The Case of Poland. Energies 2023, 16, 3799. [Google Scholar] [CrossRef]
  119. Tumwesigye, S.; Vanmaercke, M.; Hemerijckx, L.-M.; Opio, A.; Poesen, J.; Twongyirwe, R.; Van Rompaey, A. Spatial patterns of urbanisation in Sub-Saharan Africa: A case study of Uganda. Dev. S. Afr. 2023, 40, 1–21. [Google Scholar] [CrossRef]
  120. Mycoo, M.A. A Caribbean New Urban Agenda post-Habitat III: Closing the gaps. Habitat Int. 2017, 69, 68–77. [Google Scholar] [CrossRef]
  121. Harris, M.; Cave, C.; Foley, K.; Bolger, T.; Hochstrasser, T. Urbanisation of Protected Areas within the European Union-An Analysis of UNESCO Biospheres and the Need for New Strategies. Sustainability 2019, 11, 5899. [Google Scholar] [CrossRef]
  122. Datta, A. India’s ecocity? Environment, urbanisation, and mobility in the making of Lavasa. Environ. Plan. C-Gov. Policy 2012, 30, 982–996. [Google Scholar] [CrossRef]
  123. Pokharel, S.; Archer, F. Habitat-III and the New Urban Agenda: Implications for Australia. Aust. J. Emerg. Manag. 2020, 35, 66–72. [Google Scholar]
  124. Lyhagen, J.; Rickne, J. Income inequality between Chinese regions: Newfound harmony or continued discord? Empir. Econ. 2014, 47, 93–110. [Google Scholar] [CrossRef]
  125. Yang, S.Y.; Wang, W.Z.; Feng, D.W.; Lu, J.J. Impact of pilot environmental policy on urban eco-innovation. J. Clean. Prod. 2022, 341, 130858. [Google Scholar] [CrossRef]
  126. Melo, P.C.; Graham, D.J.; Noland, R.B. A meta-analysis of estimates of urban agglomeration economies. Reg. Sci. Urban Econ. 2009, 39, 332–342. [Google Scholar] [CrossRef]
  127. Surya, B.; Salim, A.; Hernita, H.; Suriani, S.; Menne, F.; Rasyidi, E.S. Land Use Change, Urban Agglomeration, and Urban Sprawl: A Sustainable Development Perspective of Makassar City, Indonesia. Land 2021, 10, 556. [Google Scholar] [CrossRef]
  128. Wolman, H.; Marckini, L. The effect of place on legislative roll-call voting: The case of central-city representatives in the US House. Soc. Sci. Q. 2000, 81, 763–781. [Google Scholar]
  129. Shao, J.; Wang, L.H. Can new-type urbanization improve the green total factor energy efficiency? Evidence from China. Energy 2023, 262, 125499. [Google Scholar] [CrossRef]
  130. Anarfi, K.; Hill, R.A.; Shiel, C. Highlighting the Sustainability Implications of Urbanisation: A Comparative Analysis of Two Urban Areas in Ghana. Land 2020, 9, 300. [Google Scholar] [CrossRef]
  131. Ibekilo, B.; Ekesiobi, C.; Emmanuel, P.M. Heterogeneous assessment of urbanisation, energy consumption and environmental pollution in Africa: The role of regulatory quality. Econ. Chang. Restruct. 2023, 1–24. [Google Scholar] [CrossRef]
  132. Sarkar, R.; Lakshmana, C.M. Measuring Urbanisation, Growth of Urban Agglomeration, Urban Growth Sustainability and Role of Urban Primacy in India. J. Asian Afr. Stud. 2022, 153, 106566. [Google Scholar] [CrossRef]
Figure 1. Division of the study area.
Sustainability 16 00564 g001
Figure 2. Trend of UME in China, 2008–2020.
Sustainability 16 00564 g002
Figure 3. Parallel trend test results.
Sustainability 16 00564 g003
Figure 4. Placebo test results.
Sustainability 16 00564 g004
Table 1. UME’s system of measurement indicators.
Base LayerFactor LayerIndicator Layer
UMEResource inputsWater resource inputWater consumption for society as a whole
Land resource inputsLand area for urban construction
Electricity resource inputsElectricity consumption of society as a whole
Gas supply resource inputsTotal gas and natural gas consumption
LPG resource inputsTotal LPG consumption
Expected outputsCompulsory education benefitsNumber of students enrolled in primary and secondary schools
Wages and benefitsTotal wages of employees on board
Economic outputGross regional product (GDP)
Non-expected outputsWastewater dischargeIndustrial wastewater discharge
Exhaust emissionIndustrial sulfur dioxide emissions
Solid waste emissionIndustrial fume (dust) emissions
Table 2. Descriptive statistics of relevant variables.
VarObsMeanMaxMin
UME36920.3170.0061.000
NU36920.2740.0001.000
URI36920.1020.0340.486
RSD36920.0310.0151.000
US36921.0640.01511.044
EM369210.1570.00127.421
URPM3692−2.525−25.99525.451
IDGIDL36920.4250.0451.166
UB36920.9690.2601.000
ED36921.4560.11416.094
PD36920.0420.0040.275
PT36927.8060.23822.504
FD36922.8330.64839.031
Note: UME denotes urban metabolic efficiency; NU denotes new urbanization; URI denotes urban–rural integrated development; RSD denotes regional synergistic development; US denotes urban sprawl index; EM denotes energy mismatch index; URPM denotes urban–rural population mobility; IDGIDL denotes inter-district green innovation division of labor; UB denotes urbanization level; ED denotes economic development; PD denotes population density; PT denotes public transportation; FD denotes fiscal decentralization.
Table 3. Mean effect of NU on UME.
Variables(1)(2)(3)(4)(5)(6)
NU0.021 ***0.026 ***0.025 ***0.024 ***0.024 ***0.024 ***
(2.69)(3.32)(3.30)(3.11)(2.82)(2.95)
ED 0.035 ***0.036 ***0.035 ***0.035 ***0.035 ***
(4.65)(4.29)(4.26)(4.70)(4.24)
UB 0.0890.1160.1090.122
(0.78)(0.99)(0.73)(0.86)
PD 0.7830.5330.527
(0.81)(0.87)(0.86)
PT 0.0010.001
(1.02)(1.04)
FD −0.005
(−1.42)
Constant0.330 ***0.275***0.187 *0.1290.1650.164
(109.11)(22.32)(1.68)(1.08)(1.43)(1.42)
City FEYESYESYESYESYESYES
Time FEYESYESYESYESYESYES
Obs0.6580.6650.6660.6680.6710.672
R2369236923692369236923692
Note: t-indicators are in parentheses; ***and * indicate significance at the 1%and 10% levels, as below is the same. NU denotes new urbanization; UB denotes urbanization level; ED denotes economic development; PD denotes population density; PT denotes public transportation; FD denotes fiscal decentralization.
Table 4. Robustness test.
Variables(1)
PSM-DID
(2)
Predefined Variable
(3)
Tobit Model
(4)
Exclusion of Simultaneous Interference
(5)
Changing the Clustering Hierarchy
NU0.050 ***0.015 *0.025 ***0.017 *0.024 **
(3.49)(1.71)(2.89)(1.72)(2.07)
SMC 0.064 ***
(7.62)
Constant0.202−2.021 ***1.434 0.130
(0.66)(−3.26)(0.03) (0.72)
Control variableControlControlControlControlControl
City/Pro FEYesYesYesYesYes
Time FEYesYesYesYesYes
Obs11113692369236923692
Log-likelihood 776.489
R20.7390.667/0.6660.666
Note: NU denotes new urbanization; SMC denotes smart city. ***, ** and * indicate significance at the 1%, 5% and 10%. t-indicators are in parentheses.
Table 5. Results of the heterogeneity test.
Variables(1)
Eastern
Region
(2)
Central
Region
(3)
Western
Region
(4)
Urban Agglomeration Cities
(5)
Non-Urban Agglomerations
Cities
(6)
Center
Cities
(7)
General
Cities
NU0.027 ***0.015 ***0.0050.017 *0.048 **0.092 ***0.018 *
(2.89)(2.62)(1.55)(1.88)(2.37)(4.38)(1.99)
Constant−0.1360.118 **0.157 *−0.577 **0.2380.8170.108
(−1.25)(2.11)(1.28)(−2.23)(1.42)(1.44)(0.89)
Control variableControlControlControlControlControlControlControl
City FEYesYesYesYesYesYesYes
Time FEYesYesYesYesYesYesYes
Obs13001300109227309623903302
R20.4870.5840.5940.6430.7210.7600.656
Note: NU denotes new urbanization. ***, ** and * indicate significance at the 1%, 5% and 10%. t-indicators are in parentheses.
Table 6. Spatial effect regression results.
Variables(1)
Spatial Adjacency Matrix
(2)
Inverse Geographic Distance Matrix
(3)
Economic–Geographic Nested Matrices
W* NU0.026 **0.029 **0.034 **
(2.02)(2.05)(2.36)
Control variableControlControlControl
City FEYesYesYes
Time FEYesYesYes
Obs369236923692
R20.0900.1940.139
Note: W* NU denotes the space overflow term for new urbanization. ** indicate significance at the 5%. t-indicators are in parentheses.
Table 7. Mechanism test results.
Target LevelStandardized LayerProgram Level
(1)
URI
(2)
RSD
(3)
US
(4)
EM
(5)
URPM
(6)
IDGIDL
NU0.214 ***0.106 *−0.033 ***−0.586 ***0.043 ***0.046 **
(10.25.)(1.98)(−3.06)(−11.24)(12.11)(2.30)
Constant0.368 ***−0.6041.202 ***5.084 ***0.099 *0.835 **
(2.88)(−9.08)(7.58)(6.70)(1.88)(2.24)
Control variableControlControlControlControlControlControl
City FEYesYesYesYesYesYes
Time FEYesYesYesYesYesYes
Obs369236923692369236923692
R20.9110.2550.6670.8490.9170.259
Note: NU denotes new urbanization; URI denotes urban–rural integrated development; RSD denotes regional synergistic development; US denotes smart growth ideology; EM denotes sustainable development concept; URPM denotes urban–rural population mobility; IDGIDL denotes inter-district green innovation division of labor. NU denotes new urbanization. ***, ** and * indicate significance at the 1%,5% and 10%.t-indicators are in parentheses.
Disclaimer/Publisher’s Note: The statements, opinions and data contained in all publications are solely those of the individual author(s) and contributor(s) and not of MDPI and/or the editor(s). MDPI and/or the editor(s) disclaim responsibility for any injury to people or property resulting from any ideas, methods, instructions or products referred to in the content.

