Article

Does Green Overseas Investment Improve Public Perception in Host Countries? Evidence from Chinese Energy Engagement in 32 African Countries

1
Griffith Asia Institute, Griffith University, Nathan, QLD 4111, Australia
2
Green Finance and Development Center, Fanhai International School of Finance (FISF), Fudan University, Shanghai 200437, China
*
Author to whom correspondence should be addressed.
Sustainability 2024, 16(2), 590; https://doi.org/10.3390/su16020590
Submission received: 19 November 2023 / Revised: 18 December 2023 / Accepted: 3 January 2024 / Published: 10 January 2024

Abstract

:
This study examines whether and how green overseas economic engagement impacts public perception in host countries as a form of soft power. We build an extensive country-level dataset on Chinese bilateral engagement in 32 African countries from 2015 to 2019 and use a fixed-effect model. We find that increased investment in green energy improves the average public perception of China. In contrast, for non-green energy investment (like coal, gas, and oil), which might also be considered as contributing to economic and employment growth, we did not find such effects. The results indicate that green economic engagement has positive non-monetary returns on the macro-scale and that by taking environmental considerations into investment decision-making, long-term bilateral relationships can be positively impacted.

1. Introduction

With increasing recognition of climate risks, international attention and scrutiny have simultaneously increased on China’s outbound energy (especially coal) and infrastructure investments in developing countries and their likely contributions to carbon emissions [1,2,3,4]. Chinese policy banks, state-owned commercial banks, and state-owned enterprises (SOEs) had, until 2020, been the largest public financial sponsors for coal-fired power plants in the Belt and Road Initiative (BRI) countries, and had been major sponsors for fossil fuel projects [5].
To overcome, or at least mitigate the negative environmental externalities from its overseas investments, Chinese policymakers have intensified policy developments to accelerate “high-quality” and “green” overseas investment, particularly related to the Belt and Road Initiative (BRI) [6,7]. China’s President has highlighted China’s ambitions for building a “green Belt and Road Initiative” and providing more green finance; and government ministries and regulators have issued green overseas finance and cooperation guidelines (for a comprehensive overview of government guidelines, see [7]); finally, China has partnered with other countries to accelerate green development. For example, the 2021 Forum on China-Africa Cooperation (FOCAC) published the Dakar Declaration of the Eighth Ministerial Conference of the Forum on China-Africa Cooperation, a dedicated communiqué on green development and addressing climate change.
This “green signaling” in China’s overseas engagement policies started as early as 2013, reflected in the Guidelines for Environmental Protection in Foreign Investment and Cooperation issued by the Ministry of Environmental Protection (now the Ministry of Ecology and Environment) and the Ministry of Commerce. Since then, it has been strengthened by other government guidelines and opinions addressing “green” overseas cooperation, finance, and engagement, in addition to many bilateral and multilateral communiqués (such as FOCAC). However, as Nedopil [7] found, much of the green signaling in the early years was not followed by green action, e.g., through green investment. This leads to a mismatch between words and action, and risks negatively impacting soft power for China.
Yet, so far this relationship between China’s green engagement and its soft power has only been conceptualized and not been empirically tested. This paper aims to provide an empirical analysis of the impact of China’s green engagement on soft power, where soft power is understood as the public perception of China in the host country. To analyze how green overseas finance can impact public perception towards the source of finance, we measure the impact of China’s green and non-green overseas energy investment on the host country’s public perception of China based on a panel dataset of 32 African countries from 2015 to 2019 (we used data until 2019 to avoid the confounding effects of COVID-19 which particularly risk impacting views on China). We constructed a new dataset based on a variety of open data sources such as the World Bank, GDELT, China Global Investment Tracker, and Afrobarometer and collected data based on desk research (for example, on Chinese media presence and Chinese workers’ presence in the host country). We use a fixed-effect model and control for previously identified factors impacting public perception, including China’s foreign direct investment (FDI) as a share of total FDI, trade with China as a share of total trade, the number of Confucius Institutes (China-sponsored language and cultural institutes that aim to educate local communities on China), the number of Chinese workers in the recipient country, the number of Chinese media branches, the number of Chinese-invested media branches, and the number of local Twitter accounts run by Chinese embassies. We further explore the moderating effects of the unemployment rate and the attitude toward climate change at the national level [8] in 32 African countries.
Our analyses find that increased investment in green energy positively impacted the average public perception of China. At the same time, we found no statistically significant effect of non-green energy investment on public perception, despite the belief that non-green energy projects (like coal, gas, and oil) are larger in scale and thus more likely to contribute to the local economy and employment.
These results indicate that public perception in African countries is shaped by environmental considerations when Chinese project developers come into their country, compared to purely economic considerations. This implies that green economic engagement also has non-monetary benefits on public perception and in extension on soft power. A conclusion should be that countries like China can strengthen environmental considerations in investment decision-making to legitimize long-term international business and bilateral relations, as well as to maintain a positive national image in Africa.
This research expands the growing literature on green and sustainable finance [9,10] and development finance [6,11] by taking into consideration a novel aspect by analyzing the effects of green investment on public perception using China as a case study. It empirically expands previously conceptual literature on “green” soft power [7,12,13].
This article is structured as follows: Section 2 reviews the literature on how economic activities might influence public perception in the recipient countries, the effects of China’s overseas investment on its national image, and how green finance, as a sub-category of financial flows, affect public perception differently from non-green finance. Section 3 develops three hypotheses on the relationships between green and non-green energy investments and public perception of China in Africa. Section 4 describes the rationale of variable selection, how we construct the dataset and provides summary statistics on the variables. Section 5 presents results from the baseline model and models to explore the moderating effects of attitude to climate change and the unemployment rate. Finally, Section 6 concludes with policy implications and discusses ways to improve and expand the current research.

2. Literature Review

Existing research has found that economic activities, including investment, trade, and aid, can influence public perception in recipient countries. Wellner et al. [12] used data from the Gallup World Poll and estimated that public support for the Chinese government in a recipient country increases both in the short and long run with the completion of one additional development project. However, such influence can be nuanced in a way that it does not change the average attitude towards China directly, but contributes to more polarized opinions on China between different population groups [13]. Overseas engagement has also been understood as a tool to influence perception in host countries [14], with the effect that the “collective judgments of a foreign country’s image and character (…) are then used to predict or explain its future behaviour” [15].
Green finance, as a research and financial discipline, focuses on identifying environmental (e.g., climate, biodiversity, pollution, adaptation) costs, revenues, and risks in finance and investment [9,16]. The application of green finance aims to reduce negative environmental risks (such as climate change) and accelerate positive environmental opportunities for investors and the broader society. An example of the application of green finance is the engagement in green energy projects (e.g., wind, solar, geothermal) that generate electricity without a negative impact on the environment. In times when climate change is viewed as a most impactful risk from the global business community [17] to the youth in Africa [18] and beyond, the application of green finance could potentially provide indirect returns on public perception and thus increase the soft power of the financiers [7]. Some research suggests that green engagement has the potential to improve perception abroad, for example when Germany promotes domestic experiences of energy transition abroad [19] or that the green credibility of a country can lead to improved soft power [20].
Chinese overseas engagement lends itself as a viable case to study the question of the impact of green finance on public perception. Morgan [21], for example, finds that opinions on China among African countries are primarily driven by China’s economic activities, making “aid, trade, and investment fundamental to Chinese efforts to build soft power on the continent”. Lekorwe et al. [22] suggest that the most important factor contributing to China’s image is China’s investments in infrastructure and other development, followed by concerns over the quality or cost of Chinese products. Custer et al. [23] believe that China sees “financial diplomacy” as one of the tools to improve its overseas image. A reason might be the close ties between Chinese overseas investments and China’s policy goals [24]. Chinese overseas investments can be analyzed as an instrument to improve China’s overseas image [21,25,26] due to three factors. First, the majority of Chinese overseas investments are government sanctioned [6] and follow policy interest in addition to (or without) economic interest [27]. Second, most of the financing for Chinese overseas projects, particularly in the BRI, is provided through government-backer entities, such as China Development Bank and The Export-Import Bank of China, Chinese state-owned banks (particularly ICBC, Bank of China, China Construction Bank), and state-owned investment funds (e.g., Silk Road Fund, China Investment Corporation CIC). Third, with over USD 1 trillion economic engagement in the BRI between 2013 and June 2023 [28], the scale of Chinese investments in the BRI is equally as large as the combined investments of the multilateral development banks in these countries [29].
In recipient countries, one major concern towards Chinese overseas engagement has been its negative environmental impact: China has been accused of exporting its dirty industries (e.g., steel, mining, agriculture) to BRI countries [23,30,31]. Dave [30], for example, argues that “China is moving high-polluting factories to neighboring states”. This has been ascribed to China’s aim to take advantage of lower environmental protection requirements in line with the pollution haven theory [32], whereby China insists on applying host country environmental standards when investing abroad [33] as compared to international standards applied by most international banks through the Equator Principles.
A potential consequence of this export of dirty industries from China to other countries is a negative impact on China’s soft power, understood as how well the public perceives China. Herreror and Xu [34], in their study on the perception of China’s Belt and Road Initiative (BRI), identified ecological sustainability as one of the reasons why of the 131 analyzed countries, 32 countries held strongly negative or somewhat negative views of the BRI, while only 14 countries were considered as holding a strongly positive view of the BRI. Nedopil [7] showed conceptually that China’s soft power might be negatively impacted due to the dichotomy between its narrative of being a champion of green development through its green Belt and Road Initiative and its continuous engagement in environmentally detrimental projects, such as fossil fuel energy investments.
So far, however, no empirical analysis has been undertaken to analyze whether China’s green and non-green investments impact the public perception of China differently in recipient countries. With China’s significant global footprint through its overseas economic and diplomatic engagement, this empirical question seems worthwhile exploring, contributing to informing a Chinese and global academic and practitioner audience.

3. Hypotheses

This study aims to empirically test whether green financial overseas engagement impacts the local perception of the source country differently from general economic engagement, using China as an example. We develop three hypotheses to distinguish different effects:
Hypothesis 1a.
Previous literature finds a positive theoretical and conceptual link between soft power and environmental commitments [7,34]. Accordingly, we hypothesize that in recipient countries with a high share of green engagement coming from China, the public perception of China in the recipient country will improve.
Hypothesis 1b.
Conversely, with a major criticism of Chinese overseas financial engagement being the acceleration of environmental degradation [34], we hypothesize that China’s investment in non-green, particularly brown assets, worsens the public perception of China in the recipient countries.
Hypothesis 2.
Awareness of the environmental impact of investments and the relevance of environmental protection is different across countries [35]. We hypothesize that in countries with a higher percentage of people viewing climate change and environmental issues as an important challenge, the difference in public perception of China resulting from green and non-green investments will be more pronounced.
Hypothesis 3.
In countries with challenging economic conditions (signaled by, e.g., a higher unemployment rate), the public will welcome investment to generate economic growth [36]. In these circumstances, public perception will be more agnostic of the environmental impact of investments. Accordingly, we hypothesize that in countries with higher unemployment rates, there will not be a difference in the public perception of China between green and non-green investments.

4. Data and Methods

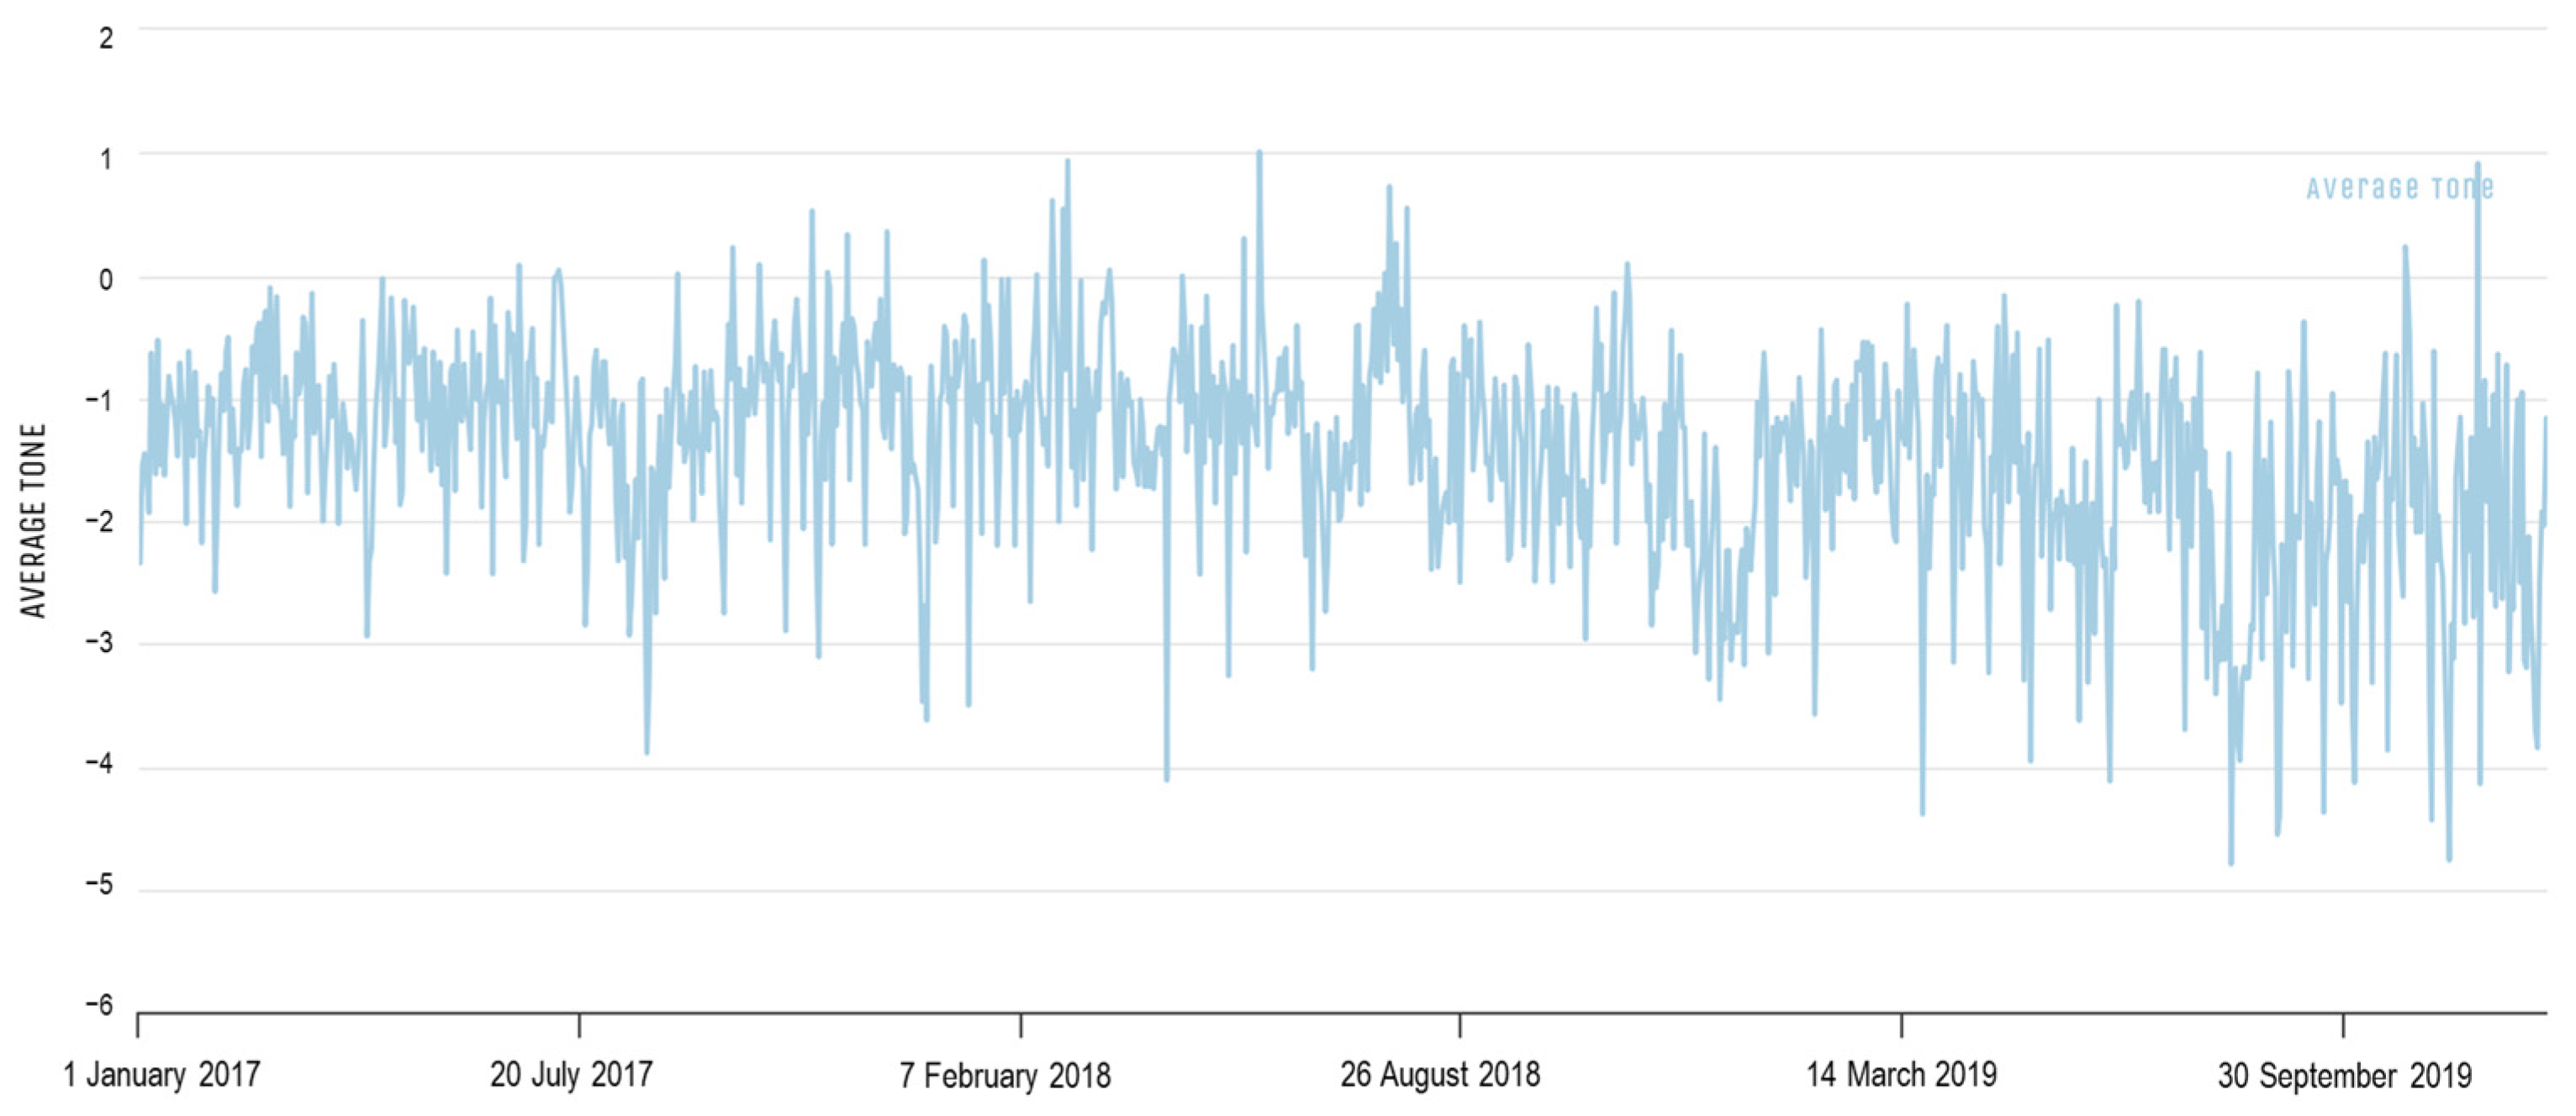
4.1. Dependent Variable

We were inspired by the big data approach of Herrero and Xu [34] and chose the tone of media coverage to measure the dependent variable, the public perception of China in recipient countries.
We extracted tone of media coverage data from the Global Database of Events Language and Tone (GDELT), a project that monitors global news coverage and provides more than 200 million geolocated events with global coverage from 1979 to the present [37]. The database has been used in previous research on public sentiment [34,38], peace [39], social unrest [40,41], and political violence [42]. We utilized the GDELT Summary tool launched in 2017 to extract daily average tones for China in individual African countries directly. GDELT Summary is based on GDELT 2.0 APIs and provides the volume and tone of any keywords across the world’s news media. While its advantage is to specify any keyword, data earlier than 2017 are lacking.
Tones are mostly between −10 and 10, in which the symbol implies a negative or positive tone and the absolute value of the number implies intensity of the tone. Figure 1 is a sample visualization of media average tone in South Africa for China from 2017 to 2019.
We extracted the daily tone of the media coverage of “China” in 32 African countries (a full list is supplied in Appendix A) from 2017 to 2019 and used the annual average tone of media coverage (Figure 2) to measure public perception of China (pp_China).
Despite China’s extensive presence in other BRI countries in Central Asia, Southeast Asia, and Europe, we focus on African countries for three reasons. First, about 50 African countries have signed a BRI cooperation agreement with China, more than any other continent. Second, African countries have received 20% to 30% of China’s outbound investment in infrastructure under the BRI [43], implying their importance in China’s BRI strategy. Third, compared to Asia, another major hotspot for Chinese overseas investments, African countries are less at risk of territorial tensions with China, which usually impacts China’s image among the public. African countries can be considered equidistant from China, given that distance also tends to impact public perception [44].

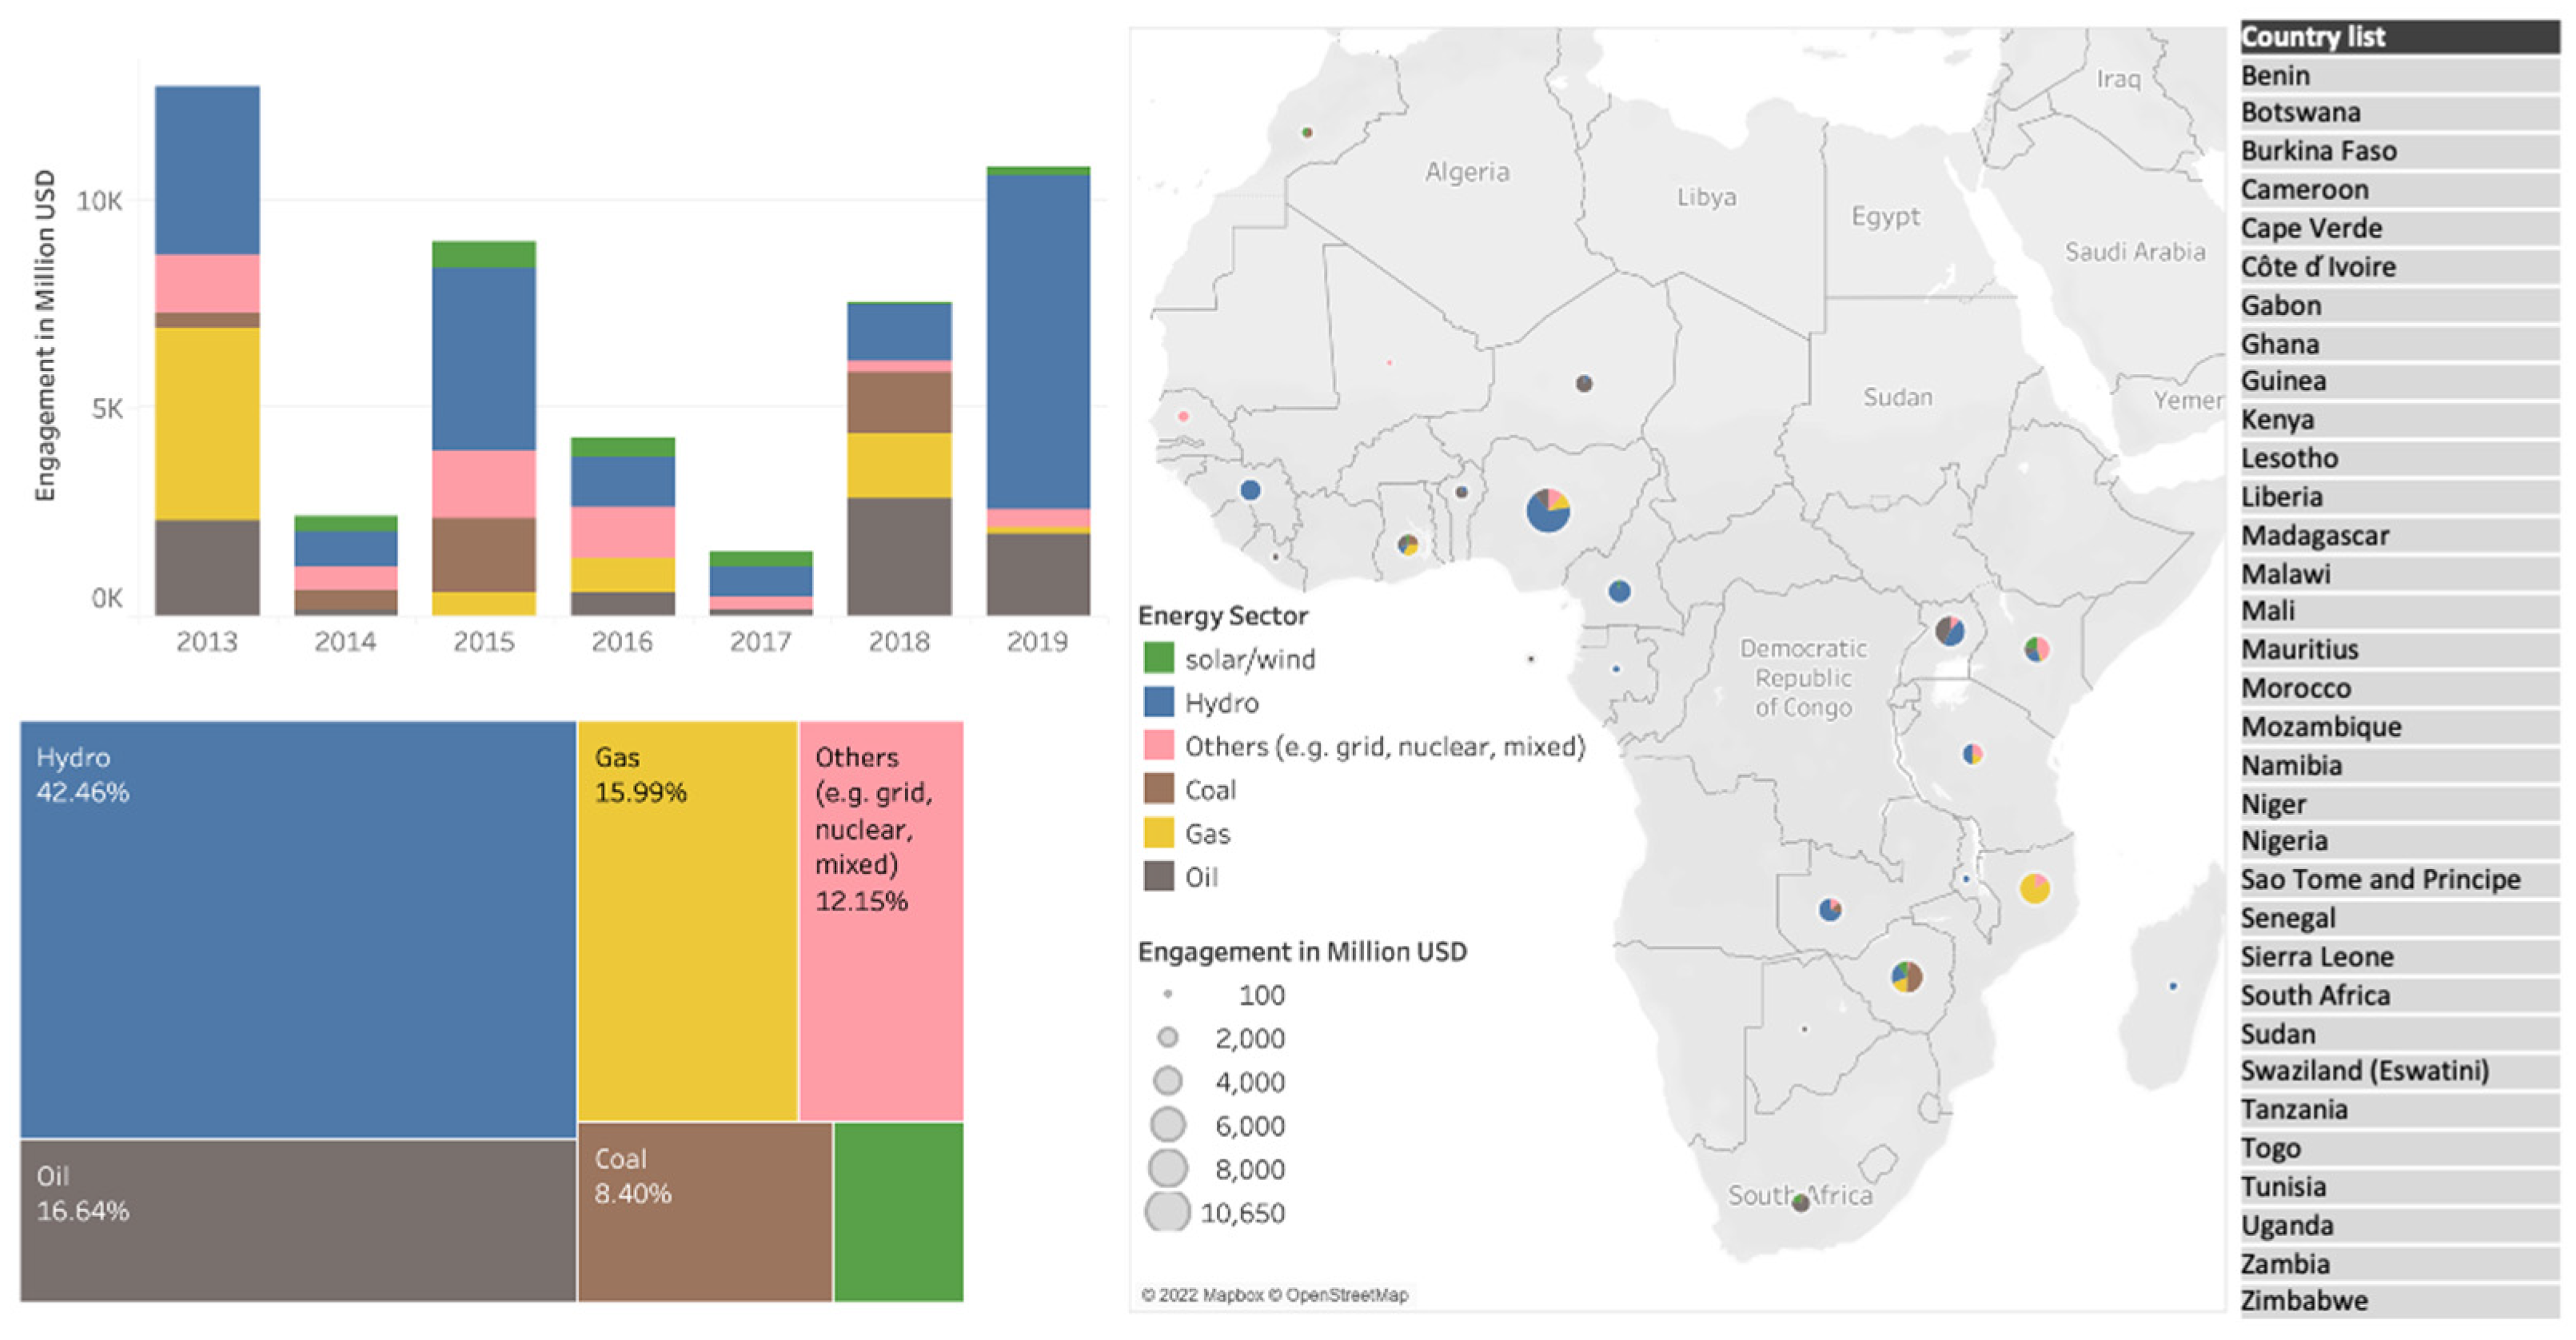
4.2. Exploratory Variables

Between 2013 and 2019, the total contract value of investment and construction projects from Chinese enterprises, banks, and investment funds in these 32 African countries was about US$126 billion. Among others, energy-related investment and construction projects were about US$48 billion, of which about 41% were fossil-related (oil, gas, coal), 42% were hydropower projects, and 4% were solar and wind projects (Figure 3).
For the exploratory variables, we focus on China’s overseas investment in the energy sector for two reasons. First, projects in the energy sector can be more easily classified into green (in this case, solar and wind projects) and non-green projects (in this case, coal, oil, and gas projects) based on sources of power generation. In contrast, project boundaries are more ambiguous in, for example, the transportation or agriculture sectors. Second, investment in energy projects contributes 60% to 70% of Chinese infrastructure investments in the BRI, and infrastructure is seen as the strongest contributing factor to sentiment towards the BRI in the host countries [22].
Therefore, we chose two exploratory variables: the total contract value of China’s investment in renewable energy, including hydropower, solar, and wind, and the total contract value of China’s investment in non-renewable energy, including coal, oil, and gas. Hydropower is regarded as renewable source of energy, but we note that the framing of hydropower as green energy is controversial given its potential harm to biodiversity [45].
Data on China’s energy investment in individual African countries are collected from the China Global Investment Tracker (CGIT) [5]. The CGIT dataset documents China’s global investment and construction activities with a transaction value of larger than USD 100 million in different countries and sectors since 2005.

4.3. Control Variables

We further control for factors that have been previously proven to influence public perception in recipient countries.
Extensive research has shown that trade and investment have an influence on China’s image or soft power in recipient countries (such as [13,21,46]). Accordingly, we include two control variables in the recipient country: FDI from China as a share of the total FDI received by that country, and trade with China as a share of the total international trade by that country.
People-to-people ties are the social foundations of BRI cooperation and one of the five key pillars of the BRI. Huang and Xiang [47] showed how China employs the Confucius Institute to maximize soft power, and Brazys and Dukalskis [48] revealed that Confucius Institutes help improve how China is viewed by foreign publics. Therefore, the number of Confucius Institutes in a recipient country is included as a control variable.
Furthermore, as the presence of Chinese media in BRI countries influences the perception of China [49], we included the number of Chinese media branches (including CGTN Africa, Xinhua news agency, China Daily, China Central Television, and China Radio International) and Chinese-invested media branches (including Startimes) in individual recipient countries.
Finally, the number of Chinese Twitter accounts (including those of the embassy and diplomats) and the number of Chinese workers in each country are included.

4.4. Dataset

Accordingly, we constructed a panel dataset containing the aforementioned variables from 2015 to 2019. In 2015, China started to include more “green” considerations in the BRI, actioned through the adoption of its green finance policy in 2016 [50]. We also use data until 2019 to avoid any impact of COVID-19 which broke out globally in early 2020, as it induced economic and political issues that not only affected financing and investment (global FDI dropped by about 50% from 2019 to 2020), but also posed a more complex influence on China’s national image.
We normalize the exploratory variables using the population size of the recipient country to relate the total investment amount to the size of the public. We use a one-year lag of the explanatory variables for two reasons. First, by using lags we ensure that the public perception captured by GDELT does not pre-date China’s investment activities. Second, it takes at least several months from the announcement of an energy project to the start of construction to pass on the impact to the public perception.
We also included two variables to explore the moderating effect on the results of the baseline model: the public attitude towards climate change, and the unemployment rate of the recipient country.
Table 1 provides the time span, source of data, and summary statistics for each variable.

5. Results

5.1. Baseline Fixed-Effect Model

We aim to analyze the country-level causal effects of Chinese energy investment in African countries on the public perception of China in the recipient country while controlling for factors that the previous literature has shown to influence public perception. To capture other unobserved factors that might affect the perception of China, such as country-level factors that remain relatively constant through the years (e.g., culture, historical events, political system), or time-invariant factors that affect all of the countries at the same time (e.g., an external economic shock, major war, a pandemic), we include a year-fixed-effect variable and a country-fixed-effect variable in the model. The model, therefore, adjusts for country-specific unobservables through comparison across periods within the same country. The Hausman test, which detects endogenous regressors in a dataset and thus supports the choice between fixed-effect and random-effect models, shows a preference for a fixed-effect model over a random-effect model (chi-square statistics of 12.81, df of 6, and p-value of 0.0461).
Accordingly, we estimate the following baseline regression equations respectively for non-renewable energy investment and renewable energy investment:
Yit = β0 + β1Investmenti, t−1 + αXi, t−1 + ηi + μt + εi,t
where Yit refers to host country i’s public perception of China in year t, Investmenti, t−1 measures Chinese investment in non-renewable energy or renewable energy in the host country one year before; Xi, t−1 stands for the country-level control variables one year before; ηi and μt represent country-fixed and year-fixed effects respectively; ε is the error term. Standard errors are clustered at the host-country level.
Table 2 shows the results of the baseline model applied for Hypotheses 1a,b. The outcome variable across all model specifications is the annual average of public perception of China from 2017 to 2019. In column (1), we only include the explanatory variable, China’s investment in renewable energy per capita (investment divided by the population of the host country). In column (2), we control for the group of variables that are proven to affect China’s image. For both specifications, the coefficients for investment in renewable energy are positive, and in the model with control variables, it is both positive and statistically significant. This indicates that increased investment in renewable energy improves the public perception of China in host countries as hypothesized. However, the size of influence remains small: for a one-dollar increase in per capita investment in renewable energy, the tone of media coverage, as a measurement of public perception of China, increases by 0.0028 (Hypothesis 1a). Interestingly, Chinese media presence in the country seems to negatively affect local perception.
The results in columns (3) and (4) show the relationships between public perception of China and the second explanatory variable, i.e., investment in non-renewable energy for Hypothesis 1b. There is a statistically significant and negative relationship in column (3), but the size of influence remains small. When using the preferred model with control variables in column (4), the empirical results fail to show any significant implications of the Chinese investment in non-renewable energy and public perception of China.

5.2. Attitude to Climate Change

To test Hypothesis 2, we include the attitude to climate change as an interacting term with the variables of interest. The attitude to climate change is measured by the percentage of respondents answering “much worse” and “somewhat worse” to the survey question “Do you think climate change is making life in your country better or worse, or haven’t you heard enough to say?” conducted by AfroBarometer in the 2016–2018 round of the survey.
Accordingly, we estimate the following model:
Yit = β0 + β1Investmenti, t−1 + β2Climate2017 + β3Climatei,2017 * Investmenti, t−1 + αXi, t−1 + ηi + μt + εi,t
where Yit refers to host country i’s public perception of China in year t; Investmenti, t−1 measures Chinese investment in non-renewable energy or renewable energy in the host country one year before; Climate2017 is a binary variable that separates all countries into two groups: countries with 50% or more of all respondents recognizing the negative effects of climate change, and countries with less than 50% of all respondents recognizing the negative effects of climate change; Xi, t−1 stands for the country-level control variables one year before; ηi and μt represent country-fixed and year-fixed effects respectively; ε is the error term.
Table 3 shows the results. Despite the assumption that in countries with more people recognizing the negative effects of climate change, the public is inclined to welcome renewable investment, and thus become more favorable to China, the empirical results show no evidence to support this hypothesis.

5.3. Unemployment Rate

To test Hypothesis 3, we include the unemployment rate as an interacting term with the variables of interest. Using unemployment data from World Development Indicators of the World Bank, we estimate the following model:
Yit = β0 + β1Investmenti, t−1 + β2Unemploymenti, t−1 + β3Unemploymenti, t−1 * Investmenti, t−1 + αXi, t−1 + ηi + μt + εi,t
where Yit refers to host country i’s public perception of China in year t; Investmenti, t−1 measures Chinese investment in non-renewable energy or renewable energy in the host country one year before; Xi, t−1 stands for the country-level control variables one year before; ηi and μt represent country-fixed and year-fixed effects respectively; ε is the error term.
We use two measurements of the unemployment rate (one year before) to capture its moderating effect on energy investment, denoted by Unemploymenti, t−1. First, we use it in the original form, as a continuous variable with variations across year and country. Second, we use a categorical variable showing the level of the unemployment rate (<10% as low, 10–20% as mid, and >20% as high) in each host country one year before.
As is shown in Table 4, column (1) represents the moderating effect of the unemployment rate (as a continuous variable, denoted by (c)) with non-renewable investment; column (2) shows the moderating effect of the unemployment rate (as a continuous variable, denoted by (c)) with renewable investment; column (3) shows the moderating effect of the unemployment rate (as a categorical variable, denoted by (i)) with non-renewable investment; column (4) shows the moderating effect of the unemployment rate (as a categorical variable, denoted by (i)) with renewable investment.
The results partially support Hypothesis 3. As is shown in column (3), the coefficient of the interaction term of non-renewable investment and the unemployment rate is positive and statistically significant. This implies that the effect of non-renewable investment in the perception of China is enlarged by higher levels of the unemployment rate. For countries with a significant increase in the level of unemployment (e.g., 10–20% compared with less than 10%), the influence of a unit increase of non-renewable investment on the tone of media coverage (the measurement of public perception) of China is 0.456 higher. One intuitive explanation might be the prevalent belief that non-renewable energy projects create more jobs. However, the influence of the unemployment rate is not statistically significant for the model specification in columns (1) and (2). Therefore, for a small and continuous increase in the unemployment rate, the perception of China is hardly affected.

6. Discussion

In this article, we examine the relationship between China’s renewable energy investment in 32 African countries and public perception of China in recipient countries with a country-level dataset from 2015 to 2019. Building on the literature that relates overseas investment to public perception, national image, and soft power [13,23], we show that China’s overseas green finance in the energy sector has the potential to improve the public perception of China in recipient countries.
We come to this conclusion by constructing a dataset of China’s overseas energy investment and public perception in 32 African countries from 2015 to 2019 and exploring the causal effect of China’s investment in renewable energy (including hydropower, solar, and wind), and investment in non-renewable energy (including coal, gas, and oil) on the public perception of China in recipient countries, represented by the tone data from the Global Database of Events Language and Tone (GDELT). We also control for previously identified factors impacting public perception, including China’s foreign direct investment (FDI) as a share of total FDI, trade with China as a share of total trade, the number of Confucius Institutes, the number of Chinese workers in the recipient country, the number of Chinese media branches, the number of Chinese-invested media branches, and the number of local Twitter accounts run by Chinese embassies. We find, first, that renewable energy engagement improves the public perception of China in recipient African countries. However, the size of the influence remains small. Second, we find no empirical evidence to support the hypothesis that for countries with a higher percentage of people recognizing the negative effects of climate change, the perception of China will be more positively affected by renewable energy investment. Thirdly, we find that a higher unemployment rate could enlarge the influence of China’s non-renewable investment on the public perception of China.
These results give credence to the notion that overseas green energy engagement can improve public perception of the source country in the recipient country. This, in practice, should lead to the conclusion that governments interested in improving their public perception abroad should include environmental considerations in their policies on export finance.
This paper contributes particularly to the literature on green finance [9,10] and the hitherto conceptual literature on the relationship between green overseas finance and soft power [7,34] by providing the first empirical analysis of green finance on public perception as a proxy for soft power. This paper also contributes to the growing literature on China’s overseas footprint through its Belt and Road Initiative [3,51,52] and broader overseas economic engagement including on political economy [21,53,54,55].
We also note several limitations of this study. First, GDELT provides a limited time starting from 2017 for analyzing the public perception of any keywords of interest (i.e., “China”). As we excluded data after 2019 to avoid the impacts of COVID-19 on the public perception of China, we used a relatively short time frame and the data size limits statistical significance. We further note that data on Chinese overseas finance is incomplete, with various data sources showing different engagement sizes [56]. We decided to use one data source, the China Global Investment Tracker [5], to avoid data collision issues.
We thus recommend that to further understand this relationship between green overseas finance and public perception abroad, more research is needed to substantiate our findings. First, a future study on the impacts of (green) Chinese overseas finance could be expanded by including more countries. Second, to further substantiate the theoretical implications, a future study could look at green versus non-green investments by other countries, e.g., US or German overseas investments. Finally, a future study could include an assessment at sub-national levels, for example, whether renewable investments affect the perception of China differently within the same state or province, and what might be the potential drivers for such variation.

Author Contributions

C.N.: Conceptualization, Investigation, Writing—Original Draft, Writing—Review and Editing, Supervision, M.Y.: Formal analysis, Investigation, Writing—Original Draft, Writing—Review and Editing. All authors have read and agreed to the published version of the manuscript.

Funding

This research received no external funding.

Institutional Review Board Statement

Not applicable.

Informed Consent Statement

Not applicable.

Data Availability Statement

Data used in the study comes from: GDELT, AfroBarometer, China Global Investment Tracker (American Enterprise Institute, https://www.aei.org/china-global-investment-tracker/, accessed on 23 November 2021), Chinese Global Foreign Aid (China Africa Research Institute, https://www.sais-cari.org/data-chinese-global-foreign-aid, accessed on 23 November 2021), China-Africa Trade (China Africa Research Institute, https://www.sais-cari.org/data-china-africa-trade), Chinese Workers in Africa (China Africa Research Institute, https://www.sais-cari.org/data-chinese-workers-in-africa, accessed on 23 November 2021), World Bank World Development Indicators.

Conflicts of Interest

The authors declare no conflicts of interest.

Appendix A. List of 32 African Countries included in the Analysis

No.CountryCountry Code
1BeninBEN
2BotswanaBWA
3Burkina FasoBFA
4CameroonCMR
5Cape VerdeCPV
6Côte d'IvoireCIV
7GabonGAB
8GhanaGHA
9KenyaKEN
10LesothoLSO
11LiberiaLBR
12MadagascarMDG
13MalawiMWI
14MaliMLI
15MauritiusMUS
16MoroccoMAR
17MozambiqueMOZ
18NamibiaNAM
19NigerNER
20NigeriaNGA
21Sao Tome and PrincipeSTP
22SenegalSEN
23Sierra LeoneSLE
24South AfricaZAF
25SudanSDN
26Swaziland (Eswatini)SWZ
27TanzaniaTZA
28TogoTGO
29TunisiaTUN
30UgandaUGA
31ZambiaZMB
32ZimbabweZWE

References

  1. Nakano, J. Greening or Greenwashing the Belt and Road Initiative? Center for Strategic & International Studies: Washington, DC, USA, 2019. [Google Scholar]
  2. Ploywarin, S.; Song, Y.; Sun, D. Research on Factors Affecting Public Risk Perception of Thai High-Speed Railway Projects Based on “Belt and Road Initiative”. Sustainability 2018, 10, 1978. [Google Scholar] [CrossRef]
  3. Xin, L.; Wang, Y. Towards a green world: The impact of the Belt and Road Initiative on the carbon intensity reduction of countries along the route. Environ. Sci. Pollut. Res. 2022, 29, 28510–28526. [Google Scholar] [CrossRef]
  4. Zhou, L.; Gilbert, S.; Wang, Y.; Cabré, M.M.; Gallagher, K.P. Moving the Green Belt and Road Initiative: From Words to Actions; World Resources Institute: Washington, DC, USA, 2018. [Google Scholar]
  5. Scissors, D. China Global Investment Tracker (CGIT). 2022. Available online: https://www.aei.org/china-global-investment-tracker/ (accessed on 23 November 2021).
  6. Gallagher, K.S.; Qi, Q. Policies Governing China’s Overseas Development Finance Implications for Climate Change; Center for International Environment and Resource Policy: Medford, MA, USA, 2018. [Google Scholar]
  7. Nedopil, C. Green finance for soft power: An analysis of China’s green policy signals and investments in the Belt and Road Initiative. Environ. Policy Gov. 2022, 32, 85–97. [Google Scholar] [CrossRef]
  8. Selormey, E.E.; Dome, M.Z.; Osse, L.; Logan, C. Change Ahead: Experience and Awareness of Climate Change in Africa; Afrobarometer Policy Paper No. 60; Afrobarometer: Accra, Ghana, 2019; p. 30. [Google Scholar]
  9. Sachs, J.D.; Woo, W.T.; Yoshino, N.; Taghizadeh-Hesary, F. Why Is Green Finance Important? SSRN Electron. J. 2019. [Google Scholar] [CrossRef]
  10. Weber, O. Sustainable Banking—History and Current Developments. SSRN Electron. J. 2012. [Google Scholar] [CrossRef]
  11. Humphrey, C.; Michaelowa, K. China in Africa: Competition for traditional development finance institutions? World Dev. 2019, 120, 15–28. [Google Scholar] [CrossRef]
  12. Wellner, W.; Dreher, A.; Fuchs, A.; Parks, B.C.; Strange, A. Can Aid Buy Foreign Public Support? Evidence from Chinese Development Finance; Global Research Institute: Williamsburg, VA, USA, 2022. [Google Scholar]
  13. Eichenauer, V.Z.; Fuchs, A.; Brückner, L. The effects of trade, aid, and investment on China’s image in Latin America. J. Comp. Econ. 2021, 49, 483–498. [Google Scholar] [CrossRef]
  14. Gupta, R. Soft Power: China’s Emerging Strategy in International Politics by Mingjiang Li (Ed.): Lexington Books, Plymouth, 2009, 275 pp., US$80, ISBN 978-0-7391-3377-4. Strateg. Anal. 2010, 35, 154–155. [Google Scholar] [CrossRef]
  15. Mercer, J. Reputation and International Politics; Cornell University Press: Ithaca, NY, USA, 2010; ISBN 978-0-8014-7489-7. [Google Scholar]
  16. Linnenluecke, M.K.; Smith, T.; McKnight, B. Environmental finance: A research agenda for interdisciplinary finance research. Econ. Model. 2016, 59, 124–130. [Google Scholar] [CrossRef]
  17. World Economics Forum. Global Risks Report 2022; World Economics Forum: Cologny, Switzerland, 2022. [Google Scholar]
  18. Ichikowitz Family Foundation. African Youth Survey 2022; Ichikowitz Family Foundation: Sandton, South Africa, 2022. [Google Scholar]
  19. Quitzow, R.; Thielges, S. The German energy transition as soft power. Rev. Int. Polit. Econ. 2022, 29, 598–623. [Google Scholar] [CrossRef]
  20. McClory, J. The Soft Power 30: A Global Rannking of Soft Power; Korea Foundation: Seogwipo-si, Republic of Korea, 2019. [Google Scholar]
  21. Morgan, P. Can China’s Economic Statecraft Win Soft Power in Africa? Unpacking Trade, Investment and Aid. J. Chin. Polit. Sci. 2019, 24, 387–409. [Google Scholar] [CrossRef]
  22. Lekorwe, M.; Chingwete, A.; Okuru, M.; Samson, R. China’s Growing Presence in Africa Wins Largely Positive Popular Reviews; Afrobarometer Round 6; Afrobarometer: Accra, Ghana, 2016. [Google Scholar]
  23. Custer, S.; Sethi, T.; Solis, J.A.; Lin, J.J.; Ghose, S.; Gupta, A.; Knight, R.; Baehr, A. Silk Road Diplomacy: Deconstructing Beijing’s Toolkit to Influence South and Central Asia; AidData: Williamsburg, VA, USA, 2019. [Google Scholar]
  24. De Rambures, D.; Felipe Escobar, D. China’s Decision Making System. In China’s Financial System; Springer: Cham, Switzerland, 2017; pp. 5–19. [Google Scholar]
  25. Kurlantzick, J. China’s Soft Power in Africa. In Soft Power: China’s Emerging Strategy in International Politics; Lexington Books: Lanham, MD, USA, 2009; pp. 165–184. [Google Scholar]
  26. Kurlantzick, J. Charm Offensive: How China’s Soft Power is Transforming the World; Yale Univ. Press: New Haven, CT, USA, 2008; ISBN 978-0-300-13628-9. [Google Scholar]
  27. Examining the Cross-Border Acquisition Strategy of Chinese Companies: The Moderating Roles of State Ownership and Institutional Transition—Jiatao Li, Zhenzhen Xie. 2013. Available online: https://journals.sagepub.com/doi/abs/10.1177/1548051812472371 (accessed on 17 December 2023).
  28. Nedopil, C. China Belt and Road Initiative (BRI) Investment Report 2023 H1; FISF Green Finance & Development Center Brief; FISF Green Finance & Development Center: Shanghai, China, 2023. [Google Scholar]
  29. Lu, Y.; Springer, C.; Steffen, B. Cofinancing and Infrastructure Project Outcomes in Chinese Lending and Overseas Development Finance; GCI Working Paper; Boston University Global Development Policy Center: Boston, MA, USA, 2023. [Google Scholar]
  30. Dave, B. Silk Road Economic Belt: Effects on China’s soft power diplomacy in Kazakhstan. In China’s Belt and Road Initiative and Its Impact on Central Asia; Central Asia Program; George Washington University: Washington, DC, USA, 2018; pp. 101–109. [Google Scholar]
  31. Ma, J.; Zadek, S. Decarbonizing the Belt and Road—A Green Finance Roadmap; McKinsey & Company: Chicago, IL, USA, 2019. [Google Scholar]
  32. Mabey, N.; McNally, R. Foreign Direct Investment and the Environment: From Pollution Havens to Sustainable Development; WWF-UK: Woking, UK, 1998. [Google Scholar]
  33. Voituriez, T.; Yao, W.; Larsen, M.L. Revising the ‘host country standard’ principle: A step for China to align its overseas investment with the Paris Agreement. Clim. Policy 2019, 19, 1205–1210. [Google Scholar] [CrossRef]
  34. Herreror, A.G.; Xu, J. Countries’ Perception of China’s Belt and Road Initiative: A Big Data Analysis; Bruegel: Brussels, Belgium, 2019. [Google Scholar]
  35. Pew Research Center Global Indicators Database. 2019. Available online: https://www.pewglobal.org/database/ (accessed on 29 June 2021).
  36. Busse, M.; Groizard, J.L. Foreign Direct Investment, Regulations, and Growth; Social Science Research Network: Rochester, NY, USA, 2006. [Google Scholar]
  37. Leetaru, K.; Schrodt, P.A. GDELT: Global data on events, location, and tone. In ISA Annual Convention; Citeseer: Pittsburgh, PA, USA, 2013. [Google Scholar]
  38. Lu, X.; Chan, F.K.S.; Li, N.; Chen, C.; Chen, W.-Q.; Chan, H.K. Improving urban flood resilience via GDELT GKG analyses in China’s Sponge Cities. Sci. Rep. 2022, 12, 20317. [Google Scholar] [CrossRef]
  39. Voukelatou, V.; Miliou, I.; Giannotti, F.; Pappalardo, L. Understanding peace through the world news. EPJ Data Sci. 2022, 11, 2. [Google Scholar] [CrossRef]
  40. Galla, D.; Burke, J. Predicting Social Unrest Using GDELT. In Machine Learning and Data Mining in Pattern Recognition; Perner, P., Ed.; Lecture Notes in Computer Science; Springer: Cham, Switzerland, 2018; Volume 10935, pp. 103–116. ISBN 978-3-319-96132-3. [Google Scholar]
  41. Qiao, F.; Li, P.; Zhang, X.; Ding, Z.; Cheng, J.-J.; Wang, H. Predicting Social Unrest Events with Hidden Markov Models Using GDELT. Discret. Dyn. Nat. Soc. 2017, 2017, 8180272. [Google Scholar] [CrossRef]
  42. Hammond, J.; Weidmann, N.B. Using machine-coded event data for the micro-level study of political violence. Res. Polit. 2014, 1, 205316801453992. [Google Scholar] [CrossRef]
  43. Nedopil, C. China Belt and Road Initiative (BRI) Investment Report 2021; Green Finance & Development Center: Shanghai, China, 2022. [Google Scholar]
  44. Milanowitsch, B.K. Impact of Asian Soft Power in Latin America—China and South Korea as Emerging Powers in the Subcontinent. Ph.D. Thesis, Philipps-Universität Marburg, Marburg, Germany, 2018. [Google Scholar] [CrossRef]
  45. Geist, J. Editorial: Green or red: Challenges for fish and freshwater biodiversity conservation related to hydropower. Aquat. Conserv. Mar. Freshw. Ecosyst. 2021, 31, 1551–1558. [Google Scholar] [CrossRef]
  46. Blair, R.A.; Marty, R.; Roessler, P. Foreign Aid and Soft Power: Great Power Competition in Africa in the Early Twenty-first Century. Br. J. Polit. Sci. 2022, 52, 1355–1376. [Google Scholar] [CrossRef]
  47. Huang, W.; Xiang, J. Pursuing Soft Power through the Confucius Institute: A Large-N Analysis. J. Chin. Polit. Sci. 2019, 24, 249–266. [Google Scholar] [CrossRef]
  48. Brazys, S.; Dukalskis, A. Rising Powers and Grassroots Image Management: Confucius Institutes and China in the Media. Chin. J. Int. Polit. 2019, 12, 557–584. [Google Scholar] [CrossRef]
  49. Zhang, X.; Wasserman, H.; Mano, W. (Eds.) China’s Media and Soft Power in Africa; Palgrave Macmillan: New York, NY, USA, 2016; ISBN 978-1-349-71377-6. [Google Scholar]
  50. Wang, Y.; Zadek, S. Establishing China’s Green Financial System: Progress Report 2017; United Nations Environment Programme: Nairobi, Kenya, 2017. [Google Scholar]
  51. Li, D.; Chen, X.; Wohlfarth, P. Public participation, investment networks, and China’s outward FDI: Evidence from 58 countries along the belt and road. Emerg. Mark. Rev. 2022, 51, 100887. [Google Scholar] [CrossRef]
  52. Yu, S.; Qian, X.; Liu, T. Belt and road initiative and Chinese firms’ outward foreign direct investment. Emerg. Mark. Rev. 2019, 41, 100629. [Google Scholar] [CrossRef]
  53. Blanchard, J.-M.F.; Lu, F. Thinking Hard About Soft Power: A Review and Critique of the Literature on China and Soft Power. Asian Perspect. 2012, 36, 565–589. [Google Scholar] [CrossRef]
  54. Buckley, P.J. China’s Belt and Road Initiative and the COVID-19 crisis. J. Int. Bus. Policy 2020, 3, 311–314. [Google Scholar] [CrossRef]
  55. Dong, Y.; Fan, C. The role of China’s aid and ODI in the economic growth of African countries. Emerg. Mark. Rev. 2020, 44, 100713. [Google Scholar] [CrossRef]
  56. Zhou, L.; Ma, Z.; Liu, S.; Ma, X.; Acker, K.; Myers, M.; Brautigam, D.; Gallagher, K. China Overseas Finance Inventory Database; World Resources Institute: Washington, DC, USA, 2022. [Google Scholar] [CrossRef]
Figure 1. Media daily average tone towards China in South Africa, 2017 to 2019.
Sustainability 16 00590 g001
Figure 2. Annual average tone towards China in 32 African Countries, 2017 to 2019.
Sustainability 16 00590 g002
Figure 3. China’s energy-related engagement in 32 selected African countries. Source: Scissors (2022) and Green Finance & Development Center.
Sustainability 16 00590 g003
Table 1. Summary statistics of variables.
VariableTime SpanSourceNumber of ObsMeanStandard DeviationMinMax
Public perception of China2017–2019GDELT96 *−0.4060.574−1.8650.552
Chinese investment in renewable energy (million US$)2015–2019CGIT16511251205790
Chinese investment in non-renewable energy (million US$)2015–2019CGIT16588.336402600
China’s FDI as a share of total FDI 2015–2019CARI1280.1080.229−0.6491.282
Trade with China as a share of total trade2015–2019CARI and World Bank1280.1480.1270.01790.612
# of Chinese workers2015–2019CARI1312361.9242593.776011,088
# of Confucius Institutes2015–2019Web search1651.2121.10906
# of Chinese media branches 2015–2019Web search1650.5820.82004
# of Chinese-invested media branches 2015–2019Web search1650.3820.48701
# of Chinese embassy Twitter accounts 2015–2019Web search1650.0550.22801
Percentage of people responding climate change has a negative impact (%)2017Afrobarometer3266.45615.23731.593.1
Unemployment rate2015–2019World Bank1658.9637.4480.47128.181
* We collected 1095 daily tones between 2017 and 2019 for each country, and aggregate them to annual average to match the scale of other variables.
Table 2. Investment in energy and perception of China.
(1) (2)(3)(4)
Perception of ChinaPerception of ChinaPerception of ChinaPerception of China
Investment in renewable energy0.001650.00288 **
(1.70)(2.80)
Investment in non-renewable energy −0.000156 *−0.000105
(−2.46)(−0.10)
China’s FDI share −0.00605 −0.0366
(−0.05) (−0.26)
China’s trade share 2.469 2.529
(1.67) (1.67)
Number of Chinese workers 0.000101 0.0000689
(1.74) (1.08)
Number of Confucius Institute −0.152 −0.128
(−0.82) (−0.68)
Number of Chinese media branches 0.202 0.210
(1.34) (1.26)
Number of Chinese-invested media branches −0.196 * −0.222 *
(−2.32) (−2.13)
Number of Chinese embassy Twitter accounts −0.120 −0.0773
(−1.37) (−0.65)
R—square0.18020.39840.17470.3728
n96899689
t statistics in parentheses. * p < 0.05, ** p < 0.01, *** p < 0.001
Table 3. Moderating effect of attitude to climate change.
(1)(2)
Perception of ChinaPerception of China
Investment in renewable energy0.00770
(1.60)
Attitude to climate change * investment in renewable energy −0.00511
(−1.04)
Investment in non-renewable energy −0.00000912
(−0.00)
Attitude to climate change * investment in non-renewable energy −0.000122
(−0.05)
n8989
t statistics in parentheses. * p < 0.05, ** p < 0.01, *** p < 0.001.
Table 4. Moderating effect of unemployment rate.
(1)(2)(3)(4)
Perception of ChinaPerception of ChinaPerception of ChinaPerception of China
Investment in non-renewable energy0.00106 −0.000889
(0.64) (−0.93)
Unemployment (c)−0.0537−0.0518
(−0.69)(−0.71)
Investment in non-renewable energy * unemployment (c)−0.000219
(−0.76)
Investment in renewable energy −0.00110 0.000168
(−0.25) (0.05)
Investment in renewable energy * unemployment (c) 0.000309
(1.02)
Unemployment (i) 0.0961−0.00825
(0.59)(−0.07)
Investment in non-renewable energy * unemployment (i) 0.456 ***
(3.79)
Investment in renewable energy * unemployment (i) 0.00327
(0.91)
t statistics in parentheses. * p < 0.05, ** p < 0.01, *** p < 0.001.
Disclaimer/Publisher’s Note: The statements, opinions and data contained in all publications are solely those of the individual author(s) and contributor(s) and not of MDPI and/or the editor(s). MDPI and/or the editor(s) disclaim responsibility for any injury to people or property resulting from any ideas, methods, instructions or products referred to in the content.

