Review

Review: Microemulsions for the Sustainable Development of EOR

1
School of Engineering Sciences, University of Chinese Academy of Sciences, Beijing 100049, China
2
Institute of Porous Flow and Fluid Mechanics, Chinese Academy of Sciences, Langfang 065007, China
3
PetroChina Research Institute of Petroleum Exploration & Development, Beijing 100083, China
*
Author to whom correspondence should be addressed.
Sustainability 2024, 16(2), 629; https://doi.org/10.3390/su16020629
Submission received: 31 October 2023 / Revised: 21 December 2023 / Accepted: 8 January 2024 / Published: 11 January 2024

Abstract

:
Global oil and gas resources are declining continuously, and sustainable development has become a common challenge worldwide. In terms of environmental protection and economic benefits, the application of microemulsions for enhanced oil recovery often requires fewer chemical agents, showing distinct advantages. This paper analyzes the application prospects and trends of middle-phase microemulsions in tertiary oil recovery. The properties of middle-phase microemulsions are introduced, and an overview of the historical development, theoretical framework, influencing factors, and preparation methods of emulsions are provided. From the perspective of oil displacement systems, this paper reviews the selection and characterization methods of emulsions, as well as the interaction mechanisms between emulsions and reservoirs, proposing future research directions. The focus of the paper is on the evaluation and characterization of emulsions, the mechanisms of micro-oil displacement, and the application of advanced CT scanning technology, which gives a new understanding of wettability changes, capillary forces, and miscible solubilization processes, contributing to the reduction in displacement costs and the improvement of economic benefits. In conclusion, the middle-phase microemulsion flooding technique can significantly enhance oil recovery through the comprehensive action of various mechanisms and has been widely used in oil field development.

1. Introduction

The oil and gas resources discovered in conventional oil fields are gradually declining, and the challenges of oil field development are increasing, but the demand for petroleum is increasing day by day. Following water injection treatment, secondary oil production for enhanced oil recovery (EOR) has neared its limits [1,2]. The discontinuous residual oil in reservoirs exists in the form of droplets captured by capillary forces, with about 75% of the original oil in place (OOIP) remaining in untapped zones of the reservoirs [3,4,5,6]. Researchers are actively seeking more sustainable methods for oil extraction and utilization. Advanced techniques and processes, such as polymer flooding, thermal recovery, and microemulsion flooding, can significantly enhance oil recovery, effectively mitigate the depletion of oil resources, and minimize the environmental impact. Moreover, enhanced oil recovery can contribute to reducing our reliance on external energy sources, thereby enhancing national energy security and mitigating the adverse effects of uncontrollable factors on the economy. The application of EOR technologies has the potential to increase the recovery degree of this residual oil, thereby holding substantial development prospects. Microemulsions are an effective tool to implement EOR technologies due to their ability to reduce the interfacial tension between oil and water. This property enables microemulsions to overcome capillary forces and efficiently mobilize isolated oil droplets in the small pores and throats of the reservoirs [7,8,9,10]. Microemulsion flooding is particularly effective in low-permeability reservoirs. Microemulsion flooding involves injecting surfactants and cosolvents to improve the displacement effect of crude oil and enhance the overall oil recovery rate of oil fields. During the microemulsion flooding process, a middle-phase microemulsion will be formed, resulting in extremely low interfacial tension (IFT), typically in the range of 103 to 104 mN·m1. Microemulsions can establish stable structures at the oil–water interface [11,12], which can encase and disperse oil droplets in the aqueous phase. By reducing the contact angle between oil droplets and the aqueous phase, microemulsions can greatly increase oil solubility and mixing. Due to their larger specific surface area, smaller droplet size, low IFT, and unique solubility and penetration capabilities, microemulsions effectively improve the ratio of liquid and water production [13,14,15,16,17].
To date, microemulsions, as a popular EOR method, still face certain disconnections between laboratory experiments and field applications. In laboratory experiments, researchers are focusing on three aspects of microemulsions from a mechanistic standpoint, that is, the properties of the microemulsion itself, including the mechanisms behind their formation and the construction of models for selected middle-phase microemulsions; the evaluation methods for microemulsions, including stability assessments, interfacial tension tests, and core displacement experiments; and the characterization methods for microemulsions, including micro visualization microfluidic technology, CT and other observation methods. As a result, nowadays, the screening efficiency of microemulsion systems is increasing, the understanding of the formation process of middle microemulsions is becoming more and more detailed, and the influences of microemulsions on temperature, salinity, and polymers are becoming clearer. However, field applications face different challenges across various types of reservoirs. For example, low-permeability reservoirs require high injection pressures that may render the displacement of crude oil unfeasible; high-temperature, high-salinity reservoirs can render surfactants ineffective, preventing the formation of microemulsions; and high-permeability reservoirs may have limited time for the emulsification and self-diffusion solubilization of microemulsions. In view of the new understanding of the mechanism of middle-phase microemulsions, the new popular characterization methods, and the new trend of field application, this paper summarizes some of the recent research progress.

2. Formation Mechanisms of Microemulsions

Microemulsions are transparent or semi-transparent stable liquid systems consisting of oil, water, surfactants, and cosolvents. Roger [18] subdivided microemulsions into various types, with three relatively stable Winsor III types, which include bicontinuous phases, liquid crystal (sponge) phases, and micellar phases [19,20,21,22], as shown in Figure 1a–e. Choi [23] noted that based on the composition, properties, and preparation conditions such as temperature, pH, and electrolyte concentration, microemulsions can also form bicontinuous phases, liquid crystal phases, and micellar phases, as shown in Figure 1f–j.
Winsor I type, also known as the lower-phase microemulsion, is characterized by the coexistence of excess oil with O/W microemulsions. It typically forms spherical swollen micelles, with water as the continuous phase and oil as the dispersed phase. It tends to be monodisperse, as shown in Figure 1a,f. As the curvature decreases further, a bicontinuous lamellar phase is obtained, as shown in Figure 1b,g. As spontaneous curvature continues to shift towards the oil, a phase reverse process occurs, resulting in the formation of a liquid crystal (sponge) phase, as illustrated in Figure 1c,h. Subsequently, oil droplets nucleate within the sponge phase, with their size decreasing simultaneously with the spontaneous curvature of the sponge phase, leading to a micellar phase morphology, as shown in Figure 1d,i. In this mixed-phase state, oil droplets are still trapped within the micellar phase. Swollen micelles and oil droplets disperse in the continuous aqueous phase, creating a bimodal size distribution. Due to the surfactant’s metastable high spontaneous curvature, the reversal of the surfactant layer is prevented. If the volume of the aqueous phase or the salinity is increased further, the remaining cylindrical or spherical micelles or droplets will transform into Winsor Type II, as shown in Figure 1e,j. Winsor Type II, also known as the upper-phase microemulsion, is characterized by the coexistence of excess water with W/O microemulsions. In W/O microemulsions, surfactants form inverse micelles in the oil phase, and water is solubilized into the cores of these micelles.
This concept is reflected in the theory proposed by Hohl and Kraume [24], as demonstrated in their rheological tests. They believed that during the emulsification process, pre-aggregates of oil and water are formed, and the number of internal droplets is solely dependent on temperature and concentration and is not influenced by the stirring speed. Inversion of the pre-aggregates’ spontaneous curvature from negative to positive or vice versa can be induced by a change in temperature, as in the so-called phase inversion temperature (PIT) method, or by changing the composition at constant temperature during emulsification, as in the so-called phase inversion composition (PIC) or emulsion inversion point method [25]. Herrera [26] observed that at the optimal concentration for the middle-phase microemulsion, it is not a homogeneous phase but rather exhibits four types of liquid crystal layering. This was verified through NMR, SAXS, and DLS characterizations, which detected distinct signals, particularly differences in particle size and hydrogen signals between the layers. Zhao [27], in an in situ displacement experiment of produced fluids in a micro-model, observed a sponge-like phase characterized by opacity and slightly larger particle size (d = 136 nm) in the lower part of the middle-phase. All these findings indicate that the Winsor model is more complex than the simple representation of three processes.

2.1. Interface Adsorption Film Theory

Schulman and Prince, based on the concept of a third phase [28], proposed that the interfacial film is an intermediate phase located between the water phase and the oil phase. Furthermore, the curvature direction of this film depends on the relative magnitudes of different interfacial tensions. In a microemulsion system, this interfacial film is composed of surfactants and co-surfactants, and based on different component ratios, it can bend towards either the water phase or the oil phase, resulting in the formation of either O/W-type or W/O-type microemulsions. When the interfacial tension γos between the interfacial film and the oil phase is greater than the interfacial tension γws between the interfacial film and the water phase, the interfacial film curves towards the oil phase, giving rise to O/W-type microemulsions. Conversely, when γos is less than γws, the interfacial film bends towards the water phase, leading to the formation of W/O-type microemulsions.

2.2. Instantaneous Negative Interfacial Tension Theory

As the number of active components in the system increases, more molecules may adsorb and mix at the interface, resulting in a continuous reduction in interfacial tension (IFT) [29]. Therefore, under the combined action of surfactants and cosolvents, ultra-low or instantaneous negative interfacial tension (IFT < 0) may be produced. The interfacial tension can approach zero with positive or negative values; the relaxation of the colloidal suspension towards a uniform fluid takes place via an interface of low or of high curvature [30,31]. This spontaneous interface expansion promotes the formation of microemulsions. However, this theory has some limitations. Firstly, negative tensions are not measurable, making this theory suitable only for theoretical research. Secondly, this theory only explains the formation mechanism of middle-phase microemulsions and cannot account for the formation of O/W and W/O microemulsions. Thus, further validation is still required.

2.3. R Ratio Theory

The R ratio theory is primarily used to investigate the interactions between molecules. As surfactants are amphiphilic molecules, their interactions with both oil and water determine the preferred bending direction of the interfacial film. The R ratio reflects the strength of the hydrophobic and hydrophilic properties of the interfacial layer and the variations in microemulsion structure. Researchers can adjust the R value by increasing the branching of hydrophobic groups or the chain length in surfactants [32]. The cohesive energy ratio R can describe the relationships mentioned above through Equation (1):
R = A s o A o o A i i A s w A w w A h h
where Aso and Asw represent the binding energies between the oil/water and surfactant, respectively. Aoo and Aww are the cohesive energies of oil and water; Aii stands for the binding energy of the surfactant’s hydrophobic group; and Ahh denotes the binding energy of the surfactant’s head group. The R ratio corresponds to different types of microemulsions as shown in Table 1.

2.4. Hydrophilic–Lipophilic Difference Theory

Researchers initially proposed the hydrophilic–lipophilic balance (HLB) theory to prepare microemulsions by controlling different temperatures (PIT) and different component contents (PIC). Lin proposed the phase inversion composition (PIC) method or the emulsion inversion point method [33]. However, this method cannot control the major parameters affecting microemulsion behavior, such as salinity, oil properties, pressure, and surfactant and co-surfactant parameters. Subsequently, Salager put forward the hydrophilic–lipophilic difference (HLD) theory and the HLD equation to describe microemulsion systems. In contrast with HLB values, which only consider formulation and equilibrium, the HLD theory reflects the Winsor model but with significantly different formulaic forms for various types of surfactants. Negative, positive, and zero values of HLD represent Type I, Type II, and Type III microemulsion systems, respectively. Anionic surfactants, which are the most commonly used for enhanced oil recovery, have the HLD equation as shown in Equation (2) [34].
H L D = ln ( C s e ) + C C K × E A C N + f ( A ) α T T β P
where C s e represents salinity, C c and K are surfactant properties, EACN represents the oil equivalent alkane number, β represents the ethanol constant, T and α T represent temperature constants, and P represents the pressure constant. In recent years, the parameter control methods for the HLD equation are mainly as shown in Table 2.
Since there are many parameters and they are not easy to obtain, scholars often use the net average curvature equation (HLD-NAC) to simplify them. Jin [39] proposed HLD-NAC equation modeling with a non-iterative algorithm. By modeling the solubilization ratio curves and phase volume fractions of different microemulsion systems, the HLD values can still be calculated using the natural logarithm of salinity for optimal salinity in the absence of information on surfactant characteristic curvature. In the following year, Jin [40] proposed using UTCHEM software (UTCHEM-9.0) to simulate the emulsification and displacement processes, which not only allows for predicting the optimal surfactant formulations but also the phase behaviors of microemulsions based on environmental conditions and surfactant structures.

3. Study of the Phase Behaviors of Microemulsions

Phase behavior control is one of the crucial parameters in the preparation of microemulsions. Traditional phase behavior experiments involving salt scans to find the optimal middle-phase system are time-consuming, especially since different surfactant concentrations may result in various salt concentrations for achieving the best middle-phase system. When using the HLD equation modeling approach, parametric design lacks intuitive expression. Therefore, there is a need for a more straightforward and intuitive method to construct models that quantitatively describe the formation regions and stability of microemulsions, optimize microemulsion formulations, and define the formation boundaries and stability limits of microemulsions. Additionally, phase diagrams can be utilized to explore changes in the properties and interactions of microemulsions. By studying the phase behaviors of microemulsions under different conditions, such as phase transitions and phase separations, researchers can gain insights into the stability mechanisms, interfacial properties, and interaction patterns of microemulsions. To efficiently determine the conditions for forming middle-phase microemulsions, researchers employ phase diagram methods, including Winsor phase diagrams, ternary phase diagrams, and fish-like diagrams, for screening and characterization.

3.1. Winsor Phase Diagrams

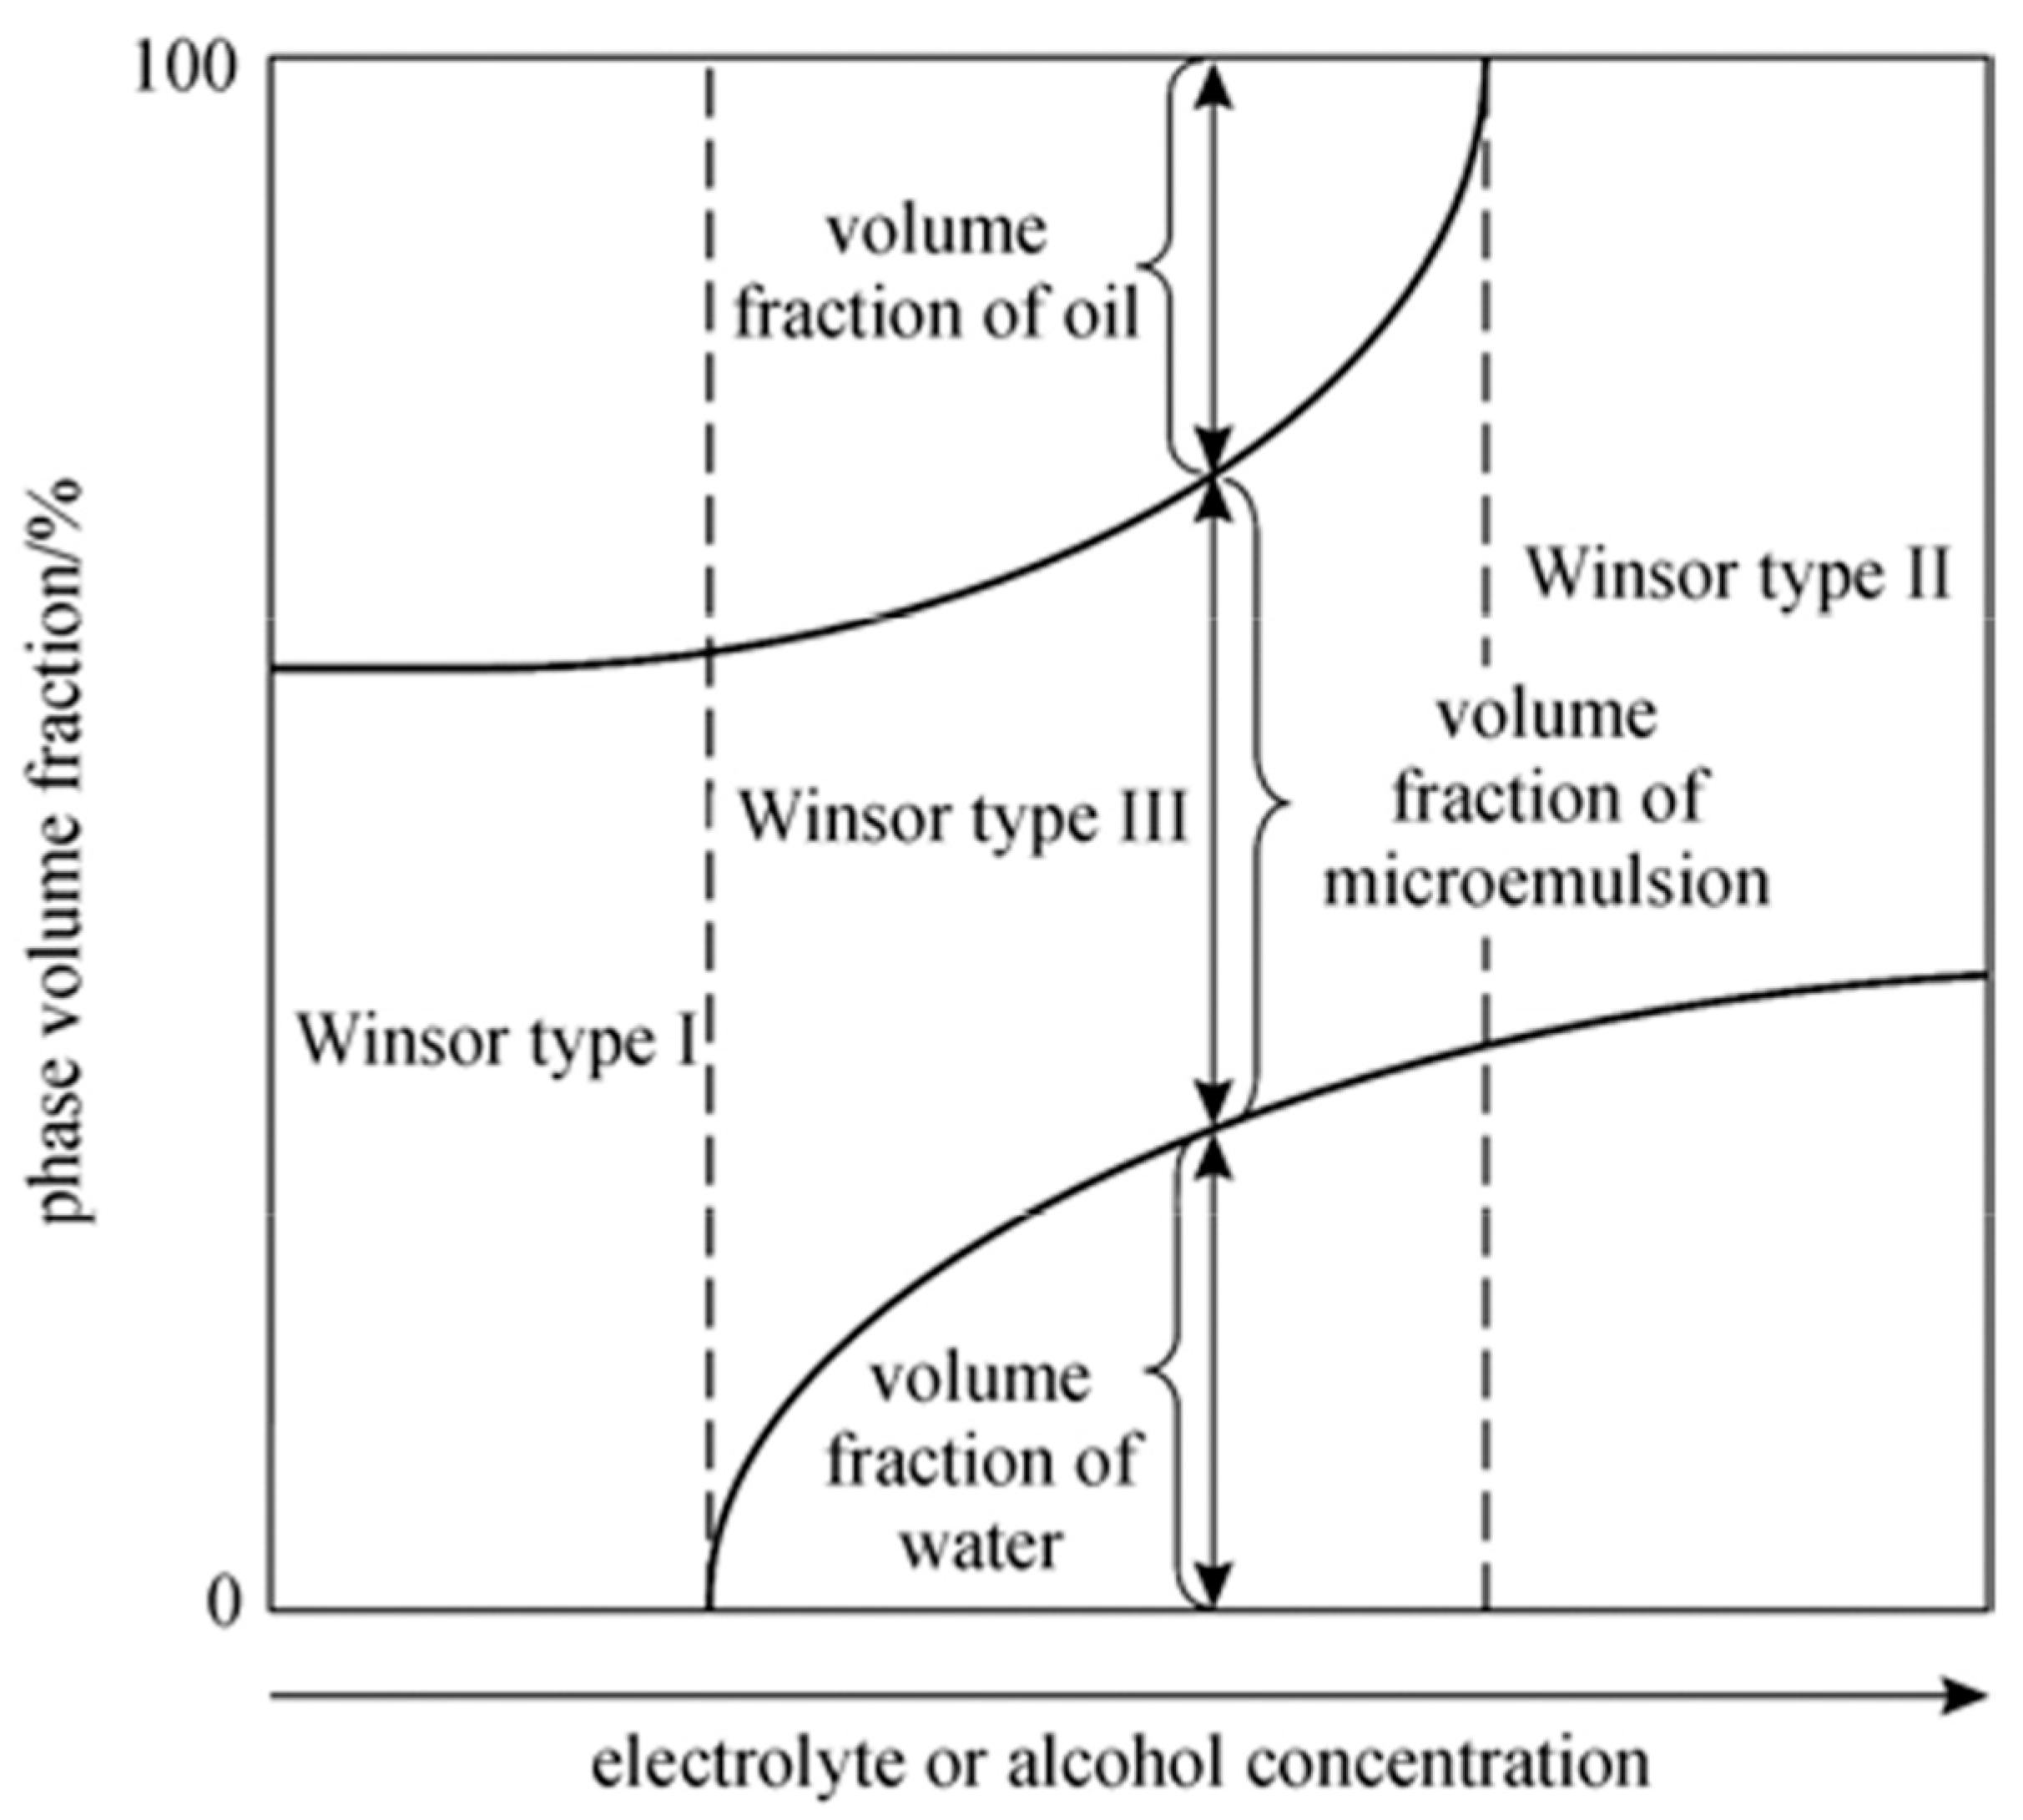
Winsor phase diagrams are typically employed to depict changes in the phase behavior of a system. These diagrams illustrate the volume or volume fraction of each phase, allowing for the determination of the width of the alcohol region and the salt region. Winsor phase diagrams can aid in selecting the most suitable salt for a given system. For example, Yao [41] compared the ranking of different emulsification degrees of three petroleum sulfonates and found that the solubilization of the middle phase is the best when describing the hydrophilic–lipophilic balance with salt region width (Figure 2). Yin [42] used the Winsor phase diagram approach to study the influence of NaCl and n-butanol dosage on the phase behavior of dodecyl dimethyl betaine/n-butanol/n-hexane/NaCl microemulsion systems, as well as the effects of changes in phase volumes on the solubilization ability and interfacial tension of the microemulsions, ultimately determining that the NaCl salt width for the middle-phase microemulsions is 3.75%. By using Winsor phase diagrams, Luo [43,44] discovered that as the carbon chain of the alcohol increases, the required NaCl concentration for the formation and disappearance of middle-phase microemulsions also increases. In this context, the salt width and optimal salt concentration both decrease. Liu [45] conducted research to compare the impacts of different electrolyte ion types and valences, such as KCl, CaCl2, NaCl, and Na2CO3, on microemulsions at various ion concentrations. The results were reflected in Winsor phase diagrams, with the author obtaining the conclusion about the quantified controlling factors. However, it is important to note that Winsor phase diagrams may not provide information about the composition of the mixed interfacial films during the formation of single-phase microemulsions and middle-phase microemulsions. This indicates that these diagrams are not suitable for assessing solubilization efficiency in a comprehensive manner.

3.2. Fish-like Diagrams

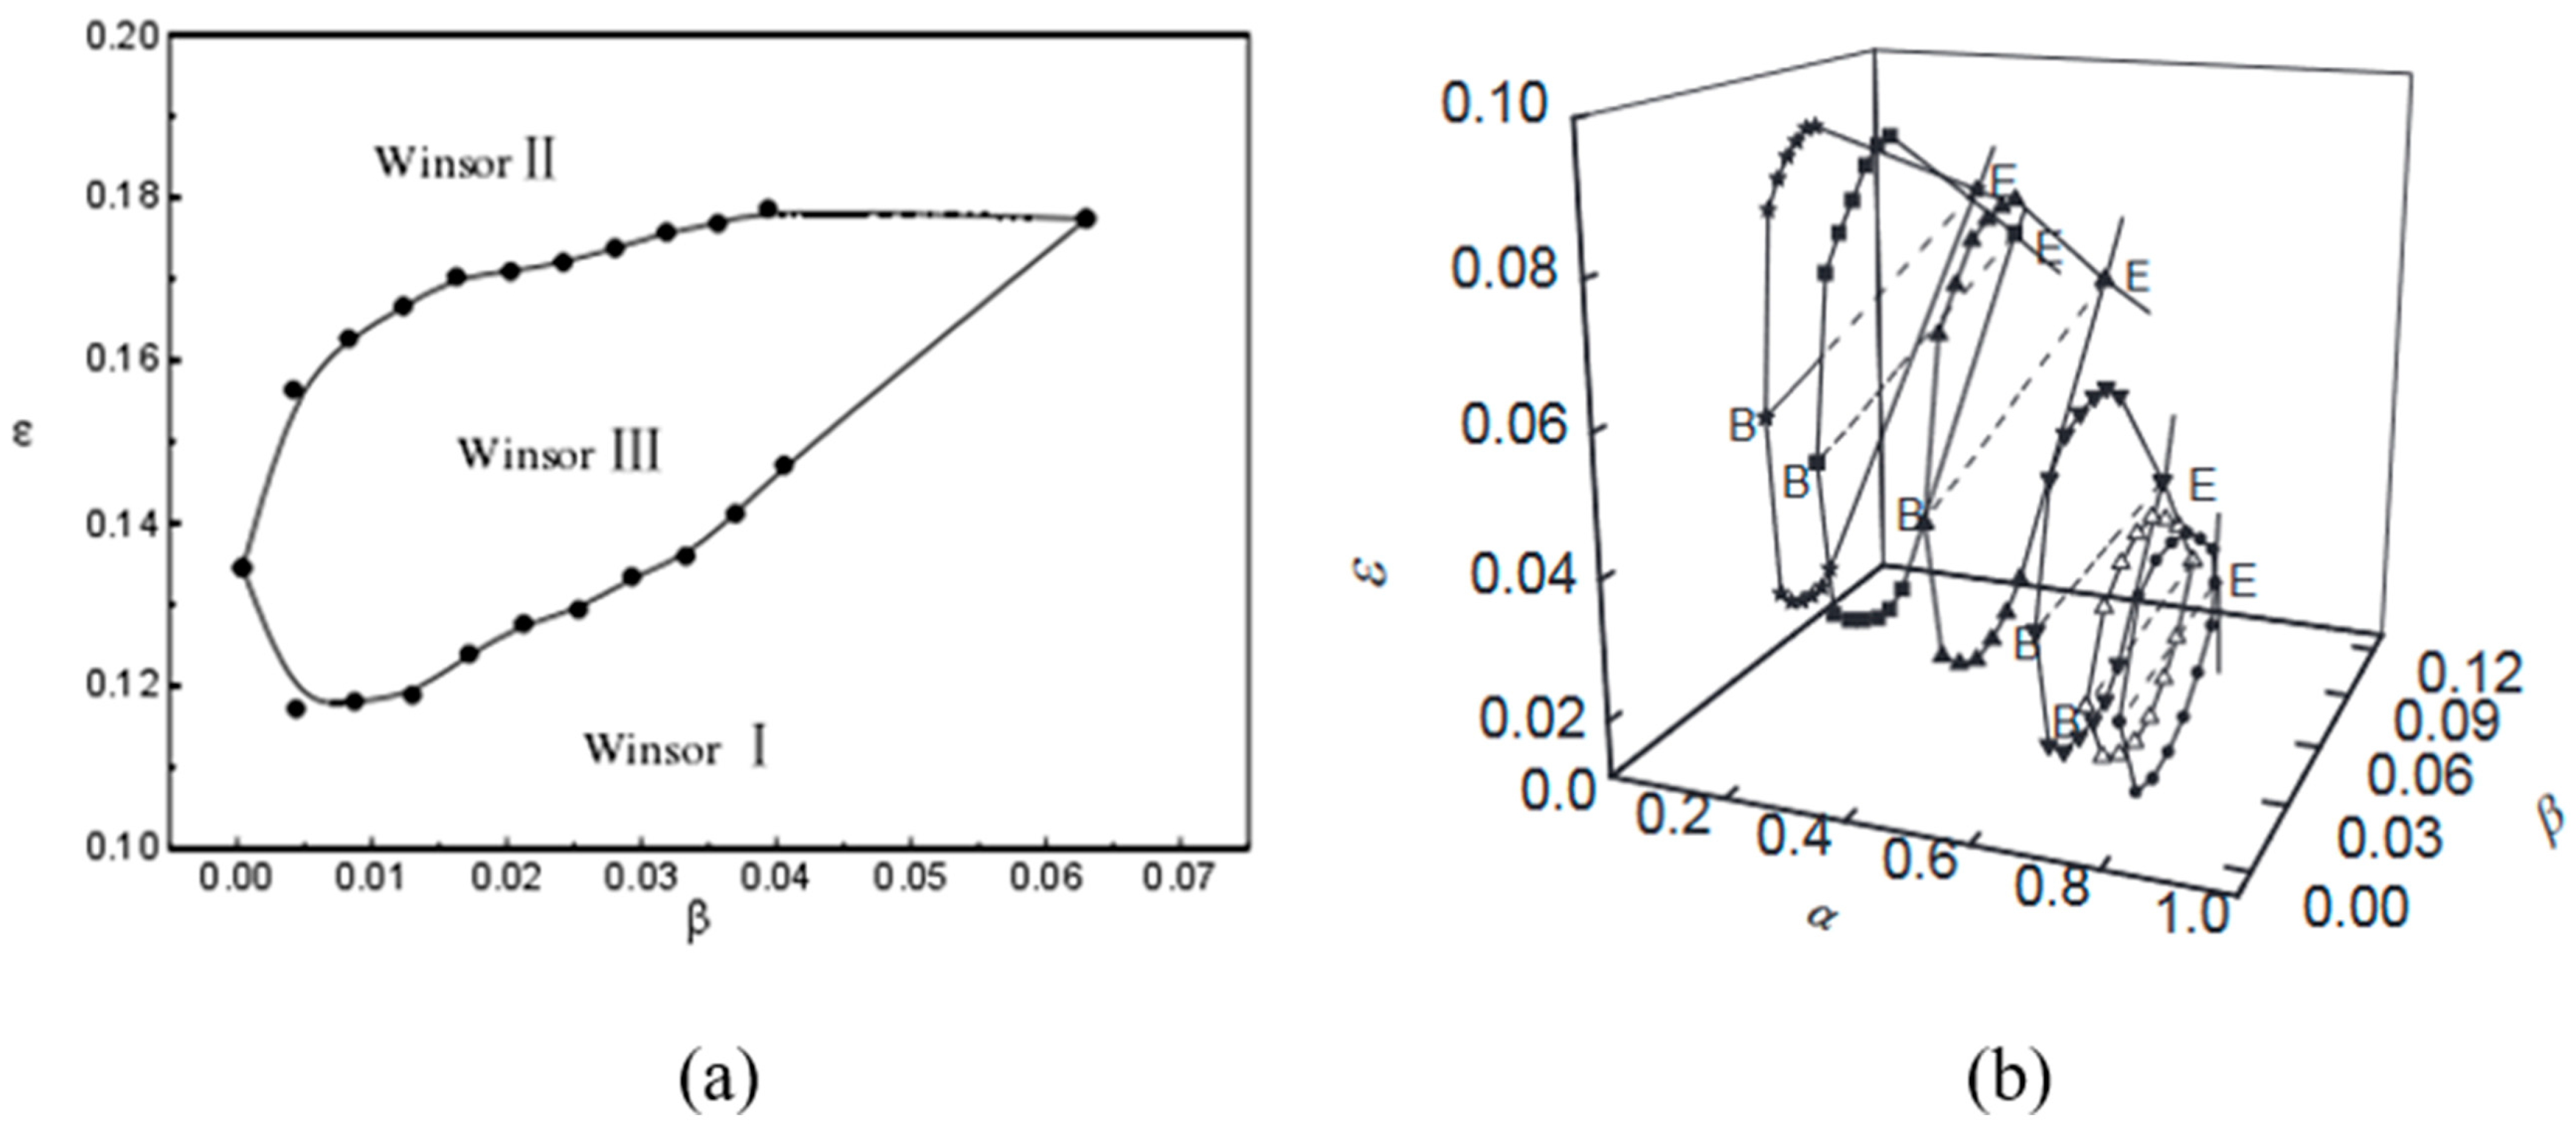
The ε-β fish-like diagrams can compensate for some of the shortcomings of Winsor phase diagrams, providing information about the composition and solubilization capability of the system when middle-phase and single-phase microemulsions begin to form. In this context, β represents the mass fraction of surfactant in the total composition, and ε represents the mass fraction of cosurfactant in the total composition. One of its advantages is that when the system contains cosurfactants such as alcohols, it can efficiently screen alcohols. Yang [46] investigated the effects of different oil and water media on phase behavior, interfacial layer composition, and solubilization capability. The results showed that oils with smaller molecular volumes enhanced the solubilization capability. By using the ε-β diagrams, Zhang [47] studied the influence of different XSDS values (molar fraction of SDS in a mixture of CTAB and SDS) and screened for microemulsion systems with lower alcohol solubility at the interface but higher solubilization capability than microemulsion systems containing only a single surfactant SDS or CTAB. By using the ε-β diagrams, Hou [48] investigated the solubilization effects of non-aqueous liquids, including trichloroethylene, carbon tetrachloride, 1,2-dichloroethane, and tetrachloroethylene, in microemulsions containing a mixed surfactant, 1-dodecyl-3-methylimidazolium bromide, and sodium dodecyl sulfate. He innovatively introduced α values representing different oil-to-water ratios as a third-dimensional axis, providing additional dimensions to represent parameter variations (Figure 3). However, ε-β fishlike diagrams have limitations. They may not effectively determine the minimum required salt content of the system and may introduce larger errors. Compared with quasi-ternary phase diagrams, they lack precision and intuitiveness when dealing with complex systems with multiple components changing simultaneously.

3.3. Quasi-Ternary Phase Diagrams

The quasi-ternary phase diagram illustrates the changes in microemulsion phases with various components. It allows for a more detailed prediction of the formation process of middle-phase microemulsions and enables the precise identification of the optimal positions for their formation. A quasi-ternary phase diagram typically includes a surfactant, oil, water and salt, as well as alcohol as a cosurfactant. One corner of the phase diagram often represents the surfactant/cosurfactant or the surfactant/salt [49]. Compared with ternary phase diagrams, quasi-ternary diagrams can describe more complex and realistic systems (Figure 4).
To improve efficiency in practical applications, researchers need to zoom in on specific details within phase diagrams. Naik [50], for instance, only enlarged the bottom edge area of the phase diagram when calculating ternary phase diagrams with the GA-UNIQUAC model. Furlanetto [51] and Dantas [52] also applied a local zoom-in approach to examine contour maps generated from fitting mixed experimental models. This method allows researchers to determine stable subregions within each formulation series, leading to a deeper understanding of middle-phase microemulsions (Table 3).
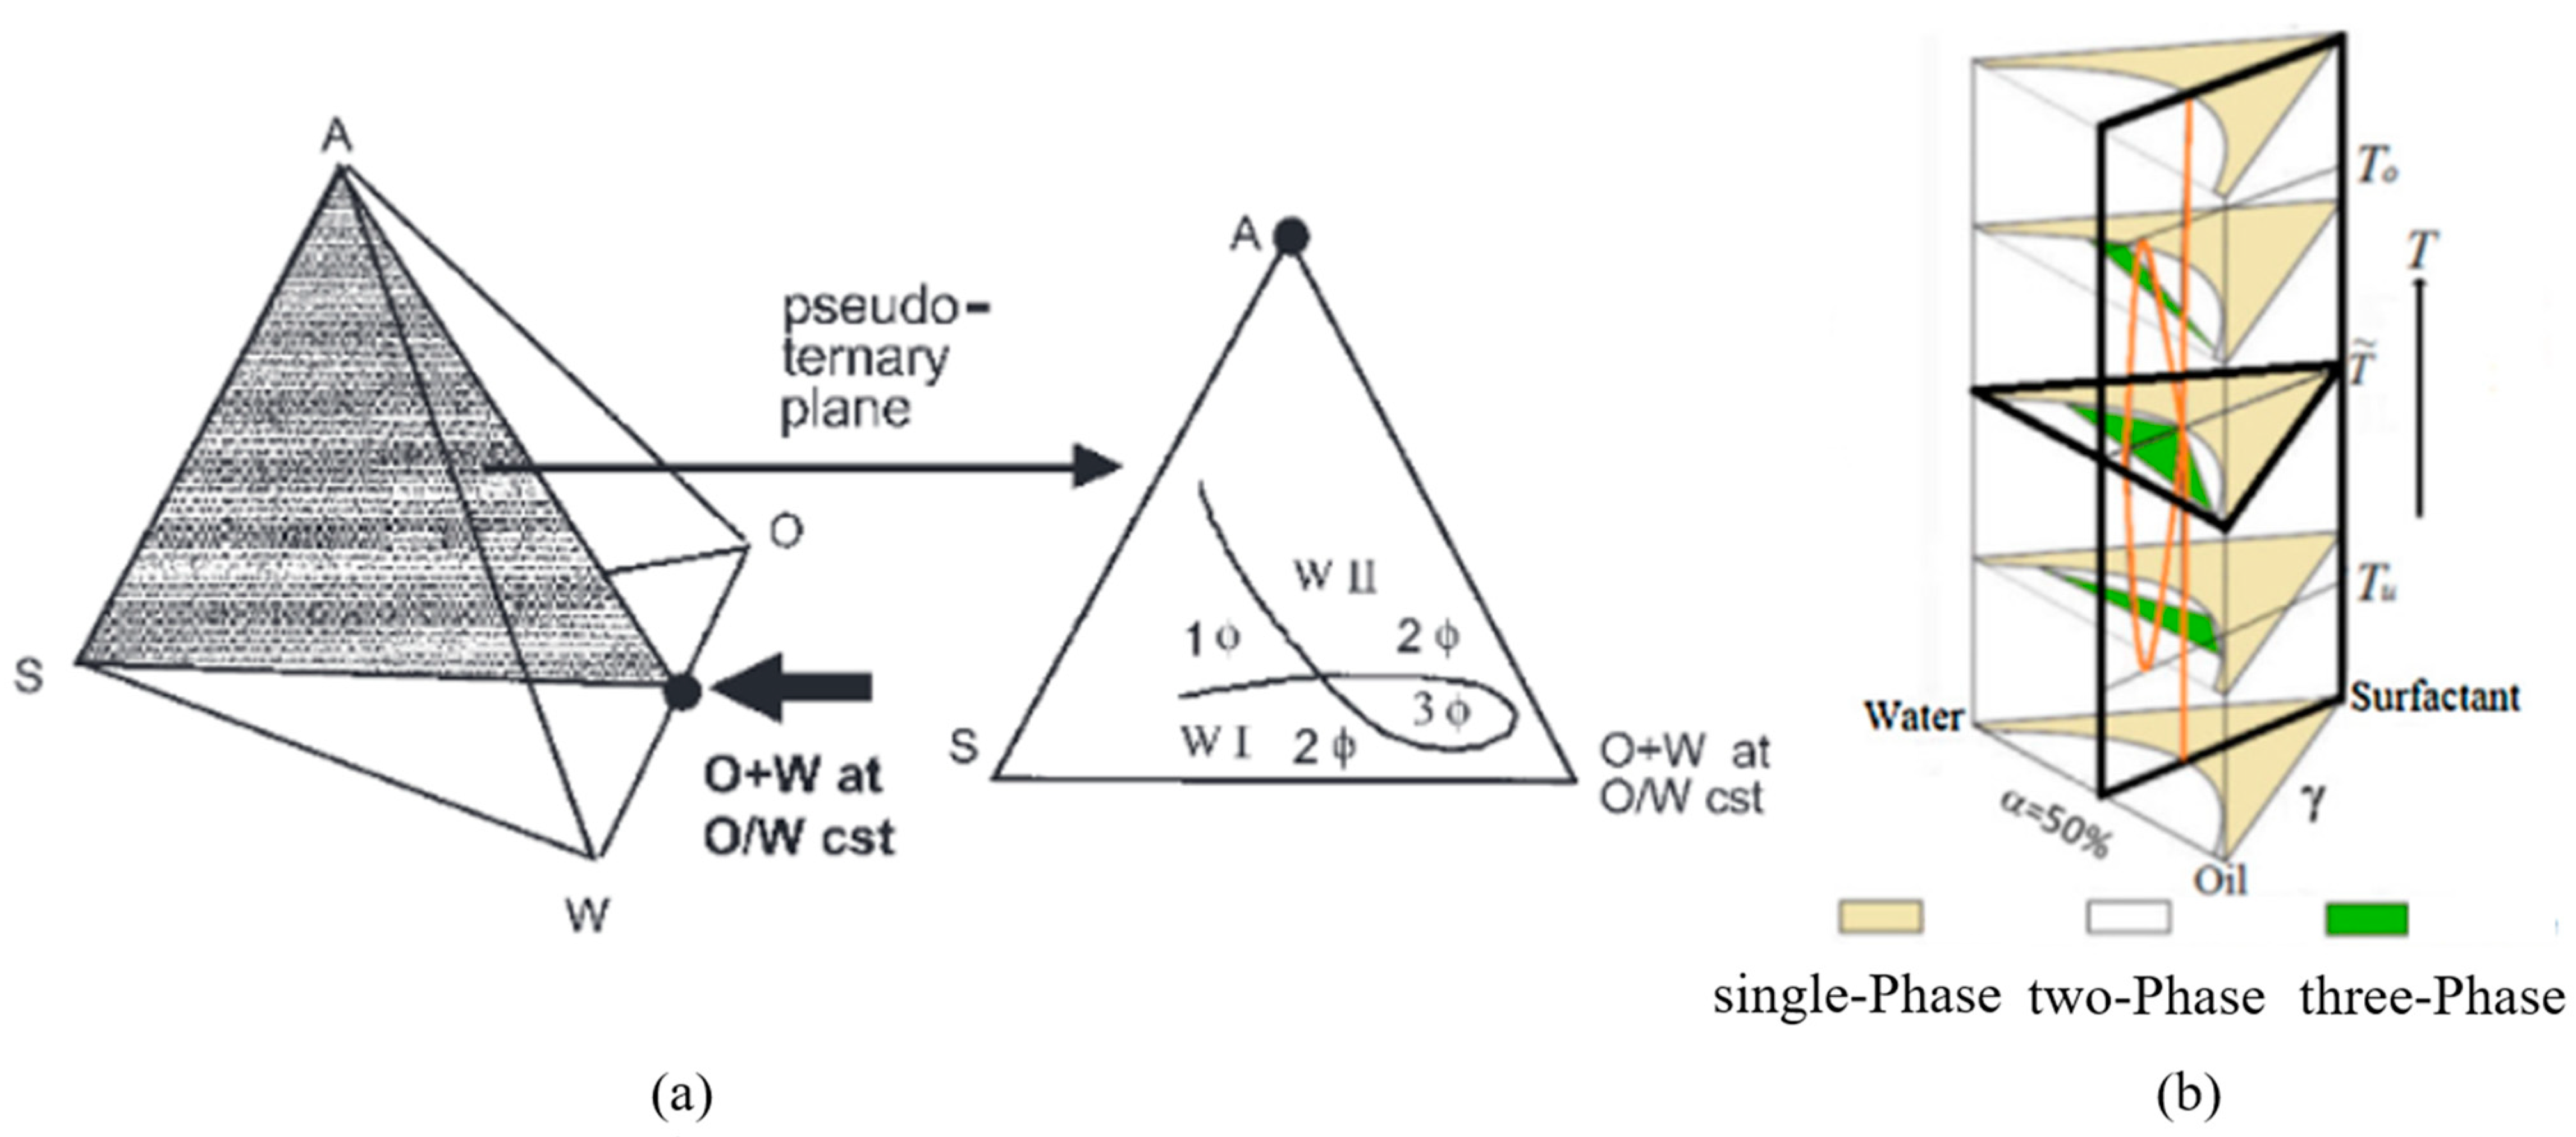
To predict phase behavior more efficiently, especially in systems with more than three components, researchers extended their approach to construct quaternary phase diagrams using tetrahedra on the basis of ternary phase diagrams. Salager [56] made a SAOW quaternary phase diagram and then created an SAR cut (with R representing the oil-to-water ratio) within the tetrahedron, obtaining results similar to fish-like diagrams, which showed the optimal consumption of surfactant and cosurfactant, as shown in Figure 5a. Kasaka [57] proposed the use of the triangular prism method to draw the change process of the quasi-ternary phase diagram with temperature. It can be intuitively seen that when the oil–water ratio is 1:1, the area where the third phase appears first increases and then decreases, and there is an optimal temperature range, as shown in Figure 5b.

4. Study on the Oil Displacement Mechanisms of Middle-Phase Microemulsions

4.1. Tension

An alkali can react with organic acids naturally existing in crude oil to form soap surfactants. These soap surfactants work synergistically with added surfactants to achieve ultra-low interfacial tension (IFT) [58,59]. This process increases the number of capillary tubes and reduces the capillary pressure, allowing the water phase to mobilize the remaining oil and thereby improving oil recovery [60,61,62]. The Winsor III-type middle-phase microemulsions are the ideal condition for enhancing oil recovery. Due to the ultra-low IFT, these microemulsions can produce mixed-phase solubilization and expand the sweep coefficient. Different types of microemulsions can maintain low IFT, with Winsor I type microemulsions still having very low IFT values [63]. In spontaneous emulsification experiments, both -II-type and +II-type microemulsions display strong emulsification capabilities and low IFT [64]. The addition of alkalis can lower the IFT of surfactants to the range of 10−3 to 10−4 mN/m [65,66]. Therefore, interfacial tension testing is a necessary step in screening middle-phase microemulsion EOR systems.

4.2. Microscopic Mechanism

When IFT is extremely low, since the dynamic contact angle increases with an increase in the number of capillary tubes, there are noticeable differences in microscopic displacement dynamics [67]. Therefore, researchers often use custom-made glass etching models for microfluidic chip experiments. These chips are used to create a single-layer flow model on a glass slide, allowing for microscopic visualization. Microfluidic chips, with their precise channel structures and control capabilities, can simulate rock pore structures. By accurately controlling fluid injection and displacement processes, they enable researchers to observe fluid movement and interactions within rock models. This experimental method helps researchers gain a deeper understanding of fluid behavior within rock pores, reveals flow mechanisms and displacement effects, and provides guidance at the microscopic level for optimizing oil recovery processes [68,69,70,71]. Through glass etching model experiments, fluid flow and interface changes within the rock model can be intuitively observed.
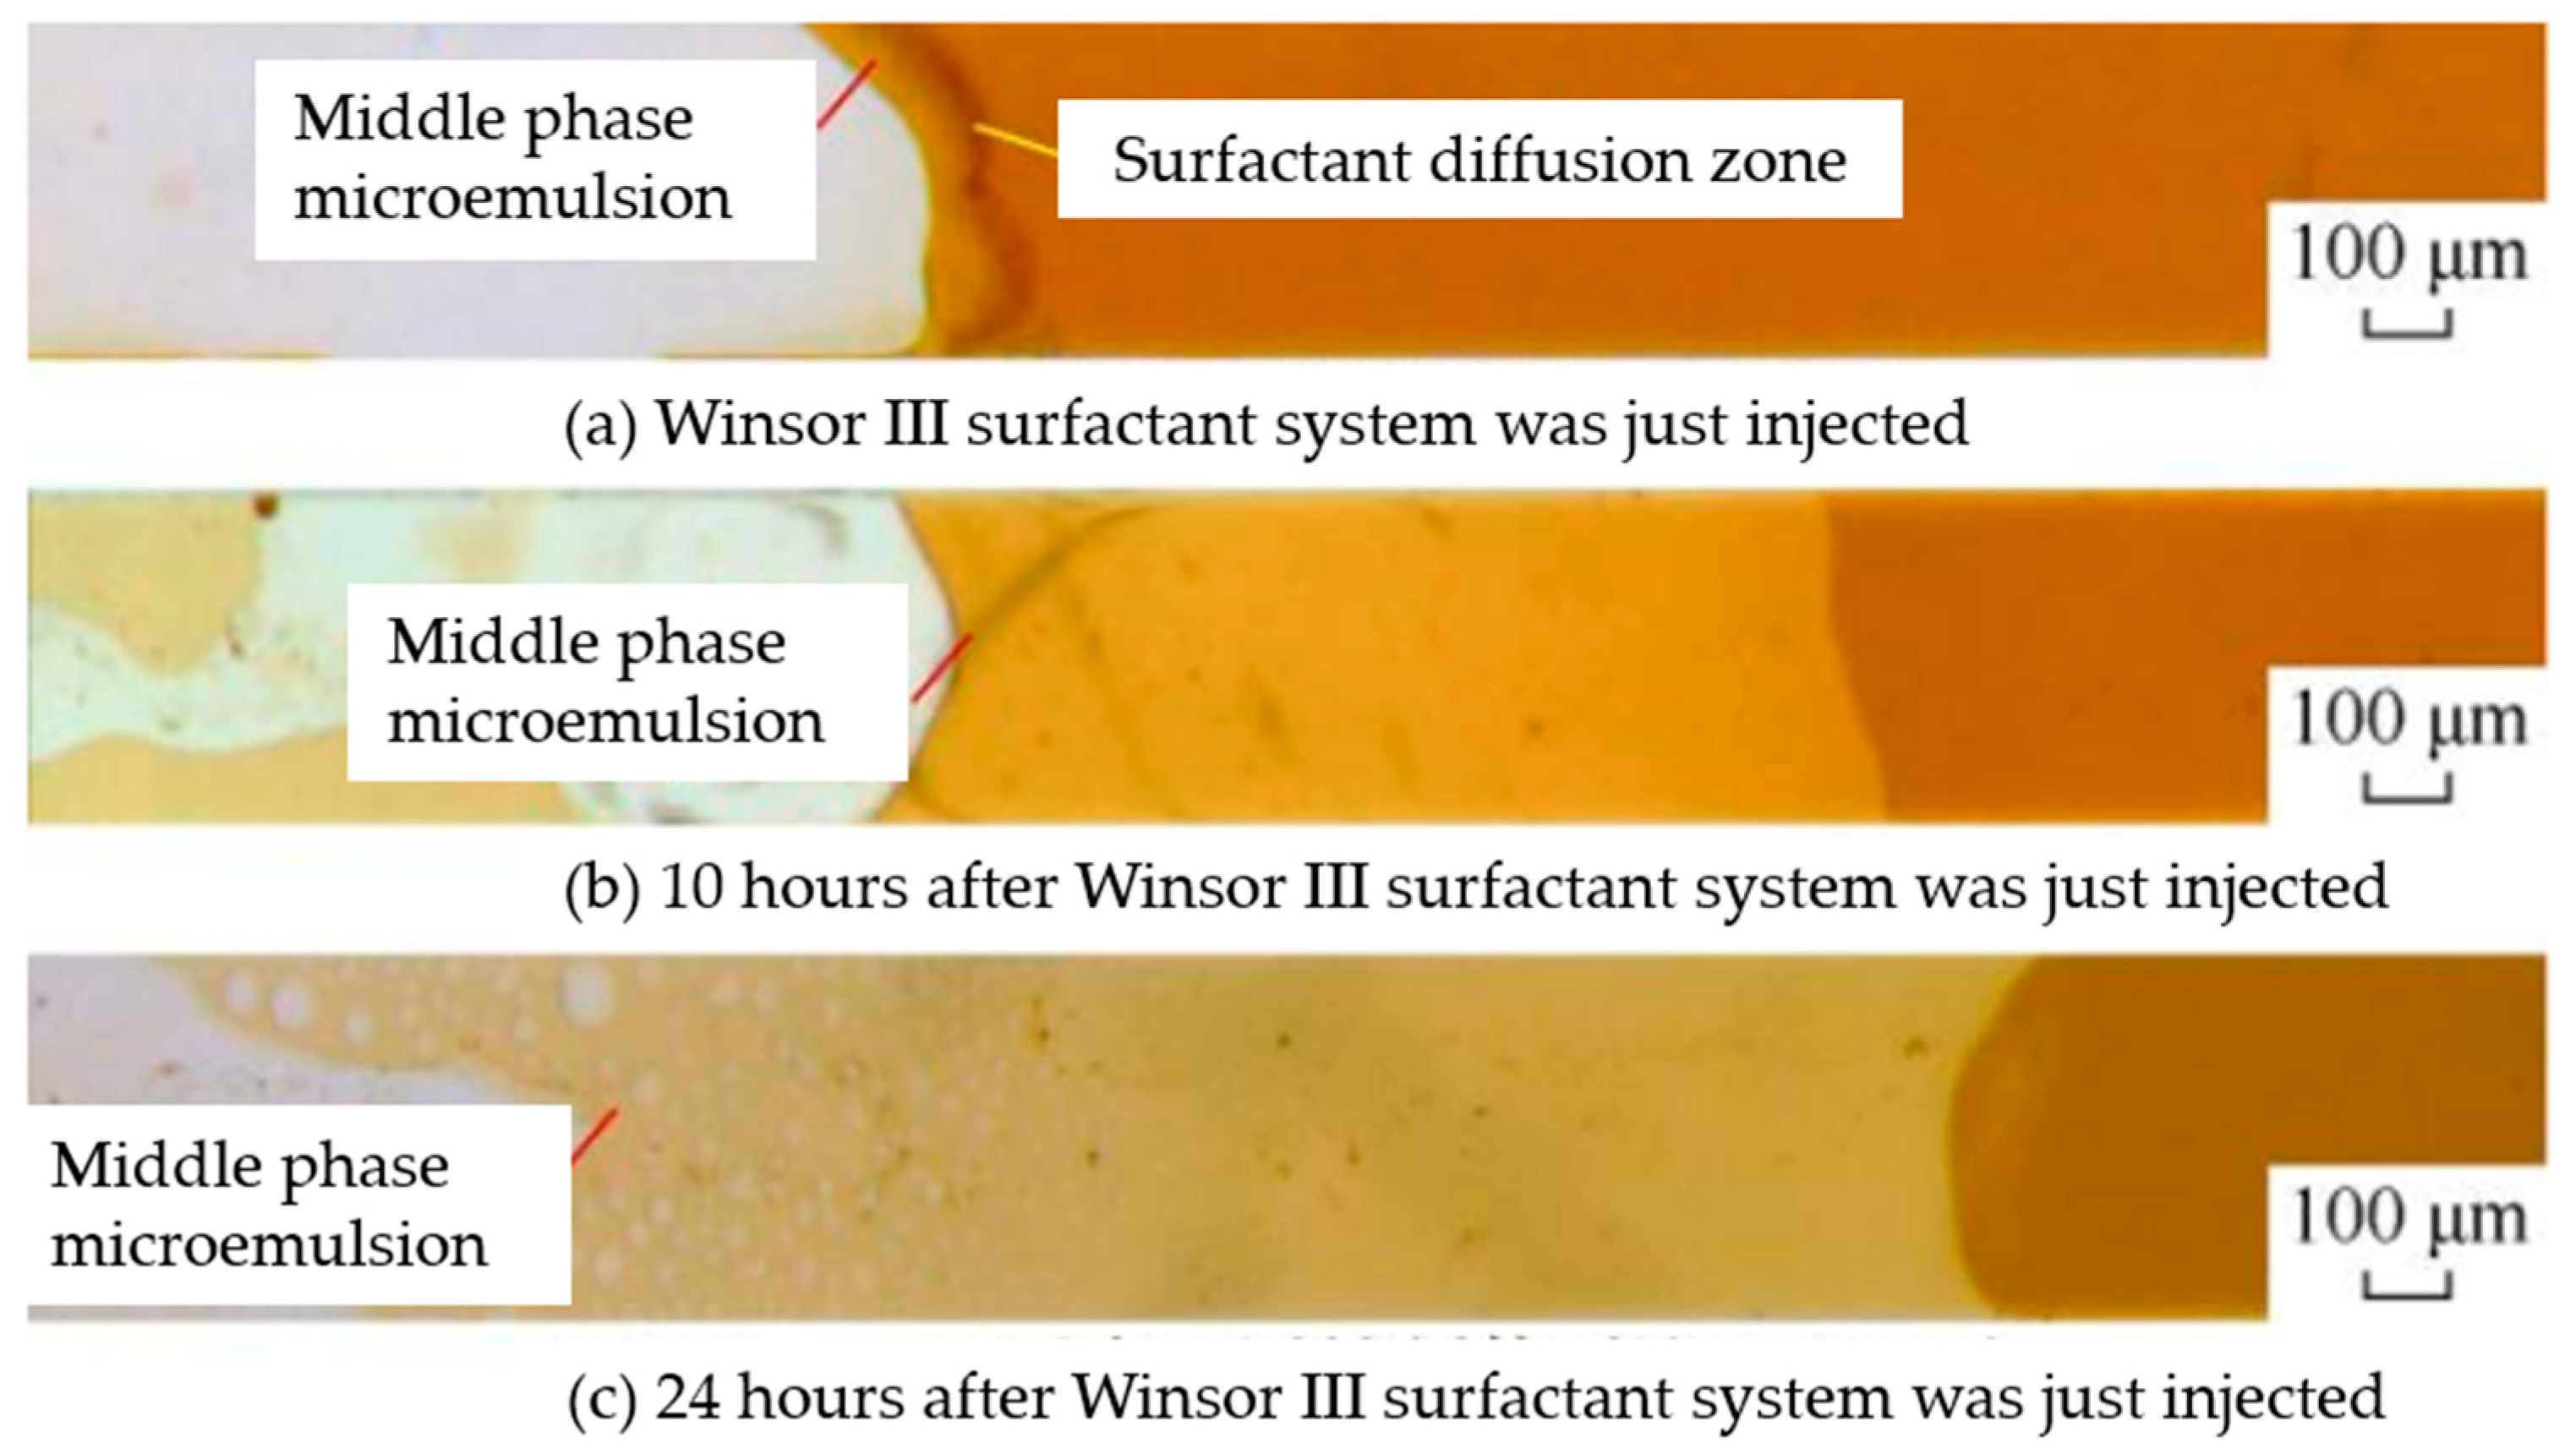
In research on using microemulsions for enhanced oil recovery, researchers need to observe the process of emulsion formation and study how to achieve separation and oil mobilization after emulsion formation, as well as analyze the type of residual oil. Yu [72] directly observed that within 100 nm pores, the middle-phase microemulsion achieved wettability alteration through the formation of a more wettable middle-phase, resulting in interface disappearance after standing (Figure 6). Yang [73] observed that propoxy sulfate can alter the curvature of the oil–water interface, leading to wettability reversal. In-house fabricated homogenous 2.5 D micromodels with 200 μm pore width were used to investigate the multiphase displacement at 110 °C. As the surfactant concentration increases, the interface becomes unstable, causing oil film entrapment.
To further observe the migration process of the middle-phase microemulsions in porous media during enhanced oil recovery, researchers have simulated rock pores, designed glass etching models, and studied the microcosmic oil displacement mechanisms for enhanced oil recovery. Zhao [27] monitored the micro-emulsification process by using in situ fluorescence labeling and cryogenic electron microscopy in a two-dimensional microfluidic system. The model was used to simulate the underground environment of the Karamay Oil field in China; the temperature of the thermal stage was maintained at 40 °C with an effective area of 42 mm × 42 mm and an average depth of approximately 100 μm. Its porosity was 44.3% and its permeability was 8.8 Darcy. They observed the formation of a new flooding fluid that mobilized the residual oil after dilution of the microemulsion (Figure 7). In the microfluidic chips, Yu [74] observed the process of wettability reversal and capillary force action during the imbibition of the microemulsion oil displacement system. The pores in the matrix model were 10 μm wide and 3 μm deep on average. The process also revealed the manifestation of the Haines jump in the microscopic view (Figure 8).
To analyze the oil displacement capabilities of middle-phase microemulsion systems, researchers use microscopic residual oil identification software (Remaining oil v1.2) for calculations and characterizations. Based on microfluidic experiments and image analysis techniques, Wang [75] established a quantitative characterization method for the occurrence and flow characteristics of microscopic residual oil. He separately studied the flow patterns of microscopic residual oil during the water flooding process in homogeneous and heterogeneous models (Figure 9). The total flow area of the model is 2 cm × 1.5 cm. The cluster remaining oil is mainly distributed in the pores with a pore radius of 30~130 μm, a pore throat ratio of 5~9, and a coordination number of 2~6.
With the continuous advancement in etching technology and continuous improvement in observation and experimental equipment, future glass-etching model experiments will have huge potential. The pressure resistance of glass allows researchers to simulate low-permeability reservoirs, and nano-scale pores enable the observation of emulsification phenomena and their mechanisms in even smaller channels.

4.3. CT

Micro-CT scanning is an advanced technique for characterizing and observing microemulsions for enhanced oil recovery. It can be used to measure physical properties and perform non-destructive scanning to determine the distribution of oil and water phases and the position of phase interfaces. Additionally, it helps in calculating and analyzing saturation, tracking phase transition processes, studying phase transition mechanisms, visualizing flow channels, revealing the permeability distribution of microemulsions in reservoirs, evaluating displacement effects, and analyzing displacement extent and zoning effects. This technology deeply aids in understanding and optimizing the oil displacement process of microemulsions. Typically, normal heptane and iodododecane are used as emulsifying contrast agents, and the addition of sodium iodide can enhance image contrast during CT scanning. A three-dimensional structure of porous media is reconstructed from an image stack, which allows for measuring average porosity and pore throat connectivity [53].
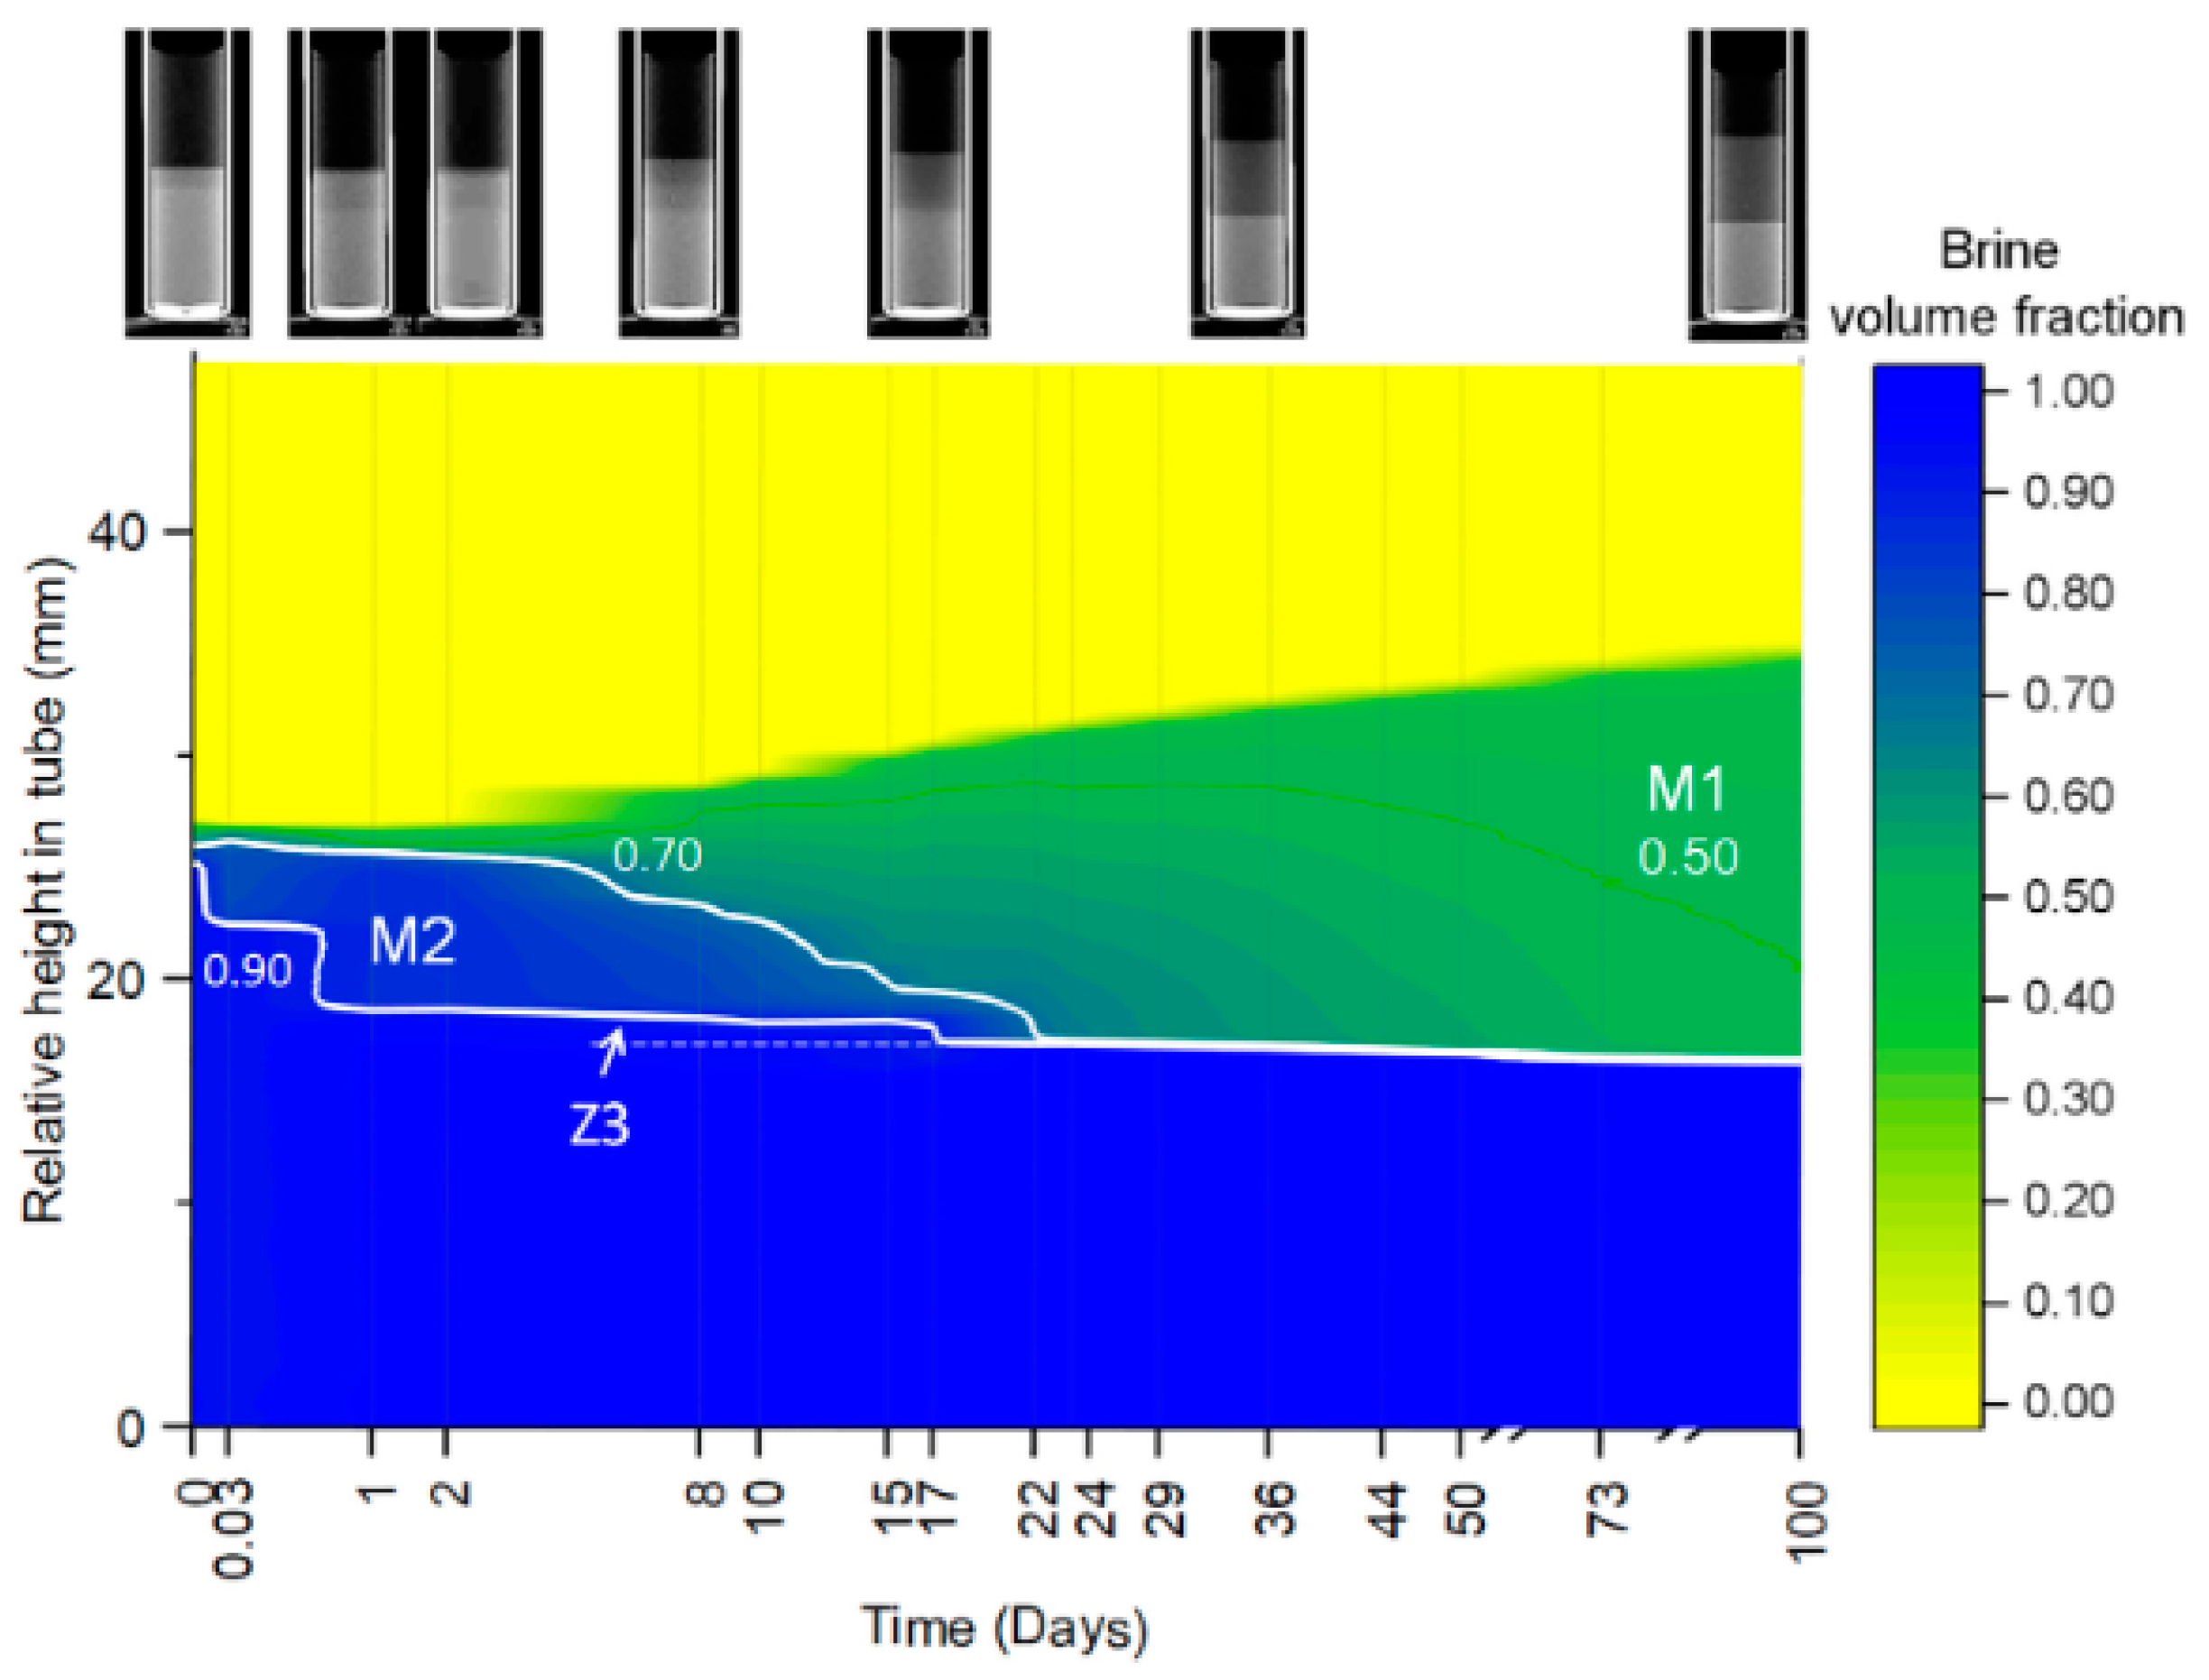
Using CT technology, it is possible to characterize the volume of the microemulsion. Herrera [26] employed micro-CT scanning and calculated the thickness of different phases based on X-ray images of a pipeline at various time points, which are displayed as grayscale depths. Tests were conducted on an EasyTom 150–160 in 10 mL glass tubes of 1.8 cm diameter at 20 °C. The white lines represent the outlines between different phases. The dashed horizontal white lines represent the interface between the Z3 phase and the excess water phase (Figure 10). In addition, CT technology can also be used to characterize the changes in wettability within the rock formations during the microemulsion EOR process. She [76] conducted a study (Figure 11), which shows a three-dimensional example of oil occupying pore spaces. In a water-wet system, oil, as a non-wetting phase, primarily occupies the central regions of larger pores. While in an oil-wet system, oil, as a wetting phase, often occupies smaller pores and throats. This provides intuitive evidence of wettability reversal.
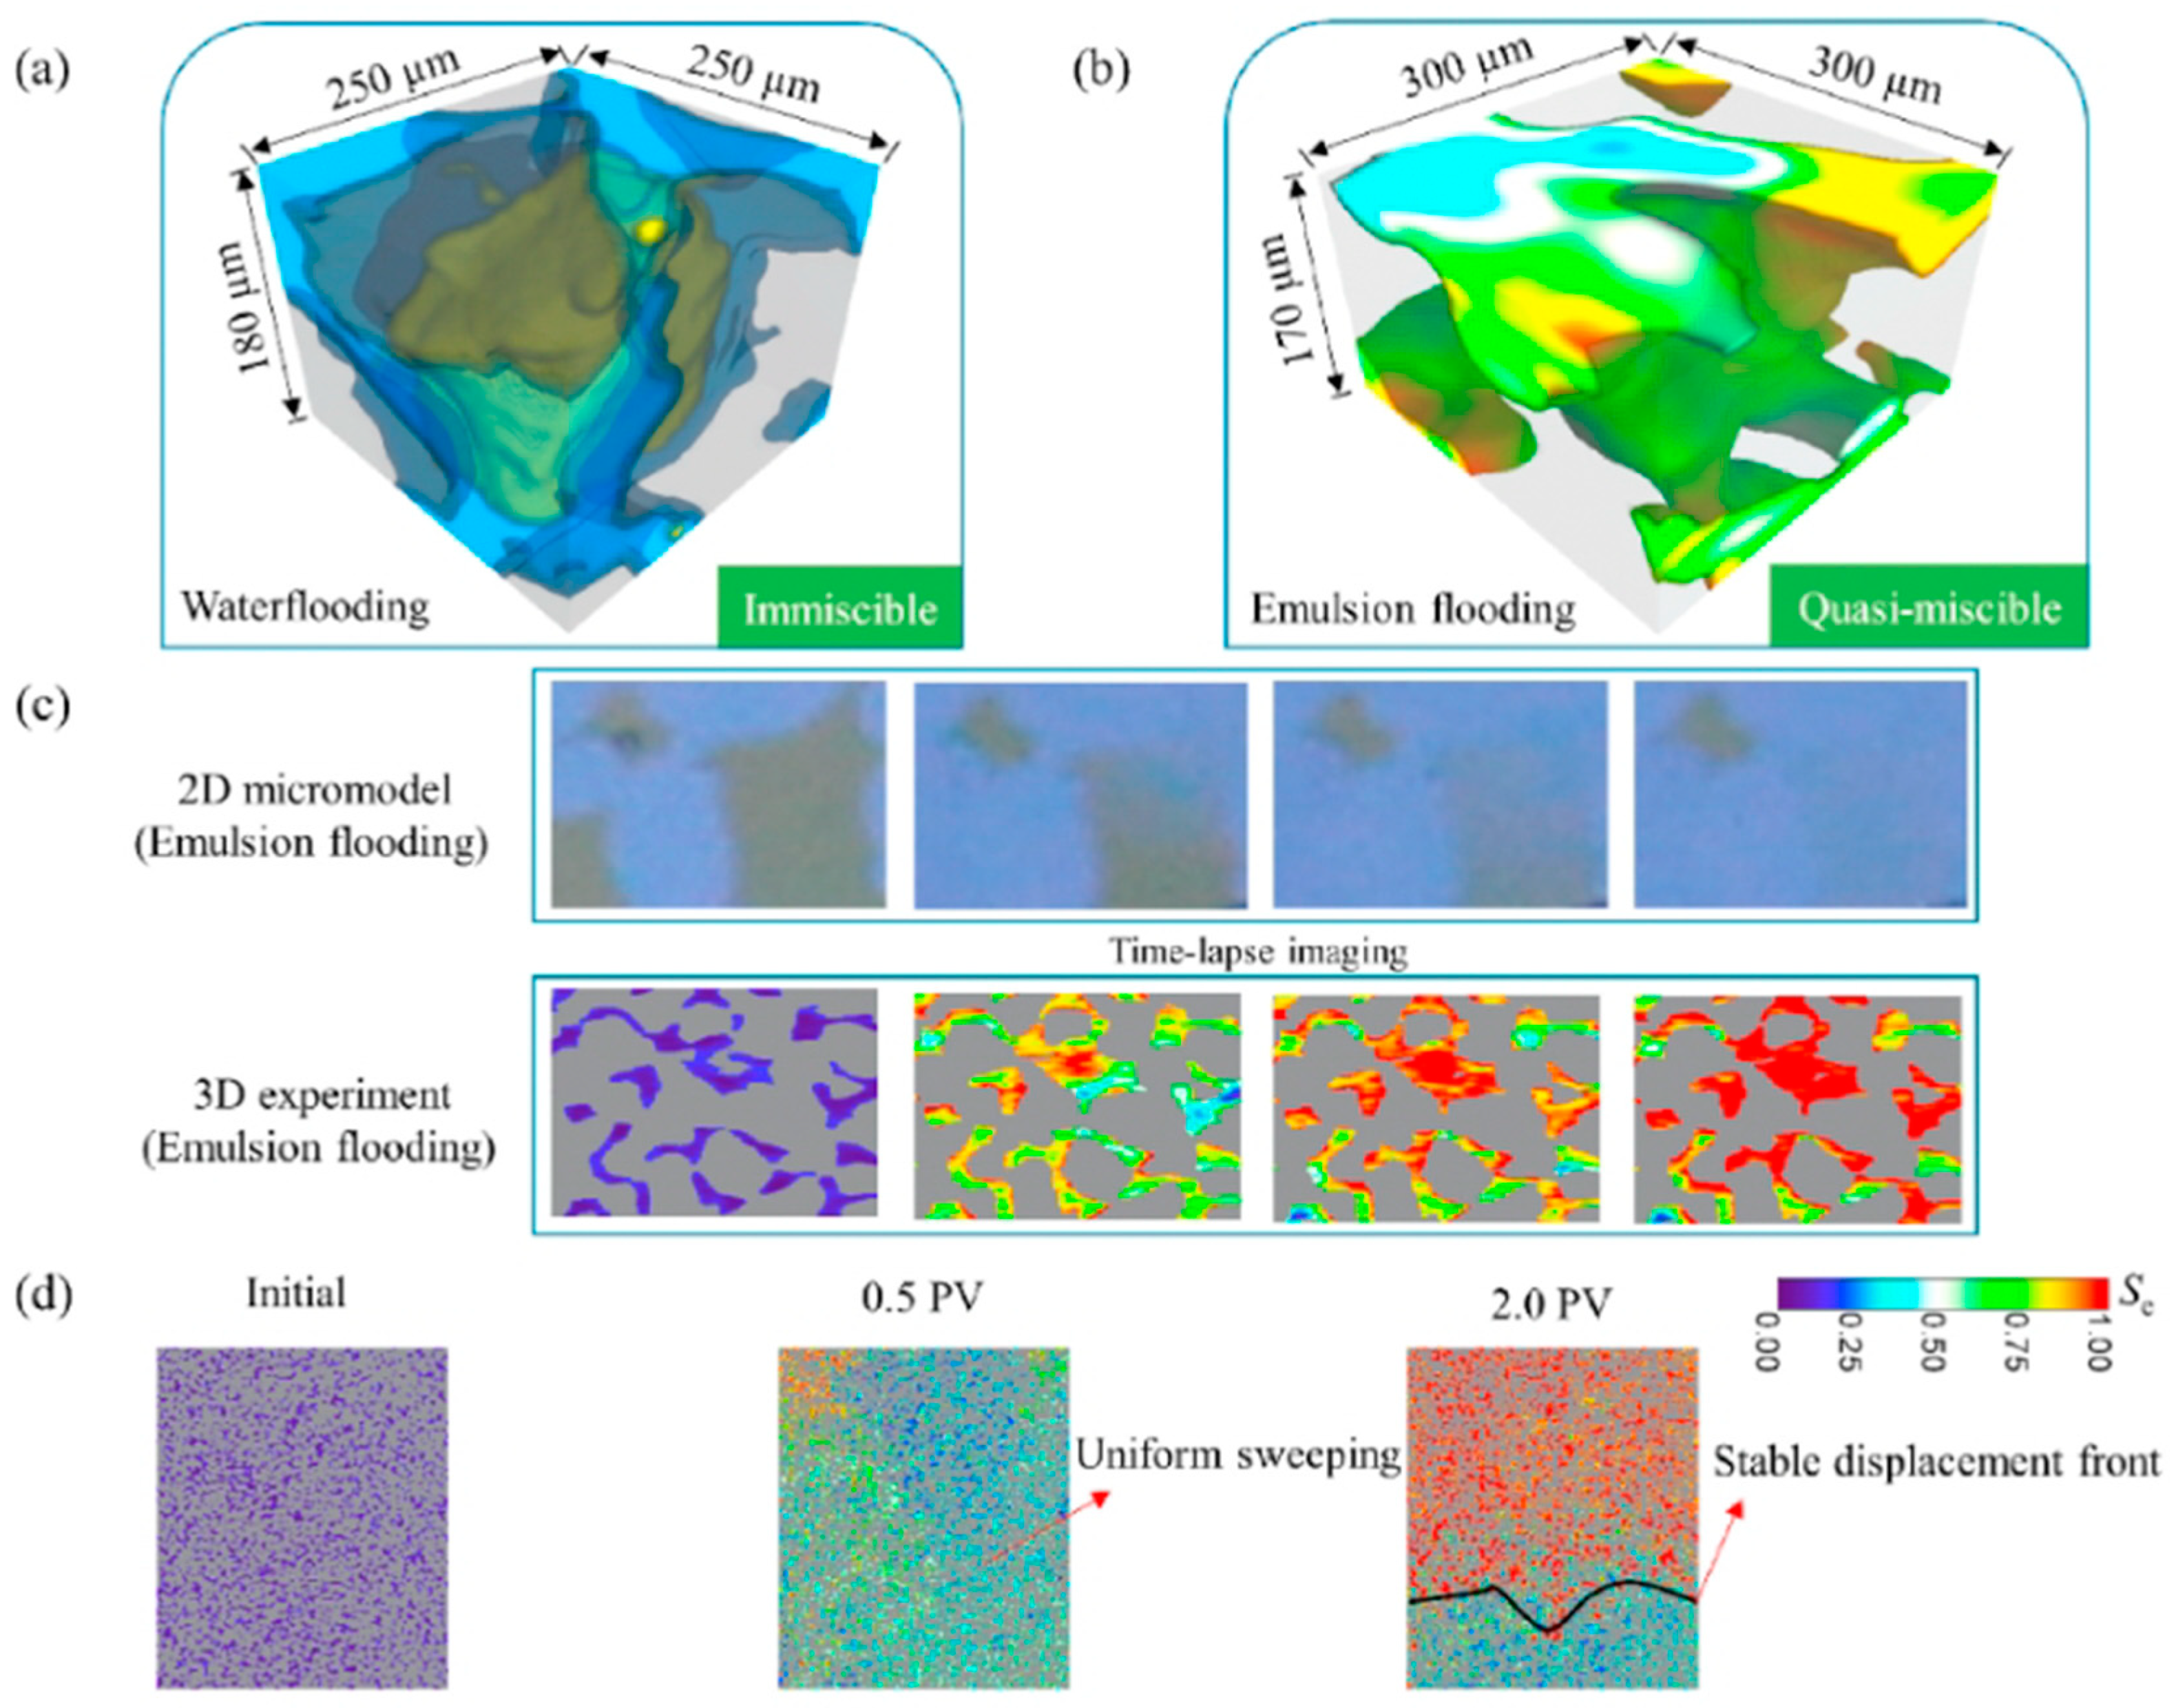
CT technology can also be used to characterize the miscible behavior of middle-phase microemulsions. She [76] observed the dispersion of solvent-type emulsions into oil, while the oil was simultaneously dissolved into the emulsions (Figure 12). This shows that although there is no obvious interface between the emulsions and the oil phase, there is a component gradient in the three-dimensional pore space, demonstrating the elimination of capillary forces during the oil displacement process.
During the displacement process of the middle-phase microemulsion system, CT technology can be used to observe the distribution and changes in the content of each component, as well as the locations and advancing process of emulsification (Figure 13). In the study conducted by She [76], from images taken at 1.0–3.0 PV in oil-wet cores, it can be observed that the color of the oil on top changes from green to dark red, indicating that trapped residual oil gradually dissolves into the emulsified phase. The gradient change in oil color suggests that under the influence of viscous forces, emulsions disperse into the oil phase, leading to miscible displacement behavior. Additionally, viscous fingering is suppressed, resulting in a stable displacement front. Chen [77] conducted CT monitoring during oil displacement experiments in cores with different permeabilities to examine the changes in oil saturation during water flooding and chemical flooding. Due to the mixed-wet nature of carbonate rocks, oil saturation is negatively correlated with porosity during both water flooding and surfactant/polymer flooding, while non-wetting phase saturation is positively correlated with porosity (Figure 14). This indicates the presence of mixed-phase behavior and its impact on wettability alterations in the reservoir.

5. Application of Middle-Phase Microemulsions in EOR

5.1. Development of Microemulsion EOR

In the early stages when Winsor proposed the three models of microemulsions, researchers typically used organically synthesized alkyl/aryl sulfonates to prepare microemulsions [5,78,79,80]. Large oil companies like Marathon [81], Shell [82], and Exxon [83] applied these microemulsions in field tests, with them achieving significant improvements in crude oil recovery rates.
Currently, microemulsion-based enhanced oil recovery (microemulsion EOR) technology is advancing in multiple directions. These include exploring the formation and action mechanisms of middle-phase microemulsions, designing surfactant molecular groups, and carrying out simulation and prediction through mathematical models. The purpose of these studies is to explain and design microemulsions from a microscopic scale and reveal how microemulsions mobilize crude oil during the oil displacement process from a smaller scale. Through studying the phase behaviors of microemulsions, researchers have developed mathematical models that can predict the optimal phase behavior of microemulsions for given surfactant and cosurfactant molecular structures, as well as oil phase types [84,85,86,87,88].
Studies show that modifying surfactant molecular structures, such as replacing hydrophobic groups, increasing the length of hydrophobic chains, or extending the EO chain length of non-ionic surfactants, can significantly impact the phase behaviors of microemulsions. It is essential to determine whether the microemulsion system can achieve ultra-low interfacial tension and solubilization properties under reservoir conditions, as this guidance reduces the time and effort required for initial reagent screening [89,90,91,92,93].

5.2. Practical Application of Microemulsion EOR

In recent years, great progress has been made in the indoor research and practical applications of middle-phase microemulsions. Researchers have improved the system for their respective target oil reservoirs, achieving considerable success (Table A1 in Appendix A) [52,94,95,96,97,98,99,100,101,102,103,104,105,106,107,108,109]. In general, both direct injection and in situ methods are preferred choices for indoor research. In practical applications, however, considering the transition from SP to ASP flooding and the impact of economic benefits, the in situ method is still favored.
In the injection way of the oil drive system, the negative salinity gradient method is becoming more and more popular, which can effectively reduce the adsorption of the surface activator by the reservoir, prolong the action time of middle-phase microemulsion, and expand the action range of the slug. The surfactant concentration in the aqueous effluent was intermediate when a negative salinity gradient was applied. This implied that the formulation was closer to hydrophobic–hydrophilic balance during surfactant propagation in the reservoir which prohibited excessive partition of the surfactant in either the oil phase or the aqueous phase.
The concentration and type of surfactant and the amount of surfactant used tends to decrease in the displacing system. The selection of environmentally friendly anionic and non-ionic surfactants tends to increase in surfactant types. Lignin-type surfactants are beneficial to environmental sustainability.
In the selection of additives for surfactants, researchers tend not to use additives or use low flash point alcohols as surface activators, which is conducive to enhancing the fluidity of the interface film and ensuring the safety of the production site. Researchers tend to choose alkali-free or weak bases (such as NaCl and Na2CO3) in salt selection to help improve the reservoir environment and reduce corrosion in production equipment.
In terms of injection pressure, researchers have found that injection pressure, capillary force, and chemical osmotic pressure are mechanisms for pressure transmission. On the one hand, microemulsions have smaller particle sizes of 80–100 nm due to their low IFT, which makes it easier for them to enter smaller pore throats compared to conventional microemulsions. On the other hand, the ultra-low IFT and the wettability inversion cause the crude oil on the rock surface to roll up so that the oil was easier to separate from the rock surface in a low permeability reservoir in the field [14,110].
These experiments and applications can guide the selection of microemulsions and the optimization and operation parameters, so as to maximize economic returns. In conclusion, the assessment and analysis of the fundamental characteristics of microemulsions are of paramount importance for improving oil field development, enhancing the oil recovery rate, and promoting microemulsion technology.

6. Conclusions

(1)
As a low-concentration surfactant chemical flooding technique, middle-phase microemulsions offer significant advantages in terms of low dosage and high effectiveness. This is mainly reflected in three aspects of mechanism, namely, the expansion of two additional types based on the Winsor model, the quantitative modeling of the HLD equation to control different parameters for various types of surfactants, and the experimental methods linking quasi-ternary phase diagrams with the HLD equation and multiple phase diagrams. These improvements make phase diagrams more intuitive and more efficient for the screening of middle-phase microemulsion systems, which can then guide quantitative parameter-based studies on middle-phase emulsions as the next step.
(2)
Middle-phase microemulsion systems are environmentally friendly for enhanced oil recovery, as the use of mildly alkaline chemicals in these systems poses minimal harm to reservoirs. The application of middle-phase microemulsion flooding in practice offers enhanced safety and reliability. Microscopic mechanism studies and CT technology enable quantitative and visual representation of wettability reversal, capillary pressure reduction, and emulsification, providing strong support for the efficacy of middle-phase microemulsion flooding.
(3)
Middle-phase microemulsion flooding systems exhibit a wide range of applications, particularly in more complex reservoirs. In low-permeability tight reservoirs characterized by low permeability, low porosity, and poor reservoir properties, middle-phase microemulsion flooding systems can control the profile, emulsify, and reduce interfacial tension. For high-temperature, high-salinity reservoirs, middle-phase microemulsion flooding systems can enhance permeability, inhibit the formation of salt and mineral scales in the oil layer, stabilize and disperse oil droplets, and maintain stability under high-temperature, high-salinity conditions, and they can be continuously used in enhancing oil recovery.

Author Contributions

Conceptualization, H.H. and Q.Z.; formal analysis, X.H.; investigation, M.T.; writing—original draft preparation, H.H. and Y.L.; writing—review and editing, H.H. and Q.Z.; visualization, Y.L.; supervision, R.G.; funding acquisition, M.T. All authors have read and agreed to the published version of the manuscript.

Funding

This research received no external funding.

Institutional Review Board Statement

Not applicable.

Informed Consent Statement

Not applicable.

Data Availability Statement

Not applicable.

Conflicts of Interest

The authors declare no conflicts of interest.

Appendix A

Table A1. Practical field applications of middle-phase microemulsions in recent years.
AuthorTimeBlock and PermeabilityAgentEffect and ConclusionReference
Bardhan2013NoneA mixture of polyoxyethylene (20) cetyl ether (Brij-58) and a cetyl trimethyl ammonium bromide (CTAB) surfactant coupled with 1-pentanol (Pn)Starting from molecular dynamics models, Bardhan demonstrated that the microemulsion droplet size changes with Gibbs free energy, which can be used to predict the size of nanoparticles in mixed surfactant middle-phase microemulsions. This has been proposed as a theoretical model.[94]
Co2015Berea core, 300 mDIn situ SP flooding, a functionalized polymer surfactant, modified water-soluble hydrolyzable polyacrylamide (HPAM)There is no direct correlation between reducing IFT and the recovery rate; instead, there is an optimal IFT. This system involves polymer surfactants rather than SP mixtures.[95]
Nguele2016SK-1H, SK-2H, and SK-3H blocksCationic dimerized ammonium salt surfactantThrough adsorption experiments and infrared absorption spectroscopy, it has been proven that the hydrophilic head is preferentially adsorbed on the rock surface. Cationic dimeric ammonium surfactants can slow down the formation of by-products with acidic properties.[96]
Chen2018Daqing oil field, 790 mDIn situ ASP flooding, a Na2CO3, mixed surfactant of alkyl benzene sulfonate and fatty alcohol propoxy ether sulfateApplying a negative salinity gradient to reduce surfactant losses, with a surfactant concentration of 0.3% and a salt concentration of 2%, can result in a maximum recovery rate of up to 45.9% for the original oil in place (OOIP). This represents a 13.1% improvement in recovery compared with ASP flooding.[97]
Ayirala2019Carbonate reservoir in a stock tank reservoirNon-ionic surfactant: ethoxylated alcohol with an average chain length of 12. Polymer: sulfonated polyacrylamide with a sulfonation degree of 25%High salinity water: Significant shift from oil-wet to intermediate-wet or low oil-wet conditions, with noticeable effects. Low salinity water: Transition from oil-wet to low oil-wet conditions, with less pronounced effects.[98]
Han2019Daqing oil field, 1018 mDIn situ ASP flooding, Na2CO3, four surfactants, including two sodium alkyl aryl sulfonates and two propoxy alcohol sulfates, with an HPAM molecular weight ranging from 12 million to 16 millionAt a negative salinity gradient, the recovery rate is approximately 33.5% to 38.5% higher compared with polymer flooding and approximately 90% higher than the polymer flooding of residual oil.[99]
Li2019Daqing oil field, 1800 mDIn situ ASP flooding, NaCl/Na2CO3, heavy alkyl benzene sulfonate, and polyacrylamide (HPAM)Under the conditions of an alkali mass fraction of 1.2 wt%, a surfactant mass fraction of 0.3 wt%, and a polymer mass fraction of 2500 mg/L, as the viscosity of the flooding agent increases, the weak alkali ASP system improves the recovery rate by 22.0%. Weak alkali ASP can achieve better interfacial tension and displacement efficiency compared with strong alkali ASP.[100]
Riswati2019Indonesia oil reservoir, 68.5 mDIn situ ASP flooding (0.5% linear alkyl benzene sulfonate (LAS) and 2% diethylene glycol butyl ether (DGBE), 1% Na2CO3)A negative salinity gradient allows the front-end Winsor II microemulsion to transform into a Winsor III microemulsion, preventing surfactant failure at low salinity. The maximum recovery rate can reach 75.80%.[101]
Han2020Daqing oil field, 1031.5 mDIn situ ASP flooding, two AESs with different alkyl lengths and number of POs, ABS, NaCl, and 12 million HAPMBy employing polymer SP flooding and subsequent core flooding with a negative salinity gradient, the final cumulative oil recovery reaches as high as 93.9% OOIP, with a residual oil saturation of approximately 3.4%. When compared with polymer flooding without preflushing with brine, the additional OOIP recovery from the negative salinity gradient flooding exceeds 10%.[102]
Kurnia2020North Dakota shale formations, 2345 mDIn situ ASP flooding, zwitterionic and non-ionic surfactants: cocamidopropyl hydroxysulfonamide and alcohol propoxy sulfate, and 10 million HPAMA binary surfactant system with a 0.3% surfactant concentration can displace 63–75% of the residual oil due to the ultra-low interfacial tension.[103]
Dantas2021Brazil Botucatu blockDirectly injected microemulsion (saponified coconut oil (SCO) is the anionic surfactant, Na2CO3 and 1-butanol are cosurfactants, and kerosene is the oil phase)The maximum total recovery rate is 97%.[52]
Liang2021Mahu tight oil reservoir Ma-131, 0.17–0.45 mDComplex nano-fluid, 0.1 wt% DR800 and 0.1 wt% DMEThe highest oil recovery rate is 31.1% higher than water flooding in the lab. The normalized cumulative oil production of Well-B2 increases by about 18.6%, from 3716.0 tons per 1000 m to 4406.4 tons per 1000 m.[104]
Slamet2021None, artificial stone (synthetic core)Sodium lignosulfonate, PEG-4000, ammonium persulfate, and acetoneThe highest oil yield, 79%, is obtained by the PS1 surfactant with the highest PEG dosage in 16,000 ppm brine solution. [105]
Sekerbayeva2022Oil fields in KazakhstanBenzenesulfonic acid, dimethyl-, mono-C11-16- alkyl deriv. and benzenesulfonic acid, C14-24-branched and linear, alkyl deriv. oxirane, and Na2CO3The microemulsion phase constituted nearly 40% of the total height of the oil/brine column by means of the hybrid method. The recovery factor after injecting formation water was 52%, and it increased to 61% after optimized LSW injection. After switching to the engineered brine/surfactant, the recovery factor reached 70%, which proves the effectiveness of the hybrid method.[106]
Panthi2022None, 50–670 mDIn situ ASP flooding, a single surfactant with 0.5% Alfoterra, and 8 million HPAMWith the preflush of alkali and soft brine, a 0.5 PV ASP plug, and 2700 ppm polymer, the cumulative oil recovery rate from the core flooding can reach 94% to 96% of the original oil in place.[107]
Mariam2023Indiana limestone outcrop cores, 111.54 mDAn anionic surfactant (Soloterra-113H), South Caspian Sea waterFour gradual negative salinity gradients design with phase behavior of Winsor Type II-III-I provided a 33.1% higher incremental of OOIP.[108]
Kurnia2023Bangko oil field, Berea cores, 406.87 mDAnionic (S11) and amphoteric (S20) surfactants, NaCl, trisodium citrate dihydrate Na3C6H5O7·2H2O, and Fe3O4Core flooding experiment showed an improvement in the recovery factor when using surfactant-Fe3O4 nanofluid, namely 5.09% of OOIP or 17.80% of ROIP with total oil recovery of 76.50% of OOIP.[109]

References

  1. Nelson, R.C.; Pope, G.A. Phase Relationships in Chemical Flooding. Soc. Pet. Eng. J. 1978, 18, 325–338. [Google Scholar] [CrossRef]
  2. Wasan, D.T.; McNamara, J.J.; Shah, S.M.; Sampath, K.; Aderangi, N. The Role of Coalescence Phenomena and Interfacial Rheological Properties in Enhanced Oil Recovery: An Overview. J. Rheol. 1979, 23, 181–207. [Google Scholar] [CrossRef]
  3. Doscher, T.M.; Wise, F.A. Enhanced Crude Oil Recovery Potential-An Estimate. J. Pet. Technol. 1976, 28, 575–585. [Google Scholar] [CrossRef]
  4. Atanase, L.I.; Riess, G. Block Copolymer Stabilized Nonaqueous Biocompatible Sub-Micron Emulsions for Topical Applications. Int. J. Pharm. 2013, 448, 339–345. [Google Scholar] [CrossRef] [PubMed]
  5. Gogarty, W.B. Oil Recovery with Surfactants: History and a Current Appraisal, in Improved Oil Recovery by Surfactant and Polymer Flooding. Acad. Press 1977, 37, 27–54. [Google Scholar]
  6. Pokhriyal, N.K.; Devi, S. Effect of Water Solubility of Monomer on Reaction Kinetics Oil-Water Microemulsion Copolymerisation. Eur. Polym. J. 2000, 36, 333–343. [Google Scholar] [CrossRef]
  7. Shinoda, K.; Friberc, S. Microemulsions: Colloidal aspects. Adv. Colloid Interface Sci. 1975, 4, 281–300. [Google Scholar] [CrossRef]
  8. Giang, H.; Shlomovitz, R.; Schick, M. Microemulsions, Modulated Phases and Macroscopic Phase Separation: A Unified Picture of Rafts. Essays Biochem. 2015, 57, 21–32. [Google Scholar] [CrossRef]
  9. Pei, H.; Zhang, G.; Ge, J.; Jin, L. The Effect of Oil Viscosity, Permeability, and Residual Oil Saturation on the Performance of Alkaline Flooding in the Recovery of Heavy Oil. Energy Sources Part A Recovery Util. Environ. Eff. 2012, 34, 702–710. [Google Scholar] [CrossRef]
  10. Liu, D.; Zhao, Y.; Zhang, Y.; Wang, Z. The Key to Surfactant-Free Microemulsion Demulsification: CO2 Promotes the Transfer of Amphiphilic Solvent to Aqueous Phase. J. Mol. Liq. 2022, 345, 117000. [Google Scholar] [CrossRef]
  11. Sottmann, T.; Strey, R. Ultralow Interfacial Tensions in Water–n-Alkane–Surfactant Systems. J. Chem. Phys. 1997, 106, 8606–8615. [Google Scholar] [CrossRef]
  12. Roger, K.; Cabane, B.; Olsson, U. Formation of 10−100 Nm Size-Controlled Emulsions through a Sub-PIT Cycle. Langmuir 2010, 26, 3860–3867. [Google Scholar] [CrossRef] [PubMed]
  13. Ahmed, S.; Elraies, K.A. Microemulsion in Enhanced Oil Recovery. In Science and Technology Behind Nanoemulsions; Karakuş, S., Ed.; InTech: London, UK, 2018; ISBN 978-1-78923-570-8. [Google Scholar]
  14. Liu, D.; Xu, J.; Zhao, H.; Zhang, X.; Zhou, H.; Wu, D.; Liu, Y.; Yu, P.; Xu, Z.; Kang, W.; et al. Nanoemulsions Stabilized by Anionic and Non-Ionic Surfactants for Enhanced Oil Recovery in Ultra-Low Permeability Reservoirs: Performance Evaluation and Mechanism Study. Colloids Surf. Physicochem. Eng. Asp. 2022, 637, 128235. [Google Scholar] [CrossRef]
  15. Wang, Z.; Pang, R.; Le, X.; Peng, Z.; Hu, Z.; Wang, X. Survey on Injection–Production Status and Optimized Surface Process of ASP Flooding in Industrial Pilot Area. J. Pet. Sci. Eng. 2013, 111, 178–183. [Google Scholar] [CrossRef]
  16. Bourrel, M.; Schechter, R.S. Microemulsions and Related Systems: Formulation, Solvency, and Physical Properties; Surfactant Science Series; Marcel Dekker, Inc.: New York, NY, USA; Basel, Switzerland, 1988. [Google Scholar]
  17. Rousseau, D.; Le Gallo, C.; Wartenberg, N.; Courtaud, T. Mobility of Microemulsions: A New Method to Improve Understanding and Performances of Surfactant EOR. In Proceedings of the SPE Improved Oil Recovery Conference, Virtual, 18 April 2022; p. D021S013R001. [Google Scholar]
  18. Roger, K.; Cabane, B.; Olsson, U. Emulsification through Surfactant Hydration: The PIC Process Revisited. Langmuir 2011, 27, 604–611. [Google Scholar] [CrossRef] [PubMed]
  19. Winsor, P. Solubilisation with Amphiphilic Compounds. Chem. Ind. 1960, 23, 632–644. [Google Scholar]
  20. Jaffar, N.A.; Luan, N.; Arisandi, E. Novel Microemulsion Breaker System Remove Drill-in-Fluids Filter Cake and Remediate Near Wellbore Damage to Enhance Productivity of Horizontal Wells of Offshore Sabah, Malaysia. In Proceedings of the Offshore Technology Conference Asia, Kuala Lumpur, Malaysia, 18 March 2022; p. D031S021R005. [Google Scholar]
  21. Wang, Z.; Lin, X.; Zhang, L.; Zhong, H.; Fan, M.; Yu, T. Opportunities for Fluorocarbons Interior Coating Technology in ASP Flooding EOR: Evaluation of Corrosion Protection and Drag Reduction. In Proceedings of the International Petroleum Technology Conference, Bangkok, Thailand, 12 November 2016; p. D011S010R005. [Google Scholar]
  22. Shen, P.; Wang, J.; Yuan, S.; Zhong, T.; Jia, X. Study of Enhanced-Oil-Recovery Mechanism of Alkali/Surfactant/Polymer Flooding in Porous Media From Experiments. SPE J. 2009, 14, 237–244. [Google Scholar] [CrossRef]
  23. Choi, K.-O.; Choi, S.J.; Lee, S. Characterization of Phase and Diffusion Behaviors of Oil, Surfactant, and Co-Surfactant Ternary Systems for Lipid-Based Delivery Carriers. Food Chem. 2021, 359, 129875. [Google Scholar] [CrossRef]
  24. Hohl, L.; Kraume, M. The Formation of Complex Droplets in Liquid Three Phase Systems and Their Effect on Dispersion and Phase Separation. Chem. Eng. Res. Des. 2018, 129, 89–101. [Google Scholar] [CrossRef]
  25. Feng, J.; Rodríguez-Abreu, C.; Esquena, J.; Solans, C. A Concise Review on Nano-emulsion Formation by the Phase Inversion Composition (PIC) Method. J. Surfactants Deterg. 2020, 23, 677–685. [Google Scholar] [CrossRef]
  26. Herrera, D.; Chevalier, T.; Frot, D.; Barré, L.; Drelich, A.; Pezron, I.; Dalmazzone, C. Monitoring the Formation Kinetics of a Bicontinuous Microemulsion. J. Colloid Interface Sci. 2022, 609, 200–211. [Google Scholar] [CrossRef]
  27. Zhao, X.; Zhan, F.; Liao, G.; Liu, W.; Su, X.; Feng, Y. In Situ Micro-Emulsification during Surfactant Enhanced Oil Recovery: A Microfluidic Study. J. Colloid Interface Sci. 2022, 620, 465–477. [Google Scholar] [CrossRef] [PubMed]
  28. Schulman, J.H.; Stoeckenius, W.; Prince, L.M. Mechanism of Formation and Structure of Micro Emulsions by Electron Microscopy. J. Phys. Chem. 1959, 63, 1677–1680. [Google Scholar] [CrossRef]
  29. Robbins, M. Microemulsions—Theory and Practice. Abstr. Pap. Am. Chem. Soc. 1976, 172, 48. [Google Scholar]
  30. Ostrovsky, M.; Good, R. Mass-Transfer And Dynamic Liquid-Liquid Interfacial-Tension. 3. Theory of Nonequilibrium Pressure Coefficient of Interfacial-Tension. J. Colloid Interface Sci. 1985, 106, 140–145. [Google Scholar] [CrossRef]
  31. Bier, M. Nonequilibrium Interfacial Tension during Relaxation-All Databases. Phys. Rev. E 2015, 92, 042128. [Google Scholar] [CrossRef] [PubMed]
  32. Surfactant Science Series Vol. 39. Interfacial Phenomena in Biological Systems—All Databases. Available online: https://www.webofscience.com/wos/alldb/full-record/BIOSIS:PREV199243035081 (accessed on 18 September 2023).
  33. Lin, T.; Kurihara, H.; Ohta, H. Effects of Phase Inversion and Surfactant Location on Formation of O-W Emulsions. J. Soc. Cosmet. Chem. 1975, 26, 121–139. [Google Scholar]
  34. Salager, J.L.; Morgan, J.C.; Schechter, R.S.; Wade, W.H.; Vasquez, E. Optimum Formulation of Surfactant/Water/Oil Systems for Minimum Interfacial Tension or Phase Behavior. Soc. Pet. Eng. J. 1979, 19, 107–115. [Google Scholar] [CrossRef]
  35. Wu, Z.; Mu, G.; Liu, H.; Ding, C. Study on the Influence of Different Types of Inorganic Salts on Microemulsion System Using Fishlike Phase Diagram-All Databases. Chem. Res. Appl. 2015, 27, 1564–1568. [Google Scholar]
  36. Arpornpong, N.; Charoensaeng, A.; Khaodhiar, S.; Sabatini, D.A. Formulation of Microemulsion-Based Washing Agent for Oil Recovery from Spent Bleaching Earth-Hydrophilic Lipophilic Deviation Concept. Colloids Surf. Physicochem. Eng. Asp. 2018, 541, 87–96. [Google Scholar] [CrossRef]
  37. Liu, Y.; Chen, S.; Sheng, L.; Wang, M.; Liu, H. The Phase Behavior and Solubilization Ability of Nonionic Surfactant-Distillate Fraction of Crude Oil Microemulsion System. Colloids Surf. Physicochem. Eng. Asp. 2020, 603, 125181. [Google Scholar] [CrossRef]
  38. Park, J.; Mohanty, K. Design of Surrogate Oils for Surfactant-Brine-Oil Phase Behavior. In Proceedings of the SPE Improved Oil Recovery Conference, Virtual, 18 April 2022; p. D011S008R003. [Google Scholar]
  39. Jin, L.; Jamili, A.; Li, Z.; Lu, J.; Luo, H.; Ben Shiau, B.J.; Delshad, M.; Harwell, J.H. Physics Based HLD–NAC Phase Behavior Model for Surfactant/Crude Oil/Brine Systems. J. Pet. Sci. Eng. 2015, 136, 68–77. [Google Scholar] [CrossRef]
  40. Jin, L.; Budhathoki, M.; Jamili, A.; Li, Z.; Luo, H.; Ben Shiau, B.J.; Delshad, M.; Harwell, J.H. Predicting Microemulsion Phase Behavior Using Physics Based HLD-NAC Equation of State for Surfactant Flooding. J. Pet. Sci. Eng. 2017, 151, 213–223. [Google Scholar] [CrossRef]
  41. Yao, T.; Li, J. An Experiments Study on Chenmical Flood for Heavy Oil Reservoirs-All Databases. Oilfield Chem. 2010, 27, 84–87+42. [Google Scholar]
  42. Yin, D.; Yang, K.; Huang, K. Effect of Salt and Alcohol on the Displacement Performance of Dodecyl Dimethyl Betaine Microemulsion System Using Winsor Phase Diagram Method-All Databases. Oilfield Chem. 2018, 35, 119–124+130. [Google Scholar]
  43. Luo, M.; Si, X.; Yang, Z.; Gong, J. Preparation and Performance of Microemulsion for Corrosion Inhibition of Coiled Tubing-All Databases. Fine Chem. 2018, 35, 1758–1764. [Google Scholar]
  44. Luo, M.; Liu, J.; Wen, Q.; Liu, H.; Jia, Z. Fracturing Cleanup Effectiveness Improved by Environment-Friendly MES Middle Phase Microemulsion-All Databases. Acta Pet. Sin. Pet. Process. Sect. 2011, 27, 454–460. [Google Scholar]
  45. Liu, H.; Zhang, X.; Ding, C.; Chen, S.; Qi, X. Phase Behavior of Sodium Dodecyl Sulfate-n-Butanol-Kerosene-Water Microemulsion System. Chin. J. Chem. Eng. 2014, 22, 699–705. [Google Scholar] [CrossRef]
  46. Yang, X.; Zhang, H.; Shi, C.; Chai, J. Middle-Phase Microemulsions Formed by n -Dodecyl Polyglucoside and Lauric-N-Methylglucamide. J. Dispers. Sci. Technol. 2013, 34, 147–152. [Google Scholar] [CrossRef]
  47. Zhang, Y.; Zhang, X.Y.; Chai, J.L.; Cui, X.C.; Pan, J.; Song, J.W.; Sun, B.; Lu, J.J. The Phase Behavior and Solubilization of Isopropyl Myristate in Microemulsions Containing Hexadecyl Trimethyl Ammonium Bromide and Sodium Dodecyl Sulfate. J. Mol. Liq. 2017, 244, 262–268. [Google Scholar] [CrossRef]
  48. Hou, N.; Chai, J.-L.; Zhang, J.-Q.; Song, J.-W.; Zhang, Y.; Lu, J.-J. Application of ε-β Fishlike Phase Diagrams on the Microemulsion Solubilizations of Dense Nonaqueous Phase Liquids. Fluid Phase Equilibria 2016, 412, 211–217. [Google Scholar] [CrossRef]
  49. Javanbakht, G.; Arshadi, M.; Qin, T.; Goual, L. Micro-Scale Displacement of NAPL by Surfactant and Microemulsion in Heterogeneous Porous Media. Adv. Water Resour. 2017, 105, 173–187. [Google Scholar] [CrossRef]
  50. Naik, P.K.; Kundu, D.; Bairagya, P.; Banerjee, T. Phase Behavior of Water-Menthol Based Deep Eutectic Solvent-Dodecane System. Chem. Thermodyn. Therm. Anal. 2021, 3–4, 100011. [Google Scholar] [CrossRef]
  51. Furlanetto, S.; Cirri, M.; Piepel, G.; Mennini, N.; Mura, P. Mixture Experiment Methods in the Development and Optimization of Microemulsion Formulations. J. Pharm. Biomed. Anal. 2011, 55, 610–617. [Google Scholar] [CrossRef]
  52. Neuma De Castro Dantas, T.; Viana, F.F.; Thaise Costa De Souza, T.; Dantas Neto, A.A.; Aum, P.T.P. Study of Single-Phase Polymer-Alkaline-Microemulsion Flooding for Enhancing Oil Recovery in Sandstone Reservoirs. Fuel 2021, 302, 121176. [Google Scholar] [CrossRef]
  53. Acosta, E.J.; Kiran, S.K.; Hammond, C.E. The HLD-NAC Model for Extended Surfactant Microemulsions. J. Surfactants Deterg. 2012, 15, 495–504. [Google Scholar] [CrossRef]
  54. Kanan, K.; Al-Jabari, M.; Kayali, I. Phase Behavioral Changes in SDS Association Structures Induced by Cationic Hydrotropes. Arab. J. Chem. 2017, 10, S314–S320. [Google Scholar] [CrossRef]
  55. Porada, J.H.; Mansueto, M.; Laschat, S.; Stubenrauch, C. Microemulsions with Hydrophobic Ionic Liquids: Influence of the Structure of the Anion. J. Mol. Liq. 2017, 227, 202–209. [Google Scholar] [CrossRef]
  56. Salager, J.-L.; Antón, R.E.; Sabatini, D.A.; Harwell, J.H.; Acosta, E.J.; Tolosa, L.I. Enhancing Solubilization in Microemulsions—State of the Art and Current Trends. J. Surfactants Deterg. 2005, 8, 3–21. [Google Scholar] [CrossRef]
  57. Kasaka, Y.; Bibouche, B.; Volovych, I.; Schwarze, M.; Schomäcker, R. Investigation of Phase Behaviour of Selected Chemical Reaction Mixtures in Microemulsions for Technical Applications. Colloids Surf. Physicochem. Eng. Asp. 2016, 494, 49–58. [Google Scholar] [CrossRef]
  58. Al-Sahhaf, T.; Ahmed, A.S.; Elkamel, A. Producing Ultralow Interfacial Tension at the Oil/Water Interface. Pet. Sci. Technol. 2002, 20, 773–788. [Google Scholar] [CrossRef]
  59. Sun, Q.; Zhou, Z.-H.; Zhang, Q.; Zhang, F.; Ma, G.-Y.; Zhang, L.; Zhang, L. Effect of Electrolyte on Synergism for Reducing Interfacial Tension between Betaine and Petroleum Sulfonate. Energy Fuels 2020, 34, 3188–3198. [Google Scholar] [CrossRef]
  60. Olajire, A.A. Review of ASP EOR (Alkaline Surfactant Polymer Enhanced Oil Recovery) Technology in the Petroleum Industry: Prospects and Challenges. Energy 2014, 77, 963–982. [Google Scholar] [CrossRef]
  61. Baek, K.H.; Liu, M.; Argüelles-Vivas, F.J.; Abeykoon, G.A.; Okuno, R. The Effect of Surfactant Partition Coefficient and Interfacial Tension on Oil Displacement in Low-Tension Polymer Flooding. J. Pet. Sci. Eng. 2022, 214, 110487. [Google Scholar] [CrossRef]
  62. He, W.; Ge, J.; Zhang, G.; Jiang, P.; Jin, L. Effects of Extended Surfactant Structure on the Interfacial Tension and Optimal Salinity of Dilute Solutions. ACS Omega 2019, 4, 12410–12417. [Google Scholar] [CrossRef]
  63. Sheng, J.J. Modern Chemical Enhanced Oil Recovery Theory and Practice Preface; Gulf Publishing Company: Houston, TX, USA, 2011; p. XIII-+. ISBN 978-0-08-096163-7. [Google Scholar]
  64. Afolabi, F.; Mahmood, S.M.; Sharifigaliuk, H.; Bin Kamarozaman, M.I.H.; Mansor, F.N.N.B.M. Investigations on the Enhanced Oil Recovery Capacity of Novel Bio-Based Polymeric Surfactants. J. Mol. Liq. 2022, 368, 120813. [Google Scholar] [CrossRef]
  65. Latief, F.W.; Setiati, R.; Mardiana, D.A. The Effect of Alkali Type on IFT Value for Surfactant-Alkali Injection. In Proceedings of the 5th Annual Applied Science and Engineering Conference (AASEC 2020), Online, 21–22 April 2020; IoP Publishing Ltd.: Bristol, UK, 2021; Volume 1098, p. 062032. [Google Scholar]
  66. Liu, M.; Fang, H.; Jin, Z.; Xu, Z.; Zhang, L.; Zhang, L.; Zhao, S. Interfacial Tensions of Ethoxylated Fatty Acid Methyl Ester Solutions Against Crude Oil. J. Surfactants Deterg. 2017, 20, 961–967. [Google Scholar] [CrossRef]
  67. Hematpur, H.; Abdollahi, R.; Safari-Beidokhti, M.; Esfandyari, H. Experimental Microemulsion Flooding Study to Increase Low Viscosity Oil Recovery Using Glass Micromodel. Math. Probl. Eng. 2021, 2021, 5021868. [Google Scholar] [CrossRef]
  68. Bao, B.; Shi, J.; Feng, J. Research Progress of Surfactant Enhanced Oil Recovery Based on Microfluidics Technology. Acta Pet. Sin. 2022, 43, 432–442+452. [Google Scholar]
  69. Lapteva, M.; Kalia, Y.N. Microstructured Bicontinuous Phase Formulations: Their Characterization and Application in Dermal and Transdermal Drug Delivery. Expert Opin. Drug Deliv. 2013, 10, 1043–1059. [Google Scholar] [CrossRef]
  70. Bao, B.; Zhao, S. A Review of Experimental Nanofluidic Studies on Shale Fluid Phase and Transport Behaviors. J. Nat. Gas Sci. Eng. 2021, 86, 103745. [Google Scholar] [CrossRef]
  71. Zhou, Y.; Yin, D.; Wang, D.; Zhang, C.; Yang, Z. Experiment Investigation of Microemulsion Enhanced Oil Recovery in Low Permeability Reservoir. J. Mater. Res. Technol. 2020, 9, 8306–8313. [Google Scholar] [CrossRef]
  72. Yu, F.; Gao, Z.; Zhu, W. Experimental Research on Imbibition Mechanisms of Fractured Reservoirs by Microfluidic Chips. Pet. Explor. Dev. 2021, 48, 1004–1013. [Google Scholar] [CrossRef]
  73. Yang, W.; Fu, C.; Du, Y.; Xu, K.; Baihoff, M.T.; Weston, J.; Lu, J. Dynamic Contact Angle Reformulates Pore-Scale Fluid-Fluid Displacement at Ultralow Interfacial Tension. SPE J. 2021, 26, 1278–1289. [Google Scholar] [CrossRef]
  74. Yu, F.; Gao, Z.; Zhu, W.; Wang, C.; Liu, F.; Xu, F.; Jiang, H.; Li, J. Experiments on Imbibition Mechanisms of Fractured Reservoirs by Microfluidic Chips. Pet. Explor. Dev. 2021, 48, 1162–1172. [Google Scholar] [CrossRef]
  75. Wang, C.; Jiang, H.; Ma, M. Study of the Variation of Pore-Scale Residual Oil Flow Based on a Microfluidic Model. Pet. Sci. Bull. 2020, 5, 376–391. [Google Scholar]
  76. She, Y.; Wang, W.; Hu, Y.; Mahardika, M.A.; Nasir, M.; Zhang, C.; Patmonoaji, A.; Matsushita, S.; Suekane, T. Pore-Scale Investigation on Microemulsion-Based Quasi-Miscible Flooding for EOR in Water-Wet/Oil-Wet Reservoirs: A 3D Study by X-Ray Microtomography. J. Pet. Sci. Eng. 2022, 216, 110788. [Google Scholar] [CrossRef]
  77. Chen, J.; Hu, X.; Fang, Y.; Jin, G.; Xia, Y. What Dominates the Interfacial Properties of Extended Surfactants: Amphipathicity or Surfactant Shape? J. Colloid Interface Sci. 2019, 547, 190–198. [Google Scholar] [CrossRef]
  78. Taber, J. Dynamic and Static Forces Required to Remove a Discontinuous Oil Phase from Porous Media Containing Both Oil and Water. Soc. Pet. Eng. J. 1969, 9, 3–12. [Google Scholar] [CrossRef]
  79. Holm, L.W. Soluble Oils for Improved Oil Recovery, in Improved Oil Recovery by Surfactant and Polymer Flooding; Academic Press: Cambridge, MA, USA, 1977; pp. 453–485. [Google Scholar]
  80. Hirasaki, G.J. Application of the Theory of Multicomponent, Multiphase Displacement to Three-Component, Two-Phase Surfactant Flooding. Soc. Pet. Eng. J. 1981, 21, 191–204. [Google Scholar] [CrossRef]
  81. Dreher, K.D.; Shoppman, T.D. Separation of Oil and Water Produced by Micellar-Solution/ Polymer Flooding. J. Pet. Technol. 1985, 37, 1459–1465. [Google Scholar] [CrossRef]
  82. Corsano, A. Field Test of an Aqueous Surfactant System For Oil Recovery, Benton Field, Illinois. J. Pet. Technol. 1973, 25, 195–204. [Google Scholar]
  83. Glover, C.J.; Puerto, M.C.; Maerker, J.M.; Sandvik, E.L. Surfactant Phase Behavior and Retention in Porous Media. Soc. Pet. Eng. J. 1979, 19, 183–193. [Google Scholar] [CrossRef]
  84. Shi, P.; Luo, H.; Tan, X.; Lu, Y.; Zhang, H.; Yang, X. Molecular Dynamics Simulation Study of Adsorption of Anionic-Nonionic Surfactants at Oil/Water Interfaces. RSC Adv. 2022, 12, 27330–27343. [Google Scholar] [CrossRef]
  85. Witthayapanyanon, A.; Phan, T.T.; Heitmann, T.C.; Harwell, J.H.; Sabatini, D.A. Interfacial Properties of Extended-Surfactant-Based Microemulsions and Related Macroemulsions. J. Surfactants Deterg. 2010, 13, 127–134. [Google Scholar] [CrossRef]
  86. Sheng, J.J. A Comprehensive Review of Alkaline-Surfactant-Polymer (ASP) Flooding: A Comprehensive Review of Asp Flooding. Asia-Pac. J. Chem. Eng. 2014, 9, 471–489. [Google Scholar] [CrossRef]
  87. Stoll, W.M. Alkaline/Surfactant/Polymer Flood: From the Laboratory to the Field. SPE Res. Eval. Eng. 2011, 14, 702–712. [Google Scholar] [CrossRef]
  88. Zhu, Y. Current Developments and Remaining Challenges of Chemical Flooding EOR Techniques in China. In Proceedings of the SPE Asia Pacific Enhanced Oil Recovery Conference, Kuala Lumpur, Malaysia, 11 August 2015; p. D021S012R003. [Google Scholar]
  89. James-Smith, M.A.; Shekhawat, D.; Cheung, S.; Moudgil, B.M.; Shah, D.O. Effect of Chain Length on Binding of Fatty Acids to Pluronics in Microemulsions. Colloids Surf. B-Biointerfaces 2008, 62, 5–10. [Google Scholar] [CrossRef]
  90. Lettow, J.S.; Lancaster, T.M.; Glinka, C.J.; Ying, J.Y. Small-Angle Neutron Scattering and Theoretical Investigation of Poly(Ethylene Oxide)-Poly(Propylene Oxide)-Poly(Ethylene Oxide) Stabilized Oil-in-Water Microemulsions. Langmuir 2005, 21, 5738–5746. [Google Scholar] [CrossRef]
  91. Liang, X.-D.; Liu, Y.-F.; Zhou, D.; Yu, W.; Yin, J.-Z. Critical Microemulsion Concentration and Molar Ratio of Water-to-Surfactant of Supercritical CO2 Microemulsions with Commercial Nonionic Surfactants: Experiment and Molecular Dynamics Simulation. J. Chem. Eng. Data 2016, 61, 3135–3143. [Google Scholar] [CrossRef]
  92. Su, H.; Zhou, F.; Wang, Q.; Yu, F.; Dong, R.; Xiong, C.; Li, J.; Liang, T. Flow Physics of Polymer Nanospheres and Diluted Microemulsion in Fractured Carbonate Reservoirs: An Investigation into Enhanced Oil Recovery Mechanisms. SPE J. 2021, 26, 2231–2244. [Google Scholar] [CrossRef]
  93. Yang, X.; Qiu, B.; Qi, D.; Lv, D.; He, J.; Zhou, S.; Wang, Z.; Han, R. Intensive Fracture Cluster Completion Strategy Using Microemulsion Flowback Technology in a Daqing Tight Oil Field Application: Case Study. In Proceedings of the SPE Russian Petroleum Technology Conference, Virtual, 26 October 2020; p. D033S010R004. [Google Scholar]
  94. Bardhan, S.; Kundu, K.; Saha, S.K.; Paul, B.K. Physicochemical Investigation of Mixed Surfactant Microemulsions: Water Solubilization, Thermodynamic Properties, Microstructure, and Dynamics. J. Colloid Interface Sci. 2013, 411, 152–161. [Google Scholar] [CrossRef] [PubMed]
  95. Co, L.; Zhang, Z.; Ma, Q.; Watts, G.; Zhao, L.; Shuler, P.J.; Tang, Y. Evaluation of Functionalized Polymeric Surfactants for EOR Applications in the Illinois Basin. J. Pet. Sci. Eng. 2015, 134, 167–175. [Google Scholar] [CrossRef]
  96. Nguele, R.; Sasaki, K.; Salim, H.S.-A.; Sugai, Y.; Widiatmojo, A.; Nakano, M. Microemulsion and Phase Behavior Properties of (Dimeric Ammonium Surfactant Salt—Heavy Crude Oil—Connate Water) System. J. Unconv. Oil Gas Resour. 2016, 14, 62–71. [Google Scholar] [CrossRef]
  97. Chen, Z.; Han, X.; Kurnia, I.; Yu, J.; Zhang, G.; Li, L. Adoption of Phase Behavior Tests and Negative Salinity Gradient Concept to Optimize Daqing Oilfield Alkaline-Surfactant-Polymer Flooding. Fuel 2018, 232, 71–80. [Google Scholar] [CrossRef]
  98. Ayirala, S.C.; Boqmi, A.; Alghamdi, A.; AlSofi, A. Dilute Surfactants for Wettability Alteration and Enhanced Oil Recovery in Carbonates. J. Mol. Liq. 2019, 285, 707–715. [Google Scholar] [CrossRef]
  99. Han, X.; Kurnia, I.; Chen, Z.; Yu, J.; Zhang, G. Effect of Oil Reactivity on Salinity Profile Design during Alkaline-Surfactant-Polymer Flooding. Fuel 2019, 254, 115738. [Google Scholar] [CrossRef]
  100. Li, J.; Niu, L.; Lu, X. Performance of ASP Compound Systems and Effects on Flooding Efficiency. J. Pet. Sci. Eng. 2019, 178, 1178–1193. [Google Scholar] [CrossRef]
  101. Riswati, S.S.; Bae, W.; Park, C.; Permadi, A.K.; Efriza, I.; Min, B. Experimental Analysis to Design Optimum Phase Type and Salinity Gradient of Alkaline Surfactant Polymer Flooding at Low Saline Reservoir. J. Pet. Sci. Eng. 2019, 173, 1005–1019. [Google Scholar] [CrossRef]
  102. Han, X.; Chen, Z.; Zhang, G.; Yu, J. Surfactant-Polymer Flooding Formulated with Commercial Surfactants and Enhanced by Negative Salinity Gradient. Fuel 2020, 274, 117874. [Google Scholar] [CrossRef]
  103. Kurnia, I.; Zhang, G.; Han, X.; Yu, J. Zwitterionic-Anionic Surfactant Mixture for Chemical Enhanced Oil Recovery without Alkali. Fuel 2020, 259, 116236. [Google Scholar] [CrossRef]
  104. Tianbo, L.; Xurong, Z.; Shuai, Y.; Jiawei, Z. Surfactant-EOR in Tight Oil Reservoirs: Current Status and a Systematic Surfactant Screening Method with Field Experiments-All Databases. J. Pet. Sci. Eng. 2021, 196, 108097. [Google Scholar] [CrossRef]
  105. Slamet, P.; Ronny Windu, S.; Suherman, S. High-Performance Polymeric Surfactant of Sodium Lignosulfonate-Polyethylene Glycol 4000 (SLS-PEG) for Enhanced Oil Recovery (EOR) Process-All Databases. Period. Polytech. Chem. Eng. 2021, 66, 114–124. [Google Scholar] [CrossRef]
  106. Sekerbayeva, A.; Pourafshary, P.; Hashmet, M.R. Application of Anionic Surfactant\engineered Water Hybrid EOR in Carbonate Formations: An Experimental Analysis-All Databases. Petroleum 2022, 8, 466–475. [Google Scholar] [CrossRef]
  107. Panthi, K.; Mohanty, K.K. Chemical Flood with a Single Surfactant. In Proceedings of the SPE Improved Oil Recovery Conference, Virtual, 18 April 2022; p. D021S013R002. [Google Scholar]
  108. Mariam, S.; Aida, S.; Peyman, P.; Muhammad, R.H. Optimization of Low Salinity Water/Surfactant Flooding Design for Oil-Wet Carbonate Reservoirs by Introducing a Negative Salinity Gradient-All Databases. Energies 2023, 15, 9400. [Google Scholar] [CrossRef]
  109. Sumadi, P.; Yoga, R.; Ivan, K.; Oki, M. Synergy of Surfactant Mixtures and Fe3O4 Nanoparticles for Enhanced Oil Recovery (EOR)-All Databases. Inorg. Chem. Commun. 2023, 155, 111125. [Google Scholar] [CrossRef]
  110. Zhang, Y.; Yi, Z.; Yang, Z.; Luyu, W. Experimental Study on Characteristics and Mechanisms of Matrix Pressure Transmission near the Fracture Surface during Post-Fracturing Shut-in in Tight Oil Reservoirs-All Databases. J. Pet. Sci. Eng. 2022, 219, 111133. [Google Scholar] [CrossRef]
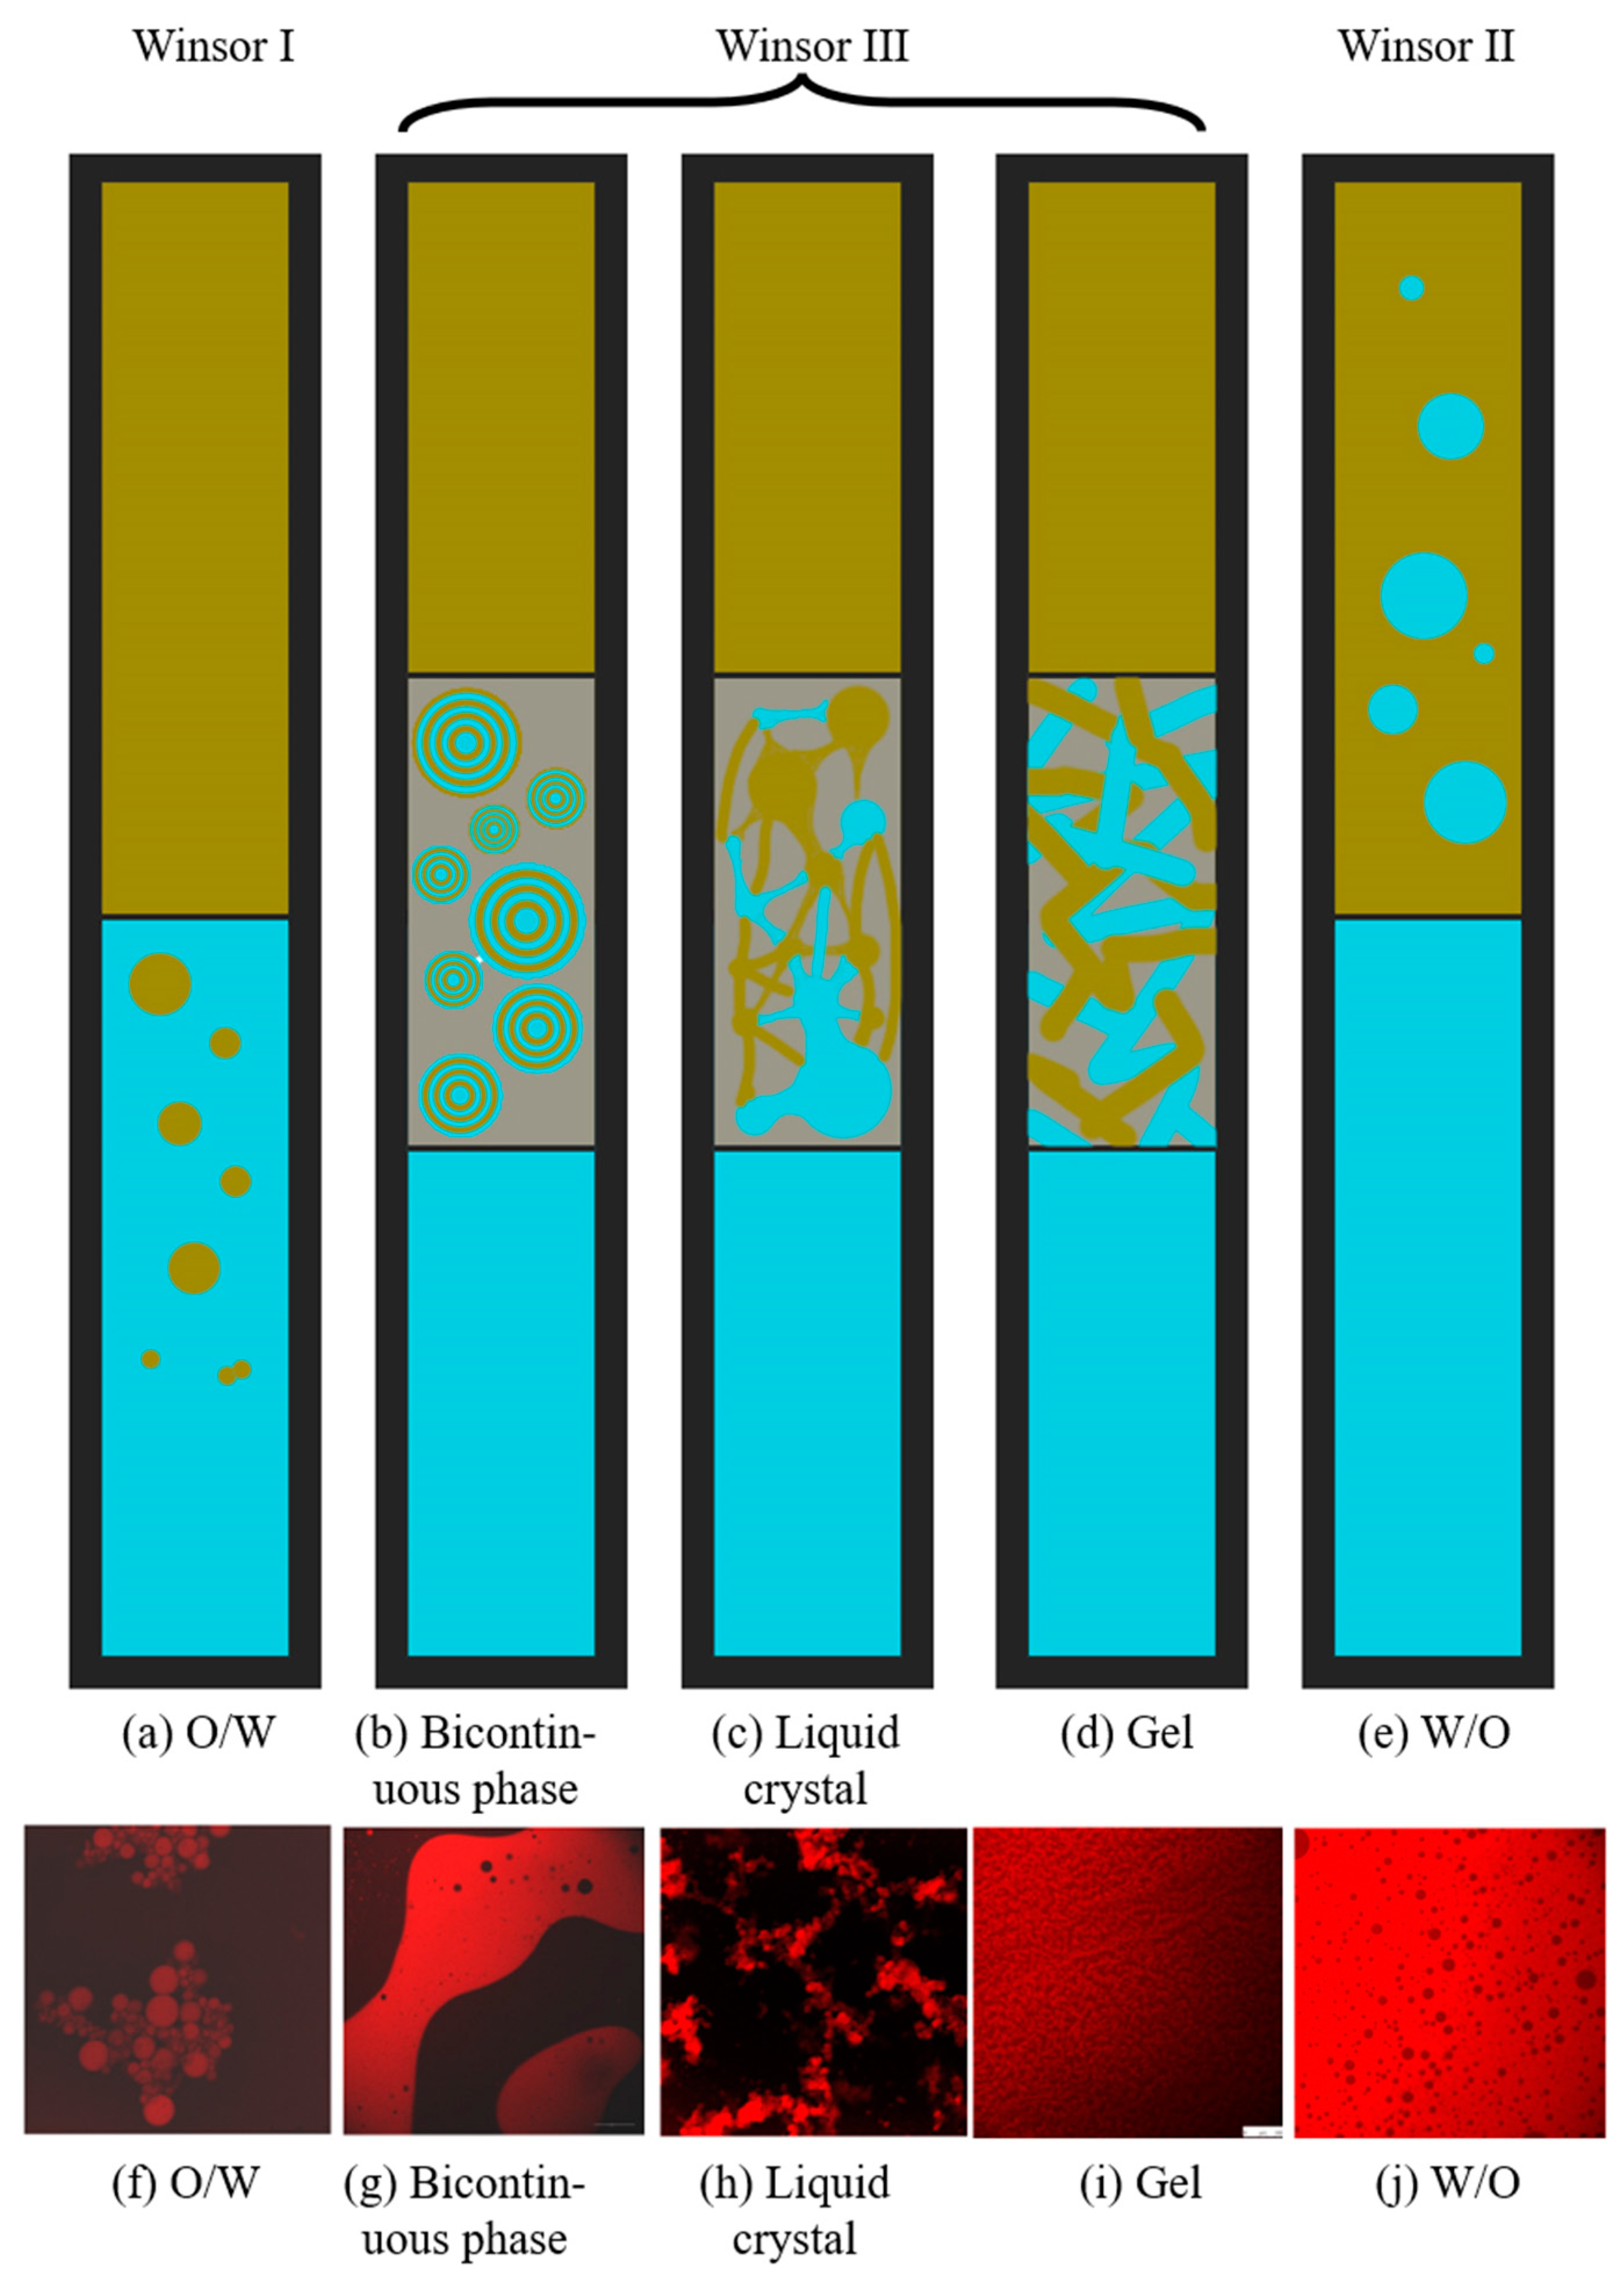
Figure 1. Microemulsion models adapted from Roger: (a) O/W microemulsion, (b) bicontinuous phase, (c) liquid crystal, (d) gel, (e) W/O microemulsion confocal laser scanning microscopic images adapted from Choi [23], (f) O/W microemulsion, (g) bicontinuous phase, (h) liquid crystal, (i) gel, and (j) W/O microemulsion. Reprinted with permission from [18]. 2011 Food Chemistry.
Sustainability 16 00629 g001
Figure 2. Winsor phase diagrams. Reprinted with permission from [45]. 2014 Chinese Journal of Chemical Engineering.
Sustainability 16 00629 g002
Figure 3. ε-β fish-like diagrams: (a) fish-like diagram for a 1:1 oil-water ratio and (b) fish-like diagram for different oil-water ratios. Points B and E are the start and end points of the three-phase microemulsion region. Reprinted with permission from [48]. 2016 Fluid Phase Equilibria.
Sustainability 16 00629 g003
Figure 4. Quasi-ternary phase diagrams. Reprinted with permission from [49]. The gray areas in the phase diagram represent the parts of the white emulsions with large droplets. 2017 Advances in Water Resources.
Sustainability 16 00629 g004
Figure 5. (a) Cut of the regular tetrahedron quaternary phase diagrams. Reprinted with permission from [56]. The O stands for oil, W for water, S for surfactant, and A for alkali. 2005 Journal of Surfactants and Detergents. (b) Triangular prism quaternary diagram. Reprinted with permission from [57]. The orange line in the figure represents the three-phase area. 2016 Colloids and Surfaces A: Physicochemical and Engineering Aspects.
Sustainability 16 00629 g005
Figure 6. Dynamic diagram of the interaction between the microemulsion oil displacement system and crude oil: (a) diffused strips formed after injection of the surfactant, (b) formed middle-phase microemulsion, and (c) the solubilization process of middle-phase microemulsion. Reprinted with permission from [72]. 2021 Junjian Li.
Sustainability 16 00629 g006
Figure 7. In situ fluorescent labeling of microemulsions displacing residual oil. Reprinted with permission from [27]. 2022 Journal of Colloid and Interface Science.
Sustainability 16 00629 g007
Figure 8. Capillary forces during imbibition and the Haines jump process. Reprinted with permission from [74]. 2021 Junjian Li.
Sustainability 16 00629 g008
Figure 9. Analysis of the occurrence state of microscopic residual oil in the homogeneous model and calculation of the relationship between the pores occupied by different types of microscopic residual oil and the average pore radius. Adapted with permission from [75]. 2020 Junjian Li.
Sustainability 16 00629 g009
Figure 10. Using the micro-CT method to calculate the thickness of different phases. Reprinted with permission from [26]. 2022 Journal of Colloid and Interface Science.
Sustainability 16 00629 g010
Figure 11. Demonstration of wettability reversal using CT, where (a) represents the water-wet state, and (b) represents in situ measurements of oil–water contact angles on rock surfaces under the oil-wet state. The green area represents water/oil-wet porous media. Image (i) shows in situ measurements via CT scanning, with red, blue, and gray indicating oil, water, and sand surfaces, respectively, while image (ii) is non-in situ measurements. Sub-images (iiiv) display typical 3D visualizations of oil phases within pore spaces (yellow and gray represent oil droplets and rock, respectively). Reprinted with permission from [76]. 2022 Journal of Petroleum Science and Engineering.
Sustainability 16 00629 g011
Figure 12. The behavior of mixed phases by X-ray CT. (a) The water flooding (WF) process, which shows a clear oil–water interface in the three-dimensional pore space. The blue area and green area represent the spread range of waterflooding and emulsion flooding. (b) The microemulsion flooding (EF) process, with a concentration gradient and no interface. (c) Two-dimensional micro-model experiments demonstrate the gradual dissolution of crude oil during the EF process. Se stands for saturation of microemulsion. (d) Due to the similar viscosities between the microemulsion and the oil phase, the fingering phenomenon during the mixed-phase displacement process is inhibited. Reprinted with permission from [76]. 2022 Journal of Petroleum Science and Engineering.
Sustainability 16 00629 g012
Figure 13. The oil displacement process by CT scanning. (a) Dynamic displacement front starting from the central cross-sectional area (Se represents emulsification saturation). (b) Residual oil in the area marked with a black rectangle (dimensions: 2.5 × 2.5 × 5.5 mm; different colors indicate unconnected clusters). Reprinted with permission from [76]. 2022 Journal of Petroleum Science and Engineering.
Sustainability 16 00629 g013
Figure 14. CT scanning observation of the displacement process: (a) permeability of 428 mD (b) and permeability of 2445 mD. Reprinted with permission from [77]. 2019 Fuel.
Sustainability 16 00629 g014
Table 1. Microemulsion structure types represented by R ratio.
R RatioMicroemulsion Structure Types
1Middle-phase microemulsion
>1O/W microemulsion
<1W/O microemulsion
Table 2. Progress in studying HLD equations with control parameters.
AuthorYearControl ParametersResearch ContentReference
Wu2016EACN, K, CCEffect of alcohol on EACN, obtaining surfactant parameters with different K values and Cc values[35]
Arpornpong2018 C s e Calculate optimal salinity from the slope intercept[36]
Liu2020EACN, TEffect of temperature on wax content and equivalent alkane carbon number[37]
Jaebum2022EACNComparison of the difference in EACN number between dead oil and live oil[38]
Table 3. Research progress on middle-phase microemulsions using the quasi-ternary phase diagram method.
AuthorYearResearch ContentReference
Roger2011Roger studied the phase diagram positions when the boundary elimination (CB) of different oil-to-water ratios occurs. The CB front edge represents a single-phase state (reverse micelle, lamellar, cubic, or sponge) or a two-phase state resulting from phase transitions between single-phase states, aligning with the middle-phase transformation process[18]
Acosta2012Acosta investigated the corresponding positions in the three-phase diagram when HLD = 0 or HLD approaches 0, indicating the formation of a bicontinuous phase[53]
Kanan2017Kanan demonstrated different phase diagram positions for middle-phase microemulsions by using cationic surfactants to prepare microemulsions[54]
Javanbakht2017Javanbakht proved the dynamic transition of Winsor III-type non-aqueous phase liquids (NAPLs) from an emulsion to a transparent phase[49]
Porada2017Porada investigated the impact of anionic polarity on the size of the three-phase region[55]
Choi2021The surfactant-to-oil ratio (SOR) is an important factor in determining the type of microemulsion. Bicontinuous microemulsions form when the SOR is greater than or equal to 2. On the other hand, when the SOR is less than 2, it favors the formation of W/O microemulsions[23]
Disclaimer/Publisher’s Note: The statements, opinions and data contained in all publications are solely those of the individual author(s) and contributor(s) and not of MDPI and/or the editor(s). MDPI and/or the editor(s) disclaim responsibility for any injury to people or property resulting from any ideas, methods, instructions or products referred to in the content.