1. Introduction
On 6 February 2023, an area about the size of Portugal was struck by two big earthquakes (9 h apart; 7.8 and 7.5 Mw) [
1]. These earthquakes occurred in Pazarcık and Ekinözü, districts of Kahramanmaraş in Türkiye [
2]. After the earthquake in the region with a population of approximately 14 million, including thousands of Syrian refugees, more than 50,000 people in Türkiye and approximately 6000 people in Syria lost their lives [
3]. Moreover, nearly 14 million people in almost 10 different cities have been affected, more than 37,000 buildings collapsed, and more than 250,000 buildings have been severely damaged, according to the Turkish Ministry of Environment, Urbanization, and Climate Change [
4]. Furthermore, after the earthquake event, about a million people were homeless; most fled to tents or student dormitories. Unfortunately, those numbers are vastly underestimated [
3]. This situation indicates that the earthquake reality in Türkiye is not entirely accepted.
In history, Türkiye has had many natural disasters due to earthquakes. In 1939 (27 December 1939, Mw = 7.8), approximately 33,000 people died in Eastern Anatolia from the Erzincan earthquake. This event triggered the first Turkish Earthquake Regulation [
5]. After the first regulation in 1940 and the Tosya–Lâdik earthquake in 1943 (27 November 1943, Mw = 7.7), a second earthquake regulation was followed in 1944. Other updates of the Code succeeded in 1947, 1949, 1953, and 1961, respectively [
6]. In 1942, a map of earthquake zones was prepared for Türkiye. In the earthquake regulations published in 1947, earthquake calculations became dependent on the seismicity of the region where the building was located [
7]. The earthquake regulation published in 1968 introduced limit values for the minimum dimensions of reinforced concrete structural elements, and modern calculation methods still in use today were included. This regulation contains definitions, suggestions, and information, such as connection and confinement zones of reinforced concrete elements, reinforcement details for ductile/tensile behavior, and element dimensions and bearing capacity [
8]. In the 1997 earthquake regulation, applying the details of the ductile design became mandatory.
Nevertheless, on 17 August 1999, a 7.4 magnitude earthquake struck an area 100 km from Istanbul [
9]. After this event (which hit Izmit and Düzce with Mw = 7.4 and 7.2), about 19,000 people died [
10]. These disasters left scars on the nation, and in 2001, a new legislation was enacted to inspect and construct earthquake-resistant buildings [
11]. These regulations were updated in 2018 to draw new technical and scientific standards [
12].
Therefore, buildings built after 2001 should be less risky throughout the country. According to the Turkish Statistical Institute, 51% of the citizens of 10 provinces affected by the recent Kahramanmaras earthquakes lived in buildings built after 2001 [
13]. However, the field observations from the front do not confirm that these buildings were more earthquake resistant.
Reports from Kahramanmaras, the earthquake’s epicenter, show buildings built after 2004. They were supposed to be earthquake resistant. Instead, many of these buildings collapsed after the quake [
3].
Right after the recent Kahramanmaras earthquakes, many builders from the region have been arrested nationwide for negligent construction. At the same time, according to regulations introduced in 2001, buildings have to be inspected by expert auditing firms [
14]. But there are mainly two types of problems: the first is corruption, since construction companies, especially in smaller cities, can have political influence and use their power to avoid being supervised; while the second is the so-called “Imar Barisi” or “construction amnesty”, a term that is often heard in Türkiye [
8]. It refers to any regulation that legalizes previously illegal constructions (all those built against the building code) in exchange for a fee [
11].
According to recent investigations, in the ten provinces hit by the Kahramanmaras earthquakes, 294,165 buildings had been issued legalization certificates [
3]. In these buildings, thousands of people lost their lives. Instead of being fortified or demolished, they were subject to amnesty under the new regulations.
The construction sector is a crucial asset for political consensus; even though it is corrupted, it undoubtedly creates an economy while triggering the growth of other sectors, and many policies support the construction sector by offering favorable financing [
15]. But, what can happen in an earthquake? Moreover, with the existent data, is it possible to build a composite indicator of the degree of risk of earthquakes? Finally, is it possible to estimate population exposure if an earthquake similar to the Kahramanmaras hits Türkiye’s third most populated city (Izmir)?
Even though the exact location, frequency, and impact of future earthquakes cannot be precisely predicted, there is the possibility of integrating the existing knowledge to design less vulnerable settlements [
16,
17,
18]. In fact, to determine the earthquake risk, information on the built environment’s vulnerability when associated with the density of people (exposure) and a robust configuration of the hazard distribution based on geological characteristics can provide means to reduce impacts and minimize economic and human losses [
19,
20].
Composite indicators in earthquake risk assessment are rooted in the principles of multi-criteria decision analysis computed in a Geographic Information System (GIS) environment [
21], these indicators amalgamate geological, geophysical, and socio-economic factors to create a holistic measure of seismic risk [
22].
By integrating quantitative data and qualitative insights, the methodologies to create composite indicators on risk spans from the Seismic Risk Index (SRI) [
23,
24] or the Earthquake Risk Evaluation Index (EREI) developed by Rojas et al. (2011) [
25], to earthquake-responsive administration [
26,
27]. These approaches exemplify the application of composite indicators in capturing the complex interplay of seismic hazards and societal vulnerabilities [
28].
Drawing inspiration from comprehensive works, such as “A GIS-based earthquake damage assessment and settlement methodology” by Hashemi and Alesheikh (2011) and “Integration of earthquake risk-sensitivity into land use planning: An approach for a local level area at development phase” by Barua et al. (2020), composite indicators incorporate seismicity rates, fault activity, ground shaking potential, and vulnerability of structures into a unified spatially georeferenced framework [
29,
30]. These indicators contribute significantly to the advancement of seismic risk science and enable decision-makers to prioritize mitigation strategies and allocate resources efficiently for resilient urban planning and infrastructure development.
In this work, we tried to create the first composite earthquake risk index for the metropolitan area of Izmir [
19]. We did it using scarce digital resources on buildings, but we integrated the available information with remote-sensed acquisitions by the Copernicus Sentinel program [
31,
32,
33]. We used a composite index calculated by a geomatic stepwise process to incorporate the building’s vulnerability with the hazard projection [
34,
35]. Geological maps were used to spatialize the local distribution of potential acceleration of the waves while also predicting where soil can be subject to liquefaction [
4,
36]. Finally, the two indexes of vulnerability and hazard were merged with population exposure while reaching the city’s first comprehensive composite earthquake risk index. Results are discussed considering the potential damage the city can face, trying to put science at the service of political decisions regarding citizen safety.
2. Materials and Methods
2.1. Study Area and Seismicity of the Region
The metropolitan city of Izmir, officially known as “İzmir Büyükşehir Belediyesi”, ranks as the third most populous urban agglomeration in Türkiye and stands out as one of the most vibrant and densely populated cities along the Aegean Sea [
37,
38].
Situated on the western tip of Anatolia (at coordinates 38.42° N 27.14° E), Izmir encompasses the most concentrated urban area, Izmir itself, spanning across 12,012 square kilometers and hosting over 4,677,292 residents [
39,
40]. The highest population densities are found around the former Roman harbor, now transformed into one of the densely developed Ottoman bazaar districts known as Alsancak in the Konak district [
41]. Due to favorable landform conditions, the entire waterfront area has become saturated with settlements and infrastructure. The waterfront basin is predominantly hilly, transitioning from steep inland slopes to gentle, flat, sandy coastlines [
42]. In other regions, particularly along the riverbanks with fertile soils, there is intensive cultivation alongside significant industrial, commercial, and residential expansion, covering 40% of the total surface area. The average elevation is 239 m above sea level, with altitudes ranging from 1462 to 2 m. The most densely inhabited district along the waterfront continues to expand onto the hillside, encroaching upon semi-natural and natural forested areas (according to Corine Land Cover data, over 53% of the land is covered by typical Mediterranean densely vegetated terrain, with forests scattered along the hillslopes) [
43].
Notably, the recent rapid urbanization process has given rise to various environmental issues. Urbanization is generally proceeding without regard for soil characteristics and associated seismic risks [
44].
Izmir has a history of enduring numerous earthquakes within its provincial boundaries and in neighboring areas like Manisa, Aydın, Balıkesir, Izmir Bay, and the surrounding islands such as Samos, Lesvos, and Chios [
45]. Historical earthquake records indicate multiple instances centered in Manisa, Selçuk–Efes, Foça, Turgutlu, Menemen, and Çeşme, estimated to fall within the VIII-X intensity range on the Modified Mercalli Scale [
46]. These seismic events are directly linked to the active tectonic activity within the West Anatolian Extensional Province [
47,
48].
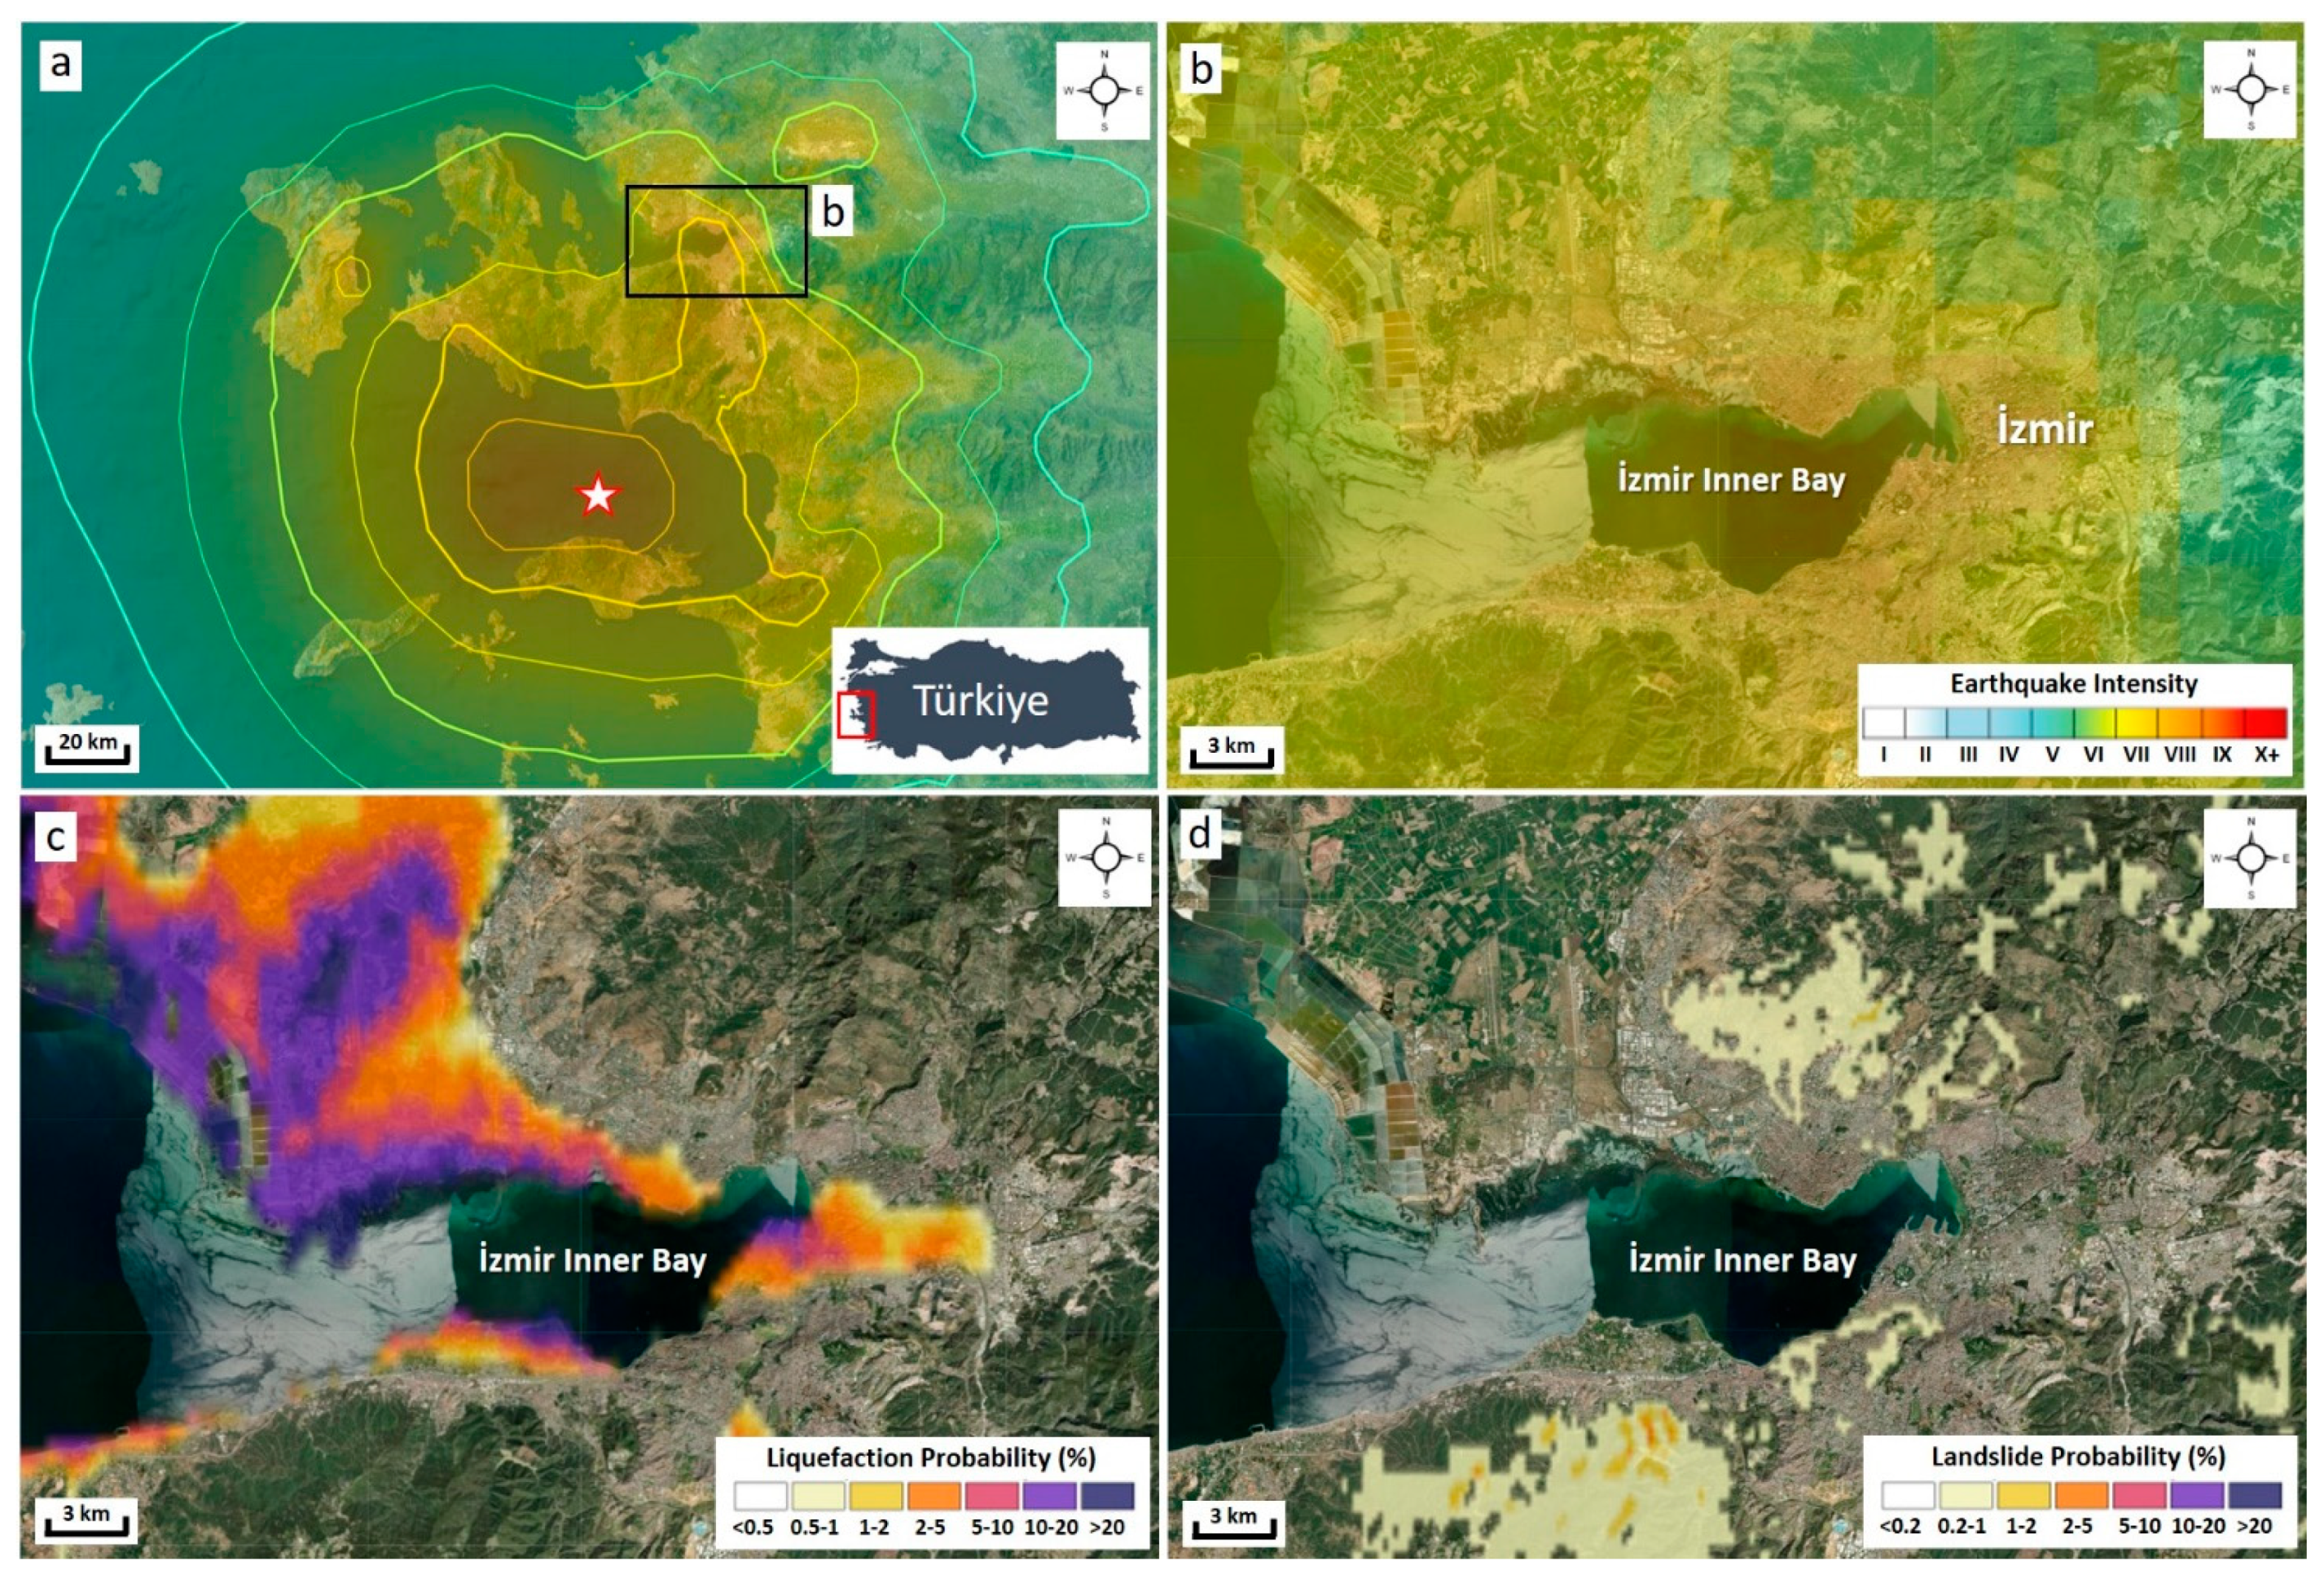
Unfortunately, the Samos Earthquake of 2020, located 70 km from Izmir’s epicenter, brought these vulnerabilities to the forefront, leading to significant loss of life and property damage in and around Bayraklı [
38]. Numerous buildings collapsed or sustained damage. This earthquake event, recorded at VI–VII levels on the Mercalli intensity scale (
Figure 1a,b), highlighted the potential for mass movements and liquefaction at considerable distances from the epicenter, in addition to surface wave amplification and surface faulting, much like the Kahramanmaraş earthquakes in 2023 [
10,
45]. Various regions within Izmir experienced such phenomena during the Samos earthquake, with noticeable signs of liquefaction, particularly along the coastlines (
Figure 1c,d).
Unfortunately, Izmir’s city center, situated in such an active seismic zone, is not adequately prepared for a major earthquake. This study evaluates the metropolitan area and its surroundings, including densely populated districts such as Karşıyaka, Bayraklı, and Konak.
2.2. The Risk Assessment
An earthquake is a movement of the earth’s surface by energy waves emitted by tectonic plate friction that shake the earth’s surface [
31,
49]. According to the current literature in this field, the earthquake risk (or seismic risk) describes which areas can be most impacted by an earthquake in terms of the probability of damage to structures or people [
50,
51].
According to the most common approaches, the factors combined to assess earthquake risk are based on a deep understanding of the earthquake hazard. Earthquake hazard maps are built upon the knowledge of past earthquakes, integrated by geology and tectonics, and local soil conditions [
10,
47]. These factors are combined with population distribution and the vulnerability of the settlement system. Without a detailed and reliable digital dataset for this scope, we composed a risk index while mixing different aspects:
the Earthquake Vulnerability (composed of building and road sensitivity);
the Hazard amplification map (composed of soil liquefaction and fault line maps);
the Exposure (composed by population distribution).
The three components can be defined as follows:
Vulnerability measures the degree to which adverse factors can damage a component. To clarify, if a building is tall, thin, irregular, and made of unstable material, it will be vulnerable to earthquakes independently of its location or intensity.
The hazard represents the potential distribution and the intensity of a shock. In that case, we used the geological maps of Izmir to detect (i) the alluvial soils that potentially can be affected by soil liquefaction and (ii) the fault lines where the earth’s surface can be affected by raptured and asymmetrical movements.
Exposure is the third factor that constitutes the risk equation and comprises the goods or people that can be exposed to hazards.
Therefore, the risk is composed of the simultaneous presence of the three factors: vulnerability, hazard, and exposure.
2.3. Data Source and Data Processing
The risk assessment was conducted in a GIS environment (see
Figure 2). Specifically, ESRI ArcGIS Pro (ver. 3.2.1) was employed to create a local dataset. Single layers were imported, processed, and overlayed to obtain the final index. Sources of data on buildings, land use, and population were downloaded from:
Copernicus Land Monitoring Service. A Land Use Land Cover map has been downloaded by the Urban Atlas 2018 project in our Area of Interest. Urban Atlas contains the Land Use Land Cover product’s digital shapefile in Functional Urban Areas, with population distribution. It includes 17 urban classes with MMU 0.25 ha and 2 Rural Classes with MMU 1 ha.
Global Human Settlement Layer (namely GHS-BUILT-V R2022A—GHS) to divide the age of construction of buildings. GHS built-up volume is a multi-temporal (1975–2030) raster grid file. The raster dataset represents the distribution of built-up volumes, expressed as the number of cubic meters from 1975 to 2030 in 5-year intervals (future epochs are predicted by linear interpolation on past trends). The resolution available is a 100 m grid.
Damaged and collapsed building data digitalized from the earthquake damage assessment studies of the Ministry of Environment and Urbanization of the Republic of Türkiye, the Samos earthquake reports, and findings in the field studies of Authors [
45,
52]. Buildings were obtained by the Urban Planning Department of the İzmir Metropolitan Municipality.
Geological unit borders were modified (especially Quaternary units) after Akbaş et al. (2011) and digitized from satellite images and the Author’s previous studies [
53].
Hydrogeological data derived from different sources such as observation wells [
45], the literature reports, and groundwater level iso-depth contours (only for Quaternary units) interpolated from these data via ArcGIS PRO software (ver. 3.2.1).
Active fault data was modified with the Author’s data after Uzel et al. (2012) and Emre et al. (2013) [
54,
55].
2.4. Earthquake Vulnerability
2.4.1. Height
Building height has a substantial impact on earthquake response and the level of structural damage [
56,
57]. Buildings having a lower height-to-surface area ratio are more earthquake-resistant and vice versa [
58,
59]. As a result, high-rise buildings with a smaller surface area are more vulnerable to earthquake damage. Similar to many earthquakes that took place in Türkiye, similar damages were observed in buildings of different heights and ages in earthquakes in and around Izmir (
Figure 3). When these buildings shake and swing during an earthquake, they have a higher probability of pounding [
17]. For height estimation during the field surveys, three types of buildings were considered: single-story, double-story, and triple or multiple-storied. To this scope, the average height has been calculated at pixel level from the original product of the Global Human Settlement Layer. The raster has been rescaled from 0 to 1.
2.4.2. Age of Construction
Traditional construction practices are considered outmoded, insubstantial, and indicative of poverty in developing towns [
60,
61,
62]. As a result, people are moving away from traditional types and methods of construction and adopting modern practices and types of buildings with bricks, cement blocks and/or stones [
57,
63]. Masonry buildings, as they are known, are extremely vulnerable to earthquakes. In İzmir, there are many old buildings in Old İzmir, Kemeraltı, Kordon, Alsancak, and Karşıyaka, which were built in the first years of the Turkish Republic, were later restored and preserved but damaged by earthquakes and are still in risky condition (
Figure 4). For this purpose, these structures realized according to newer regulations should be analyzed by classifying them separately.
We divided three classes for ages of construction while assigning anti-seismic criteria. To obtain an age of construction, we intersected GHS with the polygons of buildings. We created a spatial overlay of buildings with multi-temporal raster and created three classes of buildings:
Before 1975, assigning code 1;
1975 to 2000, assigning code 0.5;
After 2000 assigning code 0.2.
2.4.3. Pounding
Pounding between neighboring buildings is one of the most common causes of structural damage during an earthquake [
17,
64,
65]. Pounding conditions occur when two or more buildings collide during an earthquake with a smaller distance [
66,
67]. If the separation distance between the buildings is insufficient, the buildings cannot swing freely, resulting in local thrashing of the structures [
50]. We employed a methodology that requires a minimum separation distance between two buildings of 4% of the building height [
68].
The “near” function has been employed to estimate the average distance between building features in each block [
69,
70] We used the 0.30 m as the “near” function’s search radius to check whether buildings are built closer to this distance and, in case, their quantity”. We finally converted values in a range from 0 to 1.
2.4.4. Building Geometry
Compared to regular structures, buildings having geometrical irregularities, such as a big height-to-width ratio, a large length-to-width ratio, or a large offset in plan and elevation, perform poorly and sustain significant damage during earthquakes [
60,
71,
72].
We calculated the ratio between height and footprint for each building. We transformed the shapefile into a raster with normalized values between 0 and 1.
2.4.5. Building Density
Unfortunately, the increasing demand for housing in districts such as Karşıyaka, Konak, and Buca, where the population is large and where people prefer to settle for social and economic reasons, caused a density in buildings and construction (
Figure 5). However, an urban area’s building density significantly impacts its structural vulnerability [
17,
73]. The more densely built a place is, the more vulnerable it is to earthquakes. The density has been calculated in each block as a ratio between the volume of buildings and the plot size.
2.4.6. Road Network
Roads are essential in the post-earthquake response and recovery phase [
74,
75]. As seen after the 2023 Kahramanmaraş earthquakes, closed roads, unusable airports and tunnels, and damaged railways, unfortunately, caused 1–2 days delay in rescue operations, failure to deliver aid, and many related problems. Roadblocks caused by earthquakes harm not just post-earthquake emergency services but also isolate specific areas of cities where basic amenities such as hospitals, shelters, and other critical services are situated [
72,
75,
76].
We selected the bridges and tunnels as the most vulnerable part of the road network. We extracted them and calculated the density of these infrastructures in the landscape.
2.4.7. The Final Composite Index of Earthquake Vulnerability
We rasterized and normalized all the layers from 0 to 1 (1 means max vulnerability) using the function rescale by function “Logistic Growth”. Then, we used the raster calculator tool and created a weighted overlay using the weights proposed by Fayaz et al. (2023) (Height 0.12; Age of construction 0.23; Pounding 0.3; Building Geometry 0.08; Building Density 0.15 and Road Network 0.15) [
17] (see
Figure 6).
A correlation matrix has been employed to assess the extent of spatial relationships among the variables utilized in this study within the catchment area. This analysis aids in interpreting the data and gaining insights into the dominant parameter among the variables used in this study. It is important to note that the findings cannot be generalized, as they specifically pertain to the unique spatial distribution within Izmir’s bay, characterized by its distinct spatial, morphological, social, and soil-related features.
Figure 7 shows the GIS overlay’s result while in
Table 1 the pairwise correlation for all inputs can be viewed.
2.5. The Hazard
A comprehensive hazard map has been produced using a specialized ancillary dataset that focuses on the geological characteristics of the Izmir coastal region, coupled with extensive building data. This dataset has undergone further refinement and enhancement through on-site observations. These field investigations have been conducted in recent years in conjunction with the relevant literature and multiple projects carried out within the metropolitan area of Izmir.
The resulting map classifies the soil into two distinct categories concerning earthquake hazards. Firstly, active fault lines have been identified and marked as avoidance zones (buffer zones), representing areas of the highest potential risk to both the population and infrastructure, irrespective of prevailing soil conditions. Beyond these buffer zones, soil types have been grouped based on their susceptibility to risk in construction. Additionally, we present and analyze the results of GIS analysis, incorporating digitized groundwater level and mass wasting data.
2.5.1. Earthquake-Surface Rupture Risk
Fault lines are considered dangerous due to their nature during seismic activity. The points where the earthquake, called the fault zone, formed up to the surface and formed the surface rupture can only be determined by microzonation studies.
The magnitude and depth of the earthquake control many variable surface deformations, such as fault displacement, offset and rupture on the main fault (on 3-dimension), secondary fractures, blocks formed after fracture, and movement directions. In addition, whether the ground is rock, or soil directly controls the width and geometry of the surface rupture formed due to the fault. For this reason, many different buffer-avoidance zone methodologies exist in the literature [
77,
78,
79,
80]. These rules have been researched, developed, and tried to be applied by considering the fault types in general [
81,
82,
83].
Within the scope of surface faulting hazard, in this study, the known active faults in İzmir province were digitized, and a buffer analysis was performed by considering the fault type in the analyses (
Figure 6). İzmir (İF) and Karşıyaka-Bornova (KBF) faults in the study area are active fault types with dominant normal components [
54,
55,
84,
85]. Since these faults are normal, they form a falling block on one side of the fault and an associated fault scarp. This hanging block generally contains Quaternary-aged talus and less consolidated units. For this reason, following the recommendations in the literature (assuming that there is minimum scattering in the fault zone), approximately 55 m has been calculated as 40 m in the hanging wall block and 15 m in the footwall block of the fault [
86]. To stay on the safe side for faults whose type and mechanism of action have not been determined, a 55 m avoidance zone was defined on both sides following the literature and included in the analysis [
77,
87].
2.5.2. Soil Liquefaction and Wave Amplification Risk
These historical maps were examined, digitized, and cross-referenced with Landsat satellite and Google Earth images to shed light on sea level rise changes. As illustrated in
Figure 8, some locations currently on dry land were once underwater. Notable points of interest identified in these images include (1) the present-day Istanbul–İzmir highway and industrial zone connections, (2) Çiğli highway connection, (3) the Mavişehir neighborhood, (4) the vicinity of Mavişehir and Izban Station, (5) the surroundings of Bostanlı Mosque, (6) the Bayraklı coastal recreation area, (7) the Meles Delta, and (8) the Kordon area.
These regions were formerly submerged in seawater or shallow wetlands as evident in satellite imagery. After the Samos Earthquake in 2020, analyses revealed that a significant portion of the structures in these areas had incurred damage (
Figure 8). Particularly, severe damage was observed in buildings behind the Bostanlı Mosque, in Karşıyaka, and along the Kordon. The demolitions in Bayraklı resulted in the loss of both life and property due to soil characteristics.
Around İzmir Inner Bay, the predominant geological formations consist of undifferentiated Quaternary alluvial units. Beneath these units, the geological composition varies across the region. In the northern part of Bayraklı and Karşıyaka, there are Yamanlar volcanics, while karstic basement rocks and flysch units characterize Bornova and its surrounding areas. Miocene and flysch units are found to the south of the bay. Examining the current geological situation, it becomes apparent that basement rocks primarily form the elevations around the bay. These elevations are known as Yamanlar, Çatalkaya, and Nif mountains. On the slopes of these mountains, Quaternary talus units give rise to unconsolidated deposits. Close to the seaside, the plains are enriched with alluvial deposits carried by various streams.
This study categorizes the Alluvium units into three main groups, as detailed geotechnical studies are ongoing (see
Figure 9). It is important to note that this grouping is not based on lithological characteristics but rather on deposition conditions over time.
Group A—Modern Filling Zone: This group represents areas near the coast that have been deposited and/or filled by human influence in the last 50 years. We have directly digitized data from aerial imagery, satellite imagery, and historical photographs for this group.
Group B—Ancient Fill Deposits: These areas were identified as ancient fill deposits, sourced from Jones (1939) [
88] and historical maps of Smyrna settlement. Historically, these regions served as delta areas where streams met the sea.
Group C—Undifferentiated Quaternary Units: These units are less understood due to limited detailed studies on their deposition and lithology. However, the presence of sand, clay, gravel units, and shallow groundwater is supported by various well data measurements, much like in Groups A and B.
Group D—Rock Lithologies: Group D primarily consists of rock lithologies with Miocene and pre-Miocene ages. In these units, the groundwater level tends to be relatively deeper and resembles solid rock. However, it is essential to be cautious of fracture-crack zones and surface fractures that may occur due to the deformation effect of fault zones within these units.
The detailed maps provide insights into the intricate relationship between soil composition and urban development in regions identified as high-risk seismic zones (see
Figure 9 and
Figure 10). Satellite imagery reveals that the urbanized area encompassing Mavişehir and Çiğli was once a marshy coastal area covered with marine sediments. Nevertheless, it continues to experience frequent flooding during rainy seasons, triggered by sudden downpours and rising streams and groundwater levels. This situation further exacerbates the risk of liquefaction in this region, which is already challenged by unfavorable soil conditions.
Additionally, when examining the distribution of damaged buildings, it becomes evident that structures located near fault segments and streambeds are more susceptible to damage. These unconsolidated, sandy, and pebbly layers are widespread along the İnciraltı–Balçova–Narlıdere axis, spanning Bayraklı, Karşıyaka, Mavişehir, Çiğli, and the southern bay area. These units pose a liquefaction risk during earthquakes due to their shallow groundwater levels in alluvial deposits (<20 m deep). During the Samos earthquake, significant damage occurred, especially in Bayraklı, attributed to wave amplification and basin effects caused by Quaternary alluvial deposits and the rock formations that encase them, prolonging the earthquake’s duration (see
Figure 8). Previous studies and ongoing projects indicate that the alluvial thickness in and around Bayraklı is approximately 250 m, with layers composed of sandy-clay and gravel extending towards the interior [
89].
The areas affected by seawater intrusion were previously locations of streambeds [
45]. Conversely, the reduction in damage on solid ground north of Bayraklı indicates the influence of soil properties. However, as illustrated in
Figure 10, damages were detected in stream valleys and buffer zones of fault segments in the northern part of Karşıyaka, situated on volcanic rock units. Similarly, damages were observed in the buffer zone of the İzmir Fault while requiring detailed micro-zoning.
The observed damage to buildings in the vicinity of Bostanlı and its surrounding areas following the Samos earthquake is believed to be associated with the historical coastline in this region, which was situated further inland in the past (see
Figure 11). A similar scenario is evident in the Mavişehir area. It has been determined that the damages in the relatively well-preserved pre-Quaternary units between Çiğli and Cumhuriyet settlements are influenced by fault segments of the Karşıyaka-Bornova Faults. However, areas near the coastline, specifically Zones A, B, and C, pose significant challenges due to problematic soil properties and groundwater conditions.
2.5.3. Mass Wasting
In the context of this study, an assessment of potential mass movements during and after earthquakes in the region was also conducted, utilizing high-resolution digital elevation model data (see
Figure 12). An analysis of the aspect distribution reveals that in the northern part of İzmir Bay, slopes predominantly face south, while in the southern part of the bay, slopes face north. Cliffs and fault scarps typically characterize these slopes.
Yamanlar Mountain, an ancient volcano, exhibits a morphological structure with a radial caldera. In this region, fractured volcanic units have given rise to large and small blocks. Similarly, limestone blocks can present a risk factor in the basement units around Bornova. Consequently, in areas surrounding Çatalkaya and Yamanlar mountains, where slope values exceed 30–45°, conditions conducive to mass movements, such as those triggered by precipitation, floods, rockfalls, and avalanches, may occur on the highest peaks under suitable circumstances.
2.6. The Exposure
We downloaded and georeferenced the original tile Global Human Settlement Layer, population distribution, for the reference year 2020.
Figure 13 illustrates the original raster, where the value represents the total population in each pixel.
As Türkiye’s third most populous city, Izmir’s population density is relatively high, especially in the city center and more densely populated neighborhoods.
2.7. The Risk Index
The three layers (Vulnerability, Hazard, and Exposure) were normalized between 0 and 1 and then merged using the raster calculator tool, obtaining the final composite map of Risk (see
Figure 14). Then, the raster layer has been transformed into a vector polygon to calculate different degrees of risk.
In a GIS context, normalizing and summing three layers can be performed as follows:
To normalize the values of each layer from absolute values to a scale between 0 and 1, you can use the following min-max formula:
where:
is the minimum value in ;
is the maximum value in ;
MaxLi is the maximum value in Li;
Normalized Li is the normalized Li layer.
After normalizing the three layers to a range of 0 to 1, they were summed up together. The sum of the three normalized layers is given by:
This process generated a new layer (Sum) representing the normalized sum of the three original layers.
We proceeded by utilizing the Natural Jenk classification method to perform risk segmentation into five distinct classes: namely, low, medium-low, medium, medium-high, and high. Subsequently, our focus shifted to identifying medium-high and high-risk areas. In doing so, we assessed the number of buildings and individuals susceptible to earthquake risks. Overall, the process to obtain the final Risk Index consisted of four main steps (see
Figure 2).
It is crucial to note that the classification process lacks empirical numerical evidence. This arises from the amalgamation of all layers, presuming an elemental condition where the three core components of risk—vulnerability, hazard, and exposure—are uniformly prevalent with heightened intensity. In essence, this risk assessment does not adhere to a parametric approach. Consequently, the resultant index does not provide insights into the definition of damage thresholds that could occur in the event of an earthquake, but rather spatially identifies the distribution of the areas where the risk is concentrated and suggests priority for interventions.
To facilitate the interpretation of our findings, we also analyzed the binary correlation encompassing all the layers used in constructing the composite index of risk (See
Table 1). This evaluation aids in comprehending the interrelationships and influences among the various factors contributing to the overall risk evaluation.
3. Results
As demonstrated, the city of İzmir, situated along the Aegean coast and influenced by an extensional tectonic regime, was established initially on alluvial deposits carried by various rivers. Throughout history, these alluvial materials brought by numerous large and small streams, such as the Gediz River to the north and the Meles Stream in the city center, have contributed to significant changes in the coastline of İzmir. Notably, the ancient city of Smyrna was once situated along the coast in İzmir’s Inner Bay. During that historical period, three different streams in this area actively flowed, with the ancient city of Smyrna positioned by the seaside [
45].
By interpolating maps from that era [
88] into today’s geography, it becomes evident that sea levels around İzmir’s Inner Bay differed in the historical period compared to the maps from the early years of the Republic of Türkiye.
The final risk analysis results show that 67,462 buildings are in medium-high and hazardous areas, with a potential population exposure of 618,467 citizens. Despite not being the result of a parametric estimation of the magnitude of the potential earthquake event, it can be said that the degree to which the population is exposed to earthquake-sensitive areas is huge (20.9% of the total population living in the urban area), thus requiring attention.
Results of the correlation analysis demonstrated that population density emerges as the most highly correlated variable concerning the other vulnerable factors. This observation is unsurprising, given that Izmir’s bay is densely populated. Consequently, areas with higher population density also exhibit elevated values across the other parameters. This interconnectedness poses a significant challenge, as controlling population density would require drastic measures such as relocating the population from urban fringes to safer areas and redesigning a more secure and less densely populated urban system. However, these measures are costly and time-consuming, making it challenging to create a secure city rapidly. Nevertheless, it is a fact that population density should be considered a significant diver for earthquake-risk management.
The second most correlated variable is infrastructure density. Again, this correlation aligns with expectations, as locations within Izmir with bridges and tunnels also spread in all dense areas due to the heterogeneous landform of the city. Therefore, the accessibility factor is severe and complicated to consider when dealing with earthquake risk. Moreover, tunnels often pass through densely built-up regions, exacerbating the risk of a disruption. To address this situation, the size of these infrastructures should be appropriately dimensioned to ensure their survival during an earthquake.
The third most correlated variable (although the top three exhibit nearly equivalent correlations) pertains to building geometry. This indicates the prevalence of irregular building shapes throughout the catchment, often co-occurring with areas characterized by high values in the other variables.
Age is the fourth variable, demonstrating a consistently high spatial correlation with all other risk factors. This underscores that older masonry buildings are situated in densely inhabited areas where the coexistence of tall and irregular structures significantly amplifies the risk of collapse.
Unexpectedly, the fifth position is occupied by soil. While only a minority of soils exhibit a high degree of risk in terms of stability or liquefaction (primarily sandy sediment areas along the bay and fault lines on rocky terrain), many buildings and infrastructures are situated atop these soils. This poses a tangible problem in Izmir, as regardless of the shaking intensity, these areas have a notably high probability of experiencing severe structural damage. Consequently, countermeasures should be adopted. Regarding planning, relocating citizens to safer areas should take precedence in these vulnerable spots where liquefaction could occur. In such instances, appropriate solutions for rebuilding the city should be embraced, utilizing the most advanced building techniques.
The average correlation of the remaining variables is negligible. As a result, they lack a significant relationship with the other risk factors considered in this composite risk index.
4. Discussion
The overall vulnerability of the city can be viewed as an effect of the historical development in different periods: the ancient Izmir, known as Smyrna, has been built around iconic structures such as the Agora of Smyrna, the Roman-Era agora that served as the heart of the city’s commercial and social life located in Konak district.
A distinctive impulsion has been provided by the Ottoman Empire, which exerted a significant influence on Izmir’s urban development. Traditional Ottoman architecture flourished during this period, giving rise to landmarks like the Clock Tower (Saat Kulesi), a city symbol. Mosques, hammams (Turkish baths), and caravanserais were also constructed, reflecting the architectural style of the time. These development periods were characterized by traditional masonry and wood architecture, largely modified, re-built, or renovated, reaching a densely built, heterogeneous environment.
In the early 20th Century, Izmir experienced rapid urban growth and modernization. In this period, European influences became prominent, particularly in the district of Alsancak, where neoclassical and Art Nouveau buildings adorned the streets. Right after, Izmir witnessed further urban expansion and the development of modern infrastructure made of concrete. New residential areas and neighborhoods were constructed to accommodate the growing population. The city’s transportation system improved, and industrial zones emerged, contributing to economic growth.
The construction of high-rise buildings, modern shopping centers, and residential complexes has recently reshaped the city’s skyline. Green spaces and recreational areas have also been integrated into the urban fabric, promoting a more balanced and livable environment.
In general, urban areas tend to have higher population densities compared to suburban or rural areas. The average population density is approximately 641 inhabitants per square kilometer. Densely populated areas include Konak, Buca, Bornova, Karşıyaka, and Alsancak.
An integrated urban planning approach to reduce vulnerability to earthquakes necessitates a multi-faceted strategy. This approach includes the consideration of population distribution, coupled with an analysis of the morphological characteristics of buildings and infrastructure, taking into account the prevailing soil conditions.
As for the last point, considering the seismic zoning map in Izmir can stimulate a real understanding of the region’s geological characteristics and historical seismic activity. Classifying different areas based on their seismic hazard levels, and considering factors such as ground acceleration, soil liquefaction potential, and proximity to active faults can provide valuable insights on where urban transformations can occur with more safety. The seismic zoning plan should be designed while developing a strict building code incorporating seismic-resistant design and construction practices should follow the seismic hazard zone.
Building codes should implement regulations that incentivize or mandate the retrofitting and strengthening of existing buildings to enhance their seismic resilience. Critical facilities such as schools, hospitals, and emergency response centers should be prioritized, as well as other private buildings that may not meet current seismic standards.
Land Use Planning must generally integrate seismic considerations to develop specific regulations. Restrict or discourage the construction of critical facilities along fault lines or where there is a probability of soil liquefaction. Discourage high-rise buildings or large-scale infrastructure in high-risk areas identified through seismic zoning. Encourage the development of open spaces and parks in these areas to mitigate the potential impact of earthquakes.
4.1. Policy Suggestions
Within this study, we also want to go beyond the pure estimation of potential risk and suggest some possible policy suggestions that use the study results to deepen these preliminary results.
Geotechnical investigations should be regularly promoted in the areas with high risk. This procedure should be regularly adopted in all construction projects and in the existing city where a coupled integration of vulnerability, exposure, and potential hazard are simultaneously present. This investigation is necessary to assess soil conditions, liquefaction potential, and other relevant factors and ensure that the results of these studies inform the design and construction processes to mitigate the effects of seismic hazards.
Based on the comprehensive soil analysis, we can suggest dividing the area into several zones with varying degrees of seismic hazard:
Zones A and B: These encompass regions that were previously seabed, riverbeds, and deltas. They are highly susceptible to soil liquefaction during seismic events. This makes them vulnerable to risks such as seawater intrusion, liquefaction, and the amplification of seismic waves. These hazards can lead to chaotic situations, especially when combined with external factors like flooding, sea swells, tides, and rising groundwater levels. In the event of a significant earthquake, the scale of the impact could be significantly larger in neighborhoods such as Mavişehir, Bostanlı, Bayraklı, and Konak, resulting in potential loss of life and property.
Zone C: This area consists of undifferentiated alluvium and represents an intermediate hazard level. While it may not be as prone to liquefaction as Zones A and B, it still faces risks associated with seismic activity.
Zone D: Rocks in this category are considered low-risk, but they are not entirely immune to the effects of fault ruptures. The fracture and crack systems in volcanic units and the blocky structure in karstic limestones indicate that these foundation units have experienced deformation. The İzmir and Karşıyaka-Bornova faults, characterized by normal fault characteristics, are the primary fault segments responsible for the deformation of rock units in the region. After the 2020 Samos earthquake, deformations were observed in buildings in these fault segments’ interaction zones.
Most of the structures affected by the earthquake are situated in filled areas that historically coincided with the sea, as evident from older satellite images. Construction on alluvial soils in Bayraklı sustained significant damage due to geological factors like the basin effect and earthquake wave amplification. Therefore, it is imperative to determine the soil properties of İzmir through micro-zoning studies promptly, identify surface fractures and avoidance zones that fault lines may generate, and assess the earthquake readiness of buildings. Furthermore, in addition to preparing for other potential disasters during and after an earthquake, the city should develop new measures to address fire, explosions, mass movements, and similar situations as swiftly as possible.
At any rate, allocating land decisions with adaptability and flexibility helps future-proof them against changing circumstances. This includes considering potential climate change impacts, evolving seismic risks, and technological advancements. Flexibility in land use, infrastructure design, and building codes allows for adjustments and updates as needed, ensuring the long-term sustainability and resilience of the new town.
Even in a context where citizens’ trust in public administrations is relatively low, and especially where the topic of earthquakes is a taboo subject of public discourse, the role played by the city in fostering awareness and transparency regarding the acceptance of the risk of living in high-collapse risk areas is of utmost importance. Launch public awareness campaigns to educate residents, architects, engineers, and construction professionals about seismic risks and safe building practices. Provide information on the importance of complying with anti-seismic regulations and promote earthquake preparedness measures at the individual and community levels.
Finally, establishing a dedicated department within the local government responsible for overseeing and enforcing or controlling anti-seismic regulations can be vital. This department should collaborate with relevant stakeholders to conduct regular inspections, ensure compliance, and provide technical assistance and guidance to developers and building owners.
By implementing these policy recommendations, İzmir can take substantial steps toward safeguarding its residents and infrastructure against seismic risks, fostering greater preparedness, and ultimately reducing the potential impact of future earthquakes on both life and property.
4.2. Limits
The vulnerability analysis primarily relies on extensive digital building data that has not been verified or corrected through field surveys. Consequently, unverified classifications may significantly influence building vulnerability calculations’ accuracy. The classification of buildings by their age of construction and the exact construction materials and maintenance levels is nearly impossible. However, during the overlaying of layers, we attempted to “smooth” specific building scores to generalize the outcomes and mitigate the impact of incorrect classifications on the final index. It is important to note that we thoroughly examined the results of all layers, including vulnerability, hazard, and exposure.
Regarding soil data, the fault dataset employed in this study was created by digitizing active fault maps at a 1/250,000 scale. This approach may result in inaccuracies in the actual fault locations and the placement of avoidance zones around them. Therefore, the fault buffer zones presented in this study serve as a preliminary example and should be refined through detailed field investigations of faults, secondary fractures, and scattering zones to provide a more realistic representation. Similarly, the preparation of data for Quaternary alluvial units and filled areas relied on partial analysis of remote sensing data, complemented by field and well data. A thorough examination of undifferentiated Quaternary units is recommended for more lithologically sensitive microzonation studies. Additionally, groundwater levels were interpolated exclusively for alluvial units based on shallow observation wells within local study areas. Expanding this dataset by increasing the number of wells and incorporating additional observation and measurement data is advisable to improve data accuracy.
5. Conclusions
In a world where many regions are acutely aware of their susceptibility to seismic events, the events of 6 February 2023, near Kahramanmaras in south-central Türkiye serve as a stark reminder of the profound vulnerability of cities to this natural phenomenon. These events have underscored a harsh reality—that, by and large, our urban centers remain ill-prepared for the formidable tremors that nature may unleash upon them. While the causes of such vulnerability are manifold, at their core, they stem from a two-fold challenge: (i) the inadequacy of meticulous settlement planning, particularly in terms of location, and (ii) the failure to implement advanced construction techniques that ensure structural resilience.
Regrettably, as has been extensively explored by numerous research endeavors, conventional urban planning practices in Türkiye have struggled to incorporate vulnerability analyses into the expansion of settlements effectively. This deficiency extends to the comprehensive integration of geological characteristics into the assessment of building sensitivity, ultimately leaving cities exposed to seismic perils.
Against this backdrop of pressing concerns, we wanted to create the first composite earthquake risk index for Izmir. This map was achieved by harnessing the power of limited digital resources concerning building data and ingeniously fusing this information with the invaluable insights gleaned from remote-sensed acquisitions courtesy of the Copernicus Sentinel program. Through a geomatic stepwise process, we integrated building vulnerability with the ominous projection of seismic hazards.
Our methodology was fortified by the application of geological maps, enabling us to map the localized distribution of potential seismic wave accelerations and the discerning identification of regions susceptible to soil liquefaction. Through this comprehensive approach, we designed a composite earthquake risk index and situated Izmir on the precipice of possessing its inaugural and all-encompassing earthquake risk assessment. We did so, bearing considerable implications for the potential damage the city may confront in the event of a seismic event. By deploying this research, we aim to place this wealth of knowledge at the disposal of policymakers, empowering them to make well-informed decisions that prioritize the safety and well-being of Izmir’s inhabitants. The creation of this composite earthquake risk index marks a significant milestone in the city’s journey towards enhanced resilience and disaster preparedness, positioning science as a potent instrument for safeguarding the lives and livelihoods of its citizens.


