Article

Implementing BIM and Lean Construction Methods for the Improved Performance of a Construction Project at the Disassembly and Reuse Stage: A Case Study in Dezhou, China

1
School of Architecture, Southeast University, Nanjing 210096, China
2
Architects & Engineers Co., Ltd. of Southeast University, Nanjing 210096, China
*
Author to whom correspondence should be addressed.
Sustainability 2024, 16(2), 656; https://doi.org/10.3390/su16020656
Submission received: 13 November 2023 / Revised: 22 December 2023 / Accepted: 30 December 2023 / Published: 11 January 2024

Abstract

:
The construction industry is adopting a collaborative paradigm by combining Lean construction (LC) principles and BIM capabilities. Existing studies lack sufficient case studies and performance evaluations, especially for the disassembly and reconstruction stage, creating a gap in the practical application of BIM and Lean construction (BIM-LC) in China. To bridge this gap, this study quantitatively assessed the BIM-LC methodology in a relocation project in Dezhou, China. The project employed BIM-LC practices such as the Last-Planner System (LPS), Just-In-Time (JIT), Kanban, Value-Stream Mapping (VSM), and Continuous Improvement to enhance construction efficiency and minimize waste. Two main areas of the relocation process were investigated: (i) the identification of common barriers and on-site solutions to the implementation of BIM-LC; (ii) evaluation of the construction efficiency, construction and demolition waste (CDW), and carbon-emission performance. The results showed that the BIM-LC strategy improved labor efficiency and productivity by 3.4% and 12.9%, shortened the construction period by 11 days, reduced construction costs by 8.07% (i.e., USD 9093.8), and reduced transportation costs by 12.5% (i.e., USD 1875). The CDW generation rate ranged from 1–5%, which is comparable to the rates observed in residential construction across various countries. The total weight was 1903.8 kg (10.4 kg/m2). Moreover, the carbon emission during the relocation process was 15,288.4 kgCO2e, with a carbon intensity of 83.5 kg/m2. This study extends the knowledge systems on the application of the BIM-LC method in relocation projects and supports data-driven decision making. It also plays a crucial role in fostering new markets for recycled components, contributing to the realization of a sustainable built environment.

1. Introduction

As one of the industries reliant on a heavy workforce, the AEC industry is faced with the problems of low productivity and work efficiency [1]. Resource wastage and negative environmental impacts are also widespread public concerns [2]. This means that how to stay competitive and profitable by utilizing their resources, including personnel, equipment, materials, and technology, as efficiently as possible is an urgent issue to be addressed, which is also in line with Lean thinking. With the deepening awareness of low-carbon development and ecological conservation, advanced methods and practices such as BIM project management [3] and Lean construction management (LCM) [4] have attracted the interest of an increasing number of scholars and government departments.
As a result, new industry paradigms have arisen that promote collaboration through Lean construction principles and BIM capabilities. The existing literature on BIM-LC focuses on providing knowledge about current approaches and the drivers for and obstacles to their implementation. Many studies have been conducted to discuss the synergy between these two principles and their theoretical and practical applications [5,6]. The main countries with Lean and BIM synergy research are Israel, Finland, and the U.S. [7]. While China’s construction companies have started exploring LCM methods in new construction projects, there is a lack of practical research adapted to the domestic market, and local construction companies still tend to use traditional construction methods [8]. Therefore, the implementation of integrated BIM and LCM management methods in Chinese construction projects is still at the initial stage. There is also still a gap in performance evaluation research on the BIM-LC approach implemented in construction projects during the whole lifecycle stage, which is one of the barriers to the promotion of Lean BIM in practical applications.
This means that, up to now, there has been no study that has applied the BIM-LC method to disassembly and reuse projects or quantitatively analyzed its implementation effectiveness. This study represents the first known application of the BIM-LC method in the context of disassembly and reuse projects, offering a groundbreaking quantitative analysis of its implementation effectiveness. By conducting a detailed case study in China that encompasses three critical phases of the building lifecycle—disassembly, transportation, and reconstruction—this research not only fills a significant gap in the existing literature but also provides a comprehensive evaluation of the BIM-LC method’s impact on construction efficiency, carbon emissions, and waste levels.
The results reveal notable quantitative benefits of implementing the BIM-LC methodology in relocation projects, specifically in terms of enhanced construction efficiency, reduced resource wastage, and minimized environmental pollution. Beyond these measurable outcomes, the study significantly enriches the knowledge base for Chinese construction firms, offering practical guidelines for the effective adoption of BIM-LC methods in both new and refurbishment projects. Therefore, this study not only contributes to academic discourse but also promotes sustainable practices within the built environment. Additionally, it offers a potential pathway toward achieving carbon neutrality through the recyclability of buildings, aligning with global sustainability goals.

2. Literature Review

The lean production concept, as it is known today, was significantly developed and refined in the 1950s by Toyota, primarily under the leadership of Taiichi Ohno, who was inspired by earlier manufacturing practices, including those of Ford Motor Company. This evolution of lean principles led to the creation of the Toyota Production System (TPS), which became a foundational approach in modern manufacturing and later influenced lean construction practices emerging in the 1980s [9,10]. Furthermore, the term “lean production” was first proposed by Womack, Jones, and Roos in their book The Machine That Changed the World, which was published in 1995. In this context, “Lean”, as an emerging concept, offers a production philosophy that encourages the efficient use of resources in most industries. LC can be defined as the sustaining process of reducing and eliminating waste, carrying out more value-added activities, and pursuing perfection based on learning and analysis of the Percent Plan Completion (PPC) metric in the execution of a construction project [11]. The term is derived from the Lean Construction Association (LCI) in 1993. Inspired by the Lean production theory, LC is a new theory applied in the field of building management and practice.
Lean construction (LC) commonly employs tools such as the Last-Planner System (LPS), Kanban, Just-In-Time (JIT) production, Value-Stream Mapping (VSM), Total Quality Management (TQM), and Waste (Muda), among others, which are aimed at improving efficiency and reducing waste in construction projects by strengthening collaboration among relevant stakeholders [12,13,14,15]. These tools are chosen for the current study due to their established effectiveness in lean construction, particularly in improving construction schedule planning and control. The term “LPS” as a key tool of LC was first proposed at the inaugural conference of the International Lean Construction Group in Espoo, Finland, held in 1993 and published in the proceedings [16]. The basic principles of LPS are (i) to improve the workflow and (ii) to improve the reliability and predictability of the project. VSM is another pivotal LC tool for visualizing and optimizing construction processes. It involves creating current state maps to identify inefficiencies and waste in construction processes. These insights guide the development of future state maps, outlining improved processes. VSM is complemented by lean principles such as pull planning and continuous improvement. Muda, a term originating from Japanese Lean-manufacturing practices, refers to any activity that consumes resources without adding value in the eyes of the customer [17]. It is typically categorized into seven types, including overproduction, waiting, transporting, inappropriate processing, unnecessary inventory, unnecessary motion, and defects. As one of the key tools for identifying and reducing waste, it is often used in conjunction with other lean principles and methods such as VSM and TQM.
LC has been widely implemented in the construction industry all over the world, such as in Malaysia [11], China [8], the U.S. [18], the U.K. [19], and Saudi Arabia [20]. However, the application of this new construction management mode is full of challenges and obstacles. One of the reasons for this is that many of the studies have only qualitatively demonstrated that the implementation of LC methods has had a positive impact on construction efficiency. During project execution, LC principles are used to minimize the impact of risk factors on time [21]. Heravi et al. [22] found that Lean production interventions allowed contractors to improve efficiency during construction and, as a result, reduce carbon emissions. The JIT technology, a key tool in LC, is considered to have great potential for wider application in improving the movement of components from the fabrication plant to the construction site and within the construction site. Liulin et al. [23] proposed a JIT strategy for prefabricated-construction supply-chain management based on the time for transportation and on-site assembly. The results showed that this shortens the production time and reduces the inventory of raw materials, incomplete products, and finished goods, making it more stable for reducing inventory costs. These results are not effectively guided sufficiently for participants to make decisions scientifically.
Since ancillary information systems supported by BIM technology assist directly or indirectly in achieving lean goals, much research has been conducted on integrated BIM-LC methods, which is the current trend in construction projects [6,24]. BIM is a digital representation of the physical and functional characteristics of a facility. It serves as a shared knowledge resource for information about a facility, forming a reliable basis for decisions during its lifecycle from inception onward. BIM technology can provide efficient discussion based on 3D visualization, which would be difficult to do based on 2D drawings, and this has proven to be a great asset in facilitating LC practices. The combination of QR codes with BIM technology in prefabricated construction and engineering management offers a promising approach for boosting efficiency, enhancing communication, and ensuring safety and quality at construction sites [25]. The harmonious integration of digital and physical tracking tools streamlines the construction process, making it more precise and efficient, thus providing technical support for the implementation of lean construction methods. Many other examples can be provided on the synergistic relationship between BIM and lean construction [26,27]. In addition to theoretical studies on the interaction of lean principles and BIM, several practice studies on the integration of BIM and LC were also conducted. The book Building Lean, Building BIM: Improving Construction the Tidhar Way is a comprehensive guide that advocates the integration of Lean construction and building information modeling (BIM) as a strategy for construction companies to outperform their competition [28]. It details the journey of Tidhar Construction, a small-to-medium-sized construction company, and its implementation of Lean construction and BIM, highlighting the successes and failures along the way. Arayici et al. [29] indicate that the development of a Lean-design practice through BIM adoption requires taking into account not only the technical application but also the sociocultural environment. In a case study, Song and Liang [30] suggest that the implementation of Lean construction and 3D visualization eliminates waste at the operational level, improves contractor coordination, and also has a positive impact on environmental sustainability. Shuquanet et al. [31] found that the levels of Lean implementation vary depending on the company in China and that the main influencing factors are the knowledge of LC, the organizational structure and culture, as well as market feedback. While the combination of BIM-LC makes it possible to quantify the project construction performance and environmental impacts, most findings are qualitative descriptions, and there is a lack of performance evaluations spanning the full project lifecycle.
As shown in Table 1, research studies on BIM-LC practices have focused on a particular part of the whole building lifecycle, such as design, production, transportation, and construction, to investigate the impact of implementing LCM methods on the project execution. While the academic literature and lines of research on BIM-LC practices have explored various stages of construction, no study has applied the BIM-LC method to disassembly and reuse projects and quantitatively analyzed its implementation effectiveness. In addition, research on the environmental effects, such as carbon emission, of applying BIM-LC techniques in such projects is also lacking. Therefore, practical research is necessary to address these current issues in the AEC industry. This study aims to bridge this gap by integrating BIM-LC methods into a C-House Relocation Process (CRP) and quantitatively evaluating their impact on construction performance.
The contribution of this study is (i) the identification of common barriers and on-site solutions to the implementation of BIM-LC in disassembly and reconstruction projects, and (ii) the quantitative evaluation of the performance of the BIM-LC method. These will provide a body of knowledge and practical guidance for Chinese construction companies, and quantitative performance evaluation will help to implement BIM-LC in new construction projects and the refurbishment of existing buildings, which facilitates a sustainable built environment. The paper is divided into five main parts. First, the paper outlines the goals and strategies for the synergistic implementation of Lean construction and BIM. Second, the BIM-LC method and data collection are presented. Next, the case information of the CPR is presented. Then, the performance of the BIM-LC method is evaluated by CRP process data collection and analysis. Finally, the main findings of the study, limitations, and the need for future research are presented. More detailed information on the implementation process in the case study is provided in the Appendix A, Appendix B, Appendix C, Appendix D, Appendix E.

3. Research Methodology

The research design and methodological development of this study was carried out in five phases: (1) Research goal; (2) BIM-LC methods; (3) Case study; (4) Data collection and analysis; (5) Discussion and recommendations (Figure 1). The workflow for implementing the BIM-LC method in this project includes the LPS, Kanban, JIT, VSM, and BIM technology, as shown in Figure 2. The authors, as part of the LCM Team, played key roles in the relocation project. This provided a unique opportunity to observe and collect first-hand data. Data collection was carried out through a number of accepted research methods, including literature review, on-site records, and interviews with the client, construction experts, and practitioners.

3.1. Application of the Main LC Methods

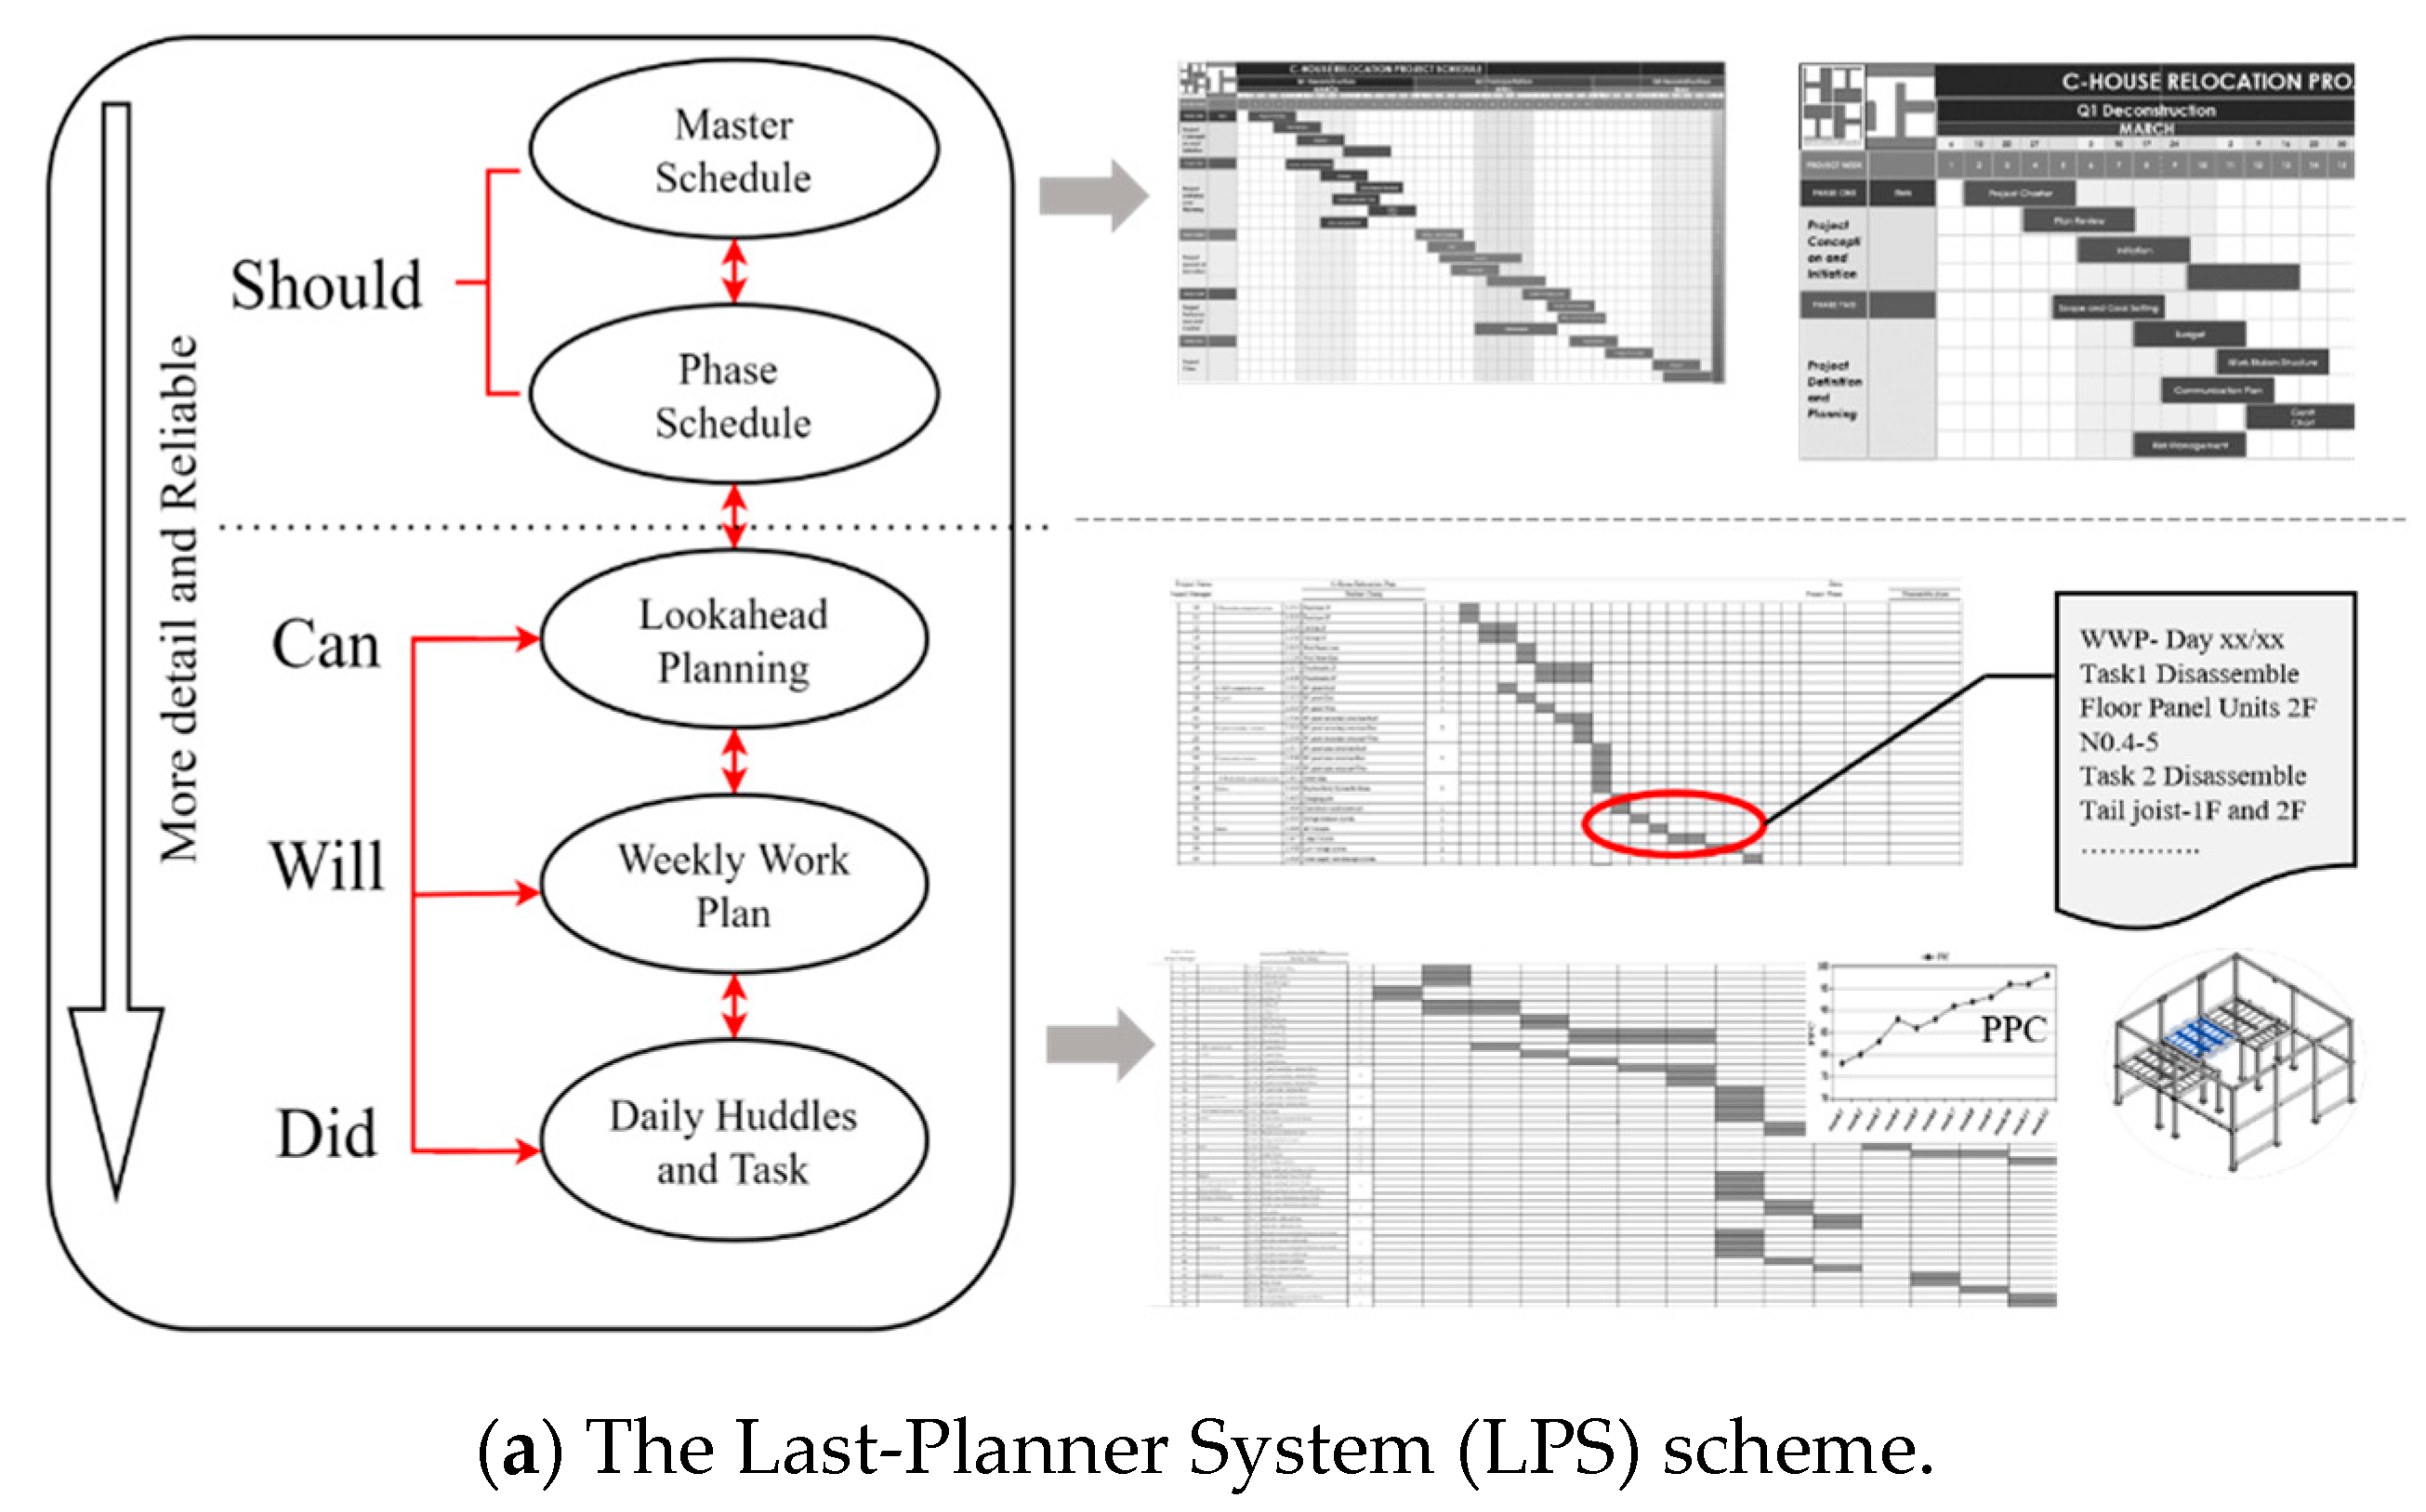
3.1.1. LPS and Kanban

The LPS encompasses a comprehensive project master plan, a detailed phase schedule, a look-ahead plan with constraint analysis for workflow control, and a weekly work plan (WWP). These correspond to the tasks that should be completed within the specified time, the tasks that can be completed, and the tasks that will be completed based on current resources. To measure team commitment reliability and to assess WWP completion, the Percent Plan Complete (PPC) metric is employed. The WWP represents the most detailed level within the system and directs production processes in a specific sequence, accounting for all constraints. At the end of each week, a review of the work completed measures the planned system’s reliability. Then, the causes of failure are surveyed and action taken using Kaizen measures in the subsequent process (Figure 2a). The PPC can be calculated by Equation (1) [34]:
P P C = N C o m p l e t e d N W e e k l y
where N C o m p l e t e d is the number of activities that have been completed in the weekly work plan, and N W e e k l y is the total number of activities in the weekly work plan.
In this case, a Kanban board on the construction site detailed the deconstruction schedule, aiding coordination among trades and enhancing project workflow. It also facilitated discussion and learning during daily huddles to analyze why the plan failed and to adjust.

3.1.2. JIT Principles

During the component transportation stage, JIT principles ensure timely component delivery, optimized batch sizes, and sequence adherence. In the narrow, space-constrained case-study site, careful planning was essential for batch assembly and transportation. The construction manager, following JIT principles, maintained daily construction records and plans for the next day, including labor, materials, and equipment allocation.

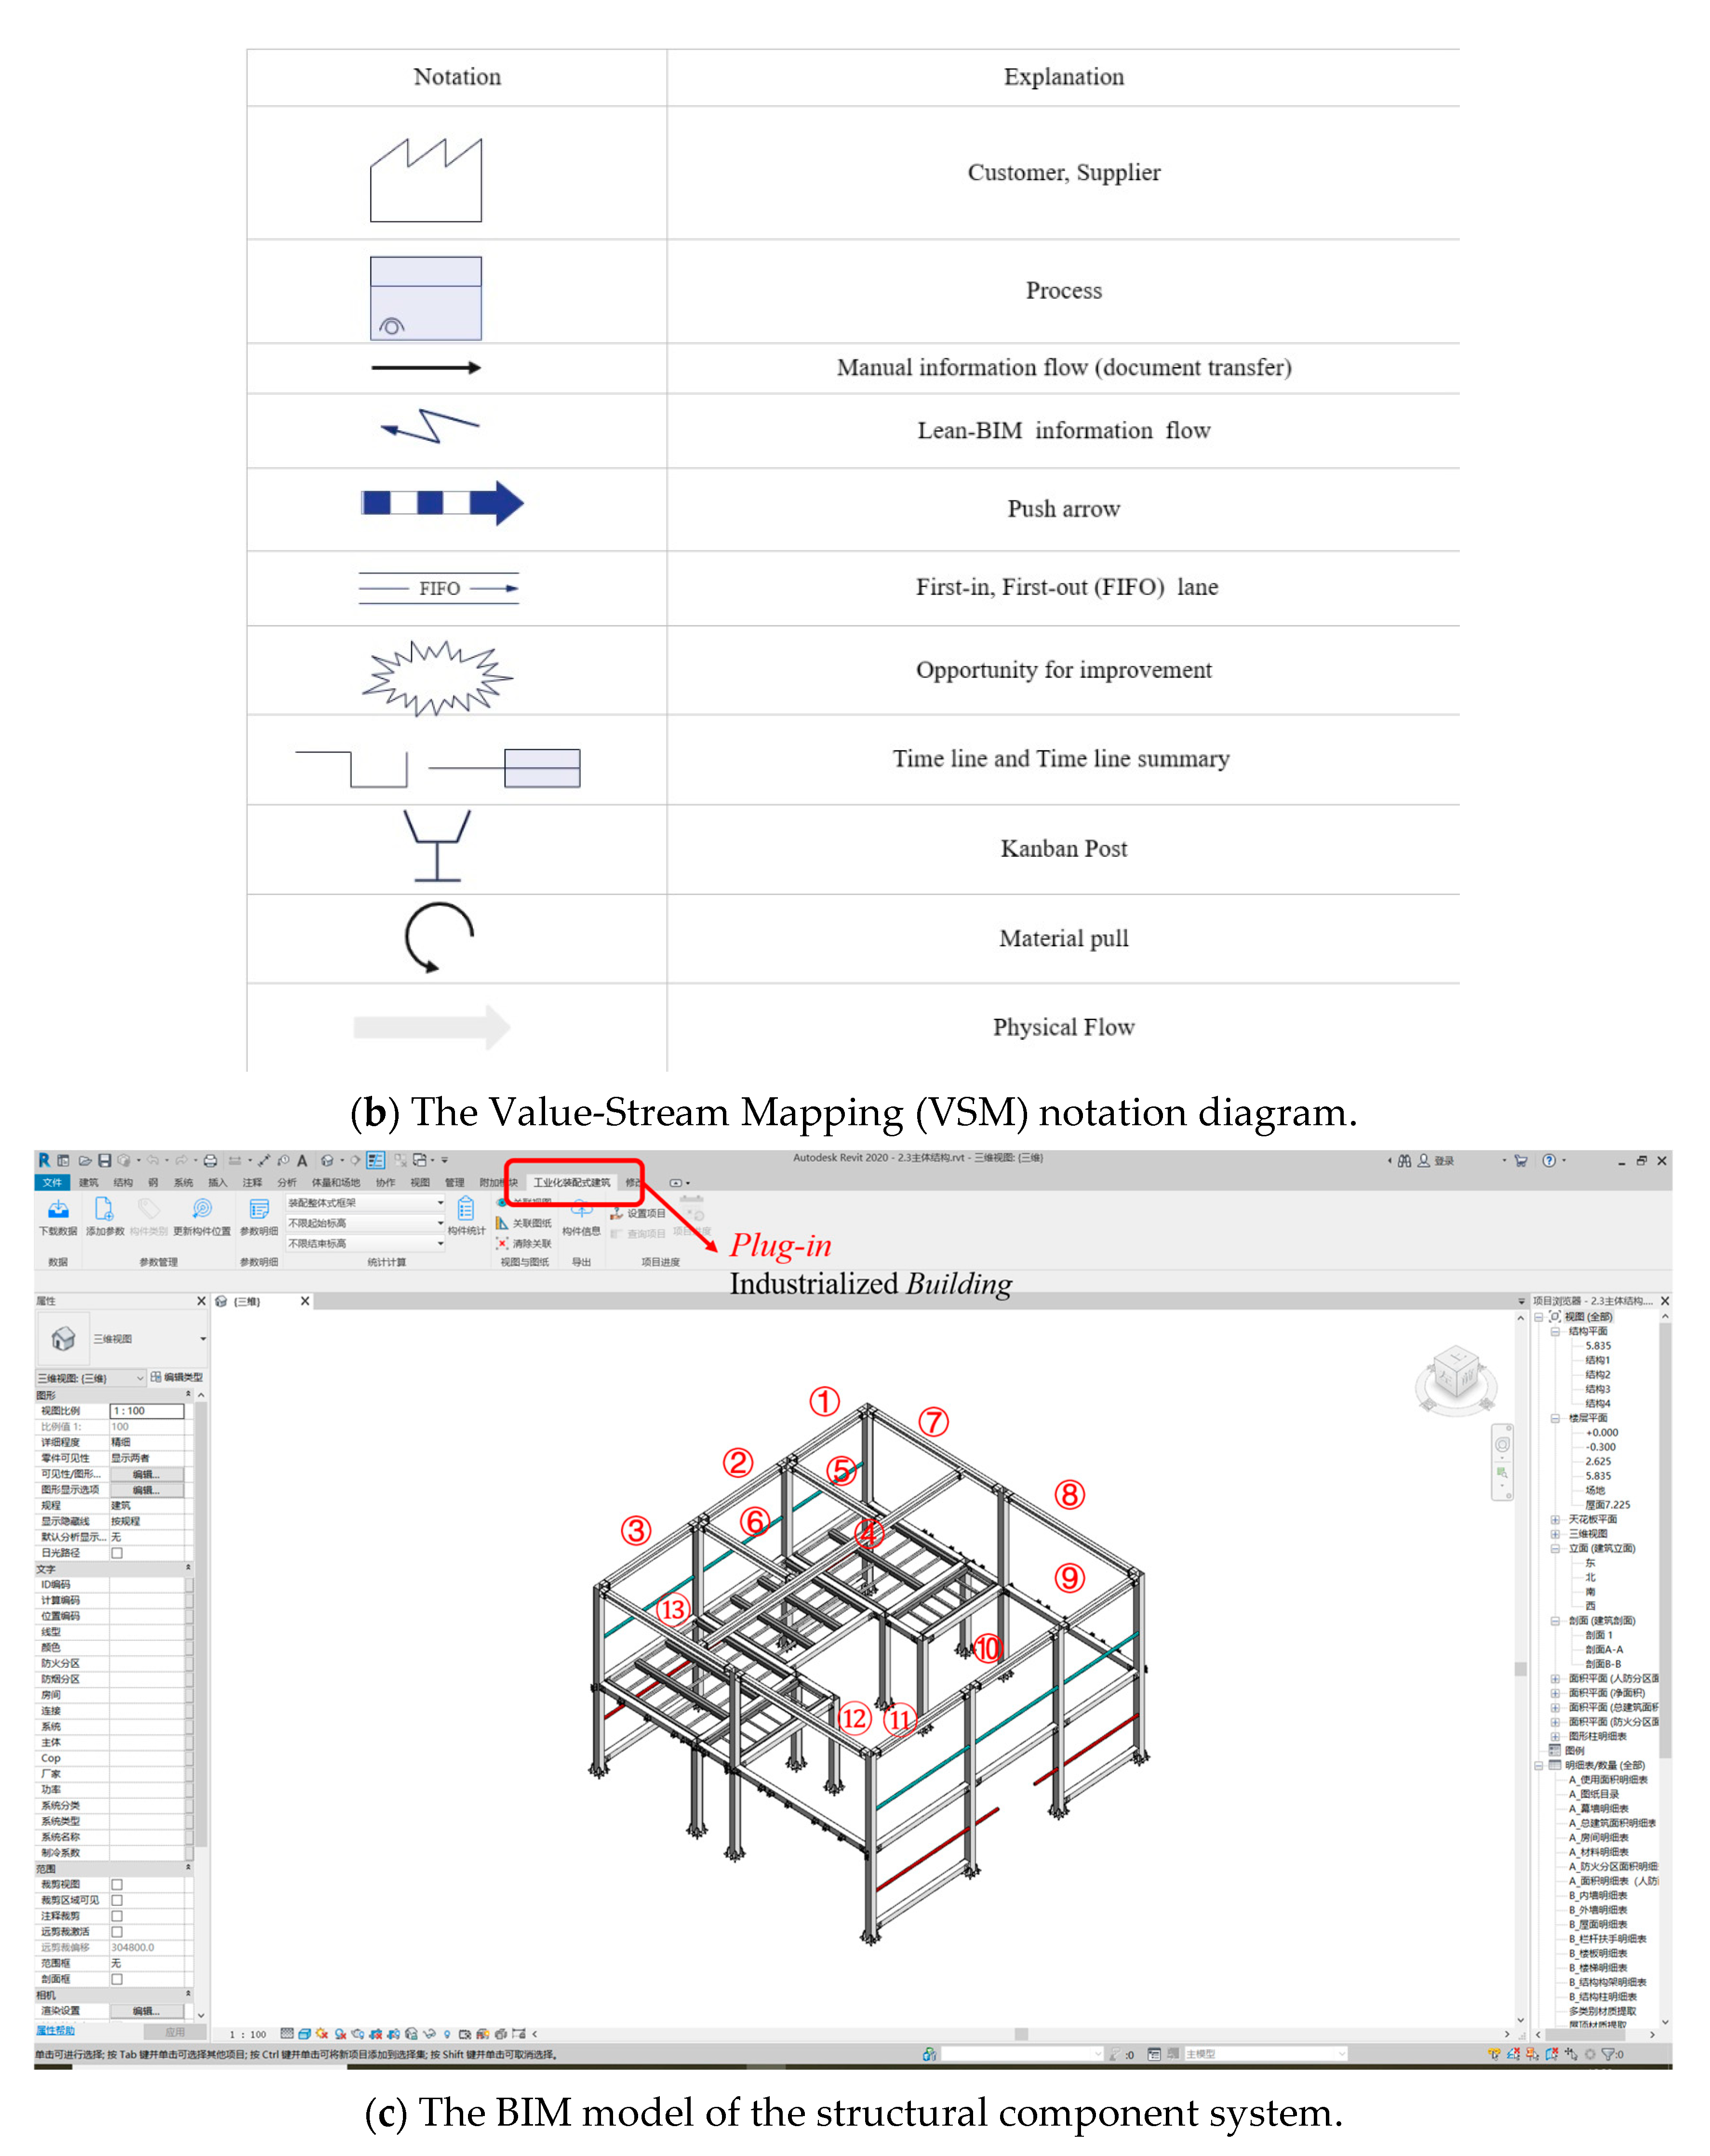
3.1.3. Value-Stream Mapping (VSM)

In this case study, the LCM team gathered information through field records and interviews with the construction team to create a future-state map, following a five-step process: (1) Data collection and value-stream selection; (2) Current-state mapping; (3) Analysis of existing practices and the development of lean metrics; (4) Formulation of continuous improvement plans (Kaizen) and future-state mapping; (5) Implementation of Kaizen plans and results evaluation. The Value-Stream Mapping (VSM) technique was applied to the entire demolition, transportation, and reconstruction process. Due to space limitations and the method’s similarity in the other stages, this study only demonstrates the disassembly process to assess the efficiency improvement. The VSM notation diagram can be seen in Figure 2b, and the VSM key elements are presented in Appendix B.

3.2. Application of the BIM Methodology

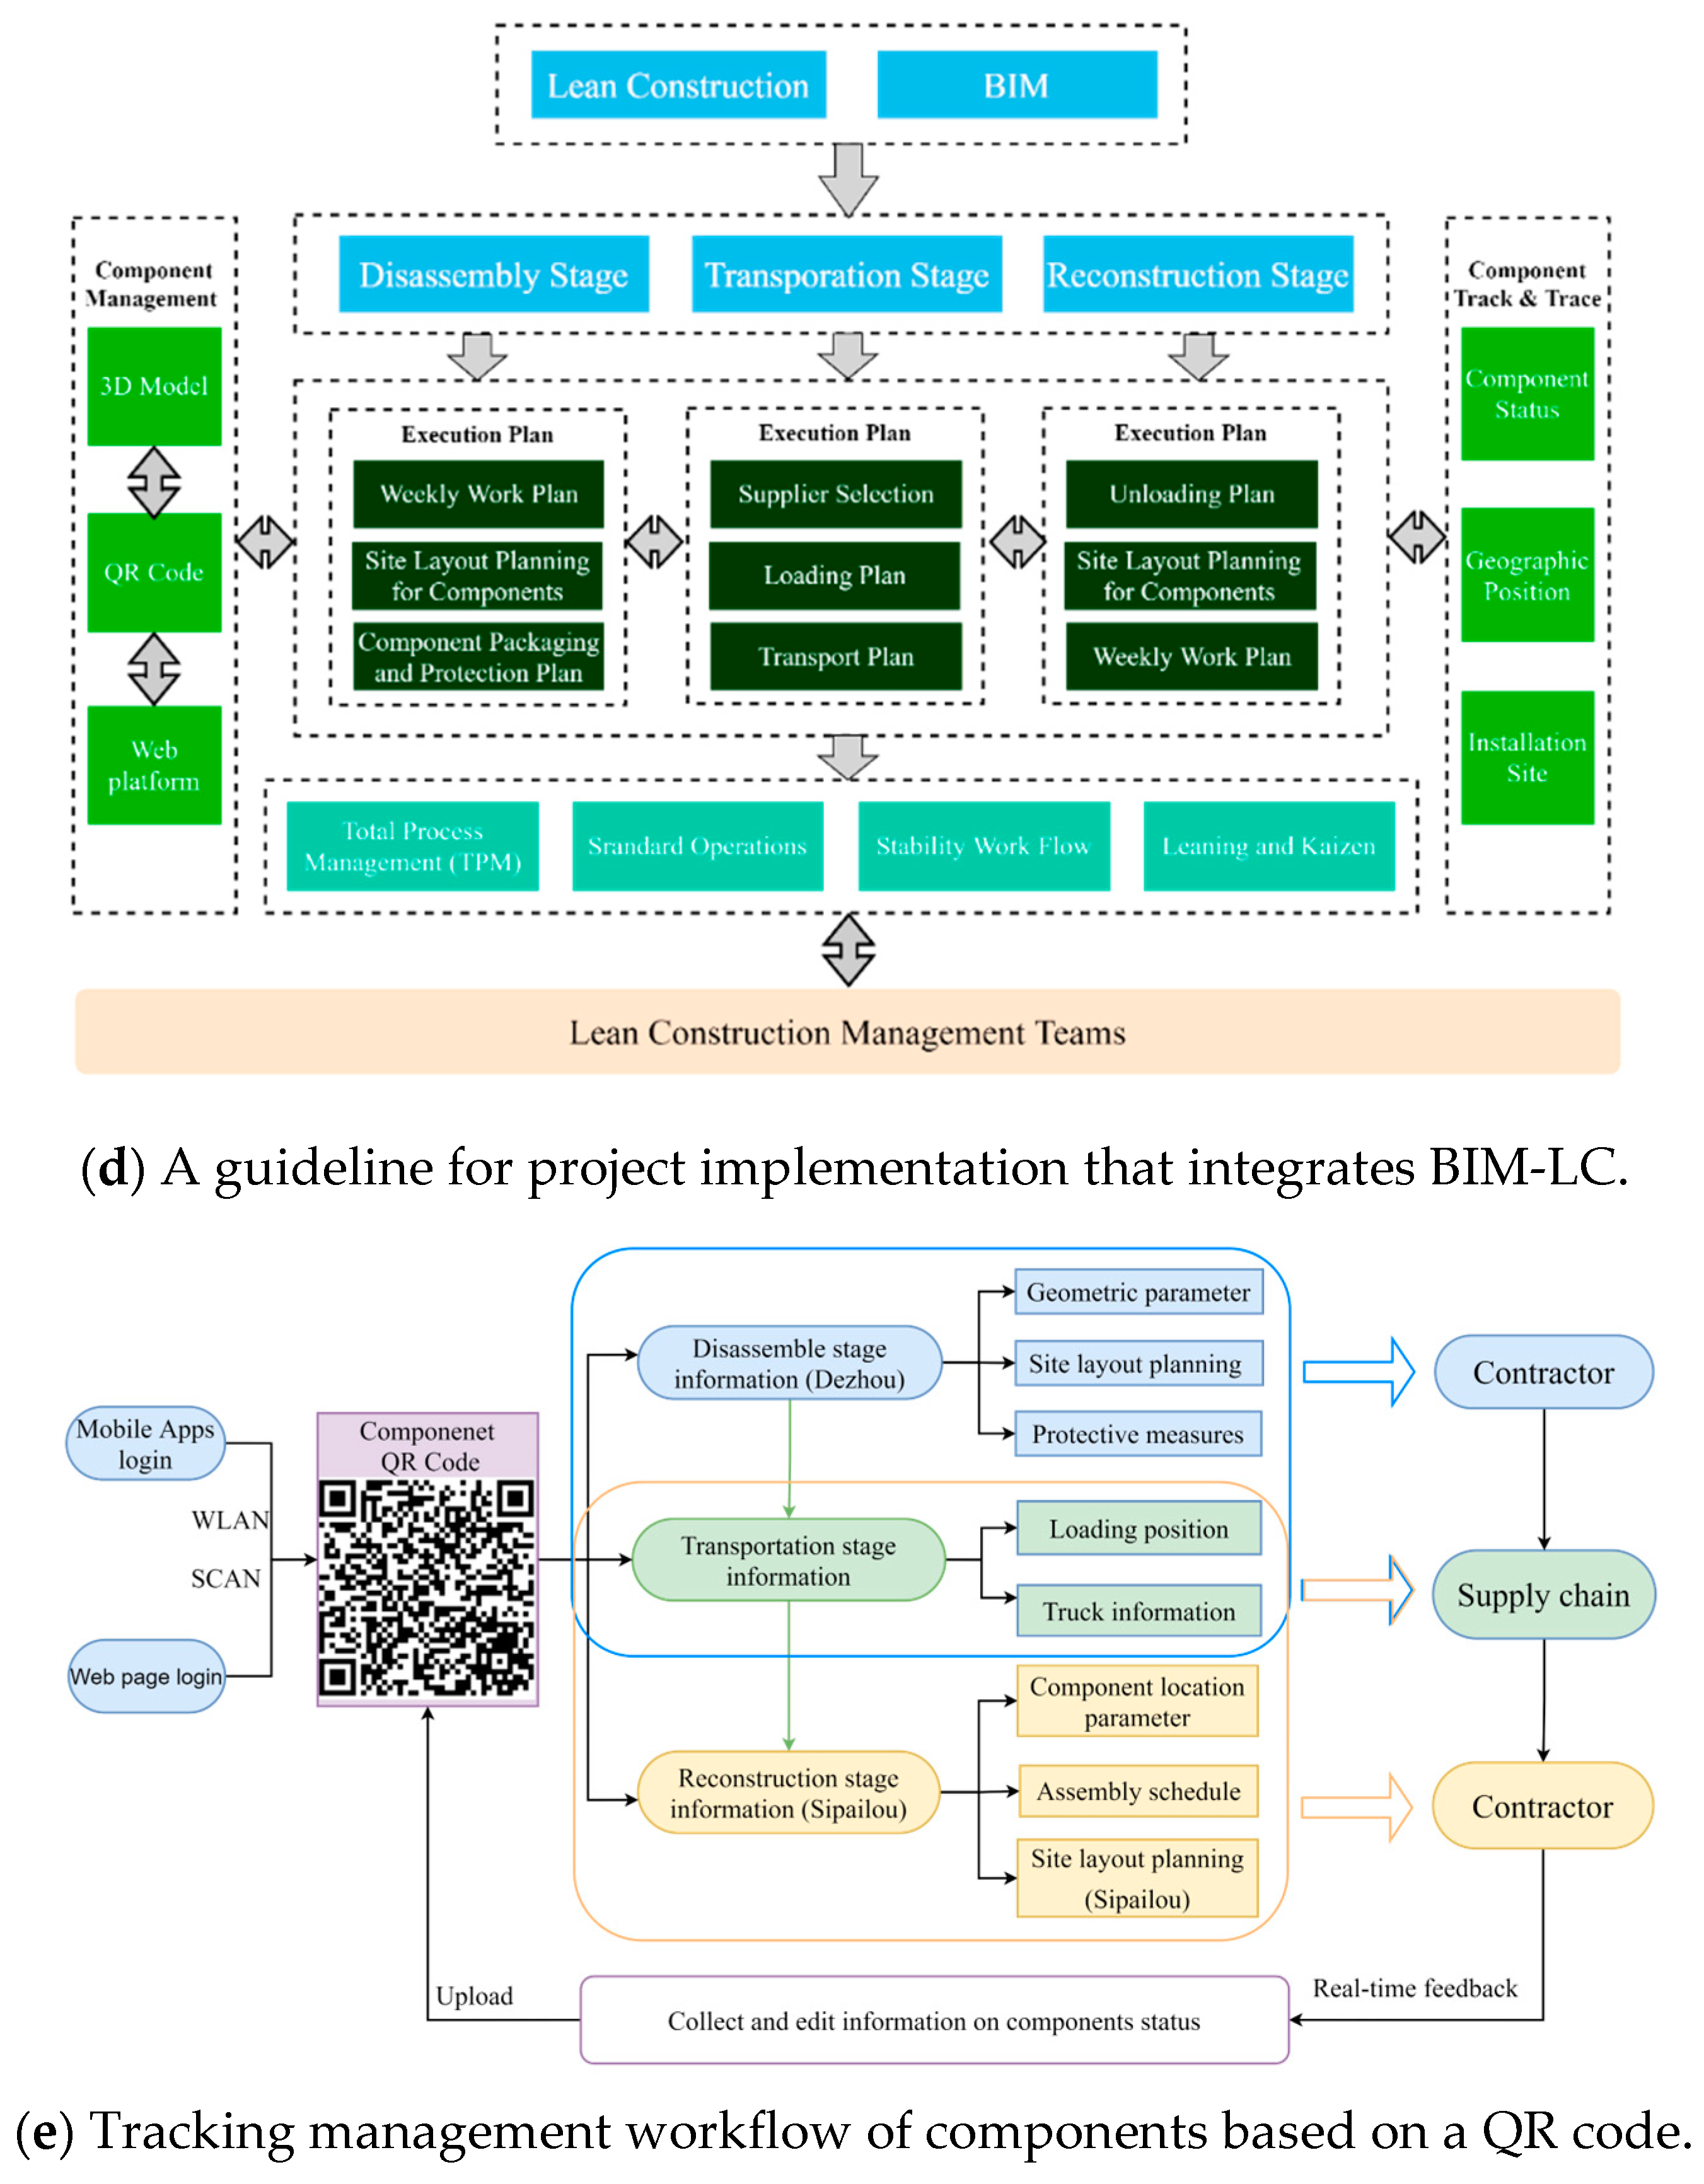
3.2.1. BIM-LC Implementation Method

As shown in Figure 2c, the LCM team employs BIM for pre-construction meetings, detecting potential on-site issues, and visualizing 3D models to improve transparency and to understand the disassembly sequences, component yard plans, and transportation schemes, enhancing the implementation of LPS. The BIM models help track daily activities and foster collaboration between off-site and on-site teams. Figure 2d shows the proposed BIM-LC implementation method, which is in accordance with the international standard ISO 19650, with particular emphasis on “About Information Requirements—Project Information Requirements (PIR)” [35,36]. The protocols and methods employed to specify and communicate the information requirements for the building or infrastructure projects are included. The LCM team utilizes this method to plan demolition sequences, yard layouts, component protection, crane positions, and loading plans. Three-dimensional (3D) visualization increases transparency, ensuring the timely allocation of resources, including materials, labor, and equipment, to the appropriate workstations.

3.2.2. QR-Code Tracking Technology and TQM

This case study utilizes QR codes to record component statuses, which are automatically generated using the Industrialized Building plug-in based on Revit, which was developed and applied by the research team. This technology enables the dynamic tracking and TQM of components across multiple scenarios, including the disassembly stage, transportation stage, and reconstruction stage. Users create an information model in Revit and export and upload it to a platform server, where a unique QR code is generated by the web server, as illustrated in Figure 2e. The QR code includes essential parameters for disassembly and reassembly procedures, encompassing physical attributes like dimensions (length, width, height), mass, geographic location, and spatial volume occupation of the components. Additionally, it incorporates process-related parameters, such as workforce, mechanical equipment, and auxiliary materials required at different stages of the relocation process. This data is vital for choosing the crane type, determining machine positions, selecting component lifting points, and controlling the lifting posture.

3.3. Carbon-Emission Calculation Model for the Relocation Process

A process-based inventory analysis model is used to calculate carbon emissions during relocation, following the guidelines outlined in the Standard for building carbon emission calculation (GB/T 51366-2019, China) [37]. Carbon-emission factors for building materials are supplemented by the China Product Carbon Footprint Factor Database (CPCFFD). According to GB/T 51366-2019, the carbon emission factor of electricity in this study is equal to 0.7035 kgCO2e/kWh. The carbon-emission factor of the worker is a constant value and is equal to 0.73kgCO2e/man-day. To be consistent with China’s situation, the average net calorific value follows national guidelines (National Development and Reform Commission, 2020), and the oxidation rate, default emissions, carbon content, a fuel-coefficient factors adhere to IPCC (2006) recommendations.
L C C O 2 = C dis + C t r a + C r e c o n
where LCCO2 is the carbon emission of buildings during the disassembly and reuse stage (kgCO2e); C dis is the carbon emission in the raw-material extraction stage (kgCO2e); C t r a is the carbon emission in the transportation stage (kgCO2e); C r e c o n is the carbon emission in the reconstruction stage (kgCO2e);
C d i s / r e c o n = i = 1 n ( n i f i + T i R i + E i + m i F i )
where n i is the number of labor days required for the type i component (kgCO2e/man-day); f i is the average carbon-emission factor of labor (kgCO2e/man-day); T i is the number of hours of machinery and equipment required for the type i component (machine-team); R i is the carbon-emission energy factor per unit hour of machinery and equipment required for the type i component (kgCO2e/machine-team); E i is the carbon emission from the electricity consumption of small machinery required for the type i component (kgCO2e/kWh); m i is the consumption of auxiliary materials and consumables required for the type i component (t); and F i is the carbon emission factor of auxiliary materials and consumables required for the type i component (kgCO2e/t);
C t r a = i n ( T i M i L i )
where T i is the consumption of the type i main building material (t or m3); M i is the average transportation distance of type i building material (km); L i is the carbon-emission factor per unit weight of transportation distance under the transportation mode of type i material (kgCO2e/(t∙km) or kgCO2e/(m3∙km)).

3.4. Construction Efficiency and Construction Duration Calculation Model

Worker productivity remains stable when the workspace is not crowded. As more workers join the operation, their combined productivity increases. However, when the workforce density reaches a certain level, productivity is affected by interference. The overall output of the team may increase until it reaches an optimal level, after which productivity starts to decline due to workspace congestion.
A model reflecting the impact of labor density on productivity was previously proposed [38]. This theoretical model was tested through interviews with construction engineers in a practical project and successfully applied in reinforcement operations. Productivity reduction follows a “hyperbolic growth” function, and labor efficiency’s optimal value can be determined to enhance the construction schedule accuracy. Under this “hyperbolic” model, the reduction in productivity can be described by the following equation.
P ( ρ ) = { P 0 ( C 1 s ρ l ) ( ρ max ρ ) ( ρ max ρ l ) ( C 1 s ρ ) P 0 , ρ < ρ ρ l , ρ l < ρ ρ max
C 1 = S [ ρ l P 0 ( ρ max ρ 0 ) ( ρ max ρ l ) ] P 0 ( ρ max ρ 0 ) P ( ρ 0 ) ( ρ max ρ l ) , ρ l < ρ 0 ρ max
β = { ( C 1 m l ) ( m max m ) ( m max m l ) ( C 1 m ) 1 , 0 < m m l , m l < m m max
T = β 0 m 0 β m T 0
where P is the construction efficiency; P 0 is the construction efficiency without the influence of the work area; S is the construction area; ρ is the labor density; ρ l is the labor density when the construction efficiency of workers begins to decline; ρ max is the maximum workforce density; m is the number of construction workers; m max is the maximum number of construction workers; m l is the number of workers at the beginning of the decline in construction efficiency; and T is the construction duration. ρ l and ρ max are determined by expert evaluation or production experiments and depend on the type of work. It has been shown from several interviews with project managers that the minimum unit area required for workers to work properly is 2 m2, and that the unit area to work in when the efficiency is affected and begins to decrease is 10 m2. The parameter C 1 is 465.7, m l is 14, and m max is 72.

4. Case Description

4.1. C-House Information

C-House, depicted in Figure 3a, is a low-carbon and energy-plus house initially designed for the 2018 Solar Decathlon China (SDC) in Dezhou, Shandong province. It is a two-story single-family home with a plastic wood ramp and a floor area of 183 m2 that features parking for one electric vehicle. Figure 3b illustrates C-House’s structure, which consists of six major component systems: structural, enclosure, performance, interior decoration, equipment, and environmental systems. These component systems are self-contained and are based on the concept of component-based architecture design. Although the building is smaller in scale, it uniquely encompasses the demolition, transportation, and reconstruction of a structure, presenting three typical scenarios and construction challenges. This is rarely seen in other research cases, making it an ideal initial test scenario.

4.2. C-House Relocation Plan (CRP)

As shown in Figure 3c, the project involved disassembly in Solar Town, Dezhou, and reconstruction at Southeast University’s Sipailou Campus in Nanjing. The disassembly stage focused on breaking down C-House into components, followed by the transfer phase, which transported these component systems from Dezhou to the Sipailou campus. The reconstruction phase refers to the period beginning from when the goods are received to the completion of the reconstruction project. Temporary LCM teams were established in both Dezhou and Sipailou.
Figure 3d shows the personnel allocation of the 28 members in the temporary LCM teams. These teams included representatives from the customer, design institute, site supervision company, and contractor. Notably, the LCM teams played diverse roles within CRP’s organizational structure, providing essential LCM training to all construction site personnel. The contractor promises that all personnel will carry out construction operations following the basic requirements of LCM.

5. Implementation Process of BIM-LC Practices

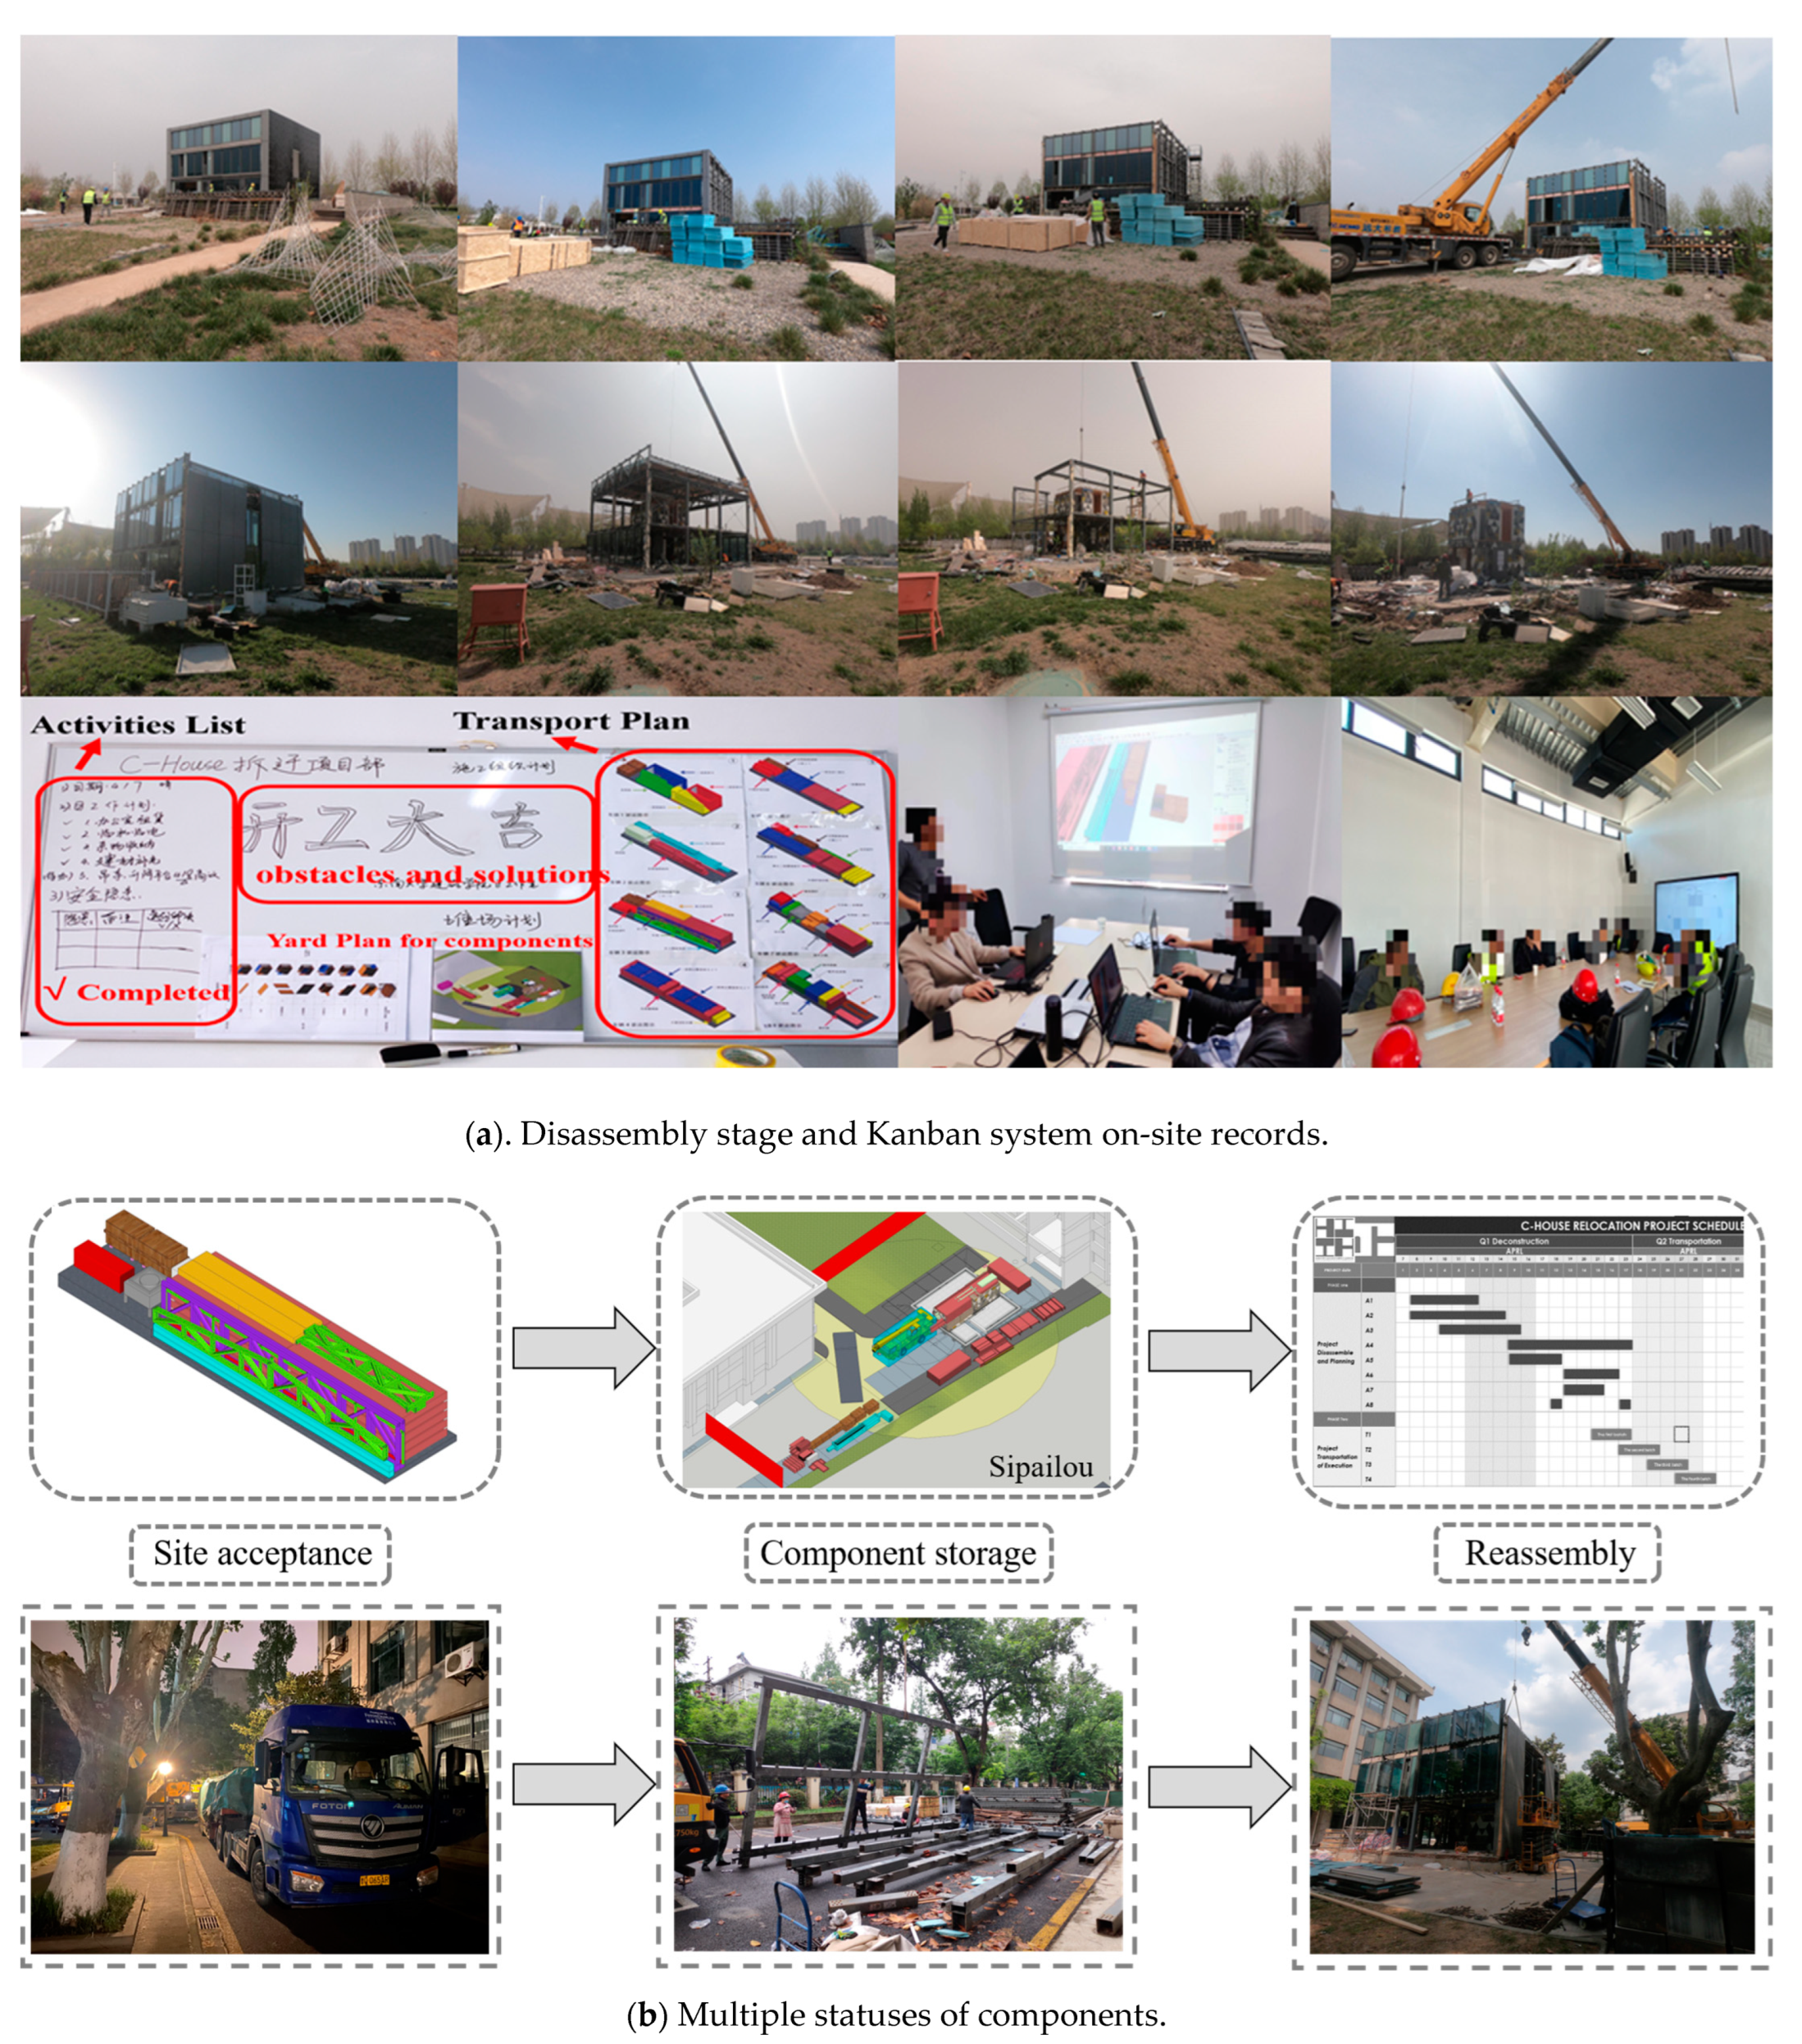
5.1. Disassembly Stage (Solar Town, Dezhou, Shandong Province)

As shown in Figure 4a, the working platform was divided into two zones: southeast and northwest. The Kanban was used as a visualization tool to display detailed daily schedules, construction obstacles, and Kaizen measures. The current state of the VSM identified wasteful conditions in each construction stage, and measures were taken to improve the demolition construction process and achieve an optimal workflow sequence, as shown in Appendix A. The PPC was calculated after each component system disassembly was completed. The huddle meetings were an opportunity to report construction progress to the crews, explain problems encountered, and provide solutions for the upcoming work. The LCM team 1 planned the disassembly based on the reconstruction sequence and determined which components should be reused, rehabilitated, refurbished, recycled, or sent directly to the landfill.

5.2. Component Transportation Stage (Dezhou to Nanjing)

The component transportation served as a critical link between the disassembly and transportation stages, where BIM-LC technology was deployed to create three essential documents guiding transportation management: the departure batch plan, component loading plan, and component transportation protection plan. The loading plan was used as a guiding document for component lifting, loading, and site acceptance. It means that each truck driver was issued a component delivery document for handing over the cargo, which includes a component listing and a truck-loading diagram with the number. The listing contains information on the component category, quantity, and dimension, and an illustration. The loading diagram shows the location of the components in the truck.
Upon arrival at Sipailou, components were stored based on a site layout plan. This plan considered site and component constraints to optimize storage. Components needed for early installation were stored closer to the base for easier access during lifting.

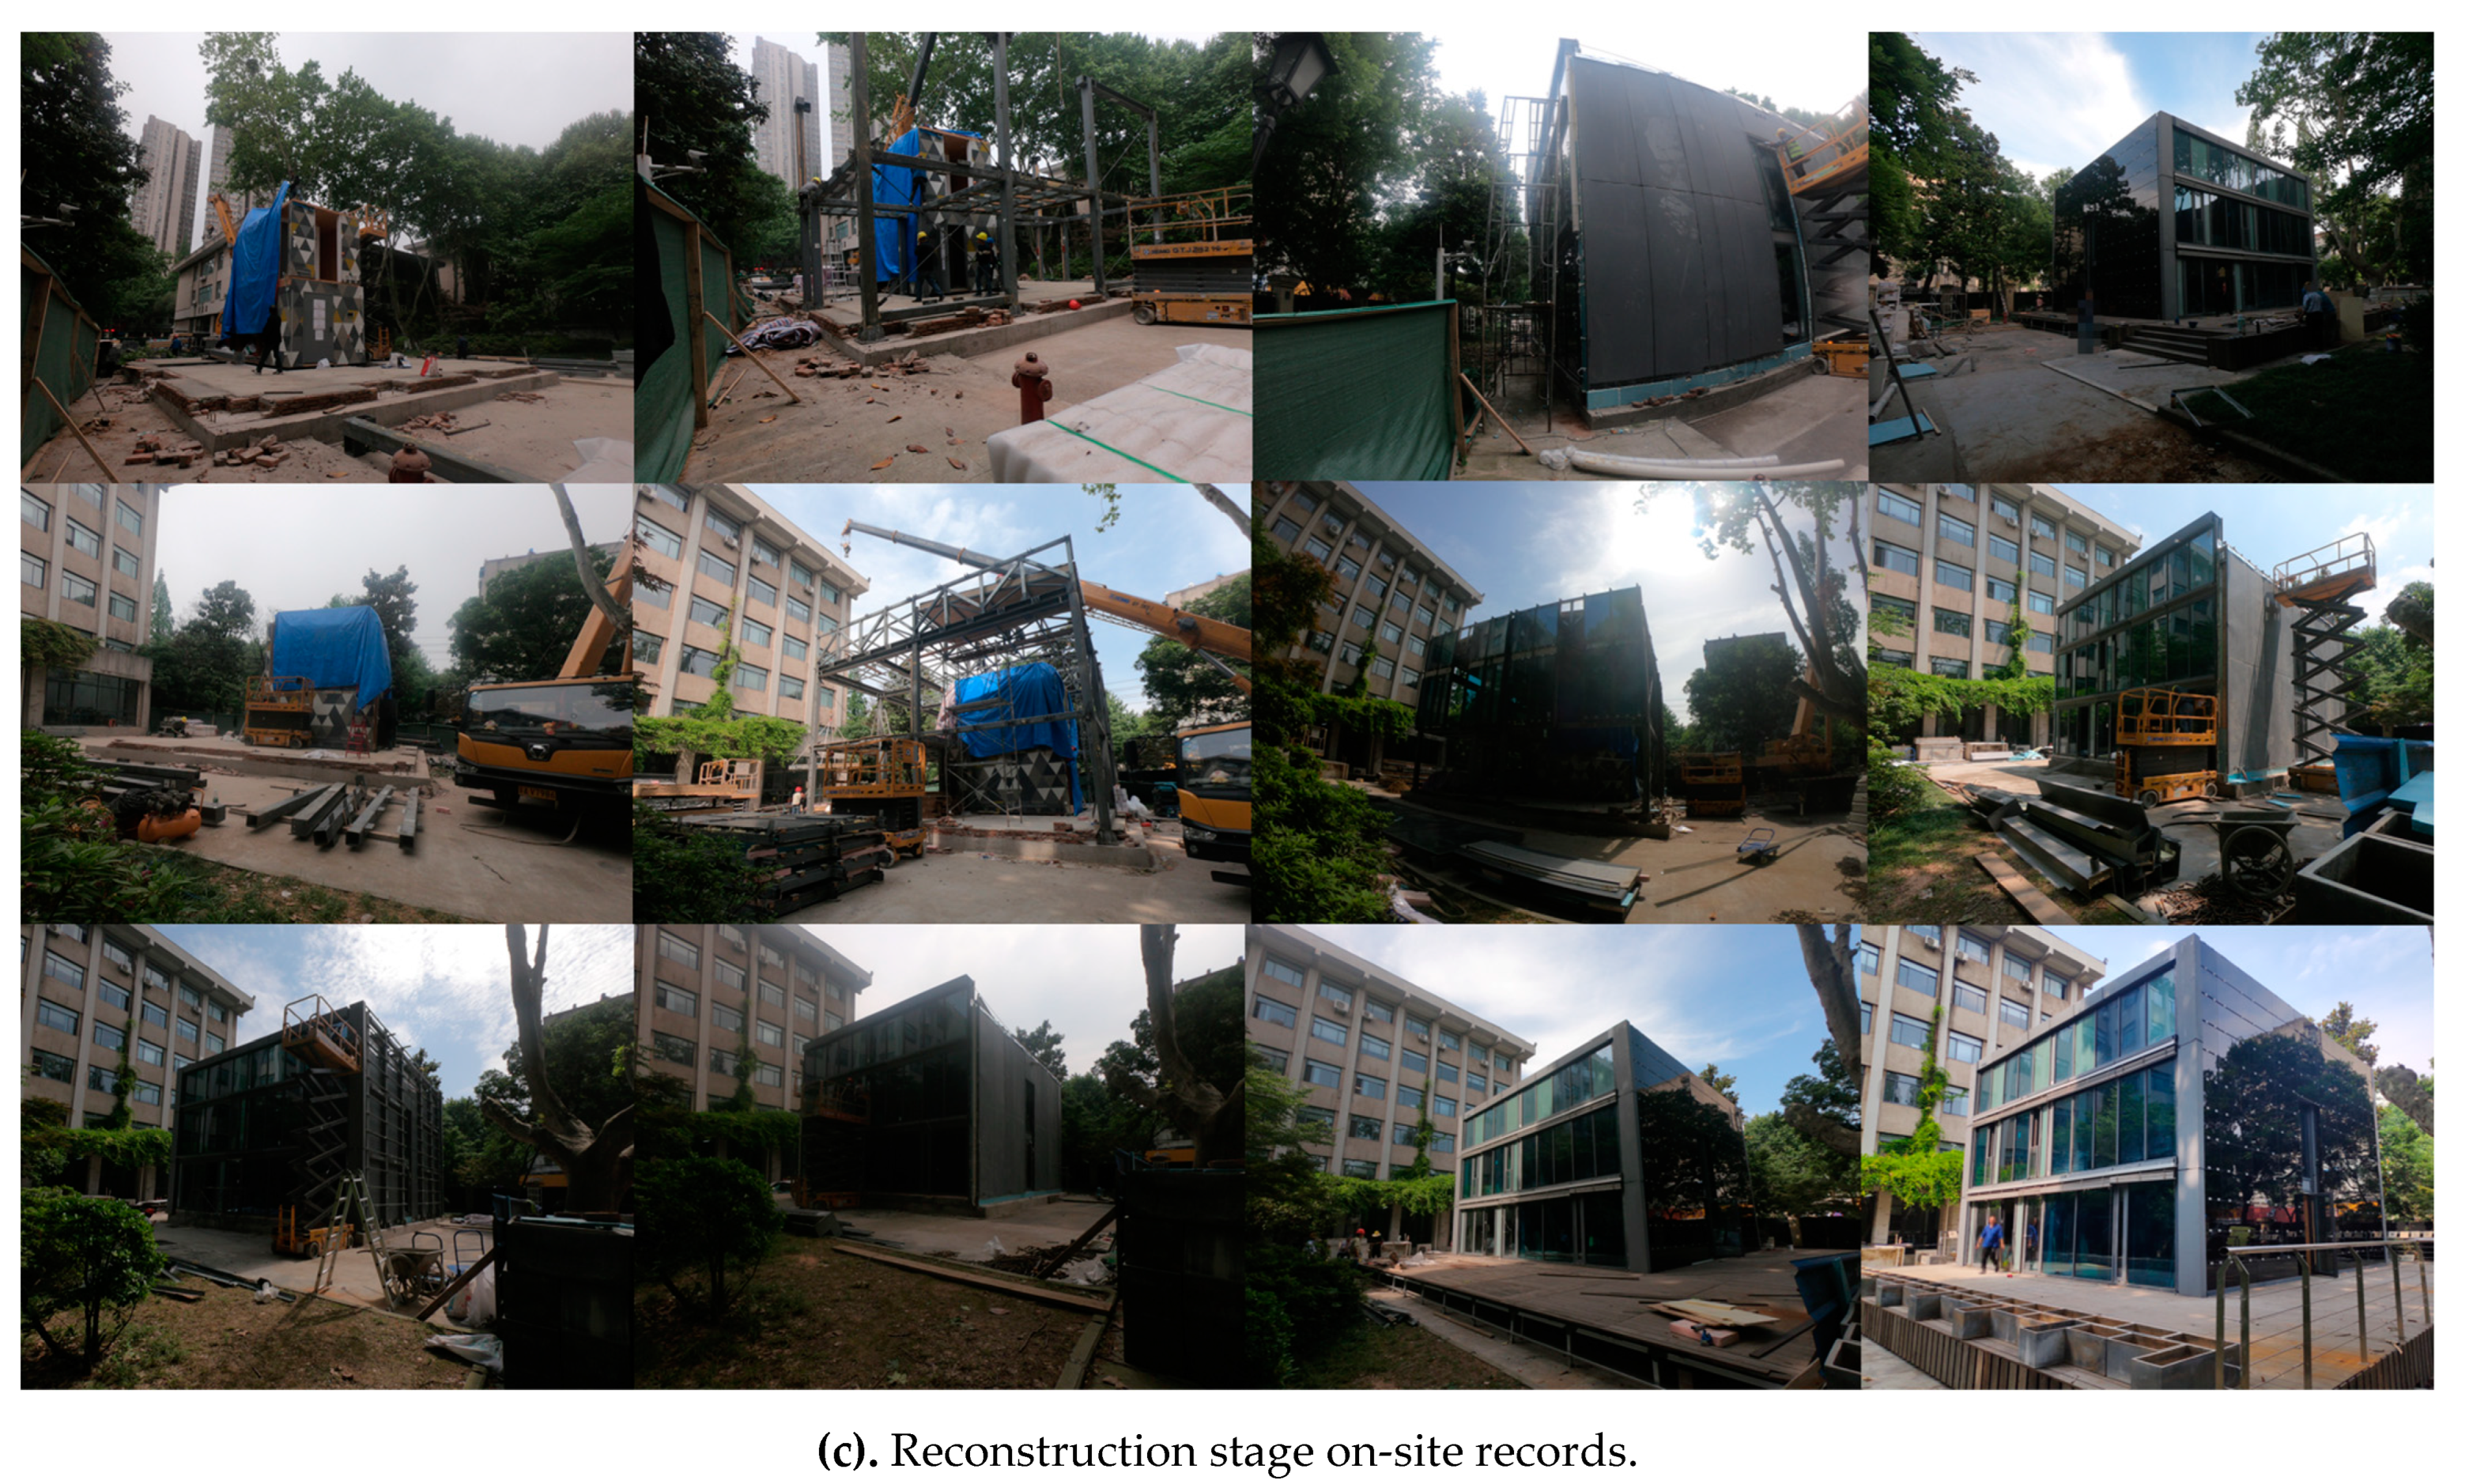
5.3. Reconstruction Stage (Sipailou Campus, Nanjing, Jiangsu Province)

As shown in Figure 4b, these components were placed in assigned storage areas and reassembled at a specific location. Like the disassembly stage, four key documents were formulated to guide construction management, including a reconstruction organization plan, a component count list, a component yard plan, and an accessory procurement plan. The reconstruction process, illustrated in Figure 4c, divided the construction site into three zones: southeast, northwest, and the surrounding environment. The sequence of reconstruction tasks is the reverse of those in the Appendix A. Consumables, like sealants and fasteners, are supplied by selected suppliers. There were weekly activities reported by multiple disciplines. Daily meetings were held to update staff with the progress of the reconstruction, highlight problems encountered, and provide the solutions for the upcoming work. Weekly reports from various disciplines and daily meetings were used to track the reconstruction progress, address any problems encountered, and plan upcoming tasks.

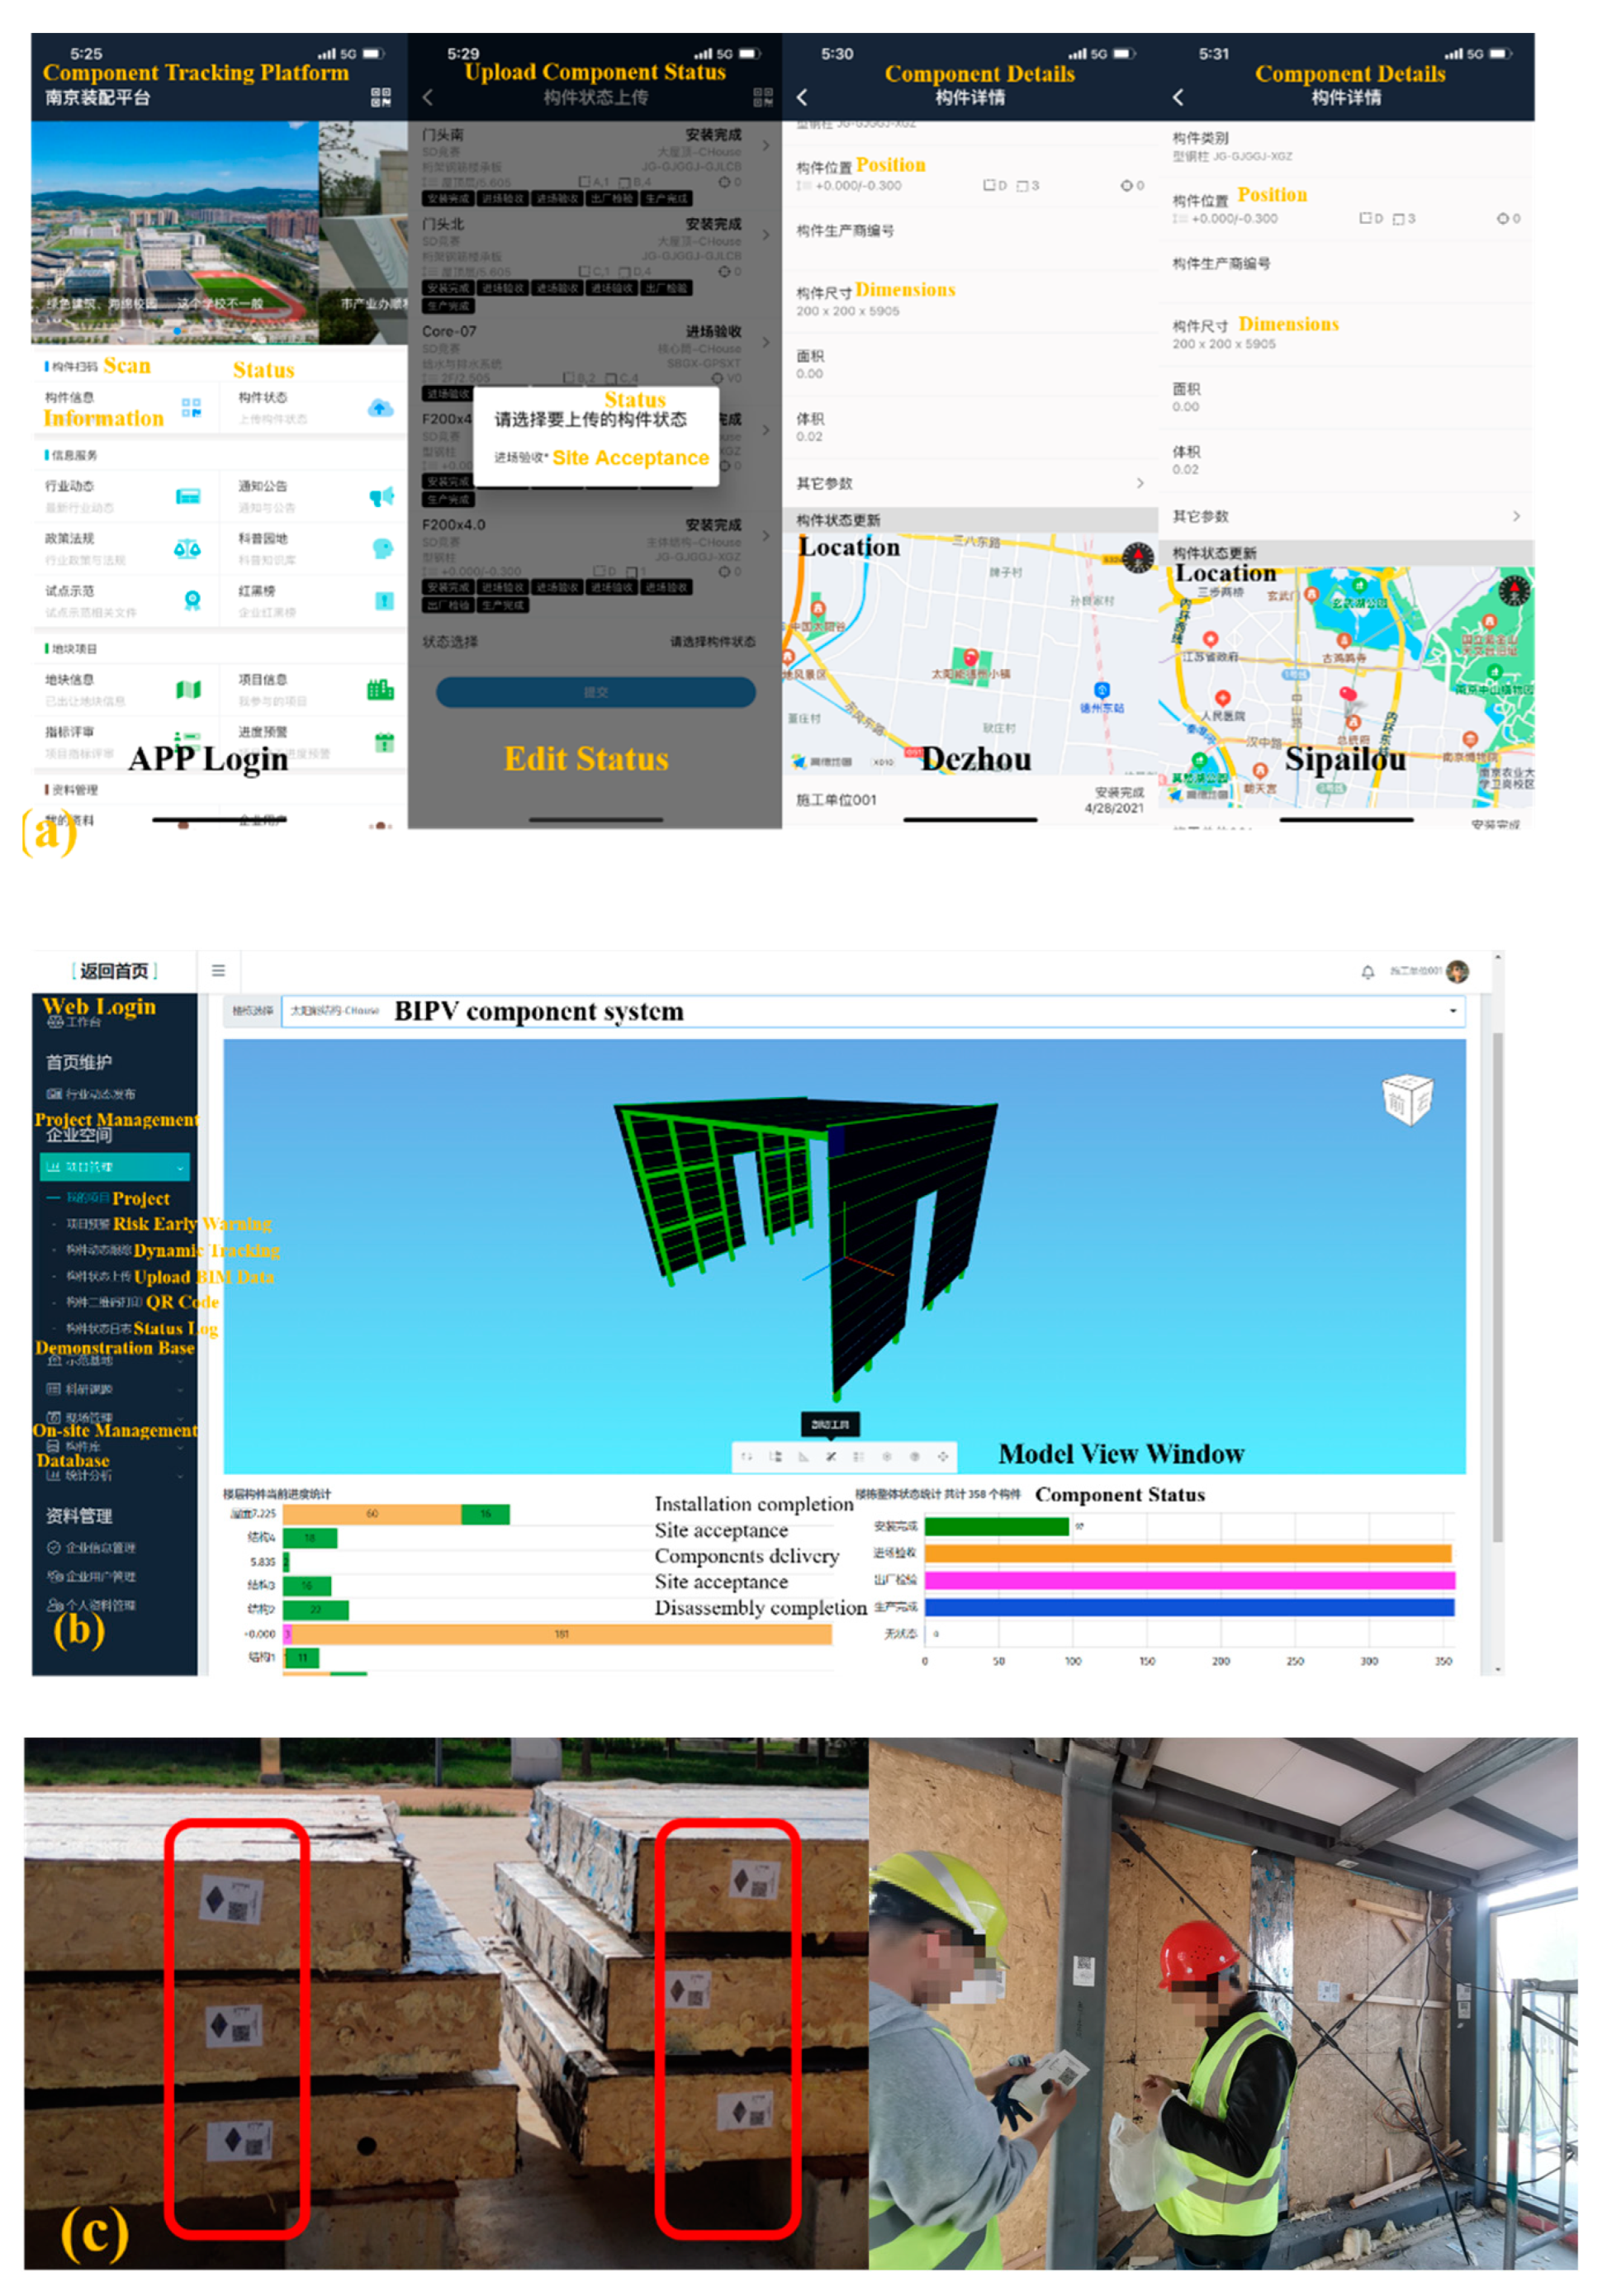
5.4. The Component-Tracking Management Based on QR Codes

As shown in Figure 5a,b, field crews can access basic component information via a smartphone or web login. QR codes attached to the components, as shown in Figure 5c, allow site managers and logisticians to update component status information, such as disassembly completion, delivery, site acceptance, and installation. This is achieved through defined access rights for individual accounts. Inspectors can scan QR codes for site acceptance and update storage details. Combined with Figure 5 and Figure 2d, construction units optimize on-site operations based on QR-code-provided component information. Real-time installation-progress tracking relies on data collection, editing, and process uploading.

6. Results and Discussion

6.1. Obstacle Analysis of and Solutions to BIM-LC Strategy Implementation

During the relocation project, BIM technology provided a powerful and highly organized graphical interface for accessing necessary data, playing a crucial role in facilitating collaboration between off-site and on-site teams, and significantly supporting the decision-making process. Concurrently, QR codes were a medium for conveying information about components model. Basic parameters and attributes of the components could be accessed and edited via smartphones or online access, thereby enabling real-time tracking of their status. This advancement enhanced the comprehensive quality control of components in aspects such as disassembly protection and transportation management. Combined with the future-state mapping feature of Value-Stream Mapping (VSM), this approach can shorten construction periods and avoid resource wastage. The BIM-LC integrated application process showcases BIM’s capability to interact with various digital tools and platforms.
In Table 2, the most important obstacles to activities are summarized and the responses to any obstacles and recommendations are also proposed. In particular, the lack of lifting points for the enclosing wall panels and insufficient structural rigidity caused the lifting operations to be influenced by wind direction and uncontrolled air posture. The dimensions of the support elements at the bottom of the core unit did not meet the standards for high-speed transportation, which increased the workload of the on-site cutting operation, prolonged the component-loading time, and affected timely truck arrival. The steel-framing members of the prefabricated roof units were bent and deformed during normal operation, requiring more loading space and affecting the loading efficiency. In addition, the construction obstacles also included the following: (i) Irregular placement, spatial dislocation, and other problems unavoidably occur during the placement of steel components. These issues arose as a result of various factors, including the competence of the crane operators, the on-site skills of the workers, the dimensions of the components, and the nature of their connections, among others; (ii) The BIM maturity level of the envelope component systems was low, and the model even somewhat erroneous, which resulted in the disassembly plans not guiding the operations effectively.

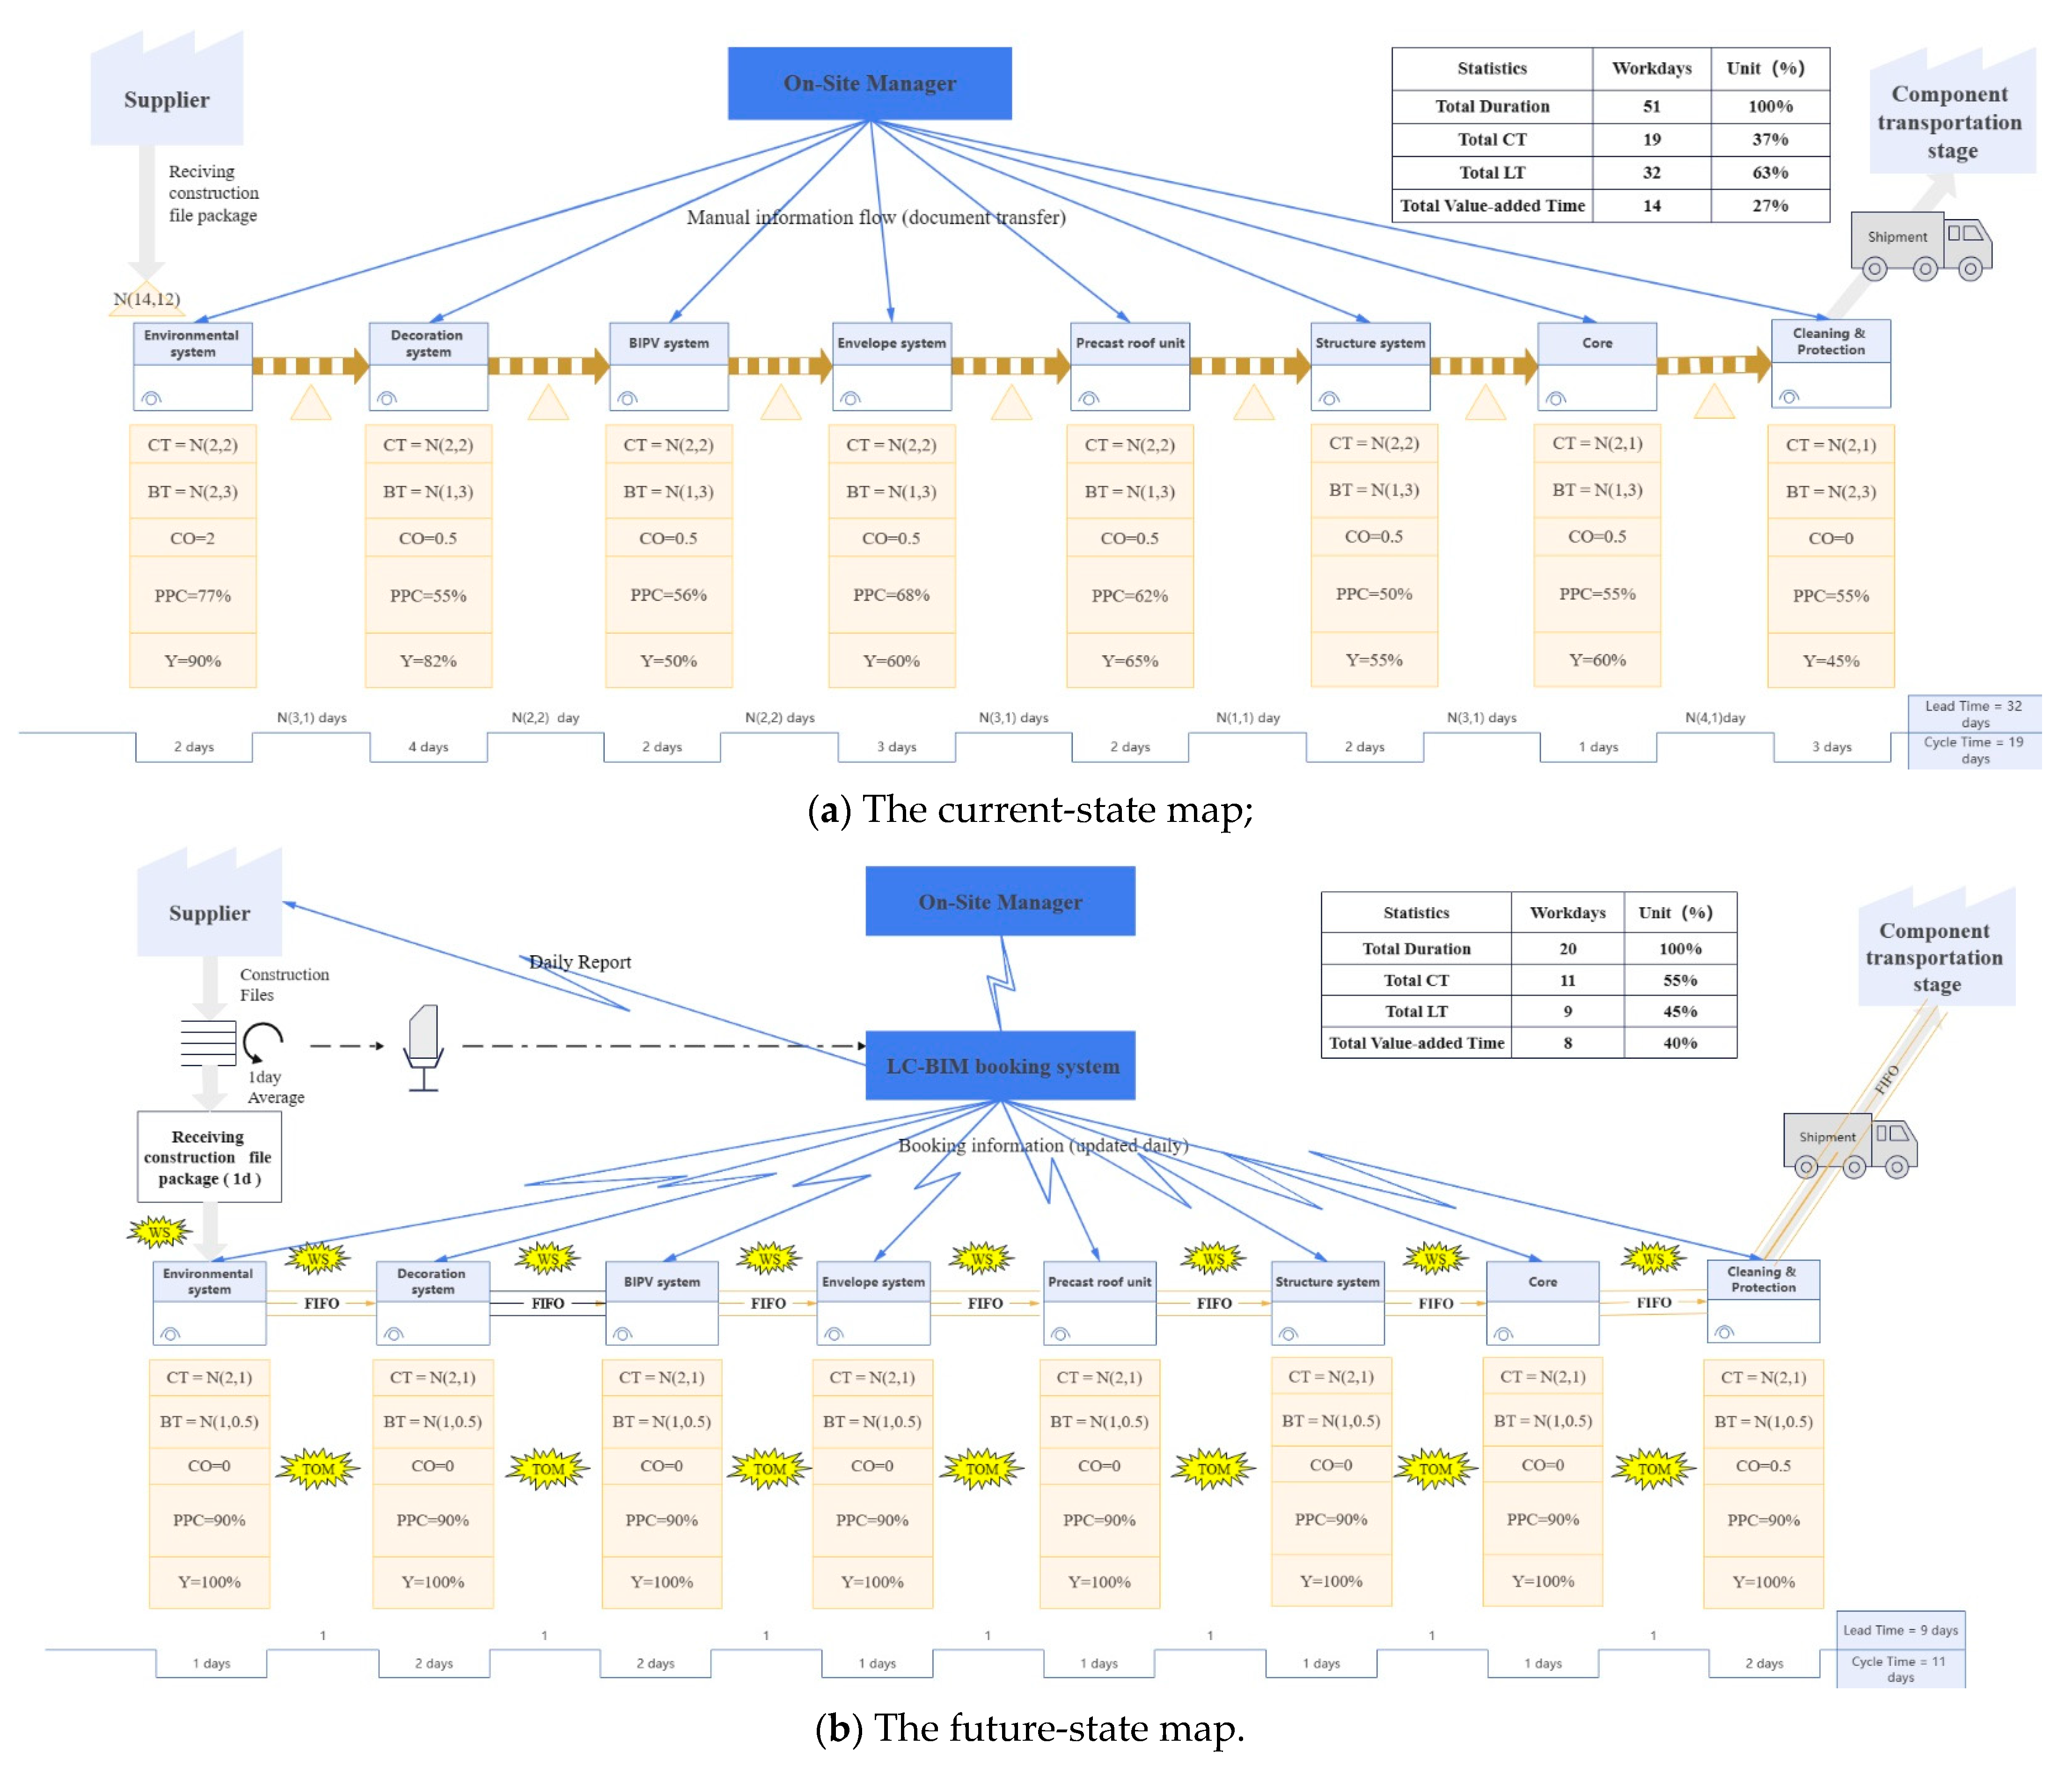
6.2. The Current-State Map and Future-State Map Analysis

Figure 6a illustrates the conventional VSM approach, which was developed by the LCM team and external construction experts during a two-day VSM conference. Data in the boxes were estimated by site managers and cross-referenced with historical production capacity data from construction companies.
Demolition is like a series of stations that a house needs to pass through, but unlike manufacturing, each task varies and follows a distribution in demolition. On-site managers are crucial for production control. Demolition projects driven by marketing lack a predefined production plan due to the market and process unpredictability. Site managers handle material and subcontractor bookings to expedite the process. Suppliers and subcontractors have no fixed schedules, and construction companies manage multiple projects, resulting in unstable crews. Booking information is shared on a case-by-case basis, often communicated via phone or in person.
Reviewing the current-state map reveals several wasteful areas, primarily excessive lead time. The demolition process took 51 workdays, while the preparation lasted 32 workdays, with a 63% idle construction site due to high process variability. Five out of nine booking times had a standard deviation over three days, and eight task-cycle times required statistical descriptions. Roughly 40% of the tasks did not begin as planned (the average PPC on the current-status chart was 60%). This occurred due to temporary contracts causing ripple effects from schedule delays. For example, when tasks like the environmental component system and interior component systems disassembly operations require specialized crews, it delays the BIPV component system demolition.
After analyzing the current construction operations, the partnership recommended setting Lean program goals to enhance productivity, reduce defects, and improve process stability, ultimately cutting lead times. Subsequently, the Lean team created a future-state map (Figure 6b) with four key steps: establishing production flow and aligning it with delivery times, balancing production at the pacemaker task, visualizing booking information with BIM, and enhancing operation reliability through work standardization and TQM. The future-state map reveals that the preparation work was completed in 9 workdays, 23 days less than the traditional model, reducing site idleness from 63% to 45%. Task delays decreased to about 10%, with the average PPC improving from 60% to 90%.

6.3. The Construction Efficiency Performance of the Relocation Process

In terms of the labor efficiency level, as can be seen from Figure 7a, the traditional model does not take into account the impact of an increase in worker numbers on productivity; however, this is not consistent with the actual production activities. Appendix C showcases the construction efficiency and the productivity under different labor inputs. In this case, the laborer number ranged from 15 to 28, and the BIM-LC mode achieved an improvement of 3.4% in labor productivity and an increase of 12.9% in productivity over the traditional construction mode (Appendix C). This is because the implementation of the BIM-LC organizational management approach significantly reduces waste, and the ensuing man-hours required per operation gradually converge to the Value Cycle Time. However, as the number of workers increased further, labor efficiency and productivity in the Lean model showed varying degrees of decline. Therefore, within the allowable range of the workface, appropriately increasing the number of workers can improve the work efficiency. Nonetheless, this necessitates a careful consideration of the impact of additional personnel in a limited area, particularly in terms of potential cross-operation interference and other disturbance factors.
As shown in Figure 7b, the planned completion date of the environmental component system (A) was April 12, and the actual completion date was April 14, which clearly shows a two-day delay from the planned date. Similarly, the actual completion time for the remaining component systems was less than planned, to varying degrees. Among them, the actual completion time for component system D was 6 days earlier than planned. System B was completed the earliest, while F was the last system to be disassembled. For the overall disassembly stage, the actual disassembly completion time was 4 days ahead of plan. Since there was concurrent engineering, the deviation between the planned and actual completion dates does not accurately reflect how long the disassembly of each component system was sustained.
Therefore, the relationship between the planned and actual durations shows that the wireframe formed by the red points is inside the wireframe formed by the blue points, except for the two points D and E. In other words, the actual period required for all systems was shorter than planned, except for the plumbing and electrical component systems and the enclosure component systems. The actual completion of the CRP was 11 days ahead of schedule.
The transportation plan determined based on the JIT principle enhanced the coordination between the demolition and reconstruction phases, reduced wasted space and time on the construction site, and ensured that the construction proceeded as planned. According to the data in Appendix E, the results showed that the BIM-LC mode reduced CRP costs by 8.07%, saving 49.7 USD/m2 or USD 9093.8 in total compared with traditional construction. Notably, 12.5% of these savings, equivalent to 10.2 USD/m2 or USD 1875, were achieved during transportation.

6.4. Carbon-Emission Performance and CDW of the Relocation Process

As shown in Figure 8a,b, total carbon emissions during the CRP process are 15,288.4 kgCO2e, with a carbon intensity of 83.5 kg/m2. Among them, the component transport stage is considered the largest contributor, contributing approximately 54% (8178.5 kgCO2e) to the carbon emissions. Under normal circumstances, carbon emissions from the preparation of materials and the production of components account for a significant proportion of the total lifecycle emissions. However, in this case, since the dismantled components were transported to another site and directly reused, a substantial amount of the energy consumption typically required for the production of materials was saved. This resulted in the transport phase having a relatively larger share of the overall carbon emissions. The disassembly stage and reconstruction stage contributed 7.4% (1133.7 kgCO2e) and 39.1% (5976.2 kgCO2e), respectively, in which the embedded carbon emissions from material preparation in the reconstruction stage dominated.
It should be noted that this project has the following two characteristics that are different from other construction activities. On the one hand, except for a small number of depleted components (e.g., sealant, woodworking boards, screws, etc.), other components can be directly recycled for use. On the other hand, since it is an off-site reconstruction project, the components are transported over a long distance; therefore, this stage accounts for a relatively large share of the carbon emissions. Therefore, the relocation or recycling of building components is deemed a better choice than reprocessing or recycling because it does not require additional energy.
Figure 8c shows the total composition (by weight and percentage) of construction waste in the disassembly stage. According to the data in Appendix E, the waste-generation rate of demolition in this case, compared with the waste-generation rates of residential construction in different countries, falls within the range of 1–5%. The total weight was 1903.8 kg (10.4 kg/m2). This also fully demonstrates that the reuse of components can significantly reduce the generation of demolition waste. The highest percentage of wood was 51.1% (973.6 kg), followed by plastic products and rubber weather-stripping-seal strips with 13.1% (248.8 kg) and 9.2% (176.1 kg), respectively. It was observed that the sale of CDW for recycling accounted for 61% of the overall CDW flow. Recycled CDW, including metal, wood strips, nails, plastic sheets, paper, etc., were either sold directly to recyclers or through intermediaries such as local residents or scavengers.

7. Conclusions, Limitations, and Recommendations

7.1. Conclusions

To comprehensively explore the implementation and quantitative analysis of BIM-LC technology and methods in ACE projects in China, a case study of a project in Dezhou, China was conducted. In this project, the LCM teams, functioning similarly to an EPC (Engineering Procurement Construction) contractor, were commissioned by the owner to manage the entire lifecycle stage, covering design, procurement, transportation, and construction. The primary findings underscore the potential benefits this offers to project stakeholders, as evidenced by its ability to mitigate implementation obstacles, improve construction efficiency, reduce carbon emissions, and minimize construction waste. Therefore, it is advantageous for EPC contractors to adopt the BIM-LC methodology.
This study enriches the existing knowledge of BIM-LC methodology implementation in a relocation project. These quantitative metrics of construction performance facilitate data-driven scientific decision making for traditional constructors, which in turn supports the implementation of BIM-LC in Chinese practice. Moreover, it also stimulates the creation of a whole new market for reusable components, achieving social and economic benefits.
The key results obtained from the analysis and the conclusions drawn can be summarized as follows:
(1)
The results showed that the BIM-LC strategy reduced the construction period by 11 days, achieved an 8.07% savings in construction costs (i.e., 49.7 USD/m2), and saved 12.5% in transportation costs (i.e., 10.2 USD/m2). The waste-generation rate of demolition in this case, compared with the waste-generation rates of residential construction in different countries, falls within the range of 1–5%, which totals a weight of 1903.8 kg (10.4 kg/m2).
(2)
The research showed that the number of laborers ranged from 15 to 28, and that the BIM-LC model achieved a 3.4% increase in labor efficiency and a 12.9% increase in productivity over the traditional construction organization model.
(3)
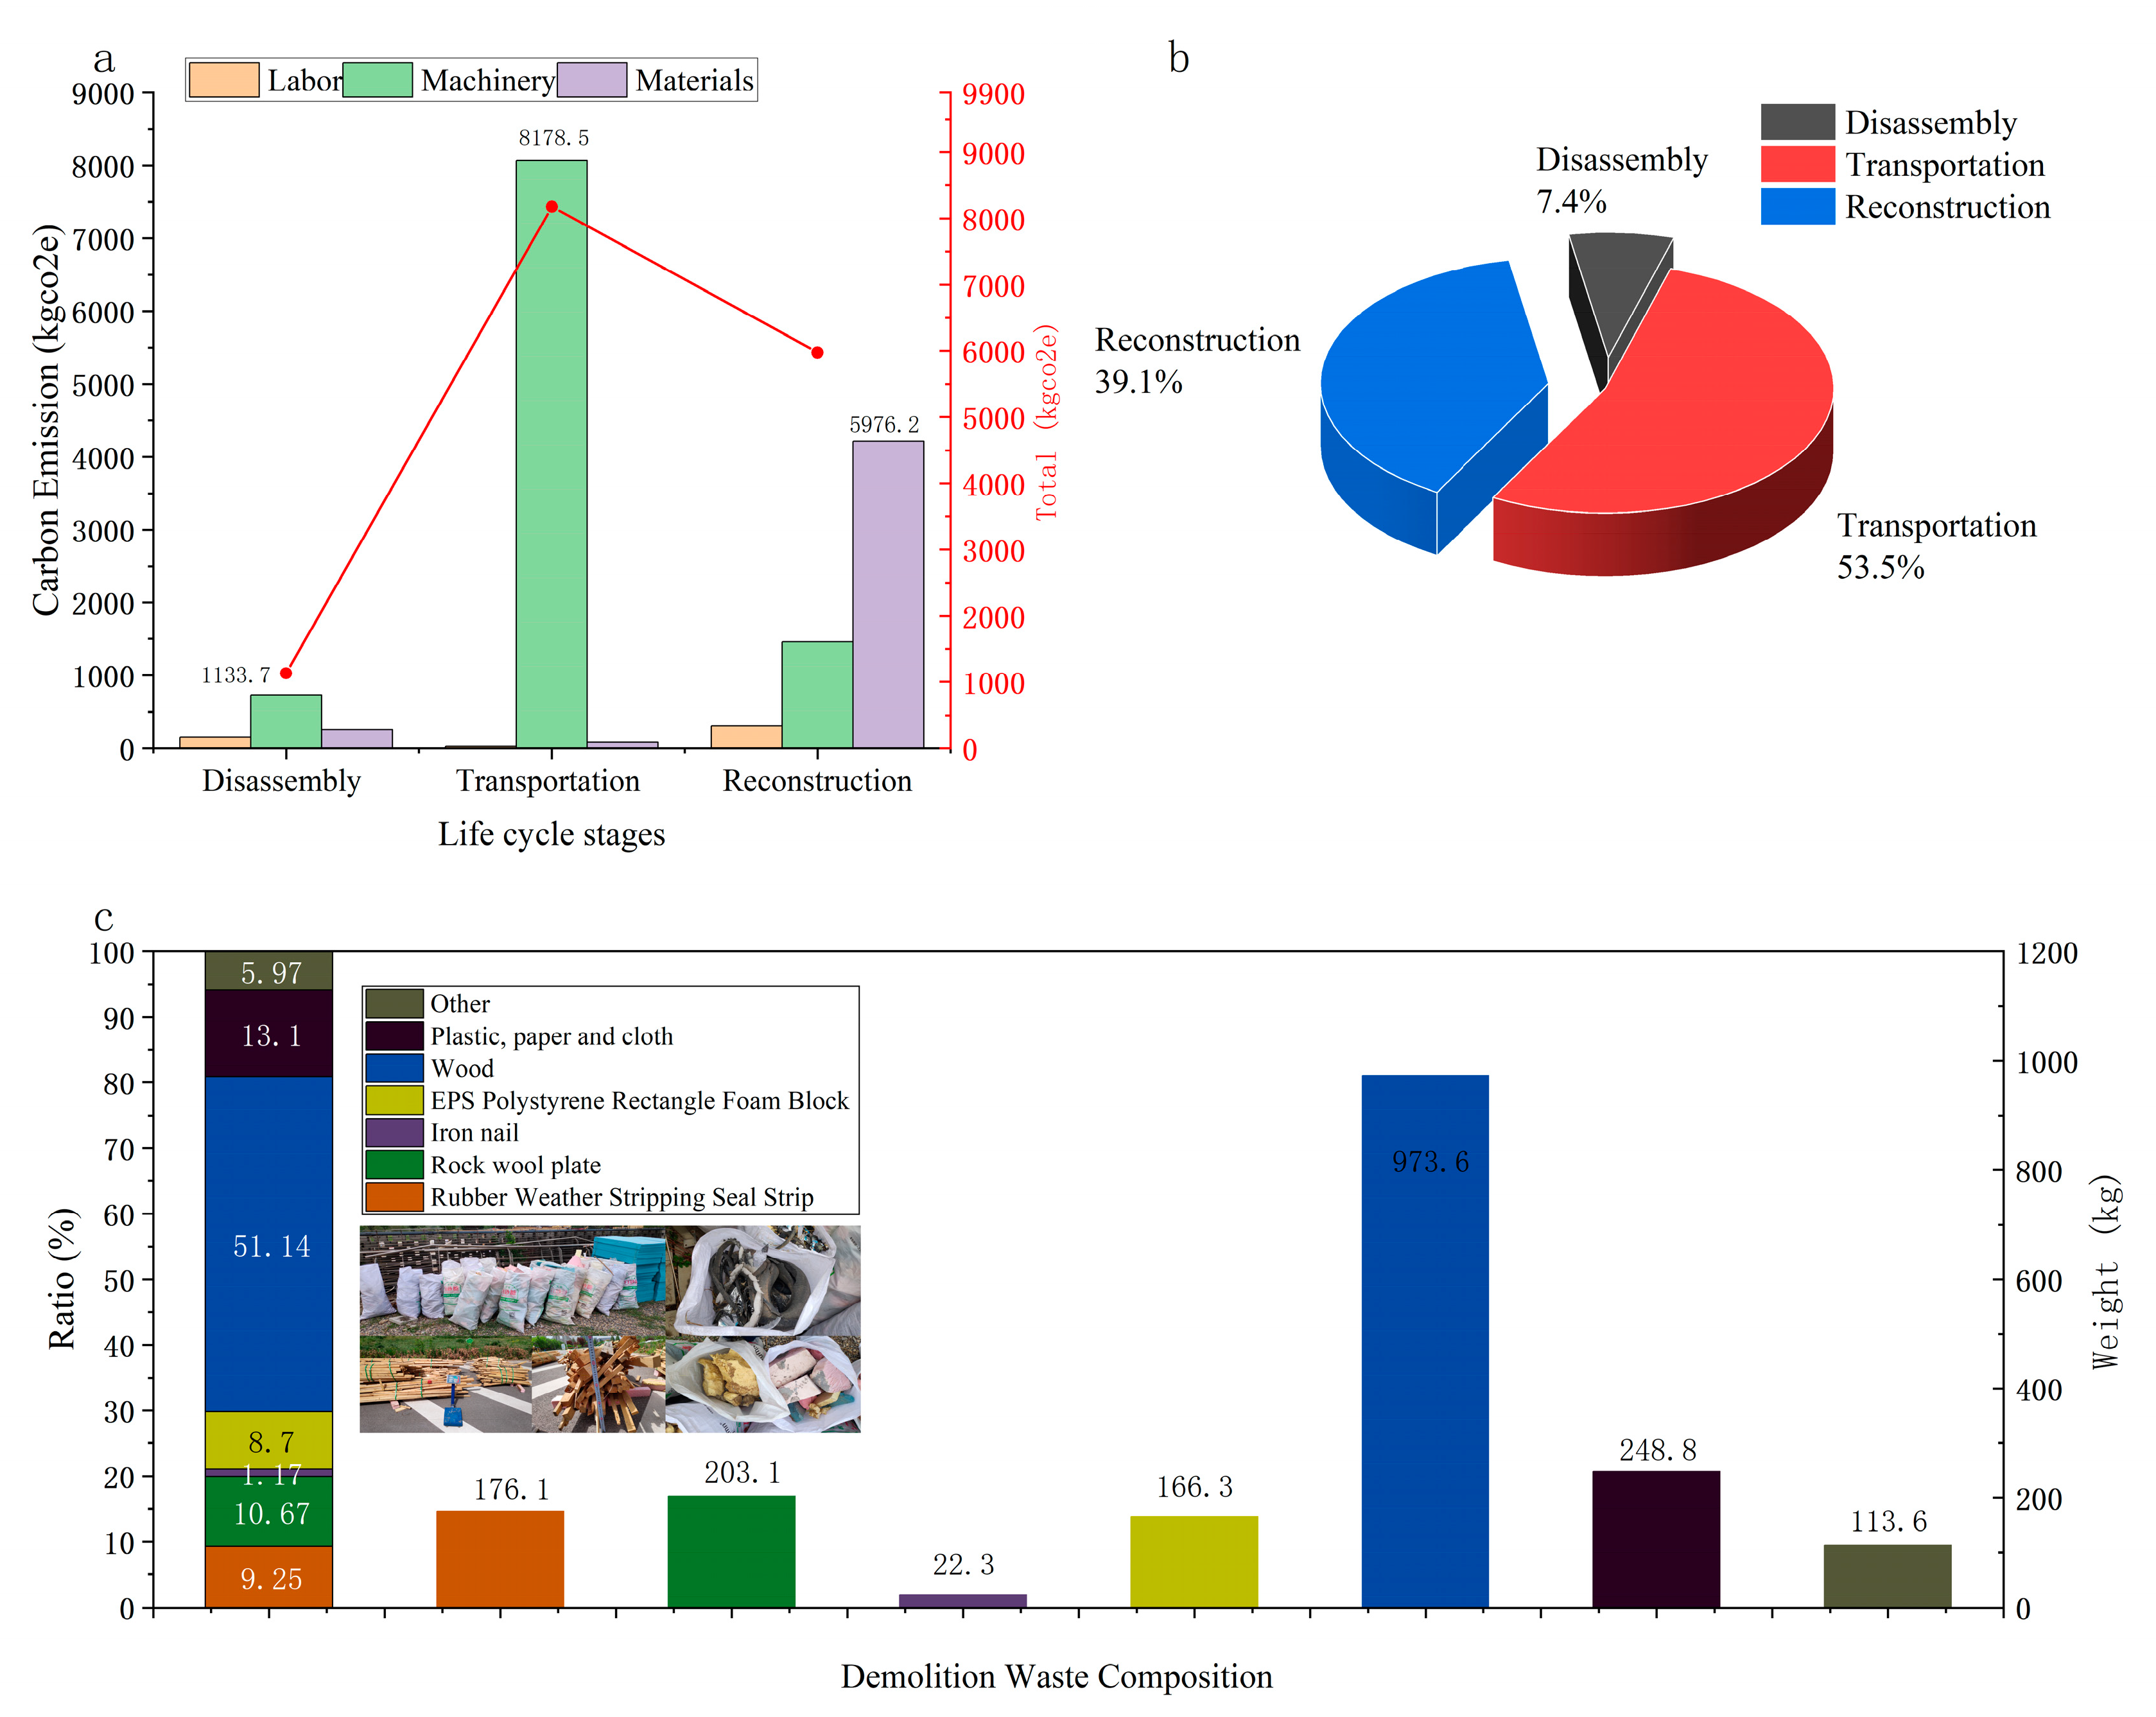
Since the components can be reused, the weight of the CDW is greatly reduced. The total carbon emissions from the CRP process were 15,288.4 kgCO2e, with a carbon intensity of 83.5 kg/m2. The component transportation stage was considered the largest contributor, contributing 53.5% (8178.5 kgCO2e). The disassembly and the reconstruction stage contributed 7.4% (1133.7 kgCO2e) and 39.1% (5976.2 kgCO2e), respectively.
(4)
The BIM-LC strategy, as a management method, needs to be human-centered and process-oriented. Hence, teamwork is necessary, and the owner plays an important role across the project as the driving force for the BIM-LC implementation. At the management level, the commitment to quality and continuous improvement by the stakeholders is essential at each stage of the project.

7.2. Limitations and Recommendations

It is important to maintain a cautious perspective on the broader implications of this research. The impact of the BIM-LC methodology may vary depending on project-specific characteristics and regional contexts. The owner acts as the driving force for the LCM team to present a detailed orientation program and training to the participants, which is an attempt to implement the BIM-LC strategy. This was key to the successful implementation of this project, but currently, the majority of proprietors lack an adequate understanding of BIM-LC. Moreover, C-House is an assembled light-steel structure, which differs slightly from prefabricated concrete buildings or other building forms in terms of construction methods or processes. Thus, future research could explore how the BIM-LC strategy applies to different project types, contract forms, construction methods, and management systems.

Author Contributions

Data curation, S.H., S.L., R.Z., C.Z., H.Y., and M.C.; Writing—original draft, S.H.; Writing—review and editing, H.Z. All authors have read and agreed to the published version of the manuscript.

Funding

This research was funded by the National Natural Science Foundation of China (Project No. 52378010).

Data Availability Statement

Dataset is available on request from the authors.

Conflicts of Interest

Authors Shen Luo and Meng Cong are employed by the company Architects & Engineers Co., Ltd. of Southeast University. The remaining authors declare that the research was conducted in the absence of any commercial or financial relationships that could be construed as a potential conflict of interest.

Appendix A. Series of Activities and Descriptive Statistics during the Disassembly Stage

ItemComponent SystemActivity IDSub-Division Sequence and DetailPercent Plan Completion (PPC) %Plan Duration (Days)
1Environmental system1.1Outdoor plastic wood floor805
1.2Outdoor plastic wood floor supports a steel frame
1.3Prefabricated wall
1.4Artistic structures
1.5C-house table
1.6Concrete handprint
1.7Stainless-steel railing
1.8Landscape stone
1.9Cement flowerpot
2Decoration system2.1Furniture 1F 1007
2.2Furniture 2F
2.3Ceiling 2F
2.4Ceiling 1F
2.5Wall panel—West
2.6Wall panel—East
2.7Floorboards 2F
2.8Floorboards 1F
3BIPV system3.1PV panel—Roof1006
3.2PV panel—East
3.3PV panel—West
3.4PV panel secondary structure—Roof
3.5PV panel secondary structure—East
3.6PV panel secondary structure—West
3.7PV panel main structure—Roof
3.8PV panel main structure—East
3.9PV panel main structure—West
4Drainage and circuitry system4.1Outdoor: Street lamp/Keyless entry system/Charging pile/Air-conditioner unit/Sewage-treatment system/909
4.2Indoor: AV circuit/Lamp circuit/
Low-voltage system/Water supply and drainage system
5Envelope system5.1Electric sunshade louver604
5.2Folded-edge aluminum plate
5.3Rain gutter
5.4Sandwich wallboard
5.5Decorative cover and glass between unit
5.6Glass curtain wall
6Precast roof unit6.1Standing-seam-roof metal panel1004
6.2Ridge board
6.3Roof panel unit
6.4Roof steel-frame—Border
6.5Roof steel-frame—Truss
7Structure system7.1Ring beam—Upper1003
7.2Floor-slab panel unit
7.3Frame structure—Tail joist 1F and 2F
7.4Steel column
7.5Frame unit—Beam
7.6Frame unit—Column
8Core8.1Top panel1005
8.2Wall panel
8.3Staircase unit
8.4Equipment room unit

Appendix B. VSM Key Elements

Key ConceptsDefinitionsFormula
Cycle time (CT)The duration the construction team takes to complete the demolition of a certain component system.CT = actual finish date − (minus) actual start date
Booking time (BT) The time it takes to deploy their employees to specific demolition jobs.BT = confirmed start date − (minus) booking date
Changeover time (CO)The time that workers need to be transferred from one construction site to work at another, including demobilization and mobilization.——
Percent Plan Complete (PPC)Percent Plan Complete (PPC) was introduced to measure the reliability of a team’s commitment and to evaluate the WWP completion.Equation (1)
Yield (Y)The percentage of houses that go through an operation correctly, without any rework.——
Lead Time (LT)The time elapsed between the completion of one task and the start of the next.——

Appendix C. Analysis of Construction Efficiency under Different Labor Inputs

Labor Input
Number
A
Efficiency
(BIM-LC)
B
Efficiency
(Traditional Model)
C
Productivity
(BIM-LC)
=A*B
Productivity
(Traditional Model)
=A*C
150.983940.8516.2349512.75
160.968820.8517.051313.6
170.953640.8517.8331414.45
180.93840.8518.5802515.3
190.923080.8519.2923816.15
200.90770.8519.9693117
210.892240.8520.6107917.85
220.876720.8521.2165918.7
230.861120.8521.7864619.55
240.845460.8522.3201620.4
250.829730.8522.8174521.25
260.813920.8523.2780722.1
270.798040.8523.7017822.95
280.782090.8524.0883223.8
Average value88.4%85%18.0515.99
Difference3.4%12.9%

Appendix D

Appendix D.1. Cost-Saving Analysis in the BIM-LC Mode

ItemW1W2W3
Unit Machine-TeamUnitMan-DayUnit Number
14500 6300 6412,000 1

Appendix D.2. Analysis of Costs under Different Conditions

WTWBIM-LCSave (Total)W3 (Planned)W3 (Actual)Save (Transportation)
CNY 721,565.8CNY 663,365.88.07%
(CNY 58,200) (USD 9093.8)
CNY 96,000CNY 84,00012.5%
(CNY 12,000)
(USD 1875)
W B I M L C represents the total cost based on the actual expenses incurred during the construction process under the BIM-LC construction mode; W T represents the estimated cost of the reconstruction project calculated based on the current Chinese engineering quota under the traditional construction management mode. At the project implementation preparation stage, this value is estimated to be CNY 721,565.8; W 1 , W 2 , and W 3 respectively represent the cost savings achieved in the BIM-LC construction mode by reducing crane shifts, reducing construction man-days, and reducing the number of transport vehicles. The crane specification is 50 tons, priced at 4500 CNY/machine-team. The labor cost is 300 CNY/man-day. The truck transportation specification is 17.5 m, priced at CNY 12,000 per vehicle. The average exchange rate over a two-month period during the demolition and reconstruction phase was chosen as the benchmark value for currency conversion (6.4 USD/CNY). Historical data from the China Money Network (chinamoneynetwork.com).

Appendix E

Appendix E.1. Waste-Activity Identification and Improvement

ItemCDW ClassificationWeight (kg)
1Rubber weather-stripping-seal strip176.1
2Rock wool plate203.1
3Iron nail22.3
4EPS polystyrene rectangle foam block166.3
5Wood973.6
6Plastic, paper, and cloth248.8
7Other113.6
8Total 1903.8

Appendix E.2. Comparison of Waste-Generation Rates (WGRs) in Different Countries (kg/m2)

CountryDemolition WGR (kg/m2)YearSource
Canada5472008[39]
EU(195,1640)-[40]
Norway(575,1100)2007[41]
Vietnam(318,610)2019[42]
Malaysia10402016[43]
China10.42021This study

References

  1. Hossain, M.A.; Zhumabekova, A.; Paul, S.C.; Kim, J.R. A review of 3D printing in construction and its impact on the labor market. Sustainability 2020, 12, 8492. [Google Scholar] [CrossRef]
  2. Kabirifar, K.; Mojtahedi, M.; Wang, C.; Tam, V. Construction and demolition waste management contributing factors coupled with reduce, reuse, and recycle strategies for effective waste management: A review. J. Clean. Prod. 2020, 263, 121265. [Google Scholar] [CrossRef]
  3. Papadonikolaki, E.; Oel, C.V.; Kagioglou, M. Organizing and managing boundaries: A structuration view of collaboration with building information modeling (BIM). Int. J. Proj. Manag. 2019, 37, 378–394. [Google Scholar] [CrossRef]
  4. Singh, S.; Kumar, K. Review of literature of lean construction and lean tools using systematic literature review technique (2008–2018). Ain Shams Eng. J. 2020, 11, 465–471. [Google Scholar] [CrossRef]
  5. Heigermoser, D.; Soto, B.D.; Abbott, E.; Chua, D. BIM-based last planner system tool for improving construction project management. Autom. Constr. 2019, 104, 246–254. [Google Scholar] [CrossRef]
  6. Sacks, R.; Koskela, L.; Dave, B.A.; Owen, R. Interaction of lean and building information modeling in construction. J. Constr. Eng. Manag. 2010, 136, 968–980. [Google Scholar] [CrossRef]
  7. Sbiti, M.; Beddiar, K.; Beladjine, D.; Perrault, R.; Mazari, B. Toward BIM and LPS Data Integration for Lean Site Project Management: A State-of-the-Art Review and Recommendations. Buildings 2021, 11, 196. [Google Scholar] [CrossRef]
  8. Xing, W.; Hao, J.L.; Qian, L.; Tam, V.W.Y.; Sikora, K.S. Implementing lean construction techniques and management methods in Chinese projects: A case study in Suzhou, China. J. Clean. Prod. 2020, 286, 124944. [Google Scholar] [CrossRef]
  9. Black, J.T.; Phillips, R.T. The lean to green evolution. Ind. Eng. 2010, 42, 46–51. [Google Scholar]
  10. Ong, J.; Pheng, L.S. Lean Construction Implementation. In Waste Reduction in Precast Construction; Management in the Built Environment; Springer: Singapore, 2021. [Google Scholar]
  11. Marhani, M.A.; Jaapar, A.; Bari, N. Lean construction: Towards enhancing sustainable construction in Malaysia. Procedia Soc. Behav. Sci. 2012, 68, 87–98. [Google Scholar] [CrossRef]
  12. Rahman, M.M.; Chua, D.K.H.; Al-Tabbaa, O. Integrated Lean and Green Building Assessment Tool for Sustainability: Development and Applications. J. Clean. Prod. 2018, 182, 603–617. [Google Scholar]
  13. Aibinu, A.A.; Venkatesh, S. Critical Success Factors for Implementing Lean Construction. J. Constr. Eng. Manag. 2018, 144, 04017099. [Google Scholar]
  14. Li, S.; Wu, X.; Zhou, Y.; Liu, X. A study on the evaluation of implementation level of lean construction in two Chinese firms. Renew. Sustain. Energy Rev. 2017, 71, 846–851. [Google Scholar] [CrossRef]
  15. Tezel, A.; Koskela, L. Evaluation of the Implementation of Lean Construction Through Multicriteria Assessment of Its Principles. J. Manag. Eng. 2018, 34, 04017047. [Google Scholar]
  16. Daniel, E.I.; Pasquire, C.; Dickens, G. Exploring the implementation of the last planner® system through IGLC community: Twenty-one years of experience. In Proceedings of the 23rd Annual Conference of the International Group for Lean Construction, Perth, Australia, 29–31 July 2015. [Google Scholar]
  17. Womack, J.P.; Jones, D.T. Lean Thinking: Banish Waste and Create Wealth in Your Corporation; Free Press: New York, NY, USA, 2003. [Google Scholar]
  18. Yu, H.; Al-Hussein, M.; Al-Jibouri, S.; Telyas, A. Lean transformation in a modular building company: A case for implementation. J. Manag. Eng. 2013, 29, 103–111. [Google Scholar] [CrossRef]
  19. Sarhan, S.; Fox, A. Trends and challenges to the development of a lean culture among UK construction Organizations. In Proceedings of the 20th Annual Conference of the International Group for Lean Construction, San Diego, CA, USA, 18–20 July 2012. [Google Scholar]
  20. Sarhan, J.G.; Bo, X.; Fawzia, S.; Karim, A. Lean construction implementation in the Saudi Arabian construction industry. Constr. Econ. Build. 2017, 17, 46–69. [Google Scholar] [CrossRef]
  21. Issa, U.H. Implementation of lean construction techniques for minimizing the effect of the risk on project construction time. Alex. Eng. J. 2013, 52, 697–704. [Google Scholar] [CrossRef]
  22. Heravi, G.; Rostami, M.; Kebria, M.F. Energy consumption and carbon emission assessment of integrated production and erection of buildings’ prefabricated steel frames using lean techniques. J. Clean. Prod. 2020, 253, 120045. [Google Scholar] [CrossRef]
  23. Kong, L.; Li, H.; Luo, H.; Ding, L.; Zhang, X. Sustainable performance of just-in-time (JIT) management in time-dependent batch delivery scheduling of precast construction. J. Clean. Prod. 2018, 193, 684–701. [Google Scholar] [CrossRef]
  24. Hamdi, O.; Leite, F. BIM and Lean interactions from the BIM capability maturity model perspective: A case study. In Proceedings of the IGLC 2012: 20th Conference of the International Group for Lean Construction, San Diego, CA, USA, 18–20 July 2012; The International Group for Lean Construction: San Diego, CA, USA, 2012. [Google Scholar]
  25. Van Groesen, W.; Pauwels, P. Tracking Prefabricated Assets and Compliance Using Quick Response (QR) Codes, Blockchain and Smart Contract Technology. Autom. Constr. 2022, 141, 104420. [Google Scholar] [CrossRef]
  26. Tezel, A.; Taggart, M.; Koskela, L.; Tzortzopoulos, P.; Hanahoe, J.; Kelly, M. Lean construction and BIM in small and medium-sized enterprises (SMEs) in construction: A systematic literature review. Can. J. Civ. Eng. 2020, 47, 186–201. [Google Scholar] [CrossRef]
  27. Gerber, D.J.; Becerik-Gerber, B.; Kunz, A. Building information modeling and lean construction: Technology, methodology, and advances from practice. In Challenging Lean Construction Thinking: What Do We Think and What Do We Know? Proceedings of the 18th Annual Conference of the International Group for Lean Construction, IGLC 18, Haifa, Israel, 14–16 July 2010; The International Group for Lean Construction: Haifa, Israel, 2010; pp. 683–693. [Google Scholar]
  28. Sacks, R.; Korb, S.; Barak, R. Building Lean, Building BIM Improving Construction the Tidhar Way; Routledge: London, UK, 2018. [Google Scholar]
  29. Arayici, Y.; Coates, P.; Koskela, L.; Kagioglou, M.; Usher, C.; O’Reilly, K. Technology adoption in the BIM implementation for lean architectural practice. Autom. Constr. 2011, 20, 189–195. [Google Scholar] [CrossRef]
  30. Song, L.; Liang, D. Lean construction implementation and its implication on sustainability: A contractor’s case study. Can. J. Civ. Eng. 2011, 38, 350–359. [Google Scholar] [CrossRef]
  31. Du, J.; Zhang, J.; Castro-Lacouture, D.; Hu, Y. Lean manufacturing applications in prefabricated construction projects. Autom. Constr. 2023, 150, 104790. [Google Scholar] [CrossRef]
  32. Cai, G.; Waldmann, D. A material and component bank to facilitate material recycling and component reus for a sustainable construction: Concept and preliminary study. Clean Technol. Environ. Policy 2019, 21, 2015–2032. [Google Scholar] [CrossRef]
  33. Eldeep, A.M.; Farag, M.A.M.; Abd El-hafez, L.M. Using BIM as a lean management tool in construction processes—A case study. Ain Shams Eng. J. 2021, 13, 101556. [Google Scholar] [CrossRef]
  34. Novinsky, M.; Nesensohn, C.; Ihwas, N.; Haghsheno, S. Combined Application of Earned Value Management and Last Planner System in Construction Projects. In Proceedings of the 26th Annual Conference of the International Group for Lean Construction, Chennai, India, 16–22 July 2018. [Google Scholar]
  35. ISO 19650-1:2018; Organization and Digitization of Information about Buildings and Civil Engineering Works, Including Building Information Modelling (BIM)—Information Management Using Building Information Modelling—Part 1: Concepts and Principles. International Organization for Standardization: Geneva, Switzerland, 2018.
  36. ISO 19650-2:2018; Organization and Digitization of Information about Buildings and Civil Engineering Works, Including Building Information Modelling (BIM)—Information Management Using Building Information Modelling—Part 2: Delivery Phase of the Assets. International Organization for Standardization: Geneva, Switzerland, 2018.
  37. GB/T 51366-2019; Standard for Building Carbon Emission Calculation. National Standard of the People’s Republic of China. Standards Press of China: Beijing, China, 2019.
  38. Pergamenshchik, B.; Undozjorov, V. A model of the labor productivity dependence on workforce density. E3S Web Conf. 2019, 97, 06020. [Google Scholar] [CrossRef]
  39. Metro Vancouver. Demolition, Land Clearing and Construction Waste Management Toolkit. Retrieved from Vancouver, Canada. 2008. Available online: https://www.vrca.ca/wp-content/uploads/DemolitConstructWasteToolkit.pdf (accessed on 7 January 2024).
  40. Mália, M.; De Brito, J.; Pinheiro, M.D.; Bravo, M. Construction and demolition waste indicators. Waste Manag. Res. 2013, 31, 241–255. [Google Scholar] [CrossRef]
  41. Bergsdal, H.; Bohne, R.A.; Brattebø, H. Projection of Construction and Demolition Waste in Norway. J. Ind. Ecol. 2008, 11, 27–39. [Google Scholar] [CrossRef]
  42. Hoang, N.H.; Ishigaki, T.; Kubota, R.; Tong, T.K.; Nguyen, T.T.; Nguyen, H.G.; Yamada, M.; Kawamoto, K. Waste Generation, Composition, and Handling in Building-Related Construction and Demolition in Hanoi, Vietnam. Waste Manag. 2020, 117, 32–41. [Google Scholar] [CrossRef]
  43. Mah, C.M.; Fujiwara, T.; Ho, C.S. Construction and demolition waste generation rates for high-rise buildings in Malaysia. Waste Manag. Res. 2016, 34, 1224–1230. [Google Scholar] [CrossRef] [PubMed]
Figure 1. The research framework of this study.
Sustainability 16 00656 g001
Figure 2. The BIM-LC practice methods implemented in this project. The numbers in Figure 2c represent the ’Schematic sequence of disassembly for partial structural components’.
Sustainability 16 00656 g002aSustainability 16 00656 g002bSustainability 16 00656 g002c
Figure 3. Case study basic information.
Sustainability 16 00656 g003
Figure 4. CRP process on-site records.
Sustainability 16 00656 g004aSustainability 16 00656 g004b
Figure 5. (a) An APP operation interface displays the tracking management of the components at different stages; (b) Web-platform operation interface; (c) The QR code on the surface of the component. In Figure 5c, the red boxes in the figure highlight the QR codes on each external wall panel component. These QR codes serve as information carriers for comprehensive tracking and management throughout the process.
Sustainability 16 00656 g005
Figure 6. The current-state map and future-state map of the disassembly stage.
Sustainability 16 00656 g006
Figure 7. (a) The construction efficiency and productivity under the two models; (b) Actual plan deviation and duration. In Figure 7b, the upward green arrows indicate delays in completion compared to the plan, while the downward red arrows indicate completion ahead of schedule. ‘+number’ represents the number of days delayed, and ‘−number’ represents the number of days completed ahead of schedule.
Sustainability 16 00656 g007
Figure 8. (a) Distribution of carbon emissions from the labor, machinery, and construction materials; (b) Proportion of carbon emissions in different stages; (c) Construction waste composition analysis.
Sustainability 16 00656 g008
Table 1. Summary of BIM-LC Case Studies.
BIM and LC Tool Benefits and ResultBuilding Type and
Building Lifecycle
Case
Location
Reference
BIMLC

LPS
Reduced time overrun rate/Improved plan completion/Identification and assessment of risk factorsIndustrial project/
Construction stage
Egypt[21]
√VSM/JIT/
TPM
Reduced energy consumption and CO2 emissions Prefabricated steel frames/
Production, transportation, and erection stage
Tehran, Iran[22]

JIT
Minimized resource waste from transport and assembly waitPrecast construction/
Transportation and assembly stage
Hong Kong, China[23]
Promotion of effective component reuse and enhanced material recyclingVirtualized project
design/Construction/End-of-life
Luxembourg[32]
Reduced design time and construction resource wasteUniversity administration Building
Design/Construction
Saudi Arabia[33]

LPS/TPS/Kaizen
Improved productivity and reduced wasteVirtualized project design/
Construction stage
United Arab Emirates[16]
Lean implementation enhances BIM maturity levelsHealth facility/
Construction stage
Tennessee,
U.S.A.
[24]
Current LC and BIM literature falls shortSmall and medium-sized
enterprises (SMEs)/Construction stage
UK[26]
Improved design process by eliminating waste and creating value.KTP (Knowledge Transfer Partnership) project/
Design phase
UK[29]

LPS
Construction simulation and 3-D visualization supports lean implementation.Concrete construction project/Construction stage-[30]
Table 2. Construction obstacles and solutions during the project execution.
ActivitiesOn-Site Main ResistanceOn-Site Record Solution and Improvement
Disassembly Stage—Sandwich wallboard work: Design weaknesses were observed to affect the reconstruction process, such as no lifting points, insufficient structural stiffness, lifting posture not controlled, etc.
—Precast roof unit work: Observations on the disassembly sequence of the roof panel unit.
—Delay in the supply of component-protection materials.
Sustainability 16 00656 i001
Sustainability 16 00656 i002
—Problems were solved on the field (Sipailou).
—Record and communicate with the reconstruction team to optimize the reconstruction plan.
—Expect more problems at the construction site during the project start.
Transportation Stage—Core: The size of the support elements at the bottom of the core cylinder did not meet the transportation standards.
—Precast roof unit: The steel frame elements of the precast roof unit flexed and deformed, resulting in a larger loading space than planned.
—Structural component system: Problems such as irregularities and spatial dislocations will inevitably occur during the placement of steel components (Crane driver proficiency, worker field auxiliary capability, component size or their joint, etc.)
—Delay in the logistics supply.
Sustainability 16 00656 i003
Sustainability 16 00656 i004
Sustainability 16 00656 i005
—On-site cutting of the over-width part of the steel according to the transportation requirements, making it within the safe transportation range.
—Propose dynamic transportation planning adjustments for Just-In-Time (JIT) strategies for on-site loading conditions.
—Logistics supply has improved via deeper communication.
Reconstruction Stage—Delay in materials supply.
—Rain affected the outdoor construction work.
—There were some worker errors during the operation.
—Minor design errors were discovered.
Sustainability 16 00656 i006—Slight improvement in material supply.
—Improve crew skills via Lean knowledge training and daily meetings.
—Work with the construction manager to refine the design and reduce minor errors.
Disclaimer/Publisher’s Note: The statements, opinions and data contained in all publications are solely those of the individual author(s) and contributor(s) and not of MDPI and/or the editor(s). MDPI and/or the editor(s) disclaim responsibility for any injury to people or property resulting from any ideas, methods, instructions or products referred to in the content.

