
Evaluating the Influence of Urban Blocks on Air Pollution Concentration Levels: The Case Study of Golden Lane Estate in London


Abstract
1. Introduction
2. Aims and Objectives
- 1.
- To measure and monitor the impact of green infrastructure (GI) and building arrangements on the concentration and dispersion of air pollutants (specifically, PM2.5, PM10, and NO2).
- 2.
- To assess and better understand the relationship between the dispersion of air pollutants (PM2.5, PM10, and NO2) and meteorological parameters, such as air temperature, relative humidity, and wind velocity, thereby providing detailed insights into the complex nature of the air quality dynamics in the study area.
3. Methodology
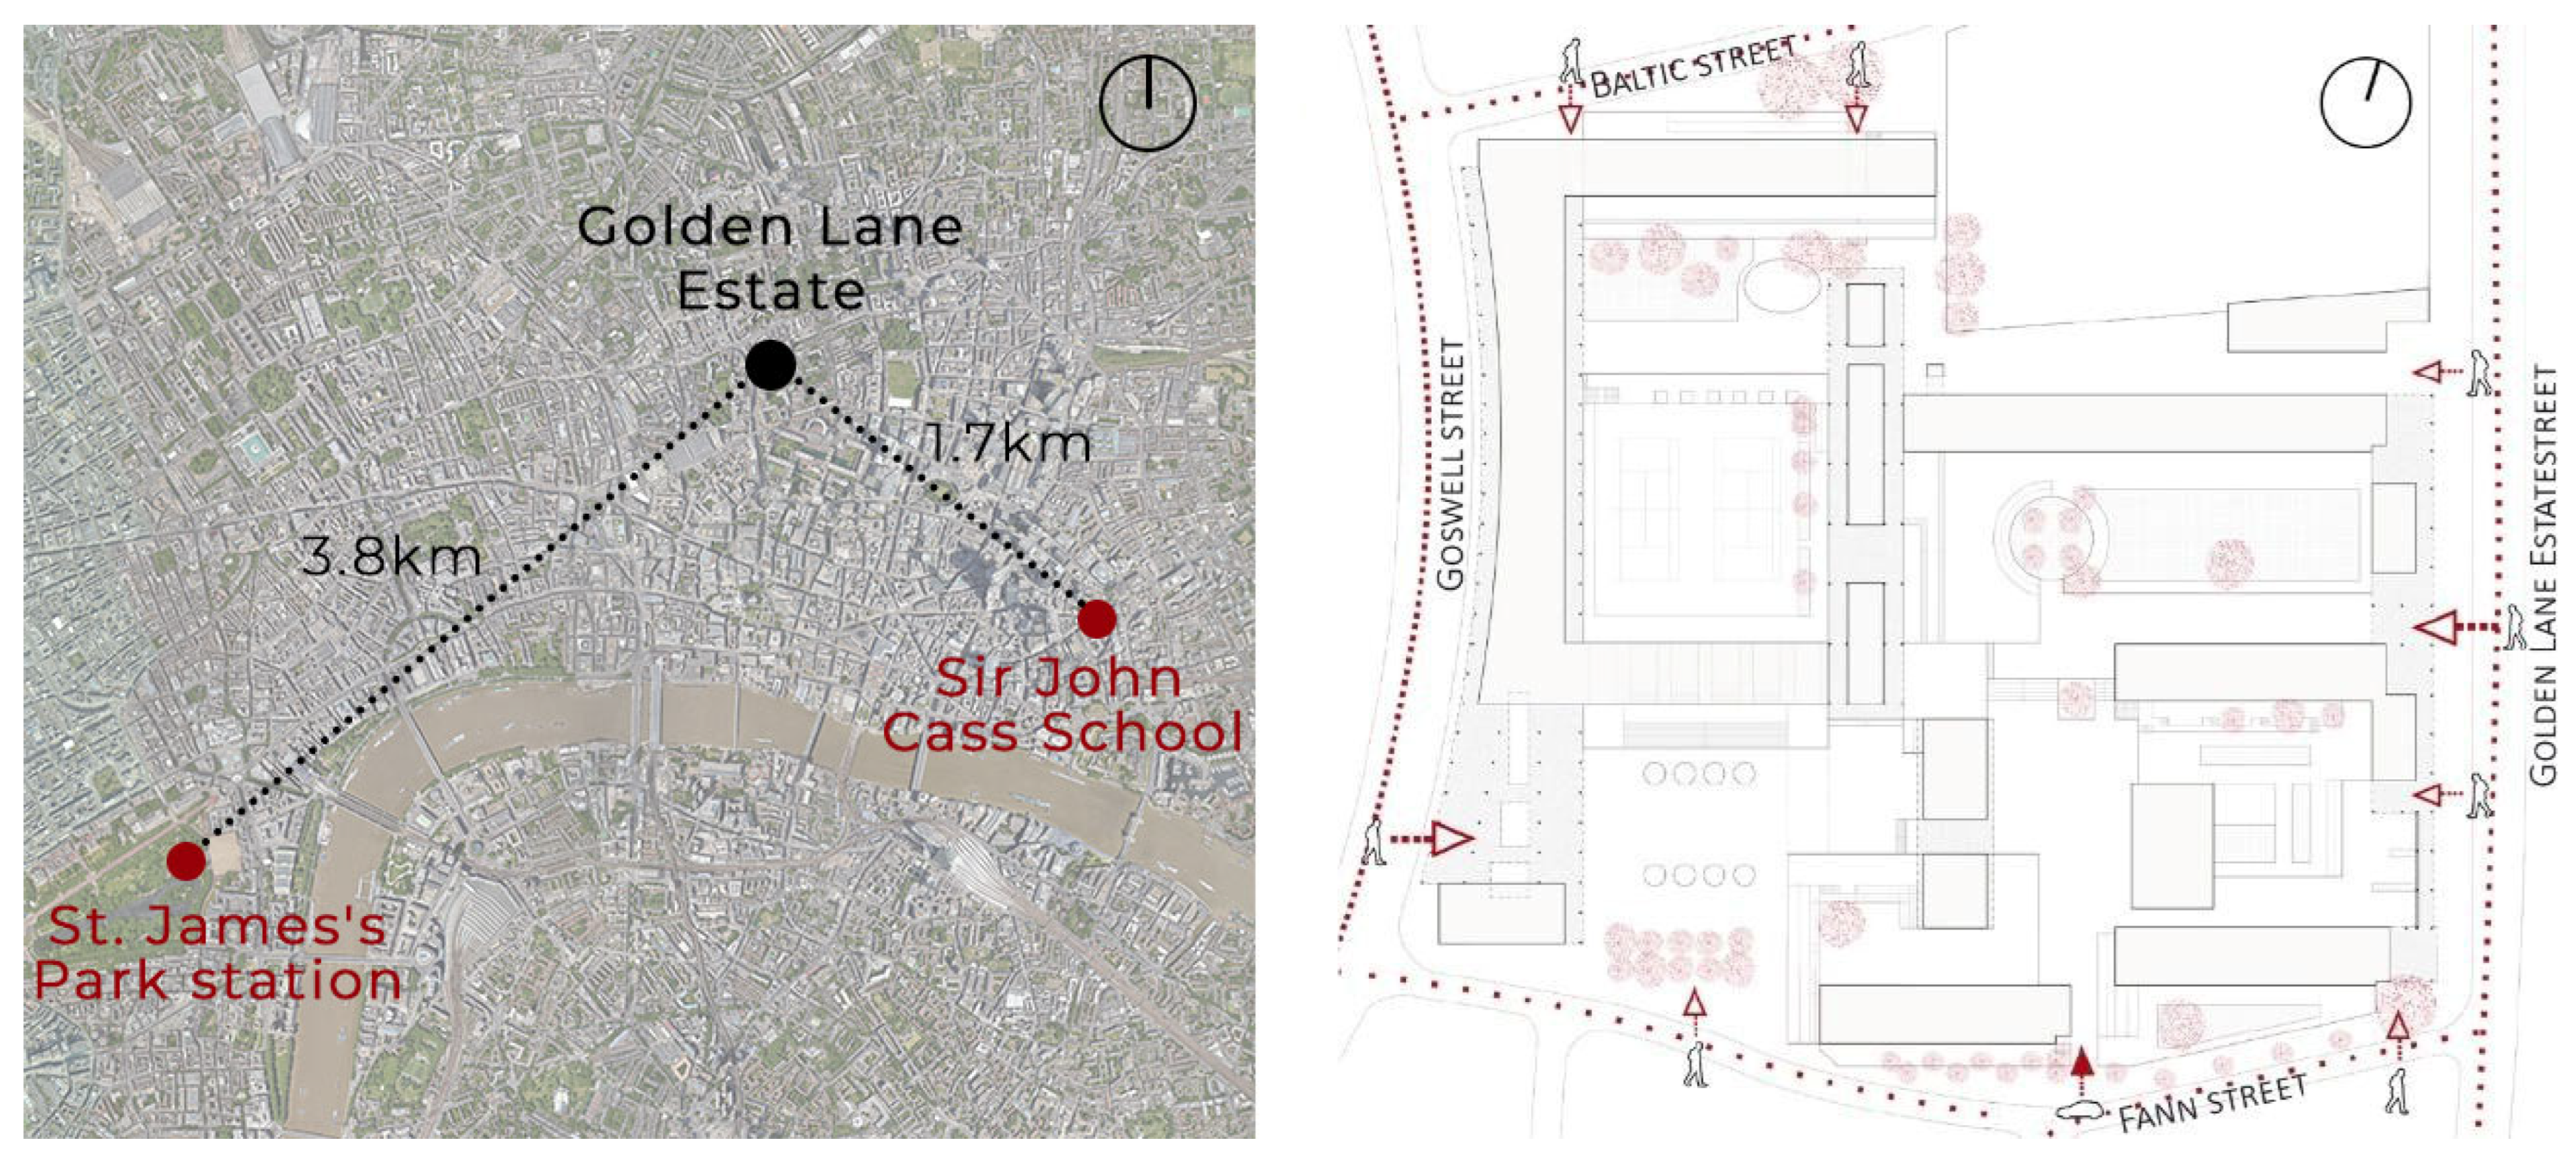
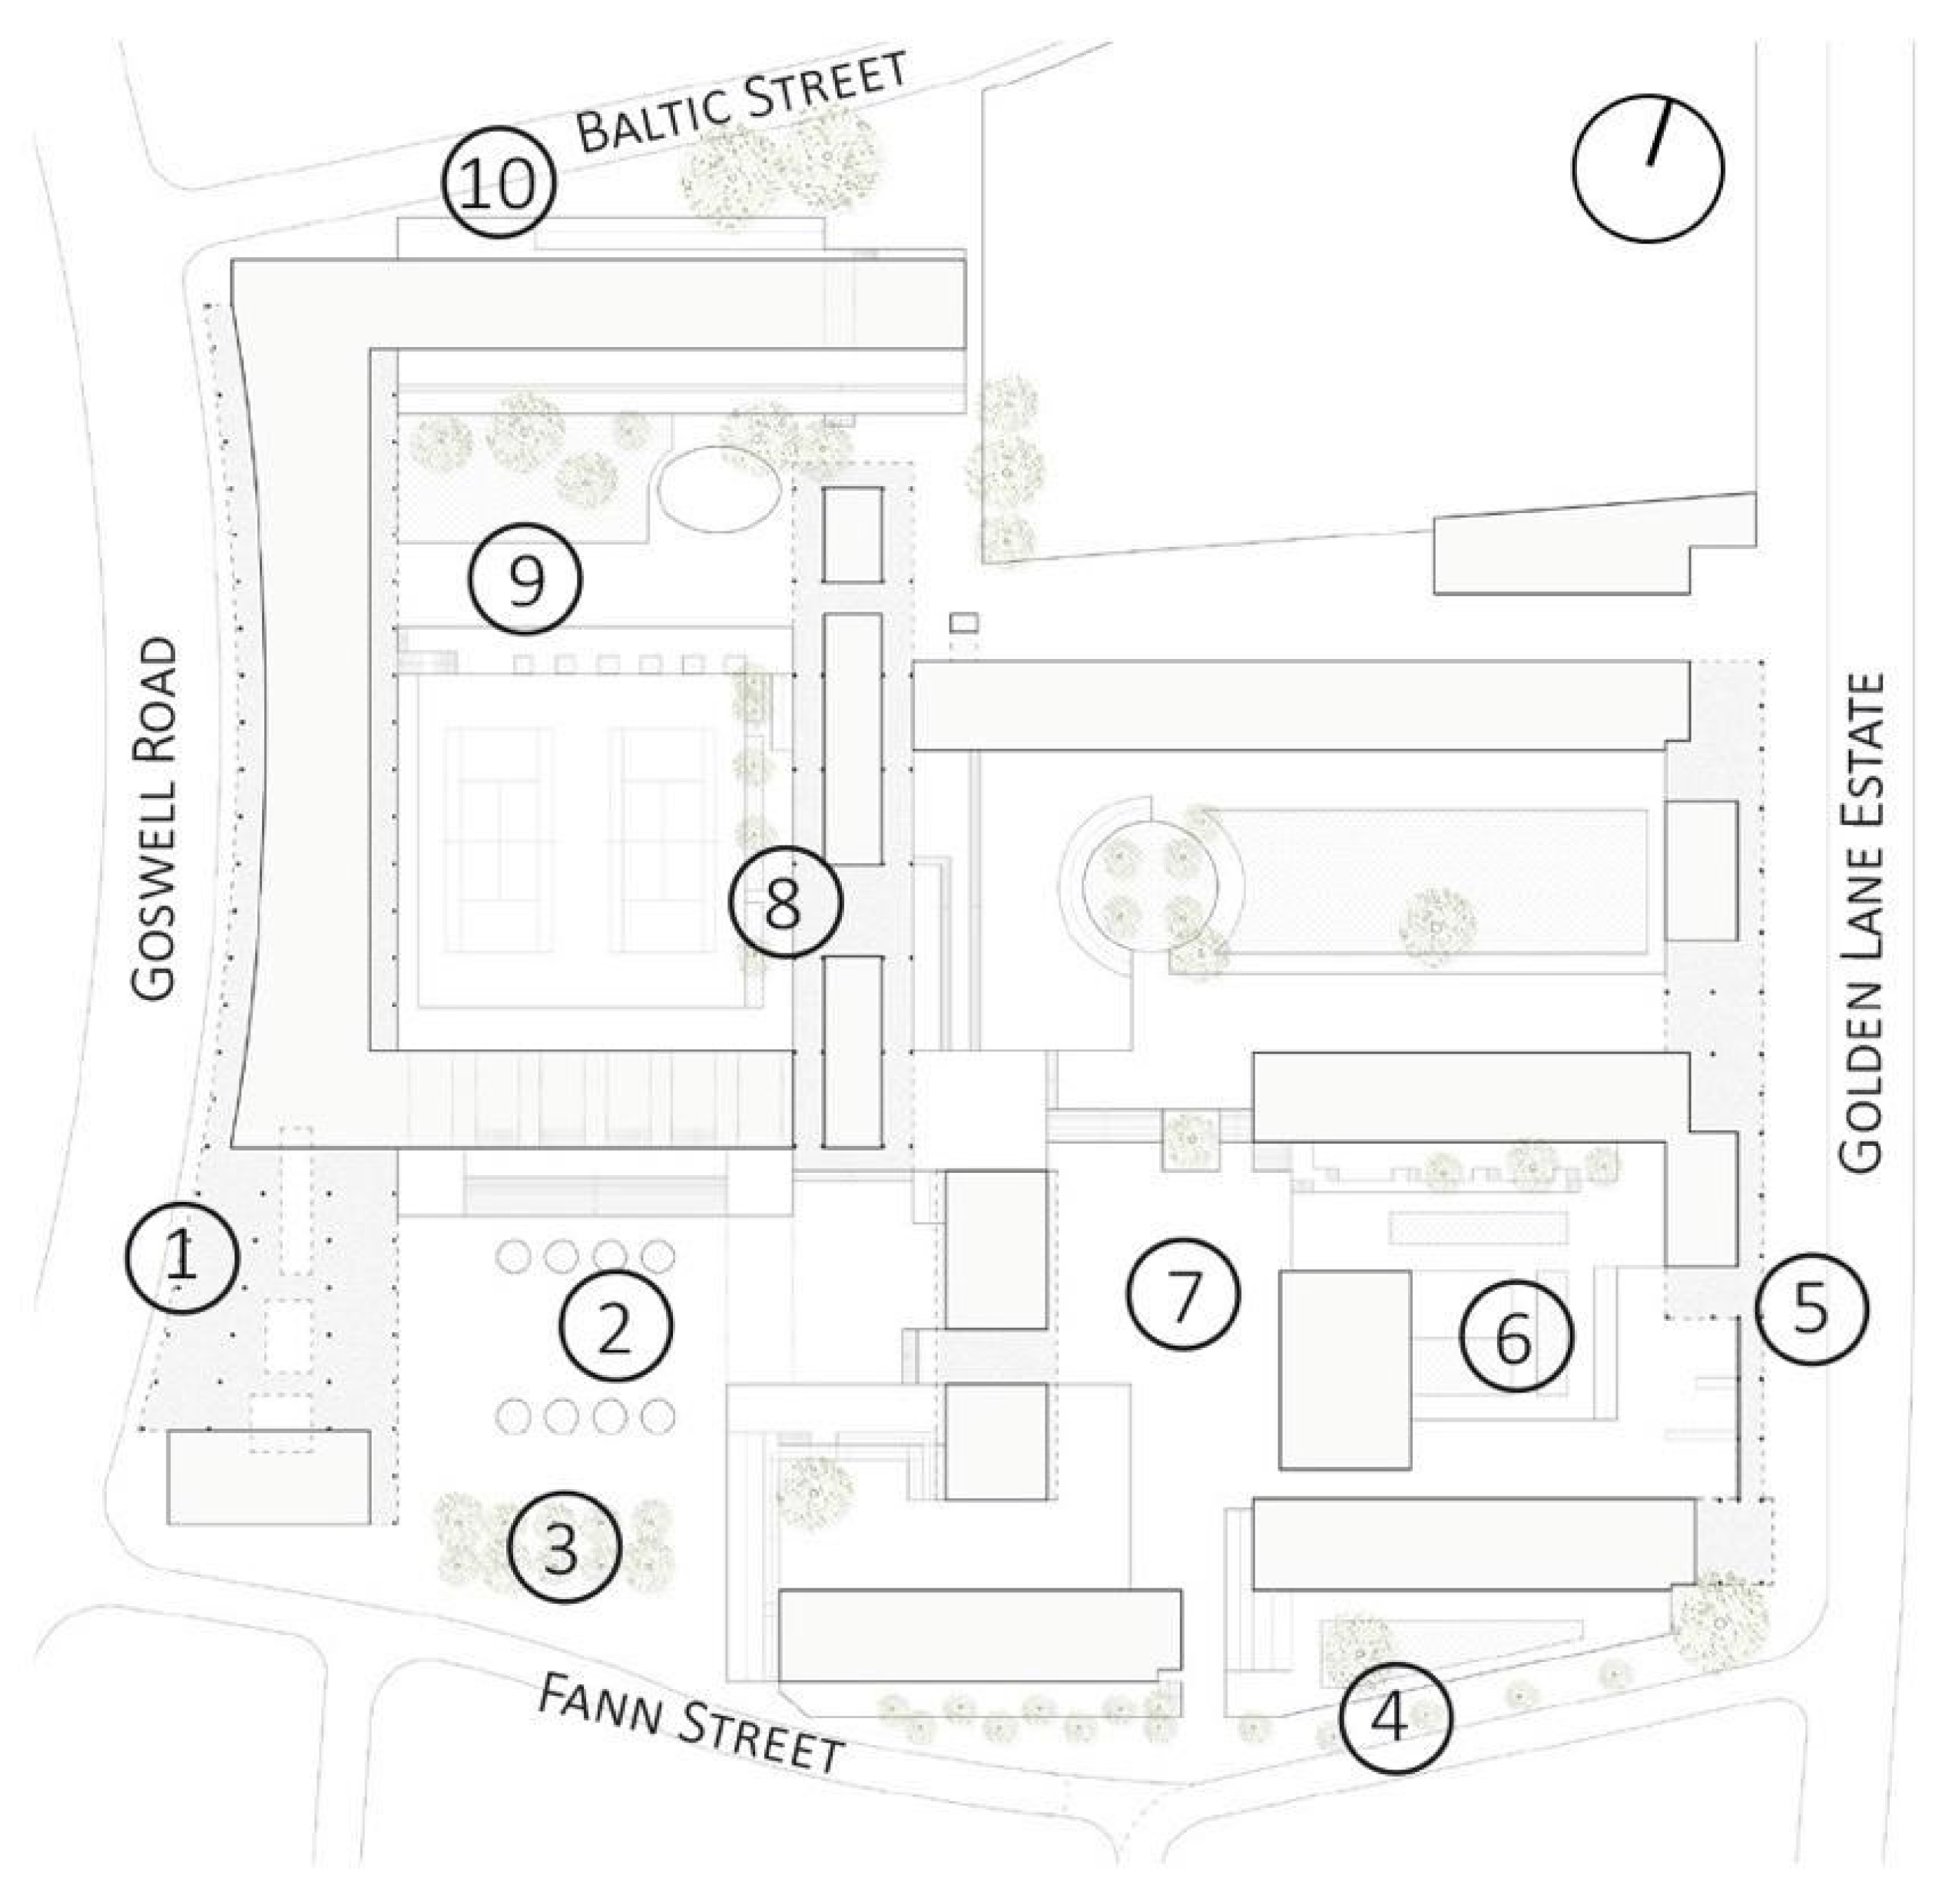
3.1. Case Study Selection and Description: Golden Lane Estate
3.2. Fieldwork: On-Site Spot Measurements
- -
- Single values were recorded for air temperature (°C) and relative humidity (%);
- -
- Minimum and maximum values were recorded in a 3 min interval for wind speed (m/s);
- -
- Average values were recorded for PM2.5, PM10, and NO2 (μg/m3);
- -
3.3. Computer Modelling and Simulation Configuration
4. Results
4.1. Air Temperature (°C)
4.2. Relative Humidity (%)
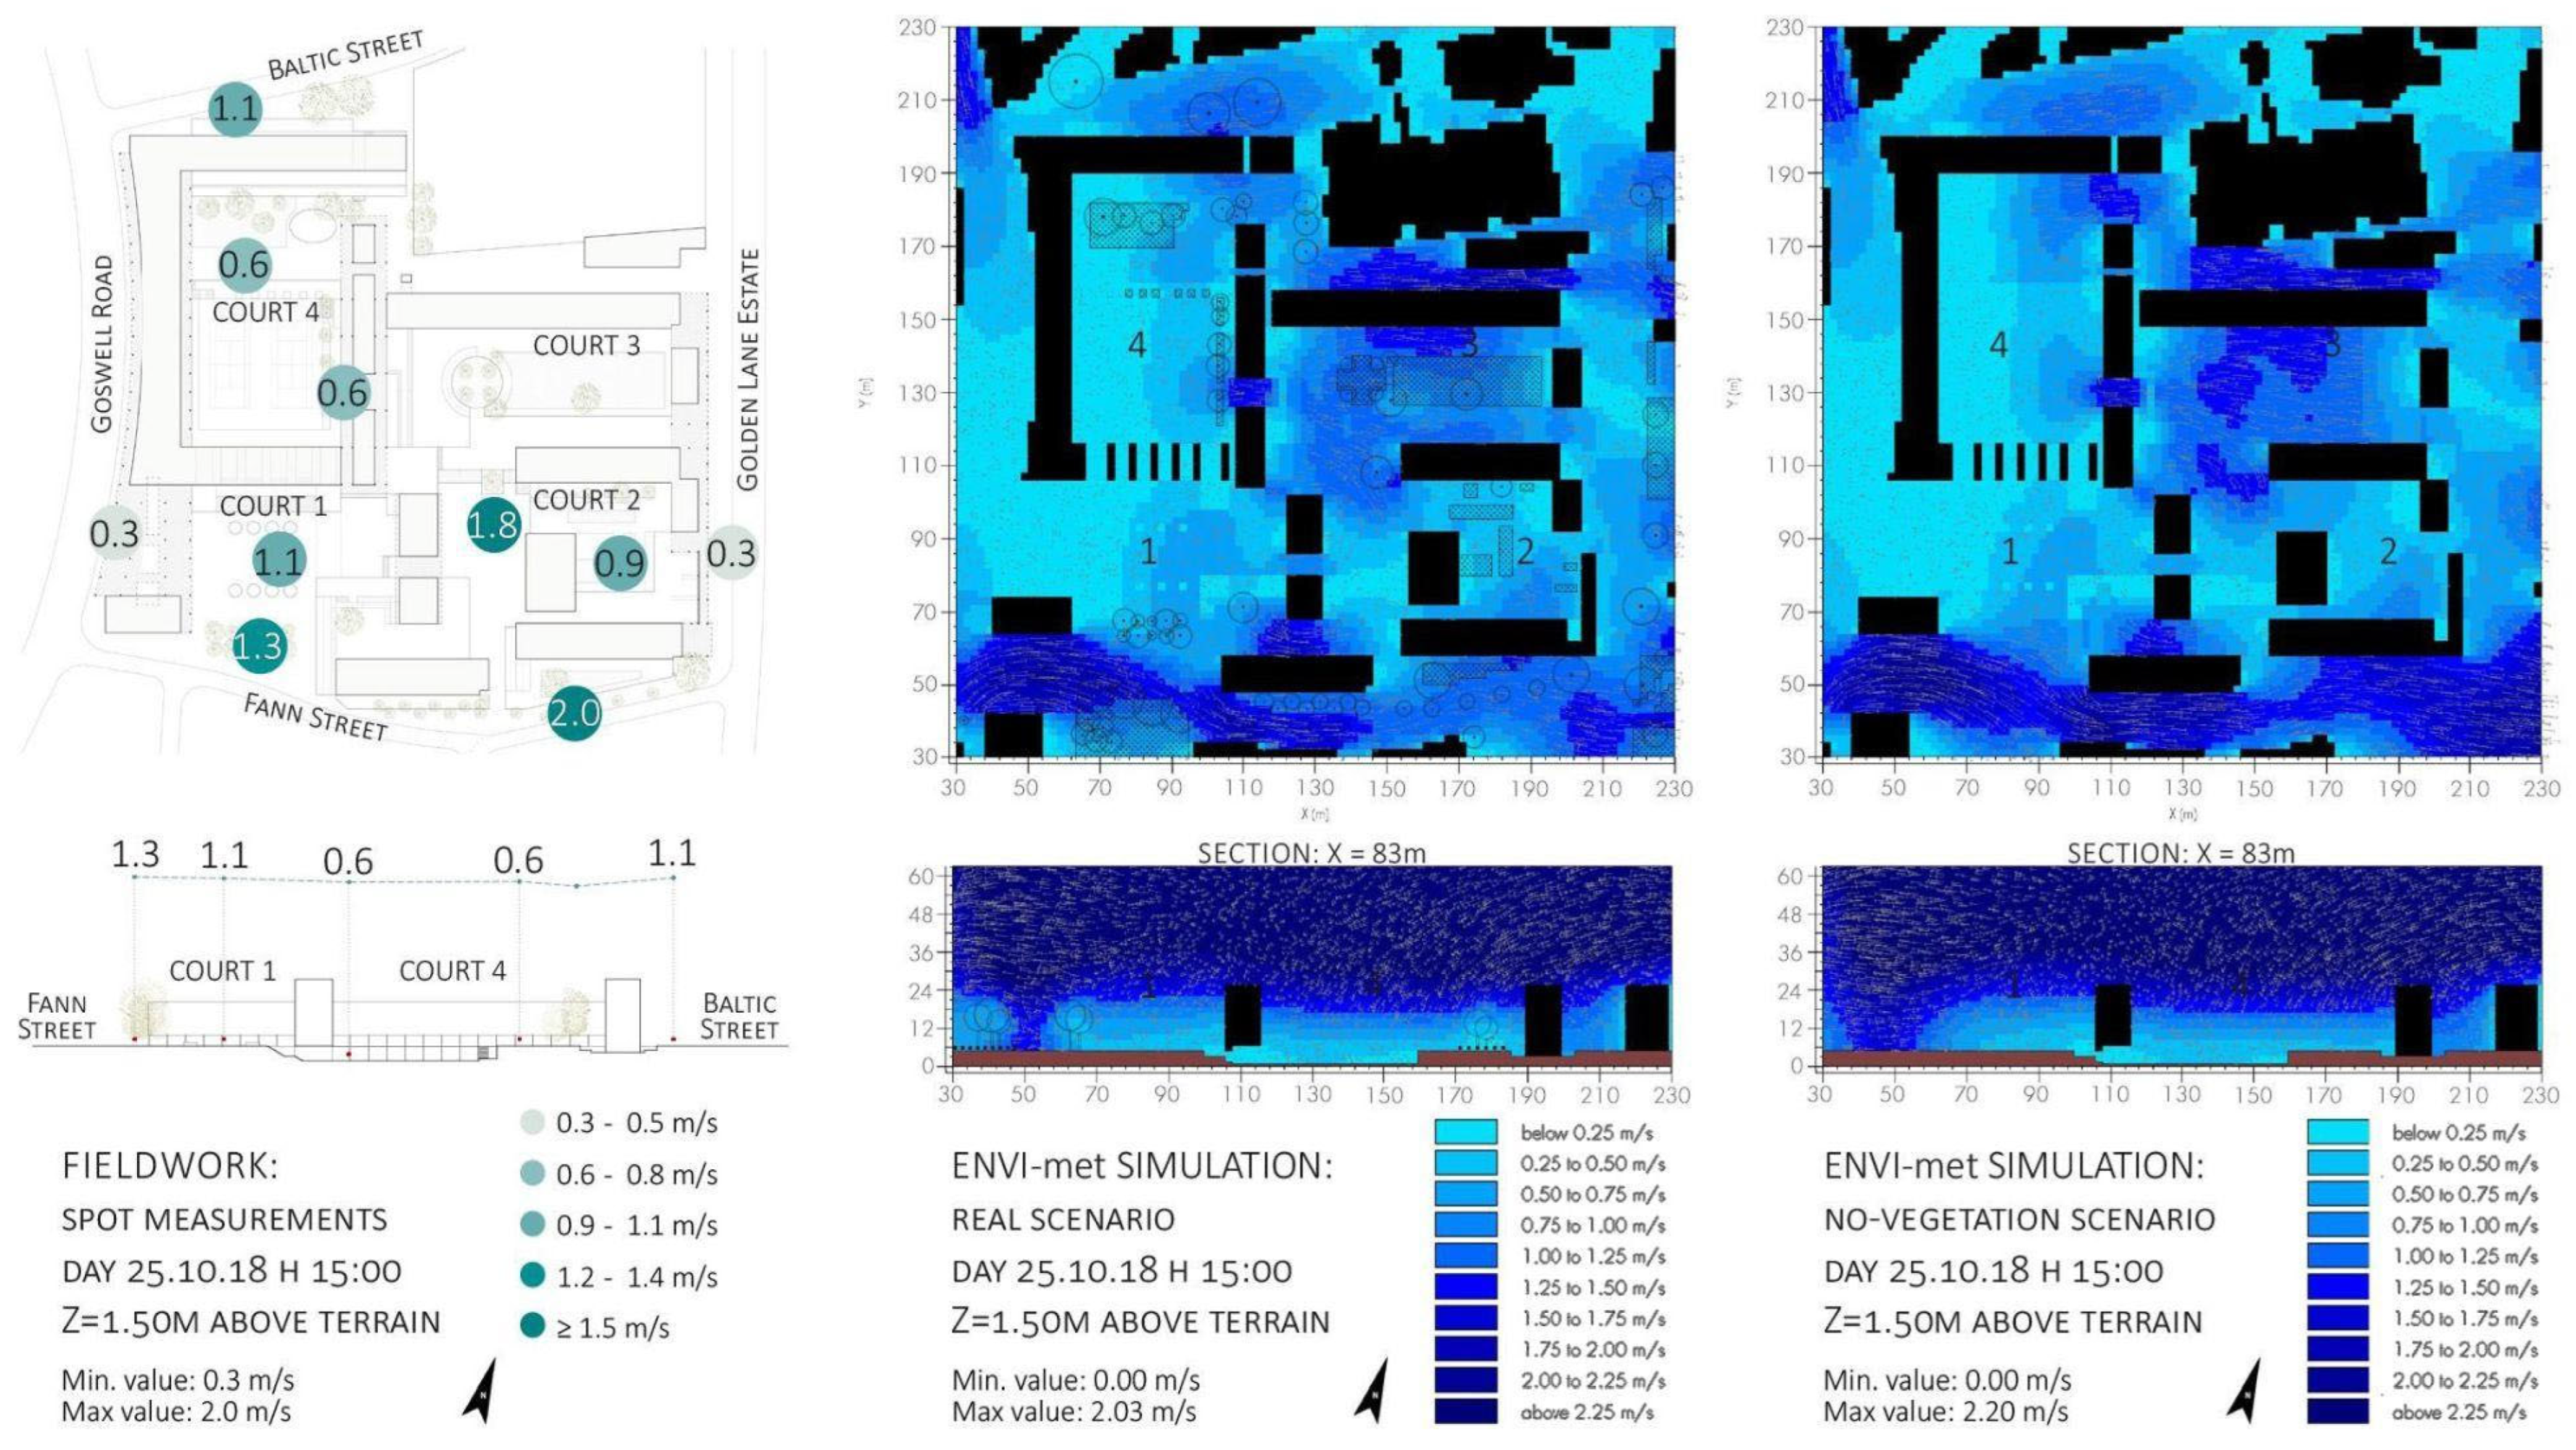
4.3. Wind Velocity (m/s)
4.4. NO2 Concentration (μg/m3)
4.5. PM2.5 and PM10 Concentration (μg/m3)
5. Discussion
6. Conclusions
Author Contributions
Funding
Institutional Review Board Statement
Informed Consent Statement
Data Availability Statement
Acknowledgments
Conflicts of Interest
References
- European Commission. Recovery Plan for Europe. 2021. Available online: https://commission.europa.eu/strategy-and-policy/recovery-plan-europe_en (accessed on 8 July 2023).
- Amaral, A.R.; Rodrigues, E.; Rodrigues Gaspar, A.; Gomes, Á. Review on performance aspects of nearly zero-energy districts. Sustain. Cities Soc. 2018, 43, 406–420. [Google Scholar] [CrossRef]
- Cheng, C.; Albert-Seifried, V.; Aelenei, L.; Vandevyvere, H.; Seco, S.; Sánchez, M.N.; Hukkalainen, M. A systematic approach towards mapping stakeholders in different phases of PED development—Extending the PED toolbox. In Sustainability in Energy and Buildings 2021; Littlewood, J.R., Howlett, R.J., Jain, L.C., Eds.; Smart Innovation, Systems and Technologies; Springer: Singapore, 2022; Volume 263, pp. 447–463. [Google Scholar] [CrossRef]
- Olivadese, R.; Alpagut, B.; Revilla, B.P.; Brouwer, J.; Georgiadou, V.; Woestenburg, A.; van Wees, M. Towards Energy Citizenship for a Just and Inclusive Transition: Lessons Learned on Collaborative Approach of Positive Energy Districts from the EU Horizon2020 Smart Cities and Communities Projects. Proceedings 2021, 65, 20. [Google Scholar] [CrossRef]
- World Health Organization (WHO). 9 Out of 10 People Worldwide Breathe Polluted Air, but More Countries Are Taking Action. 2018. Available online: https://www.who.int/news/item/02-05-2018-9-out-of-10-people-worldwide-breathe-polluted-air-but-more-countries-are-taking-action (accessed on 7 May 2022).
- World Health Organization. WHO’s First Global Conference on Air Pollution and Health. 2018. Available online: https://www.who.int/news-room/events/detail/2018/10/30/default-calendar/who-s-first-global-conference-on-air-pollution-and-health (accessed on 13 February 2020).
- Hedman, Å.; Rehman, H.U.; Gabaldón, A.; Bisello, A.; Albert-Seifried, V.; Zhang, X.; Guarino, F.; Grynning, S.; Eicker, U.; Neumann, H.M.; et al. IEA EBC Annex83 positive energy districts. Buildings 2021, 11, 130. [Google Scholar] [CrossRef]
- Sareen, S.; Albert-Seifried, V.; Aelenei, L.; Reda, F.; Etminan, G.; Andreucci, M.B.; Kuzmic, M.; Maas, N.; Seco, O.; Civiero, P.; et al. Ten questions concerning positive energy districts. Build. Environ. 2022, 216, 109017. [Google Scholar] [CrossRef]
- Tuerk, A.; Frieden, D.; Neumann, C.; Latanis, K.; Tsitsanis, A.; Kousouris, S.; Llorente, J.; Heimonen, I.; Reda, F.; Ala-Juusela, M.; et al. Integrating plus energy buildings and districts with the eu energy community framework: Regulatory opportunities, barriers and technological solutions. Buildings 2021, 11, 468. [Google Scholar] [CrossRef]
- COST Action ‘PED-EU-NET’. PED Database. Available online: https://pedeu.net/map/ (accessed on 15 November 2023).
- European Environment Agency (EEA). Ηow Air Pollution Affects Our Health. 2023. Available online: https://www.eea.europa.eu/en/topics/in-depth/air-pollution/eow-it-affects-our-health#:~:text=Both%20short%2D%20and%20long%2Dterm,asthma%20and%20lower%20respiratory%20infections (accessed on 15 November 2023).
- EEA Report. Unequal Exposure and Unequal Impacts: Social Vulnerability to Air Pollution, Noise and Extreme Temperatures in Europe. 2018. Available online: https://www.eea.europa.eu/publications/unequal-exposure-and-unequal-impacts (accessed on 15 November 2023).
- Yang, J.; Shi, B.; Zheng, Y.; Shi, Y.; Xia, G. Urban form and air pollution disperse: Key indexes and mitigation strategies. Sustain. Cities Soc. 2020, 57, 101955. [Google Scholar] [CrossRef]
- Viecco, M.; Jorquera, H.; Sharma, A.; Bustamante, W.; Fernando, H.J.S.; Vera, S. Green roofs and green walls layouts for improved urban air quality by mitigating particulate matter. Build. Environ. 2021, 204, 108120. [Google Scholar] [CrossRef]
- Baradaran Motie, M.; Yeganeh, M.; Bemanian, M. Assessment of greenery in urban canyons to enhance thermal comfort & air quality in an integrated seasonal model. Appl. Geogr. 2023, 151, 102861. [Google Scholar] [CrossRef]
- Baek, J.I.; Ban, Y.U. The Impacts of Urban Air Pollution Emission Density on Air Pollutant Concentration Based on a Panel Model. Sustainability 2020, 12, 8401. [Google Scholar] [CrossRef]
- Buccolieri, R.; Santiago, J.-L.; Rivas, E.; Sáanchez, B. Reprint of: Review on urban tree modelling in CFD simulations: Aerodynamic, deposition and thermal effects. Urban For. Urban Green. 2018, 37, 56–64. [Google Scholar] [CrossRef]
- Cardelino, C.A.; Chameides, W.L. Natural hydrocarbons, urbanization, and urban ozone. J. Geophys. Res. 1990, 95, 13971–13979. [Google Scholar] [CrossRef]
- Berardi, U.; GhaffarianHoseini, A.; GhaffarianHoseini, A. State-of-the-art analysis of the environmental benefits of green roofs. Appl. Energy 2014, 115, 411–428. [Google Scholar] [CrossRef]
- Taha, H. Modeling impacts of increased urban vegetation on ozone air quality in the South Coast Air Basin. Atmos. Environ. 1996, 30, 3423–3430. [Google Scholar] [CrossRef]
- Abhijith, K.; Gokhale, S. Passive control potentials of trees and on-street parked cars in reduction of air pollution exposure in urban street canyons. Environ. Pollut. 2015, 204, 99–108. [Google Scholar] [CrossRef] [PubMed]
- Amorim, J.; Rodrigues, V.; Tavares, R.; Valente, J.; Borrego, C. CFD modelling of the aerodynamic effect of trees on urban air pollution dispersion. Sci. Total Environ. 2013, 461–462, 541–551. [Google Scholar] [CrossRef] [PubMed]
- CLAIRO Project. Green Infrastructure and Its Effect on Air Quality. Methodology of Planting Greenery in Urban Areas in Order to Capture Pollution. 2022. Available online: https://uia-initiative.eu/sites/default/files/2022-04/CLAIRO_Methodology_ENG.pdf (accessed on 15 November 2023).
- Wang, Y.; Akbari, H. The effects of street tree planting on Urban Heat Island mitigation in Montreal. Sustain. Cities Soc. 2016, 27, 122–128. [Google Scholar] [CrossRef]
- Loughner, C.P.; Allen, D.J.; Zhang, D.L.; Pickering, K.E.; Dickerson, R.R.; Landry, L. Roles of urban tree canopy and buildings in urban heat island effects: Parameterization and preliminary results. J. Appl. Meteorol. Climatol. 2012, 51, 1775–1793. [Google Scholar] [CrossRef]
- Duarte, D.H.S.; Shinzato, P.; Gusson, C.d.S.; Alves, C.A. The impact of vegetation on urban microclimate to counterbalance built density in a subtropical changing climate. Urban Clim. 2015, 14, 224–239. [Google Scholar] [CrossRef]
- Livesley, S.J.; McPherson, E.G.; Calfapietra, C. The Urban Forest and Ecosystem Services: Impacts on Urban Water, Heat, and Pollution Cycles at the Tree, Street, and City Scale. J. Environ. Qual. 2016, 45, 119–124. [Google Scholar] [CrossRef]
- Bach, W. Urban Climate, Air Pollution and Planning. In Urbanization and Environment: The Physical Geography of the City; Detwyler, T.R., Marcus, M.G., Eds.; Duxbury Press: North Scituate, MA, USA; pp. 69–96.
- Huang, J.Y.; Black, T.A.; Jassal, R.S.; Lavkulich, L.M.L. Modelling rainfall interception by urban trees. Can. Water Resour. J. 2017, 42, 336–348. [Google Scholar] [CrossRef]
- Li, W.C.; Yeung, K.K.A. A comprehensive study of green roof performance from environmental perspective. Int. J. Sustain. Built Environ. 2014, 3, 127–134. [Google Scholar] [CrossRef]
- Castiglia Feitosa, R.; Wilkinson, S.J. Attenuating heat stress through green roof and green wall retrofit. Build. Environ. 2018, 140, 11–22. [Google Scholar] [CrossRef]
- Wong, N.H.; Cheong, D.K.W.; Yan, H.; Soh, J.; Ong, C.L.; Sia, A. The effects of rooftop garden on energy consumption of a commercial building in Singapore. Energy Build. 2003, 35, 353–364. [Google Scholar] [CrossRef]
- Jaffal, I.; Ouldboukhitine, S.E.; Belarbi, R. A comprehensive study of the impact of green roofs on building energy performance. Renew. Energy 2012, 43, 157–164. [Google Scholar] [CrossRef]
- Wong, N.H.; Kwang Tan, A.Y.; Chen, Y.; Sekar, K.; Tan, P.Y.; Chan, D.; Chiang, K.; Wong, N.C. Thermal evaluation of vertical greenery systems for building walls. Build. Environ. 2010, 45, 663–672. [Google Scholar] [CrossRef]
- Azkorra, Z.; Pérez, G.; Coma, J.; Cabeza, L.F.; Bures, S.; Álvaro, J.E.; Erkoreka, A.; Urrestarazu, M. Evaluation of green walls as a passive acoustic insulation system for buildings. Appl. Acoust. 2015, 89, 46–56. [Google Scholar] [CrossRef]
- Van Renterghem, T.; Hornikx, M.; Forssen, J.; Botteldooren, D. The potential of building envelope greening to achieve quietness. Build. Environ. 2013, 61, 34–44. [Google Scholar] [CrossRef]
- Othman, N.; Mohamed, N.; Ariffin, M.H. Landscape Aesthetic Values and Visiting Performance in Natural Outdoor Environment. Procedia Soc. Behav. Sci. 2015, 202, 330–339. [Google Scholar] [CrossRef]
- Zhou, X.; Rana, M.M.P. Social benefits of urban green space: A conceptual framework of valuation and accessibility measurements. Manag. Environ. Qual. 2012, 23, 173–189. [Google Scholar] [CrossRef]
- Oke, T.R. Canyon geometry and the nocturnal heat island: Comparison of scale model and field observations. J. Climatol. 1981, 29, 237–254. [Google Scholar] [CrossRef]
- Givoni, B. Climate Considerations in Buildings and Urban Design; Van Nostrand Reinhold: New York, NY, USA, 1998. [Google Scholar]
- Santamouris, M. Environmental Planning in Urban Areas. Generalisation based on least squared adjustments. Proc. Int. Arch. Photogramm. Remote Sens. 2000, 931–938. [Google Scholar]
- Cole, R.J. Designing High-Density Cities. In Designing High-Density Cities for Social and Environmental Sustainability; Ng, E., Ed.; Routledge: London, UK, 2009. [Google Scholar]
- Edussuriya, P.; Chan, A.; Ye, A. Urban morphology and air quality in dense residential environments in Hong Kong. Part I: District-level analysis. Atmos. Environ. 2011, 45, 4789–4803. [Google Scholar] [CrossRef]
- Ren, C.; Ng, E.Y.Y.; Katzschner, L. Urban climatic map studies: A review. Int. J. Climatol. 2011, 31, 2213–2233. [Google Scholar] [CrossRef]
- Ng, E.; Chen, L.; Wang, Y.; Yuan, C. A study on the cooling effects of greening in a high-density city: An experience from Hong Kong. Build. Environ. 2012, 47, 256–271. [Google Scholar] [CrossRef]
- Chatzidimitriou, A.; Yannas, S. Street canyon design and improvement potential for urban open spaces; the influence of canyon aspect ratio and orientation on microclimate and outdoor comfort. Sustain. Cities Soc. 2017, 33, 85–101. [Google Scholar] [CrossRef]
- Jeanjean, A.; Buccolieri, R.; Eddy, J.; Monks, P.; Leigh, R. Air quality affected by trees in real street canyons: The case of Marylebone neighbourhood in central London. Urban For. Urban Green. 2017, 22, 41–53. [Google Scholar] [CrossRef]
- Kazmierczak, A.; James, P. The Role of Urban Green Spaces in Improving Social Inclusion. In Proceedings of the 7th International Postgraduate Research Conference in the Built and Human Environment, Greater Manchester, UK, 28–29 March 2007. [Google Scholar]
- Buccolieri, R.; Gao, Z.; Gatto, E.; Rui, L.; Ding, W. Study of the effect of green quantity and structure on thermal comfort and air quality in an urban-like residential district by ENVI-met modelling. Build. Simul. 2018, 12, 183–194. [Google Scholar] [CrossRef]
- Mandal, M.; Popek, R.; Przybysz, A.; Roy, A.; Das, S.; Sarkar, A. Breathing Fresh Air in the City: Implementing Avenue Trees as a Sustainable Solution to Reduce Particulate Pollution in Urban Agglomerations. Plants 2023, 12, 1545. [Google Scholar] [CrossRef]
- Hinds, W.C. Aerosol Technology: Properties, Behavior, and Measurement of Airborne Particles (Second ed.). 1999. Available online: http://library.navoiy-uni.uz/files/hinds%20w.c.%20-%20aerosol%20technology-%20properties,%20behavior,%20and%20measurement%20of%20airborne%20particles%20(2nd%20edition)(1999)(504s).pdf (accessed on 15 July 2023).
- Petroff, A.; Mailliat, A.; Amielh, M.; Anselmet, F. Aerosol dry deposition on vegetative canopies. Part I: Review of present knowledge. Atmos. Environ. 2008, 42, 3625–3653. [Google Scholar] [CrossRef]
- Nowak, D.J.; Crane, D.E. The Urban Forest Effects (UFORE) Model: Quantifying Urban Forest Structure and Functions. For. Service. 2000, 8, 714–720. [Google Scholar]
- Barwise, Y.; Kumar, P. Designing vegetation barriers for urban air pollution abatement: A practical review for appropriate plant species selection. NPJ Clim. Atmos. Sci. 2020, 3, 12. [Google Scholar] [CrossRef]
- Nowak, D.J.; Crane, D.E.; Stevens, J.C.; Ibarra, M. Brooklyn’s Urban Forest. United States Department of Agriculture. 2002; 107. Available online: https://www.fs.usda.gov/ne/newtown_square/publications/technical_reports/pdfs/2002/gtrne290.pdf (accessed on 15 July 2023).
- Tallis, M.; Taylor, G.; Sinnett, D.; Freer-Smith, P. Estimating the removal of atmospheric particulate pollution by the urban tree canopy of London, under current and future environments. Landsc. Urban Plan. 2011, 103, 129–138. [Google Scholar] [CrossRef]
- Vos, P.E.J.; Maiheu, B.; Vankerkom, J.; Janssen, S. Improving local air quality in cities: To tree or not to tree? Environ. Pollut. 2013, 183, 113–122. [Google Scholar] [CrossRef] [PubMed]
- Buccolieri, R.; Gromke, C.; Di Sabatino, S.; Ruck, B. Aerodynamic effects of trees on pollutant concentration in street canyons. Sci. Total Environ. 2009, 407, 5247–5256. [Google Scholar] [CrossRef] [PubMed]
- Ehrnsperger, L.; Klemm, O. Air pollution in an urban street canyon: Novel insights from highly resolved traffic information and meteorology. Atmos. Environ. X 2022, 13, 100151. [Google Scholar] [CrossRef]
- Santiago, J.L.; Rivas, E.; Sanchez, B.; Buccolieri, R.; Martin, F. The impact of planting trees on NOx concentrations: The case of the Plaza de la Cruz neighborhood in Pamplona (Spain). Atmosphere 2017, 8, 131. [Google Scholar] [CrossRef]
- Carpentieri, M.; Robins, A.G. Influence of urban morphology on air flow over building arrays. J. Wind Eng. Ind. Aerodyn. 2015, 145, 61–74. [Google Scholar] [CrossRef]
- Xie, X.; Huang, Z.; Wang, J.S. Impact of building configuration on air quality in street canyon. Atmos. Environ. 2005, 39, 4519–4530. [Google Scholar] [CrossRef]
- Aristodemou, E.; Boganegra, L.M.; Mottet, L.; Pavlidis, D.; Constantinou, A.; Pain, C.; Robins, A.; ApSimon, H. How tall buildings affect turbulent air flows and dispersion of pollution within a neighbourhood. Environ. Pollut. 2018, 233, 782–796. [Google Scholar] [CrossRef]
- City of London. Golden Lane Estate Listed Building Management Guidelines. 2013. Available online: https://www.cityoflondon.gov.uk/assets/Services-Environment/golden-lane-listed-building-management-guidelines.pdf (accessed on 8 July 2023).
- Edussuriya, P.; Chan, A.; Malvin, A. Urban morphology and air quality in dense residential environments: Correlations between morphological parameters and air pollution at street-level. J. Eng. Sci. Technol. 2014, 9, 64–80. [Google Scholar]
- Schiano-Phan, R.; Lau, B.; Pourel, D.; Khan-Phatan, S. Spatial Delight and Environmental Performance of Modernist Architecture in London—Golden Lane Estate. Future Cities Environ. 2018, 4, 782–796. [Google Scholar] [CrossRef]
- Stewart, I.D.; Oke, T.R. ‘Local climate zones’ for urban temperature studies. Bull. Am. Meteorol. Soc. 2012, 93, 1879–1900. [Google Scholar] [CrossRef]
- Department for UK Transport. Road Traffic Statistics. Road Traffic. 2018. Available online: https://roadtraffic.dft.gov.uk/#6/55.254/-6.064/basemap-regions-countpoints (accessed on 8 July 2023).
- Buccolieri, R.; Salim, S.M.; Leo, L.S.; Di Sabatino, S.; Chan, A.; Ielpo, P.; de Gennaro, G.; Gromke, C. Analysis of local scale tree-atmosphere interaction on pollutant concentration in idealized street canyons and application to a real urban junction. Atmos. Environ. 2011, 45, 1702–1713. [Google Scholar] [CrossRef]
- Gromke, C.; Ruck, B. Influence of trees on the dispersion of pollutants in an urban street canyon-Experimental investigation of the flow and concentration field. Atmos. Environ. 2007, 41, 3287–3302. [Google Scholar] [CrossRef]
- Wania, A.; Bruse, M.; Blond, N.; Weber, C. Analysing the influence of different street vegetation on traffic-induced particle dispersion using microscale simulations. J. Environ. Manag. 2012, 94, 91–101. [Google Scholar] [CrossRef] [PubMed]
- Ng, W.Y.; Chau, C.K. Evaluating the role of vegetation on the ventilation performance in isolated deep street canyons. Int. J. Environ. Pollut. 2012, 50, 98–110. [Google Scholar]
- Gromke, C.; Ruck, B. Pollutant Concentrations in Street Canyons of Different Aspect Ratio with Avenues of Trees for Various Wind Directions. Bound.-Layer Meteorol. 2012, 144, 41–64. [Google Scholar] [CrossRef]
- Johnson, O.; More, D. Collins Tree Guide; Harper Collins Publishers: New York, NY, USA, 2004. [Google Scholar]
- Ozkeresteci, I.; Crewe, K.; Brazel, A.J.; Bruse, M. Use and evaluation of the ENVI-met model for environmental design and planning. An Experiment on Lienar Parks. In Proceedings of the 21st International Cartographic Conference (ICC), Durban, South Africa, 10–16 August 2003. [Google Scholar]
- Salata, F.; Golasi, I.; Vollaro, A.D.L.; Vollaro, R.D.L. How high albedo and traditional buildings’ materials and vegetation affect the quality of urban microclimate. A case study. Energy Build. 2015, 99, 32–49. [Google Scholar] [CrossRef]
- Conry, P.; Sharma, A.; Potosnak, M.J.; Leo, L.S.; Bensman, E.; Hellmann, J.J.; Fernando, H.J.S. Chicago’s heat island and climate change: Bridging the scales via dynamical downscaling. J. Appl. Meteorol. Climatol. 2015, 54, 1430–1448. [Google Scholar] [CrossRef]
- Erell, E.; Pearlmutter, D.; Williamson, T. Urban Microclimate; Routledge: London, UK, 2010. [Google Scholar] [CrossRef]
- WHO Report. Global Air Quality Guidelines. 2021. Available online: https://iris.who.int/bitstream/handle/10665/345329/9789240034228-eng.pdf?sequence=1 (accessed on 16 November 2023).
- Zheng, X.; Orellano, P.; Lin, H.; Jiang, M.; Guan, W. Short-term exposure to ozone, nitrogen dioxide, and sulphur dioxide and emergency department visits and hospital admissions due to asthma: A systematic review and meta-analysis. Environ. Int. 2021, 150, 106435. [Google Scholar] [CrossRef]
- Huangfu, P.; Atkinson, R. Long-term exposure to NO2 and O3 and all-cause and respiratory mortality: A systematic review and meta-analysis. Environ. Int. 2020, 144, 105998. [Google Scholar] [CrossRef] [PubMed]
- Chen, J.; Hoek, G. Long-term exposure to PM and all-cause and cause-specific mortality: A systematic review and meta-analysis. Environ. Int. 2020, 143, 105974. [Google Scholar] [CrossRef] [PubMed]
- Tsoka, S.; Tsikaloudaki, K.; Theodosiou, T. Urban space’s morphology and microclimatic analysis: A study for a typical urban district in the Mediterranean city of Thessaloniki, Greece. Energy Build. 2017, 156, 96–108. [Google Scholar] [CrossRef]
- Dimoudi, A.; Nikolopoulou, M. Vegetation in the Urban Environment. Energy Build. 2003, 35, 69–76. [Google Scholar] [CrossRef]
- Hussain, M.; Lee, B.E. An Investigation of Wind Forces on Three-Dimensional Roughness Elements in a Simulated Atmospheric Boundary Layer Flow. Part II: Flow Over Large Arrays of Identical Roughness Elements and the Effect of Frontal and Side Aspect Ratio Variations; Department of Building Science, University of Sheffield: Sheffield, UK, 1980. [Google Scholar]
- Oke, T.R. Boundary Layer Climates; Routledge: London, UK, 1987. [Google Scholar]
- Ng, E.; Wong, H.H.; Han, M. Permeability, porosity and better ventilated design for high density cities. In Proceedings of the PLEA2006—The 23rd Conference on Passive and Low Energy Architecture, Geneva, Switzerland, 6–8 September 2006. [Google Scholar]
- Lawson, T. Building Aerodynamics; Imperial College Press: London, UK; River Edge, NJ, USA, 2001. [Google Scholar]
- Borna, M.; Schiano-Phan, R. Improving Hyperlocal Air Quality in Cities Impact of vegetation on pollutants concentration at pedestrian level. In Planning Post Carbon Cities. In Proceedings of the 35th PLEA Conference on Passive and Low Energy Architecture, A Coruña, Spain, 1–3 September 2020; Available online: https://westminsterresearch.westminster.ac.uk/download/f5536c70e251a5aa07cc722f2570ea32ccaaf84eca311088eac7b3087c8c0933/10707927/PLEA_2020_PlanningPostCarbonCities_Proc_Vol_1MB.pdf (accessed on 15 July 2023).
- Cranck, P.J.; Sailor, D.J.; Ban-Weiss, J.; Taleghani, J. Evaluating the ENVI-met microscale model for suitability in analysis of targeted urban heat mitigation strategies. Urban Clim. 2018, 26, 188–197. [Google Scholar] [CrossRef]
- Acero, J.A.; Arrizabalaga, J. Evaluating the performance of ENVI-met model in diurnal cycles for different meteorological conditions. Theor. Appl. Climatol. 2019, 131, 455–469. [Google Scholar] [CrossRef]
- Oliveira Favretto, A.P.; Lucas Souza, L.C. A meta-analysis over geometric modeling simplifications in ENVI-met urban climate simulation. Ambiente Construído 2019, 1, 143–160. [Google Scholar] [CrossRef][Green Version]
- Alves, F.M.; Gonçalves, A.; del Caz-Enjuto, M.R. The Use of Envi-Met for the Assessment of Nature-Based Solutions’ Potential Benefits in Industrial Parks—A Case Study of Argales Industrial Park (Valladolid, Spain). Infrastructures 2022, 7, 85. [Google Scholar] [CrossRef]


| Location and Vegetation Image Number | Vegetation Scientific Name | Vegetation Common Name | Vegetation Height (Top of Vegetation from Ground) (m) | LAD (High/Low) | Typology (Evergreen/Deciduous) | Trunk Size (Small/Medium/Large) | Crown Shape (Cylindrical/Heart-Shape/Spherical | Clear Stem Height (m) |
|---|---|---|---|---|---|---|---|---|
| A | Carpinus | Hornbeam | 5–7 | High | Deciduous | Medium | Broadly Oval (Heart-Shaped) | 2–3 |
| B | Catalpa bignonioides | Indian-bean-tree | 9 | Low | Deciduous | Medium | Broadly Round (Spherical) | 4–5 |
| C | Pyrus | Pear | 4–5 | High | Deciduous | Medium | Irregular (Heart-Shaped) | 1–2 |
| D | Prunus avium | Cherry Tree | 8–10 | Low | Deciduous | Medium | Irregular (Heart-Shaped) | 2.5 |
| E | Acer saccharinum | Silver Maple | 10 | High | Deciduous | Large | Broadly Oval (Heart-Shaped) | 2 |
| F | Betula pendula | Silver birch | 11 | Low | Deciduous | Medium | Irregular (Heart-Shaped) | 1 |
| G | Fagus | Beech Tree | 12 | High | Evergreen | Large | Broadly Oval (Heart-Shaped) | 0.5 |
| H | Crataegus persimilis | Broad-leaved cockspur thorn | 3 | Low | Deciduous | Small | Irregular (Heart-Shaped) | 1.5 |
| I | Cherry Laurel | Prunus laurocerasus | 3–4 | High | Evergreen | N/A | Hedge | 0 |
| L | Ficus carica | Fig | 5 | High | Deciduous | Medium | Broadly Round (Spherical) | 1.5 |
| M | Cedrus deodara | Deodar | 12 | Low | Evergreen | Medium | Irregular (Pyramidal) | 2 |
| N | Malus domestica | Apple | 6 | High | Deciduous | Small | Broadly Oval (Heart-Shaped) | 1 |
| O | Laurus | Bay | 2 | High | Evergreen | N/A | Hedge | 0 |
| P | Pittosporum tenuifolium | Kohuhu | 2.5 | High | Evergreen | N/A | Hedge | 0 |
| Q | Cercis siliquastrum | Judas-tree | 5 | Low | Deciduous | Medium | Broadly Round (Spherical) | 2 |
| R | Platanus | Plane | 22 | Low | Deciduous | Large | Broadly Oval (Heart-Shaped) | 3 |
 | A—Hornbeam | I—Prunus laurocerasus | ||||||
| B—Indian-bean-tree | L—Fig | |||||||
| C—Pear | M—Deodar | |||||||
| D—Cherry Tree | N—Apple | |||||||
| E—Silver Maple | O—Bay | |||||||
| F—Silver birch | P—Kohuhu | |||||||
| G—Beech Tree | Q—Judas-tree | |||||||
| H—Broad-leaved cockspur thorn | R—Plane | |||||||
| System Specifications | |
|---|---|
| Measurement units | Gas: ppm or mg/m3|Humidity: %|Temperature: °C or °F |
| Reading functions | Instant, minimum, maximum, average |
| Sensor head | Active fan sampling accuracy measurements, interchangeable |
| Sensor head calibration | Zero and span calibration |
| Temperature and humidity sensor | Range −40 °C to 124 °C (−40 °F to 255 °F); Range 0 to 100% RH |
| Environmental operating conditions | Temperature: −5 °C to 45 °C|Humidity: 0 to 95% non-condensing |
| Display status indicators | Battery, sensor, standby |
| Enclosure material and rating | PC and ABS; IP20 and NEMA 1 equivalent |
| Size | (L × W × D) 195 × 122 × 54 (mm) |
| Weight | <460 g (with sensor head and battery) |
| Approvals | Part 15 of FCC Rules |
| System Specifications | |
|---|---|
| Measurement | Anemometer, Humidity, Temperature, Light |
| Air velocity | Range: 0.4 to 30.0 m/s|Resolution: 0.1 m/s |
| Humidity | Range: 10 to 95% RH|Resolution: 0.1% RH |
| Temperature | Range: 0 to 50 °C|Resolution: 0.1 °C |
| Light | Range: 0 to 20,000 Lux|Resolution: 1 Lux |
| Weight | 160 g (battery included) |
| Dimension | HWD 156 × 60 × 33 mm |
| SPOT | TIME (h) | T (°C) | RH (%) | WS MIN–MAX (m/s) | WS AVER. (m/s) | PM2.5 (μg/m3) | PM10 (μg/m3) | NO2 (μg/m3) |
|---|---|---|---|---|---|---|---|---|
| Spot 1 | 13:54 | 17.6 | 52.3 | 0.0–0.5 | 0.3 | 8 | 10 | 18 |
| Spot 2 | 14:02 | 15.9 | 57.2 | 0.8–1.3 | 1.1 | 8 | 9 | 12 |
| Spot 3 | 14:06 | 15.0 | 59.2 | 0.7–1.8 | 1.3 | 8 | 9 | 19 |
| Spot 4 | 14:21 | 14.2 | 62.3 | 1.8–2.1 | 2.0 | 8 | 9 | 23 |
| Spot 5 | 14:24 | 14.9 | 60.0 | 0.0–0.5 | 0.3 | 7 | 8 | 13 |
| Spot 6 | 14:32 | 14.7 | 60.7 | 0.7–1.0 | 0.9 | 6 | 7 | 15 |
| Spot 7 | 14:36 | 14.0 | 63.2 | 1.5–2.0 | 1.8 | 7 | 8 | 13 |
| Spot 8 | 14:50 | 14.8 | 60.7 | 0.4–0.8 | 0.6 | 9 | 10 | 16 |
| Spot 9 | 14:58 | 14.5 | 62.1 | 0.4–0.8 | 0.6 | 8 | 10 | 14 |
| Spot 10 | 15:17 | 14.7 | 61.6 | 0.9–1.3 | 1.1 | 7 | 8 | 12 |
| SIMULATION AREA FILE (.inx) | CONFIGURATION FILE (.sim) | ||
|---|---|---|---|
| Localisation, lat. (deg,+N,−S): long. (deg,−W,+E): - Grid dimension (x, y, z): - Grid cells size (dx; dy; dz): - Nesting grids (Nr): - Space configuration . DEM configuration: . buildings configuration: . soil typology: . vegetation typology and configuration: . sources of pollutants: . geometry: . height (m): | 51.52 −0.09 130 × 130 × 60 2 m; 2 m; 1.5 m 5 Google Maps and survey on site Google Maps and survey on site Google Maps and survey on site Google Maps and survey on site Google Maps and survey on site www.londonair.org.uk (accessed on 1 November 2018), Google Maps and survey on site 0.5 | - Start and duration of model run . start date (DD.MM.YYYY): . start time (hh:mm:ss): . total simulation time (h): - Initial meteorological conditions . wind speed at 10 m height (m/s): . wind direction (deg): . initial temperature (°C) . relative humidity in 2 m (%): - Hourly meteorological conditions: - Pollutants dispersion and reactions . operation mode: . chemistry. | 25.10.2018 07:00:00 12 2.5 260 10.11 69 data by www.rp5.ru (accessed on 25 October 2018) multi-pollutant (NO, NO2, O3, PM10 and PM2.5) active chemistry |
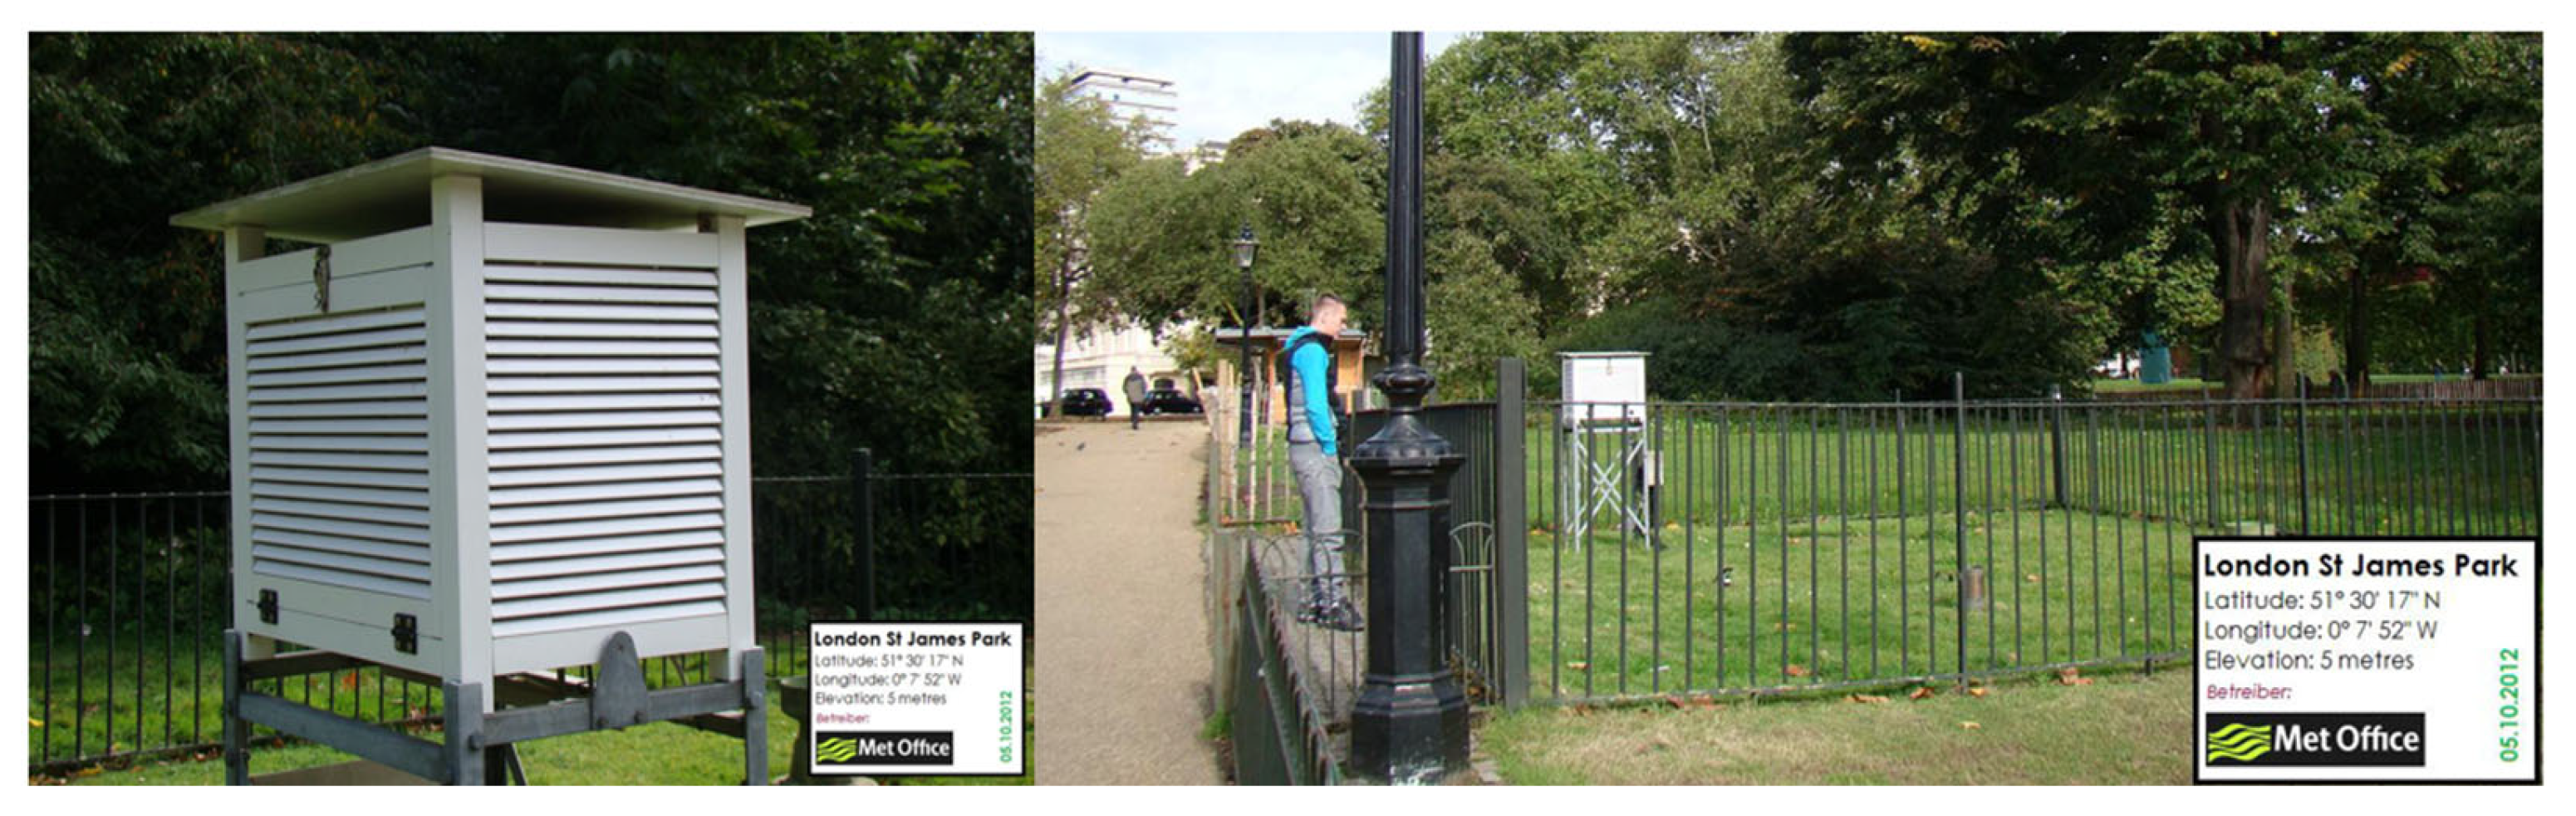
| Meteorological Conditions on 25 October 2018, Weather Station London St. James’ Park and www.metoffice.gov.uk (accessed on 1 November 2018) | Pollutants Concentration on 25 October 2018, Station London Sir John Cass School (NO; NO2; PM10; PM2.5) and Bloomsbury (Ozone) | ||||||||
|---|---|---|---|---|---|---|---|---|---|
| Hourly Time (UTC) | Air Temperature (°C) | Rel. Humidity (%) | Wind Velocity (m/s) | Wind Direction | NO (μg/m3) | NO2 (μg/m3) | Ozone (μg/m3) | PM10 (μg/m3) | PM2.5 (μg/m3) |
| 00:00:00 | 9.50 | 82 | 2 | SW | 3.70 | 25.40 | 31.90 | 23.00 | 9 |
| 01:00:00 | 7.50 | 90 | 2 | W | 3.20 | 27.80 | 28.10 | 19.40 | 6 |
| 02:00:00 | 7.00 | 95 | 2 | WNW | 3.80 | 34.40 | 25.90 | 24.40 | 3 |
| 03:00:00 | 6.70 | 96 | 2 | W | 4.00 | 34.00 | 22.00 | 22.00 | 5 |
| 04:00:00 | 6.60 | 95 | 1 | WSW | 9.80 | 46.50 | 16.40 | 22.20 | 9 |
| 05:00:00 | 6.10 | 97 | 1 | WSW | 24.90 | 50.4 | 3.80 | 22.40 | 11 |
| 06:00:00 | 5.90 | 97 | 1 | W | 49.30 | 54.80 | 1.20 | 26.80 | 13 |
| 07:00:00 | 6.60 | 97 | 2 | W | 42.60 | 57.70 | 1.60 | 28.20 | 13 |
| 08:00:00 | 7.30 | 95 | 2 | W | 35.50 | 57.10 | 6.00 | 38.20 | 10 |
| 09:00:00 | 9.00 | 87 | 3 | NW | 37.20 | 55.30 | 13.20 | 28.80 | 16 |
| 10:00:00 | 10.80 | 78 | 4 | NNW | 30.90 | 49.70 | 22.60 | 29.40 | 13 |
| 11:00:00 | 12.60 | 69 | 4 | NW | 19.50 | 42.20 | 30.30 | 23.40 | 9 |
| 12:00:00 | 14.10 | 66 | 3 | NNW | 12.10 | 34.20 | 26.70 | 22.40 | 17 |
| 13:00:00 | 14.60 | 65 | 4 | W | 14.30 | 42.40 | 36.50 | 18.80 | 9 |
| 14:00:00 | 13.50 | 67 | 3 | W | 17.10 | 47.10 | 28.90 | 19.00 | 8 |
| 15:00:00 | 13.30 | 70 | 3 | NW | 27.70 | 59.30 | 20.00 | 21.60 | 11 |
| 16:00:00 | 13.20 | 70 | 4 | WNW | 19.30 | 61.20 | 11.20 | 18.20 | 12 |
| 17:00:00 | 12.20 | 72 | 4 | NW | 8.70 | 43.10 | 17.60 | 17.20 | 8 |
| 18:00:00 | 11.90 | 71 | 3 | NW | 11.40 | 41.10 | 26.30 | 17.20 | 9 |
| 19:00:00 | 11.60 | 73 | 4 | NW | 7.50 | 35.80 | 24.30 | 16.80 | 9 |
| 20:00:00 | 10.90 | 77 | 3 | NW | 12.80 | 33.30 | 30.70 | 14.60 | 8 |
| 21:00:00 | 10.60 | 78 | 3 | WNW | 6.30 | 27.70 | 26.50 | 8.60 | 7 |
| 22:00:00 | 10.50 | 78 | 3 | WNW | 6.30 | 27.30 | 37.70 | 9.40 | 6 |
| 23:00:00 | 10.60 | 73 | 3 | W | 7.60 | 28.70 | 35.50 | 8.20 | 7 |
| Type of Measurement | T (°C) | RH (%) | WS aver. (m/s) | PM2.5 (μg/m3) | PM10 (μg/m3) | NO2 (μg/m3) |
|---|---|---|---|---|---|---|
| On-site spot measurements | 15.0 | 59.9 | 1.0 | 8 | 10 | 16 |
| Meteorological stations | 13.3 | 70.0 | 4.0 | 11 | 22 | 59 |
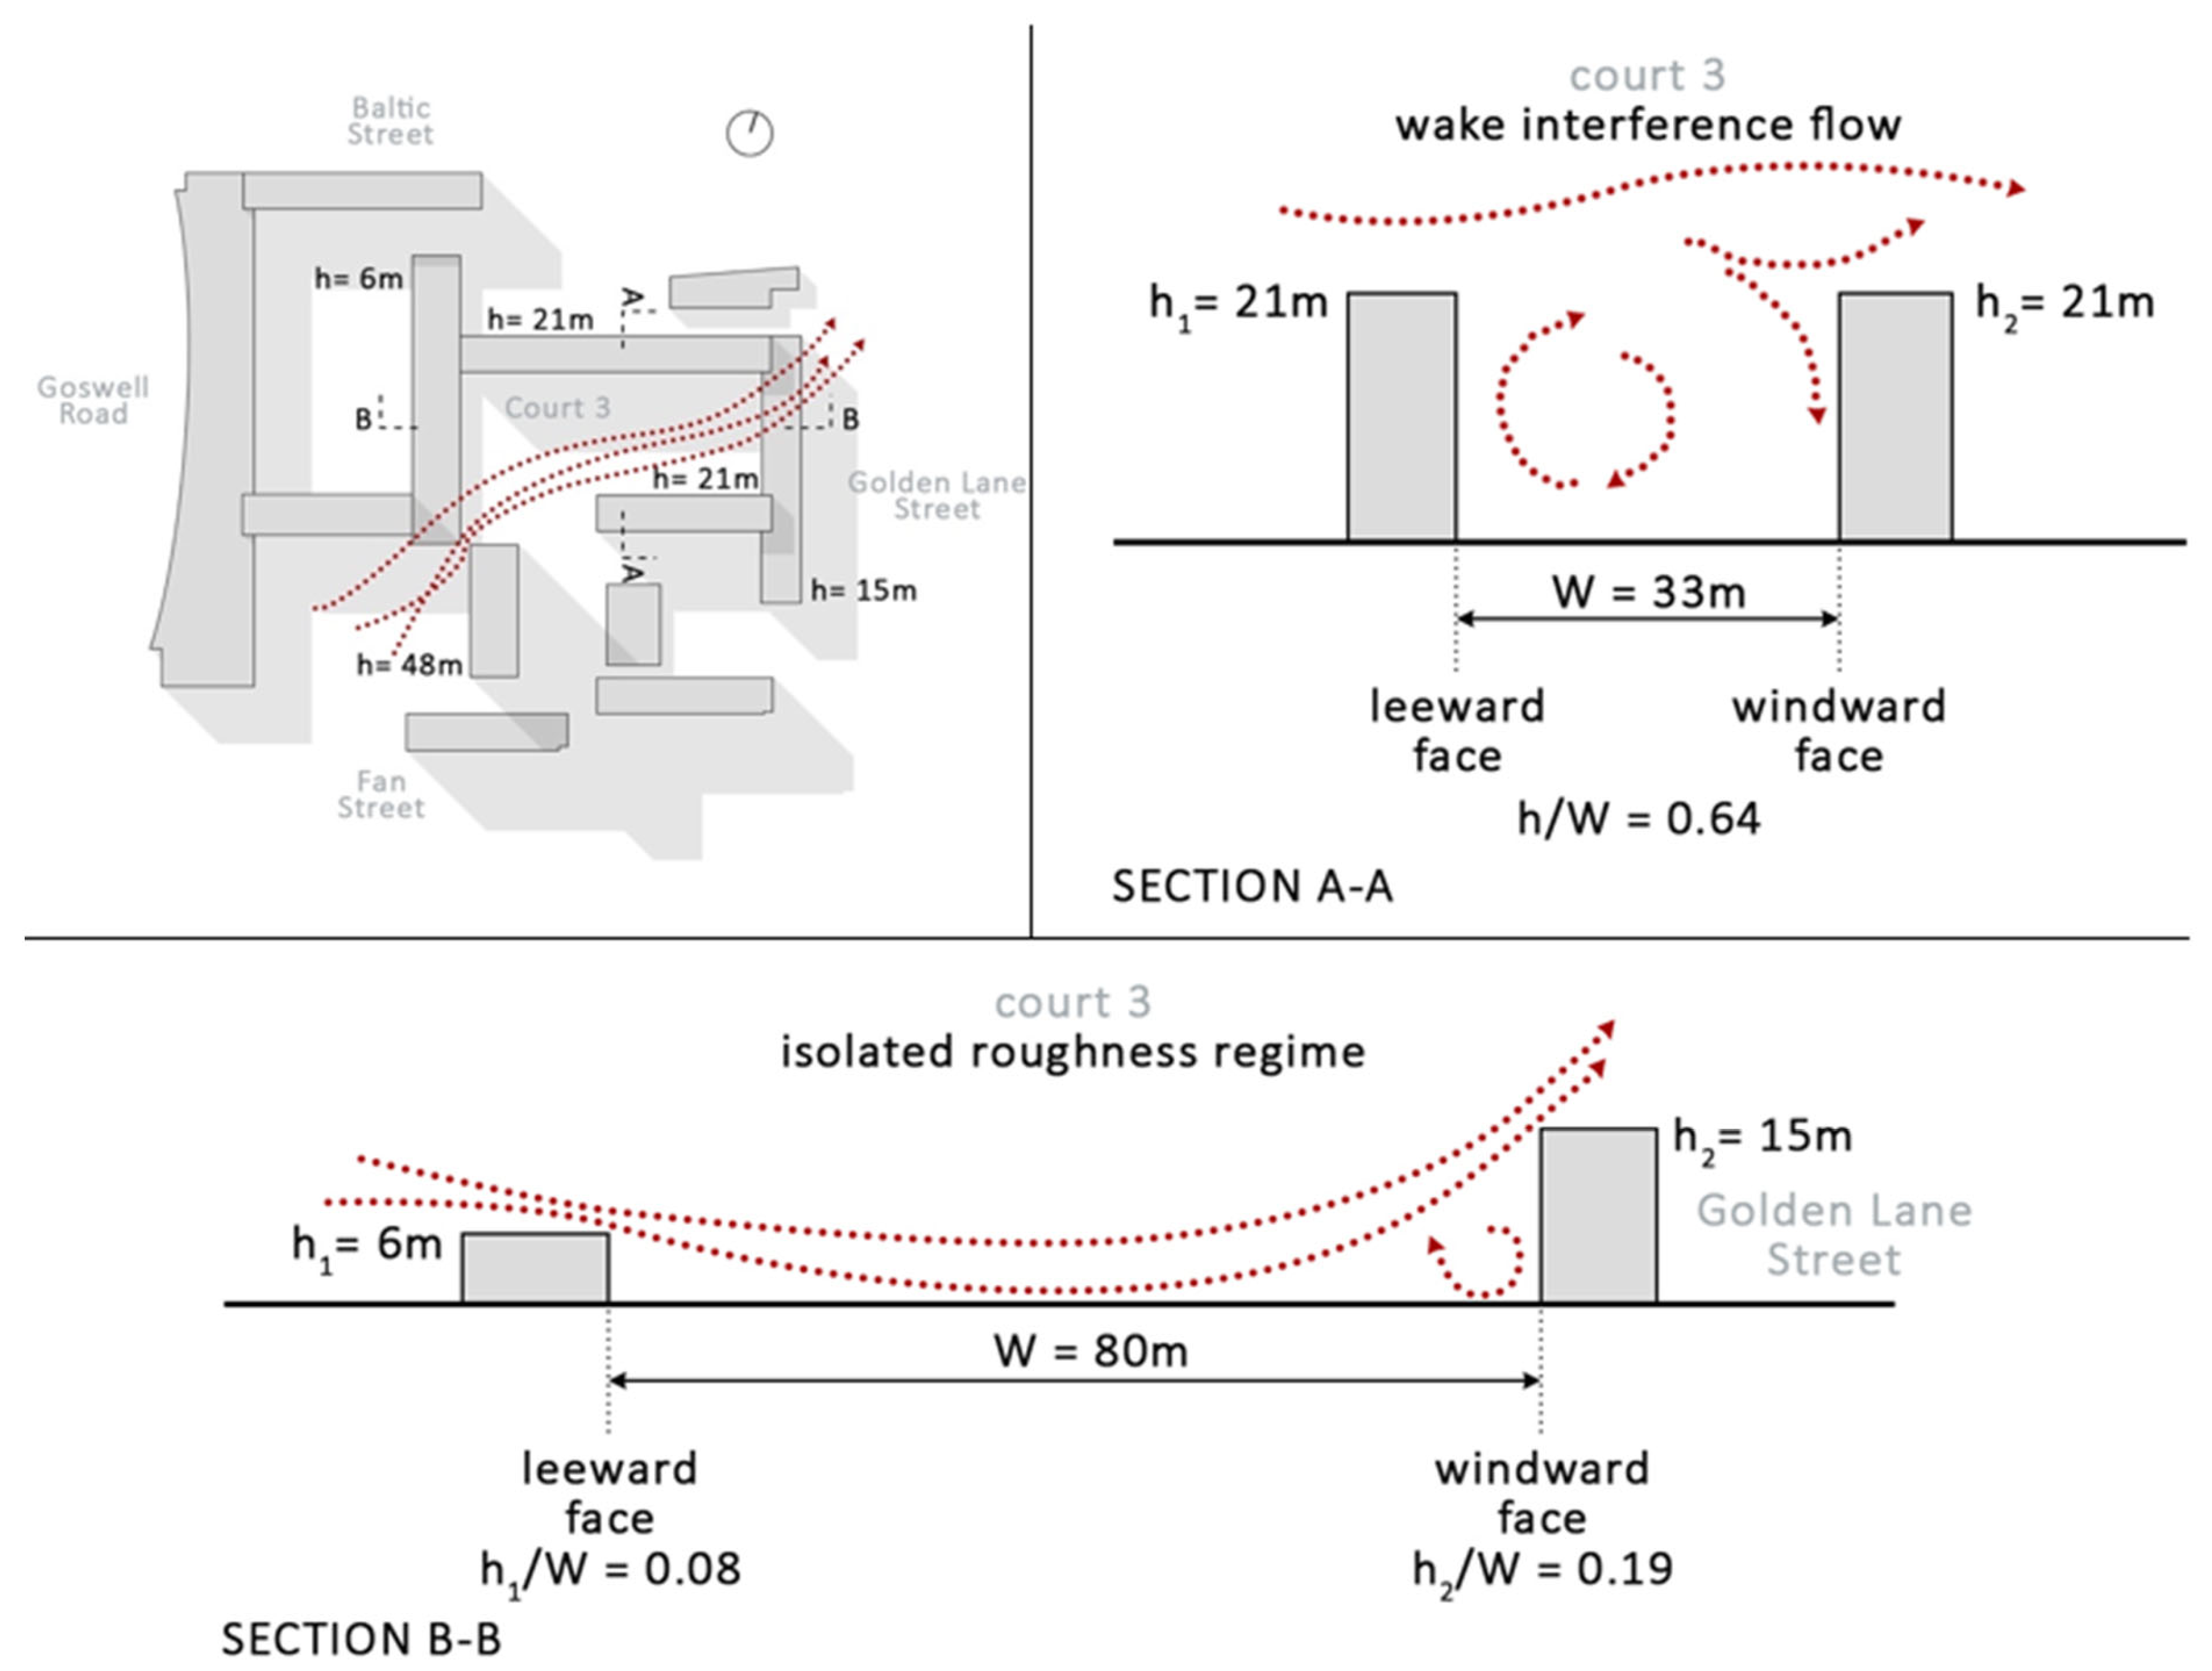
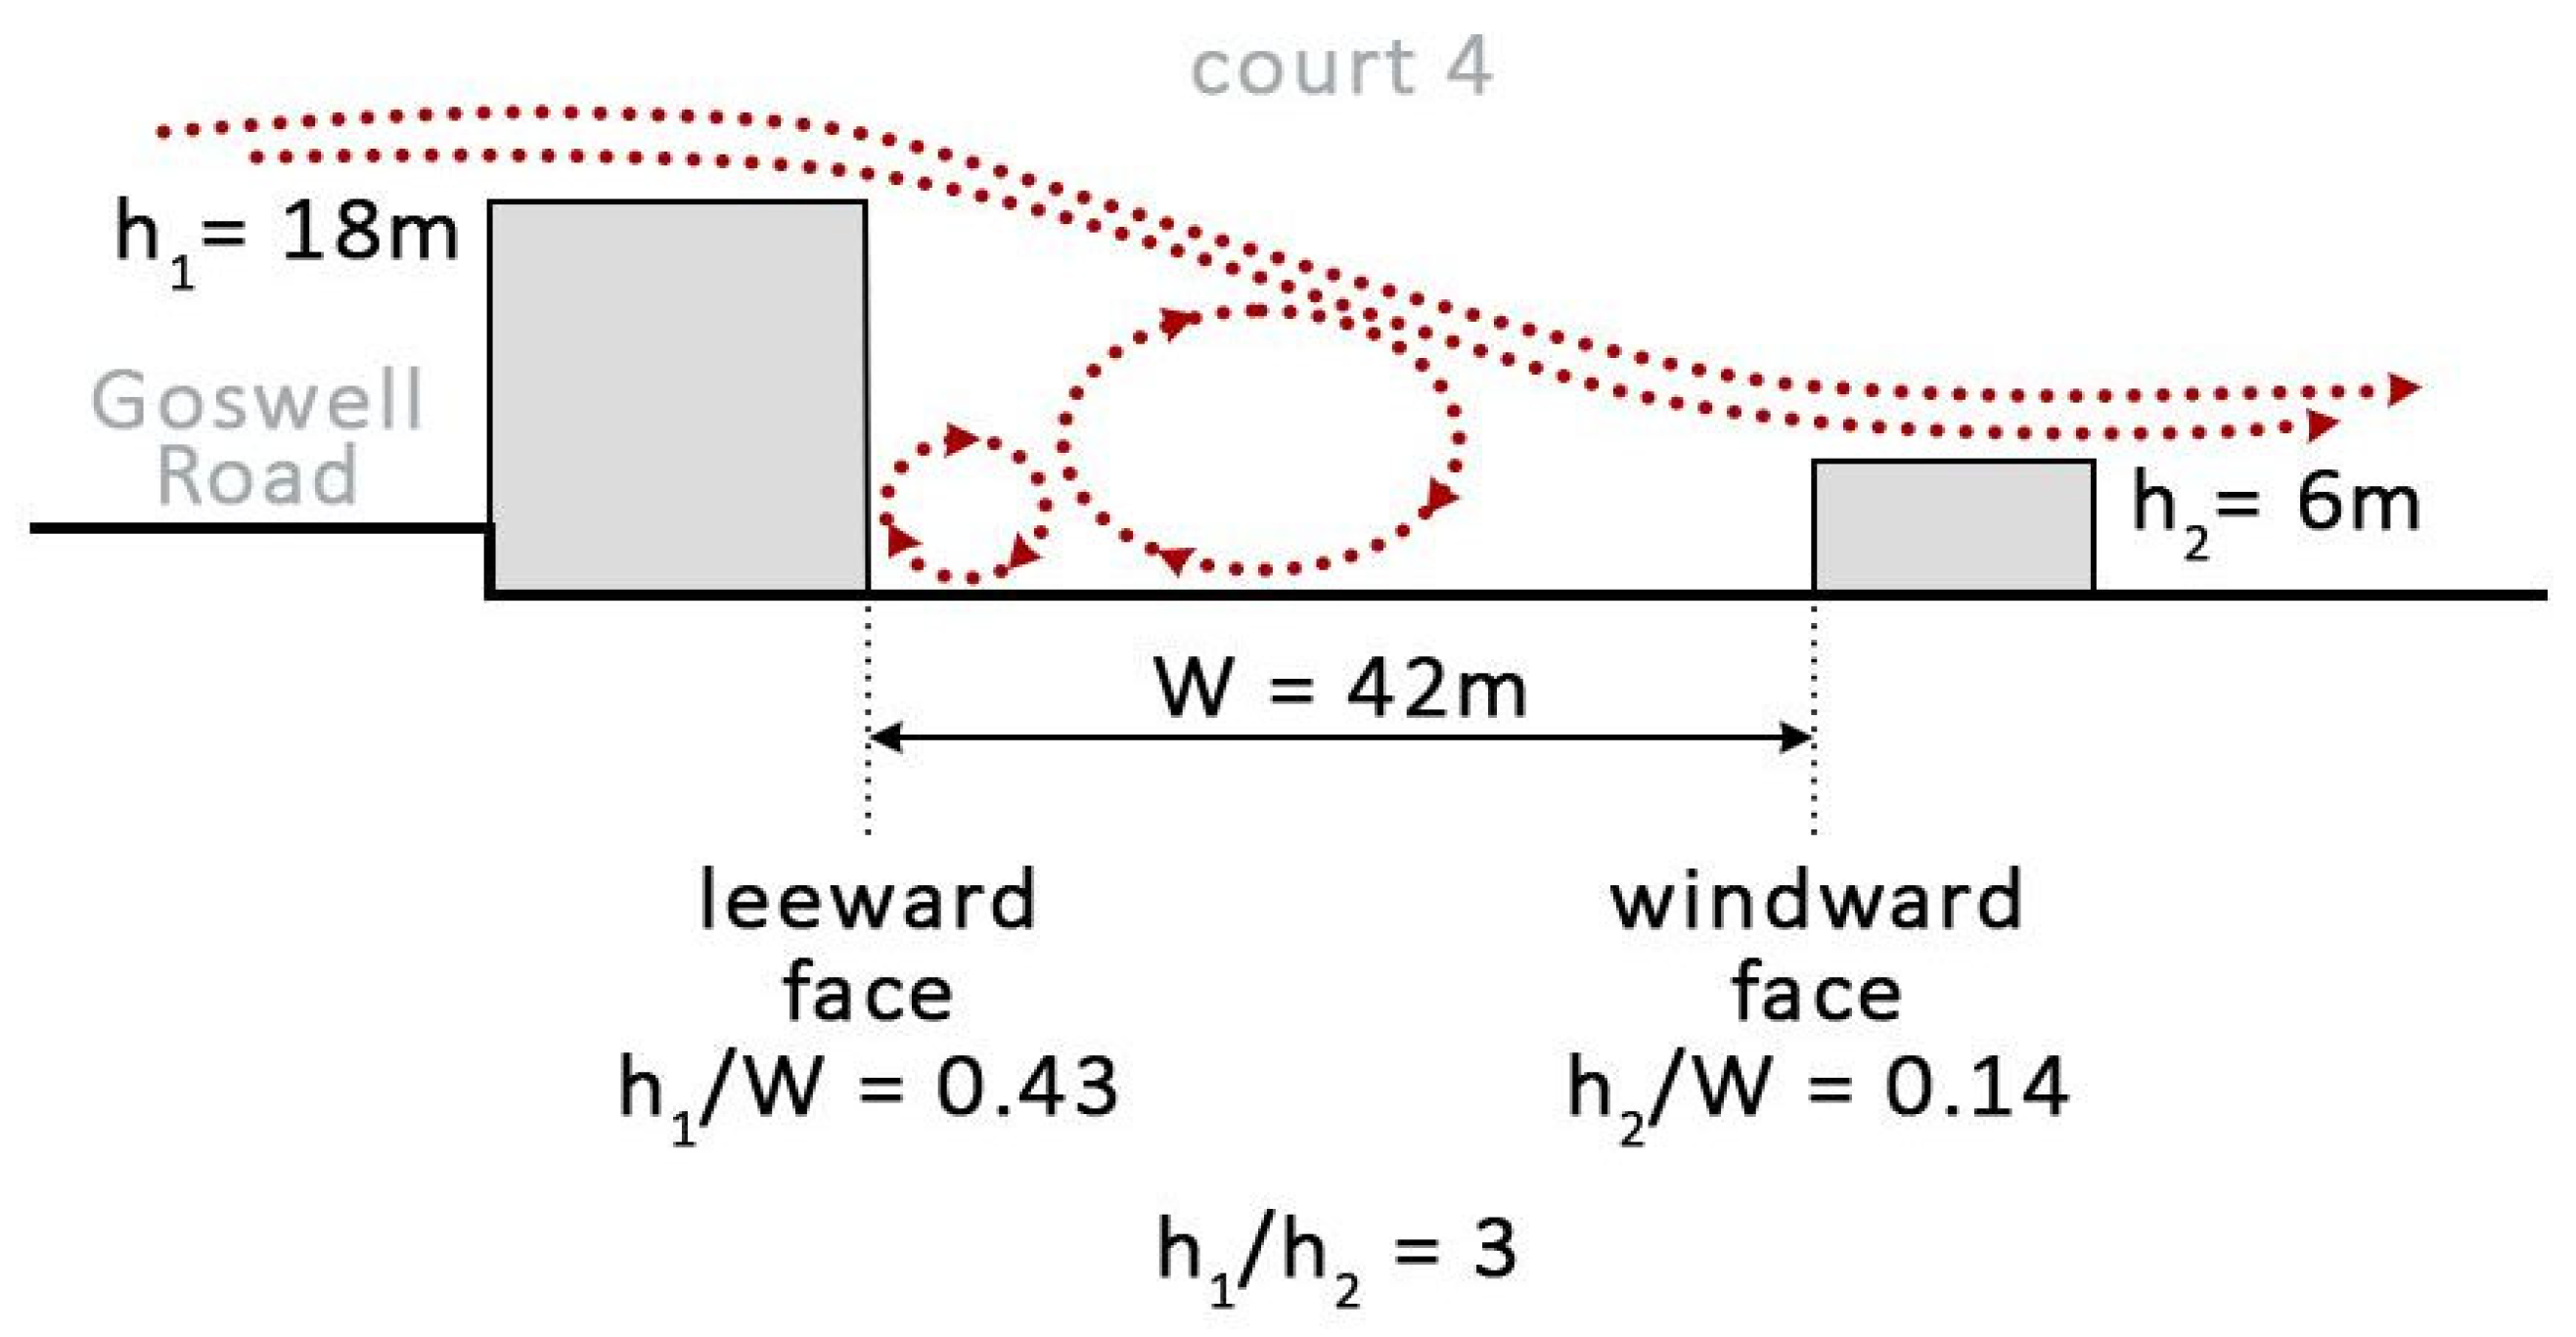
| Flow Regime | Height-to-Width Ratio (H/W) | Characteristics |
|---|---|---|
| (i) Isolated roughness flow | H/W < 0.5 | The flow fields surrounding the buildings on either side of the street do not interact. Two co-rotative vortices can be formed. |
| (ii) Wake interference flow | 0.5 < H/W < 0.65 | The flow around the upstream buildings starts to interfere with flow around downstream buildings. One main vortex can be formed. |
| (iii) Skimming flow | H/W > 0.65 | The air above buildings hardly can interfere with the flow around downstream buildings inside the canyon. Circulatory or contra-rotative vortices can be formed. |
Disclaimer/Publisher’s Note: The statements, opinions and data contained in all publications are solely those of the individual author(s) and contributor(s) and not of MDPI and/or the editor(s). MDPI and/or the editor(s) disclaim responsibility for any injury to people or property resulting from any ideas, methods, instructions or products referred to in the content. |
© 2024 by the authors. Licensee MDPI, Basel, Switzerland. This article is an open access article distributed under the terms and conditions of the Creative Commons Attribution (CC BY) license (https://creativecommons.org/licenses/by/4.0/).
Share and Cite
Borna, M.; Turci, G.; Marchetti, M.; Schiano-Phan, R. Evaluating the Influence of Urban Blocks on Air Pollution Concentration Levels: The Case Study of Golden Lane Estate in London. Sustainability 2024, 16, 696. https://doi.org/10.3390/su16020696
Borna M, Turci G, Marchetti M, Schiano-Phan R. Evaluating the Influence of Urban Blocks on Air Pollution Concentration Levels: The Case Study of Golden Lane Estate in London. Sustainability. 2024; 16(2):696. https://doi.org/10.3390/su16020696
Chicago/Turabian StyleBorna, Mehrdad, Giulia Turci, Marco Marchetti, and Rosa Schiano-Phan. 2024. "Evaluating the Influence of Urban Blocks on Air Pollution Concentration Levels: The Case Study of Golden Lane Estate in London" Sustainability 16, no. 2: 696. https://doi.org/10.3390/su16020696
APA StyleBorna, M., Turci, G., Marchetti, M., & Schiano-Phan, R. (2024). Evaluating the Influence of Urban Blocks on Air Pollution Concentration Levels: The Case Study of Golden Lane Estate in London. Sustainability, 16(2), 696. https://doi.org/10.3390/su16020696