Abstract
To address the poor thermal comfort of library exteriors in hot and dry regions during the summer, this study takes the libraries of universities in Xinjiang as its research object. It corrects the range of the perceived environmental temperature (PET) index for evaluating comfort in Xinjiang by combining subjective and objective methods. It explores the impact and adjustment mechanism of physical parameters on PET through field measurements and simulations. Finally, it determines the optimal external environmental design based on PET. The research results show that the neutral temperature of PET in Xinjiang during the summer is 27.44 °C, and the optimal comfort temperature range is 25.52–29.36 °C. The correlation between meteorological and physical parameters and PET is as follows: Tg > G > Ta > RH > SVF > reflectance > Va. The optimal PET design includes a combination of a water body in the upwind direction on the south side, an asphalt underlay, grass, and large-leaved wax vegetation. In the optimal scheme, PET decreased by 6.73 °C, or 12.59%, compared with Case 0 at 18:00. This study provides a reference for the design of external environmental conditions in hot and dry regions during the summer.
1. Introduction
The accelerated process of urbanization has led to significant changes in underlying surface materials, disrupting the thermal equilibrium within urban ecosystems and exacerbating the urban heat island phenomenon [1]. The occurrence of the urban heat island phenomenon results in reduced summer comfort, significantly impacting the utilization and vibrancy of urban spaces. It also has adverse effects on the health of urban residents, leading to physiological and psychological health problems, such as respiratory and cardiovascular issues [2]. Additionally, it consumes a considerable amount of building energy, exacerbating the energy crisis. Saving energy has always been a widely discussed topic globally, and countries actively promote sustainable development strategies through the formulation of policies, regulations, and various activities. In the 1960s, Paola Soleri proposed the integration of ecology and architecture, giving rise to ecological architecture, known today as green zero-carbon buildings [3]. To implement the low-carbon, sustainable concept, environmental agencies, universities, and research institutions conduct research and activities related to green sustainability. The SDLAC event held in Cali (Colombia) in 2015 aimed to establish self-sufficient, green, sustainable buildings through active promotion, contributing to the goal of creating green, sustainable cities [4]. The ecological concept in green buildings primarily focuses on optimizing the design of the external environment, improving indoor and outdoor environments by altering external physical parameters. True green sustainable development is achieved through the optimization of both the building structure and the external environment. Due to the complex functionality, high population density, and high utilization rate of spaces, campuses have higher requirements for comfort. As an important component of the campus, libraries are located in a central area with a large population density, serving as crucial places for students and faculty to study and work. A good external environment is essential for promoting outdoor activities and alleviating psychological stress. It also plays a positive role in saving building energy [5,6]. Located in the northwest of China, Xinjiang is in a severely cold region, resulting in limited outdoor activities during winter and more outdoor activities during summer for students and faculty. However, the hot and dry climate in the summer leads to poor thermal comfort. Therefore, this study focuses on the external environmental comfort of libraries in Xinjiang during the summer, aiming to provide a comfortable campus environment for students and faculty.
Establishing a favorable external environment involves studying blue–green spaces and underlying surface materials to determine their impact on comfort [7]. Vegetation, as an important factor in the external environment, provides shade and transpiration, and its proper arrangement not only enhances aesthetics but also positively influences microclimate regulation [8]. To investigate the extent and mechanisms of vegetation’s impact on microclimate and comfort, research has been conducted in Shanghai and Xuzhou, which are representative of humid and hot climate regions in China. The studies showed that altering vegetation types and layouts significantly reduces air temperature and PET, thereby improving comfort [9,10]. The influence of vegetation on microclimate varies in different climatic regions. Therefore, research has been conducted on the external environmental conditions of buildings in Tehran, Iran, representing a semi-arid region, and Cairo, Egypt. Through field measurements and ENVI-met simulations, vegetation’s impact on microclimate has been determined. The studies indicate that the vegetation canopy and leaf area index have a more significant effect on average radiant temperature and comfort compared to humid and hot climate regions, while also contributing to energy savings [11,12,13]. Water bodies, as important elements in the environment, contribute to heat absorption through evaporation. Proper arrangement of water bodies not only regulates the surrounding climate but also alleviates human physical and mental stress [14]. Through comprehensive analyses of different water body shapes, sizes, and layouts in residential areas and campuses, it has been determined that they significantly impact microclimate [15,16,17]. As urban development continues, impervious surfaces increase, leading to significant urban heat island effects. Cool underlying surface materials play a mitigating role in the urban heat island phenomenon. Research has shown that using high-reflectance materials as underlying surfaces significantly improves the surface temperature and PET, thereby positively impacting comfort [18,19]. Therefore, vegetation types and layouts, water body sizes and shapes, and underlying surface materials all have significant effects on microclimate and comfort.
In addition to the relevant parameters, research on the comfort of the external environment also concentrates on optimizing research methods. In recent years, scholars have conducted in-depth studies on the impact of different physical parameters on comfort and energy demand, primarily through empirical and simulation methods. Empirical studies involve on-site investigations and data collection, validating model accuracy for numerical simulations. With advancements in computing power and technology, computational fluid dynamics (CFD) has been widely applied in numerical simulations to study microclimates and comfort, utilizing software packages such as Fluent (2019), OpenFoam (V2312), and ENVI-met (5.5.1). The specific research methods are summarized in Table 1.

Table 1.
Overview of research methods in articles related to microclimates and comfort.
In summary, current research in the field primarily focuses on campus environments in humid and hot regions, with limited studies conducted in hot and dry areas. Furthermore, research elements tend to analyze and study single parameters, with limited consideration given to the combined effects of vegetation, water bodies, and underlying surface materials. Simultaneously, in terms of research methods, most studies only use simulations or, when combined with empirical methods, focus on validating simulation accuracy. Few studies consider the integration of subjective and objective measurements with numerical simulations. Therefore, this study focuses on the external environmental comfort of the library at Shihezi University in Xinjiang. It aims to adjust the comfort evaluation range specific to Xinjiang, analyze the extent and mechanisms of the impact of physical parameters on microclimate and comfort, and propose an optimal design solution for the library’s external environment based on comfort. The study aims to fill the research gap concerning the external environment of hot and dry regions, represented by Xinjiang, and provide references for the design of building exteriors.
2. Materials and Methods
The analysis was conducted through a combination of field measurements and questionnaire surveys to adjust the comfort evaluation range specific to Xinjiang and determine the neutral temperature and optimal comfort range. The impact and regulation mechanisms of different physical parameters on microclimate and comfort were determined through a combination of field measurements and ENVI-met simulations. Finally, an optimal design solution for the library’s external environment based on comfort was determined. The specific workflow is shown in Figure 1.
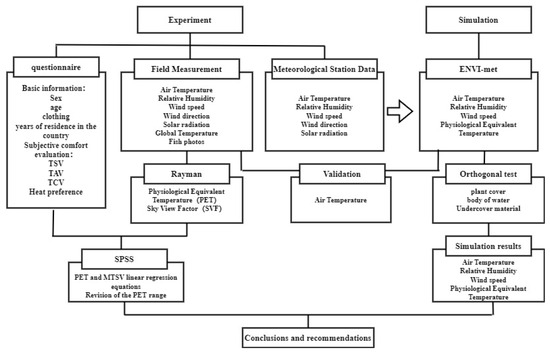
Figure 1.
Flow chart of the study.
2.1. Study Location
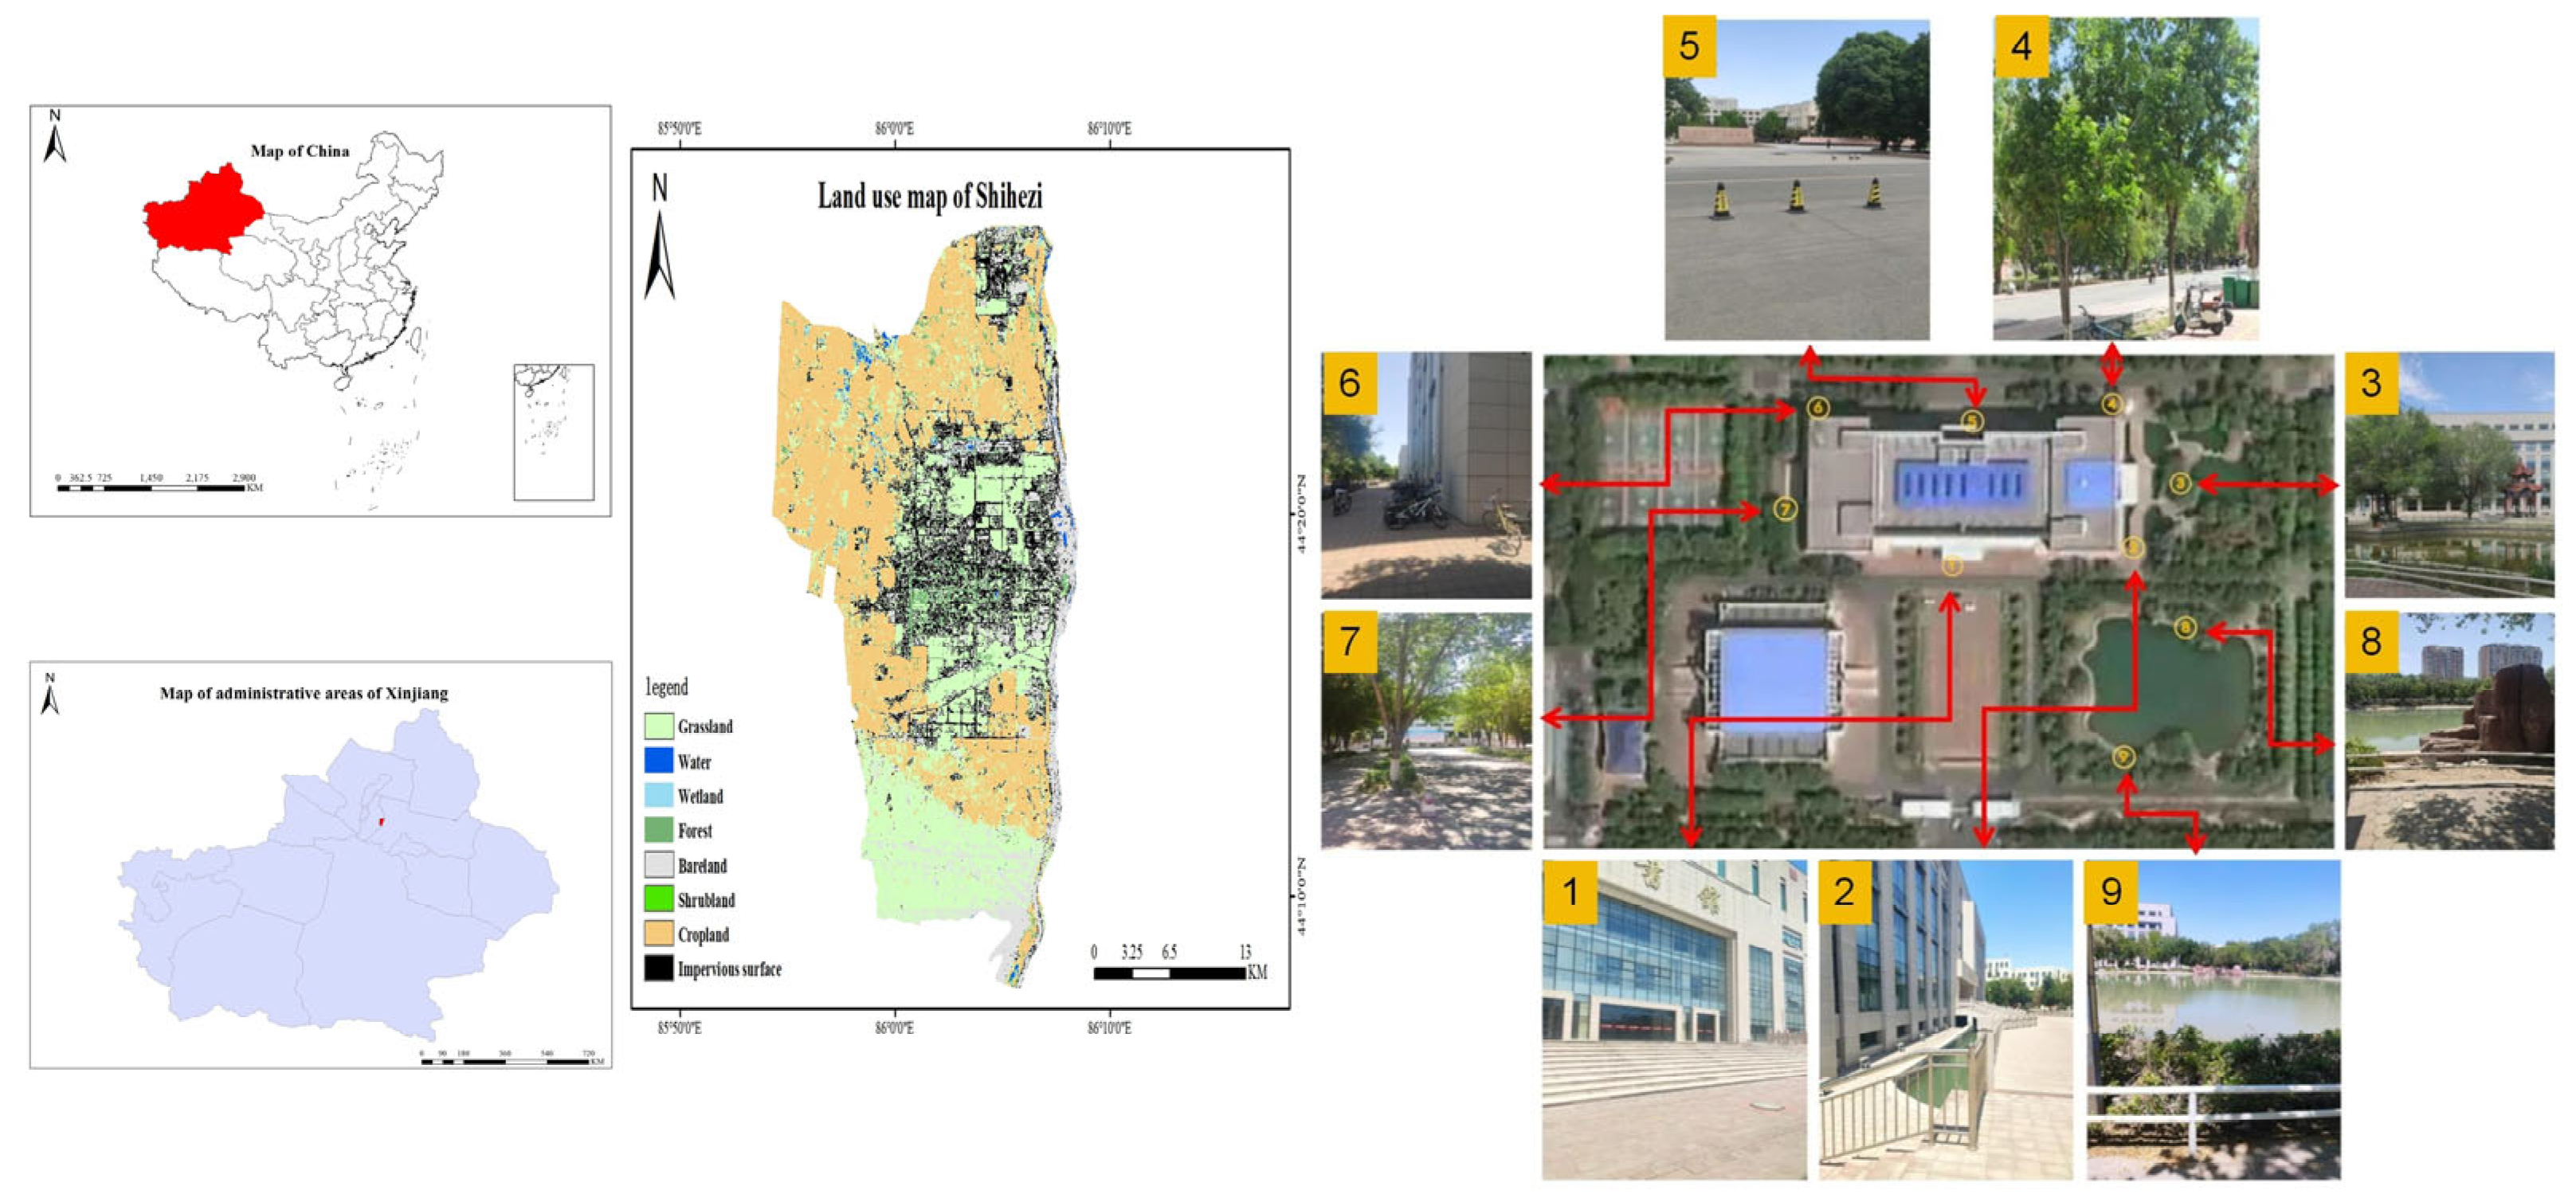
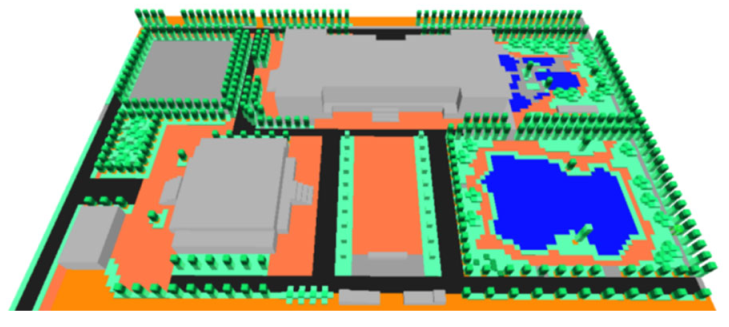
The study was conducted in Shihezi, Xinjiang (44°18′50″ N, 86°03′24″ E). Shihezi is located in the middle section of the Tianshan Mountains, in the southern part of the Junggar Basin. It has a typical temperate continental climate, with cold winters and hot summers. Based on meteorological statistics from 2012 to 2023, the highest temperatures typically occur in mid to late July, with an average maximum temperature of 38.2 °C. The historical highest temperature occurred on 21 July 2015, reaching 41 °C. The study area is the external environment of the library at Shihezi University, surrounded by abundant water bodies and vegetation. The southeastern side features Shuxiang Lake, the eastern side has a recreational area for students and faculty, and the north and south sides are lined with asphalt roads with large canopy trees planted on both sides, as shown in Figure 2.
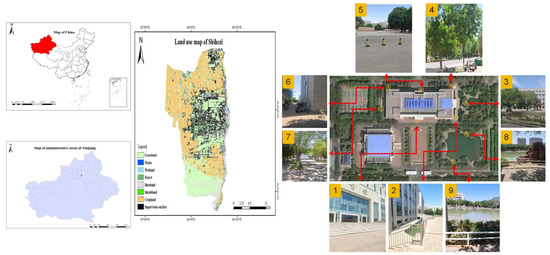
Figure 2.
Geographic location and layout of the study area.
2.2. Questionnaire Survey
A subjective survey was conducted through a questionnaire to assess the comfort of the respondents. The aim was to determine the suitable comfort range for Xinjiang based on the survey. The questionnaire included three aspects of information, as follows: (1) Respondent information, including gender, age, years of residence in Xinjiang, and clothing conditions. (2) Subjective comfort voting, including the thermal sensation vote (TSV), thermal comfort vote (TCV), and thermal acceptability vote (TAV). Since the study focused on summer, the TSV was divided into slightly cool −1, moderate 0, slightly warm +1, warm +2, hot +3, and very hot +4. The TCV was divided into comfortable 0, slightly uncomfortable +1, uncomfortable +2, and very uncomfortable +3. The TAV was divided into acceptable +1 and not acceptable 0. (3) Subjective expectation voting, including expectations for current temperature, humidity, wind speed, and solar radiation. Expectations were categorized as warmer/more humid/stronger, remain the same, and cooler/drier/weaker.
2.3. Field Measurements
2.3.1. Monitoring Point Layout
Through on-site investigations of the library’s external environment, fish-eye images were captured using a fish-eye camera and imported into Rayman Pro software for sky view factor (SVF) calculations [25]. Based on factors such as different SVF, underlying surface materials, prevailing wind direction, distance from water bodies, and solar trajectory, nine typical areas with different physical parameters were selected for the monitoring point layout. The specific layout positions are shown in Figure 2, and detailed information for each point is provided in Table 2.
Table 2.
Detailed information of monitoring points.
2.3.2. Monitoring Indicators and Methods
Meteorological data was collected at each monitoring point from 24 June to 28 June and 2 July to 5 July 2023. The monitoring period included rainy, cloudy, and sunny days. The monitored parameters included air temperature (Ta), relative humidity (RH), wind speed (Va), solar radiation (G), and globe temperature (Tg). The Vantage Pro2 weather station was placed on the roof of a building 1.5 km away from the study area, while the other instruments were placed at a height of 1.4 m above the ground. The instrument selection complied with ASHRAE55-2017 [26] and ISO7726 [27] standards, and the instruments were calibrated prior to measurements to ensure accuracy. Due to instrument limitations, Ta and RH were sampled every 1 min, while Va, Tg, and G were sampled using mobile measurements, with a 3 min stabilization period at each location before recording data. Supplementary Material Table S1 provides detailed information on the sensors used, including the instrument name, range, and resolution parameters.
2.4. Software Simulation
2.4.1. ENVI-Met Modeling and Boundary Condition Settings
This study employed ENVI-met (5.5.1) software to simulate the complex atmosphere–vegetation–surface interactions in the external environment of the library. ENVI-met is a grid-based model with a high spatial resolution (0.5–10 m) and utilizes the standard k-epsilon turbulence model and Reynolds-averaged Navier–Stokes (RANS) equations [28]. The ENVI-met simulation process consists of model establishment and boundary condition settings. Model establishment includes parameters such as the building height, area scope, vegetation, water body size, and underlying surface materials. Boundary condition settings mainly involve the date, geographical information, resolution, meteorological data, and roughness. Details are provided in Table 3.
Table 3.
ENVI-met model and boundary conditions.
2.4.2. Selection of Evaluation Indicators
Researchers domestically and internationally have analyzed user physiological and psychological sensations and combined them with actual climate measurements to identify universal comfort evaluation indicators. The main evaluation indicators include the predicted mean vote (PMV), physiological equivalent temperature (PET), universal thermal climate index (UTCI), and standard effective temperature (SET). These indicators consider slightly different factors, as shown in Table 4.
Table 4.
Comfort evaluation indicators.
PET is based on the Munich Personal Energy Balance Model and is expressed in degrees Celsius. Due to its intuitive nature and accurate evaluation of comfort, PET has been widely used in various fields, including environmental studies. Therefore, this study selects PET as the evaluation indicator for external environmental comfort.
2.4.3. Simulation Scheme Design
To study the external environment of the library, an orthogonal experiment was conducted to design the combination of the water body, underlying surface material, and vegetation parameters. The water body parameters included no water body, water body on the south side of the building, water body on the north side of the building, and enclosed water body. The underlying surface materials included asphalt, soil, pavement bricks, and concrete. The vegetation parameters were selected based on field investigations and literature references [33], and the suitable vegetation for the local area in Shihezi City was chosen. The vegetation parameters are detailed in Table 5. The vegetation options included grass, grass with large-leaved white wax, grass with white elm, and grass with Chinese pine. The control group, denoted as Case0, consisted of only the building and soil as the underlying surface. The specific schemes are shown in Table 6. The schemes were simulated using ENVI-met. To ensure the accuracy of the ENVI-met simulation, the boundary conditions were set as described in Table 3 to explore the regulatory mechanisms of various parameters on microclimate and comfort.
Table 5.
Vegetation parameters [33].
Table 6.
Simulation schemes.
3. Results and Discussion
3.1. Questionnaire Analysis
A total of 133 people participated in the survey, with 78 males and 55 females, accounting for 58.6% and 41.4%, respectively. The survey analysis revealed that male participants had slightly higher thermal sensation votes (TSV) compared to females. Under the same TSV conditions, males tended to dress more comfortably than females [34]. Participants who had lived in Xinjiang for more than 3 years had an average decrease of one level in TSV compared to those who had lived there for less than a year under the same climatic conditions. This indicates that the adaptation period has a significant impact on thermal comfort, suggesting that thermal history plays a role in comfort perception [35]. An analysis of thermal preferences showed that 97% of the participants wished to reduce solar radiation, and 91% of them wanted to lower the temperature. Therefore, temperature and solar radiation were identified as the main causes of discomfort during the summer for both students and teachers. To accurately evaluate thermal comfort in different regions, scholars have modified the PET index range based on local climate and human parameters, as shown in Table 7.
Table 7.
PET neutral temperature and comfort ranges.
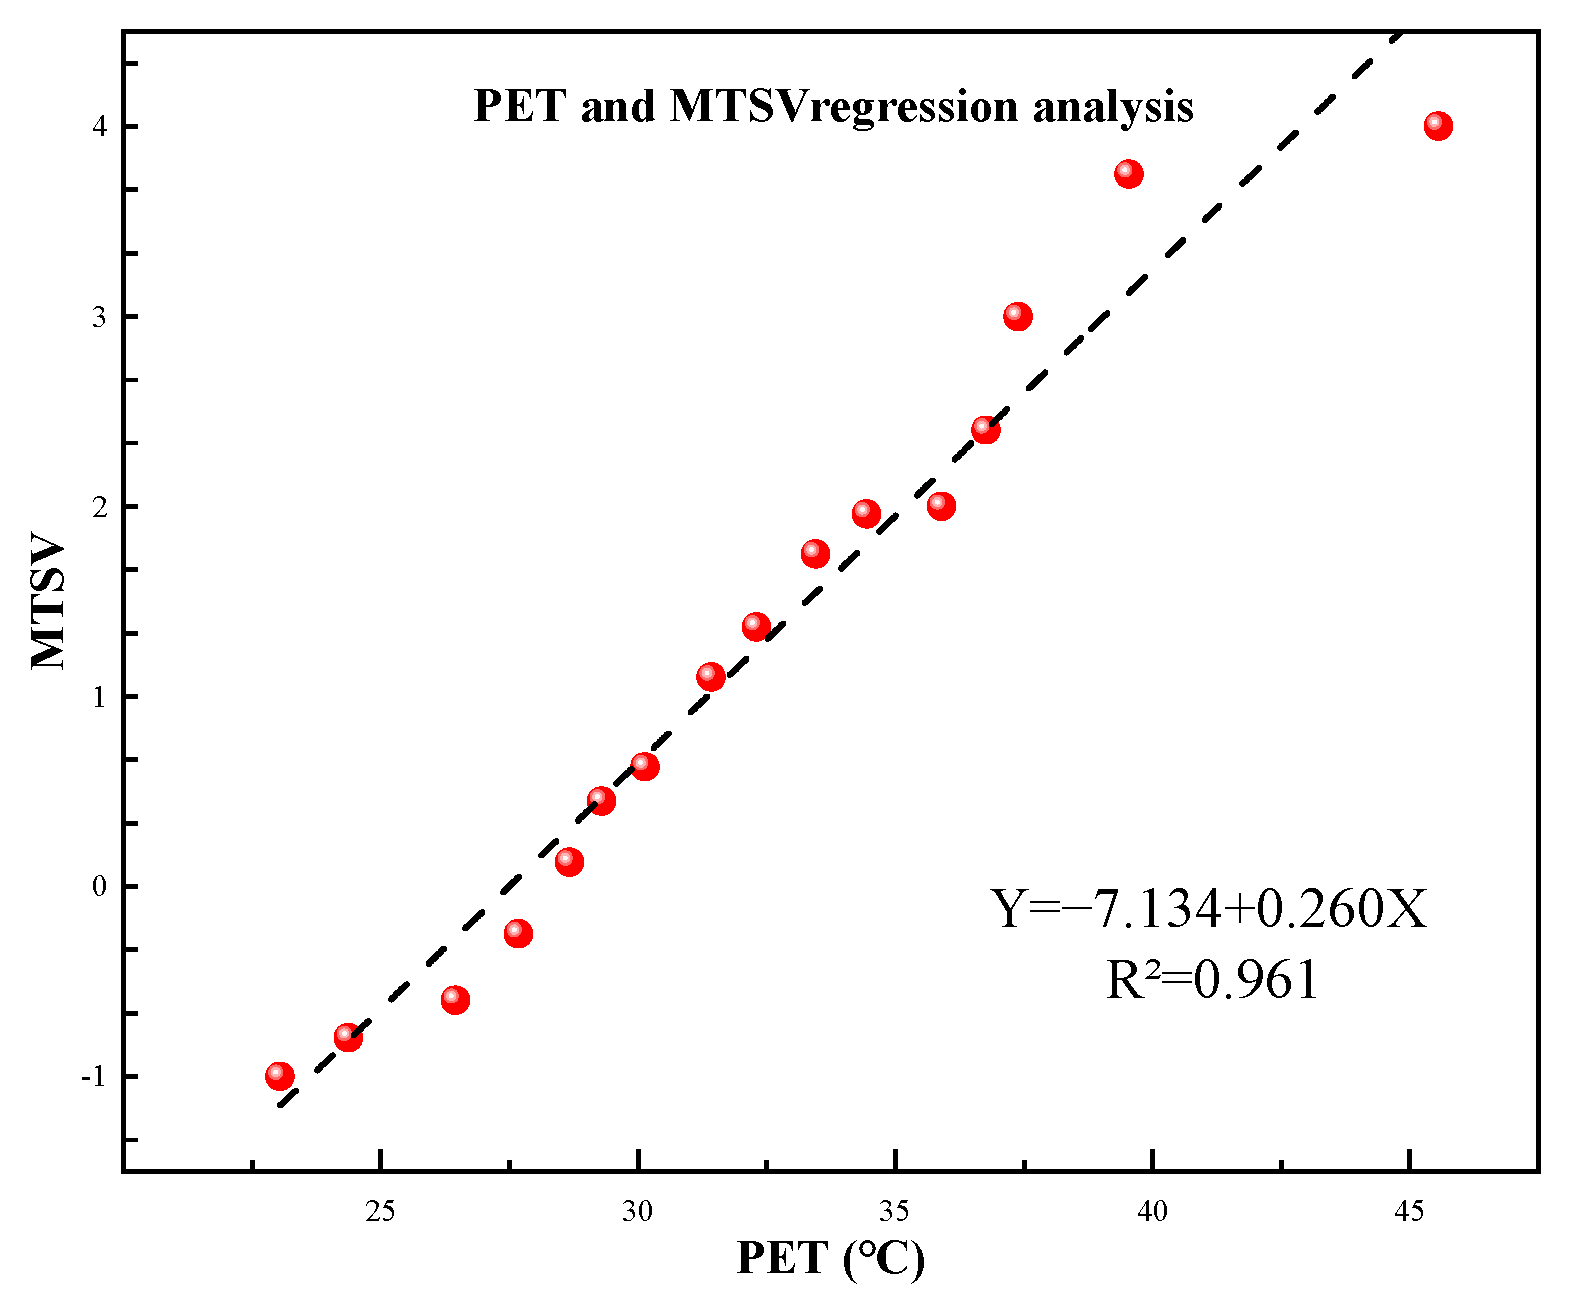
Based on the analysis above, the TSV varies among residents in different climatic regions, and the neutral temperature and thermal comfort range of PET also differ. In order to accurately evaluate comfort in Xinjiang, the PET evaluation range for the summer was adjusted. Meteorological data collected from monitoring stations were used to calculate the mean radiant temperature (Tmrt) using Equation (1). Tmrt, along with other meteorological parameters and basic human information, were input into the Rayman Pro software to calculate PET. Based on the method used by Lin et al. [42], the average thermal sensation vote (MTSV) corresponding to each 1 °C of PET was calculated, as shown in Figure 3.
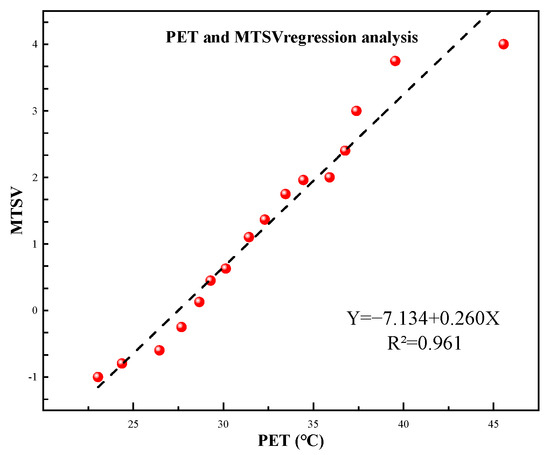
Figure 3.
PET and MTSV regression analysis (summer).
In this study, D represents the diameter of the globe (0.15 m) and its emissivity (0.95 for a black globe). Tg represents the temperature of the globe (in degrees Celsius) and Va represents the wind speed (in meters per second).
Through linear regression analysis using the data from Figure 3 in SPSS Statistics 27, the regression equation for PET and MTSV, was determined, as shown in Equation (2). According to Equation (2), when MTSV = 0, it represents the neutral temperature of PET. After calculating the equation, the neutral temperature of PET in the study area was found to be 27.44 °C. Typically, MTSV (−0.5~+0.5) is defined as the optimal comfort range, corresponding to a PET range of 25.52 to 29.36 °C, which differs from the standard PET classification range. Under the same TSV, the PET temperature in Xinjiang is higher. The specific adjusted PET ranges are shown in Table 8.
Table 8.
Categorization of PET for various levels of thermal perception.
3.2. Analysis of Field Measurements
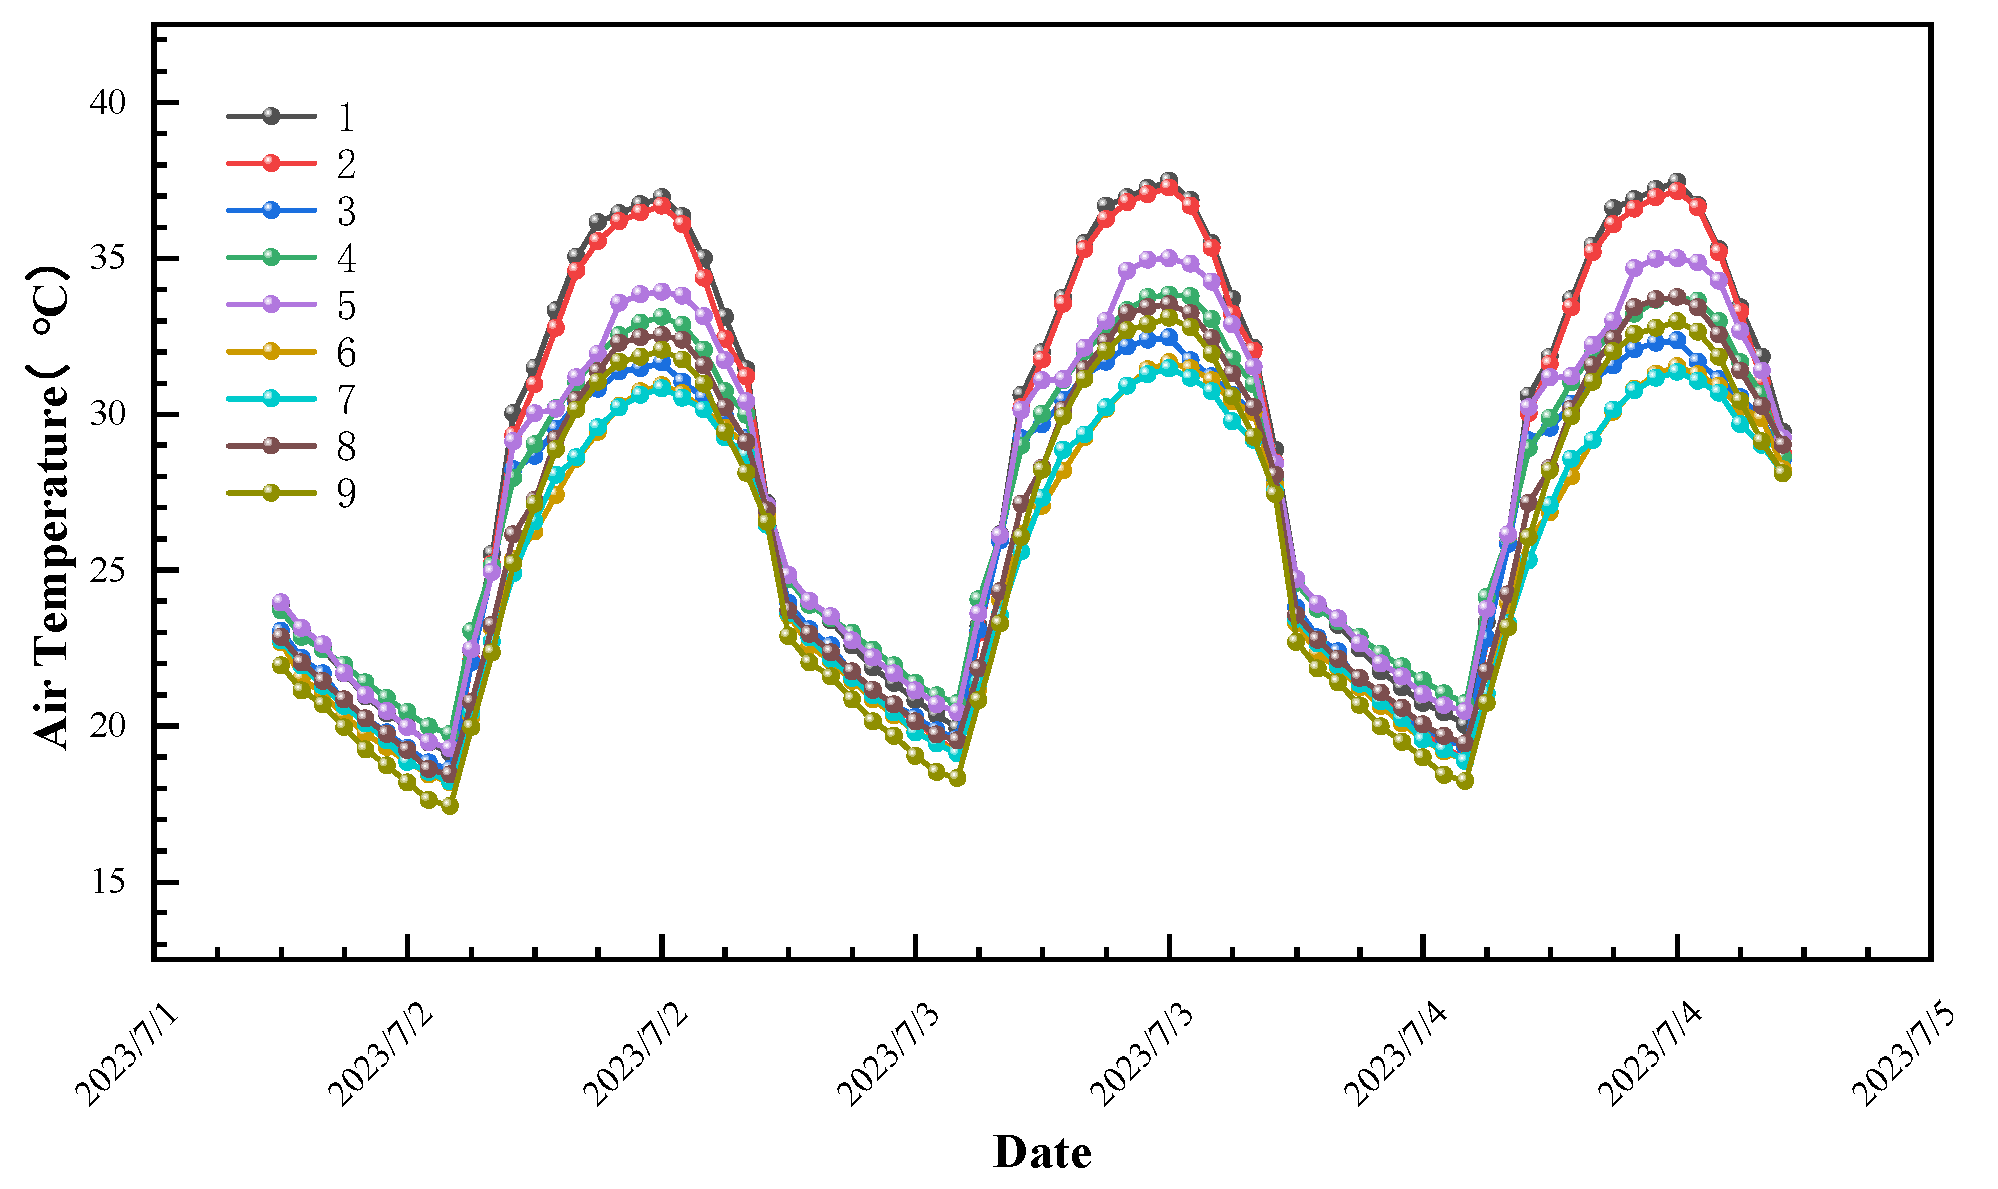
The meteorological data from different measurement points around the library area were compiled and analyzed for the period of 24 June to 26 June and 2 July to 5 July 2023. 24 June to 26 June was mostly cloudy or rainy, and there were no significant differences among the points, as shown in Supplementary Figure S1. From 2 July to 5 July, the weather was sunny, and there were significant microclimate differences among the points. Therefore, the analysis and study focused on this period. Ta, as an important factor influencing comfort, was analyzed first for each point. The specific trend is shown in Figure 4. It can be observed that the Ta variations for each point during the three days were generally similar, indicating that the monitoring data was accurate and representative of the actual trends in the study area; 3 July was selected as a typical day for detailed analysis due to its cloudless sky, high Ta, strong G, and other characteristics. The variations in Ta, RH, G, Va, Tg, and PET were analyzed in detail.
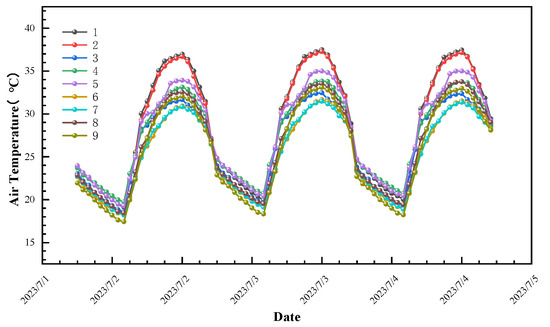
Figure 4.
Trend of temperature at measuring points, 2–4 July.
3.2.1. Air Temperature (Ta) and Relative Humidity (RH)
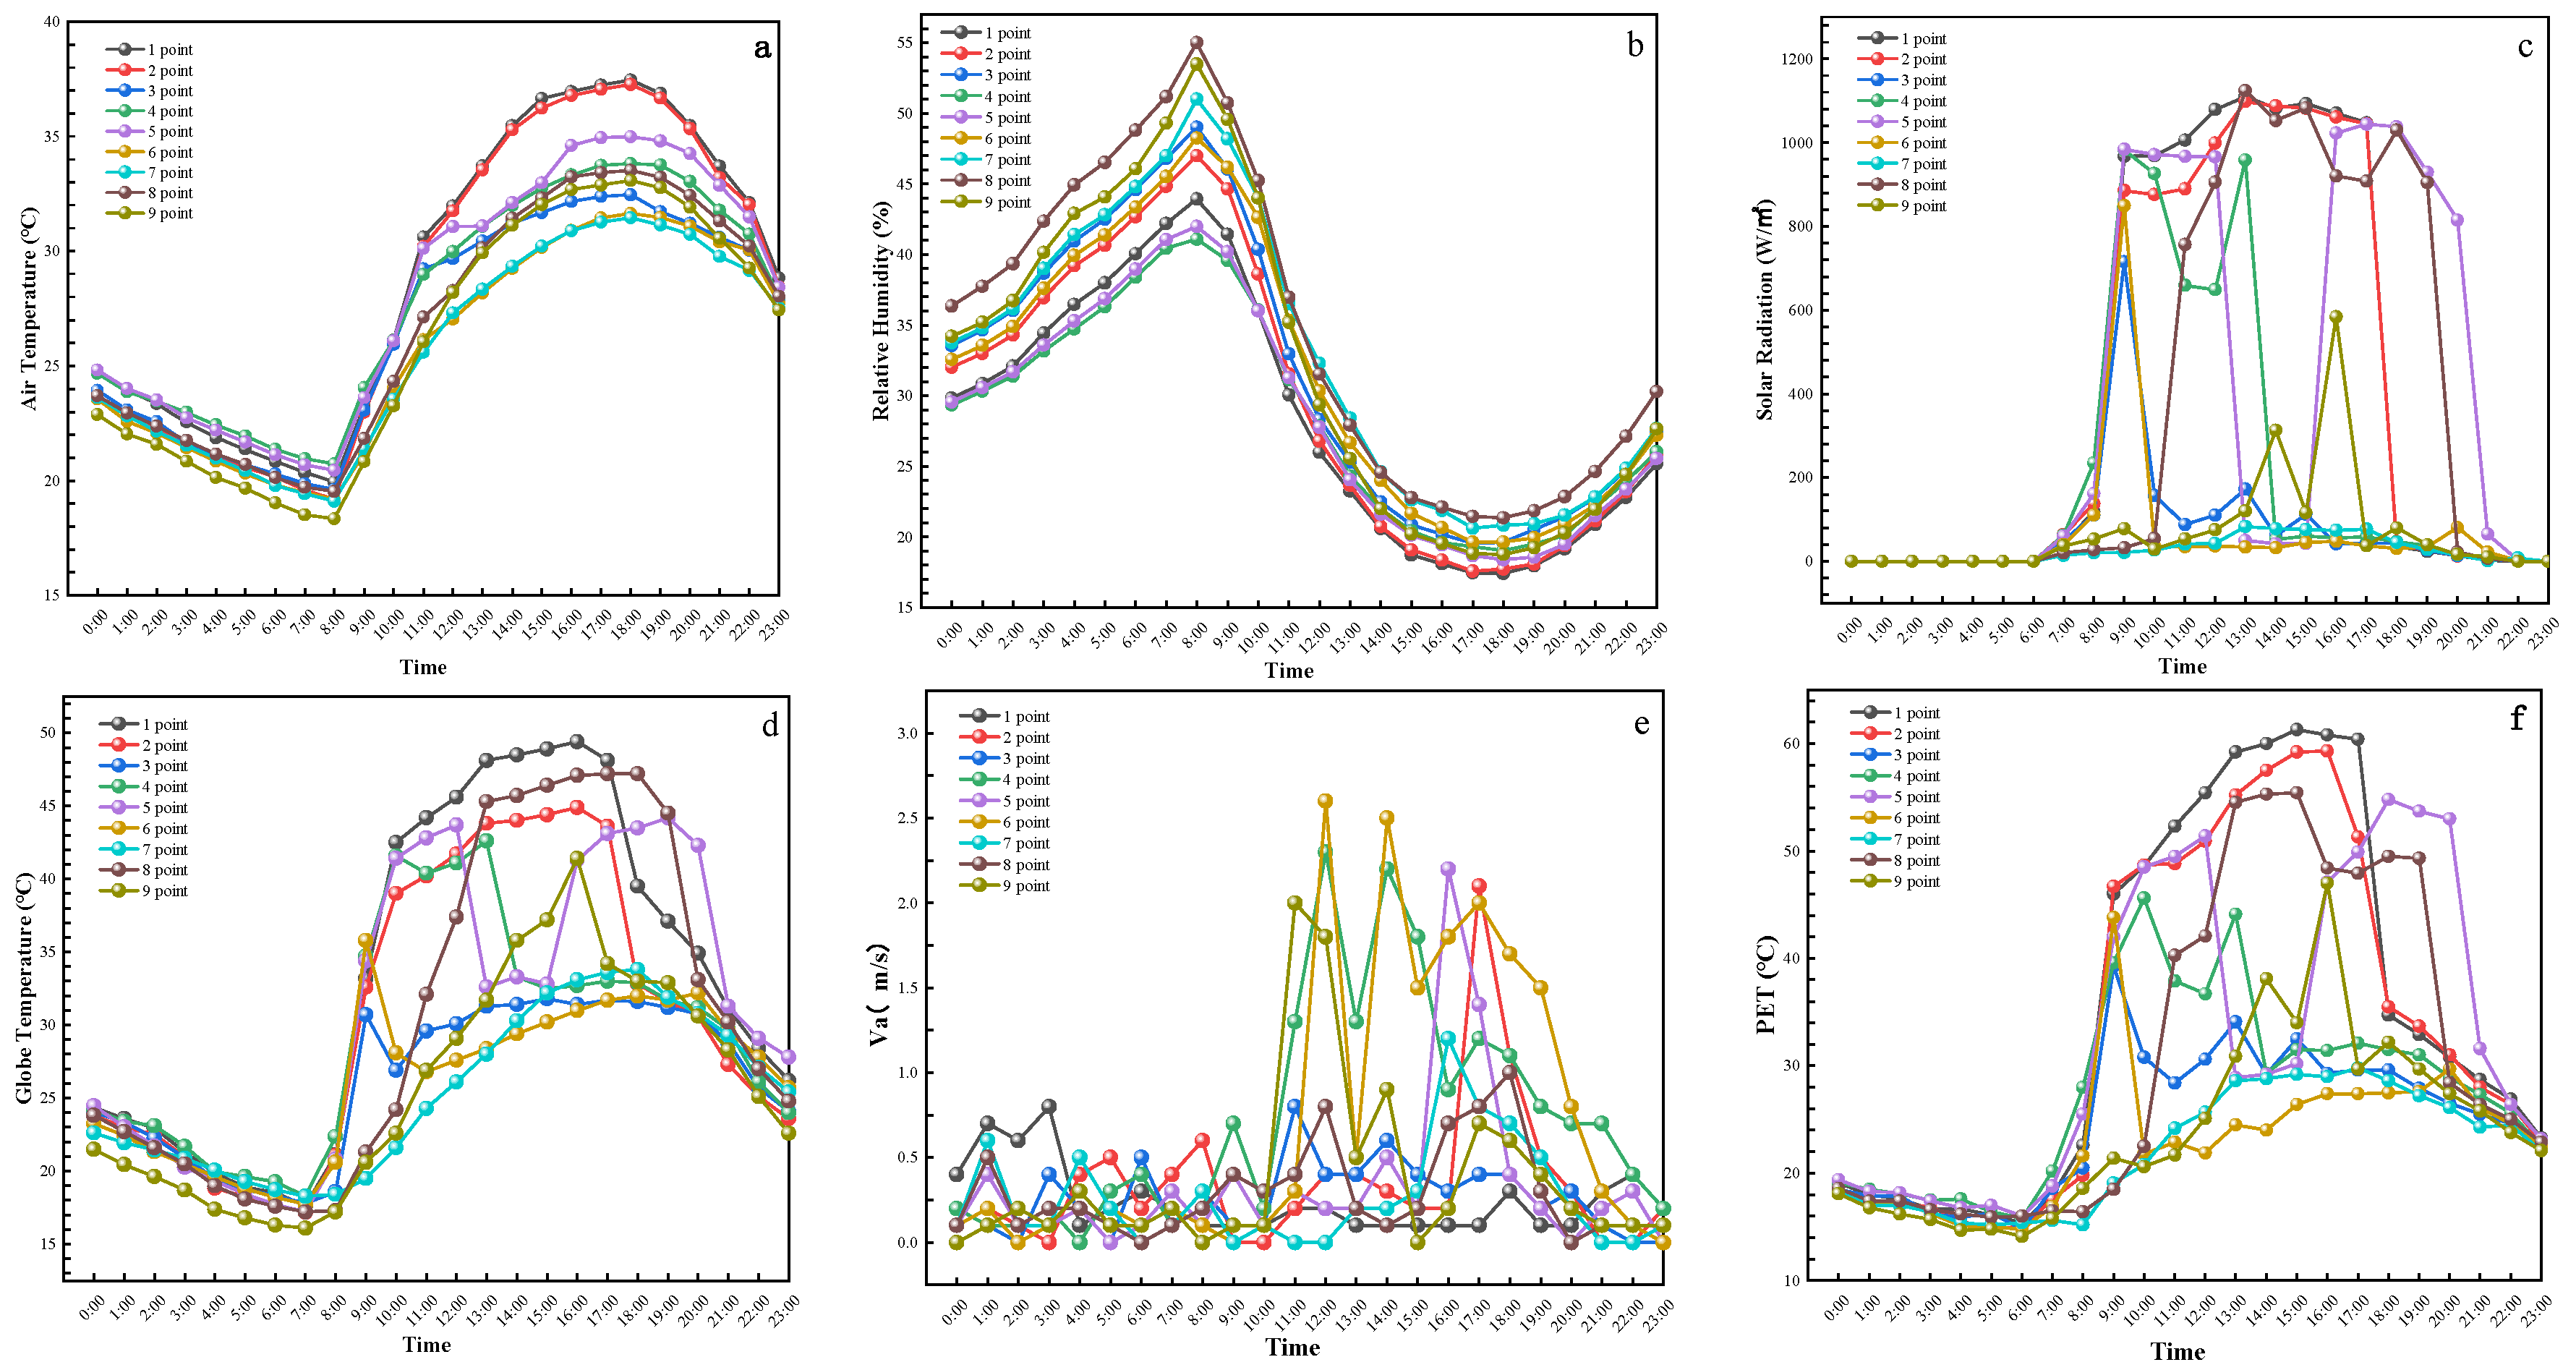
As shown in Figure 5a,b, Ta decreases and RH increases with time from 0:00 to 8:00 at all measurement points. Ta reaches its lowest point and RH reaches its peak at 8:00. After 8:00, Ta increases and RH decreases as G strengthens, reaching their peaks and lowest points at 18:00, respectively. At 18:00, points 1 and 2 have higher Ta (37.47 °C and 37.26 °C, respectively) and lower RH (17.40% and 17.71%, respectively). These two points have no buildings or vegetation obstructions, with SVF values of 0.871 and 0.796, and G values of 1047 W/m2 and 1045 W/m2, respectively. Due to the presence of water bodies around point 2, evaporation-induced heat absorption regulates the microclimate, resulting in lower Ta compared to point 1. After 18:00, as the sun trajectory changes, G gradually weakens, leading to a decrease in Ta and an increase in RH. Points 1 and 2 have no obstructions, allowing rapid heat dissipation and significant decreases in Ta compared to other points during the same period. Points 3, 6, 7, and 9 have lower Ta and higher RH throughout the entire period. Point 3 is shaded by trees, with an SVF of 0.375 and weak G, and is also influenced by the presence of water bodies. Point 6 is shaded by buildings except during 8:00–10:00 when it is exposed to strong G, and the higher reflectance of the underlying surface material causes lower Ta compared to other points during the same period. Point 7 is located on the west side of the building, shaded by both trees and buildings, with an SVF of 0.155, weak G, and an underlying surface of grass, which has a cooling and humidifying effect. Point 9 is partially shaded by vegetation, with an SVF of 0.510 and weak G, and the presence of a large water body and soil as the underlying surface enhances convective heat exchange, resulting in a more significant cooling and humidifying effect. Although point 8 is exposed to strong G, it is close to the water body and located in the dominant downwind direction, and is thus significantly influenced by the water body and has a better Ta and RH compared to points 1 and 2.
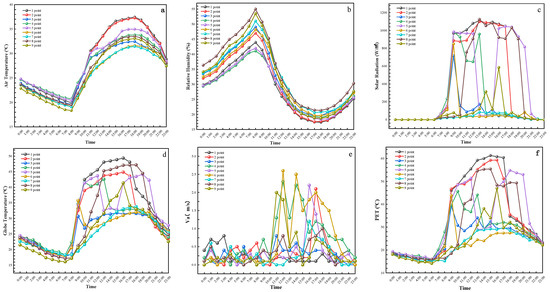
Figure 5.
Hour-by-hour changes in microclimate parameters and PET on 3 July. Notes: (a) Ta, (b) RH, (c) G, (d) Tg, (e) Va, (f) PET.
3.2.2. Solar Radiation (G) and Black Globe Temperature (Tg)
As shown in Figure 5c,d, the variation trend of Tg from 0:00 to 7:00 is consistent with Ta, with a difference of around ±0.2 °C. As G strengthens with sunrise at 7:00, Tg increases significantly. From 9:00 to 17:00, point 1 has the highest Tg among all points due to its high SVF value and higher reflectance of the underlying surface. Tg reaches its peak at 16:00, with a value of 49.4 °C, which is 12.4 °C higher than Ta. This phenomenon may be due to G reaching its peak at 16:00, and although Ta continues to rise after 16:00, G gradually weakens and significantly affects Tg, resulting in its peak value at 16:00. Point 6 experiences a significant increase in Tg during 8:00–10:00 due to direct sunlight exposure, but after 10:00, it is shaded by buildings, leading to weakened G and a more stable Tg with little difference from Ta. Point 5, located on the north side of the building, experiences weakened G from 13:00 to 15:00 due to building shading, resulting in a slight decrease in Tg with little difference from Ta. Points 3, 6, and 7 have weak G throughout the entire period, and Tg has no significant difference from Ta, once again demonstrating the significant influence of G on Tg. Points 1, 2, 5, and 8 have highly reflective underlying surfaces and are mostly exposed to strong G, resulting in significant differences between Tg and Ta.
3.2.3. Wind Speed (Va) and Physiological Equivalent Temperature (PET)
As shown in Figure 5e,f, there is no significant change in PET at all measurement points from 0:00 to 7:00. With the strengthening of G after sunrise at 7:00, PET increases rapidly. Points 1 and 2 have high SVF values and no obstructions, resulting in higher PET levels throughout the day. Point 2 has a water body nearby, a hard surface as the underlying material, and is located in a corner of the building, leading to higher Va compared to point 1 and a slightly lower PET. Point 5 experiences a significant increase in PET from 8:00 to 12:00, but from 12:00 to 15:00, it is shaded by the building, resulting in reduced G and a significant decrease in PET. From 15:00 to 18:00, with the change in sun trajectory, the shadow of the building disappears, leading to a significant increase in PET. Point 8 receives a large amount of G overall, but there is a large water body nearby, which has a cooling and humidifying effect on the environment. Additionally, due to the wide water surface with no obstructions, Va is stronger, resulting in a lower PET compared to points 1 and 2. Points 6 and 7 are shaded by both buildings and vegetation throughout the day, resulting in weak G and lower PET levels.
3.2.4. Pearson Correlation Analysis
During the analysis of the measured data, it was found that vegetation, water bodies, and underlying surface materials have significant effects on Ta, RH, Tg, G, Va, and PET. However, the specific extent of these effects cannot be accurately determined. Therefore, Pearson correlation analysis was conducted. As shown in Figure 6, Ta is positively correlated with all parameters except RH and reflectance, with a correlation coefficient of −0.928 for Ta and RH, indicating a significant negative correlation. RH is slightly correlated with reflectance but significantly correlated with other parameters, mainly due to its relationship with water bodies and vegetation, among other factors, which need to be considered comprehensively. Tg is negatively correlated with reflectance and RH, but positively correlated with other parameters, especially with G. SVF is positively correlated with all parameters except RH and reflectance. PET is slightly correlated with Va but significantly correlated with other meteorological parameters, mainly due to the error in recording instantaneous Va. The correlation coefficients are as follows: Tg (0.952) > G (0.913) > Ta (0.709) > RH (−0.522) > SVF (0.310) > reflectance (−0.223) > Va (0.133). It can be concluded that G and Ta have a significant impact on PET.
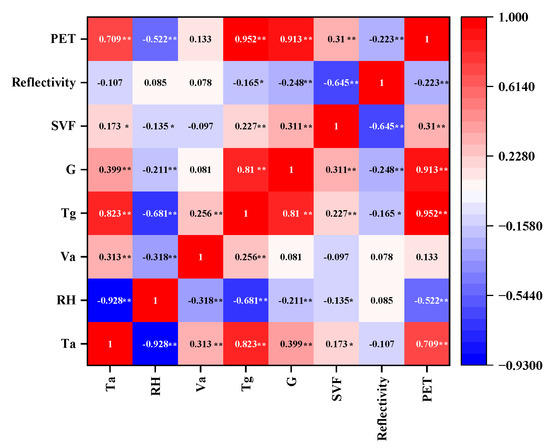
Figure 6.
Heat map of correlation. Note: ** is a very significant correlation, * is a significant correlation.
3.3. Analysis of Simulation Results
3.3.1. Validation of ENVI-Met Model Accuracy
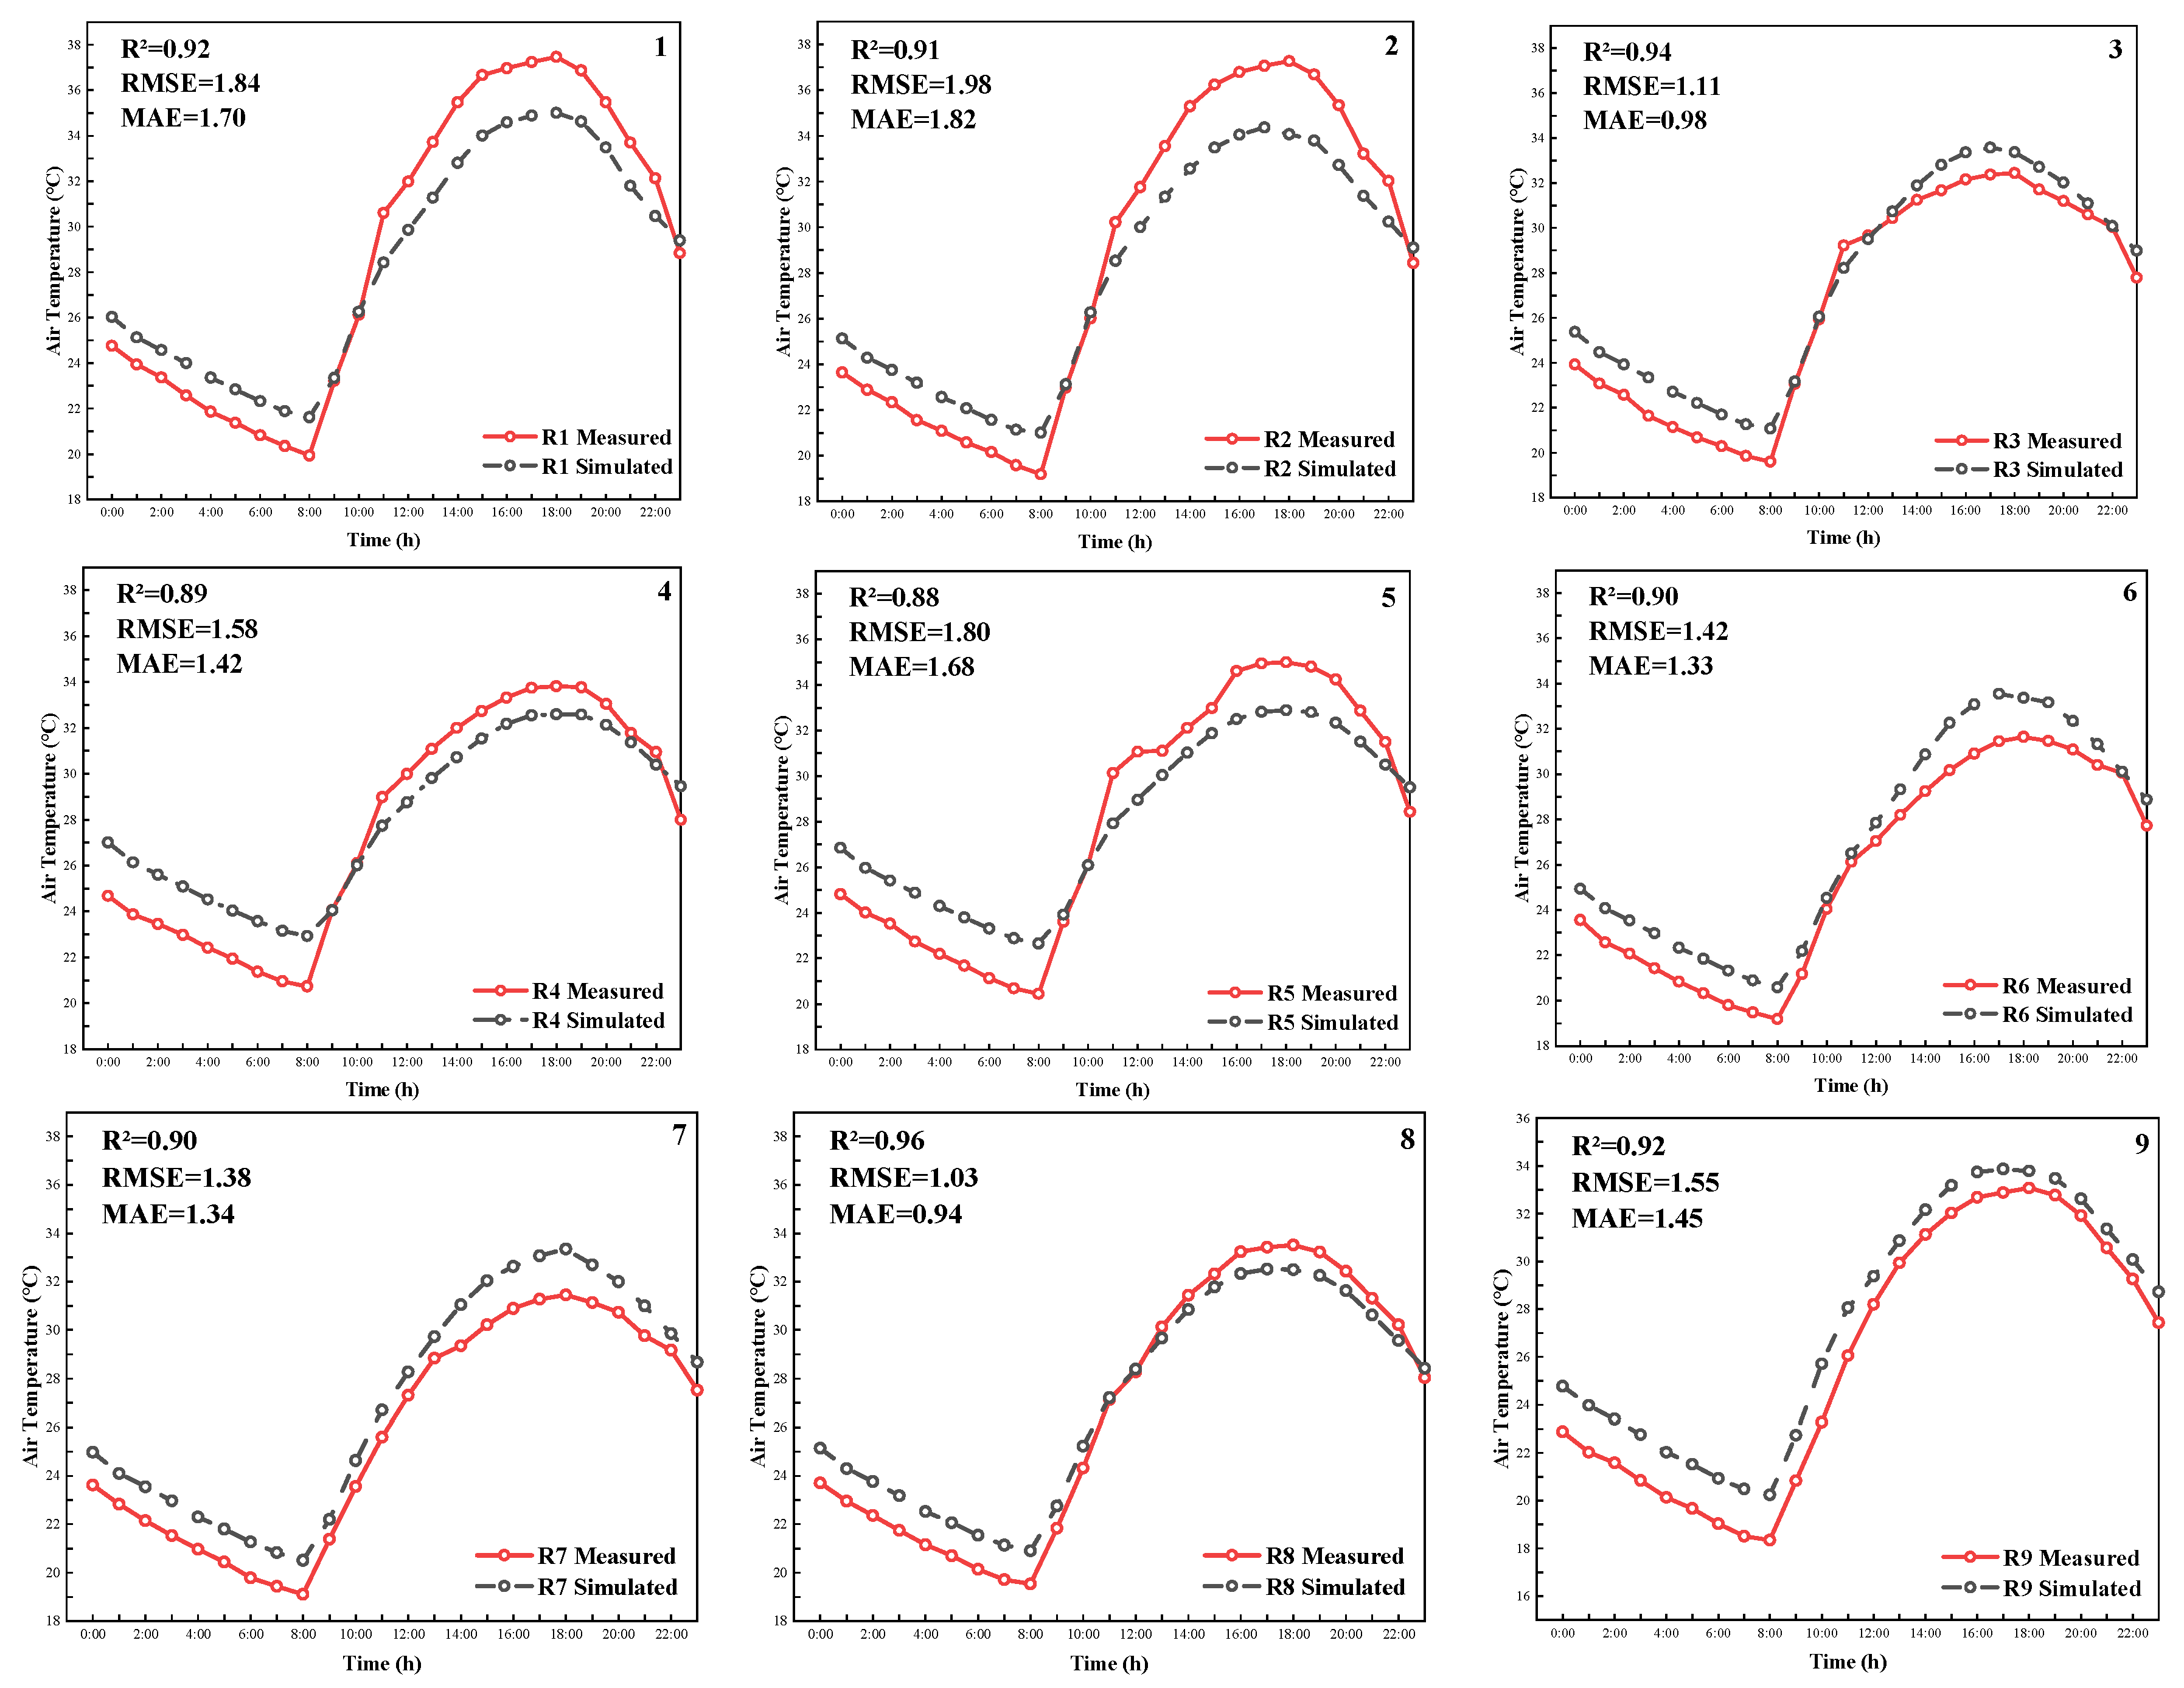
Currently, ENVI-met simulations are mainly conducted for humid and hot regions, with limited simulations in hot and arid areas. Therefore, to validate the accuracy of the ENVI-met software in simulating hot and arid areas, the simulated Ta values at various points were compared with the measured Ta daily variation trends, as shown in. The root mean square error (RMSE) and mean absolute error (MAE) were used to evaluate the accuracy of the model [44], as shown in Equations (3) and (4). The trend and error parameters at each point are shown in Figure 7.
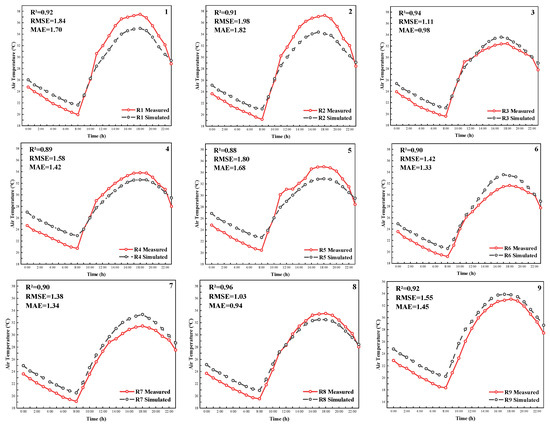
Figure 7.
Verification of measured and simulated accuracy. Note Numbers 1~9 represent the nine measuring points around the library.
Rosso [45] and Salata [46] conducted multiple studies and found that the RMSE between ENVI-met simulated values and measured values ranged from 0.66 °C to 7.98 °C. The currently accepted RMSE values range from 0.52 °C to 4.30 °C, and MAE values range from 0.27 °C to 3.67 °C [47]. In this study, the RMSE errors between the measured and simulated values ranged from 1.03 °C to 1.98 °C, and the MAE errors ranged from 0.94 °C to 1.82 °C, which meet the requirements and indicate good simulation results.
3.3.2. Analysis of Simulation Schemes
- Orthogonal Experimental Simulation Scheme Analysis
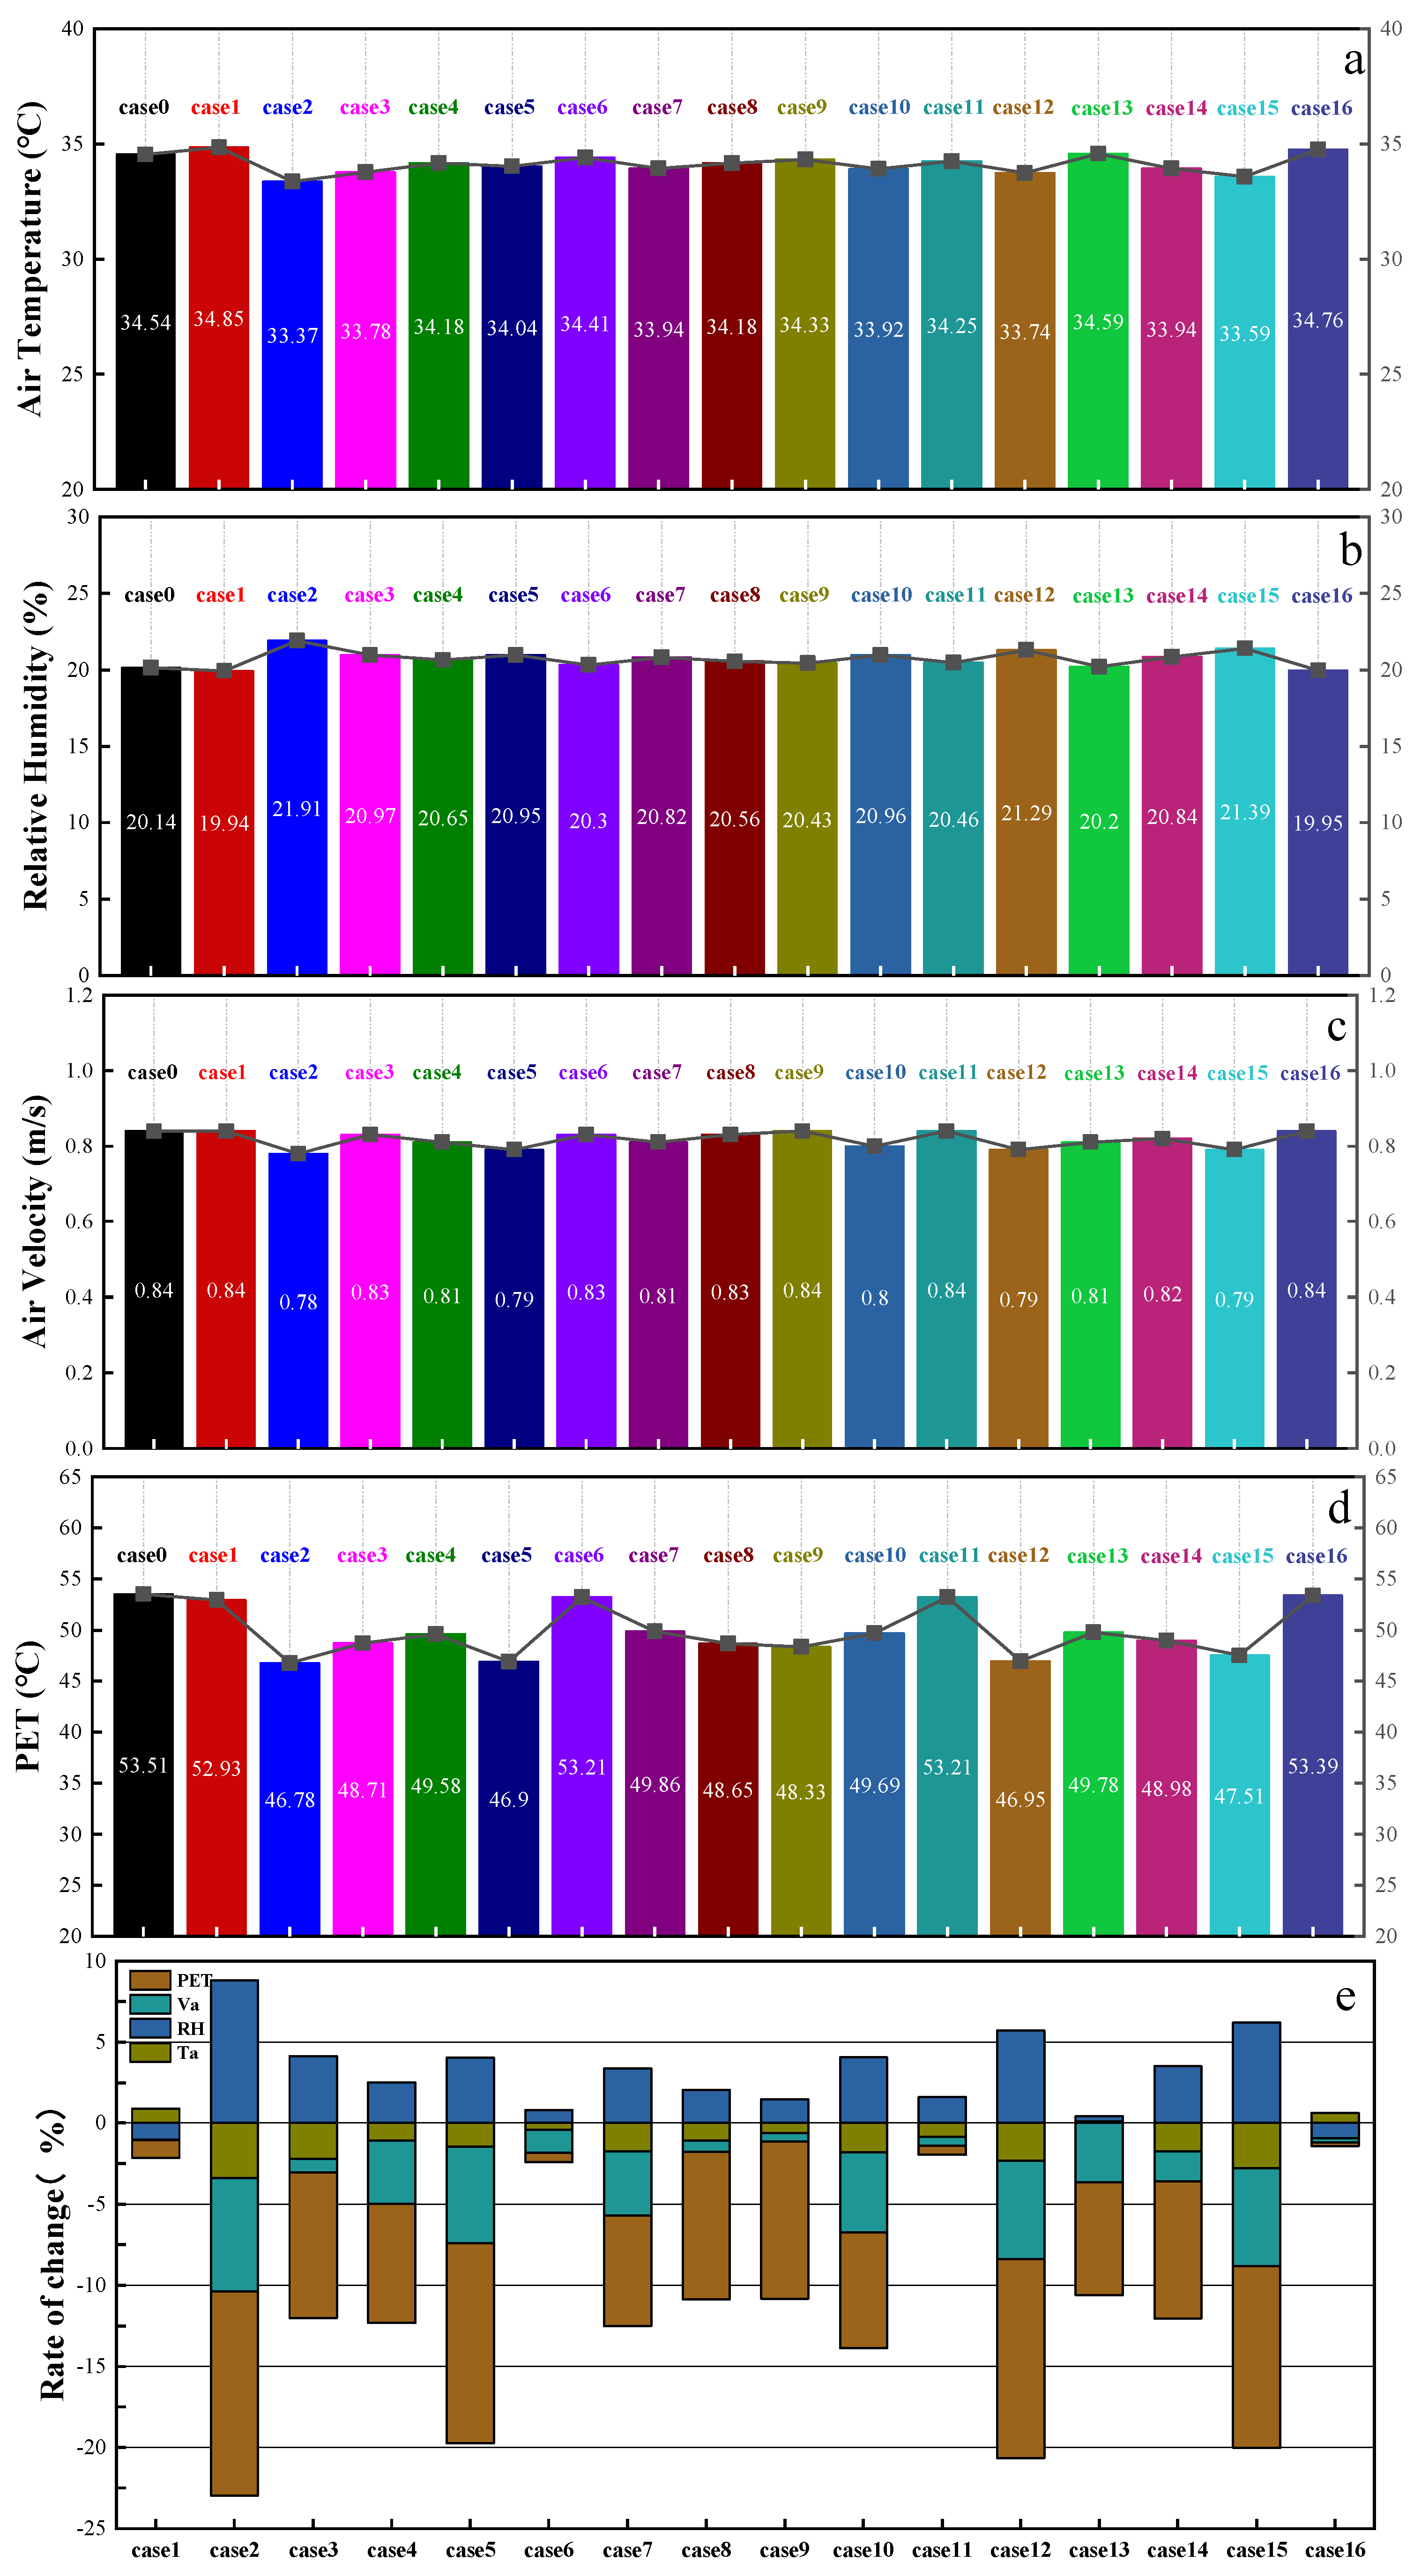
The simulated results of Ta, RH, Va, and PET at 18:00 for different schemes were output, and the simulation results and parameter variations are shown in Figure 8.
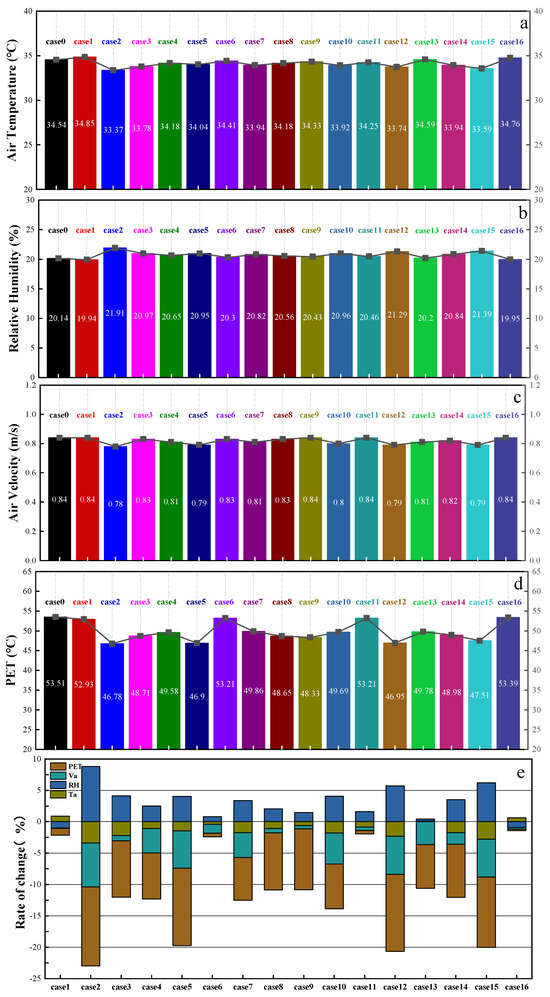
Figure 8.
Variation in meteorological parameters and PET for different programmes. Note: (a) Ta change; (b) RH change; (c) Va change; (d) PET change; (e) Meteorological parameters and rate of change in PET.
(1) Air Temperature (Ta) and Relative Humidity (RH)
As shown in Figure 8a,b,e, cases 2, 3, 12, and 15 showed significant cooling and humidification effects at 18:00. Ta decreased by 1.77 °C, 0.76 °C, 0.80 °C, and 0.95 °C, with a decrease rate of 3.39%, 2.20%, 2.33%, and 2.76%, respectively. RH increased by 1.77%, 0.83%, 1.15%, and 1.25%, with an increase rate of 8.81%, 4.14%, 5.71%, and 6.20%, respectively. Among them, case 2 showed the most significant cooling and humidification effect. This phenomenon is mainly because the water body on the south side of case 2 is dominant in the upwind direction, resulting in a significant cooling and humidification effect on the downwind area. The underlying surface is soil, which enhances the heat exchange between the air and the ground. The vegetation consists of grass and large-leaved wax, and the large canopy of large-leaved wax can effectively block and reflect solar radiation, thereby weakening its impact on Ta and RH. The schemes with significant cooling and humidification effects combine grassland with large-canopy deciduous trees, indicating that the canopy size of vegetation has a significant impact on cooling and humidification effects [48]. Cases 1 and 16 showed an increase in Ta at 18:00 compared to case 0, with a change rate of 0.9% and 0.63%, respectively. RH decreased by 0.12% and 0.19%, with a decrease rate of 1.00% and 0.93%, respectively. The reason for this phenomenon is that the underlying surface material of case 1 is asphalt, which has a dark color and low reflectance, resulting in the absorption of a large amount of heat in summer, causing an increase in Ta and a decrease in RH [49,50]. The water body also has a positive regulatory effect on microclimate, especially thermal comfort [51], and case 16 does not have a water body, resulting in high Ta and low RH.
(2) Wind Speed (Va)
As shown in Figure 8c,e, the Va values of cases 1–16 decreased compared to case 0 at 18:00, but the decrease was not significant. Among them, cases 2, 5, 12, and 15 showed more significant changes in Va at 18:00, with a decrease of 0.06 m/s, 0.05 m/s, 0.05 m/s, and 0.05 m/s, respectively, representing a decrease rate of 7.01%, 5.95%, 6.04%, and 6.05%. The reason for this phenomenon is mainly due to the blocking effect of tree canopies, which weakens Va in pedestrian locations. To reduce the impact of canopy on Va, tall trees can be planted to avoid the weakening of Va in pedestrian locations, thereby improving summer comfort [52]. Cases 1, 6, 11, and 16 changed the underlying surface material compared to case 0, and the roughness of the material affects Va. The introduction of grassland in the schemes also has an impedance effect on Va through friction [53].
(3) Physiological Equivalent Temperature (PET)
As shown in Figure 8d,e, the PET of cases 1–16 decreased compared to case 0 at 18:00. Cases 2, 5, 12, and 15 showed more significant decreases in PET, with a decrease of 6.73 °C, 4.80 °C, 6.56 °C, and 6.00 °C, representing a decrease rate of 12.57%, 12.35%, 12.27%, and 11.21%, respectively. Among them, case 2 showed the most significant decrease in PET. The reason for this phenomenon is the addition of an upwind south-side water body, which leads to cooling and humidification effects. The vegetation consists of grass and large-leaved wax, and the large canopy of large-leaved wax reduces the impact of solar radiation. The underlying surface is asphalt, which has low reflectivity. Cases 5, 12, and 15 all have water bodies and vegetation consisting of grass and large-leaved wax, with large canopies resulting in a significant decrease in PET compared to case 0.
In summary, through the analysis of different scenarios, it was found that the location of water bodies, vegetation canopy width, and underlying surface materials significantly affect Ta, RH, Va, and PET. In the arrangement of water bodies, the dominant wind direction should be considered, and water bodies should be placed in the upwind direction to maximize cooling and humidification. In the arrangement of vegetation, a combination of grass and trees should be considered, and in areas with high radiation, vegetation with larger canopy widths should be selected to minimize the impact of solar radiation on microclimate and comfort. In the arrangement of underlying surfaces, the influence of different material reflectivity on microclimate and comfort should be considered, and materials should be selected appropriately based on their locations.
- 2.
- Analysis of the Best PET Scenario
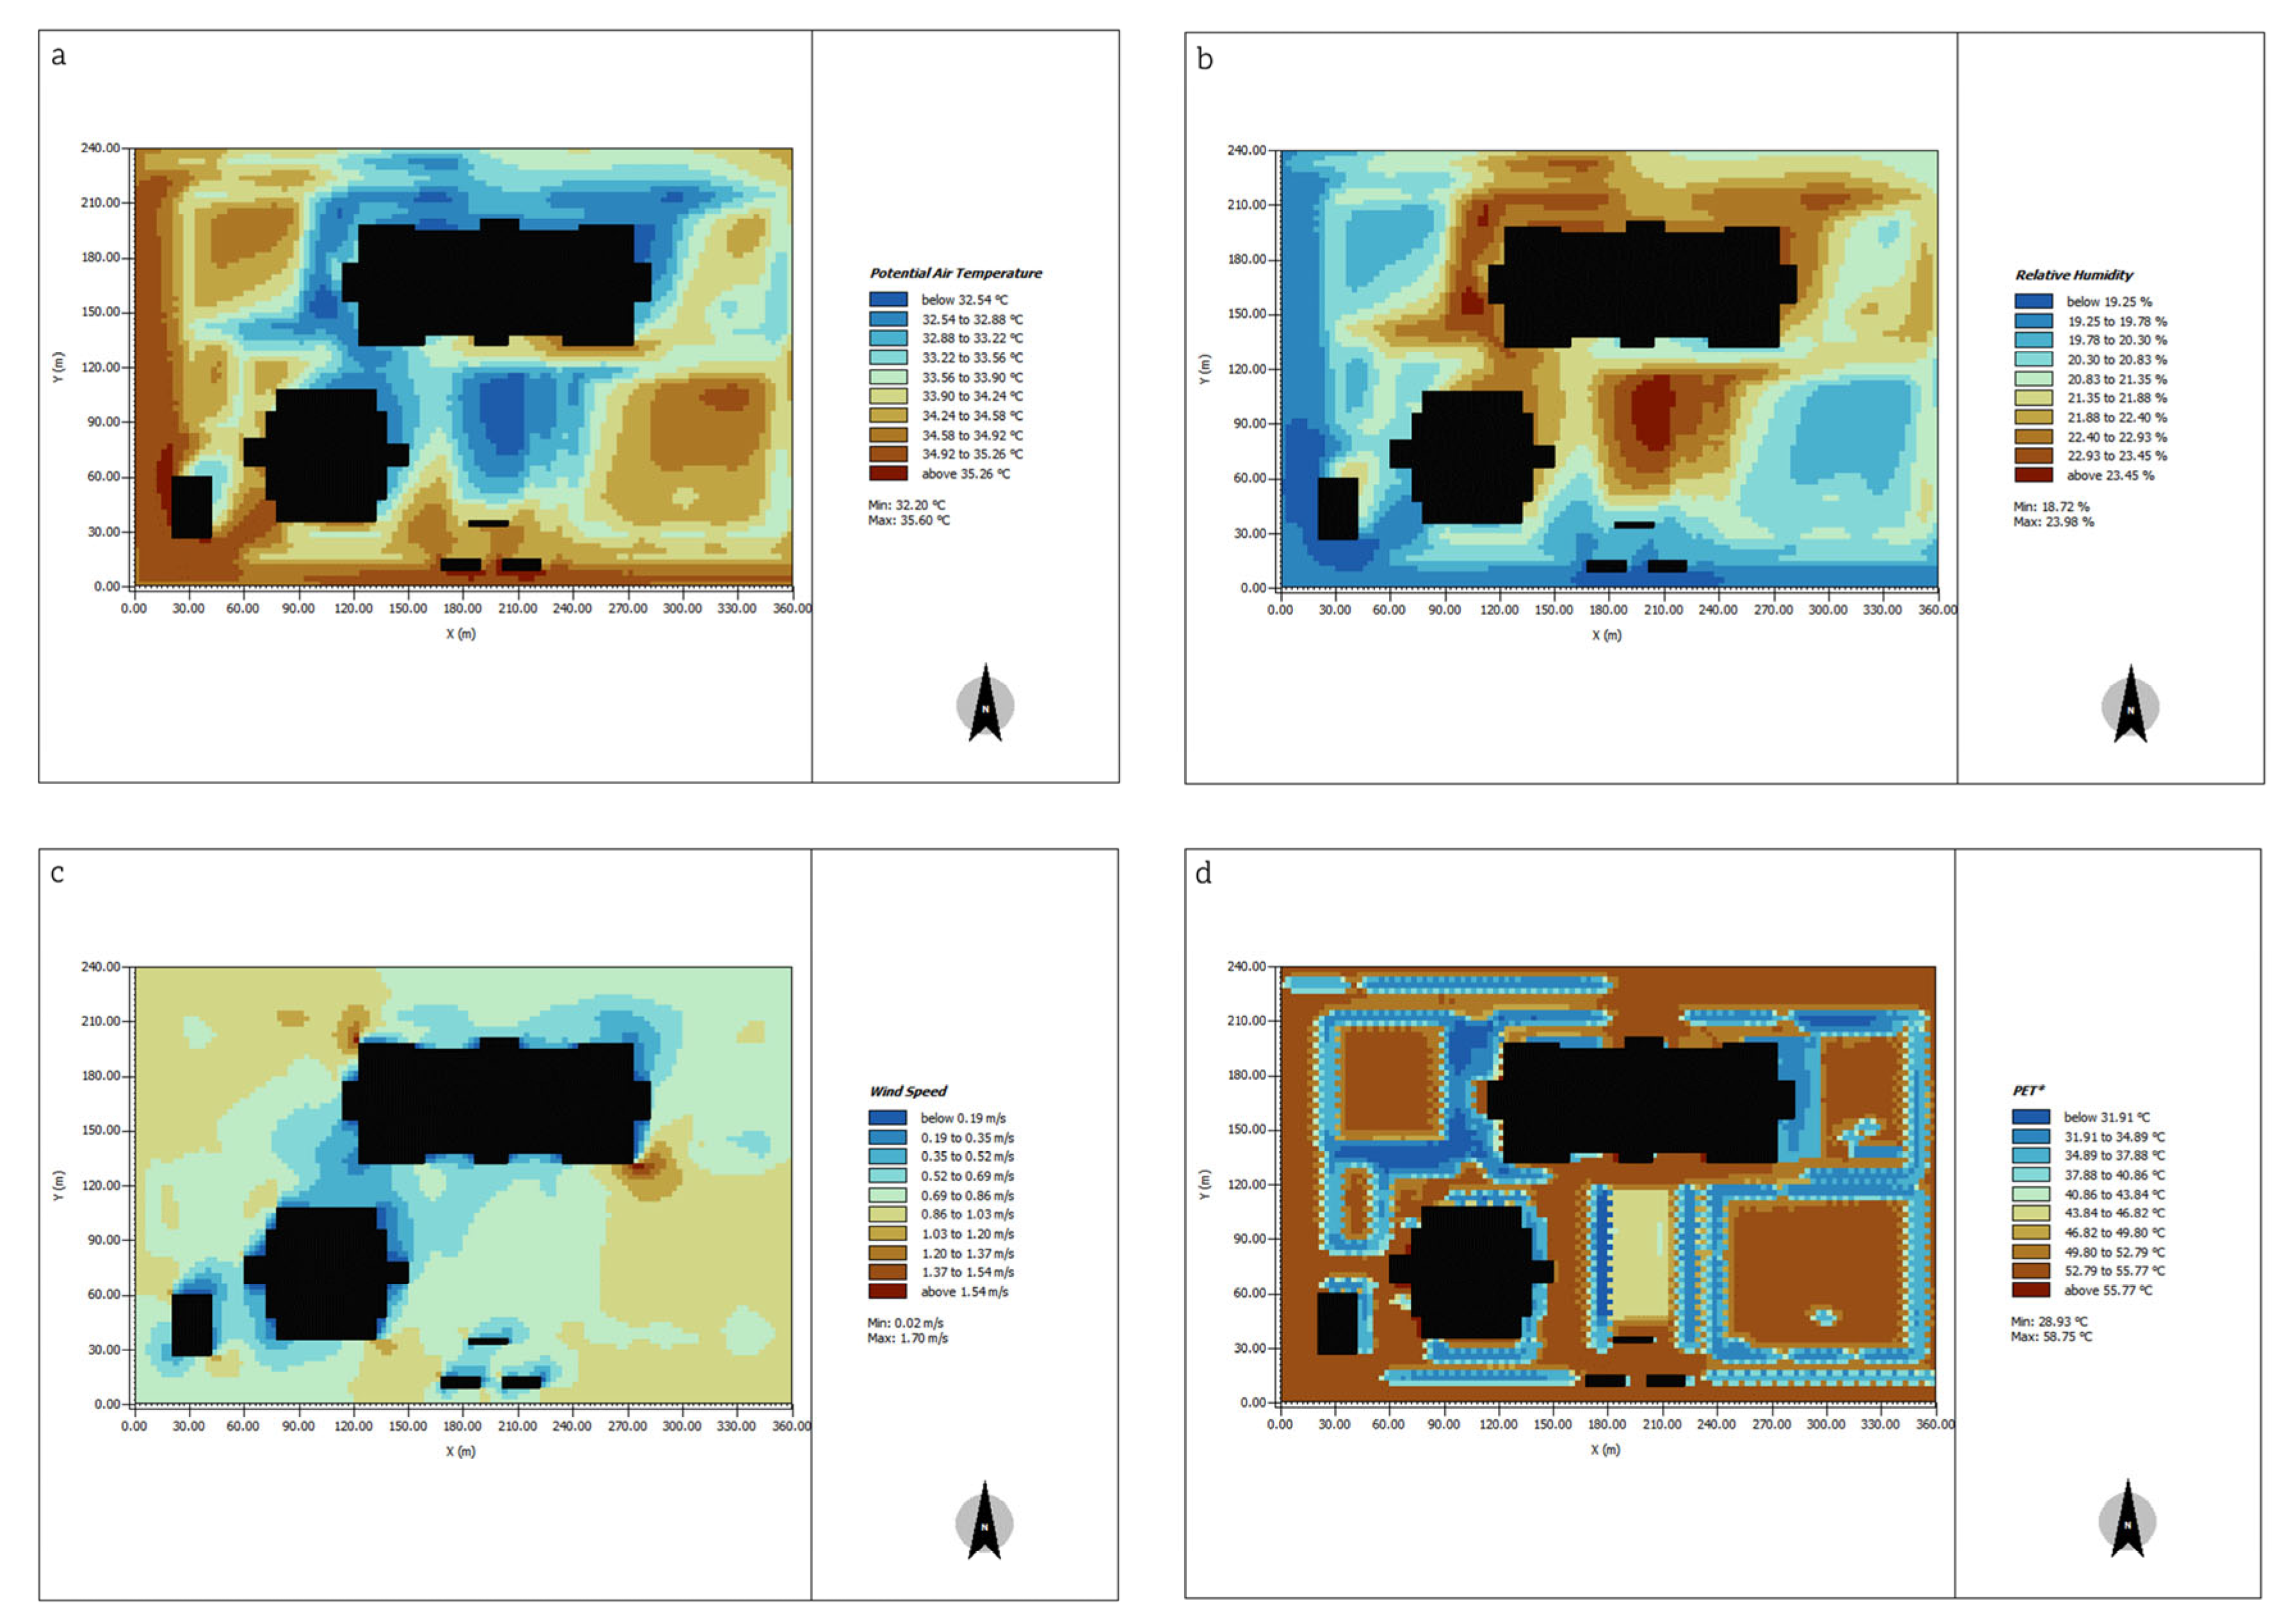
Based on the simulation results of the 16 different scenarios from the orthogonal experiment combinations, the influence trends of water bodies, vegetation, and underlying surface materials on PET were determined. The sum of PET values corresponding to each factor at the same level was denoted as Ki, and the average value was denoted as ki. For example, the sum of PET values corresponding to the south-side water body in the water body parameters was denoted as K1, and the average value was denoted as k1. The parameter corresponding to the minimum k under the same factor was selected as the best parameter, and the same method was applied to select the remaining parameters. By selecting the trends of parameters, the best PET design scenario was determined, which includes a water body on the upwind side, an asphalt underlying surface, and a combination of grass and large-leaved wax. The simulation results of Ta, RH, Va, and PET at 18:00 are shown in Figure 9.

Figure 9.
Output microclimate parameters of the optimal PET scheme. Note: The black part is the building, (a) is Ta, (b) is RH, (c) is Va, and (d) is PET.
As shown in Figure 9a,b, significant improvements in microclimates and comfort around the library are evident at 18:00, especially in spaces under vegetation. The Ta under vegetation is 32.54~34.24 °C, a cooling of 0.91~1.9 °C compared to Case 0, while other uncovered spaces show insignificant changes, resulting in an overall average temperature reduction of 0.59 °C, or 1.7%. The RH is 21.51~23.45%, with an increase of 1.35~3.25% compared to case 0, and other spaces show negligible changes, leading to an overall average humidity increase of 0.94%, or 4.67%. As depicted in Figure 9c, Va under vegetation decreases but not significantly, with an overall average reduction of 0.05 m/s, or 6.00%. Figure 9d shows that PET under vegetation is 31.27~34.92 °C, a significant decrease of 18.42~22.43 °C compared to case 0, falling within the comfortable and slightly warm range. The rest of the spaces exhibit insignificant changes, resulting in an overall average reduction in PET of 6.73 °C, or 12.59%. Analyzing the microclimate and comfort of this scheme reveals that the microclimate and PET under vegetation are significantly better than in areas exposed to direct sunlight.
During the research process, differential phenomena were discovered based on the trend changes obtained from orthogonal experiments in microclimates and PET. The design scheme with the lowest Ta did not necessarily result in the lowest PET, which was attributed to differences in the underlying surface material. The best PET scheme had asphalt as the underlying surface material, which has a low reflectance, reducing reflected radiation significantly. Reflected radiation considerably impacts mean radiant temperature (Tmrt), and Tmrt significantly influences PET [54]. Xinjiang is located in a high radiation area where G is intense; asphalt material reflects far less radiation than materials with higher reflectance, such as pavement bricks and concrete. G significantly affects changes in PET, explaining the observed differential phenomenon [55,56,57].
The hot and dry climate in summer leads to poor outdoor comfort and low space utilization rates, with occupants relying on air conditioning and other cooling methods to maintain indoor comfort, thereby increasing energy consumption in buildings. This study improves the external environment comfort by analyzing and optimizing external environmental parameters (vegetation, water bodies, and underlying surface materials). Through the research, it is evident that G is the most significant factor influencing PET in the hot and dry summer region. Vegetation proves to be the most effective method of regulating PET, maintaining comfortable and slightly warm conditions under vegetation at all times. The significantly enhanced comfort resulting from the optimized external environment leads to increased outdoor space utilization. Additionally, the favorable external environment enters the building through doors and windows, reducing building energy consumption and providing strong support for green sustainable development. In future research, the optimized external environment can be combined with the building itself, considering factors such as changes in ventilation type and window size in coupled studies to achieve indoor and outdoor comfort and ultimately achieve energy-saving effects in buildings.
4. Conclusions
This study conducted research through field measurements and numerical simulations to refine the comfort evaluation index range in Xinjiang. The study determined the extent of the influence of physical parameters on microclimate and comfort, as well as the adjustment mechanisms, and ultimately identified the optimal design for the external environment of the library based on comfort.
By combining questionnaire surveys and on-site measurements, the thermal comfort of students and teachers on campus was analyzed. The regression equation MTSV = −7.134 + 0.260 × PET was determined to correct the PET evaluation range in Xinjiang, with a neutral temperature for PET of 27.44 °C and an optimal comfort temperature range of 25.52–29.36 °C. This indicates that the evaluation range of the PET index varies under different climatic conditions.
By monitoring meteorological data in different regions with different physical parameters, it was found that water bodies, vegetation, and underlying surface materials have a significant impact on comfort. The correlation between each parameter and PET is as follows: Tg (0.952) > G (0.913) > Ta (0.709) > RH (−0.522) > SVF (0.310) > reflectivity (−0.223) > Va (0.133). It can be determined that G, Ta, SVF, RH, and reflectivity have a significant impact on PET.
Through the analysis of the trend results of Ta, RH, Va, and PET for the 16 combinations in the orthogonal experiment, the best scheme was determined. The best PET design scheme involves water bodies positioned on the upwind side, asphalt as the underlying surface, combined with grass and large-leaved wax for vegetation. At 18:00, the average Ta in the study area for the best scheme decreases by 0.59 °C compared to Case 0, or 1.70%. The average RH increases by 0.94%, or 4.67%, and the average Va decreases by 0.05 m/s, or 6.00%. The average PET decreases by 6.73 °C, or 12.59%.
Through a comprehensive analysis involving subjective surveys, empirical measurements, and simulations, it was determined that G is the most significant factor influencing PET. Thus, during the analytical process, it was discovered that vegetation, due to its canopy and shading effect, obstructs G, leading to a significant improvement in comfort in spaces under vegetation. G is the most influential factor affecting PET, explaining the choice of asphalt as the underlying surface material in the optimal PET scheme. The analysis of water body parameters determined that the arrangement of water bodies should align with the dominant wind direction, positioned on the upwind side to maximize the cooling and humidifying range. Through this study, it is evident that in the optimization design of the external environment, considering the differences in geographical and climatic conditions is crucial. It is essential to first determine the comfortable PET temperature in the study area and then proceed with targeted optimization of external physical parameters. This approach provides a solid guarantee for the ecological aspects of green and low-carbon buildings, contributing robust support for the establishment of sustainable, green, and comfortable urban environments.
Supplementary Materials
The following supporting information can be downloaded at: https://www.mdpi.com/article/10.3390/su16020743/s1, Figure S1: Instrument parameter list; Table S1: Temperature change 24–26 June.
Author Contributions
H.X.: Software, writing—review and editing. J.L.: Writing—review and editing. Y.C.: Methodology. All authors have read and agreed to the published version of the manuscript.
Funding
This research was funded by the Xinjiang Production and Construction Corps Science and Technology Tackling Programme in Key Areas (2021AB027).
Data Availability Statement
Data will be made available on request.
Acknowledgments
We would like to thank students from Mingzhi Cong and Wenjie Xi for their support during the data collection process.
Conflicts of Interest
The authors declare that they have no known competing financial interests or personal relationships that could have appeared to influence the work reported in this paper.
Nomenclature
| Ta | Air temperature | G | Solar radiation |
| RH | Relative humidity | Va | Wind speed |
| Tmrt | Mean radiant temperature | TSV | Thermal sensation vote |
| Tg | Global temperature | TCV | Thermal comfort vote |
| SVF | Sky view factor | TAV | Thermal acceptability vote |
| PET | Physiological equivalent temperature | PMV | Predicted mean vote |
| UTCI | Universal thermal climate index | SET | Standard effective temperature |
References
- Mallen, E.; Bakin, J.; Stone, B.; Sivakumar, R.; Lanza, K. Thermal impacts of built and vegetated environments on local microclimates in an Urban University campus. Urban Clim. 2020, 32, 100640. [Google Scholar] [CrossRef]
- Duan, S.; Luo, Z.; Yang, X.; Li, Y. The impact of building operations on urban heat/cool islands under urban densification: A comparison between naturally-ventilated and air-conditioned buildings. Appl. Energy 2019, 235, 129–138. [Google Scholar] [CrossRef]
- Jaradat, H.; Alshboul, O.A.M.; Obeidat, I.M.; Zoubi, M.K. Green building, carbon emission, and environmental sustainability of construction industry in Jordan: Awareness, actions and barriers. Ain Shams Eng. J. 2024, 15, 102441. [Google Scholar] [CrossRef]
- Herrera-Limones, R.; León-Rodríguez, Á.L.; López-Escamilla, Á. Solar Decathlon Latin America and Caribbean: Comfort and the Balance between Passive and Active Design. Sustainability 2019, 11, 3498. [Google Scholar] [CrossRef]
- Ning, S.; Jing, W.; Ge, Z. Sunlight perception and outdoor thermal comfort in college campuses: A new perspective. Sci. Rep. 2023, 13, 16112. [Google Scholar] [CrossRef] [PubMed]
- Pritoni, M.; Salmon, K.; Sanguinetti, A.; Morejohn, J.; Modera, M. Occupant thermal feedback for improved efficiency in university buildings. Energy Build 2017, 144, 241–250. [Google Scholar] [CrossRef]
- Zhao, T.F.; Fong, K.F. Characterization of different heat mitigation strategies in landscape to fight against heat island and improve thermal comfort in hot-humid climate (Part I): Measurement and modelling. Sustain. Cities Soc. 2017, 32, 523–531. [Google Scholar] [CrossRef]
- Qingjuan, Y.; Wanyi, S.; Ziqi, L. A microclimate model for plant transpiration effects. Urban Clim. 2022, 45, 101240. [Google Scholar] [CrossRef]
- Sun, B.; Zhang, H.; Zhao, L.; Qu, K.; Liu, W.; Zhuang, Z.; Ye, H. Microclimate Optimization of School Campus Landscape Based on Comfort Assessment. Buildings 2022, 12, 1375. [Google Scholar] [CrossRef]
- Lai, D.; Liu, Y.; Liao, M.; Yu, B. Effects of different tree layouts on outdoor thermal comfort of green space in summer Shanghai. Urban Clim. 2023, 47, 101398. [Google Scholar] [CrossRef]
- El-Bardisy, W.M.; Fahmy, M.; El-Gohary, G.F. Climatic Sensitive Landscape Design: Towards a Better Microclimate through Plantation in Public Schools, Cairo, Egypt. Procedia Soc. Behav. Sci. 2016, 216, 206–216. [Google Scholar] [CrossRef]
- Darvish, A.; Eghbali, G.; Eghbali, S.R. Tree-configuration and species effects on the indoor and outdoor thermal condition and energy performance of courtyard buildings. Urban Clim. 2021, 37, 100861. [Google Scholar] [CrossRef]
- Feng, W.; Ding, W.; Zhen, M.; Zou, W.; Wang, H. Cooling effect of urban small green spaces in Qujiang Campus, Xian Jiaotong University, China. Environ. Dev. Sustain. 2021, 24, 4278–4298. [Google Scholar] [CrossRef]
- Zhou, X.; Zhang, S.; Zhu, D. Impact of Urban Water Networks on Microclimate and PM2.5 Distribution in Downtown Areas: A Case Study of Wuhan. Build. Environ. 2021, 203, 108073. [Google Scholar] [CrossRef]
- Xu, H.; Lin, X.; Lin, Y.; Zheng, G.; Dong, J.; Wang, M. Study on the Microclimate Effect of Water Body Layout Factors on Campus Squares. Int. J. Environ. Res. Public Health 2022, 19, 14846. [Google Scholar] [CrossRef]
- Jin, H.; Shao, T.; Zhang, R. Effect of water body forms on microclimate of residential district. Energy Procedia 2017, 134, 256–265. [Google Scholar] [CrossRef]
- Cao, B.; Chen, Q.; Du, M.; Cheng, Q.; Li, Y.; Liu, R. Simulation Analysis of the Cooling Effect of Urban Water Bodies on the Local Thermal Environment. Water 2022, 14, 3091. [Google Scholar] [CrossRef]
- Battisti, A.; Laureti, F.; Zinzi, M.; Volpicelli, G. Climate Mitigation and Adaptation Strategies for Roofs and Pavements: A Case Study at Sapienza University Campus. Sustainability 2018, 10, 3788. [Google Scholar] [CrossRef]
- Morabito, M.; Crisci, A.; Guerri, G.; Messeri, A.; Congedo, L.; Munafò, M. Surface urban heat islands in Italian metropolitan cities: Tree cover and impervious surface influences. Sci. Total Environ. 2020, 751, 142334. [Google Scholar] [CrossRef]
- Brozovsky, J.; Radivojevic, J.; Simonsen, A. Assessing the impact of urban microclimate on building energy demand by coupling CFD and building performance simulation. J. Build. Eng. 2022, 55, 104681. [Google Scholar] [CrossRef]
- Li, Y.; Ouyang, W.; Yin, S.; Tan, Z.; Ren, C. Microclimate and its influencing factors in residential public spaces during heat waves: An empirical study in Hong Kong. Build. Environ. 2023, 236, 110225. [Google Scholar] [CrossRef]
- Alsaad, H.; Hartmann, M.; Hilbel, R.; Voelker, C. ENVI-met validation data accompanied with simulation data of the impact of facade greening on the urban microclimate. Data Brief 2022, 42, 108200. [Google Scholar] [CrossRef] [PubMed]
- Qi, Y.; Chen, L.; Xu, J.; Liu, C.; Gao, W.; Miao, S. Influence of university campus spatial morphology on outdoor thermal environment: A case study from Eastern China. Energy Built Environ. 2023, 300, 113640. [Google Scholar] [CrossRef]
- Li, J.; Niu, J.; Huang, T.; Mak, C.M. Dynamic effects of frequent step changes in outdoor microclimate environments on thermal sensation and dissatisfaction of pedestrian during summer. Sustain. Cities Soc. 2022, 79, 103670. [Google Scholar] [CrossRef]
- Shata, R.O.; Mahmoud, A.H.; Fahmy, M. Correlating the Sky View Factor with the Pedestrian Thermal Environment in a Hot Arid University Campus Plaza. Sustainability 2021, 13, 468. [Google Scholar] [CrossRef]
- ASHRAE Standard 55-2020; Thermal Environmental Conditions for Human Occupancy. American Society of Heating, Refrigerating and Air Conditioning Engineers: Atlanta, GA, USA, 2020.
- International Standard Organization. Ergonomics of the Thermal Environment, Instruments for Measuring Physical Quantities; International Standard Organization: Geneva, Switzerland, 1998; p. 7726. [Google Scholar]
- Ouyang, W.; Sinsel, T.; Simon, H.; Morakinyo, T.E.; Liu, H.; Ng, E. Evaluating the thermal-radiative performance of ENVI-met model for green infrastructure typologies: Experience from a subtropical climate. Build. Environ. 2022, 207, 108427. [Google Scholar] [CrossRef]
- Omidvar, A.; Kim, J. Modification of sweat evaporative heat loss in the PMV/PPD model to improve thermal comfort prediction in warm climates. J. Affect. Disord. 2020, 176, 106868. [Google Scholar] [CrossRef]
- Zare, S.; Hasheminejad, N.; Shirvan, H.E.; Hemmatjo, R.; Sarebanzadeh, K.; Ahmadi, S. Comparing Universal Thermal Climate Index (UTCI) with selected thermal indices/environmental parameters during 12 months of the year. Weather Clim. Extrem. 2018, 19, 49–57. [Google Scholar] [CrossRef]
- Blazejczyk, K.; Epstein, Y.; Jendritzky, G.; Staiger, H.; Tinz, B. Comparison of UTCI to selected thermal indices. Int. J. Biometeorol. 2012, 56, 515–535. [Google Scholar] [CrossRef]
- Chun, B.; Guhathakurta, S. Daytime and nighttime urban heat islands statistical models for Atlanta. Environ. Plan. B Urban Anal. City Sci. 2017, 44, 308–327. [Google Scholar] [CrossRef]
- Wang, C.; Tang, C. Structural Characteristics of Street Trees in Shihezi City. J. Beihua Univ. (Nat. Sci. Ed.) 2018, 19, 250–256. [Google Scholar]
- Dai, J.; Jiang, S.; Xu, X.; Wu, M. Study on Natural Ventilation Thermal Comfort of Teaching Buildings in Cold Regions Based on Gender. J. Therm. Sci. Technol. 2019, 18, 306–314. [Google Scholar]
- Brager, G.S.; de Dear, R.J. Thermal adaptation in the built environment: A literature review. Energy Build 1998, 27, 83–96. [Google Scholar] [CrossRef]
- Hirashima, S.Q.; de Assis, E.S.; Nikolopoulou, M. Daytime thermal comfort in urban spaces: A field study in Brazil. Build. Environ. 2016, 107, 245–253. [Google Scholar] [CrossRef]
- Ribeiro, K.F.A.; Justi, A.C.A.; Novais, J.W.Z.; Santos, F.M.d.M.; Nogueira, M.C.d.J.A.; De Miranda, S.A.; Marques, J.B. Calibration of the Physiological Equivalent Temperature (PET) index range for outside spaces in a tropical climate city. Urban Clim. 2022, 44, 101196. [Google Scholar] [CrossRef]
- Cheng, B.; Gou, Z.; Zhang, F.; Feng, Q.; Huang, Z. Thermal comfort in urban mountain parks in the hot summer and cold winter climate. Sustain. Cities Soc. 2019, 51, 101756. [Google Scholar] [CrossRef]
- Roshan, G.; Almomenin, H.S.; da Silveira Hirashima, S.Q.; Attia, S. Estimate of outdoor thermal comfort zones for different climatic regions of Iran. Urban Clim. 2019, 27, 8–23. [Google Scholar] [CrossRef]
- Li, J.; Qu, Z.; Yi, Y.; Zhou, J.; Liu, X. Study on Microclimate and Comfort of Traditional Dai Villages in Xishuangbanna. Build. Sci. 2023, 39, 42–53. [Google Scholar]
- Guo, W.; Jiang, L.; Cheng, B.; Yao, Y.; Wang, C.; Kou, Y.; Xu, S.; Xian, D. A study of subtropical park thermal comfort and its influential factors during summer. J. Therm. Biol. 2022, 109, 103304. [Google Scholar] [CrossRef]
- Lin, T.-P.; Matzarakis, A. Tourism climate and thermal comfort in Sun Moon Lake, Taiwan. Int. J. Biometeorol. 2008, 52, 281–290. [Google Scholar] [CrossRef]
- Höppe, P. The physiological equivalent temperature–A universal index for the biometeorological assessment of the thermal environment. Int. J. Biometeorol. 1999, 43, 71–75. [Google Scholar] [CrossRef] [PubMed]
- Sriraam, N.; Prabha, V.P.; Sushma, T.V.; Suresh, S. Performance evaluation of linear and nonlinear filters for despeckling B mode foetal heart ultrasound images. Imaging Sci. J. 2023, 1–18. [Google Scholar] [CrossRef]
- Rosso, F.; Golasi, I.; Castaldo, V.L.; Piselli, C.; Pisello, A.L.; Salata, F.; Ferrero, M.; Cotana, F.; de Lieto Vollaro, A. On the impact of innovative materials on outdoor thermal comfort of pedestrians in historical urban canyons. Renew. Energy 2018, 118, 825–839. [Google Scholar] [CrossRef]
- Salata, F.; Golasi, I.; Petitti, D.; Vollaro, E.d.L.; Coppi, M.; Vollaro, A.d.L. Relating microclimate, human thermal comfort and health during heat waves: An analysis of heat island mitigation strategies through a case study in an urban outdoor environment. Sustain. Cities Soc. 2017, 30, 79–96. [Google Scholar] [CrossRef]
- Hu, X.; Gu, K.; Geng, S.; Geng, S.; Jie, W. Simulation of Thermal Environment and Research on Human Thermal Comfort based on ENVI-met Software: A Case Study of Green Roofs in Anhui Provincial Institute of Architectural Design and Research. Environ. Occup. Med. 2021, 38, 694–700. [Google Scholar]
- Li, R.; Zeng, F.; Zhao, Y.; Wu, Y.; Niu, J.; Wang, L.; Gao, N.; Shi, X. CFD simulations of the tree effect on the outdoor microclimate by coupling the canopy energy balance model. J. Affect. Disord. 2023, 230, 109995. [Google Scholar] [CrossRef]
- Sen, S.; Roesler, J.; Ruddell, B.; Middel, A. Cool Pavement Strategies for Urban Heat Island Mitigation in Suburban Phoenix, Arizona. Sustainability 2019, 11, 4452. [Google Scholar] [CrossRef]
- Zhao, M.; Long, J.; Zhang, H.; Chen, Z. Performance evaluation of temperature-regulating asphalt mixture with thermochromic materials and low freezing point materials. Constr. Build. Mater. 2023, 364, 129873. [Google Scholar] [CrossRef]
- Cheng, Y.; Liu, X.; Zeng, Z.; Liu, S.; Wang, Z.; Tang, X.; He, B.-J. Impacts of Water Bodies on Microclimates and Outdoor Thermal Comfort: Implications for Sustainable Rural Revitalization. Front. Environ. Sci. 2022, 10, 940482. [Google Scholar] [CrossRef]
- Wania, A.; Bruse, M.; Blond, N.; Weber, C. Analysing the influence of different street vegetation on traffic-induced particle dispersion using microscale simulations. J. Environ. Manag. 2012, 94, 91–101. [Google Scholar] [CrossRef]
- Li, R.; Pei, H.; Zhang, S.; Li, F.; Lin, X.; Wang, S.; Yang, L. Dividing the transit wind speeds into intervals as a favorable methodology for analyzing the relationship between wind speed and the aerodynamic impedance of vegetation in semiarid grasslands. J. Arid. Land 2023, 15, 887–900. [Google Scholar] [CrossRef]
- Taha, H. Urban climates and heat islands: Albedo, evapotranspiration, and anthropogenic heat. Energy Build. 1997, 25, 99–103. [Google Scholar] [CrossRef]
- Salata, F.; Golasi, I.; Vollaro, E.D.L.; Bisegna, F.; Nardecchia, F.; Coppi, M.; Gugliermetti, F.; Vollaro, A.D.L. Evaluation of Different Urban Microclimate Mitigation Strategies through a PMV Analysis. Sustainability 2015, 7, 9012–9030. [Google Scholar] [CrossRef]
- Yang, F.; Lau, S.S.Y.; Qian, F. Thermal comfort effects of urban design strategies in high-rise urban environments in a sub-tropical climate. Archit. Sci. Rev. 2011, 54, 285–304. [Google Scholar] [CrossRef]
- Coccolo, S.; Pearlmutter, D.; Kaempf, J.; Scartezzini, J.-L. Thermal Comfort Maps to estimate the impact of urban greening on the outdoor human comfort. Urban For. Urban Green. 2018, 35, 91–105. [Google Scholar] [CrossRef]


Disclaimer/Publisher’s Note: The statements, opinions and data contained in all publications are solely those of the individual author(s) and contributor(s) and not of MDPI and/or the editor(s). MDPI and/or the editor(s) disclaim responsibility for any injury to people or property resulting from any ideas, methods, instructions or products referred to in the content. |
© 2024 by the authors. Licensee MDPI, Basel, Switzerland. This article is an open access article distributed under the terms and conditions of the Creative Commons Attribution (CC BY) license (https://creativecommons.org/licenses/by/4.0/).