Article

Sustainable Supplier Evaluation: From Current Criteria to Reconstruction Based on ESG Requirements

1
School of Economics and Management, Tongji University, Shanghai 200092, China
2
Sino-German College of Applied Sciences, Tongji University, Shanghai 200092, China
*
Author to whom correspondence should be addressed.
Sustainability 2024, 16(2), 757; https://doi.org/10.3390/su16020757
Submission received: 5 December 2023 / Revised: 3 January 2024 / Accepted: 8 January 2024 / Published: 16 January 2024

Abstract

:
The disclosure of ESG tasks, seen as companies’ performance of sustainability, has gradually became a necessity for listed enterprises. From an ESG perspective, this paper revisits and restructures the sustainable supplier evaluation criteria. Leveraging thematic analysis, this study dissected ESG reporting guidelines across stock exchanges and explored ESG annual reports and supplier codes of conduct from the listed firms. This elucidated the evaluation criteria currently in practice. The findings indicate that existing sustainable supplier evaluations cannot fully meet ESG regulatory requirements. Drawing insights from these gaps, we reconstructed the evaluation criteria through text analysis to better align with ESG mandates. This study introduces the concept of a “Relative Word Frequency Ratio” to analyze the importance of each indicator and to further determine which to retain or delete. This research offers a robust theoretical foundation and practical guidance for enhancing supplier sustainability evaluations, and the proposed sustainable supplier evaluation criteria system could provide a decision-making reference for enterprises in the choice of ESG-qualified suppliers.

1. Introduction

In the current global economic system, corporate sustainability has emerged as a central issue, especially against the backdrop of the increasing global focus on environmental, social, and governance (ESG) standards [1]. Numerous countries and regions have intensified regulatory and disclosure requirements for publicly listed companies regarding ESG, a trend that reflects the heightened emphasis on sustainable development in global markets and underscores the pivotal role of ESG standards in commercial operations [2].
As societal expectations for sustainability grow, businesses have shifted their supply chain management focus from solely cost and efficiency to increasingly prioritizing sustainable performance [3]. Extensive research, including findings by Yu [4], has demonstrated that robust ESG performance can enhance corporate value. The global attention to ESG issues presents new challenges for corporate supply chain management.
In this context, companies are paying greater attention to the sustainability performance of all parties within their supply chain, with the evaluation of suppliers’ sustainability being particularly critical [5]. Sustainable supplier evaluation is an essential component of corporate sustainable development and ESG transformation, impacting enterprises’ supplier selection behaviors [6]. This is especially true for manufacturing companies, where the sustainability of supplied products directly determines the sustainable performance of the final manufactured goods [7].
Traditional supplier evaluation typically focuses on economic dimensions such as cost, quality, and delivery time, with scholars like Pedroso Carolina Belotti incorporating the environmental and social dimensions of sustainability issues into evaluation criteria based on the “Triple Bottom Line” theory [8]. In the current era, where ESG factors are increasingly prominent, integrating these new sustainability capability requirements into supplier evaluation criteria is not only a compliance with regulatory requirements but also a practice that enhances corporate reputation [9], customer satisfaction [10], and investor relations [11].
Although the importance of ESG criteria is widely recognized, it remains to be explored what sustainable supplier evaluation criteria are being used by enterprises and whether these evaluation behaviors align with the regulatory requirements related to ESG transformation. If they are not in compliance, how can the evaluation criteria be improved based on ESG regulatory requirements and what should the reconstructed criteria be? To address these research questions, this paper will employ a text analysis method to study the concerns of enterprises towards their suppliers’ sustainability competence and the regulations’ focuses. This study will delve into official documents of international organizations and regulatory bodies to discern ESG-related regulation requirements and will analyze public reports and supplier management documents of listed companies to understand the current supplier evaluation criteria used by enterprises. Through the comparative analysis of the two bodies, this research will discuss their compliance, as well as further reconstruction.
This research design enables us not only to identify and analyze shortcomings in the existing evaluation system, but also to propose new evaluation criteria based on ESG requirements. The potential research contribution of this paper lies in clarifying the current practices and issues in sustainable supplier evaluation by enterprises, and based on ESG requirements, suggesting improvements to these evaluation criteria. On the one hand, the study could lay a theoretical foundation for further research about the construction of sustainable supplier selection decision-making model through providing the criteria system. On the other hand, these findings will provide practical guidelines for enterprises in evaluating the sustainability capabilities of suppliers during the ESG transformation process, contributing to the sustainable development of the entire supply chain and the industry as a whole.
The remainder of this paper includes the following sections: Section 2 is the literature review section; Section 3 is the introduction of the research methodology and the sample and data analysis; Section 4 is the reconstruction of sustainable supplier assessment criteria based on ESG requirements; and the last section is the conclusion of this paper.

2. Literature Review

2.1. Sustainable Supplier Evaluation

In the research on sustainability, Elkington introduced the “Triple Bottom Line (TBL)” theory, encompassing economic, environmental, and society aspects within corporate operations research. This theory forms the basis for building a sustainable supplier evaluation system [12].
Early studies in related fields primarily focused on environmental aspects when evaluating suppliers, giving rise to the concept of “green suppliers”. Noci conducted a pioneering study in 1997, identifying four key evaluation priorities: “Green” competencies, current environmental efficiency, the supplier’s “green” image, and the net life cycle cost, supported by 13 secondary indicators [13]. Subsequent research has expanded the criteria, considering pollution output [14], resource consumption [14], ecological design [14,15], environmental management systems [14,15], green products [15], and green warehousing [15], green transportation [15], green technology [15], and other primary items, and further refining 21 secondary indicators. Additionally, taking into account customer needs, green supplier selection evaluated factors related to financial stability, environmental management systems, waste treatment plans, management commitments, quality control systems, manufacturing facilities, and reverse logistics, totaling eight key aspects [16].
As sustainability has gained attention, scholars have explored suppliers’ social performance alongside environmental concerns. Zimmer highlighted ten key aspects within the TBL framework studied by previous scholars [17]. However, some researchers noted the need for more in-depth discussions on social sustainability evaluation, compared to the environmental dimension [18]. Thus, some scholars employed the best–worst method to optimize the 16 social indicators to 8 based on prior research [19]. Following researchers further discussed the application of the criteria above in supplier selection. At the same time, Ghadimi and others utilized the nominal group method to propose four environmental criteria (environmental performance, green image, pollution control, and green competencies) and two social criteria (health and safety and employment practices) [20]. Some scholars combined a literature analysis and the Delphi method to expand on Ghadimi’s work, introducing three additional social criteria (information sharing, stakeholder relations, and social activities) [21]. Furthermore, studies delved into specific industries like automobile manufacturing [22], petrochemicals [23], clothing and textiles [24], and various scenarios such as supplier switching [25] and multi-level global procurement [26].
Since the ESG concept was introduced later than TBL, there is a relative lack of maturity in related research. As a result, few papers integrate ESG matters into sustainable supplier evaluation nowadays. For instance, Dai and Tang examined supply chain issues emerging in the post-pandemic era, highlighting three key challenges that underscore the need to incorporate supply chain activities into ESG management [27]. Zeng combined ESG and financial indicators to assess green supply chain performance, focusing on 10 indicators from profitability, environmental performance, and operational performance 3 aspects [28], but did not encompass content of social aspects and governance.

2.2. ESG Framework and Regulatory Requirements

The concept of ESG was initially proposed by the United Nations Global Compact in the 2004 “Who Cares Wins” report [29]. Its goal was to provide guidance on integrating ESG factors into asset management and securities transactions. Since then, various entities, including governments, non-governmental organizations, and enterprises, have increasingly focused on ESG-related matters. ESG has emerged as a pivotal indicator for assessing economic sustainability [30].
Recent scholarly achievements have encompassed several areas, including the following: (1) exploring the relationship between ESG and corporate performance [31,32,33], (2) investigating the regulatory impact of ESG investors on financial performance [11], (3) analyzing the connection between ESG investment risk and returns [34], and (4) assessing the influence of ESG ratings on measuring corporate sustainable development performance [35]. However, discussions about ESG regulatory requirements remain limited. In a comparative analysis of ESG disclosure systems in developed and developing countries, researchers discovered that adopting mandatory norms alone does not significantly improve ESG scores. Instead, practical measures, such as sustainable development reports and carbon emission commitments, contribute to better ESG performance [36]. Bruno studied ESG policies in the European banking industry [37]. Alamilos found that the EU has played a prominent role in shaping ESG regulations, resulting in the “Brussels Effect”, which impacts exposure, revenue, trade, and investment [38].

2.3. Literature Summary

Current discussions on “Sustainable supplier evaluation” are primarily based on the TBL framework, which does not treat “Governance” as a distinct dimension. Moreover, research on social criteria is relatively limited compared to environmental factors. Additionally, there are not many studies that integrate ESG requirements into sustainable supplier evaluation. Some researchers have explored the impact of ESG performance on financing, reputation, and customer loyalty to enterprises, with most finding a positive correlation between ESG performance and corporate value. From past research, it is evident that incorporating ESG considerations into sustainable supplier management is essential. However, few studies delve into concrete methods. Thus, this article aims to examine sustainable supplier evaluation criteria within the ESG context, providing a foundation for future research in this area.

3. Methods and Data

This section will introduce the research approach, including the theory background, sample selection, and data processing. In terms of the method, this study is mainly based on coding and text mining in the text analysis, as well as a word frequency analysis. In the text-mining process, patterns are extracted from natural language text rather than from structured databases of facts [39]. Though, to date, text mining has been largely used for exploratory purposes, it can also be applied to explanatory/theory-driven research [40]. This paper obeys the same text data collection and text data cleaning practice defined in text mining. Text transformation is not involved for the reason that the research purpose is to form indicators by examining lists through documental materials instead of mathematical structures. In addition, to differentiate the importance of the indicators and reflect their varying levels of significance, this study uses word frequency analysis, a classical and wide-accepted content analysis method that is able to carry out a quantitative analysis of text-based materials. Mehmet and Betul [41] reviewed some classical research with this method, including political science [42], linguistics [43], consumer behavior [44], and public opinion [45]. In recent years, some scholars also introduced this method into research of fisheries [39] and energy social science [46] fields.

3.1. Research Design

This article mainly employs text analysis to conduct this research. Studying the official documents from international organizations, regulatory agencies, public reports of listed companies, and journal literature can help to us understand the current research landscape and identify shortcomings in the existing evaluation system. Examining ESG reporting guidelines and globally accepted standards provides insights into mandatory provisions and recommended sustainability requirements at policy- and regulatory levels. Reviewing scholars’ research contributions establishes the theoretical foundation for this study. Subsequently, this article codes and summarizes these materials, identifying operational concepts within words and phrases through data analysis. This process results in the development of sustainable supplier evaluation criteria systems, categorized under “Regulation Requirements” and “Corporate Practices”. Furthermore, the study reviews and analyzes existing sustainable supplier evaluation criteria in corporate practice, offering optimization recommendations based on the criteria proposed by the regulations.

3.2. Sample

The Sustainable Stock Exchanges Initiative (SSE) is a collaborative effort by the United Nations Conference on Trade and Development (UNCTAD), the United Nations Global Compact (UNGC), the United Nations Environment Program Finance Initiative (UNEP FI), and the United Nations Principles for Responsible Investment (UNPRI). SSE focuses on the role of securities trading in promoting ESG performance, encouraging sustainable investment and facilitating ESG disclosure. This research is based on the follow-up of the released ESG reporting guidelines by SSE. As of February 2023, 69 out of the 120 stock exchanges followed by SSE have officially released “ESG Reporting Guidelines” (data source: Sustainable Stock Exchange official website https://sseinitiative.org/esg-guidance-database/, accessed on 15 February 2023). Among them, eight stock exchanges adopted the “ESG Reporting Guide—Target 1.5 °C” issued by Euronext in 2022, and another eight adopted the “ESG Reporting Guidelines 2.0—A Support Resource for Companies” issued by Nasdaq in 2019. After removing 14 duplicate resources within these two groups, this article analyzes a total of 55 “Regulation Requirements” samples, as shown in Table 1.
In addition, this study takes 17 listed companies in 6 different countries as the research objects. The samples are selected based on the following principles: (1) firstly, the sample corporations should be the leading manufacturing companies with advanced technical capabilities, whose products are high value-added, for the reason that corporations with these characteristics face higher demands in singling out qualified suppliers; (2) secondly, the product supply chains of the sample corporations should be relatively long, with a large number and a wide variety of parts and components, which means the supply chain management activities are located in critical links for them; (3) thirdly, the sample company’s supplier management system, process, and practice should be at the leading position in their own field, and it is the same for their practices of sustainability and ESG matters. Based on these three requirements, this study included 17 enterprises from industries in vehicles and auto parts, intelligent equipment, electronic and electrical, aircraft manufacturing, and many other categories. We analyzed policy documents like supplier codes of conduct and disclosure documents on ESG, as well as supply chain annual reports from the sample companies. These documents were gathered from the official websites of the sample companies. A total of 42 “Corporate Practices” research samples are contained in this study, as shown in Table 1. To be specific, there are 12 documents related to 5 companies in Germany, 10 documents related to 4 companies in China, 9 documents related to 3 companies in the USA, 4 documents related to 2 companies in France, 4 documents related to 2 companies in the Republic of Korea, and 3 documents related to 1 company in Japan.

3.3. Coding Procedure

This article codes a total of 55 “ESG Reporting Guidelines” and 42 corporate management documents or public reports. Using a consistent coding approach, it involves three levels of coding: initial category, main category, and core category. These three levels of coding align with the ESG framework, resulting in the categorization of data into the three dimensions of E, S, and G. The initial category content is derived and conceptualized from the original data through open coding, the main category content is generated by summarizing the initial category coding items, and the core category content is abstracted from the main category through selective coding.
First, the researchers coded the “Regulation Requirements” system. Out of 55 “ESG Reporting Guidelines”, 45 documents were randomly selected for processing, while 10 materials were retained to assess the theoretical saturation. In the initial category, 84 codes were identified through text mining and conceptual abstraction. In the axial coding stage, 18 main-category codes were refined and summarized by comparing concepts and analyzing internal logic and connections from the initial category codes. In the selective coding stage, this article further abstracted the main category content, resulting in six core category codes through a systematic analysis of the discovered concepts. Subsequently, after conceptually abstracting the 10 retained materials, no new concepts emerged beyond the resulting coding system. This indicates that the elements and their interrelationships have essentially met the saturation requirements.
Second, we coded the “Corporate Practices” system. In processing 42 corporate policies and reporting documents of listed companies, we conducted conceptual abstraction based on text mining on all the materials. Following semantics extracting, sorting, and merging, a total of 71 initial category codes were identified. Next, we applied the same processing logic as the “Regulation Requirements” system to conduct axial and selective coding. In order to emphasize the similarities between the two coding systems, this article refers to the upper system’s description when summarizing the main category and core category indicators for the current one. Consequently, 16 main category codes and 7 core category codes were obtained. Regarding the test of theoretical saturation, new concepts beyond the initial category ceased to appear during the text mining process after the 32nd document; therefore, it can be considered that each element and its interrelationship have essentially met the saturation requirement.

3.4. Data Analysis

The commonly used factor to describe word frequency is in the form of an absolute value. For the purpose of comparative analysis between two different sample groups, this paper converts the absolute value of word frequency to a relative one; thus, the concept of “Relative Word Frequency Ratio (R)” is introduced. Each “dimension” is treated as a unit to count the cumulative number of occurrences of all the initial category indicators under it. Then, we calculate the ratio of the indicator’s occurrence frequency within each initial category to the total frequency. Table 2 presents the parameters used in R calculations, along with their definitions. R can be computed using Equation (1) and adheres to the requirements outlined in Equation (2). The “Relative Word Frequency Ratio (R)” effectively helps identify key indicators and offers guidance for subsequent evaluation system reconstruction.
R k i = E T k i T T k   ,   i = 1 ,   2 , , n ,   k = 1 ,   2 , , m
i = 1 n R k i = 1 ,   i = 1 ,   2 , , n ,   k = 1 ,   2 , , m
By coding 55 “ESG Reporting Guidelines” issued by stock exchanges from different countries, the ESG evaluation criteria system shown in Figure 1 is obtained, defined as “System 1”. Similarly, by reviewing 42 documents from 17 leading companies across various industries, this study identified their concerns about supplier sustainability, forming “System 2” (refer to Figure 2). The core and main category indicators are illustrated in Figure 1 and Figure 2, while the detailed initial category indicators can be found in Appendix A and Appendix B.
In System 1, we observed that in the E dimension, “Production Behavior” plays a pivotal role in determining a company’s environmental sustainability performance. Among them, the accumulated R index related to energy, gas, and water resources is 26.2%, 16.7%, and 14.0%, respectively, which are the critical points that enterprises need to focus on. From a results-oriented perspective, regulatory agencies prioritize a company’s tangible environmental impact, with a strong emphasis on climate change and biodiversity. In the S dimension, the evaluation of social sustainability, especially from an institutional standpoint, places a premium on a company’s internal employment practices, including employee rights and recruitment. Regulatory agencies consider internal users (employees) as the foremost stakeholders regarding a company’s social responsibility. Thus, a company’s social sustainability is closely tied to how it manages and engages with its workforce, both in terms of activities and feedback. Concerning external behaviors, ESG oversight focuses primarily on supply chain control and social initiatives. In the G dimension, besides the widely recognized importance of board diversity, ethics, anti-corruption, board independence, and data and information policies, other indicators show relatively lower R indices. This suggests that sustainability evaluation here is still evolving. Nonetheless, current ESG regulations emphasize the significance of indicators affecting corporate compliance and risk management.
In System 2, the top five environmental dimension concerns, with six initial category indicators (fourth to sixth items tied), collectively account for a significant 47.8% R. Of these, five fall under the “Production Behavior” core category, and the first two belong to the “Production Performance” main category, underscoring the critical role of production activities in environmental sustainability. Within the S dimension, there is also a concentrated focus on the top indicators. The 76.2% accumulated R of the initial category indicators are distributed among the first 36.4% indicators, meaning that the attention differences between the indicators are significant. In addition, companies predominantly measure the social sustainability of suppliers through employment practices, emphasizing internal HR policies, while placing less importance on external social behaviors. In the G dimension, the main category indicators are relatively balanced, except for “Governance Compliance”, which leads with an R value of 36.3%. However, great variations in the R index exist between the top and bottom indicators within the initial category. This highlights a directional consensus among companies regarding supplier governance sustainability, though specific evaluation items remain subject to further discussion.

4. Results and Discussion

4.1. Discussion about System 1 and System 2

4.1.1. Review of the Current Supplier Sustainability Evaluation System (System 2)

In System 2, the word frequency concentration of the initial and main category indicators in all dimensions is notably high. The average R value surpasses the median, and there are significant differences in the R values between the top and bottom indicators. This indicates a high degree of consistency among the sample companies when assessing supplier sustainability. Specifically, this phenomenon is more pronounced in the S and G dimensions. The standard deviation and extreme differences in the R values for the initial categories are 2.6% and 8.5% for E, 3.9% and 10.3% for S, and 3.4% and 10.9% for G. This reveals a greater difference in attention between the top and bottom indicators in the S and G dimensions. Comparatively, the concentration and dispersion characteristics of the main category indicators are even more pronounced. This shows that companies engage in thorough discussions on environmental aspects of ESG in current economic activities, with a more even distribution of word frequency. Environmental issues take precedence in sustainable development practices.
In addition, enterprise-favored sustainable indicators often share two characteristics: they are highly quantified and possess regulatory aspects. When reviewing the top 5 indicators in each of System 2′s three dimensions, the study finds that 13 of them require quantitative description. Quantitative indicators offer a clear advantage in comparing the performance of different suppliers. They provide direct insight into the suppliers’ management practices and capabilities, aiding enterprises in making informed supplier selection decisions. At the same time, many of these prominent evaluation indicators come with precise regulatory requirements, such as greenhouse gas emissions, child labor, forced labor, fair competition, and transactions. Non-compliance by suppliers in such areas poses legal risks. Therefore, the primary driver for enterprise engagement in ESG management currently remains punitive guarantees, rather than a pursuit of excellence. In other words, companies prioritize assessing the negative risks associated with substandard supplier behavior over the positive benefits that high sustainability-capable suppliers may offer.
System 2 also presents that companies lack a deep understanding of ESG-related sustainable affairs. The current evaluation system remains somewhat limited, primarily focused on compliance standards and short-term operational stability, rather than the long-term sustainability of operations. Yet, the core purpose of ESG is to facilitate the long-term stability of economic activities. Achieving this necessitates suppliers to possess sustainable capabilities and invest in their enhancement. However, the initial category indicators in System 2 predominantly assess suppliers’ past sustainable performance rather than their efforts to bolster long-term capabilities. In essence, what enterprises radically need to evaluate is the supplier’s inherent competence that underpins sustainability, instead of the performance itself.
The current enterprise evaluation system fails to provide a truly comprehensive picture of suppliers’ sustainability capabilities and lacks a necessary long-term perspective, requiring further improvement.

4.1.2. Comparative Analysis of System 1 and System 2

The two systems in the E and G dimensions exhibit substantial consistency in content and R values, signifying alignment between enterprise’s supplier ESG management and ESG regulatory priorities. Notably, within the G dimension, System 2 additionally emphasizes “Information Governance”, underlining the importance of information transparency and sharing in supplier management. Overall, all six core categories presented in System 1 are encompassed in System 2. This demonstrates that companies’ sustainable management of supplier activities largely aligns with the ESG disclosure requirements stipulated by stock exchanges.
First of all, upon examining the main and initial category content, this study found that in the E dimension, the main category indicators are consistent in both systems, while institutional requirements place more emphasis on resource management. For instance, System 2′s initial category indicator “Energy” is subdivided into “Energy Structure”, “Energy Consumption”, and “Energy Intensity” in System 1—a more detailed and three-dimensional review of corporate energy applications. Furthermore, System 1 combines economic benefits with the evaluation of environmental performance, introducing “Gas Emission Intensity” and “Energy Intensity” indicators. These indicators calculate energy consumption and gas emissions per unit of economic output, providing a more objective benchmark for assessing resource utilization efficiency and management capabilities among enterprises of different scales. In addition, institutional focuses on sustainable matters exhibit pronounced external characteristics. System 2 places a 52.3% R value on “Production Performance” and “Production Management”, meaning that enterprises regard production activities as the primary factor influencing suppliers’ environmental sustainability. However, System 1 accentuates the environmental repercussions of corporate actions, requiring the disclosure of past environmental incidents and paying special attention to the impact of corporate activities on air quality and climate change. This shift in regulatory perspective extends the evaluation from internal company behavior to the broader macro-level.
Secondly, an obvious difference between the two coding systems is the richness of the main category indicators in the S dimension. System 1 encompasses System 2′s content and introduces more quantitative indicators in the initial category for assessing social sustainability. This approach aims to translate descriptive requirements into specific and comparable values. For instance, although System 2 introduces the “Non-discrimination and Equality” criterion, it lacks specific and actionable assessment points. System 1, on the other hand, provides quantitative criteria, such as “Gender Pay Ratio”, “Gender Ratio”, and “Temporary Worker Ratio” to concretely reflect “Equality”, offering practical evidence for relevant evaluations. Additionally, in the assessment of “Employment Practices”, System 1 not only evaluates the company’s management behavior, but also takes employee feedback into account. It proposes quantitative indicators like “Employee Turnover Rate” to analyze employee satisfaction, providing a more comprehensive view of the company’s employment performance through internal user evaluations. In line with this approach, System 1 considers stakeholder rights and interests in evaluating the corporation’s external social activities, involving “Product Responsibility” and “Consumer Privacy” to assess backend supply chain behavior.
Finally, the most significant disparities between the two coding systems emerge in the G dimension. Both systems consist of six main category indicators, encompassing “Governance Compliance”, “Management Behavior”, and “Market Behavior”. As for the same main category indicators, System 1 displays a more pronounced quantitative inclination and places greater emphasis on the high-level design of internal governance and senior management. For example, System 1 addresses the diversity and independence of the board of directors, requiring a quantitative evaluation of the board’s structure based on factors like gender ratio and the proportion of independent directors. When it comes to the differences in the main categories, companies attach great importance to assessing transaction risks and information disclosure and protection when evaluating supplier governance sustainability. Performance in these areas can have an immediate short-term impact on competitiveness and operational stability. In contrast, the governance of sustainable matters and stakeholder management, as outlined in institutional requirements, provide longer-term feedback on operational performance. They also consider the external effects of corporate governance activities. Additionally, System 1’s normative evaluation places greater emphasis on both internal and external regulatory measures, necessitating not only regular reporting on governance activities, but also adherence to standardized oversight.
In summary, the current sustainable supplier evaluation system employed by enterprises must align more closely with the specific disclosure requirements at the institutional level. It falls short of meeting the requirements for sustainable supplier evaluation based on ESG regulations. Hence, there is a need to reconstruct the existing evaluation criteria to comprehensively represent the supplier’s sustainable performance and capabilities.

4.2. Reconstruction of Evaluation Criteria

4.2.1. Steps of Reconstruction

Following the review and comparative analysis of the indicator systems, this study reconstructed the criteria in System 2, using System 1 as a foundation. The principles guiding this reconstruction can be summarized as follows: (1) retaining common initial category indicators included in both systems, as they are considered essential for comprehensive sustainable supplier evaluation, combining corporate practices and regulatory requirements. (2) Acknowledging that companies tend to prioritize supplier’s performance in basic behaviors over ESG reporting requirements, which can reveal some issues about supplier’s underlying capabilities, an importance analysis based on R values was conducted for content unique to System 2, rather than direct elimination. (3) Since there lacks a general consensus among different countries’ exchanges regarding ESG disclosure requirements at the current stage, and discussions on some recommended items are still ongoing, we also conducted a comparison analysis of R for the indicators in System 1. Ultimately, the two systems were reorganized based on independent reviews, resulting in the reconstruction of sustainable supplier evaluation criteria based on ESG requirements.
To be specific, we obtained the reconstructed system through the following steps.
Firstly, the common concerns of the two systems were identified and the initial retention items were determined. We compared the initial category indicators in the two coding systems and marked items with similar expressions or inclusive relationships (if the meaning scope of indicators in System 2 was greater than that in System 1). For System 2, there are 16, 10, and 5 indicators mentioned in System 1 in E, S, and G dimensions, respectively. These accounted for 66.7%, 45.5%, and 20.0% of the total initial category indicators in each dimension, forming the first-stage retention indicators.
Secondly, the attention differences among the System 1 indicators were analyzed and new items in the reconstructed system were determined. Each dimension was considered separately, with all System 1 initial category indicators sorted in descending order based on the R values. The initial critical line was set at an accumulated R value of 90% to identify the initial category critical indicators. Then, the R value of the critical indicators was treated as a standard. Indicators with R values greater than or equal to this standard were retained as the second-stage retention indicators. It is worth noting that in the G dimension, where the accumulated R value reaches 80.4%, all the initial category indicators have the same R value. Based on data analysis, we adjusted the accumulated R requirement in this dimension to 80%. Similarly, in the S dimension, after an accumulated R value of 88.9%, all the initial category indicators have the same R value. We considered this difference acceptable and retained those indicators. Subsequently, we re-evaluated indicators with R values lower than the critical to ensure they were not included in the first-stage retention indicators before removal. The results of the second-stage indicator analysis are presented in Table 3.
Thirdly, the attention differences among the System 2 indicators were analyzed and the items requiring retention and deletion were determined in the reconstructed system. Here, the same processing logic was adopted as the second-stage analysis, with details shown in Table 4.
Finally, the indicators obtained in three stages were integrated to form primary indicators in the E, S, and G dimensions, respectively, and an upward summarization was produced to obtain the secondary and major indicators based on the coding theory. This study aims to establish sustainable supplier evaluation criteria that align with ESG requirements and offer practical guidance for businesses; therefore, clear primary indicators needed to be formed. Additionally, given the diversity within the manufacturing industry, companies prioritize different aspects in sustainable supplier evaluation. To enhance the evaluation system’s compatibility, we further condensed the secondary and major indicators with stronger class attributes based on the primary ones. This ensures a higher practicality and guiding significance of the reconstruction system, while at the same time maintaining the same structure as the original systems.

4.2.2. The Reconstructed Sustainable Supplier Evaluation Criteria based on ESG Regulatory Requirements

Based on the given reconstruction logic, this article reconstructs the current sustainable supplier evaluation criteria from an ESG perspective and obtains a new criteria system, shown in Table 5. The meaning of each primary indicator is explained in Appendix C.
The reconstructed sustainable supplier evaluation criteria based on ESG requirements are also under the dimension division frame of E, S, and G. The concrete indicators are stepwise upward defined as primary indicator, secondary indicator, and major indicator, respectively corresponding to the initial category indicator, main category indicator, and core category indicator of Systems 1 and 2. Obeying the logic of induction, the description of Table 5 will start with the third column.
The third column of Table 5 presents a total of 79 primary indicators, with the distribution of 24 in the E dimension, 28 in the S dimension, and 27 in the G dimension. Compared with the original evaluation criteria system (System 2), 23 indicators are newly added. Next, the second column contains 17 secondary indicators, encompassing 5 in the E dimension, 6 in the S dimension (with the addition of the “Employment Condition” category compared to System 2), and 6 in the G dimension (which combines “Information Disclosure” and “Information Processing” from System 2 into “Information Governance” while adding “Sustainability Project”). Finally, the first column of Table 5 shows the major indicators of the reconstructed criteria. Each dimension contains 2 major indicators, among which the contents in E and S align with System 2, but “Information Governance” of G dimension in System 2 is excluded.

4.3. Discussion of the Reconstructed Evaluation Criteria

Compared to System 2, the reconstructed criteria introduced 3, 11, and 9 new primary indicators in the E, S, and G dimensions. This indicates a notable alignment between businesses’ environmental sustainability focus and regulatory requirements, with environmental sustainability exhibiting more maturity than social and governance aspects. To be specific, 7 out of the 11 new primary indicators in the social dimension are quantitative, with 85.7% addressing internal employment practices. For a long time, social assessments were primarily qualitative, susceptible to the subjectivity of evaluators, which hindered horizontal performance comparisons. The supplement of quantitative indicators helps mitigate this challenge. In addition, the newly added governance indicators underscore the importance of governance systems, particularly in the context of sustainable practices. Although the concept of “Sustainable Development” has existed for almost 40 years, it is only recently that companies have shown widespread attention and action. Therefore, these additional indicators offer guidance for enterprises in developing their governance practices. Moreover, in the context of growing global awareness and deepening understanding of sustainable development, the actions required for achieving sustainability have become more evident over time. This progress has led to the refinement and maturation of supplier sustainability evaluations. Comparing the revised system to the original (System 2), an expanded scope in the sustainable supplier evaluation system based on ESG regulatory requirements can be observed. It now encompasses not only a company’s internal behaviors but also external impacts, including emerging topics like data and privacy management. At the same time, the degree of quantification has been improved.
As a result, enterprises must take actions to build up their own competence, both for using this reconstructed system and for improving their sustainability. Firstly, the changes in the reconstructed system necessitate increased investment from both suppliers and core supply chain corporates (“core corporates” for short). On the one hand, the expansion of scope requires enterprises to enhance their management capabilities in newly added scenes, in ways that may never have occurred to them before. These scenarios must bring some challenges to all the participants. To be specific, companies should be able to make out their current performance in every indicator, identify the potential opportunities for improvement, and implement these measures, as well as proactively respond to sustainability challenges. On the other hand, there will unavoidably exist some direct expenditure in facilities, human resources, and training. Secondly, the improvement and enrichment of the reconstructed system requires comprehensive, accurate, and timely underlying data as support. Meanwhile, different categories of data need to be able to corroborate with each other and maintain logical consistency. The finer the granularity of data requirements, the stronger the ability for analysis, but this also entails more challenging data collection, requiring advanced equipment and skilled personnel. For suppliers, the collection of information is the main difficulty when reconstructing the system, in which they also need to weigh the cost-benefit balance. At the same time, for evaluation companies, verifying and validating the data provided by suppliers is a crucial issue to address.
Of course, the benefits that companies will bring from reorganizing their evaluation systems are also apparent. Global initiatives such as the Sustainable Development Goals (SDGs) and Climate Change Actions have assigned clear tasks and goals to governments, and policy requirements are developing towards more stringent trends. The earlier an enterprise carries out sustainable supplier management in accordance with ESG regulatory requirements, the more beneficial it will be to the long-term development of its local business and market access to other countries. The leverage effect brought by early investment will significantly reduce the company’s later transformation costs. In the context of “Responsible Investment”, a growing number of investors are starting to pay attention to enterprises’ performance in aspects such as environmental friendliness and social responsibility, as well as emphasizing long-term development capabilities. Therefore, enterprises’ transformation in supplier management can meet investors’ demands for sustainable development information, help reduce financing costs, and gain investor favor. Furthermore, the sustainable supplier evaluation criteria based on ESG regulatory requirements serve not only to assess supplier sustainability, but also to provide self-examination tools for both parties involved, contributing to the enhancement of sustainable management competence.

4.4. Application of the Reconstructed Evaluation Criteria

As for the application of the reconstructed criteria system in practice, this research proposes to carry out a three-step rating system, outlined in Figure 3, in which the qualitative and quantitative indicators are treated differently.
In the first step, the core corporate needs to gain supporting materials about their suppliers’ performance on each primary indicator. These materials could be documents provided by suppliers (it would be better if verified by third-party organizations) or information collected in an onsite audit carried out by the core corporate itself. It is of great significance that the evaluation results are based on a consensual fact that is recognized by both sides. For the quantitative indicators, the concrete number should be calculated and recorded in this stage. For qualitative indicators, after benchmarking other companies in the given industry, the core corporate should rate the supplier’s performance on a scale of 0 to 5 for each primary indicator, according to the degree to which suppliers meet the requirements. Thus, the evaluation of qualitative indicators requires that the core corporate has enough knowledge and experience to carry out a reliable assessment. However, the risk of subjectivity still cannot be avoided completely.
In the second step, the core corporate should determine the supplier’s performance on quantitative indicators compared to the industry, especially for indicators with explicit numerical requirements set by regulations. Based on the analysis above, the concrete number of each quantitative indicator will be converted into a score on a scale of 0 to 5. This conversion enables the evaluation results of quantitative indicators under the same standard as the qualitative indicators. Nothing needs to be done with the qualitative indicators in this period.
In the third step, the core corporate could calculate the supplier’s score of each secondary indicator, major indicator, and the total. This will be helpful in understanding the supplier’s overall sustainable performance, as well as its advantages and disadvantages in different subdivisions.

5. Conclusions

ESG disclosure is becoming a mandatory requirement for listed companies, reflecting the growing global emphasis on sustainable development. Therefore, when evaluating the sustainability capabilities of their suppliers, companies must consider the evolving ESG requirements. This study, on the one hand, identifies the detailed demands for supplier sustainability by manufacturing companies in current practice and, on the other hand, analyzes the differences and consensus in ESG disclosure demands across different exchanges. Leveraging both business concerns and regulations, the study reconstructs sustainable supplier evaluation criteria. This research clarifies the focus areas for evaluating sustainable suppliers, helps in selecting competitive partners in sustainability, and points out the direction for training and improving suppliers’ sustainability capabilities, as well. This study bridges the gap in research by integrating ESG requirements with supplier sustainability evaluations.
(1)
Research Conclusion
The identification of sustainable supplier evaluation criteria used by enterprises currently (System 2) is summarized in Figure 2 and Figure 3 and the tables in Appendix B. Through analyzing the current corporate sustainable supplier evaluation system, several key findings emerged: firstly, companies prioritize E over S and G, with more comprehensive and sufficient discussions on environmental sustainability; secondly, quantitative indicators that reflect sustainability capabilities or performance are favored by enterprises; thirdly, regulatory requirements are the primary driver for supplier sustainability management, focusing on compliance rather than excellence; and finally, current evaluations predominantly assess past behavior performance and overlook investments in future capabilities.
In the comparative analysis of the two coding systems, it is evident that, firstly, in the E dimension, institutional requirements encompass economic output factors and examine environmental performance from an external influence perspective; secondly, the S dimension includes quantitative inspection indicators for qualitative criteria, requiring support with actual data and considering internal and external customer feedback; and thirdly, the G dimension emphasizes factors affecting long-term corporate stability and makes a claim of external supervision. Overall, the current enterprise evaluation system falls short of meeting ESG-based sustainable supplier evaluation requirements, necessitating criteria reconstruction.
In order to enhance the compatibility of a sustainable supplier evaluation criteria system, this study carried out word frequency analysis to determine the addition, deletion, or replacement of indicators in System 2, according to System 1. The concept of “Relative Word Frequency Ratio (R)” is introduced to support this task. The reconstructed sustainable supplier evaluation criteria system based on ESG regulatory requirements is presented in Table 5. The proposed criteria further enrich the connotation of sustainable supplier evaluation and improve the quantitative capabilities and the horizontal comparability of the evaluation results. However, this expansion demands increased data requirements for enterprises, necessitating careful data collection, processing, and review for the evaluation of both enterprises and the objects. The benefits of this restructured system are evident, serving as a starting point for sustainable development transformation, reducing market entry costs and expansion challenges, decreasing financing costs by meeting investor information needs, and enhancing reputation.
(2)
Research Prospects
First of all, the reconstructed system provides recommended evaluation criteria at this stage. In the future, the importance of each category indicator will be further tested, analyzed, and differentially weighted. On this basis, 79 primary category indicators will be screened to lay a foundation for constructing a sustainable supplier selection decision-making model based on ESG requirements. Secondly, subsequent research will address challenges such as quantifying qualitative indicators and integrating indicators across dimensions so as to conduct in-depth research on the concrete application methods in supplier selection decisions. Thirdly, based on the sample selection requirements of this study, the current research samples on “Corporate Practices” are relatively limited. In the future, as more companies disclose ESG reports and formulate supplier management related documents, the research sample will be further enriched and allow for more targeted data processing. Finally, with the improvement of evaluation criteria, further research will apply it in case studies of specific companies to identify potential problems lying within them.

Author Contributions

Conceptualization, S.L., T.X. and X.Y.; methodology, S.L. and T.X.; validation, S.L.; formal analysis, S.L.; investigation, S.L.; resources, S.L.; data curation, S.L.; writing—original draft preparation, S.L.; writing—review and editing, S.L., T.X. and X.Y.; visualization, S.L.; supervision, X.Y. and T.X.; project administration, T.X.; funding acquisition, X.Y. All authors have read and agreed to the published version of the manuscript.

Funding

This work was sponsored by Shanghai Rising-Star Program (21YF1449500).

Institutional Review Board Statement

Not applicable.

Informed Consent Statement

Not applicable.

Data Availability Statement

No new created data.

Conflicts of Interest

The authors declare no conflicts of interest.

Appendix A. Evaluation Criteria Details of System 1
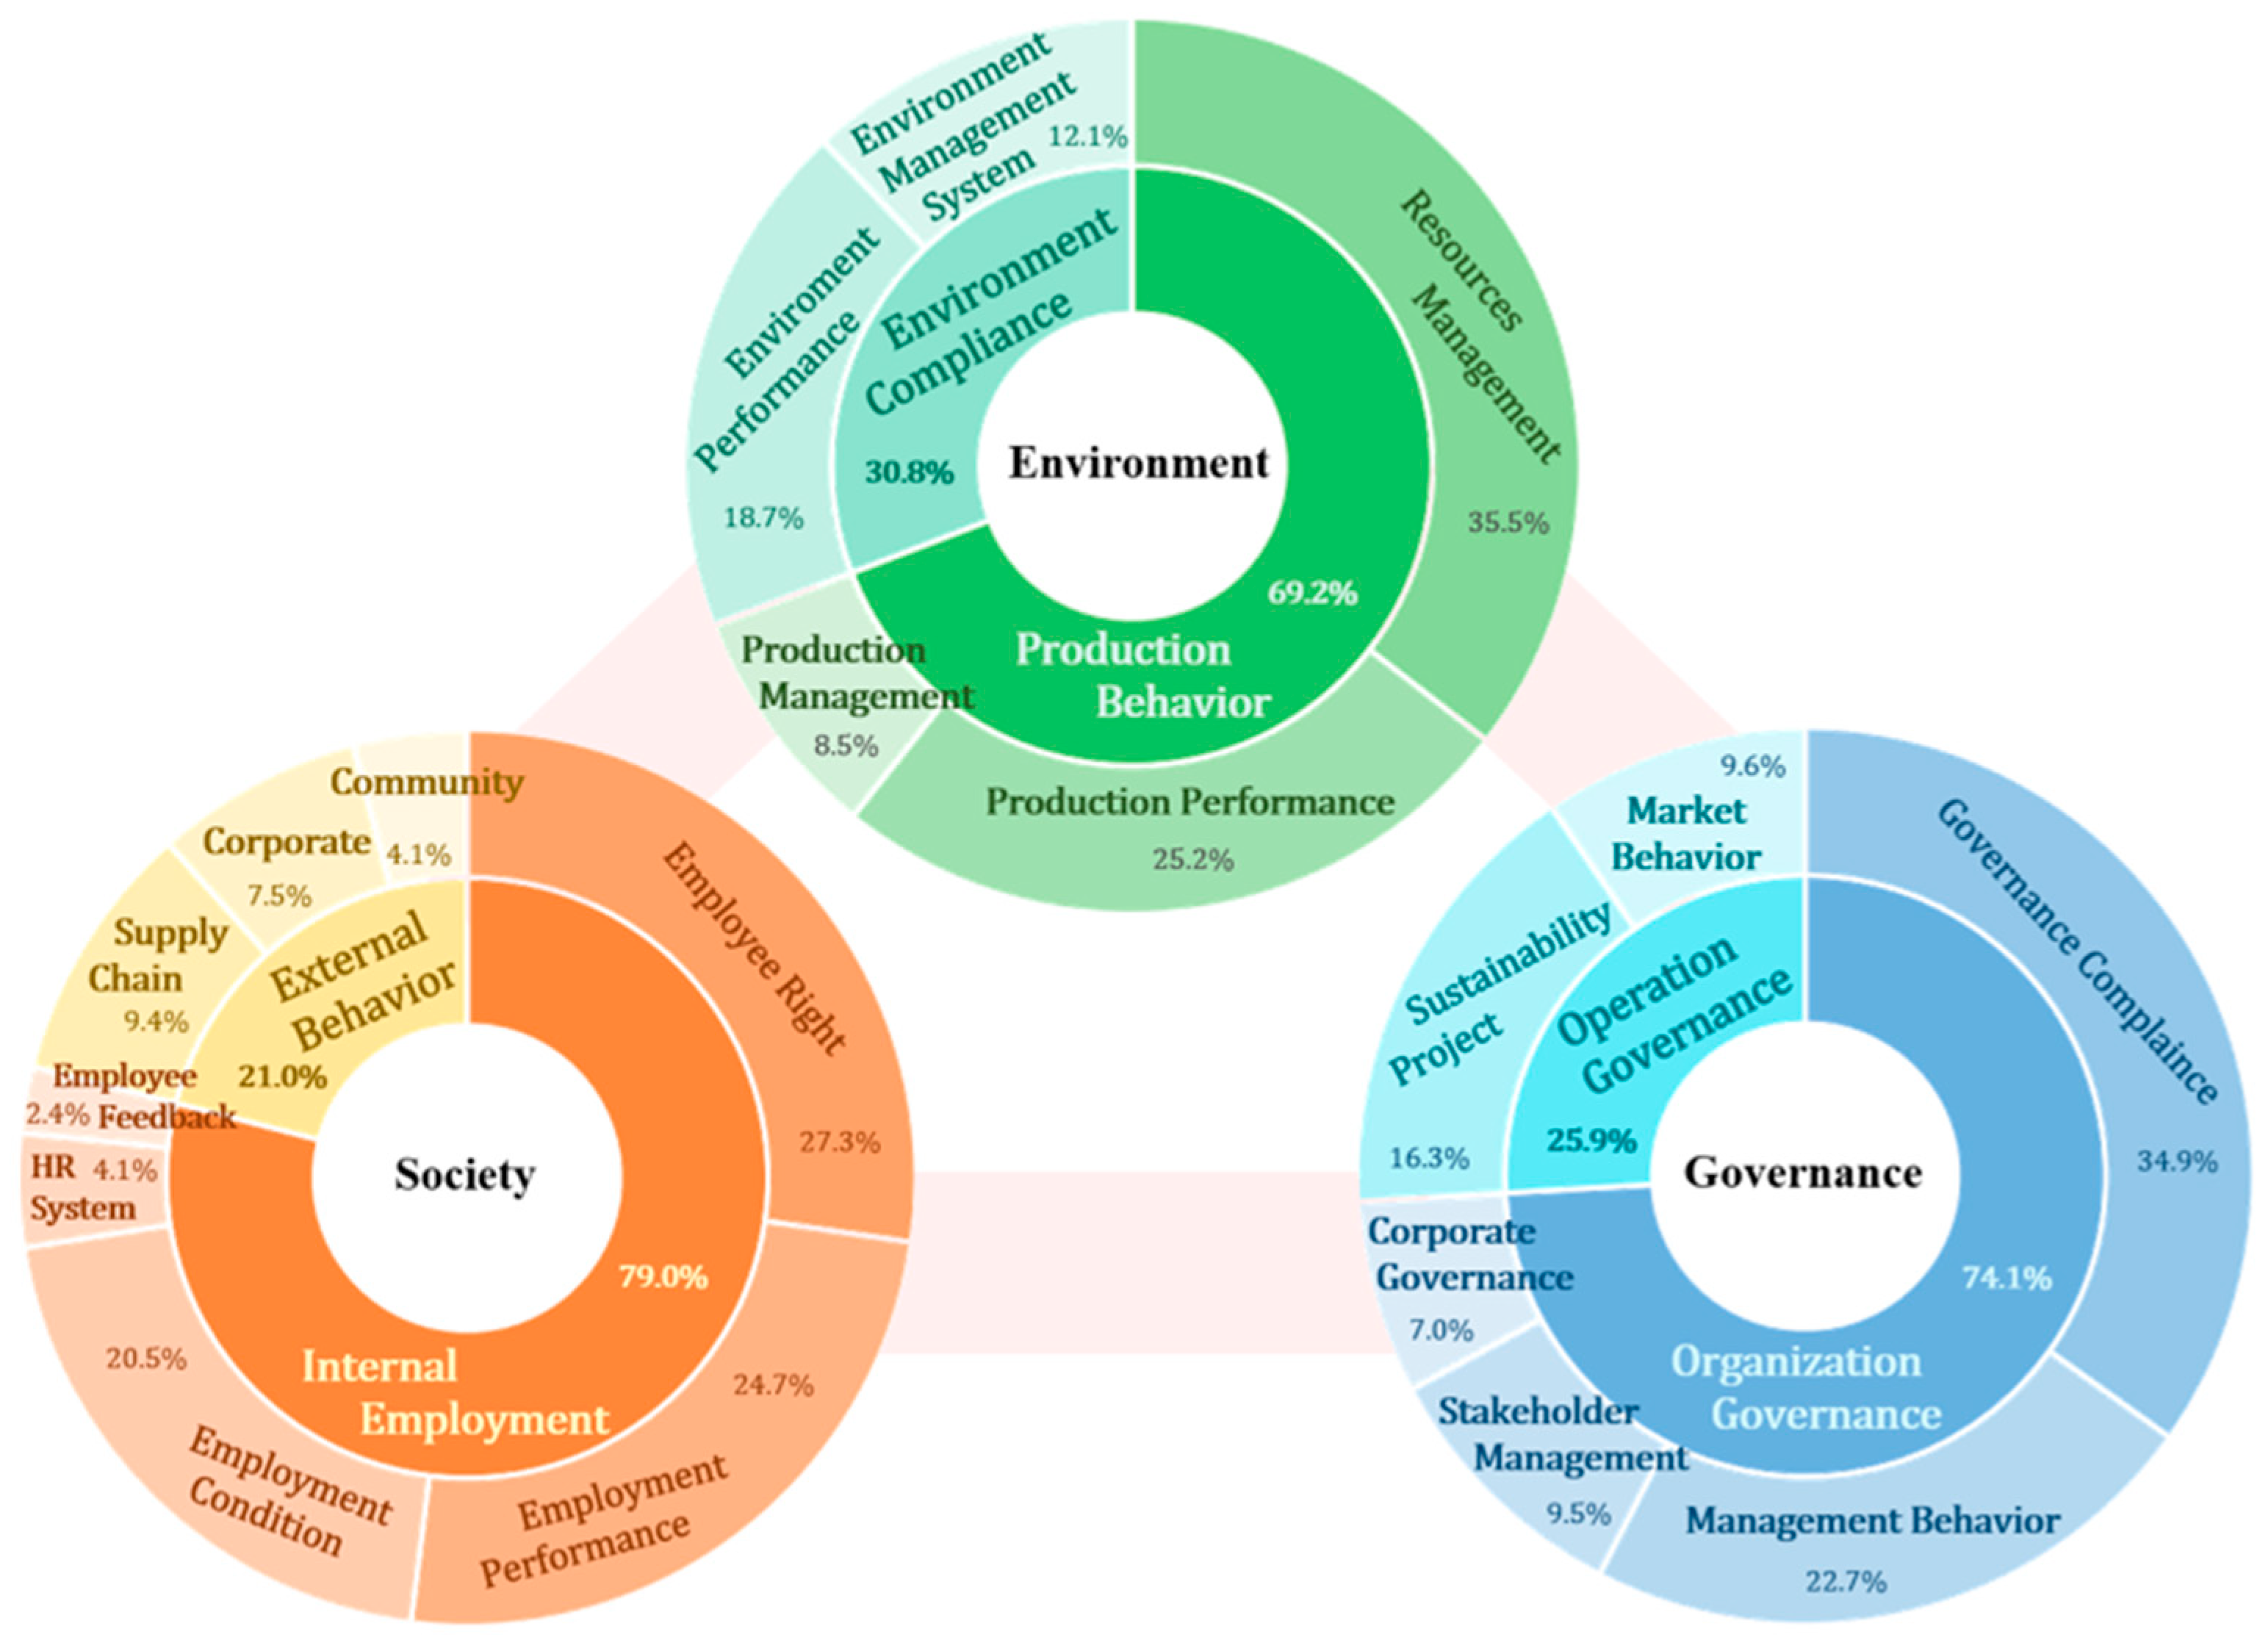
Table A1. Concerns for sustainability activities based on the “ESG Reporting Guidelines” (System 1)—environmental dimension.
DimensionCore CategoryMain CategoryInitial Category
Environmental
(E)
Production Behavior
(69.2%)
Resource Management
(35.5%)
Energy Structure (11.3%)
Water (9.3%)
Energy Consumption (9.3%)
Energy Intensity (5.6%)
Production Performance
(25.2%)
Greenhouse Gas Emission (9.3%)
Gas Emission Intensity (5.6%)
Wastewater Discharge (4.7%)
Material (1.9%)
Product (1.9%)
Carbon Footprint (0.9%)
Exhaust Gas Emissions (0.9%)
Production Management
(8.5%)
Waste Management (6.7%)
Recycling Management (0.9%)
Hazardous Materials Management (0.9%)
Environment
Compliance
(30.8%)
Environment Performance
(18.7%)
Climate Impacts (7.5%)
Biodiversity (5.6%)
Environmental Incident Records (3.8%)
Air Quality Impact (0.9%)
Land and Ecological Resources Impact (0.9%)
Environment
Management System (12.1%)
Environment Operations (5.6%)
Environment Regulation (5.6%)
Supply Chain Environment Management (0.9%)
Table A2. Concerns for sustainability activities based on the “ESG Reporting Guidelines” (System 1)—social dimension.
DimensionCore CategoryMain CategoryInitial Category
Social
(S)
Internal Employment
(79.0%)
Employee Right
(27.3%)
Global Health and Safety (7.7%)
Human Rights Policy (5.9%)
Human Rights Diligence (5.9%)
Career Development and Training (4.3%)
Freedom of Association and Collective (3.5%)
Employment Performance
(24.7%)
Gender Pay Ratio (6.8%)
CEO Pay Ratio (5.1%)
Child Labor and Forced Labor (5.1%)
Non-discrimination and Inclusion (4.2%)
Casualty Rate (3.5%)
Employment Condition
(20.5%)
Employee Turnover Rate (8.5%)
Gender Ratio (7.7%)
Temporary Worker Ratio (3.5%)
Employee Nationality (0.8%)
HR System
(4.1%)
Human Resource Management Policies (1.7%)
Board Oversight of Human Resources (0.8%)
Human Resources Risk Management (0.8%)
Human Resources Target Investment (0.8%)
Employee Feedback
(2.4%)
Voluntary Turnover Rate (0.8%)
Employee Satisfaction (0.8%)
Maternity/Childcare Leave Return Rate (0.8%)
External Behavior
(21.0%)
Supply Chain
(9.4%)
Supplier Audit Data (4.3%)
Supply Chain Social Management (3.5%)
Rights of Local People (0.8%)
Local Procurement (0.8%)
Corporate
(7.5%)
Violations (1.7%)
Product Responsibility (1.7%)
Consumer Privacy (1.7%)
Lack of Compliance Supervision (0.8%)
Involvement in Controversial Weapons (0.8%)
Sustainable Economic Activity (0.8%)
Community
(4.1%)
Community Impact (2.5%)
Community Investment (0.8%)
Initiatives that Benefit the Community (0.8%)
Table A3. Concerns for sustainability activities based on the “ESG Reporting Guidelines” (System 1)—governance dimension.
DimensionCore CategoryMain CategoryInitial Category
Governance
(G)
Organization
Governance
(74.1%)
Governance Compliance
(34.9%)
Board Diversity (12.1%)
Ethics and Anti-corruption (10.6%)
Board Independence (8.1%)
Code of Business Ethics (4.1%)
Management Behavior
(22.7%)
Data and Information Policy (8.1%)
Incentive Payments (6.7%)
Supplier Code of Conduct (5.3%)
Discloser Policy (2.6%)
Stakeholder Management
(9.5%)
Stakeholder Participation Mechanism (4.1%)
Stakeholder Risk Management (2.6%)
Stakeholder Risk (1.4%)
Minority Shareholder Rights (1.4%)
Corporate Governance
(7.0%)
Corporate Governance System (1.4%)
Corporate Governance Structure (1.4%)
Corporate Executive Body (1.4%)
Corporate Organization Chart (1.4%)
Subsidiaries and Affiliates (1.4%)
Operation
Governance
(25.9%)
Sustainability Project
(16.3%)
Sustainability External Audit (5.3%)
Sustainability Reporting (4.1%)
Sustainability Disclosure (4.1%)
Sustainability Governance (1.4%)
Sustainable Development Policy (1.4%)
Market Behavior
(9.6%)
Inconsistent Behavior (2.6%)
Historical Event Reporting (1.4%)
Anti-competitive Conduct (1.4%)
Internal Control and Audit (1.4%)
Dividends (1.4%)
Main Transaction Information (1.4%)

Appendix B. Evaluation Criteria Details of System 2
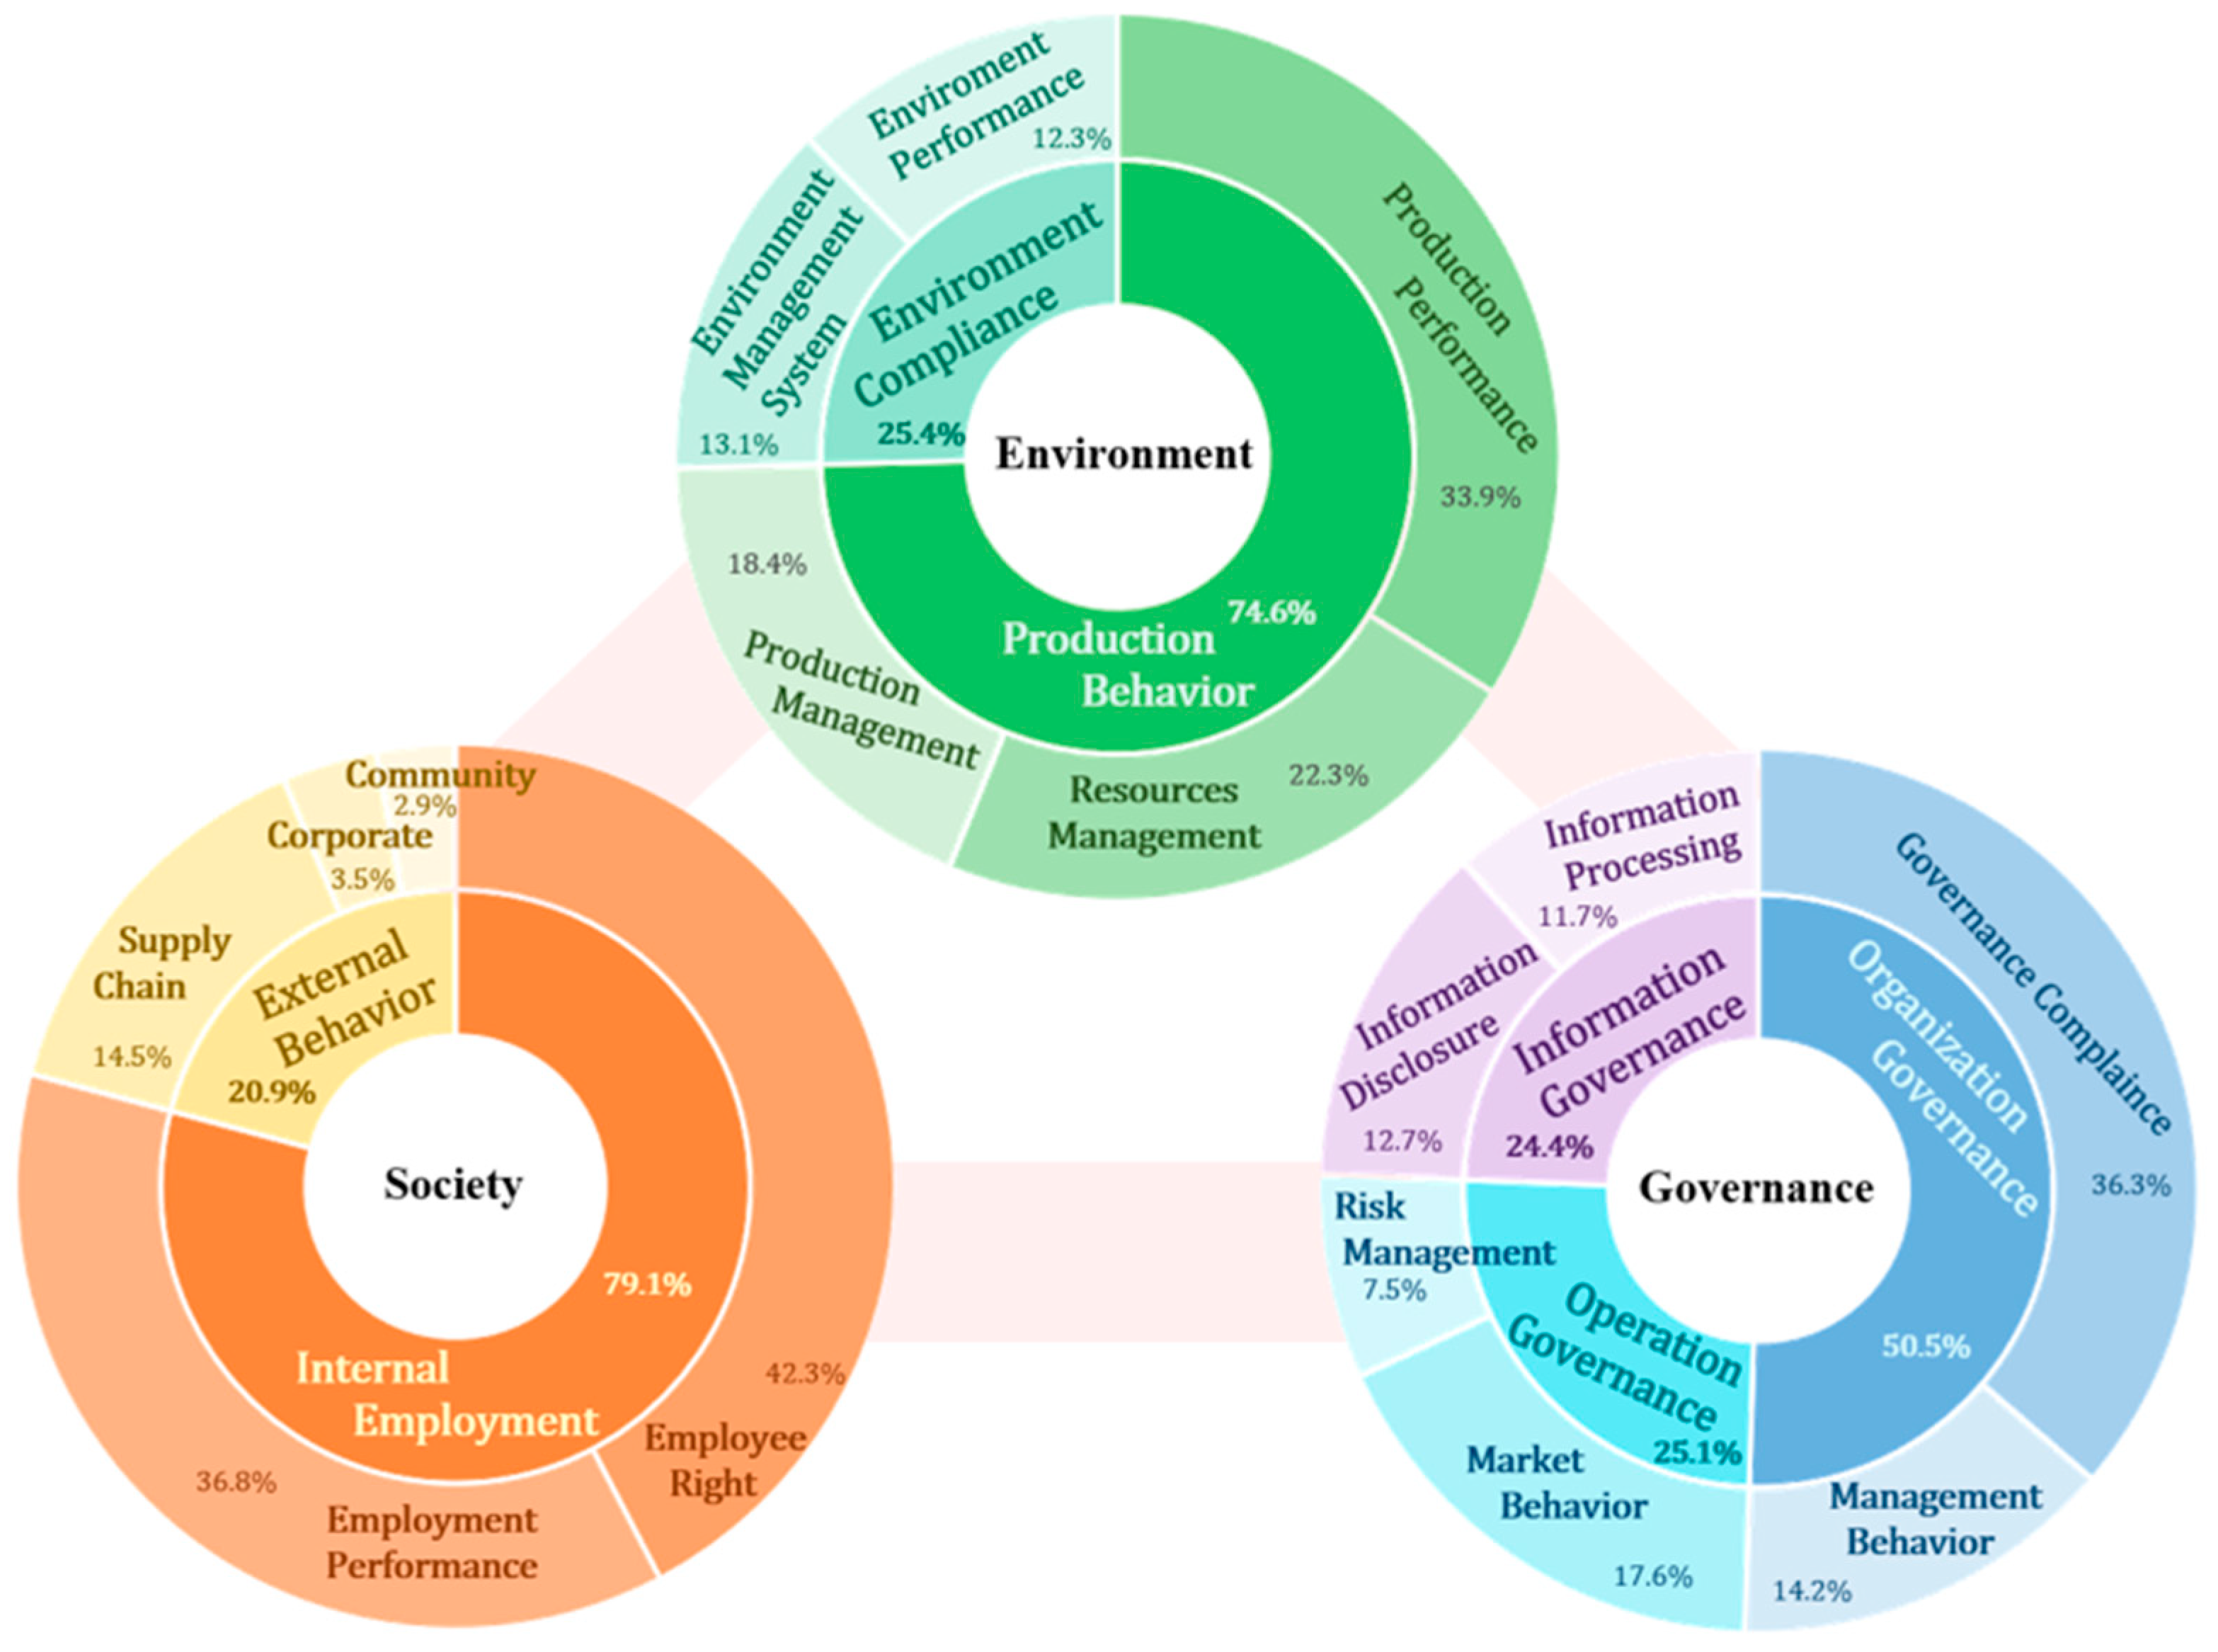
Table A4. Concerns for sustainability activities based on corporate supplier management behavior (System 2)—environmental dimension.
DimensionCore CategoryMain CategoryInitial Category
Environmental
(E)
Production Behavior
(74.6%)
Production Performance
(33.9%)
Greenhouse Gas Emissions (9.3%)
Material Type and Efficiency (9.3%)
Carbon Footprint (5.4%)
Exhaust Gas Emissions (3.8%)
Pollutants (3.8%)
Products (1.5%)
Noise Outside the Factory (0.8%)
Resources Management
(22.3%)
Resource Efficiency (5.4%)
Energy (8.5%)
Water (6.9%)
Land (1.5%)
Production Management
(18.4%)
Waste Management (6.9%)
Hazardous Materials Management (4.6%)
Chemical Substance Management (4.6%)
Recycling Management (2.3%)
Environment
Compliance
(25.4%)
Environment
Management System
(13.1%)
Environment Management System (6.9%)
Environment Certifications and License (4.6%)
Environment Accident Handling Plan (0.8%)
Environment Diligence (0.8%)
Environment Performance
(12.3%)
Environment Compliance (3.1%)
Climate Change and Protection (3.1%)
Air Quality Impact (2.3%)
Biodiversity (2.3%)
Zero Deforestation (1.5%)
Table A5. Concerns for sustainability activities based on corporate supplier management behavior (System 2)—social dimension.
DimensionCore CategoryMain CategoryInitial Category
Social
(S)
Internal Employment
(79.1%)
Employee Right
(42.3%)
Occupation Health and Safety (10.4%)
Salary and Benefits (10.4%)
Freedom of Association and Collective (8.3%)
Human Right (8.3%)
Employee Grievance Mechanism (2.8%)
Career Development and Training (2.1%)
Employment Performance
(36.8%)
Child Labor and Forced Labor (10.4%)
Non-discrimination and Equality (9.1%)
Working Hours (8.3%)
Inclusion and Diversity (4.1%)
Working Environment (2.8%)
Employment Freedom (1.4%)
Employee Engagement (0.7%)
External Behavior
(20.9%)
Supply Chain
(14.5%)
Conflict Minerals (11.0%)
Local Procurement (2.1%)
Responsible Sourcing (1.4%)
Corporate
(3.5%)
Public and Private Security (1.4%)
Social Violations (0.7%)
Prohibition of Supporting Armed Forces (0.7%)
Slavery and Human Trafficking (0.7%)
Community
(2.9%)
Community Impact (2.1%)
Local Community Equity (0.8%)
Table A6. Concerns for sustainability activities based on corporate supplier management behavior (System 2)—governance dimension.
DimensionCore CategoryMain CategoryInitial Category
Governance
(G)
Organization
Governance
(50.5%)
Governance Compliance
(36.3%)
Intellectual Property Protection (10.9%)
Anti-corruption and Bribery (9.3%)
Business Ethics (9.3%)
Comply with the Law (3.4%)
Money Laundering (3.4%)
Management Behavior
(14.2%)
Discloser Policy (5.9%)
Management Systems and Accountability (5.9%)
Stakeholder Management (0.8%)
Reporting Mechanism (0.8%)
Partner Diligence (0.8%)
Operation
Governance
(25.1%)
Market Behavior
(17.6%)
Fair Competition and Transactions (11.8%)
No Unfair Competition (2.5%)
External Regulation (1.7%)
Fraud (0.8%)
Insider Trading (0.8%)
Risk Management
(7.5%)
Import and Export Control (5.0%)
AI Risk (1.7%)
Sanction Risk (0.8%)
Information
Governance
(24.4%)
Information Disclosure
(12.7%)
Conflict of Interest (7.7%)
Information Disclosure (4.2%)
Financial Disclosure (0.8%)
Information Processing
(11.7%)
Information Security Protection (5.0%)
Personal Privacy Protection (3.4%)
Information Privacy Protection (2.5%)
Accurately Recorded (0.8%)

Appendix C. The Reconstructed Sustainable Supplier Evaluation Criteria Based on ESG Requirements (Including Interpretation of Primary Indicators)

DimensionMajor IndicatorSecondary IndicatorPrimary Indicator
IndicatorExplain
E—
Environmental
E1
Production
Behavior
E1-1
Production
Performance
E1-1.1 Greenhouse Gas Emission
E1-1.2 Gas Emission Intensity
E1-1.3 Material Type and Efficiency
E1-1.4 Carbon Footprint
E1-1.5 Waste Gas Emission
E1-1.6 Waste Water Emission
E1-1.7 Pollutant
E1-1.8 Product
Reflect emissions and emission intensity.
Various gas emissions per unit of output.
Include direct and indirect materials.
Carbon emissions of finished products in three categories.
Reflect waste gas treatment methods and emissions.
Reflect wastewater treatment methods and emissions.
Reflect the type, treatment, and quantity of pollutants.
Reflect the environmental friendliness in product life cycle.
E1-2
Resources
Management
E1-2.1 Resource Efficiency
E1-2.2 Energy
E1-2.3 Water
E1-2.4 Land
Consumption of each kind of resource per unit of output.
Reflect energy structure, category, and consumption.
Reflect water resources consumption and management.
Reflect the utilization and management of land resources.
E1-3
Production
Management
E1-3.1 Waste Management
E1-3.2 Hazardous Substance Management
E1-3.3 Chemical Substance Management
E1-3.4 Recycling Management
Reflect waste categories and management.
Reflect hazardous materials categories and management.
Reflect chemical substance categories and management.
Reflect the status of material recycling.
E2
Environment Compliance
E2-1
Environment
Management System
E2-1.1 Environment Management System
E2-1.2 Environment Certification and License
E2-1.3 Environment Due Diligence
Including management policies, organization structure, etc.
Reflect environment certification status.
Supervision and investigation of environment behavior.
E2-2
Environmental
Performance
E2-2.1 Environment Incident Records
E2-2.2 Environment Compliance
E2-2.3 Climate Change and Protection
E2-2.4 Air Quality Impact
E2-2.5 Biodiversity
Recording of environmental events.
Examine whether there are environmental violations.
Reflect positive and negative impacts on climate change.
Reflect positive and negative impacts on air quality.
Reflect positive and negative impacts on biodiversity.
S—
Social
S1
Internal
Employment
S1-1
Employee Right
S1-1.1 Occupation Health and Safety
S1-1.2 Wages and Benefits
S1-1.3 Freedom of Association and Collective
S1-1.4 Human Rights
S1-1.5 Employee Grievance Mechanism
S1-1.6 Career Development and Training
S1-1.7 Human Resources Management Policy
Reflect health and safety policies and behaviors.
Reflect employee wages and benefits.
Reflect employees’ association and negotiation rights.
Examine corporate human rights policies.
Reflect employee grievance channels and handling modes.
Reflect opportunities for professionalism and promotion.
Examine human resources-related policies.
S1-2
Employment
Performance
S1-2.1 Child Labor and Forced Labor
S1-2.2 Non-discrimination and Equality
S1-2.3 Working Hours
S1-2.4 Gender Pay Ratio
S1-2.5 CEO Pay Ratio
S1-2.6 Inclusion and Diversity
S1-2.7 Working Environment
Examine whether child labor and forced labor exist.
Examine whether any discrimination exists.
Examine whether working hours comply with regulations.
Reflect the difference in pay between genders.
Reflect the difference in pay between CEO and employees.
Reflect employee diversity.
Examine the friendliness of the working environment.
S1-3
Employment
condition
S1-3.1 Employee Turnover Rate
S1-3.2 Gender Ratio
S1-3.3 Temporary Worker Ratio
Examine the age and turnover of employees.
Examine the employee gender ratio.
Examine the ratio of temporary workers to regular employees.
S2
External
Behavior
S2-1
Supply Chain
S2-1.1 Conflict Minerals
S2-1.2 Supply Chain Audit Data
S2-1.3 Supply Chain Social Management
S2-1.4 Local Procurement
Examine whether to use minerals that affect human rights.
Audit supply chains’ social conduct.
Reflect social behavioral management of supply chains.
Examine local purchasing practices.
S2-2
Corporate
S2-2.1 Product Responsibility
S2-2.2 Consumer Privacy
S2-2.3 Social Violations
S2-2.4 Prohibition of Supporting Armed Forces
Examine responsible behavior towards products.
Reflect the protection and infringement of consumer privacy.
Disclose social violations.
Do not fund illegal armed forces.
S2-3
Community
S2-3.1 Community Impact
S2-3.2 Local Community Rights
Examine support for community work.
Examine whether practices infringe the interests of local communities.
G—
Governance
G1
Organization Governance
G1-1
Governance
Compliance
G1-1.1 Board Diversity
G1-1.2 Board Independence
G1-1.3 Intellectual Property Protection
G1-1.4 Anti-corruption and Bribery
G1-1.5 Business Ethics
G1-1.6 Compliance with Laws
G1-1.7 Money Laundering
Examine the gender ratio of the board.
Examine the proportion of independent directors of the board.
Reflect the status of IP protection and infringement.
Examine whether there is corruption.
Reflect compliance or violation of business ethics.
Examine whether there are illegal cases.
Examine whether there is money laundering.
G1-2
Management
Behavior
G1-2.1 Data Policy
G1-2.2 Incentivized Pay
G1-2.3 Supplier Code of Conduct
G1-2.4 Discloser Policy
G1-2.5 Management System and Accountability
G1-2.6 Stakeholder Management
Review data and information policies.
Reflect incentivized pay for sustainable matters.
Examine whether there is a supplier code of conduct.
Examine the relevant systems for disclosure behavior.
Examine management systems and accountability policies.
Examine stakeholder risk-return management.
G1-3
Information
Governance
G1-3.1 Conflict of Interest
G1-3.2 Information Disclosure
G1-3.3 Information Security Protection
G1-3.4 Personal Privacy Protection
G1-3.5 Information Privacy Protection
Review the disclosure of conflicts of interest.
Determine whether information disclosure is compliant.
Reflect information security protection behaviors.
Reflect privacy protection practices for insiders.
Reflect the protection of business information.
G2
Operation
Governance
G2-1
Market Behavior
G2-1.1 Fair Competition and Transactions
G2-1.2 No Unfair Competition
G2-1.3 External Supervision
G2-1.4 Inconsistent Behavior
Examine the fairness of market transactions and competition.
Determine whether there are illegitimate gains.
Determine whether there is external regulation.
Determine whether there are operations that violate regulations.
G2-2
Sustainability Project
G2-2.1 Sustainability External Assurance
G2-2.2 Sustainability Reporting
G2-2.3 Sustainability Disclosure
Conduct external audits of sustainability matters.
Routine reporting on sustainability matters.
Disclosure of information on sustainable matters.
G2-3 Risk
Management
G2-3.1 Import and Export Control
G2-3.2 AI Risk
Management of import and export control risks.
Management of AI risks.

References

  1. Zhang, C.; Jin, S.Y. What Drives Sustainable Development of Enterprises? Focusing on ESG Management and Green Technology Innovation. Sustainability 2022, 14, 20. [Google Scholar] [CrossRef]
  2. Liu, P.D.; Gao, H.; Ma, J.H. Novel green supplier selection method by combining quality function deployment with partitioned Bonferroni mean operator in interval type-2 fuzzy environment. Inf. Sci. 2019, 490, 292–316. [Google Scholar] [CrossRef]
  3. Zhan, Y.Z.; Chung, L.; Lim, M.K.; Ye, F.; Kumar, A.; Tan, K.H. The impact of sustainability on supplier selection: A behavioural study. Int. J. Prod. Econ. 2021, 236, 12. [Google Scholar] [CrossRef]
  4. Yu, E.P.Y.; Guo, C.Q.; Luu, B.V. Environmental, social and governance transparency and firm value. Bus. Strategy Environ. 2018, 27, 987–1004. [Google Scholar] [CrossRef]
  5. Ahmadi, H.B.; Lo, H.W.; Gupta, H.; Kusi-Sarpong, S.; Liou, J.J.H. An integrated model for selecting suppliers on the basis of sustainability innovation. J. Clean. Prod. 2020, 277, 11. [Google Scholar] [CrossRef]
  6. Shekarian, E.; Ijadi, B.; Zare, A.; Majava, J. Sustainable Supply Chain Management: A Comprehensive Systematic Review of Industrial Practices. Sustainability 2022, 14, 30. [Google Scholar] [CrossRef]
  7. Bai, C.G.; Kusi-Sarpong, S.; Ahmadi, H.B.; Sarkis, J. Social sustainable supplier evaluation and selection: A group decision-support approach. Int. J. Prod. Res. 2019, 57, 7046–7067. [Google Scholar] [CrossRef]
  8. Pedroso, C.B.; Tate, W.L.; da Silva, A.L.; Carpinetti, L.C.R. Supplier development adoption: A conceptual model for triple bottom line (TBL) outcomes. J. Clean. Prod. 2021, 314, 18. [Google Scholar]
  9. Maaloul, A.; Zéghal, D.; Ben Amar, W.; Mansour, S. The Effect of Environmental, Social, and Governance (ESG) Performance and Disclosure on Cost of Debt: The Mediating Effect of Corporate Reputation. Corp. Reput. Rev. 2023, 26, 1–18. [Google Scholar] [CrossRef]
  10. Puriwat, W.; Tripopsakul, S. From ESG to DESG: The Impact of DESG (Digital Environmental, Social, and Governance) on Customer Attitudes and Brand Equity. Sustainability 2022, 14, 15. [Google Scholar] [CrossRef]
  11. Chen, Z.F.; Xie, G.X. ESG disclosure and financial performance: Moderating role of ESG investors. Int. Rev. Financ. Anal. 2022, 83, 16. [Google Scholar] [CrossRef]
  12. Elkington, J. Towards the sustainable corporation—Win-win-win business strategies for sustainable development. Calif. Manag. Rev. 1994, 36, 90–100. [Google Scholar] [CrossRef]
  13. Noci, G. Designing ‘green’ vendor rating systems for the assessment of a supplier’s environmental performance. Eur. J. Purch. Supply Manag. 1997, 3, 103–114. [Google Scholar] [CrossRef]
  14. Govindan, K.; Khodaverdi, R.; Jafarian, A. A fuzzy multi criteria approach for measuring sustainability performance of a supplier based on triple bottom line approach. J. Clean. Prod. 2013, 47, 345–354. [Google Scholar] [CrossRef]
  15. Fallahpour, A.; Olugu, E.U.; Musa, S.N.; Wong, K.Y.; Noori, S. A decision support model for sustainable supplier selection in sustainable supply chain management. Comput. Ind. Eng. 2017, 105, 391–410. [Google Scholar] [CrossRef]
  16. Yazdani, M.; Chatterjee, P.; Zavadskas, E.K.; Hashemkhani, Z.S. Integrated QFD-MCDM framework for green supplier selection. J. Clean. Prod. 2017, 142, 3728–3740. [Google Scholar] [CrossRef]
  17. Zimmer, K.; Fröhling, M.; Schultmann, F. Sustainable supplier management—A review of models supporting sustainable supplier selection, monitoring and development. Int. J. Prod. Res. 2016, 54, 1412–1442. [Google Scholar] [CrossRef]
  18. Ahi, P.; Searcy, C. Measuring social issues in sustainable supply chains. Meas. Bus. Excell. 2015, 19, 33–45. [Google Scholar] [CrossRef]
  19. Ahmadi, H.B.; Kusi-Sarpong, S.; Rezaei, J. Assessing the social sustainability of supply chains using Best Worst Method. Resour. Conserv. Recycl. 2017, 126, 99–106. [Google Scholar] [CrossRef]
  20. Ghadimi, P.; Dargi, A.; Heavey, C. Making sustainable sourcing decisions: Practical evidence from the automotive industry. Int. J. Logist. Res. Appl. 2017, 20, 297–321. [Google Scholar] [CrossRef]
  21. Chai, N.J.; Zhou, W.L.; Jiang, Z.G. Sustainable supplier selection using an intuitionistic and interval-valued fuzzy MCDM approach based on cumulative prospect theory. Inf. Sci. 2023, 626, 710–737. [Google Scholar] [CrossRef]
  22. Hendiani, S.; Liao, H.C.; Ren, R.X.; Lev, B. A likelihood-based multi-criteria sustainable supplier selection approach with complex preference information. Inf. Sci. 2020, 536, 135–155. [Google Scholar] [CrossRef]
  23. Mina, H.; Kannan, D.; Gholami-Zanjani, S.M.; Biuki, M. Transition towards circular supplier selection in petrochemical industry: A hybrid approach to achieve sustainable development goals. J. Clean. Prod. 2021, 286, 16. [Google Scholar] [CrossRef]
  24. Karami, S.; Yaghin, R.G.; Mousazadegan, F. Supplier selection and evaluation in the garment supply chain: An integrated DEA-PCA-VIKOR approach. J. Text. Inst. 2021, 112, 578–595. [Google Scholar] [CrossRef]
  25. Aditi; Kannan, D.; Darbari, J.D.; Jha, P.C. Sustainable supplier selection model with a trade-off between supplier development and supplier switching. Ann. Oper. Res. 2023, 331, 351–392. [Google Scholar] [CrossRef]
  26. Awasthi, A.; Govindan, K.; Gold, S. Multi-tier sustainable global supplier selection using a fuzzy AHP-VIKOR based approach. Int. J. Prod. Econ. 2018, 195, 106–117. [Google Scholar] [CrossRef]
  27. Dai, T.L.; Tang, C. Frontiers in Service Science: Integrating ESG Measures and Supply Chain Management: Research Opportunities in the Postpandemic Era. Serv. Sci. 2022, 14, 1–12. [Google Scholar] [CrossRef]
  28. Zeng, H.L.; Li, R.Y.M.; Zeng, L.Y. Evaluating green supply chain performance based on ESG and financial indicators. Front. Environ. Sci. 2022, 10, 13. [Google Scholar] [CrossRef]
  29. UNGC. Who Cares Wins: Connecting Financial Markets to a Changing World. 2004. Available online: https://www.unepfi.org/fileadmin/events/2004/stocks/who_cares_wins_global_compact_2004.pdf (accessed on 15 February 2023).
  30. Yu, E.P.Y.; Van Luu, B.; Chen, C.H. Greenwashing in environmental, social and governance disclosures. Res. Int. Bus. Financ. 2020, 52, 23. [Google Scholar] [CrossRef]
  31. Brooks, C.; Oikonomou, I. The effects of environmental, social and governance disclosures and performance on firm value: A review of the literature in accounting and finance. Br. Account. Rev. 2018, 50, 1–15. [Google Scholar] [CrossRef]
  32. Huang, D.Z.X. Environmental, social and governance (ESG) activity and firm performance: A review and consolidation. Account. Financ. 2021, 61, 335–360. [Google Scholar] [CrossRef]
  33. Wang, N.; Pan, H.Y.; Feng, Y.Z.; Du, S.X. How do ESG practices create value for businesses? Research review and prospects. Sustain. Account. Manag. Policy J. 2023, 23, 24. [Google Scholar] [CrossRef]
  34. Cornell, B. ESG preferences, risk and return. Eur. Financ. Manag. 2021, 27, 12–19. [Google Scholar] [CrossRef]
  35. Drempetic, S.; Klein, C.; Zwergel, B. The Influence of Firm Size on the ESG Score: Corporate Sustainability Ratings under Review. J. Bus. Ethics 2020, 167, 333–360. [Google Scholar] [CrossRef]
  36. Singhania, M.; Saini, N. Institutional framework of ESG disclosures: Comparative analysis of developed and developing countries. J. Sustain. Financ. Invest. 2023, 13, 516–559. [Google Scholar] [CrossRef]
  37. Bruno, M.; Lagasio, V. An Overview of the European Policies on ESG in the Banking Sector. Sustainability 2021, 13, 10. [Google Scholar] [CrossRef]
  38. Alamillos, R.R.; de Mariz, F. How Can European Regulation on ESG Impact Business Globally? J. Risk Financ. Manag. 2022, 15, 19. [Google Scholar]
  39. Fytilakos, I. Text mining in fisheries scientific literature: A term coding approach. Ecol. Inform. 2021, 61, 8. [Google Scholar] [CrossRef]
  40. Kobayashi, V.B.; Mol, S.T.; Berkers, H.A.; Kismihók, G.; Den Hartog, D.N. Text Mining in Organizational Research. Organ. Res. Methods 2018, 21, 733–765. [Google Scholar] [CrossRef]
  41. Dicle, M.F.; Dicle, B. Content analysis: Frequency distribution of words. Stata J. 2018, 18, 379–386. [Google Scholar] [CrossRef]
  42. Laver, M.; Benoit, K.; Garry, J. Extracting policy positions from political texts using words as data. Am. Political Sci. Rev. 2003, 97, 311–331. [Google Scholar] [CrossRef]
  43. Roberts, C.W. Other than counting words—A linguistic approach to content-analysis. Soc. Forces 1989, 68, 147–177. [Google Scholar] [CrossRef]
  44. Kolbe, R.H.; Burnett, M.S. Content-analysis research—An examination of applications with directives for improving research reliability and objectivity. J. Consum. Res. 1991, 18, 243–250. [Google Scholar] [CrossRef]
  45. Scott, W.A. Citation classic—Reliability of content-analysis—The case of nominal scale coding. Curr. Contents/Soc. Behav. Sci. 1984, 18, 14-14. [Google Scholar]
  46. Müller-Hansen, F.; Callaghan, M.W.; Minx, J.C. Text as big data: Develop codes of practice for rigorous computational text analysis in energy social science. Energy Res. Soc. Sci. 2020, 70, 9. [Google Scholar] [CrossRef]
Figure 1. Concerns for sustainability activities based on the “ESG Reporting Guidelines” (System 1).
Sustainability 16 00757 g001
Figure 2. Concerns for sustainability activities based on corporate supplier management behavior (System 2).
Sustainability 16 00757 g002
Figure 3. Application flow chart of the reconstructed evaluation criteria.
Sustainability 16 00757 g003
Table 1. Research sample.
“Regulation Requirements” Sample“Corporate Practices” Sample
Objects number6917
Raw data size6942
After-filtering data size5542
Table 2. Relevant parameters.
ParameterDefinition
E T k i The occurrence times of the i th initial category indicator in the k th dimension
T T k The total occurrence times of all initial category indicators in the k th dimension
n The number of initial category indicators
m The number of dimensions
i i = 1 ,   2 , , n
k k = 1 ,   2 , , m
Table 3. Analysis of the second-stage indicators of System 1.
ESG
Given critical indicator accumulated R value90.0%90.0%80.0%
Critical indicator R value1.9%1.7%2.6%
Actual critical indicator accumulated R value93.7%88.9%80.4%
The number of indicators retained in the 2nd stage152014
Deleted number of indicators11112
Table 4. Analysis of third-stage indicators of System 2.
ESG
Given critical indicator accumulated R value90.0%90.0%90.0%
Critical indicator R value2.3%2.1%1.7%
Actual critical indicator accumulated R value93.1%92.2%93.6%
The number of indicators retained in the 2nd stage181417
Deleted number of indicators357
Table 5. The reconstructed sustainable supplier evaluation criteria based on ESG requirements.
Major IndicatorSecondary IndicatorPrimary Indicator
E—Environmental Dimension
E1
Production Behavior
E1-1 Production PerformanceE1-1.1 Greenhouse Gas Emission, E1-1.2 Gas Emission Intensity, E1-1.3 Material Type and Efficiency, E1-1.4 Carbon Footprint, E1-1.5 Waste Gas Emission, E1-1.6 Waste Water Emission, E1-1.7 Pollutant, E1-1.8 Product
E1-2 Resources ManagementE1-2.1 Resource Efficiency, E1-2.2 Energy, E1-2.3 Water, E1-2.4 Land
E1-3 Production ManagementE1-3.1 Waste Management, E1-3.2 Hazardous Substance Management, E1-3.3 Chemical Substance Management, E1-3.4 Recycling Management
E2
Environment
Compliance
E2-1 Environment
Management System
E2-1.1 Environment Management System, E2-1.2 Environment Certification and Licensing, E2-1.3 Environment Due Diligence
E2-2 Environmental
Performance
E2-2.1 Environment Incident Records, E2-2.2 Environment Compliance, E2-2.3 Climate Change and Protection, E2-2.4 Air Quality Impact, E2-2.5 Biodiversity
S—Social Dimension
S1
Internal
Employment
S1-1 Employee RightS1-1.1 Occupation Health and Safety, S1-1.2 Wages and Benefits, S1-1.3 Freedom of Association and Collective, S1-1.4 Human Rights, S1-1.5 Employee Grievance Mechanism, S1-1.6 Career Development and Training, S1-1.7 Human Resources Management Policy
S1-2 Employment
Performance
S1-2.1 Child Labor and Forced Labor, S1-2.2 Non-discrimination and Equality, S1-2.3 Working Hours, S1-2.4 Gender Pay Ratio, S1-2.5 CEO Pay Ratio, S1-2.6 Inclusion and Diversity, S1-2.7 Working Environment
S1-3 Employment conditionS1-3.1 Employee Turnover Rate, S1-3.2 Gender Ratio, S1-3.3 Temporary Worker Ratio
S2
External Behavior
S2-1 Supply ChainS2-1.1 Conflict Minerals, S2-1.2 Supply Chain Audit Data, S2-1.3 Supply Chain Social Management, S2-1.4 Local Procurement
S2-2 CorporateS2-2.1 Product Responsibility, S2-2.2 Consumer Privacy, S2-2.3 Social Violations, S2-2.4 Prohibition of Supporting Armed Forces
S2-3 CommunityS2-3.1 Community Impact, S2-3.2 Local Community Rights
G—Governance Dimension
G1
Organization
Governance
G1-1 Governance ComplianceG1-1.1 Board Diversity, G1-1.2 Board Independence, G1-1.3 Intellectual Property Protection, G1-1.4 Anti-corruption and Bribery, G1-1.5 Business Ethics, G1-1.6 Compliance with Laws, G1-1.7 Money Laundering
G1-2 Management BehaviorG1-2.1 Data Policy, G1-2.2 Incentivized Pay, G1-2.3 Supplier Code of Conduct, G1-2.4 Discloser Policy, G1-2.5 Management System and Accountability, G1-2.6 Stakeholder Management
G1-3 Information GovernanceG1-3.1 Conflict of Interest, G1-3.2 Information Disclosure, G1-3.3 Information Security Protection, G1-3.4 Personal Privacy Protection, G1-3.5 Information Privacy Protection
G2
Operation
Governance
G2-1 Market BehaviorG2-1.1 Fair Competition and Transactions, G2-1.2 No Unfair Competition, G2-1.3 External Supervision, G2-1.4 Inconsistent Behavior
G2-2 Sustainability ProjectG2-2.1 Sustainability External Assurance, G2-2.2 Sustainability Reporting, G2-2.3 Sustainability Disclosure
G2-3 Risk ManagementG2-3.1 Import and Export Control, G2-3.2 AI Risk
Disclaimer/Publisher’s Note: The statements, opinions and data contained in all publications are solely those of the individual author(s) and contributor(s) and not of MDPI and/or the editor(s). MDPI and/or the editor(s) disclaim responsibility for any injury to people or property resulting from any ideas, methods, instructions or products referred to in the content.

