Article

A New Land Use Dataset Fusion Algorithm for the Runoff Simulation Accuracy Improvement: A Case Study of the Yangtze River Basin, China

1
State Key Laboratory of Simulation and Regulation of Water Cycle in River Basin, China Institute of Water Resources and Hydropower Research, Beijing 100038, China
2
Tianjin University, Tianjin 300072, China
3
China Three Gorges Corporation, Beijing 100038, China
*
Author to whom correspondence should be addressed.
Sustainability 2024, 16(2), 778; https://doi.org/10.3390/su16020778
Submission received: 10 November 2023 / Revised: 25 December 2023 / Accepted: 11 January 2024 / Published: 16 January 2024
(This article belongs to the Special Issue Sustainable Water Resource Management and Agriculture Development)

Abstract

:
Monitoring and understanding the development of agricultural management requires fine information on multiple agricultural land use classes. According to the main data bulletin of China’s third national land survey released in 2021, the proportion of arable land in China accounts for 16% of the total land area. After excluding areas that are not suitable for development (slope greater than 25 degrees), the remaining area represents arable land affected by human activities, constituting 96.69% of the total arable land area in the country. Artificially irrigated areas are products of the intertwined interactions between the natural environment and human society. However, the original remote sensing image (China’s land use/cover datasets, CLUDs), which is designed to depict the land use and cover patterns in mainland China, categorizes arable land into two main types: paddy fields and dryland. It lacks a subdivision of artificially irrigated areas. We also found a data discrepancy of more than 10% between the statistical data of rice and the paddy field data in CLUDs. To refine land use data, and then improve the simulation accuracy of the hydrological model, this article proposes a dual-source datasets fusion algorithm, learning based on big data, namely the LUCC statistical data fusion (LUSF) algorithm for integrating the remote sensing-based cropland area dataset and statistics dataset. The runoff simulation results show that, in the Yangtze River Basin, using LUSF datasets, the mean absolute percentage error value of monthly simulated runoff decreased by 0.74%, and the root mean square error value decreased by 0.22 million m 3 . At the basin scale, the absolute error of the simulated runoff is reduced by an average of 433 million m 3 per year, and 36 million m 3 every month. The LUSF datasets corrected the canopy interception coefficient effectively; the runoff simulation error was reduced by 2.96 billion m 3 /a. In the past 40 years, the runoff variation in Dongting Lake and Hanjiang River has been most strongly impacted by changes in the underlying surface. These results reveal that the new data fusion method has some significant improvement over the original method, applicable to the runoff simulation disturbed by strong human activities.

1. Introduction

Land use-induced land cover change (LUCC) is an important anthropogenic driving force of global change that has influenced (and is still influencing) many aspects of regional and global environments [1]; the fine LUCC dataset is very important for environmental sustainability and food security [2]. Variations in land use types among different datasets can impact the accuracy of classification, influencing the performance of hydrological model simulations and predictions. China’s land use/cover datasets (CLUDs) are currently the high-precision land use data covering the entire country; these datasets play a crucial role in national land resource surveys, hydrological studies, and ecological research [3]. However, the dataset categorizes arable land into only two types, paddy fields and dry fields, which does not align with the diverse crops grown in reality. As different crops require varying irrigation timings and amounts of water, using this dataset as input for hydrological models results in lower accuracy.
Land use changes are closely related to hydrological processes, undergoing multilayered impacts soil infiltration, land-surface evapotranspiration (ET), canopy interception, and other hydrological parameters during rainfall events [4,5,6,7,8]. This redistribution of water resources consequently affects hydrological cycles. Numerous studies have focused on the relationship between land cover at the watershed scale and surface runoff. Existing research has demonstrated that considering finer subcategories of land cover types, starting from their impact on the hydrological process and catchment structure, enhances the applicability of hydrological simulation models. The impacts of anthropogenic land use changes, particularly under rapid urbanization and agricultural irrigation activities, and the associated changes in water demand, have been found to be significantly pronounced on hydrological processes [9,10,11]. The changes in the quantity and extent of agricultural land resulting from land use significantly interfere with the hydrological connectivity of the watershed. The alterations in the landscape structure of agricultural land impact surface runoff [3]. The urban land use types extracted from high-resolution remote sensing images can reveal the runoff generation and flow confluence mechanism more accurately in urbanized regions [12]. In summary, fine-grained land use products play a crucial role in simulating surface runoff processes and water cycles under intense human disturbances; they play a vital role in upholding ecological security, fostering systematic development, and ensuring the well-ordered advancement of watersheds.
Of all LUCC, 60% is associated with direct human activities and 40% with indirect drivers, such as climate change [13]. China is one of the regions where high-intensity human activities dramatically influenced land use patterns in the world [14]. Satellite remote sensing monitoring and statistical yearbooks are the two representative cropland data sources in China. Commensurate with rapid developments in computer hardware and software, the capacity for satellite data acquisition has greatly increased [15]. The extraction of natural resource elements based on remote sensing imagery is the most fundamental, widely applied, resource-intensive, and technologically challenging aspect in the field of survey and monitoring work [16]. In China, remote sensing-based human–machine interaction interpretation technology is currently one of the widely used methods for obtaining land use data. Currently, the primary reliance is on manpower-intensive tactics, utilizing a combination of visual interpretation through human–machine interaction and on-site verification through detailed field checks. With the rapid development of artificial intelligence, adopting machine learning methods to achieve automatic, fast, and accurate interpretation of high-resolution remote sensing imagery has become the mainstream research direction [16,17,18,19]. For the long period and high data accuracy, CLUDs formed by the use of human–machine interaction interpretation technology are widely applied in hydrological studies and national land surveys [20,21,22,23]. Based on the Landsat TM/ETM+ and Landsat 8 remote sensing images, the datasets were produced at five-year intervals from the 1980s to 2015 [24]. According to the national land use classification, land use types have been categorized into 6 primary and 25 secondary categories [25]. The statistical data regarding the snow-covered areas of major regional crops are used as basic data to verify the accuracy of the area extraction of various crops [2]. Most of these data are obtained from statistical yearbooks and reports at the regional scale. The data have better fidelity, authority, and reliability, but the real statistics are often quite different from remote sensing data [26].
Over the past few decades, domestic and foreign scholars have carried out research on the fusion method of multiple sensor data to construct a high spatiotemporal resolution image dataset [27]. Nevertheless, those mapping methods rely on the very-high spatial resolution of original images [28] and need to overcome formidable technological challenges. Few studies have focused on remote sensing images and statistical fusion method development, e.g., the pixel-based method [2,29], fusing the multiple existing cropland products and using statistics as thresholds. Chad et al. (2008) rasterized crop areas and generated novel maps of major crop groups, crop net primary production, and four physiologically based crop types [30]. They used an adaptability index to integrate two-source data from Russia and generate a mixed land cover dataset [14]. Steffen et al. set weights to generate consistent quantities of cultivated land close to statistical data [31]. Most of these studies focus on mapping a single crop type. The accuracy and efficiency were limited by poor data availability and the image-based method [27,28,32,33], or the lack of practical application. Meanwhile, the different crop planting areas influence ET, infiltration, irrigation water, and other parameters [34]. However, there are few land use/land cover (LUCC) datasets that presently consider the concepts of irrigated and non-irrigated areas.
Under strong economic and social interference, the influence of uncertain factors on the water cycle process is increasing. The hydrological model plays an important role in water resource management [35,36,37], and the simulations of runoff are sensitive to land use maps with varying accuracy [38]. The goal of this research is to minimize the runoff simulation error caused by misclassification errors in CLUDs and address the issue of dual-source data mismatch while maintaining consistency with the statistical data in the Yangtze River Basin. First, based on a large number of sample data analyses, we propose a land use data set reconstruction algorithm, combining the higher classification accuracy of cultivated land in statistics and the large-scale spatial distribution information of remote sensing data. Secondly, we investigate whether adding crop statistics will improve the performance of the distributed hydrological model effectively. The LUSF algorithm was tested on a large-scale watershed with 97 prefecture-level cities in China. Subsequently, we will describe the algorithm in detail and discuss how to refine cropland data to improve the accuracy of runoff simulation.

2. Introduction to the Study Area

The Yangtze River Basin (YZRB), the largest river in China, has witnessed rapid population growth and great changes in land use and land cover (LULC) area, the change caused by human activities is the main driving factor of LUCC [39]. At present, over 600 million people are living in the YZRB area, which accounts for about 45% of the country’s population. The cultivated land area of the basin is about 24,600 km 2 , accounting for a quarter of the country’s total cultivated land. Farmland is a crop-growing area modified artificially, serving both ecological and production spaces.
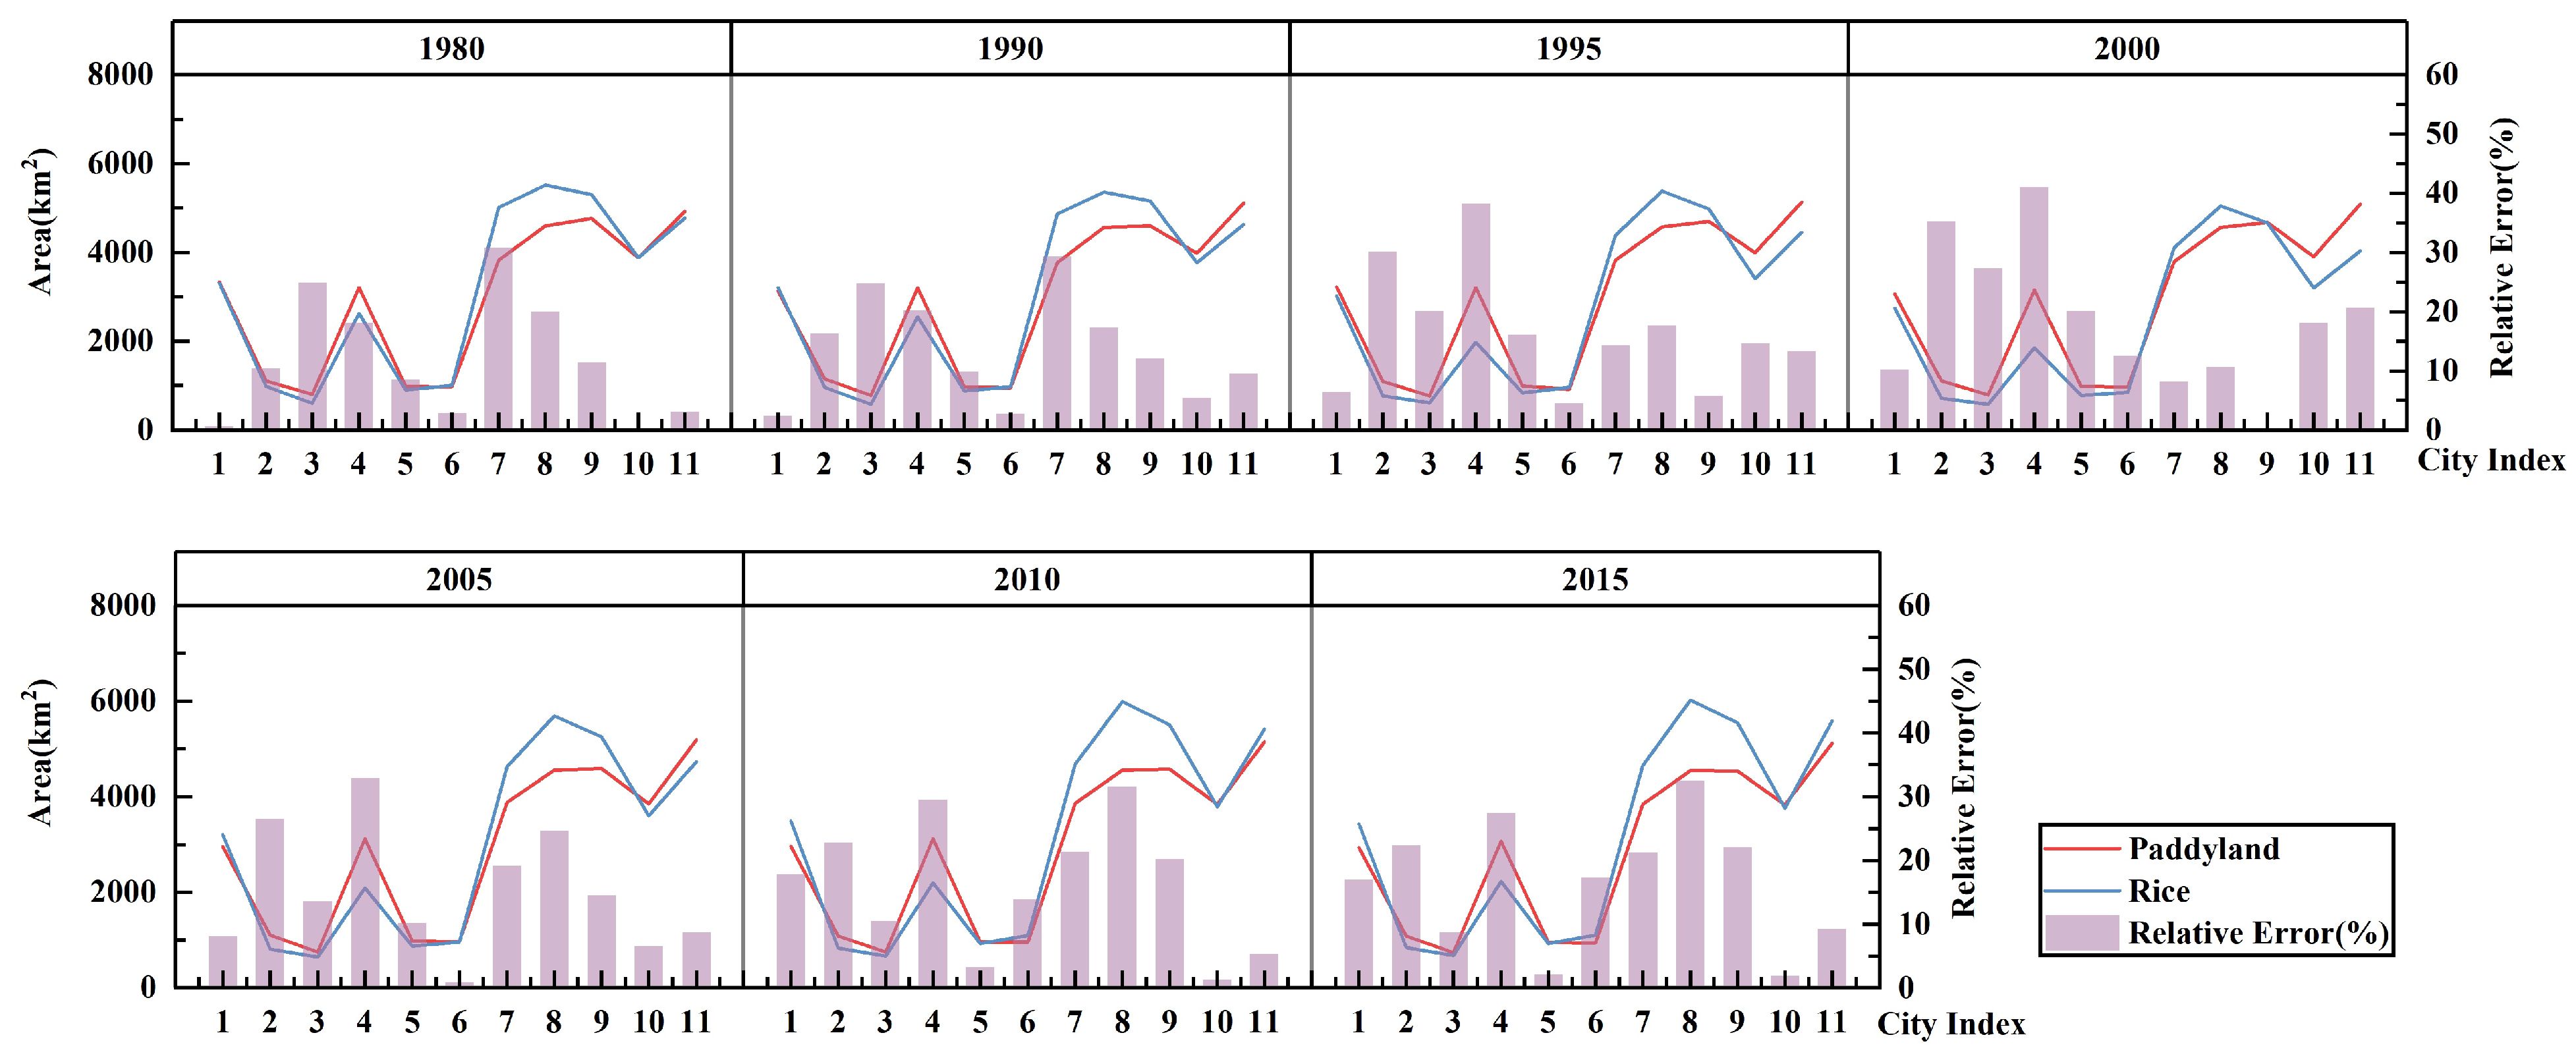
The study area is located at 90°33 E–122°25 E and 24°30 N–35°45 N, covers an area of 1.80 million km2, and occupies 19% of the total area of China (Figure 1). Due to the vast area, complex terrain, and typical monsoon climate, the spatiotemporal distribution of annual precipitation and rainstorms is very uneven [40]. Through data collection, we identified a certain level of discrepancy between the paddy field area extracted using GIS technology in CLUDs and the local statistical yearbook data, indicating difficulties in interpretation and misclassification problems. Using Jiangxi Province as an example, the data error is illustrated in Figure 2.

3. Data Introduction

The major crop snow areas were mainly acquired from provincial and prefecture-level statistical yearbooks in China, and include rice, wheat, maize, vegetables, and other crops. Since wheat and maize rotation is a common planting method, our study used a larger area of wheat and maize (WM). In addition, the statistical datasets are constructed with other materials, including China’s Rural Economic Statistical Summary by County [41], the Statistical Yearbook of Yangtze River Economic Zone [42], the Statistical Communique of the People’s Republic of China on National Economic and Social Development [43], and the 1949–2019 China Agricultural Statistical Report [44]. The average missing data rate is about 35%, mostly occurring in the 1980s. The deficiency rate in the past 20 years has been less than 30% (Table 1). The missing values were filled by a linear interpolation algorithm, and the outliers were corrected by the trend method.
China’s land use/cover datasets (CLUDs) were interpreted from the Landsat TM/ETM+ and Landsat 8 remote sensing images, with a spatial resolution of 1 km, for the years 1980, 1990, 1995, 2000 2005, 2010, and 2015. They were mapped by the Institute of Geographic Sciences and Natural Resources Research, Chinese Academy of Sciences [45,46]. The dataset producer used this method based on a vast amount of geoscientific knowledge. According to the reports, the overall accuracy of CLUDs is up to 90%. The different data types used in this paper are shown in Table 2.

4. Method

4.1. LUSF Classification

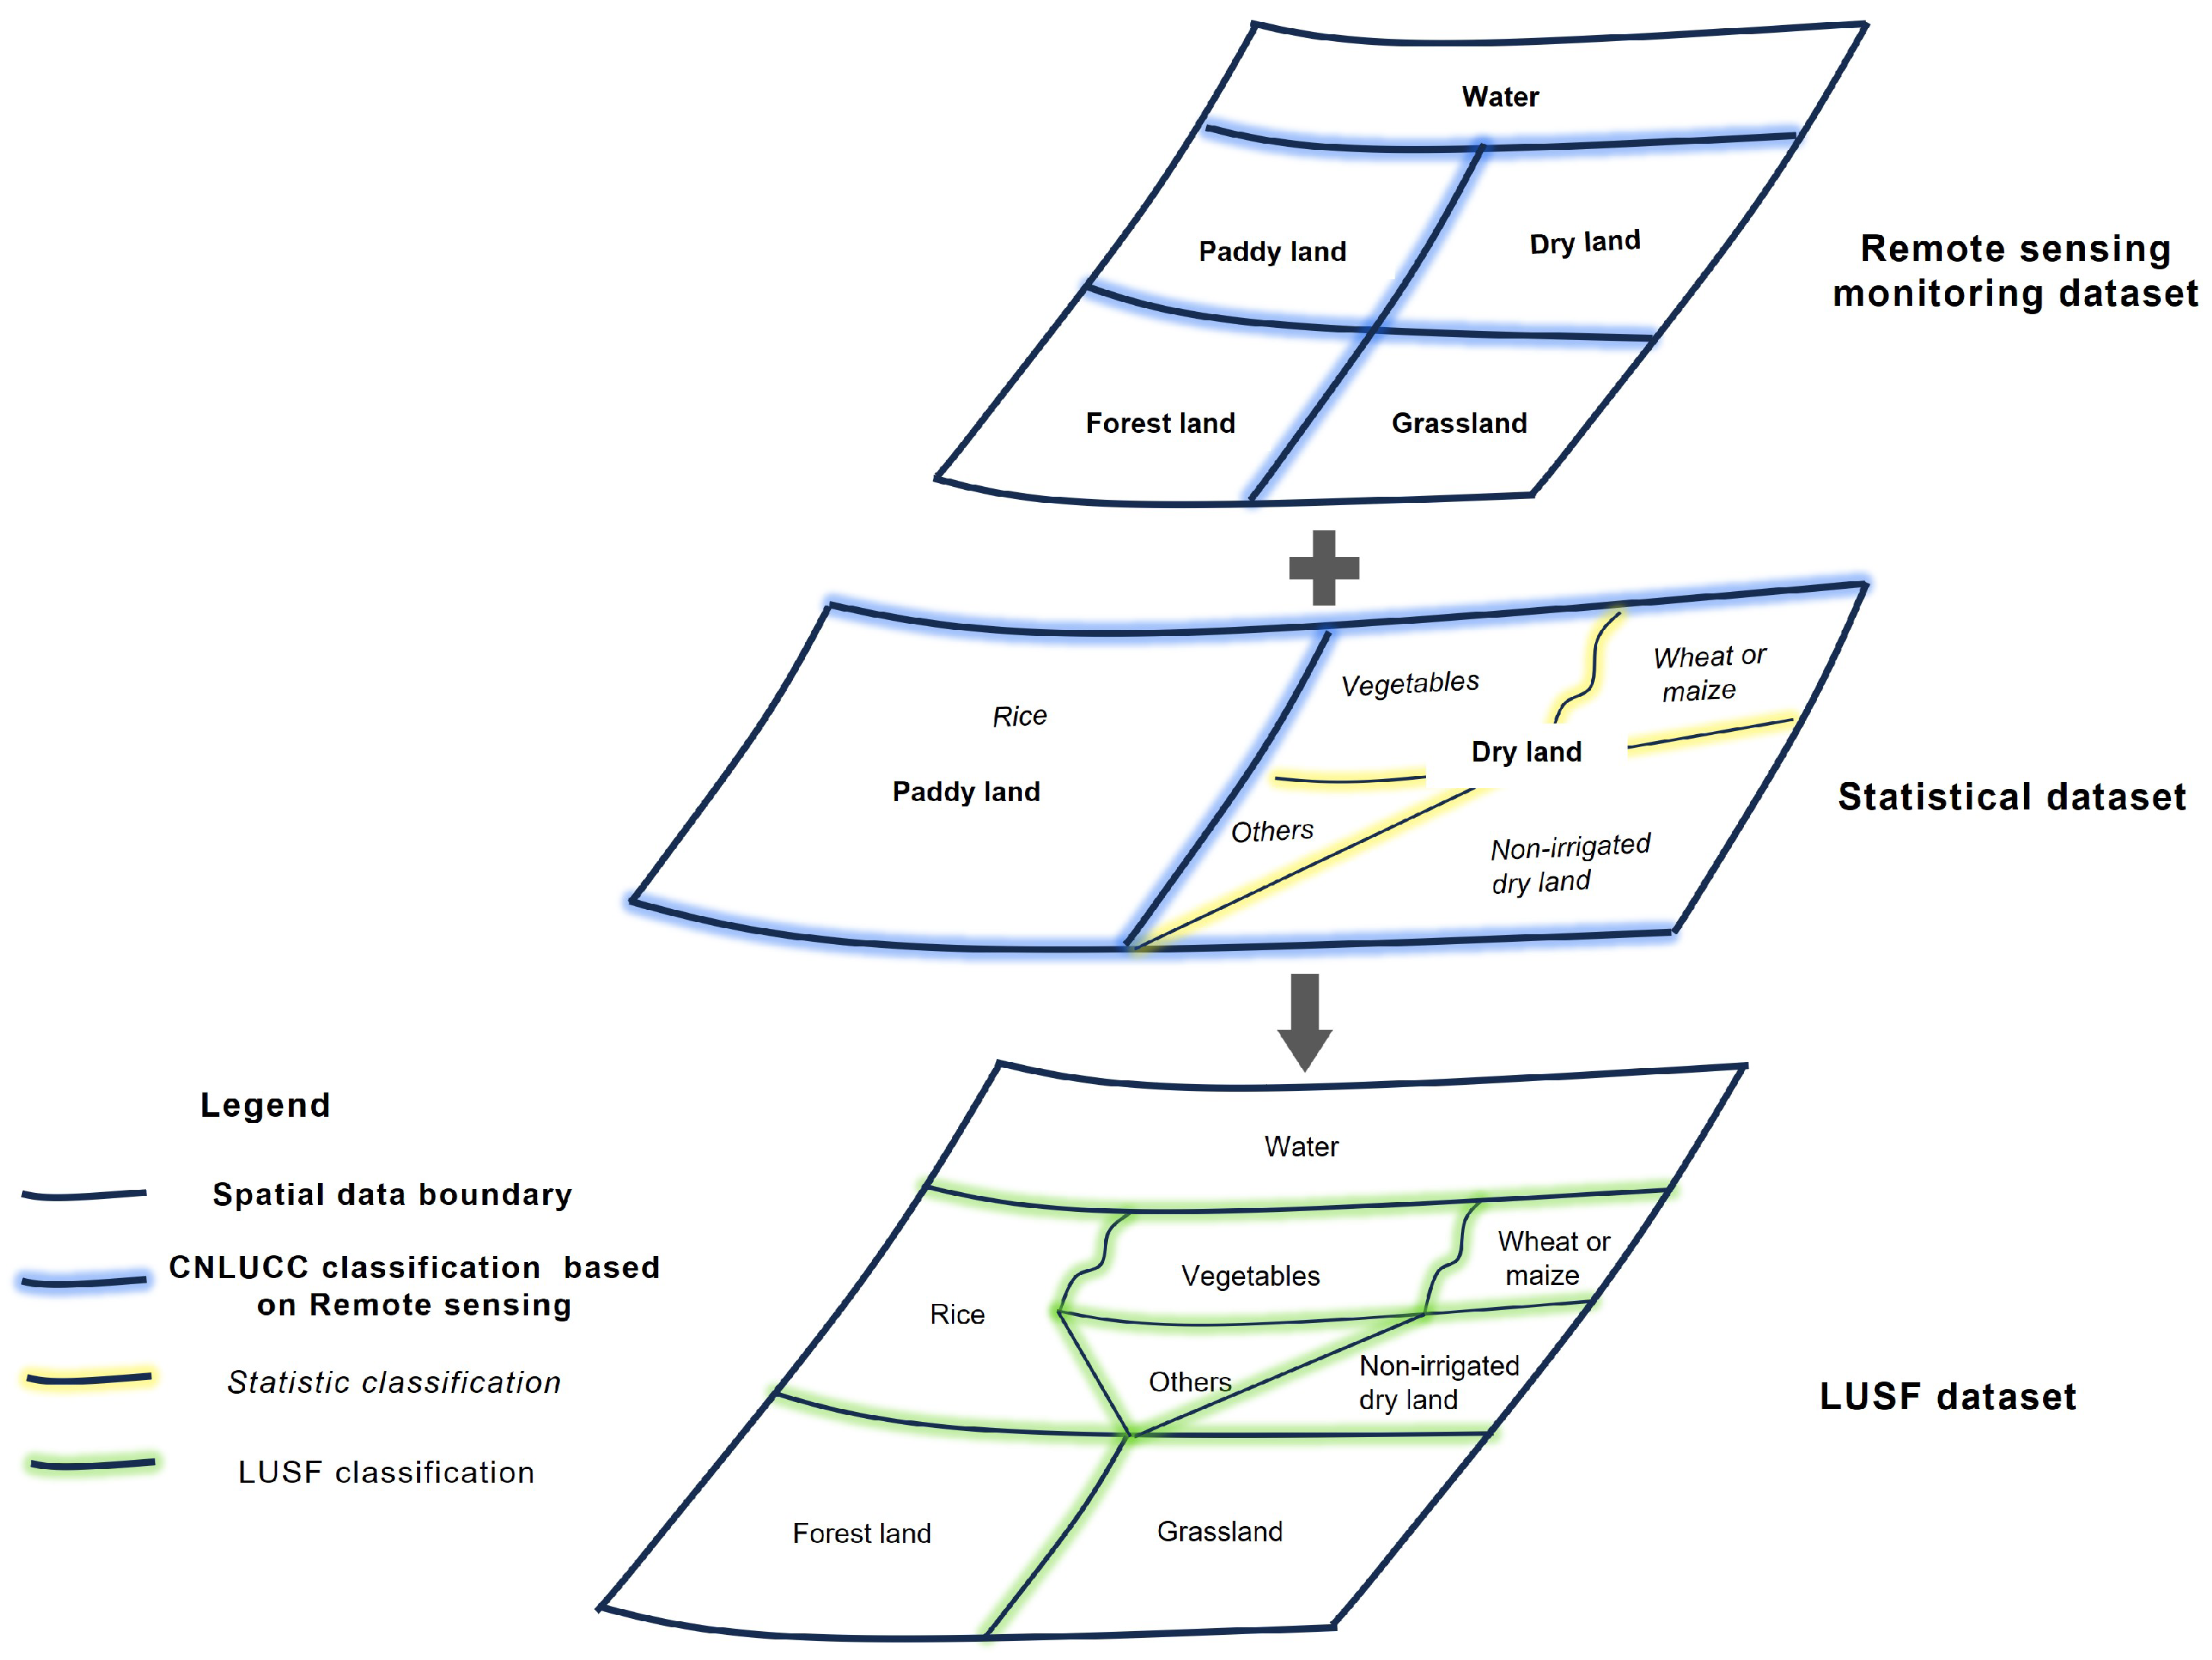
Most of the current land cover datasets and land-use models use a classification of land cover based on the dominant land cover type within a distinct region, which disregards the diversity and intensity of human influence [47]. Since dual-source datasets vary in their classification schemes, in this study, we combine the main crops’ statistical index from the provincial statistical yearbook and refine the cropland area of the CLUDs at a large basin scale. This approach clarifies the meaning of farmland before data fusion.
In China’s current land use classification [48], cropland is divided into three categories: paddy fields for aquatic crops, irrigated land for dry crops, and dry land for non-irrigated crops. The four main crops planted are rice, wheat, maize, and vegetables. These crops play an important role in national agricultural production [49,50,51]. Thus, the areas of paddy fields and irrigated dry land are further subdivided into these four main crop areas, and the woodland, grassland, and buffer zones of water bodies with similar characteristics in the regional CLUDs are reconstructed. Along with dry land, built-up land, and bare land, these ten land use types constitute the LUSF datasets (Figure 3).

4.2. Dual-Source Dataset Fusion Method

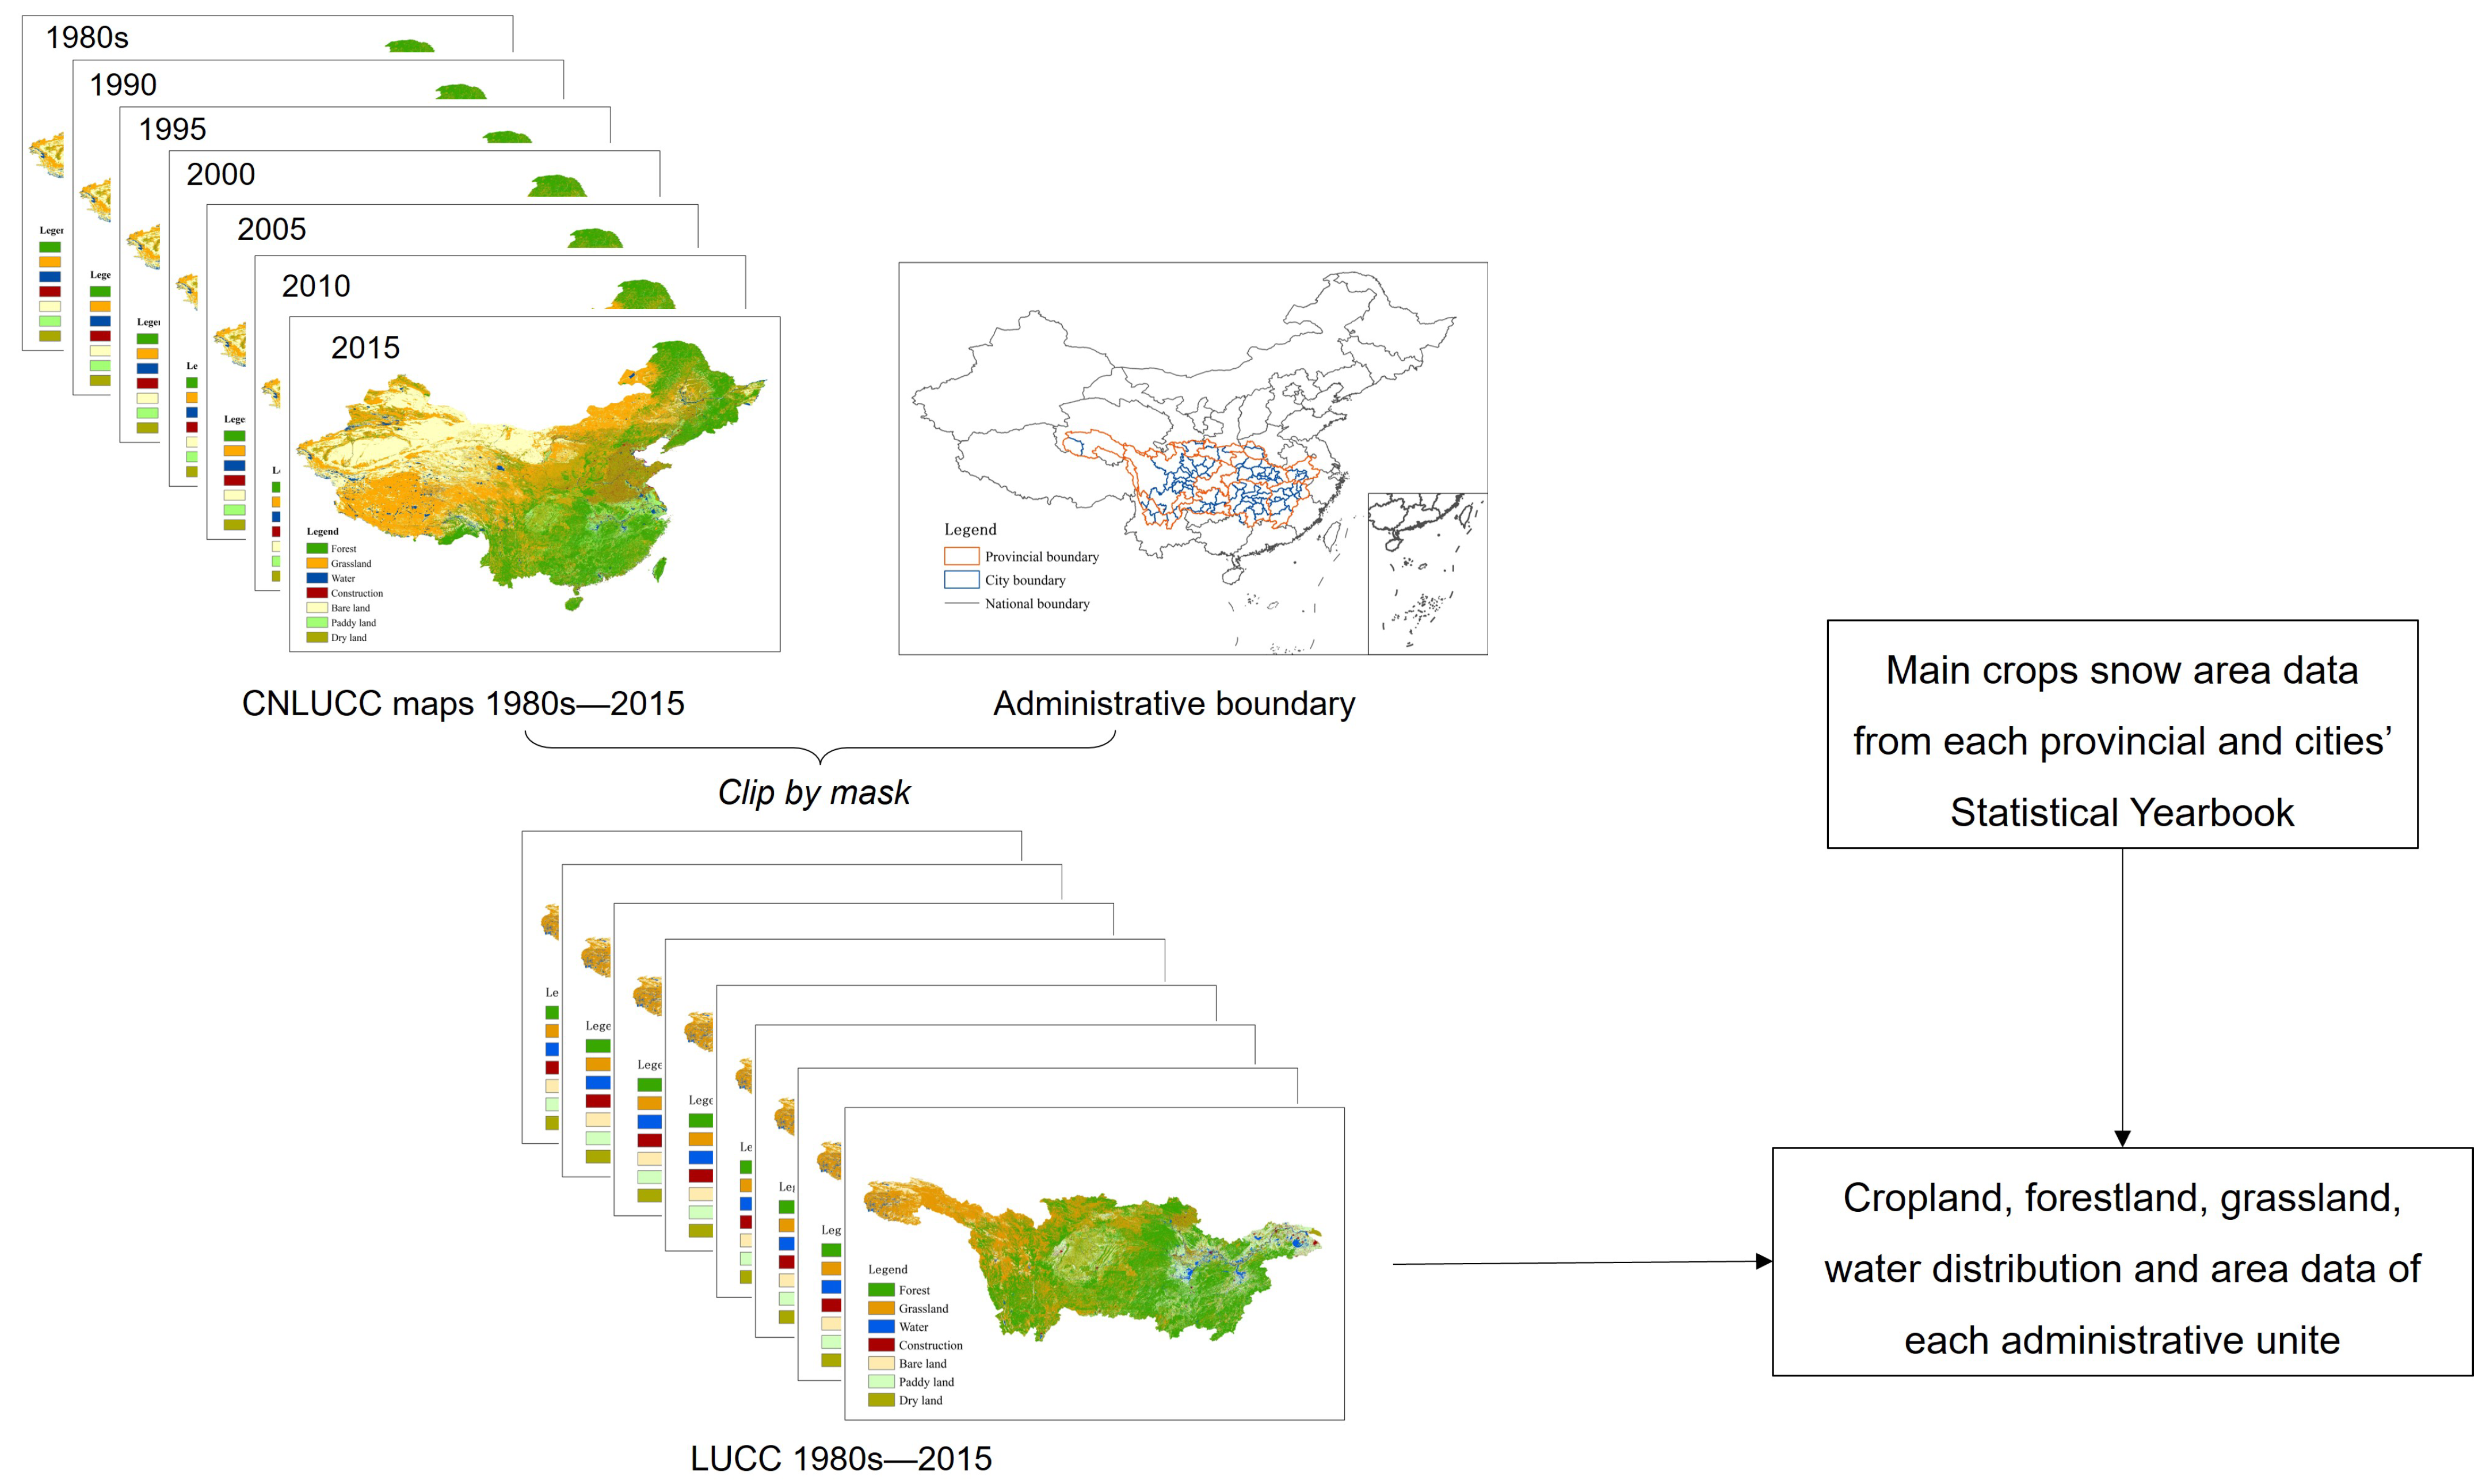
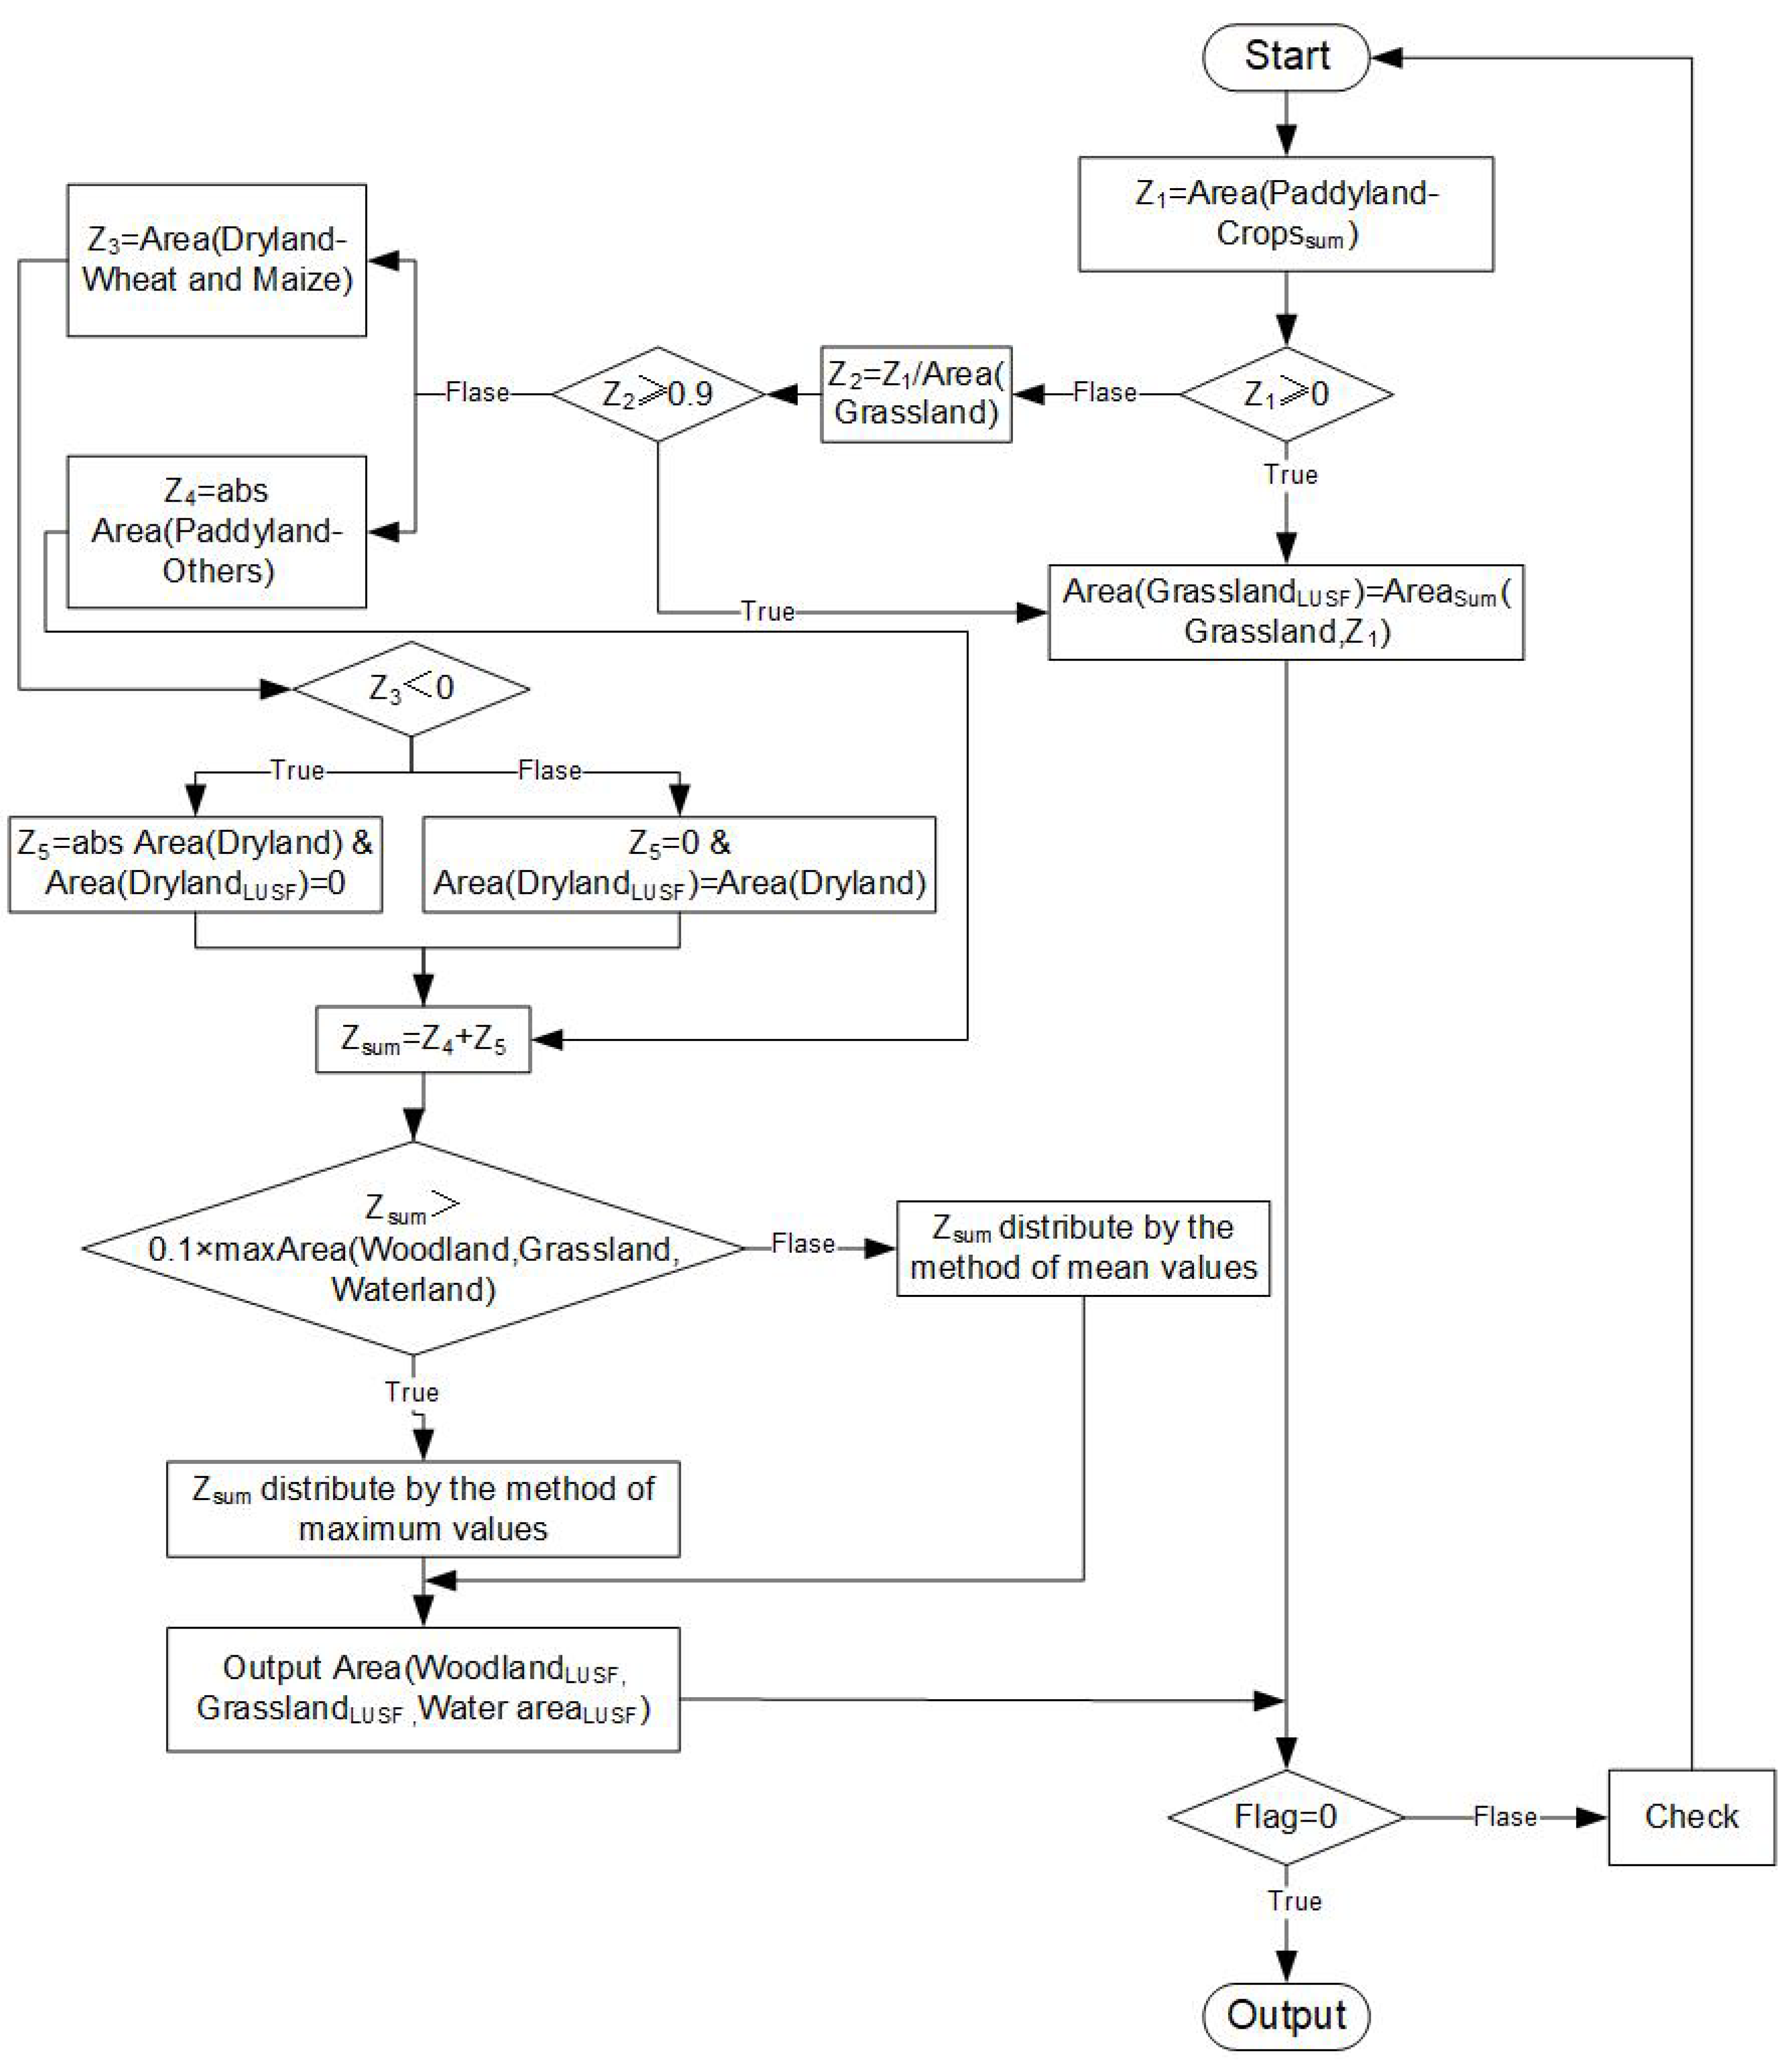
In this paper, limited by the collection units of statistical data, we first integrated the crops’ statistical dataset and CLUDs at the administrative unit scale (Figure 4). The LUSF fusion algorithm roadmap is as follows (Figure 5):
Based on the original data sample feature learning, the empirical threshold is set at 10%. The calculation formula is as follows:
Z 1 , i = I i j = 1 4 f c r o p i j , I i j = 1 4 f c r o p i j 0 I i j = 1 3 f c r o p i j , others
D 1 , i = D 0 , i , Z 1 , i 0 0 , Z 1 , i < 0 and 0 W M 0 , i D 0 , i D 0 , i W M 0 , i , others
Z 2 , i = W M 0 , i D 0 , i , D 0 , i 0 and D 1 , i = 0 0 , o t h e r s
where I i represents the paddy land area from CLUDs of the i-th prefecture-level city (km2); f c r o p i j represents the area of j crop types (statistical data) in the i-th prefecture-level city (km2); D 0 , i , D 1 , i represent dry land area before and after integration (km2), respectively; Z 1 , i represents the sum of the crop area difference per unit between statistics and CLUD data (km2); Z 2 , i represents the dry land area difference of two datasets (km2); j = 1 , 2 , 3 , 4 represent rice, vegetables, other crops, and wheat or maize, respectively.
When Z 1 < 0 , we combine the statistical data with grassland, woodland, and water areas, which have similar features to CLUDs, using the average subtraction and maximum value method; the calculation formula is as follows:
M a x = max ( W 0 , i , W A 0 , i )
G R 1 , i = G R 0 , i + ( Z 1 , i + Z 2 , i ) , Z 1 , i 0 or ( Z 1 , i + Z 2 , i ) + G R 0 , i 0 G R 0 , i + ( Z 1 , i + Z 2 , i ) G R 0 , i W 0 , i + W A 0 , i + G R 0 , i 100 % , others
W 1 , i = W 0 , i , G R 1 , i 0.9 × G R 0 , i 0 W 0 , i + ( Z 1 , i + Z 2 , i ) , ( Z 1 , i + Z 2 , i ) + G R 0 , i × 10 % < 0 and W 0 , i = M ax W 0 , i + ( Z 1 , i + Z 2 , i ) × W 0 , i W 0 , i + W A 0 , i + G R 0 , i 100 % , others
W A 1 , i = W A 0 , i , G R 1 , i 0.9 × G R 0 , i 0 W A 0 , i + ( Z 1 , i + Z 2 , i ) , ( Z 1 , i + Z 2 , i ) + G R 0 , i × 10 % < 0 and W A 0 , i = M ax W A 0 , i + ( Z 1 , i + Z 2 , i ) × W A 0 , i W 0 , i + W A 0 , i + G R 0 , i × 100 % , others
where G R 1 , i , W 1 , i , W A 1 , i represent the areas of grassland, woodland, and water after the integration of the unit, respectively (km2); G R 0 , i , W 0 , i , W A 0 , i represent the areas of grassland, woodland, and water before the integration of the i unit, respectively (km2).
Finally, the unit area verification of prefecture-level cities:
f l a g = 1 , C A R E A lucc sf ( i ) C A R E A lucc ( i ) > 0.0000001 0 , C A R E A lucc sf ( i ) C A R E A lucc ( i ) 0.0000001
where f l a g indicates the judgment condition.
C L u c c F i × 10 = [ X 1 , X 2 , X 3 , X 4 , D 1 , W 1 , G R 1 , W A 1 , I n 0 , O t 0 ]
where C L u c c F i × 10 represents the generated LUSF dataset at the prefecture-level city unit scale; X 1 , X 2 , X 3 , X 4 represent the areas of rice, vegetables, other crops, wheat, and maize, respectively; D 1 , W 1 , G R 1 , W A 1 represent the areas of dry land, forest land, grassland, and water after fusion, respectively; I n 0 , O t 0 represent the areas of the built-up land and the barely land from the LUCC dataset, respectively.
Figure 6 shows the proportion of different crop types in each calculation unit.

4.3. Scale Conversion

In this study, we introduced the water allocation and simulation (WAS) model to evaluate the runoff simulation accuracy improvement of the LUSF dataset. We constructed a natural water cycle model of the Yangtze River Basin to evaluate the spatiotemporal responses of runoff to land use types in LUSF datasets. The study area was divided into 225 calculation units, necessitating the conversion of the space division from an administrative unit to a hydrologic computing unit. Using the area coefficient obtained through the unit grid division, we weighted and reconstructed every land use type area of the LUSF dataset at the prefecture-level scale. This process generated a LUSF dataset at the basin scale, enabling dual-source data fusion with spatiotemporal spread. Utilizing the codes for the administrative divisions of the People’s Republic of China [52] as an index, the area ratio coefficient of the calculation unit is derived according to the grid division ratio of prefecture-level cities. The formula is as follows:
a i j = U a r e a i j C a r e a i j
a i j = a 11 a 12 a 1 j a 21 a 22 a 2 j a i 1 a i 2 a i j
where i represents the serial number of the calculation unit, j represents different land use types; a i j represents the different land use area ratio coefficients of prefecture-level cities and calculation units based on the CLUDs; U a r e a i j represents the area of land use type j in the i calculation unit; C a r e a i j represents the area of land use type j in the prefecture-level city unit. We allocate LUSF data at the administrative unit into each basic calculation unit to generate the LUSF dataset for the watershed hydrological model simulation. The formula is as follows:
U L u c c F i × 10 = [ X 1 α 1 , X 2 α 1 , X 3 α 1 , X 4 α 2 , D 1 α 2 , W 1 α 3 , G R 1 α 4 , W A 1 α 5 , I n 0 α 6 , O t 0 α 7 ]

4.4. Model Introduction

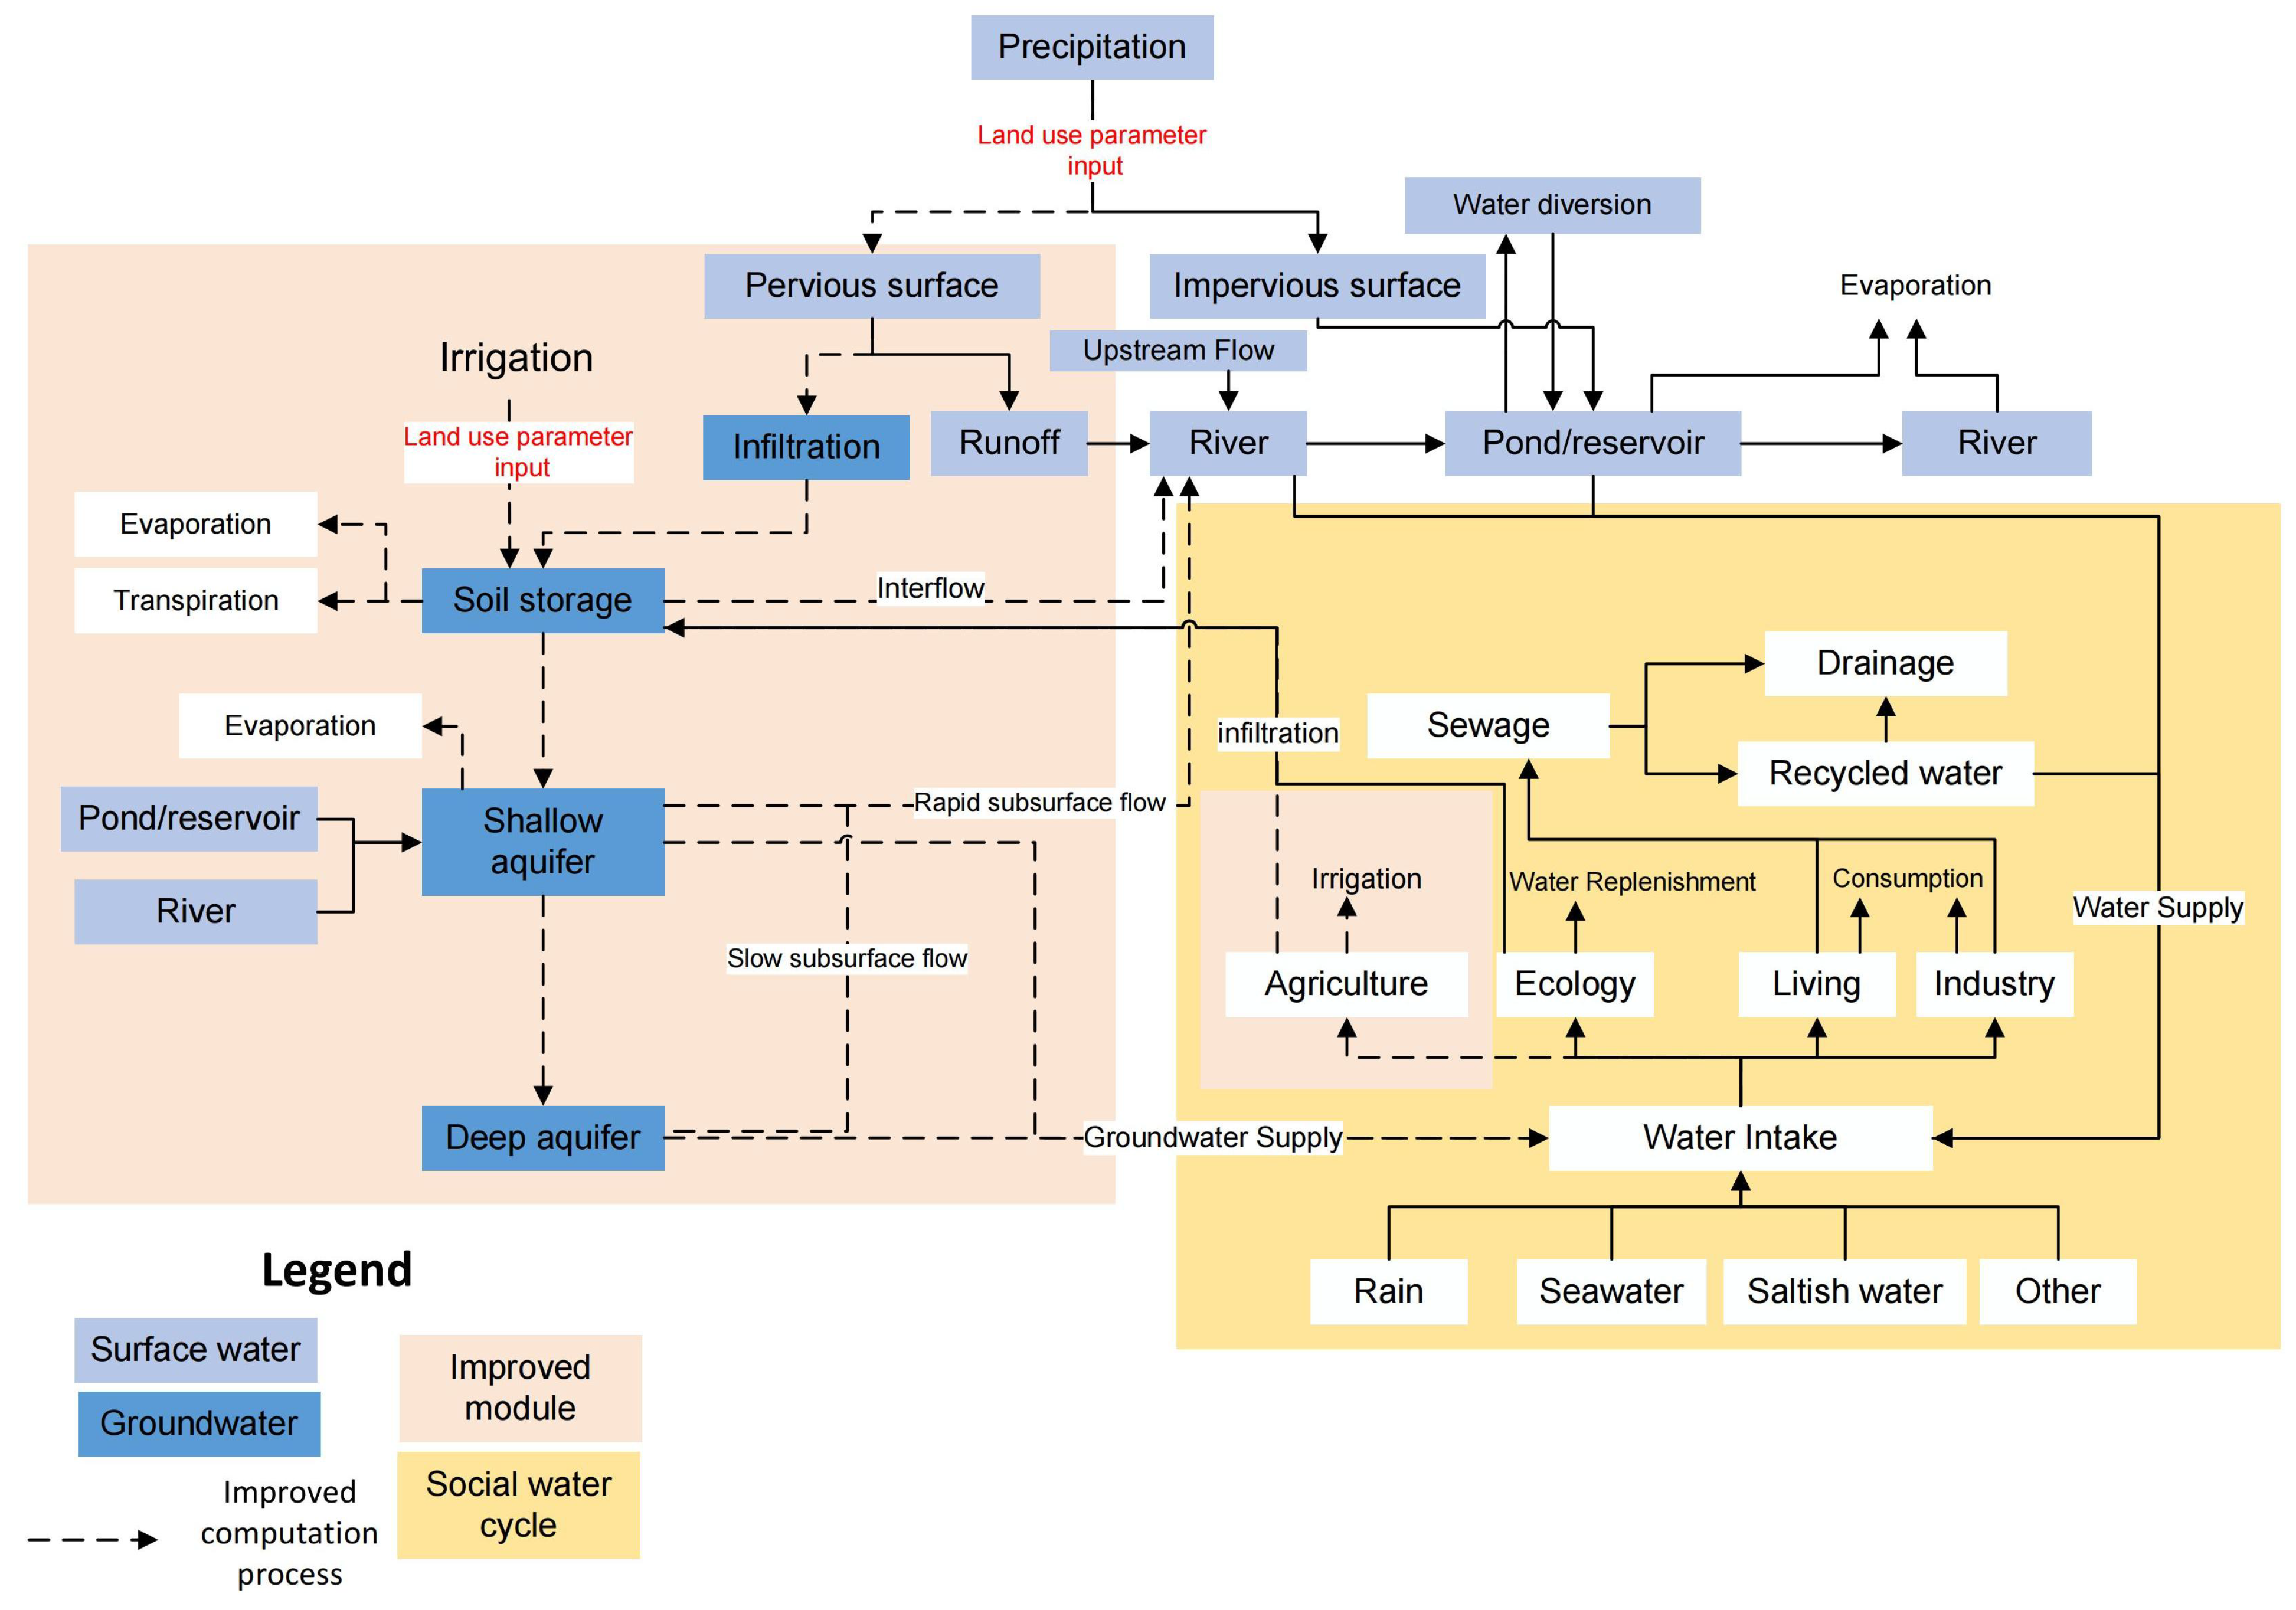
Given the intricate water network of the Yangtze River Basin, this study employs the WAS model to construct a water cycle model for the basin. This is done to validate the applicability and value of the proposed LUSF method. The WAS model can dually simulate natural–artificial water cycles; it consists of two inter-operative computational modules: SWAT and the artificial water-optimized allocation module (AWOM) [53,54,55]. The WAS model has added an irrigation function that can locate more water sources for irrigation water within the same time frame, meeting the computational requirements of the study at hand (Figure 7).

4.5. Evaluation Metrics

There are two metrics applied to evaluate the performance of the correlation coefficient (R, Equation (13)) and the Nash–Sutcliffe efficiency (NSE, Equation (14)). The correlation coefficient measurement range is between −1 and 1, and the Nash–Sutcliffe efficiency measurement range is between and 1. As R and NSE values approach 1, this suggests an enhancement in the model’s simulation effectiveness. There are three indicators used to assess the proposed method: the mean absolute percentage error (MAPE, Equation (15)), root mean square error (RMSE, Equation (16)), and the runoff simulation error reduction ( δ 3 , Equation (16)). The measurement range for MAPE is from 0% to , while for RMSE, it is from 0 to . In general, lower values of MAPE and RMSE indicate smaller errors between simulated and observed values. The calculation process is as follows:
R = n Q i q i Q i q i n Q i 2 ( Q i ) 2 n q i 2 ( q i ) 2
N S E = 1 i = 1 n ( Q i q i ) 2 i = 1 n ( q i q ¯ ) 2
M A P E = 100 n i = 1 n q i Q i Q i
R M S E = 1 n × i = 1 n ( q i Q i ) 2
where n is a series of samples, Q i is the measured value, and q i is the simulated value; q ¯ is the average value of the measured value. R ranges from
δ 1 = f ( x 1 ) f ( y ) f ( y )
δ 2 = f ( x 2 ) f ( y ) f ( y )
δ 3 = δ 1 δ 2
where f ( y ) represents the measured runoff series, f ( x 1 ) is the simulated runoff series based on the LUSF data, f ( x 2 ) is the simulated runoff series based on CLUDs, δ 1 represents the relative error of the runoff simulation under LUSF data, δ 2 represents the relative error of the runoff simulation under CLUD data, and δ 3 represents the runoff simulation error reduction.
We use the runoff coefficient and the dynamic attitude of land use and land cover (LULC) to evaluate the runoff response under land use change. The calculation process is as follows:
K = U b U a U a × 1 t × 100 %
α = P R
where K represents the dynamic attitude of a single land use type in the study area during the study period t, U a , U b represent the land use type areas at the beginning and the end of the study period, respectively. α represents the runoff coefficient, P represents the precipitation depth, mm. R represents the runoff depth, mm.

5. Results

5.1. Correlational Analyses

We conducted a correlation analysis on a sample of 4832 data points. In the realm of statistical indicators, the semantic interpretation of CLUDs’ land use types aligns with the prevailing national standard for assessing current land use status. This alignment serves as the rationale behind our selection of this dataset. The findings reveal a substantial correlation between the statistical data of the rice planting area and the paddy field area extracted from CLUD maps, with a correlation coefficient of 0.81. Additionally, the correlation coefficients for dryland area versus irrigated dryland area and the total cultivated land area between the two datasets are 0.77 and 0.78, respectively (Figure 8). These outcomes signify a high level of agreement in the dual-source data, further affirming the classification rationality within our study.

5.2. Result of Runoff Simulation

We set the model calibration period as 1982–1991, and the validation period as 1992–2000. While using the LUSF dataset as model land use data input, the calibration results show that the value of R is 0.927 (in the calibration period) and 0.856 (in the validation period); the values of NSE are 0.921 (in the calibration period) and 0.829 (in the validation period), indicating a great consistency between the observed runoff process and the simulated runoff process.
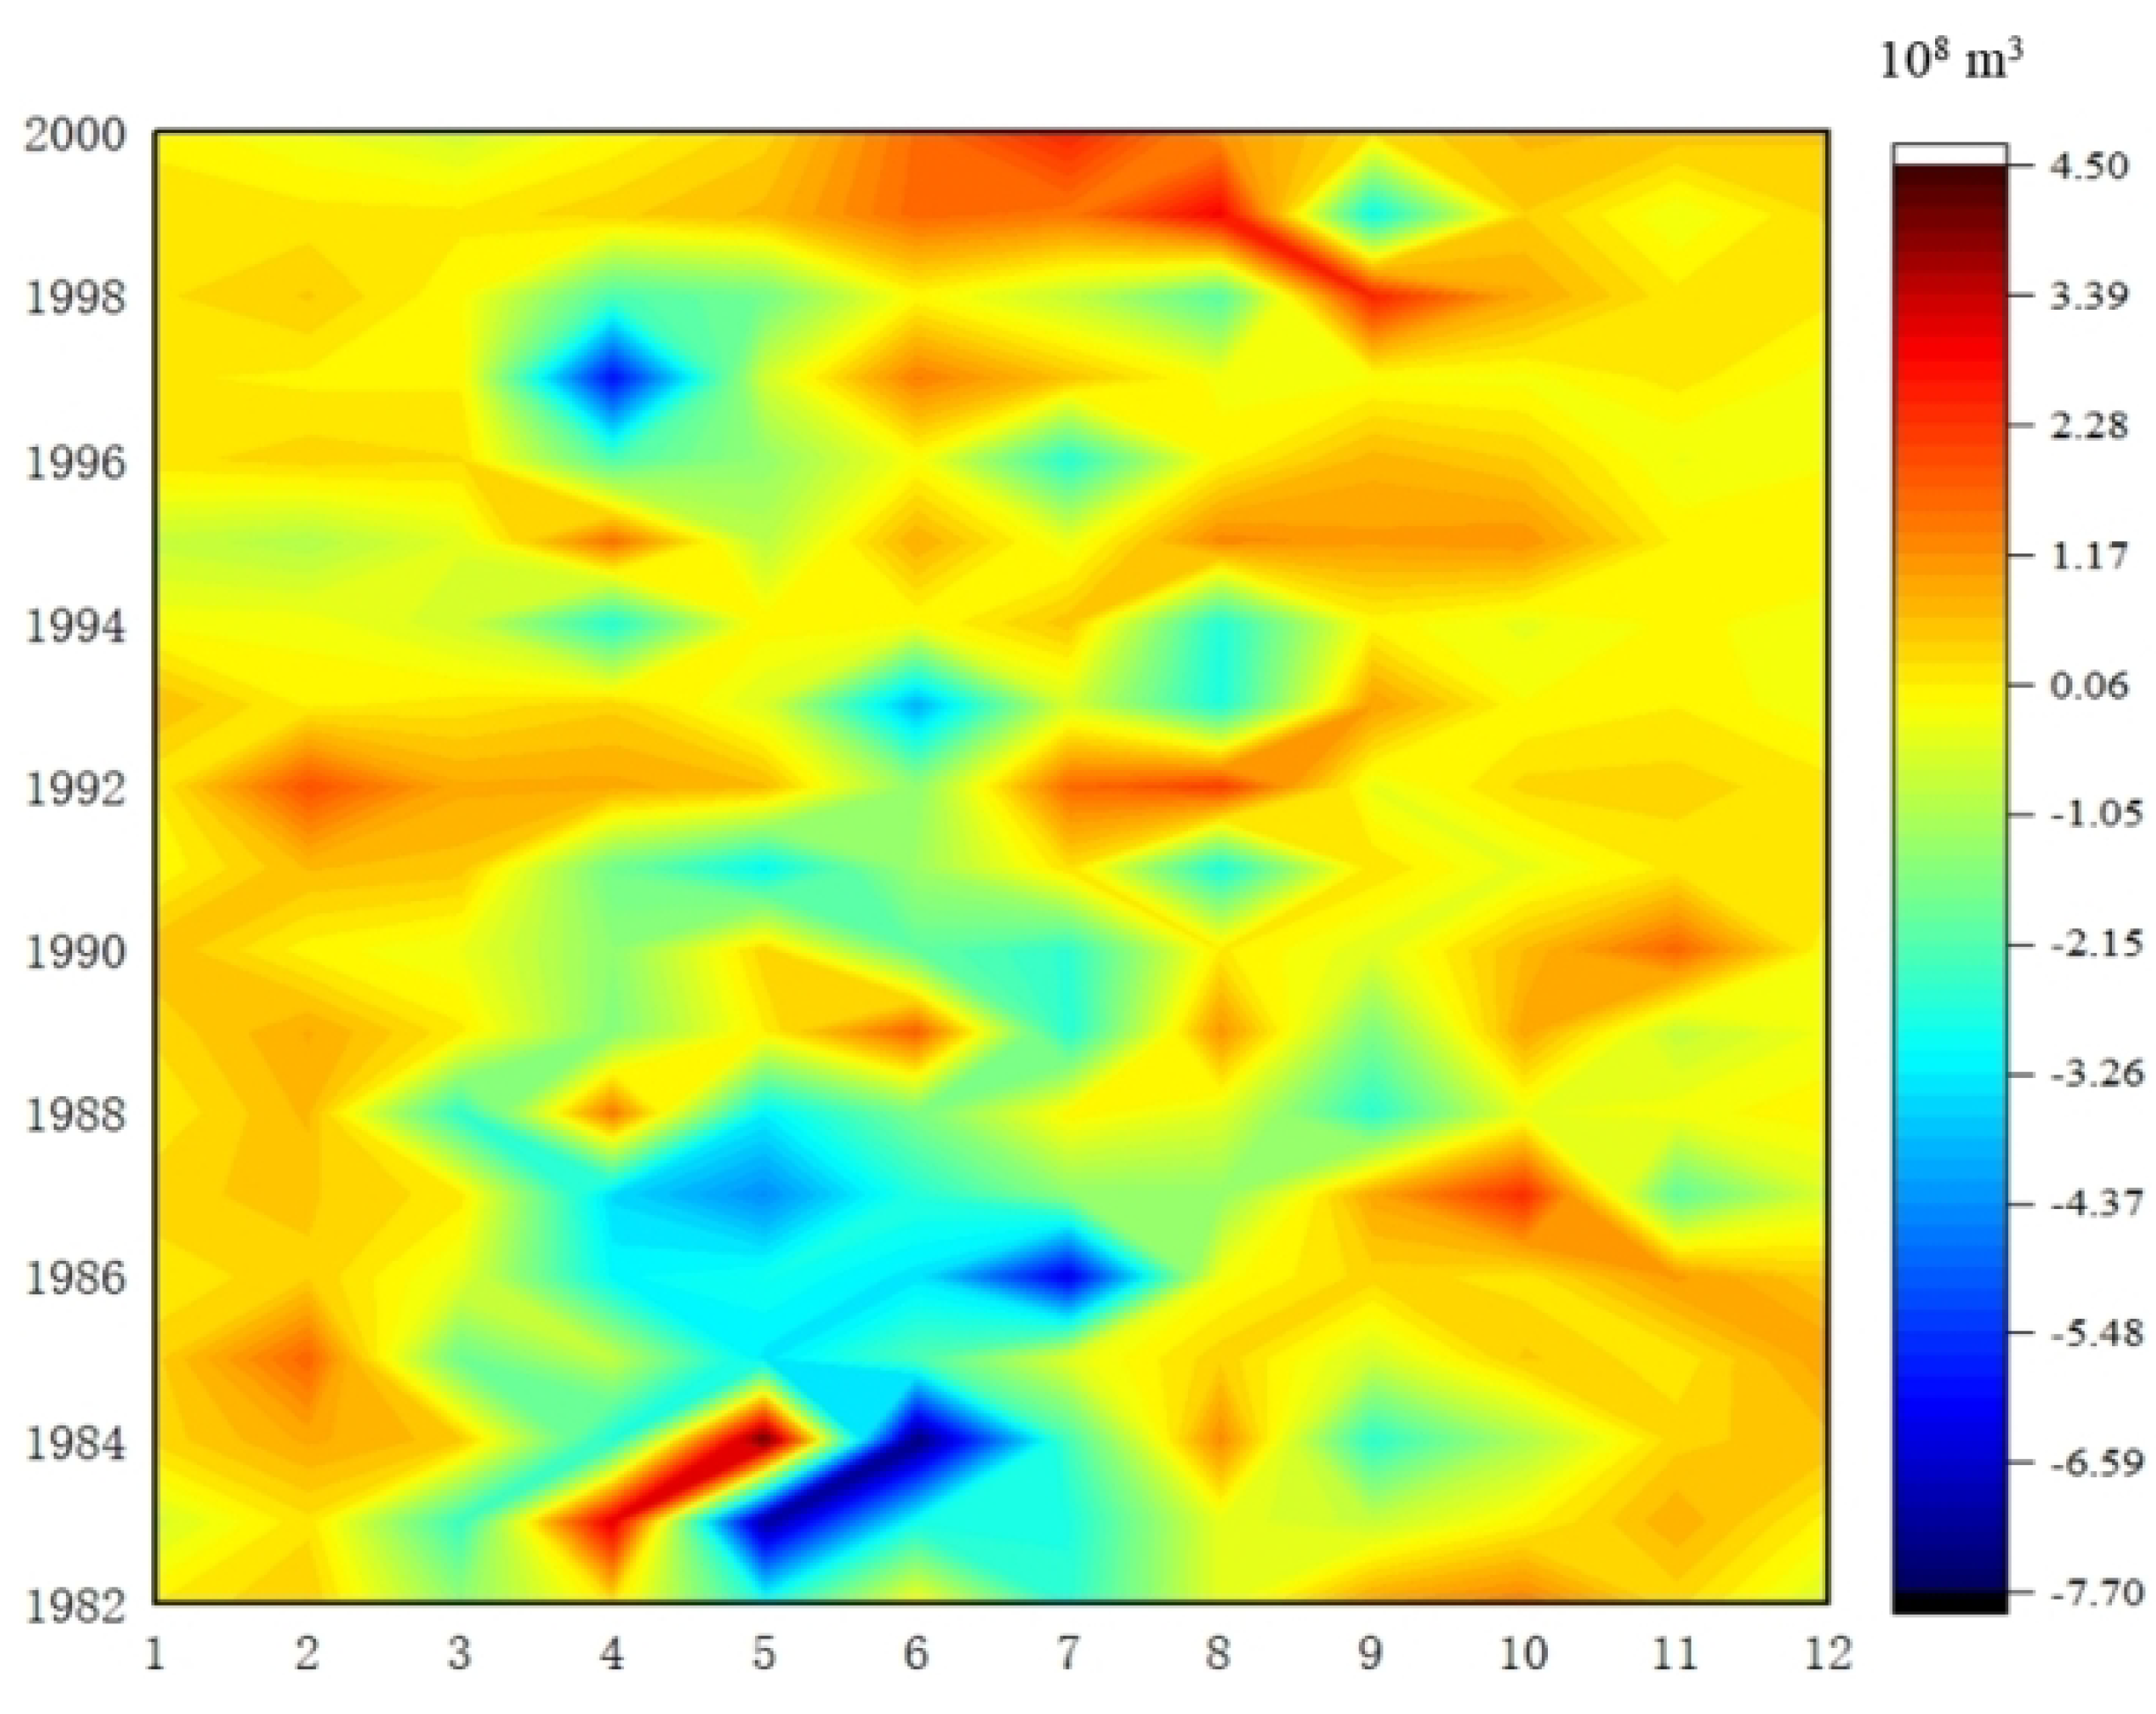
We compare the runoff simulation errors between the original datasets extracted from CLUDs and those from LUSF to further evaluate the effect of LUSF data on improving runoff simulation accuracy. According to the research, the absolute error of the simulated runoff at 17 hydrological stations is reduced by 433 million m3 annually (Figure 9), and the absolute error of the monthly runoff simulation is reduced by 36 million m3.
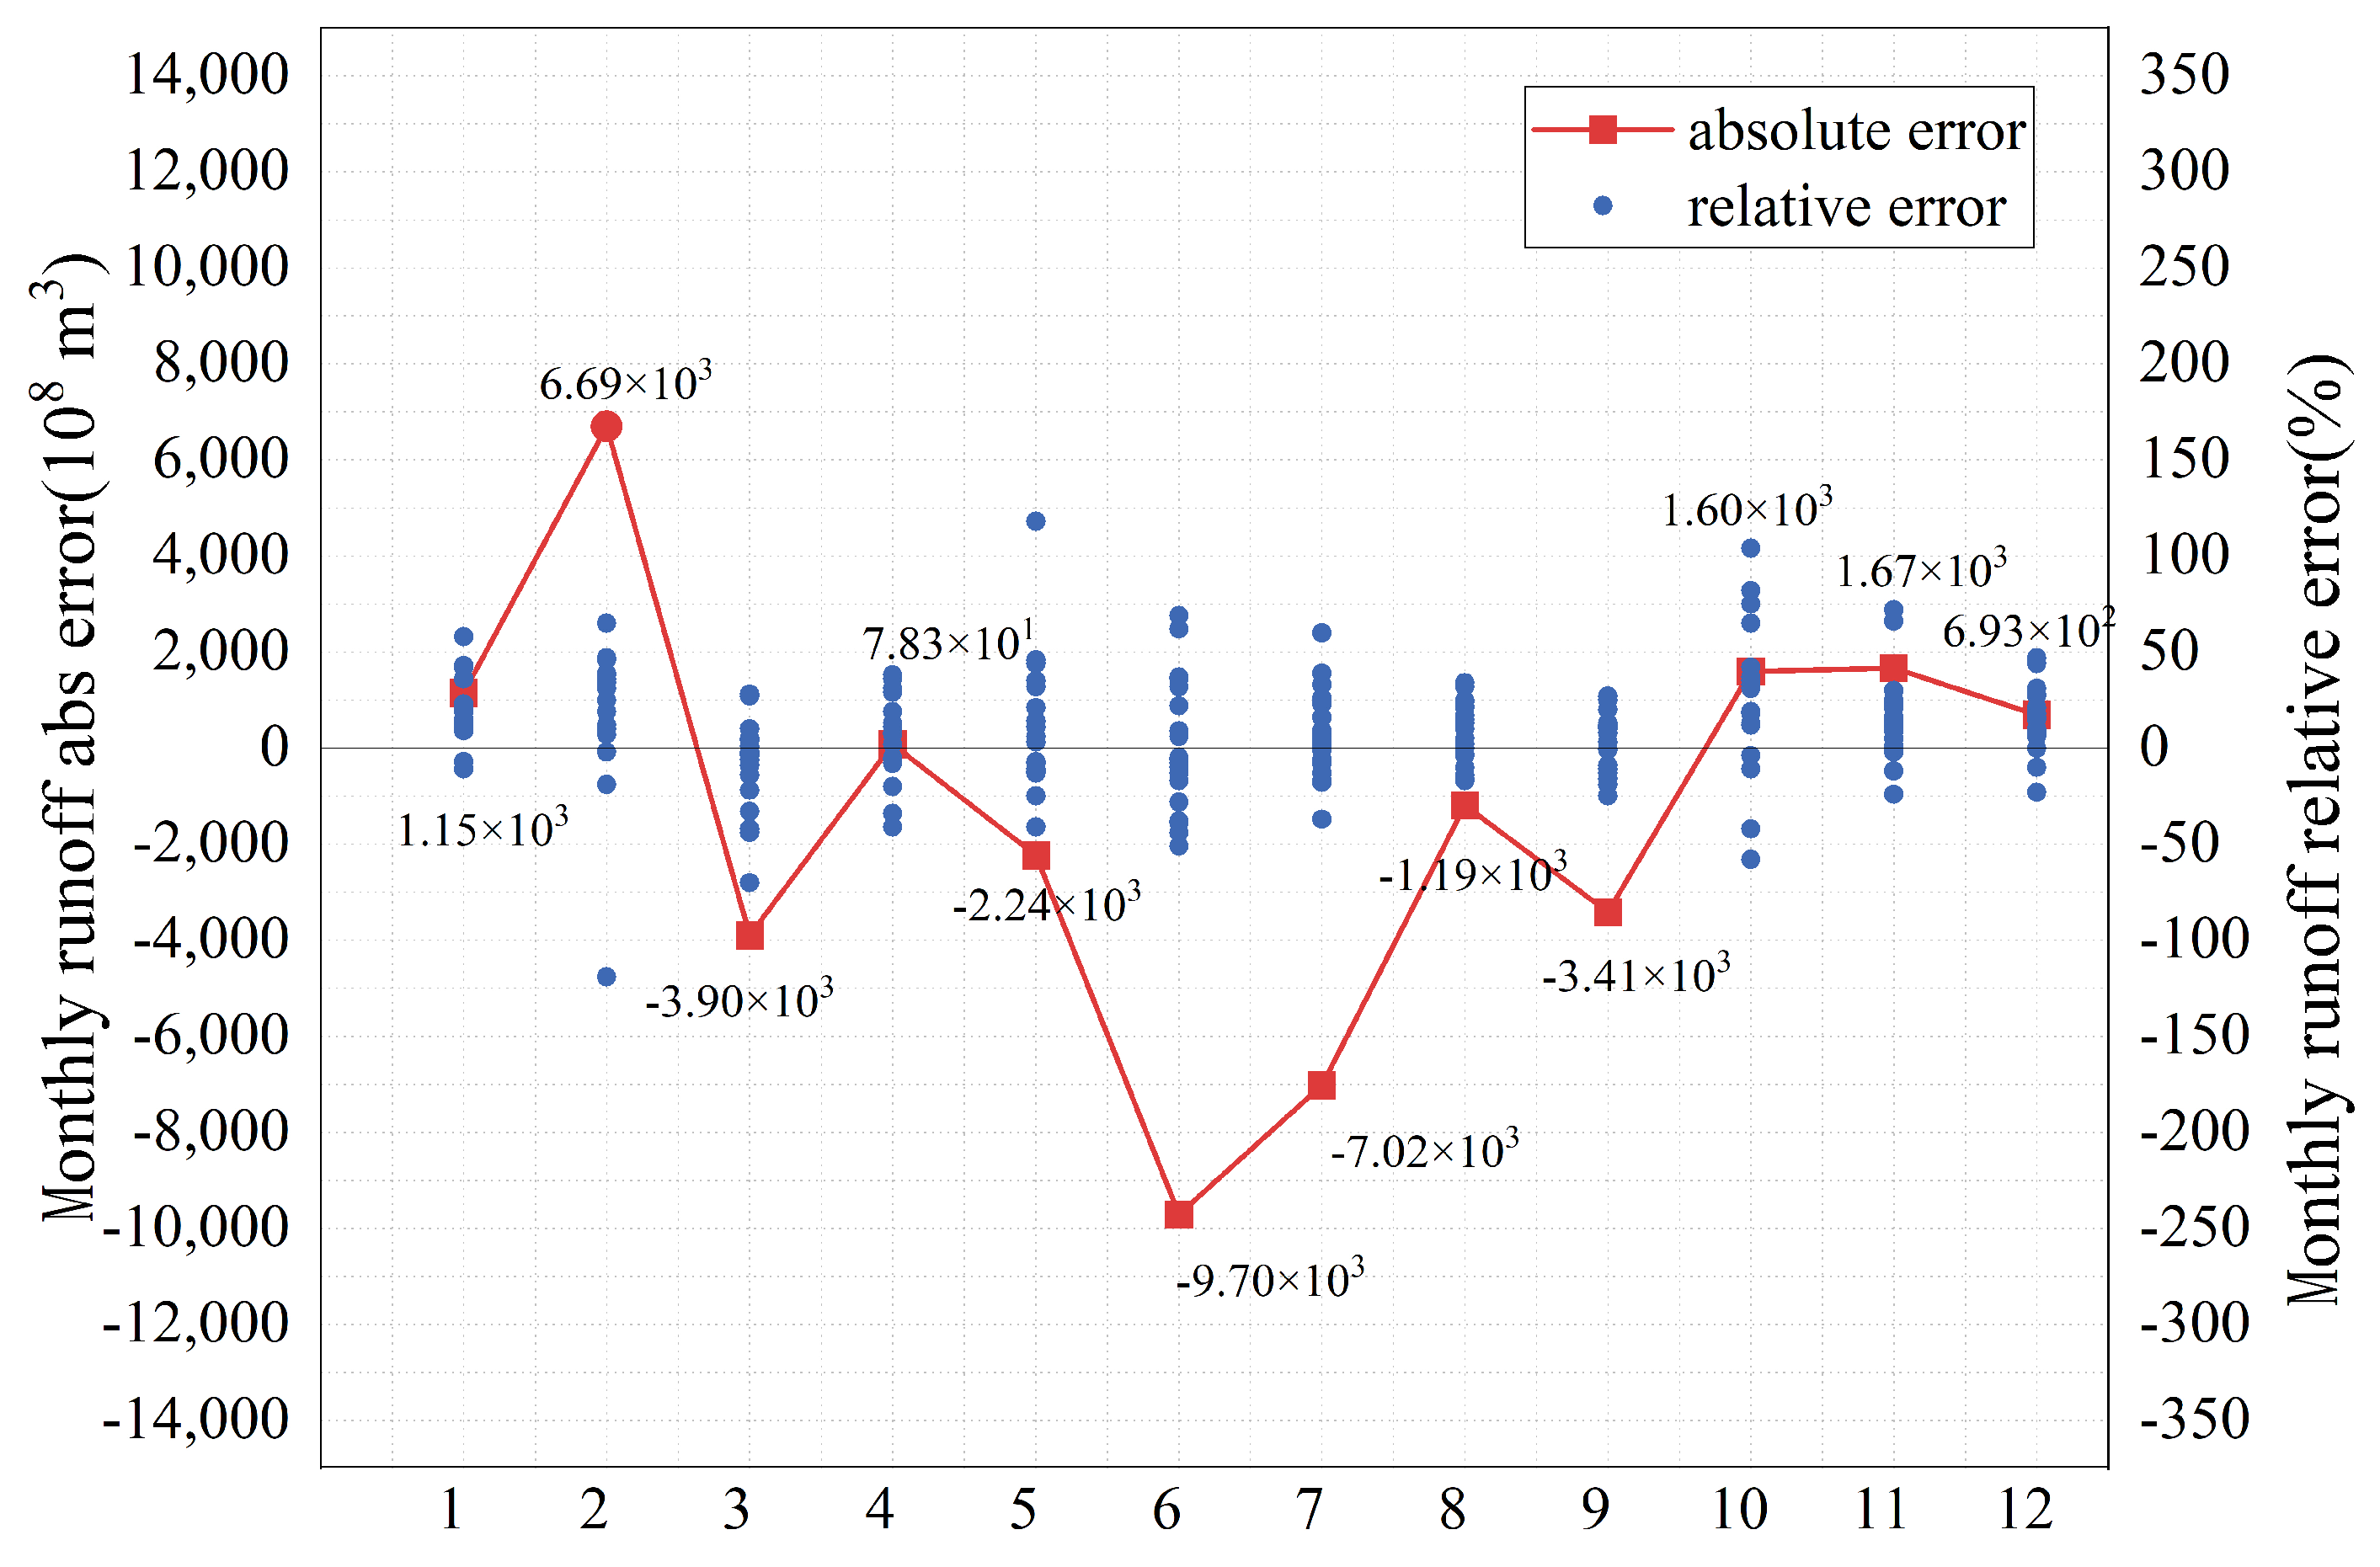
Moreover, the results also show that a lower runoff simulation error occurs from March to September compared to other months, with the absolute error by an average of 70 million m3 (Figure 10).

5.3. Simulation Effects of Hydrological Sections

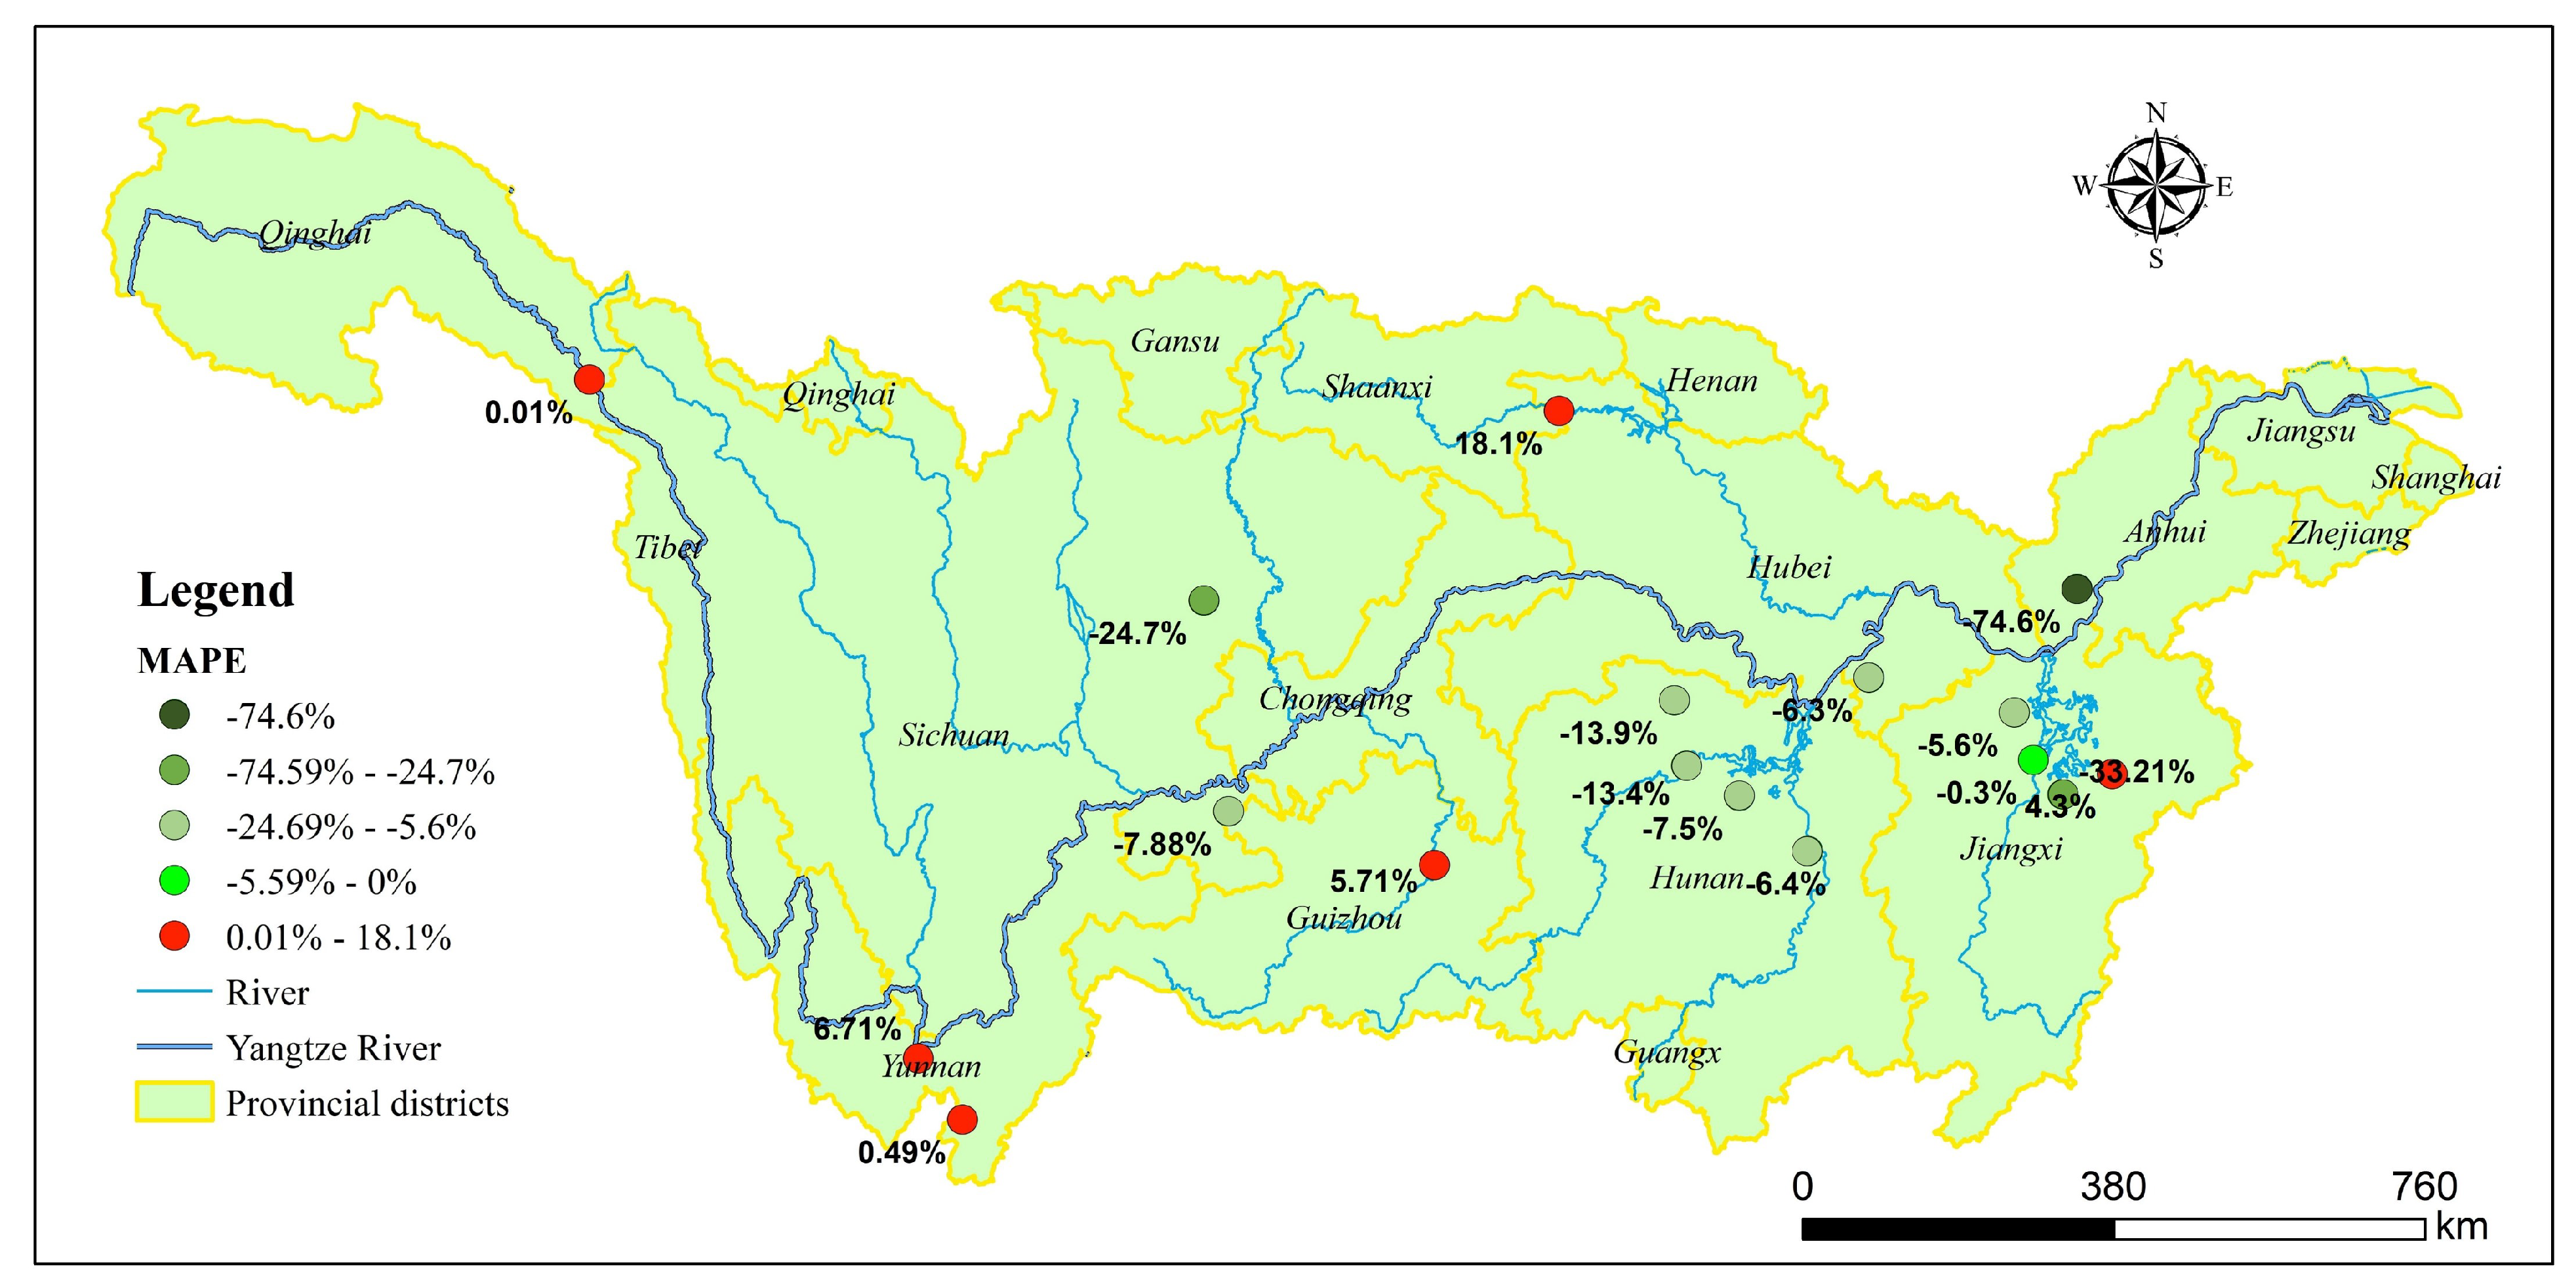
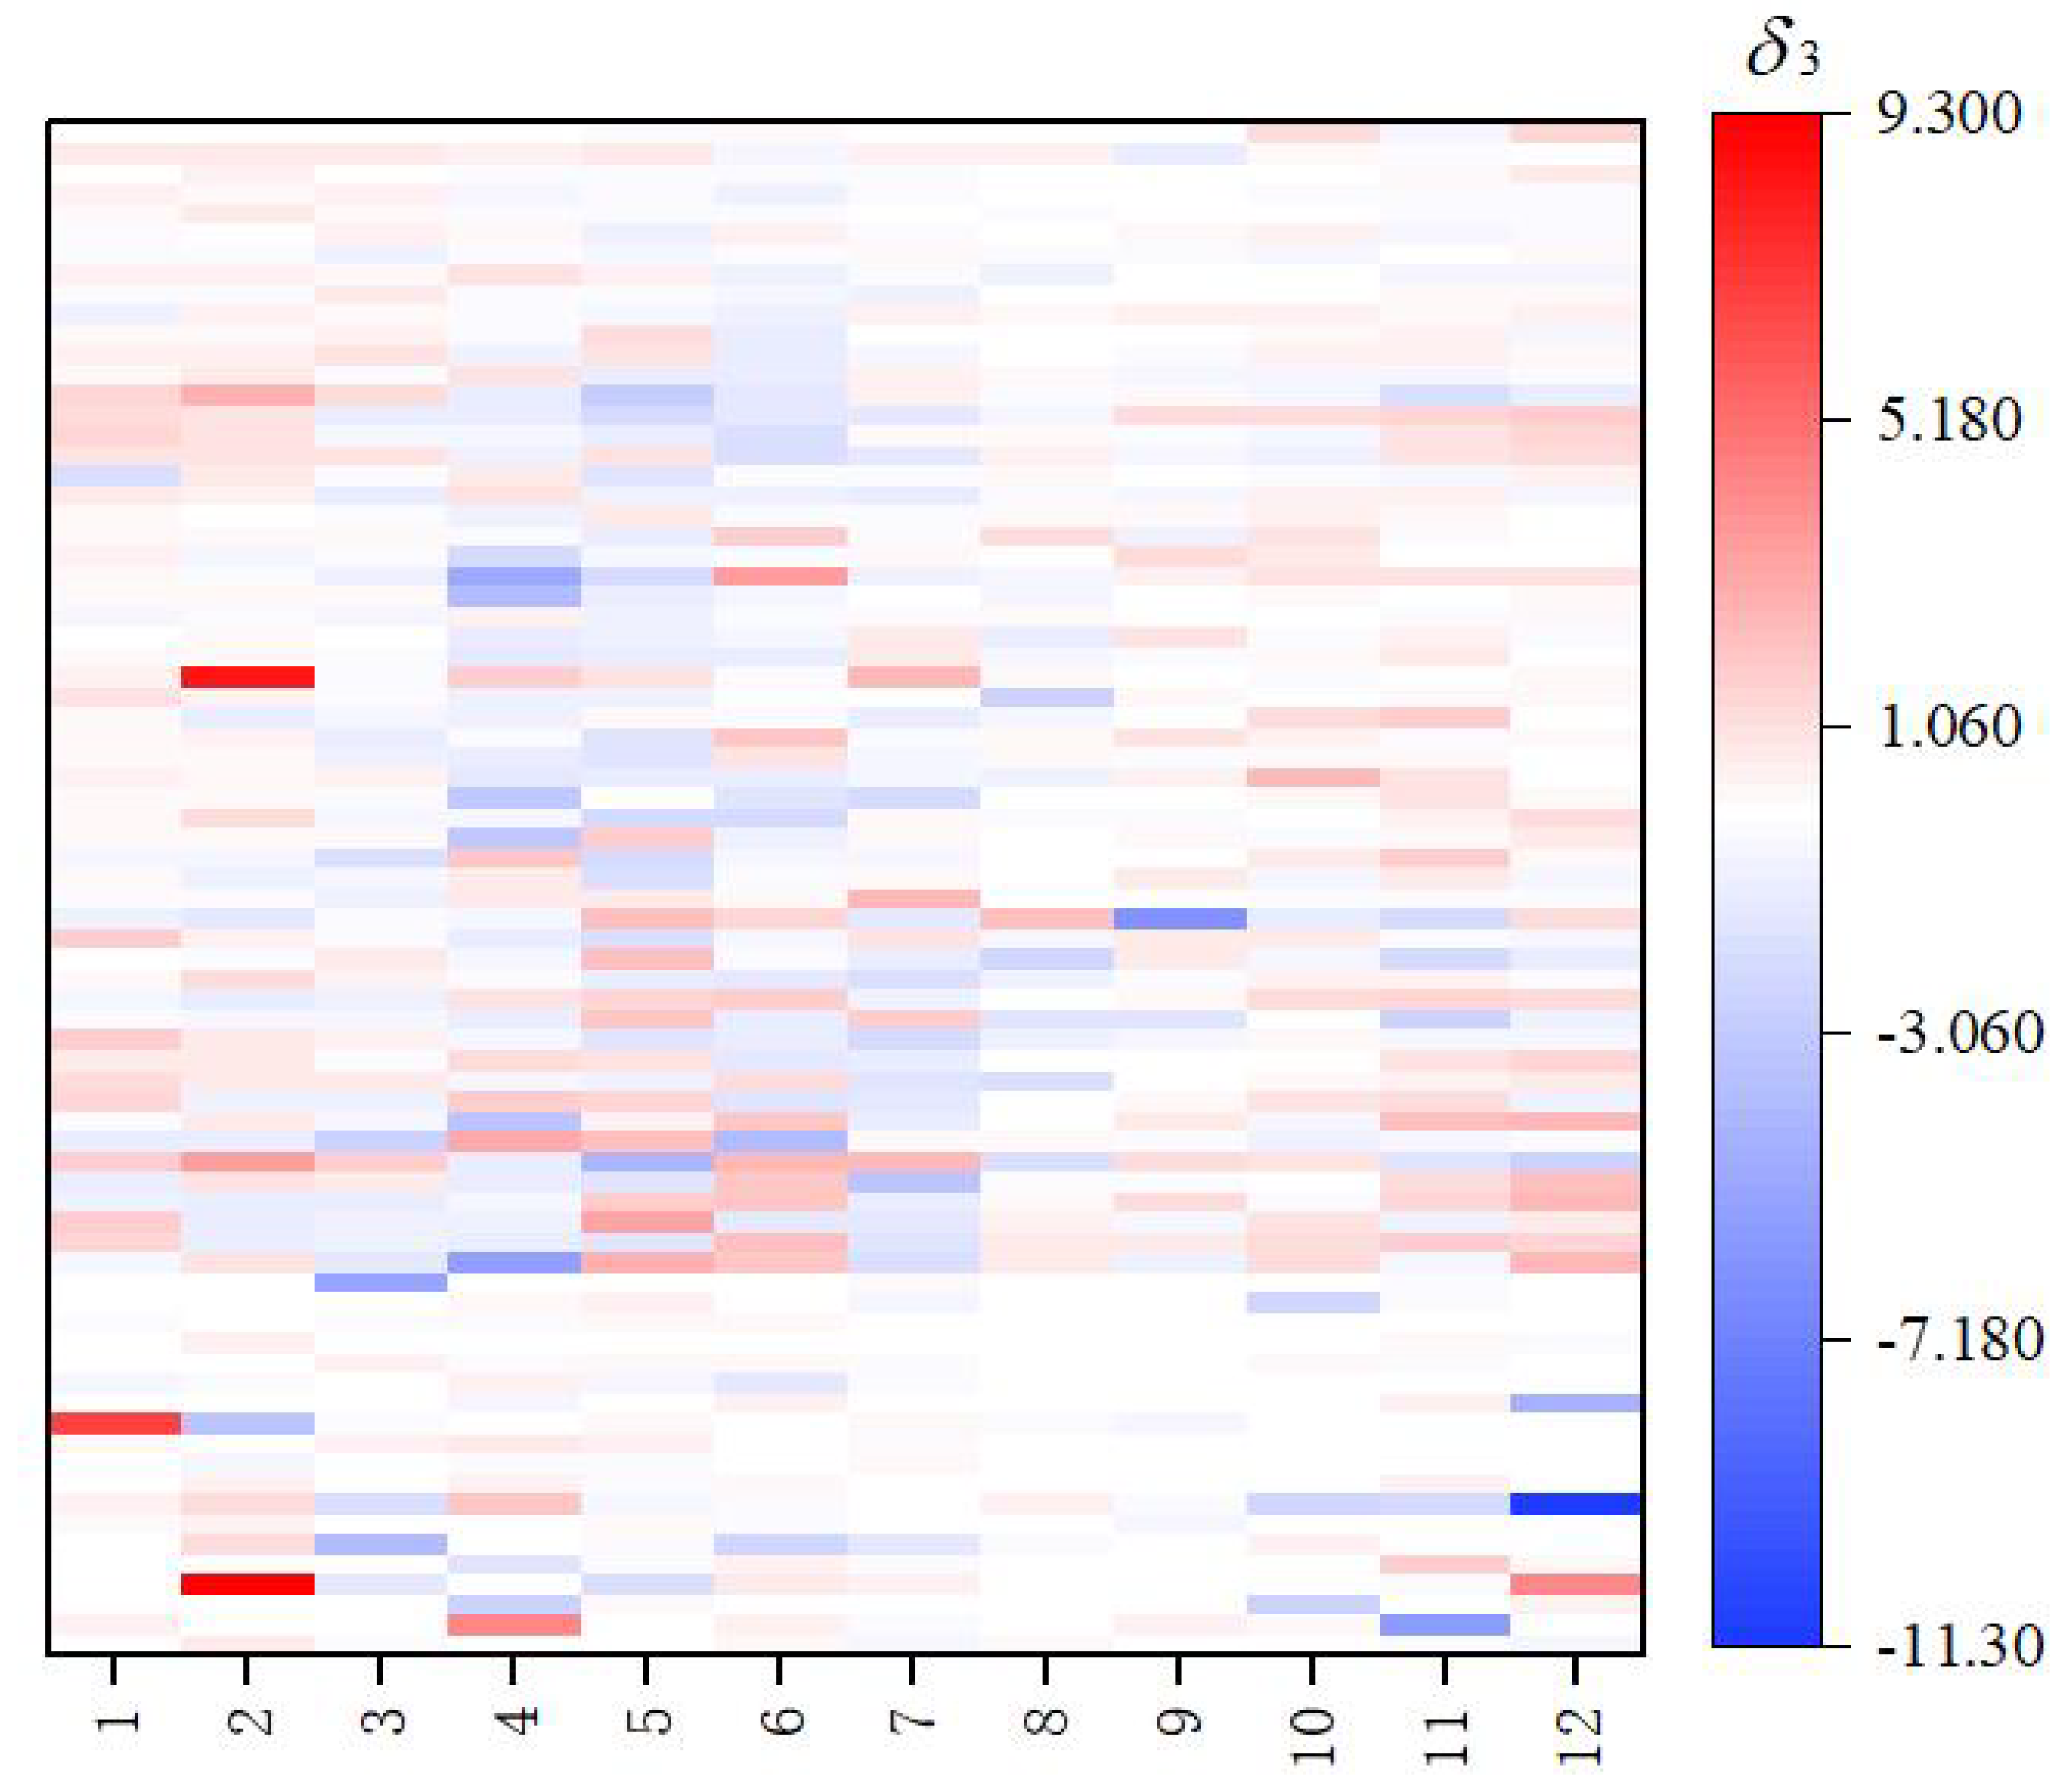
From the perspective of the annual runoff simulation improvement, the MAPE value of the monthly average simulated runoff for the 14 sections under the LUSF dataset decreased by 0% to 0.74%, and the RMSE value decreased by 0 to 22 million m3. The simulation effect of the LUSF dataset, which refines CLUDs, is better. Furthermore, results also demonstrate that the reduction in the MAPE value is more significant in large grain provinces with complete administrative boundaries (Jiangxi Province, Hunan Province, Sichuan Province), and the decrease in error in these regions is larger than that of other provincial administrative regions, about 7% (Figure 11). Using the LUSF dataset, the relative error reduction in monthly runoff simulation is generally observed during the crop planting and growth water demand months (March to September) (Figure 12).

5.4. Coefficient Optimization Analysis

We conducted a study on the simulated runoff improvement under constant meteorological conditions. To do this, we utilized the canopy interception coefficient based on both LUSF and CLUDs, analyzing the improvement of the corrected canopy interception coefficient. We studied the runoff simulation of the refined cropland area in the LUSF dataset. The scene settings are as follows (Table 3).
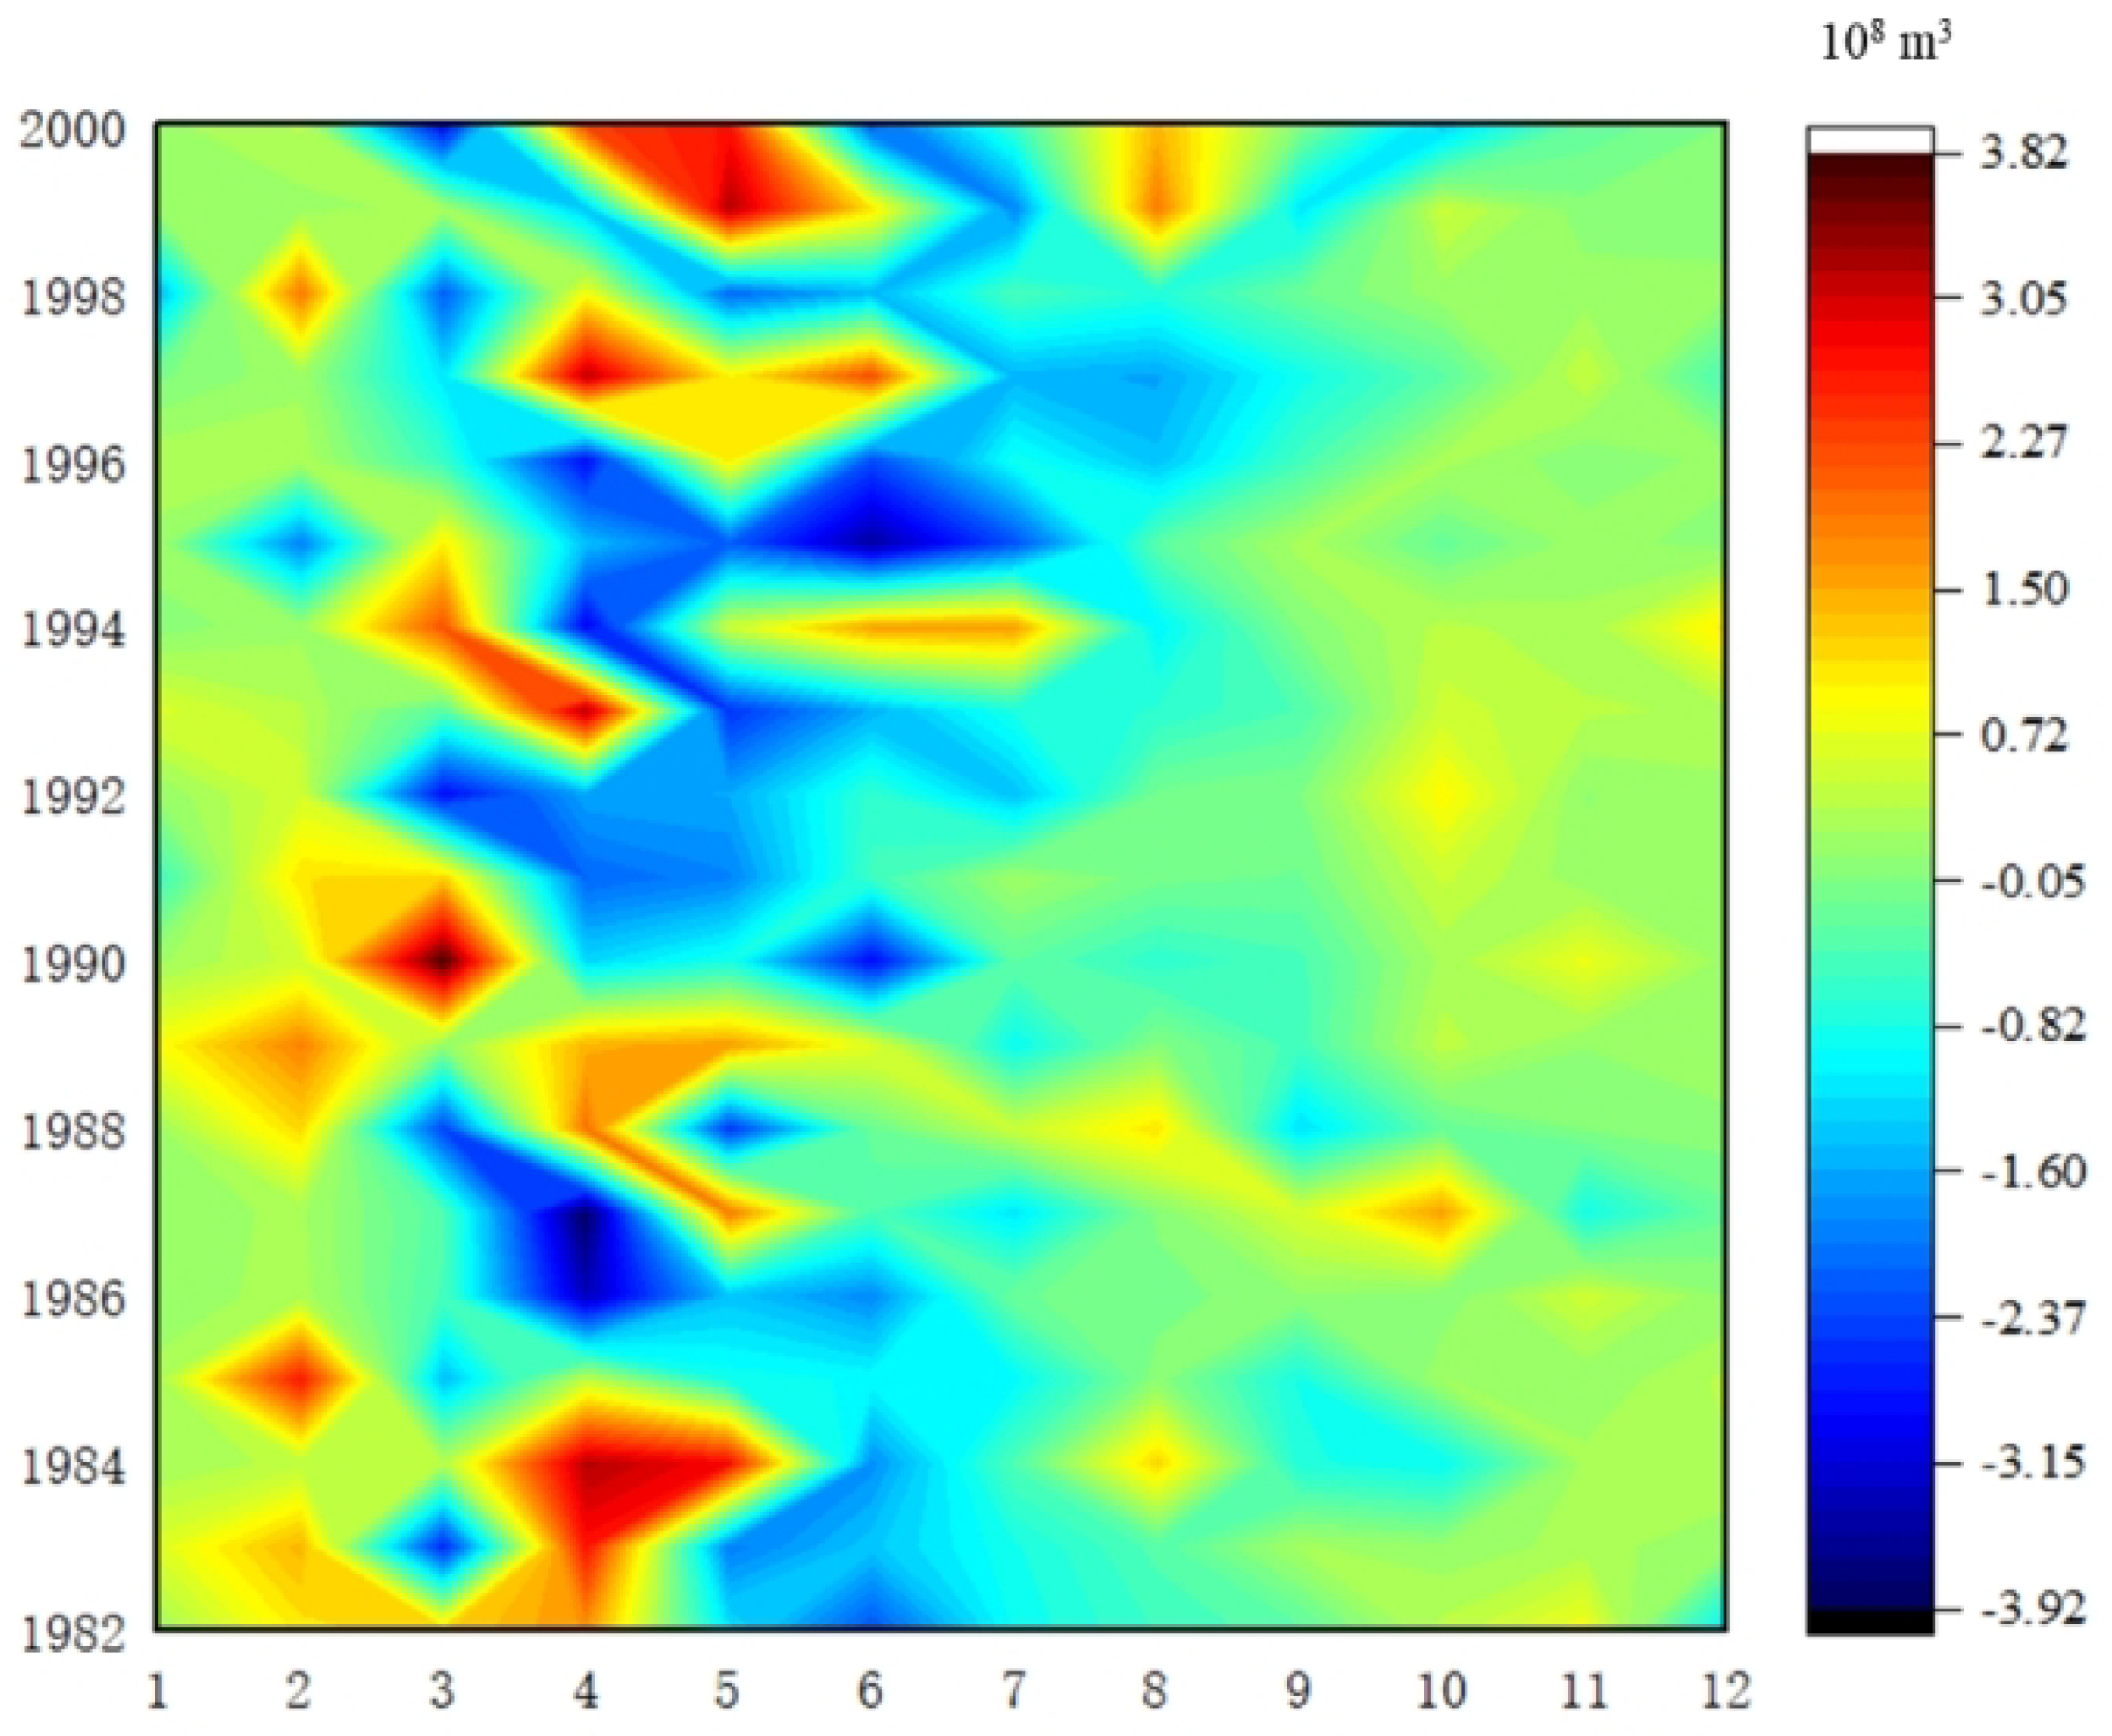
From the results shown in Figure 13, it is evident that the corrected canopy interception coefficient under the LUSF dataset reduces the runoff simulation error of 2.96 billion m3, with an average monthly decrease of 13 million m3. Among them, the simulation error of the runoff process from March to September decreased by 274 million m3 (Figure 14).

5.5. Spatiotemporal Land Use Change in Yangtze River Basin

Based on the simulation results of the hydrological model, we calculated the regional runoff coefficient and the dynamic attitude of land use type to describe the runoff response under land use spatiotemporal change in the Yangtze River Basin. The regional runoff coefficient is a measure used to evaluate the variation of regional runoff. The analysis conducted reveals that in the year 2015, the Mintuo River had the highest runoff coefficient, followed by the Poyang Lake system. On the other hand, the Qingjiang River Basin exhibited the smallest runoff coefficient of only 0.08. The runoff coefficients of the Yalong River and Mintuo River systems have not varied significantly from 1980 to 2019. However, the runoff coefficient of the Dongting Lake system has decreased from 0.557 to 0.545 over the past 40 years, which suggests that the amount of water flowing into this basin has reduced.
Regarding the land use type dynamic attitude, there has been minimal variation in the area of cultivated and forest land in the Yalong River and Mintuo River Basins, with an increase or decrease of approximately 1%, which means that the underlying surface disturbance is weak. The planting areas of rice and vegetables increased the most in the Dongting Lake Basin; the built-up area increased by 1%, and the water area decreased by 0.06%. The wheat and corn planting areas increased the most in the Hanjiang River Basin (Table 4).

6. Discussion

6.1. The Contribution of the LUSF Method

In this study, we assume that statistics represent actual observations, and through extensive data collection, a dataset of four major crops for 97 prefecture-level cities was constructed. Firstly, we analyzed the relationship between statistical yearbook indicators and the classification system of CLUDs, finding a high degree of consistency between paddy land and rice planting area, as well as the total cropland area in both datasets. Secondly, we set a threshold for iterative elimination of area differences and proposed a dual-source dataset fusion algorithm. Finally, we realized the application of the new dataset using scale transformation. This approach includes two optimization levels: on the one hand, the integrated land use dataset includes four irrigated crop planting areas, facilitating spatial refinement and achieving a finer resolution in terms of water amounts over time. It yielded an increase in the accuracy of the hydrological model simulation by further refining the evapotranspiration and infiltration in the irrigation area. On the other hand, the integrated method proposed has been practically applied in hydrological models, demonstrating practical value. The merged dataset includes four major crops (rice, wheat, maize, and vegetables) and six categories of land use area data (cultivated land, forest land, grassland, water area, urban land, and total unused land). This dataset is more suitable for analyzing hydrological effects under modern land cover changes, aiding hydrologists in quantifying runoff response patterns under different land use types. Furthermore, the data maintains high consistency with ground-level statistical data, providing researchers with technical and database support for the sustainable development of ecological environments and water resources.

6.2. Characteristics of the Main Crop-Planting Area in the Yangtze River Basin

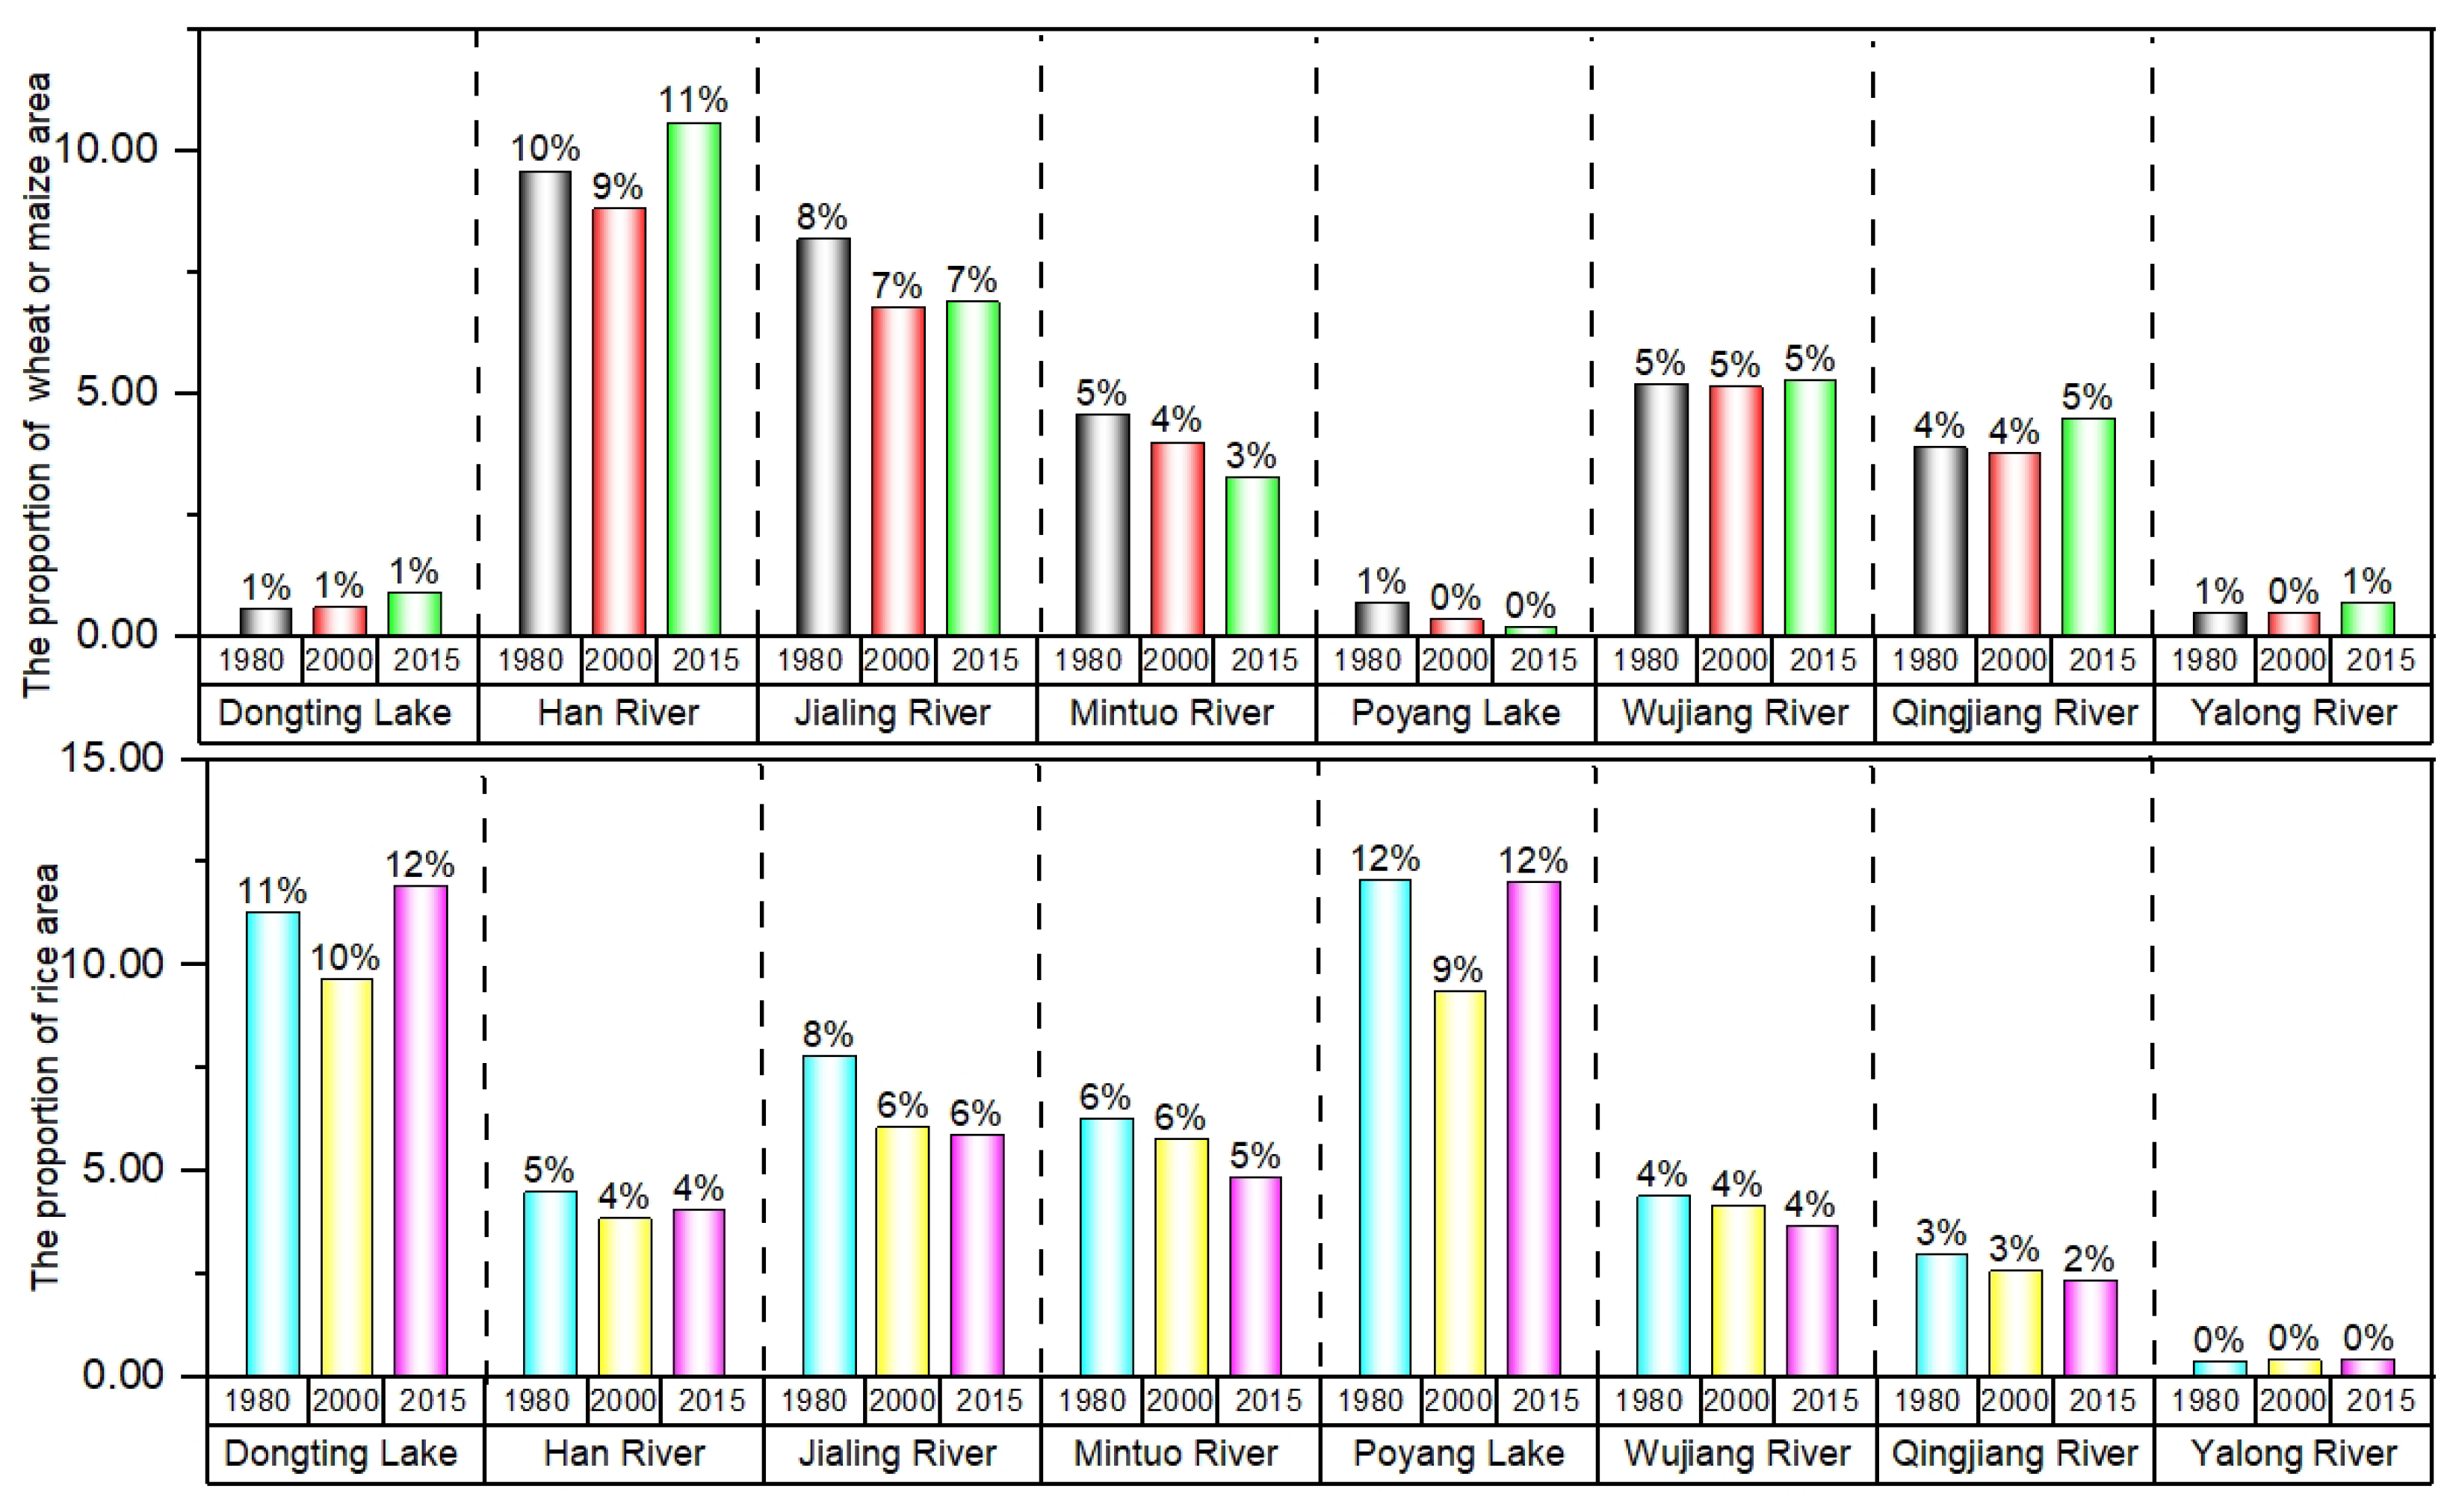
Human activities directly or indirectly affect the Earth’s surface system, with land use and cover change being the most intuitive manifestation of human land transformation. We selected the Yangtze River Basin, which has the widest drainage area in China, as our study area. This study found that under the rapid urbanization trend in contemporary society, the area of construction land in each sub-basin is showing a growing trend. Among them, Poyang Lake and Dongting Lake have the highest growth rates, followed by the Han River and Wu River. The Han River, as China’s main grain-producing region, has the most significant proportion of wheat and corn cultivation area, averaging 9.6% of the basin area over the past four decades and still showing an increasing trend. At the same time, its rice planting area is not low, with an average of 4.3%, second only to the Jialing River and Mintuo River. In the Dongting Lake and Poyang Lake Basins located south of the Yangtze River, with abundant water resources, the proportion of rice cultivation area is the most significant, averaging around 11% of the basin area. The Yalong River is located in the upper reaches of the Yangtze River. The main landform features within the basin are mostly hilly plateau areas with complex terrain. Due to climatic conditions and topographic restrictions, the proportion of rice and wheat (maize) planting area in the basin is lower than that of the other seven major river systems. China’s grain production—affected by grain policies and market prices—reached its lowest point around 1990 and continued to decrease from 2000 to 2004, which explains the declining fluctuations in grain sown area in our study (Figure 15).

6.3. Uncertainties and Improvement

This study provides a new dual-source dataset fusion algorithm and analyzes the interaction between runoff change and land use area change in the Yangtze River Basin in the last 40 years. The proposed LUSF algorithm guarantees a high degree of consistency with the statistical data but also depends on its accuracy. At the same time, this method is based on the manual experience extraction of a large sample of data; it only includes the data of four relatively major crops.
The original data are available for free on the official website (https://www.resdc.cn/ accessed on 9 November 2023) and local government websites (e.g., http://www.hunan.gov.cn/zfsj/tjnj/tygl.html accessed on 9 November 2023 for Hunan province), making this method more practical and versatile. The verification experiment of agricultural irrigation water quantity will be further added in the later stage. Previous studies have shown that the cultivated land area has a positive effect on runoff production under a constant climate, while the irrigated area has a negative effect; the refined LUSF dataset could help us with further research.

7. Conclusions

Improving the spatial accuracy of land use data in hydrological models could enhance the effect of runoff simulation effectively. In this study, we propose a dual-source dataset fusion algorithm called the LUCC statistical data fusion algorithm (LUSF), which is based on human brain experience and big data learning and training. It integrates crop ground survey statistical data and CLUD data extracted from remote sensing to better adapt to changes in the underlying surface under artificial transformation. The water distribution during the water cycle simulation process is further refined from the spatial scale and time scale. Compared to other data fusion methods, the new proposed LUSF method is more convenient, efficient, and has practical applications. Moreover, We quantitatively analyzed the underlying land use characteristics of the eight main tributaries in the Yangtze River Basin, assessed the hydrological effects under land use and land cover change (LUCC), and conducted a preliminary attribution analysis on them, incorporating the new integrated dataset.
The results indicate that the new fusion method is particularly well-suited for areas with high human disturbances. It effectively reduces runoff simulation errors in the semi-distributed hydrological model, especially during the months of irrigation crop planting within the year (March to September). The average runoff simulation error can be reduced by 70 million m3, and the RMSE value can decrease by 22 million m3. Additionally, in terms of the correction of hydrological model parameters, the LUSF method also demonstrates some optimization effects.
The alteration of the underlying surface in the Yangtze River Basin, which serves as the primary grain-producing region in China, is significantly influenced by human modifications. From 1980 to 2019, major primary tributaries within the Yangtze River Basin have all experienced a decline in runoff. The regions with a relatively large proportion of irrigated grain crops (Han River, Dongting Lake, and Poyang Lake Basins) also exhibit a more pronounced decrease in runoff. For nearly 40 years, the planting area of grain crops in the Yangtze River Basin exhibited a growing trend, with a fluctuating decline around the year 2000. In the northern region of the Yangtze River, the crop planting area in the Han River Basin is relatively large, with wheat (corn) accounting for nearly 10% of the basin area. In the southern region of the Yangtze River, the rice planting areas in the Poyang Lake Basin and Dongting Lake Basin are substantial, each accounting for approximately 11%. The research findings can provide support for the study of the evolving patterns of water circulation under the influence of water usage in economic and social contexts.
Our study presents a method that integrates four crucial crop statistics—rice, wheat, maize, and vegetables—with the remotely sensed CLUDs. This approach refines the the irrigated cropland area and provides more realistic input to further improve the hydrological model’s performance. Furthermore, this finding can support relevant departments in optimizing land and water resource management.

Author Contributions

Conceptualization, S.Z.; methodology, S.Z. and X.S.; software, X.S.; validation, S.Z. and Z.L.; formal analysis, S.H. and J.C.; investigation, Z.L. and P.L.; data curation, S.Z. and Z.L.; writing—original draft preparation, S.Z.; writing—review and editing, S.Z.; visualization, S.Z.; Supervision, X.S.; project administration, X.S.; funding acquisition, X.S. All authors have read and agreed to the published version of the manuscript.

Funding

This research was funded by the National Key Research and Development Program of China (2022YFC3204404) and the Hydraulic Science and Technology Program of Jiangsu Province (2022044).

Institutional Review Board Statement

Not applicable.

Informed Consent Statement

Not applicable.

Data Availability Statement

All relevant data are available from an online repository or repositories (https://www.resdc.cn/ accessed on 9 November 2023, and local government websites, e.g., http://www.hunan.gov.cn/zfsj/tjnj/tygl.html accessed on 9 November 2023 for Hunan province).

Conflicts of Interest

Author Pan Liu was employed by the company China Three Gorges Corporation. The remaining authors declare that the research was conducted in the absence of any commercial or financial relationships that could be construed as a potential conflict of interest.

References

  1. Fang, X.; Zhao, W.; Zhang, C.; Zhang, D.; Wei, X.; Qiu, W.; Ye, Y. Methodology for credibility assessment of historical global LUCC datasets. Sci. China Earth Sci. 2020, 63, 1013–1025. [Google Scholar] [CrossRef]
  2. Zhong, Y.; Luo, C.; Hu, X.; Wei, L.; Wang, X.; Jin, S. Cropland Product Fusion Method Based on the Overall Consistency Difference: A Case Study of China. Remote Sens. 2019, 11, 1065. [Google Scholar] [CrossRef]
  3. Callow, J.N.; Smettem, K.R.J. The effect of farm dams and constructed banks on hydrologic connectivity and runoff estimation in agricultural landscapes. Environ. Model. Softw. 2009, 24, 959–968. [Google Scholar] [CrossRef]
  4. Jin, X.; Jin, Y.; Mao, X. Land Use/Cover Change Effects on River Basin Hydrological Processes Based on a Modified Soil and Water Assessment Tool: A Case Study of the Heihe River Basin in Northwest China’s Arid Region. Sustainability 2019, 11, 1072. [Google Scholar] [CrossRef]
  5. Wang, Q.; Xu, Y.; Xu, Y.; Wu, L.; Wang, Y.; Han, L. Spatial hydrological responses to land use and land cover changes in a typical catchment of the Yangtze River Delta region. CATENA 2018, 170, 305–315. [Google Scholar] [CrossRef]
  6. Xu, Y.; Chen, Y.; Ren, Y.; Tang, Z.; Yang, X.; Zhang, Y. Attribution of Streamflow Changes Considering Spatial Contributions and Driver Interactions Based on Hydrological Modeling. Water Resour. Manag. 2023, 37, 1859–1877. [Google Scholar] [CrossRef]
  7. Chang, M.; Fan, S.; Fan, Q.; Chen, W.; Zhang, Y.; Wang, Y.; Wang, X. Impact of Refined Land Surface Properties on the Simulation of a Heavy Convective Rainfall Process in the Pearl River Delta Region, China. Asia-Pac. J. Atmos. Sci. 2014, 50, 93–103. [Google Scholar] [CrossRef]
  8. Mekonnen, Y.A.; Manderso, T.M. Land use/land cover change impact on streamflow using Arc-SWAT model, in case of Fetam watershed, Abbay Basin, Ethiopia. Appl. Water Sci. 2023, 13, 111. [Google Scholar] [CrossRef]
  9. Chunfen, Z. The Effect Research of Surface Coverage Remote Sensing Classification Data Quality and Change on Hydrological Simulation and Water Resources Evaluation. Ph.D. Thesis, Nanjing University, Nanjing, China, 2013. (In Chinese). [Google Scholar]
  10. DeFries, R.; Eshleman, N. Land-use change and hydrologic processes: A major focus for the future. Hydrol. Process. 2004, 18, 2183–2186. [Google Scholar] [CrossRef]
  11. Mustafa, A.; Szydlowski, M. The Impact of Spatiotemporal Changes in Land Development (1984–2019) on the Increase in the Runoff Coefficient in Erbil, Kurdistan Region of Iraq. Remote Sens. 2020, 12, 1302. [Google Scholar] [CrossRef]
  12. Xu, S.; Chen, Y.; Zhang, Y.; Chen, L.; Sun, H.; Liu, J. Developing a framework for urban flood modeling in Data-poor regions. J. Hydrol. 2023, 617, 128985. [Google Scholar] [CrossRef]
  13. Song, X.P.; Hansen, M.C.; Stehman, S.V.; Potapov, P.V.; Tyukavina, A.; Vermote, E.F.; Townshend, J.R. Global land change from 1982 to 2016. Nature 2018, 560, 639–643. [Google Scholar] [CrossRef]
  14. Gao, Z.Q.; Deng, X.Z. Analysis on spatial features of lucc based on remote sensing and gis in China. Chin. Geogr. Sci. 2002, 12, 107–113. [Google Scholar] [CrossRef]
  15. Wulder, M.A.; Coops, N.C.; Roy, D.P.; White, J.C.; Hermosilla, T. Land cover 2.0. Int. J. Remote Sens. 2018, 39, 4254–4284. [Google Scholar] [CrossRef]
  16. Zhang, J.; Li, H.; Gu, H.; Zhang, H.; Yang, Y.; Tan, X.; Li, M.; Shen, J. Study on man-machine collaborative intelligent extraction for natural resource features. Acta Geod. Cartogr. Sin. 2021, 50, 1023–1032. (In Chinese) [Google Scholar]
  17. Zhou, P.C.; Cheng, G.; Yao, X.W.; Han, J.W. Machine learning paradigms in high-resolution remote sensing image interpretation. Natl. Remote Sens. Bull. 2021, 25, 182–197. (In Chinese) [Google Scholar] [CrossRef]
  18. Dou, Y.; Guo, C.; Kuang, W.; Chi, W.; Lei, M. The Massive Expansion and Spatial Transformation of Potentially Contaminated Land Across China in 1990-2020 Observed from Remote Sensing and Big-data. Chin. Geogr. Sci. 2022, 32, 776–791. [Google Scholar] [CrossRef]
  19. Liu, J.Y.; Zhang, Z.X.; Zhang, S.W.; Yan, C.; Wu, S.; Li, R.; Kuang, W.H.; Shi, W.J.; Huang, L.; Ning, J.; et al. Innovation and Development of Remote Sensing-based Land Use Change Studies based on Shupeng Chen’s Academic Thoughts. J. Geo-Inf. Sci. 2020, 22, 680–687. [Google Scholar]
  20. Liu, J.; Zhang, Z.; Xu, X.; Kuang, W.; Zhou, W.; Zhang, S.; Li, R.; Yan, C.; Yu, D.; Wu, S.; et al. Spatial patterns and driving forces of land use change in China during the early 21st century. J. Geogr. Sci. 2010, 20, 483–494. [Google Scholar] [CrossRef]
  21. Ning, J.; Liu, J.; Kuang, W.; Xu, X.; Zhang, S.; Yan, C.; Li, R.; Wu, S.; Hu, Y.; Du, G.; et al. Spatiotemporal patterns and characteristics of land-use change in China during 2010-2015. J. Geogr. Sci. 2018, 28, 547–562. [Google Scholar] [CrossRef]
  22. He, S.; Li, J.; Wang, J.; Liu, F. Evaluation and analysis of upscaling of different land use/land cover products (FORM-GLC30, GLC_FCS30, CCI_LC, MCD12Q1 and CNLUCC): A case study in China. Geocarto Int. 2022, 37, 17340–17360. [Google Scholar] [CrossRef]
  23. Yang, F.; Yang, X.; Wang, Z.; Sun, Y.; Zhang, Y.; Xing, H.; Wang, Q. Spatiotemporal Evolution of Production-Living-Ecological Land and Its Eco-Environmental Response in China’s Coastal Zone. Remote Sens. 2023, 15, 3039. [Google Scholar] [CrossRef]
  24. Liu, J.; Shao, Q.; Yan, X.; Fan, J.; Zhan, J.; Deng, X.; Kuang, W.; Huang, L. The climatic impacts of land use and land cover change compared among countries. J. Geogr. Sci. 2016, 26, 889–903. [Google Scholar] [CrossRef]
  25. Liu, J.; Liu, M.; Zhuang, D.; Zhang, Z.; Deng, X. Study on spatial pattern of land-use change in China during 1995-2000. Sci. China Ser.-Earth Sci. 2003, 46, 373–384. [Google Scholar] [CrossRef]
  26. Zhong, H.; Liu, Z.; Wang, J. Understanding impacts of cropland pattern dynamics on grain production in China: A integrated analysis by fusing statistical data and satellite-observed data. J. Environ. Manag. 2022, 313, 114988. [Google Scholar] [CrossRef] [PubMed]
  27. Pan, L.; Xia, H.; Zhao, X.; Guo, Y.; Qin, Y. Mapping Winter Crops Using a Phenology Algorithm, Time-Series Sentinel-2 and Landsat-7/8 Images, and Google Earth Engine. Remote Sens. 2021, 13, 2510. [Google Scholar] [CrossRef]
  28. Cai, Z.; Hu, Q.; Zhang, X.; Yang, J.; Wei, H.; He, Z.; Song, Q.; Wang, C.; Yin, G.; Xu, B. An Adaptive Image Segmentation Method with Automatic Selection of Optimal Scale for Extracting Cropland Parcels in Smallholder Farming Systems. Remote Sens. 2022, 14, 3067. [Google Scholar] [CrossRef]
  29. Lu, M.; Wu, W.; You, L.; Chen, D.; Zhang, L.; Yang, P.; Tang, H. A Synergy Cropland of China by Fusing Multiple Existing Maps and Statistics. Sensors 2017, 17, 1613. [Google Scholar] [CrossRef]
  30. Monfreda, C.; Ramankutty, N.; Foley, J.A. Farming the planet: 2. Geographic distribution of crop areas, yields, physiological types, and net primary production in the year 2000. Glob. Biogeochem. Cycles 2008, 22, GB1022. [Google Scholar] [CrossRef]
  31. Fritz, S.; See, L.; McCallum, I.; You, L.; Bun, A.; Moltchanova, E.; Duerauer, M.; Albrecht, F.; Schill, C.; Perger, C.; et al. Mapping global cropland and field size. Glob. Chang. Biol. 2015, 21, 1980–1992. [Google Scholar] [CrossRef]
  32. Qin, Y.; Xiao, X.; Dong, J.; Zhou, Y.; Zhu, Z.; Zhang, G.; Du, G.; Jin, C.; Kou, W.; Wang, J.; et al. Mapping paddy rice planting area in cold temperate climate region through analysis of time series Landsat 8 (OLI), Landsat 7 (ETM+) and MODIS imagery. Isprs J. Photogramm. Remote Sens. 2015, 105, 220–233. [Google Scholar] [CrossRef]
  33. Loew, F.; Duveiller, G. Defining the Spatial Resolution Requirements for Crop Identification Using Optical Remote Sensing. Remote Sens. 2014, 6, 9034–9063. [Google Scholar] [CrossRef]
  34. Sterling, S.M.; Ducharne, A.; Polcher, J. The impact of global land-cover change on the terrestrial water cycle. Nat. Clim. Chang. 2013, 3, 385–390. [Google Scholar] [CrossRef]
  35. Dolan, F.; Lamontagne, J.; Link, R.; Hejazi, M.; Reed, P.; Edmonds, J. Evaluating the economic impact of water scarcity in a changing world. Nat. Commun. 2021, 12, 1915. [Google Scholar] [CrossRef] [PubMed]
  36. Li, C.; Cai, Y.; Tan, Q.; Wang, X.; Li, C.; Liu, Q.; Chen, D. An integrated simulation-optimization modeling system for water resources management under coupled impacts of climate and land use variabilities with priority in ecological protection. Adv. Water Resour. 2021, 154, 103986. [Google Scholar] [CrossRef]
  37. Teshager, A.D.; Gassman, P.W.; Secchi, S.; Schoof, J.T.; Misgna, G. Modeling Agricultural Watersheds with the Soil and Water Assessment Tool (SWAT): Calibration and Validation with a Novel Procedure for Spatially Explicit HRUs. Environ. Manag. 2016, 57, 894–911. [Google Scholar] [CrossRef]
  38. Liu, S.; Wang, J.; Ang, H.; Ge, S. Influence of Underlying Surface Datasets on Simulated Hydrological Variables in the Xijiang River Basin. J. Hydrometeorol. 2023, 24, 1209–1223. [Google Scholar] [CrossRef]
  39. Yang, H.; Zhong, X.; Deng, S.; Nie, S. Impact of LUCC on landscape pattern in the Yangtze River Basin during 2001–2019. Ecol. Inform. 2022, 69, 101631. [Google Scholar] [CrossRef]
  40. Ahmed, N.; Wang, G.; Booij, M.J.; Xiangyang, S.; Hussain, F.; Nabi, G. Separation of the Impact of Landuse/Landcover Change and Climate Change on Runoff in the Upstream Area of the Yangtze River, China. Water Resour. Manag. 2022, 36, 181–201. [Google Scholar] [CrossRef]
  41. China County-Level Rural Economic Statistics Overview(1980–1987); China Statistics Press: Beijing, China, 1989; Available online: https://data.cnki.net/yearBook/single?id=N2007080357 (accessed on 9 November 2023).
  42. Statistical Yearbook of Yangtze River Economic Zone; China Statistics Press: Beijing, China, 2018; Available online: https://data.cnki.net/yearBook/single?id=N2019040023 (accessed on 9 November 2023).
  43. Statistical Communique of the People’s Republic of China on National Economic and Social Development; China Statistics Press: Beijing, China, 2000; Available online: https://data.cnki.net/yearBook/single?id=N2020040350 (accessed on 9 November 2023).
  44. China Agricultural Statistical Report (1949–2019); China Agriculture Press: Beijing, China, 2020; Available online: https://data.cnki.net/yearBook/single?id=N2019120059 (accessed on 9 November 2023).
  45. Liu, J.; Kuang, W.; Zhang, Z.; Xu, X.; Qin, Y.; Ning, J.; Zhou, W.; Zhang, S.; Li, R.; Yan, C.; et al. Spatiotemporal characteristics, patterns, and causes of land-use changes in China since the late 1980s. J. Geogr. Sci. 2014, 24, 195–210. [Google Scholar] [CrossRef]
  46. Wang, H.; Cai, L.; Wen, X.; Fan, D.; Wang, Y. Land cover change and multiple remotely sensed datasets consistency in China. Ecosyst. Health Sustain. 2022, 8, 2040385. [Google Scholar] [CrossRef]
  47. Letourneau, A.; Verburg, P.H.; Stehfest, E. A land-use systems approach to represent land-use dynamics at continental and global scales. Environ. Model. Softw. 2012, 33, 61–79. [Google Scholar] [CrossRef]
  48. GB/T 21010-2017; Current Land Use Classification. China National Standardization Administration Committee: Beijing, China, 2017.
  49. Gu, X.; Bai, W.; Li, J.; Kong, D.; Liu, J.; Wang, Y. Spatio-temporal changes and their relationship in water resources and agricultural disasters across China. Hydrol. Sci. J. J. Des Sci. Hydrol. 2019, 64, 490–505. [Google Scholar] [CrossRef]
  50. Jin, T.; Zhong, T. Changing rice cropping patterns and their impact on food security in southern China. Food Secur. 2022, 14, 907–917. [Google Scholar] [CrossRef]
  51. Wang, S.; Yang, L.S.; Liao, S.P.; Sun, B.; Shi, X.J.; Lu, J.W.; Guo, S.W.; Shen, J.B.; Zhang, F.S.; Goulding, K.; et al. Impact of Nutrient Management on Wheat/Vegetable Yields and the Fate of N-15-Labeled Fertilizer in the Yangtze River Basin. Front. Environ. Sci. 2022, 10, 772972. [Google Scholar] [CrossRef]
  52. GB/T 2260-2007; Codes for the Administrative Divisions of the People’s Republic of China. China National Standardization Administration Committee: Beijing, China, 2017.
  53. Wang, J.; Sang, X.; Zhai, Z.; Liu, Y.; Zhou, Z. An Integrated Model for Simulating Regional Water Resources Based on Total Evapotranspiration Control Approach. Adv. Meteorol. 2014, 2014, 345671. [Google Scholar] [CrossRef]
  54. Sang, X.; Wang, H.; Wang, J.; Zhao, Y.; Zuhao, Z. The development and application of water resources allocation model based on water balance closure. J. Hydraul. Eng. 2018, 49, 1451–1459. (In Chinese) [Google Scholar] [CrossRef]
  55. Zhai, Z.l.; Sang, X.F.; Chen, J.; Yang, M. The Total Control of Water Supply and Water Consumption in Tianjin City Based on WAS Model. DEStech Trans. Environ. Energy Earth Sci. 2017, 12. [Google Scholar] [CrossRef]
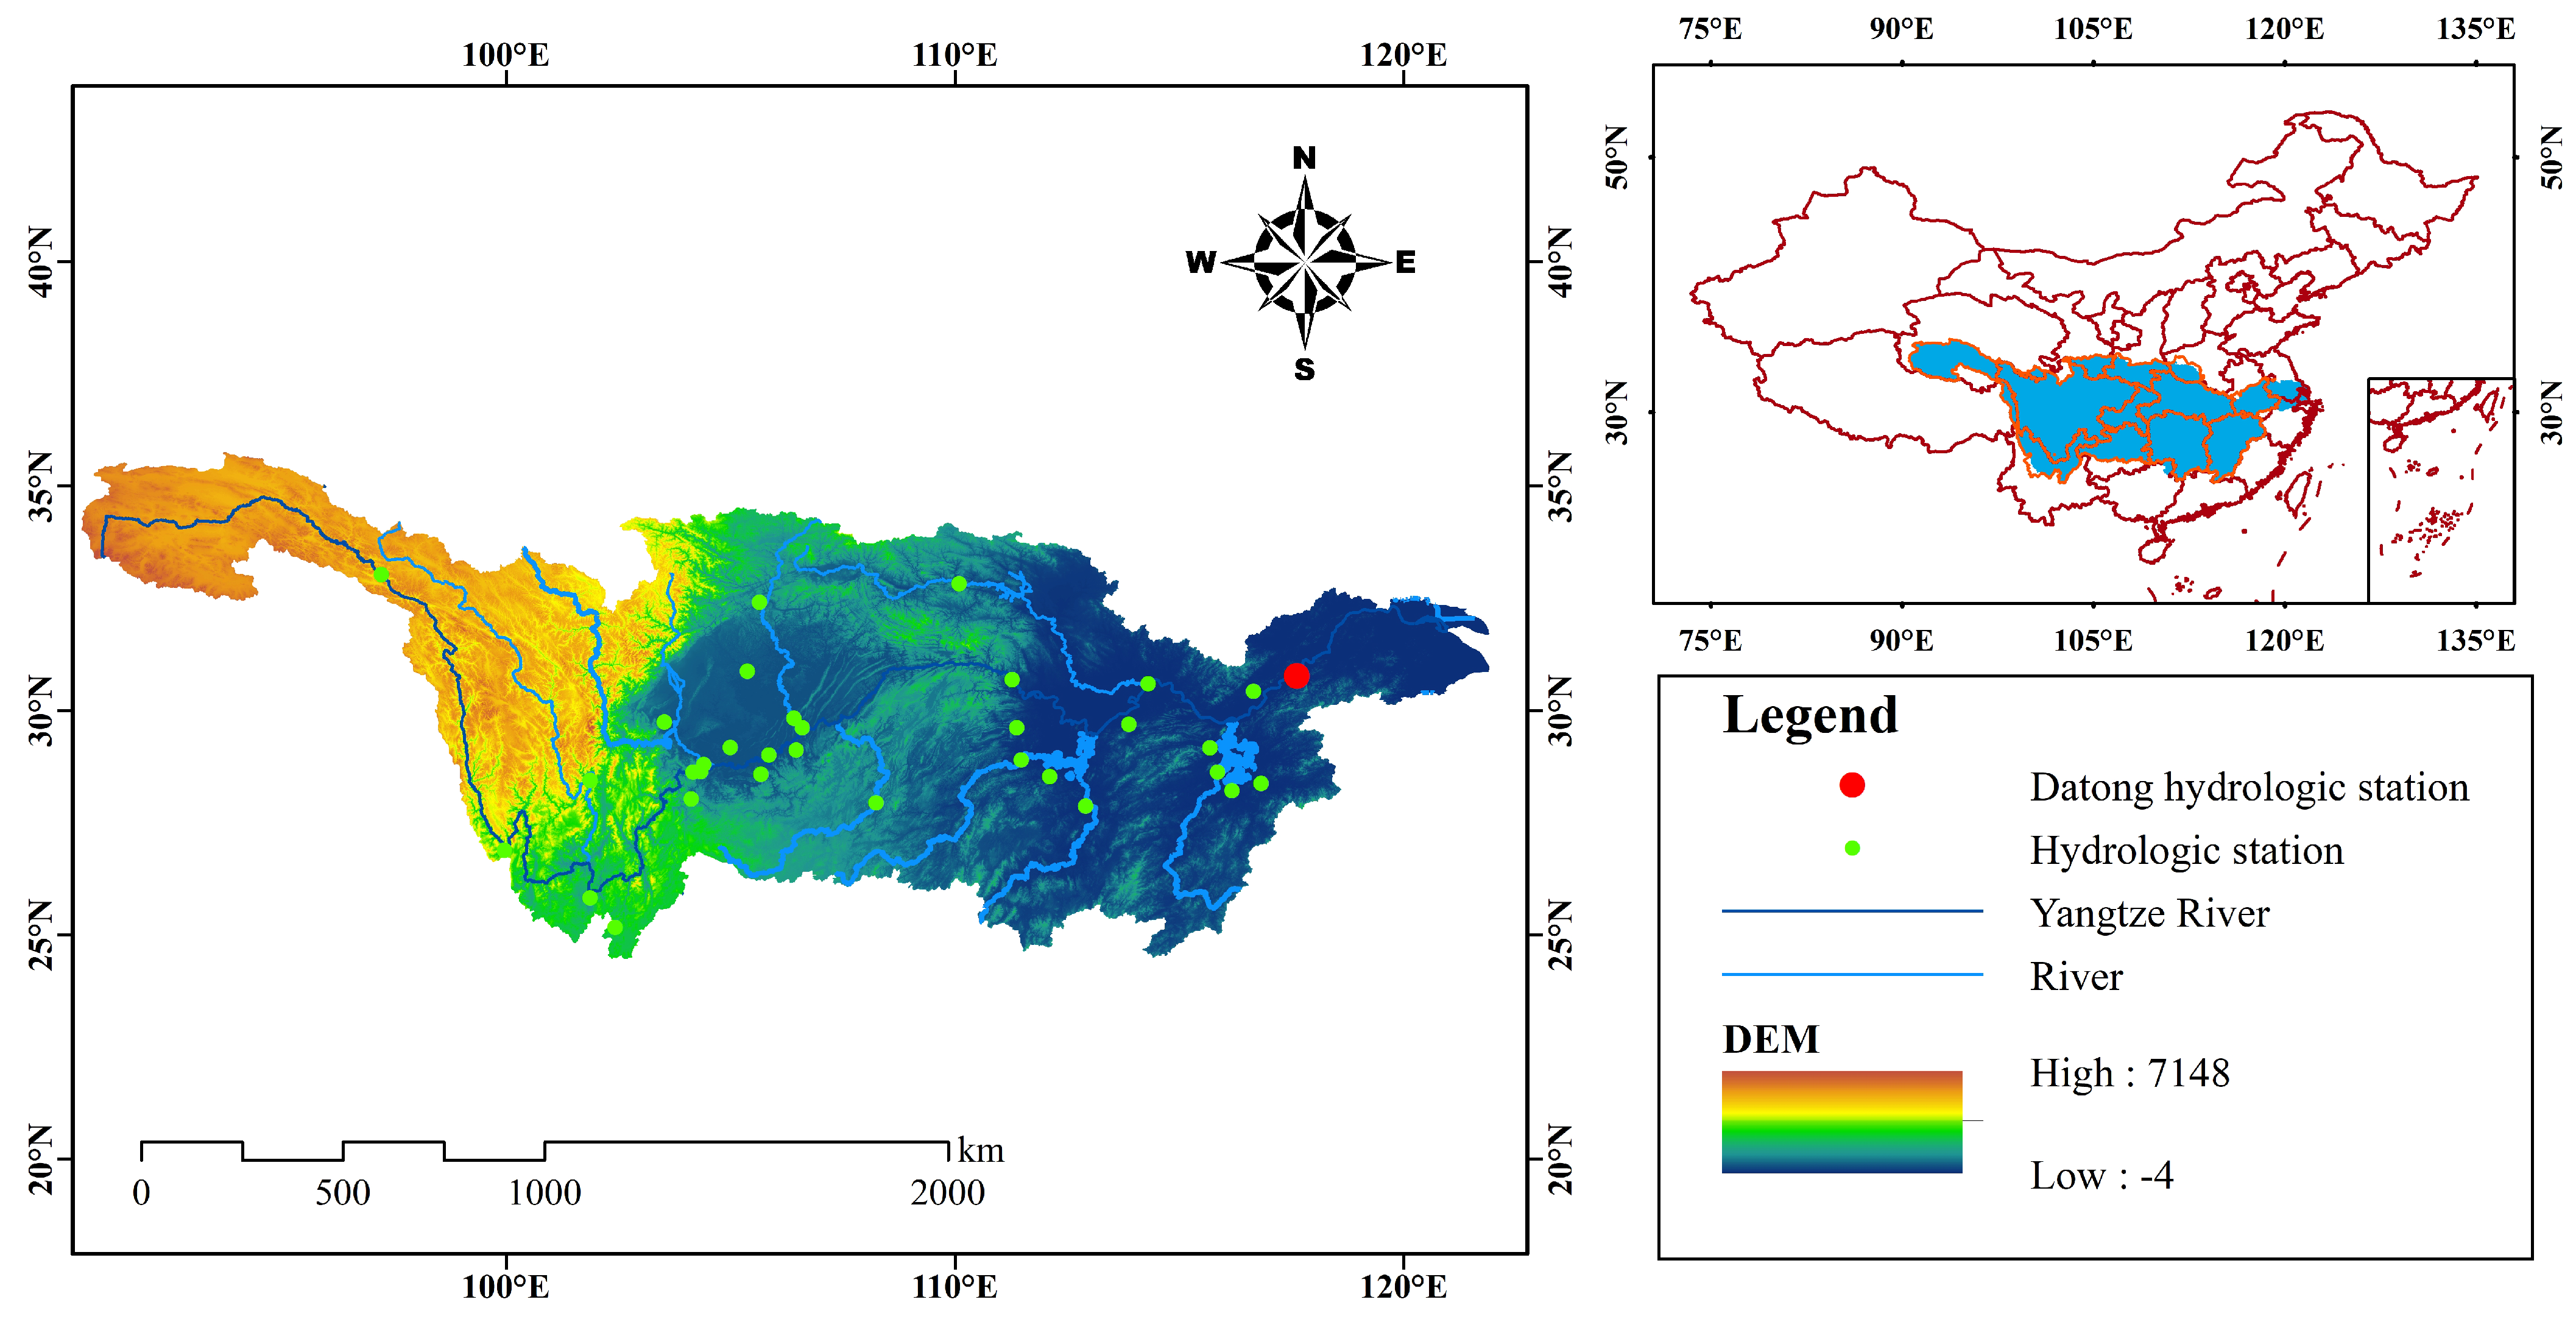
Figure 1. Map of Yangtze River Basin, China.
Sustainability 16 00778 g001
Figure 2. Analysis of non-matching dual-source data on the paddy field (rice) areas in 11 cities in Jiangsu Province.
Sustainability 16 00778 g002
Figure 3. Flowchart of the LUSF classification.
Sustainability 16 00778 g003
Figure 4. Flowchart of the methodology adopted in this study.
Sustainability 16 00778 g004
Figure 5. Flowchart of the algorithm adopted in this study.
Sustainability 16 00778 g005
Figure 6. The crop area proportion in each calculating unit.
Sustainability 16 00778 g006
Figure 7. The structure of the WAS model [53].
Sustainability 16 00778 g007
Figure 8. Consistency of arable land area from the official statistics and remote sensing datasets, respectively. (a) The rice planting area (statistics data), paddy land area (CLUDs), (b) irrigated crop area (statistics data), dryland area (CLUDs); (c) the total cultivated land area.
Sustainability 16 00778 g008
Figure 9. The absolute error reduction in the runoff simulation using LUSF datasets, respectively. “Green–blue” indicates the stronger reduction effect of the regional runoff simulation error.
Sustainability 16 00778 g009
Figure 10. The absolute error and relative error reduction in the monthly runoff simulation using the LUSF dataset, respectively.
Sustainability 16 00778 g010
Figure 11. The difference in MAPE value generated from each hydrologic section using the LUSF dataset. The green dots represent a significant decrease in the MAPE value between simulated runoff and measured runoff from the control unit of the hydrological station.
Sustainability 16 00778 g011
Figure 12. The difference in relative error using the LUSF dataset. “Red–white–blue” means that the effect of reducing the relative error between the simulated results and the measured results is gradually enhanced.
Sustainability 16 00778 g012
Figure 13. The absolute error reduction in the runoff simulation using before and after corrected canopy interception coefficients, respectively. "Green–blue" indicates the stronger reduction effect of the regional runoff simulation error.
Sustainability 16 00778 g013
Figure 14. The absolute error and relative error reduction in monthly runoff simulation using before and after corrected canopy interception coefficients, respectively.
Sustainability 16 00778 g014
Figure 15. The proportion of the main crop planting area to the total area of the eight river systems in the Yangtze River Basin in 1980, 2000, and 2015.
Sustainability 16 00778 g015
Table 1. Ground-level data collection status.
Year1980199019952000200520102015
Missing rate78%58%41%36%21%36%24%
Table 2. Datasets used in the creation of the LUSF dataset.
DatasetData SourceYearsSpatial ResolutionApplication
China’s Land-Use/cover Datasets
(CLUDs) maps
Landsat TM/ETM+
and Landsat 8 remote sensing images
1980, 1990, 1995, 2000,
2005, 2010, and 2015
1kmTo extract CLUDs
Major crop-planting areaPrefecture-level city
statistical Yearbook
97 regionsTo statistics dataset
Table 3. Scene Setting.
ScenesCoefficient MatrixLand Use Dataset
F01-1X1LUSF
F01-2X2CLUDs
Table 4. Dynamic attitude of land use types and runoff coefficient variation in the study area during 1980–2019.
WatershedRiceWheat or MaizeVegetablesOther CropsDry LandWoodlandGrasslandBuilt-Up LandWater BodyUnused Land α 1980 α 2019 α change
Dongting Lake0.74%0.24%4.93%4.80%−0.43%−5.52%−5.64%0.92%−0.06%−0.03%0.55730.5447−0.0126
Han River−0.50%0.94%4.12%4.52%−3.65%−3.48%−2.86%0.75%0.21%−0.07%0.39520.3851−0.0101
Jialing River−1.98%−1.32%4.06%3.45%−1.39%−1.68%−1.91%0.70%−0.04%0.04%0.52180.5189−0.0029
Mintuo River−1.45%−1.26%2.93%1.61%−1.13%−1.32%−0.92%0.87%−0.01%0.04%0.81790.8168−0.0010
Poyang Lake−0.08%−0.45%3.15%2.34%−0.19%−2.00%−3.75%0.96%0.10%−0.13%0.60840.6049−0.0035
Wujiang River−0.64%0.22%2.12%1.66%0.23%−2.93%−1.47%0.74%0.07%0.00%0.56010.5579−0.0022
Qingjiang River−0.61%0.63%4.42%1.65%−1.48%−5.16%−0.08%0.51%0.14%−0.02%0.08270.0804−0.0023
Yalong River0.65%0.20%0.39%0.15%−0.11%−0.11%−3.45%0.06%−1.28%0.61%0.37800.3775−0.0005
Disclaimer/Publisher’s Note: The statements, opinions and data contained in all publications are solely those of the individual author(s) and contributor(s) and not of MDPI and/or the editor(s). MDPI and/or the editor(s) disclaim responsibility for any injury to people or property resulting from any ideas, methods, instructions or products referred to in the content.