Abstract
The eco-environmental protection policy of the Yangtze River Economic Belt (YREB) is paramount in upholding biodiversity and fostering sustainable development within the Yangtze River Basin. To assess the effectiveness of this policy, an evaluation system was established utilising text mining and the PMC-Index model. Subsequently, thirteen representative policies were evaluated, and their performance was visualised through PMC-Surface plots. The study showed that nine of the thirteen representative policies were assessed as “Excellent”, the remaining four were assessed as “Acceptable”, and no policy was assessed as either “Perfect” or “Poor”. It shows that the general design of the eco-environmental protection policy of the YREB is reasonable and scientific but still has much to improve. The performance is as follows: short- and medium-term policies are the most prevalent, while long-term planning is lacking; the issuing agency is relatively single, and the awareness and capacity of collaborative governance need to be strengthened; the regulatory scope of local policies does not focus on the YREB as a whole. Based on this, subsequent policies should be improved by focusing on policy timeliness, the policy issuing agency, and the regulation scope.
1. Introduction
As a natural geographical phenomenon, the formation of river basins can be traced back to the geological evolution of the Earth over hundreds of millions of years. River basins, which are responsible for receiving and discharging water bodies, significantly influence the global climate, soil, ecosystems, and resource distribution [1]. There are many significant river basins in the world, among which the Nile, Amazon, Mississippi, and Yangtze River are the most representative [2]. The water systems stemming from these basins have accompanied the rise and fall of human civilisations throughout history. The formation of river basins plays a pivotal role in economic development. They supply the surrounding areas with essential resources such as transportation, agriculture, industry, and human life, thereby nurturing a series of vibrant economic belts. The YREB is one of the most representative regions in China and the world. As the third largest basin in the world, the Yangtze River has a complex climate and terrain. It contains a wide range of ecological types and natural resources. The YREB has become a key area for China’s economic development and global sustainable development, especially in transportation, agriculture, and industry [3]. As a river spanning many provinces with different levels of development, the Yangtze River plays a vital role in the global sustainable development goals. In this context, taking the YREB as the research object has high representativeness in the following aspects. First, the level of economic development: the YREB contributes significantly to China’s overall economic output, covering a wide range of economic types in cities and regions across the country. Second, diversity of ecosystems: regions within the YREB are characterised by diverse ecosystems and complex ecological environments. Finally, regional differences: the vertical and horizontal diversity of landforms result in marked regional differences, making the Yangtze River Economic Belt a valuable and influential case study. Therefore, taking the YREB as the research object is not only highly representative, but it also can provide a reference for other basins in the world.
At present, the global climate is in a period of constant change; environmental problems are becoming increasingly prominent. Governments worldwide are actively formulating various environmental policies to seek harmony between man and nature to achieve sustainable development. The Yangtze River traverses more than half of China, which is rich in resources, has a large population, and is a major transportation route in China, known as the “Golden Waterway” [4]. In 1984, the idea of building an industry-intensive belt along the Yangtze River was put forward for the first time [5]. Subsequently, the concept of the Yangtze River Economic Belt came into being [6]. As an essential economic development area extending inland, the Yangtze River Basin has attracted the attention of all parties, and the concept of the YREB came into being.
Economic development often comes with adverse effects, and the YREB has endured the tremendous pressure brought about by rapid development, which has manifested itself in the continuous deterioration of the eco-environment. Environmental pollution, ecological destruction, and other problems threaten the balance of the ecosystem and constrain the sustainable development of the YREB. With the development of the YREB, it has received widespread attention; the degree and volume of topics and issues related to eco-environmental protection in the YREB have also risen. As a pioneer demonstration belt for ecological civilisation construction, the YREB plays a benchmarking and demonstrative role in the basin’s high-quality development. However, without addressing the bottleneck of ecological degradation, the goal of high-quality development will be challenging. In response, the Chinese government has adopted multiple eco-environmental protection policies to ease the development pressure on the YREB through ecological restoration. In recent years, it has gradually established the basic policy of taking the concept of green development as the core and avoiding over-development [7]. Although we have made certain progress, the eco-environmental protection of the YREB still faces many challenges and problems. Obviously, the task of eco-environment protection in the YREB is heavy. For the purpose of providing impetus for developing and improving subsequent policies, a comprehensive evaluation of the YREB’s eco-environmental protection policies is essential.
Policy evaluation is an essential basis for measuring the quality of public policies. It aims to assess and analyse the effects of policy implementation in order to facilitate subsequent adjustments and improvements. Through the evaluation of the policy, we can find out the strengths and weaknesses of that policy and predict the problems that may arise during the policy implementation [8]. Therefore, this study evaluates the eco-environmental protection policies in the YREB, with the following three contributions. First, it uses text mining technology to deeply analyse eco-environmental protection policies, providing a more detailed perspective and data support for policy evaluation. Second, it constructs a quantitative evaluation framework based on the PMC-Index model, systematically evaluating the implementation effect of eco-environmental protection policies in the YREB and providing new methods for existing research. Third, it selects nine representative policies of eco-environmental policies, and through empirical analysis, comprehensively evaluates the advantages and disadvantages of each policy in the implementation process, providing new basis and suggestions for the adjustment of eco-environmental protection policies in the YREB of China. Furthermore, it provides research and practice for global environmental governance, further promoting international policy communication and cooperation.
The rest of this paper is arranged as follows. Section 2 reviews the existing research and literature. Section 3 introduces the data sources and constructs the PMC-Index model. Section 4 presents the representative policies, and then performs calculations and analyses using the PMC-Index model. Section 5 concludes the paper and provides an outlook.
2. Literature Review
In this study, based on existing literature, research findings on the eco-environmental protection policies of the YREB are sorted into two parts. The first part is eco-environmental protection in the YREB, and the second part is eco-environmental protection policy. By integrating the research findings from these two aspects, we can gain a better understanding of the relationship between regional ecological environments and policies. It can provide a solid theoretical foundation and support for formulating and implementing effective ecological protection policies. In addition, this literature review will also provide beneficial enlightenment and thinking for future research on eco-environmental protection in the YREB.
2.1. Eco-Environmental Protection in YREB
The current academic research on eco-environmental protection in the YREB mainly focuses on the interrelationship between economic development and the change of eco-environment. Much of the research has been grounded in the Environmental Kuznets Curve (EKC) hypothesis as its theoretical foundation. The hypothesis is derived from the Kuznets curve proposed in 1955 [9]. The EKC hypothesis suggests that economic development and environmental quality follow an inverted U-shaped, with economic growth to a particular scale inevitably leading to environmental damage. In contrast, environmental problems must be solved by relying on economic growth [10]. Based on this theory, the water resources of the Yangtze River are taken as the study object, and the footprint analysis model is employed to analyse the negative impact of economic development policies on local water ecology in the YREB. This negative impact is more pronounced in economically developed areas [11]. To further verify the relationship between the environment and the economy, Liu et al. [12] built an evaluation system and model; empirically tested the development of the YREB; verified the critical impact of the interaction between regional energy, economy, and ecosystem on sustainable development; and proposed optimisation strategies. Similarly, based on Landsat TM data of the YREB in 1991, 2001, and 2008, Wang et al. [13] constructed the eco-economic system coordination degree (CDES) model, ecosystem service value (ESV), and spatial data transformation model, and revealed the ecological and economic development laws of different regions in the YREB. In order to deeply understand the causes of regional ecological problems and the influencing factors of sustainable development, Yang et al. [14] used an ecological footprint model to study the ecological sustainability of the YREB urban agglomeration and found that human activities are essential to the sustainable development. A rapid economic development and the expansion of human activities are two main factors limiting the sustainable development in YREB. On the other hand, a mechanism equilibrium model was applied to reveal an evolutionary trend in which the YREB has shifted from eco-function dominance (2000) to production dominance (2010) and back to eco-function dominance (2020) [15]. In terms of investigating regional ecological efficiency and its influencing factors, Ma et al. [16] adopted the measurement model based on relaxation degree (SBM), built a new research framework, realised the research on the factors affecting regional ecological efficiency, and confirmed the effectiveness and development of ecological efficiency. In addition, some scholars believe that ecological damage is not a by-product of economic development, and therefore, there is no necessary connection between the eco-environment and economic development. This point provides a new thinking direction for the study of eco-environmental protection.
2.2. Eco-Environmental Protection Policy
Eco-environmental protection policy refers to a series of countermeasures formulated by a country or region to improve the eco-environment. Policies in protecting the eco-environment have developed since the 1960s, when the advent of the third industrial revolution propelled the world into a phase of rapid development, and environmental problems ensued. The issue of ecological protection has begun to receive attention from various countries, and IUCN, UNEP, and the World Wide Fund for Nature (WWF) have put forward the concept of “sustainable development” [17]. Subsequently, governments have introduced a series of environmental protection regulations and policies, such as the Convention on Biological Diversity, the National Environmental Policy Law, and the United Nations Framework Convention on Climate Change. These policies aim to limit industrial pollution, protect natural resources and ecosystems, and promote sustainable economic and social development. Since then, there has been a great deal of academic research on such ecological conservation policies in various countries. At the macro level, Russell [18] analysed 23 years of ecological protection policies of the United States Environmental Protection Agency and suggests that ecological improvement should not be aimed only at human health but should also focus on the impact of the environment on other organisms. From the perspective of China’s policies, Xie [19] analysed the development history and evolution characteristics of China’s eco-environmental protection policy and summarised it into three stages: the initial stage of enlightenment and formation, the stage of sustainable development, and the stage of ecological civilisation construction. At the micro level, Yin et al. [20] took the grassland ecological protection subsidy policy as the study object. They explored the significant difference in the impact of ecological policies on the work enthusiasm of herders in different regions by using the Logistic model, and then suggested that the government should improve the existing grassland ecological subsidy under the characteristics of herders in different regions. Another study that explores the relationship between regional economic benefits and environmental policies is from Girma and Beyene [21]. They investigated the factors influencing collective management willingness in the Godere Forest in the Gambela Region. They proposed the allocation of different policy tools and management models in short-, medium-, and long-term planning for the management of public welfare forests from a dynamic perspective to achieve a win–win situation for both forest ecological benefits and farmers’ economic benefits. From the perspective of collaborative governance, Tsang and Kolk [22] pointed out that in order to balance energy consumption and environmental degradation, it is necessary to establish and implement collaborative policies to address climate change and eco-environmental protection. Some scholars have investigated the effectiveness of implementing the current eco-environmental protection policies in the YREB. In terms of policy formulation, Zhao et al. [23] conducted a textual analysis of several policies on the environmental governance of the Yangtze River Economic Belt and found the cooperation among these policies remains inadequate. They argue that cross-regional collaborative governance should be considered in policy formulation, further emphasising the unified standards of centralised environmental management for achieving more precise governance. In terms of policy implementation, Xiao [24] used a coupling coordination degree model to calculate and evaluate the synergy between the two subsystems of ecological and environmental protection and policy capacity in the Yangtze River Economic Belt. Her research found that the overall capability of local governments to implement policies is insufficient, with considerable disparities. In terms of policy feedback, Wen et al. [25] assessed the implementation and feedback effects of ecological and environmental protection policies in the Yangtze River Economic Belt, pointing out that the policy implementation effects in resource utilisation, environmental management, and ecological protection vary across provinces and cities along the belt. They suggest timely adjustments and refinements of policy objectives based on the feedback results.
In summary, academic research on eco-environmental protection policies primarily focuses on policies involving the use of induced tools such as ecological compensation, and there is less research on the actual effects and feedback of eco-environmental protection policies. Most of the studies on the YREB have carried out eco-environmental protection and policy capacity as two separate research topics, and the lack of a perfect policy evaluation system makes it difficult to assess the effectiveness of policies. Based on this, this research provides a new idea to quantitatively study the eco-environmental protection policy in the YREB by constructing the PMC-Index evaluation modelling method, which makes up for the insufficiency of previous studies and provides suggestions for the practice of ecological protection in the Yangtze River Basin in China.
3. Research Design
3.1. Data Sources
In order to guarantee the precision, pertinence, and representativeness of policy data, our research employs a retrospective approach. The data collection starts from the year 1984, when the concept of YREB was proposed. The research focuses on relevant policies related to eco-environment protection within the YREB, which have been issued by various policy entities such as the Central Committee and provincial governments, and their functional departments. These sources serve as the primary data for the analysis conducted in this research. For data collection, we used “Yangtze River Economic Belt”, “Yangtze River”, and “eco-environmental protection” as the keywords to search in the Peking University Legal and Regulation Database. In addition, we compared, verified, and supplemented the results with official websites of governments at all levels. We deleted informal documents such as memos and approvals unrelated to ecological protection. After screening and sorting, this study finally obtained 234 policy documents, including 48 documents from the central government and 186 documents from the local government.
3.2. Construction of the PMC-Index Model
The PMC-Index model, known as the Policy Model and Critique model, is an evaluation model based on a text-mining approach that is primarily used to measure policy consistency and effectiveness. The model is derived from Ruize Estrada’s hypothesis called “Omnia Mobilis”. It states that everything in the universe is in motion and interconnected so that any one variable is equally important [26]. The PMC-Index model has two levels of variables; the first level is usually up to 10, the secondary variables have no quantity limit, and each variable has the same weight. This setting intends to capture the various heterogeneities within the policy and thus more accurately evaluate the level of advantages and shortcomings of the policy [27]. In addition, the parameters of the PMC-Index model are mainly extracted by text mining, especially the extraction of secondary variables, which can significantly reduce the influence of human subjective evaluation, which can improve the accuracy of quantitative evaluation and scientifically reflect the mechanism of policy, evaluation results, and evaluation value. Therefore, this study chooses the PMC-Index model to evaluate the eco-environmental protection policy of the YREB. The PMC-Index model is constructed in four steps: (1) excavate text and design the variables; (2) construct a multi-input-output table; (3) compute the index of PMC variables; and (4) construct a PMC-Surface.
3.2.1. Word Frequency Analysis and Variable Design
Analysing and mining the policy text helps to accurately and scientifically refine the policy focus, thus providing a reference basis for indicator selection and variable design. In this study, 234 pieces of policy text were first integrated into one TXT file, imported into the text analysis software and subjected to lexical processing. Next, word frequency analysis was conducted using the segmented documents, and the initial run yielded a list of high-frequency words that had no practical significance for this study, were not significant for further modelling and analysis of policy characteristics, and therefore needed to be filtered by human beings. After eliminating the trend verbs such as position, place name, or “elevate” and “carry out”, a list of the top 20 high-frequency vocabulary words was compiled (Table 1). According to the table, the core points of the ecological protection policies in the YREB are pollution control, environmental protection regulation, financial subsidies, and water resource management.

Table 1.
High-frequency words in eco-environmental protection policies of the YREB.
Next, 234 pieces of policy text were subjected to semantic network analysis. The semantic network analysis chart can intuitively reflect the degree of association between different feature words by extracting the high-frequency feature words from the TXT file and using the co-occurrence matrix to construct the network structure diagram [28]. This research generates a semantic network relationship graph of ecological protection policies in the YREB by using text analysis software, as shown in Figure 1. The nodes represent keywords, and the thickness of the connecting lines between the nodes indicates the closeness of the connection between the two keywords; the closer the keyword is to the centre of the network structure graph, the more connecting lines it radiates, the higher the importance of the keyword is indicated [26]. This study combines the current practice of eco-environmental protection policies in the YREB. Based on the results of policy text excavating and concerning the PMC-Index model variables, this study constructs a system for evaluating eco-environmental protection policies in the YREB. We set 9 primary variables and 34 secondary variables in this study. The primary variables are Policy NatureX1, Policy TimelinessX2, Policy PerspectiveX3, Policy Issuing AgencyX4, Policy FocusX5, Regulation ScopeX6, Policy ObjectX7, Policy ToolX8, and Policy EvaluationX9, as shown in Table 2.
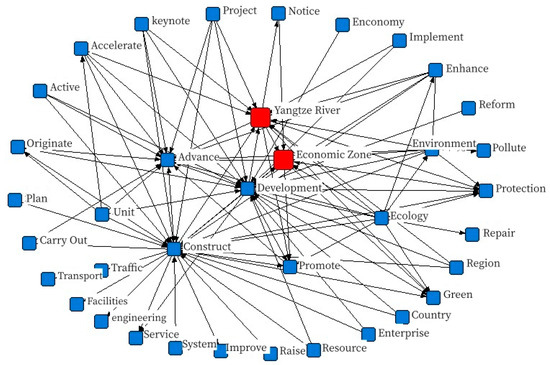
Figure 1.
The semantic network structure diagram.
Table 2.
Variable design and evaluation criteria.
3.2.2. Constructing a Multi-Input–Output Table
Based on the meanings of the variables in Table 2, we used the binary algorithm to assign values to the policies. The default assumption is that all secondary variables have the same weight, and then the text mining method is adopted to assess whether the representative policy contains content that meets the meaning of the corresponding secondary variables, and if so, assign a value of 1; if not, assign a value of 0 [29]. Since each variable has equal utility in a multi-input–output table, it can effectively reduce the subjectivity of policy evaluation. We constructed a multi-input–output table to assign values of the policies, as shown in Table 3.
Table 3.
Multi-input–output table.
3.2.3. PMC-Index Calculation and Evaluation Grade Classification
The calculation of the PMC-Index model can be divided into three steps, following the formula below: firstly, refer to Equations (1) and (2), enter the primary and secondary variables in the multi-input–output table, and assign a value to each of the secondary variables; then, using Equation (3), combine the assigned values of the secondary variables to calculate and arrive at the value of the primary variable. “j” represents the primary variable, and “i” represents the secondary variable. Finally, the data are imported into Equation (4) to generate the PMC-Index value of the policy to be evaluated, which is the summed score of all the first-level variables in Equation (3).
Referring to Ruize’s rating scale [30], the PMC-Index model in this study follows the following policy evaluation scale: if the policy’s PMC-Index ranges from 0 to 3.99, it is rated as “bad”; if the policy’s PMC-Index ranges from 4 to 5.99, it is rated as “acceptable”; if the policy’s PMC-Index ranges from 6 to 7.99, it is rated as “excellent”; and if the policy’s PMC-Index ranges from 8 to 9, it is rated as “perfect”.
3.2.4. Construction of PMC-Surface Diagrams
The PMC-Surface chart is a tool to show the evaluation effect of policies in the form of images. Converting the PMC-Index into a PMC-Surface chart can display the evaluation results of the policies intuitively and help to analyse the excellent parts and weak links of the eco-environmental protection policies of the YREB [31]. A raised portion of the surface indicates that the policy to be evaluated has a high score on that indicator level; a concave portion indicates that the policy to be evaluated has a low score on that indicator level. Since this study has nine primary variables, a 3 × 3 third-order matrix can be formed, as shown in Equation (5), to ensure the symmetry of the PMC-Surface.
4. Quantitative Analysis of Eco-Environmental Protection Policies in the YREB
4.1. Selection of Representative Policies
In the selection of representative policies, this study, based on the principle of a comprehensive examination of the central and local governments [32], selected thirteen representative policies from the database formed by the previous collection, including three policies issued by the central government or the State Council and ten policies issued by local governments and local departments. Regarding policy selection at the central level, we tried to pick more comprehensive and directive policies. In terms of policy selection at the local level, considering the different levels of development and geographical environments in different regions of the YREB, there may be differences in policy focus and policy effectiveness. Therefore, we selected one representative policy in each province (municipalities) to ensure the objectivity and comprehensiveness of the evaluation results. Among them, Sichuan Province and Chongqing Municipality are both located in the Sichuan Basin and have close cooperation in eco-environmental protection. Consequently, we selected a cooperative policy to explore the effectiveness of inter-provincial cooperation policies in the eco-environment in the YREB. These thirteen representative policies are all closely related to the eco-environment of the YREB, and they cover a wide range of fields and policy contents that can well reflect the current status. In terms of logic and paragraph layout, these representative policies have similarities and, therefore, are more comparable and more reasonable for side-by-side comparisons, as shown in Table 4.
Table 4.
Representative policies for eco-environmental protection in the YREB.
4.2. PMC-Index of 13 Representative Policies
The thirteen representative policies were substituted into the multi-input–output table, and the values of each secondary variable were assigned through text mining and content analysis, as shown in Table 5. Next, the PMC-Index value of each eco-environmental protection policy of the YREB was further calculated, as shown in Table 6.
Table 5.
Multi-input–output table of 13 representative policies.
Table 6.
PMC-Index of 13 representative policies.
According to Table 6, it can be seen that the thirteen representative policies are ranked from highest to lowest based on the PMC-Index: P1 > P9 > P6 > P2 > P3 > P10 > P7 = P11 > P12 > P4 > P8 > P13 > P5.
Among them, nine had an “excellent” level (P1, P2, P3, P6, P7, P9, P10, P11, P12), four had an “acceptable” level (P4, P5, P8, P13), and there were no “perfect” or “poor” levels. According to the rating scale, the average PMC value for these thirteen policies is 6.32, which is an “excellent” level. The three national policies all have an “excellent” rating. In comparison, the ten local policies have four “acceptable” ratings, indicating that the national policies are generally better than the local policies. It shows that national policies are generally better than local policies. From this point of view, the overall level of ecological protection policies in the YREB is good, with a certain degree of scientificity and feasibility. However, there are still some aspects that need to be improved.
In order to visually present the evaluation results of the eco-environmental protection policies in different regions of the YREB, we produced a choropleth map based on the PMC-Index scores of the policies in each province. As shown in Figure 2, regions with lighter colours have higher scores, while regions with darker colours have lower scores. The upstream region generally performs moderately, with Guizhou scoring higher at 7.16 points, and Yunnan scoring at a medium level of 6.13 points. However, Sichuan and Chongqing jointly achieved a lower average level of 5.72 points. In the midstream region, Hunan scored relatively higher at 6.91 points, performing well; Jiangxi also scored at a high level with 6.46 points; while Hubei scored only 5.21 points, indicating that there may be room for improvement in terms of ecological environment protection. In the downstream, Jiangsu and Shanghai scored close to each other in terms of ecological environment protection policies, with scores of 6.49 and 6.46 points, respectively, performing well; Zhejiang scored 5.88 points, which is at a medium level; while Anhui scored the lowest with 4.81 points, indicating that the region may need to take more measures to improve its score in terms of eco-environmental protection. It can be seen that the scores are significantly different in the downstream of the YREB, with uneven performance in ecological environment protection policies. The overall performance in the midstream region is relatively stable, and Hunan performed the best. Guizhou performed well in the upstream region, while Sichuan and Chongqing performed relatively low. The reason for this difference may be due to differences in geographical conditions, economic development status, and other factors in different regions, leading to different policy orientations and policy goals [31].
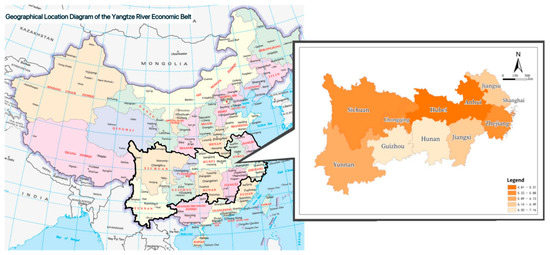
Figure 2.
Choropleth Map of the YREB.
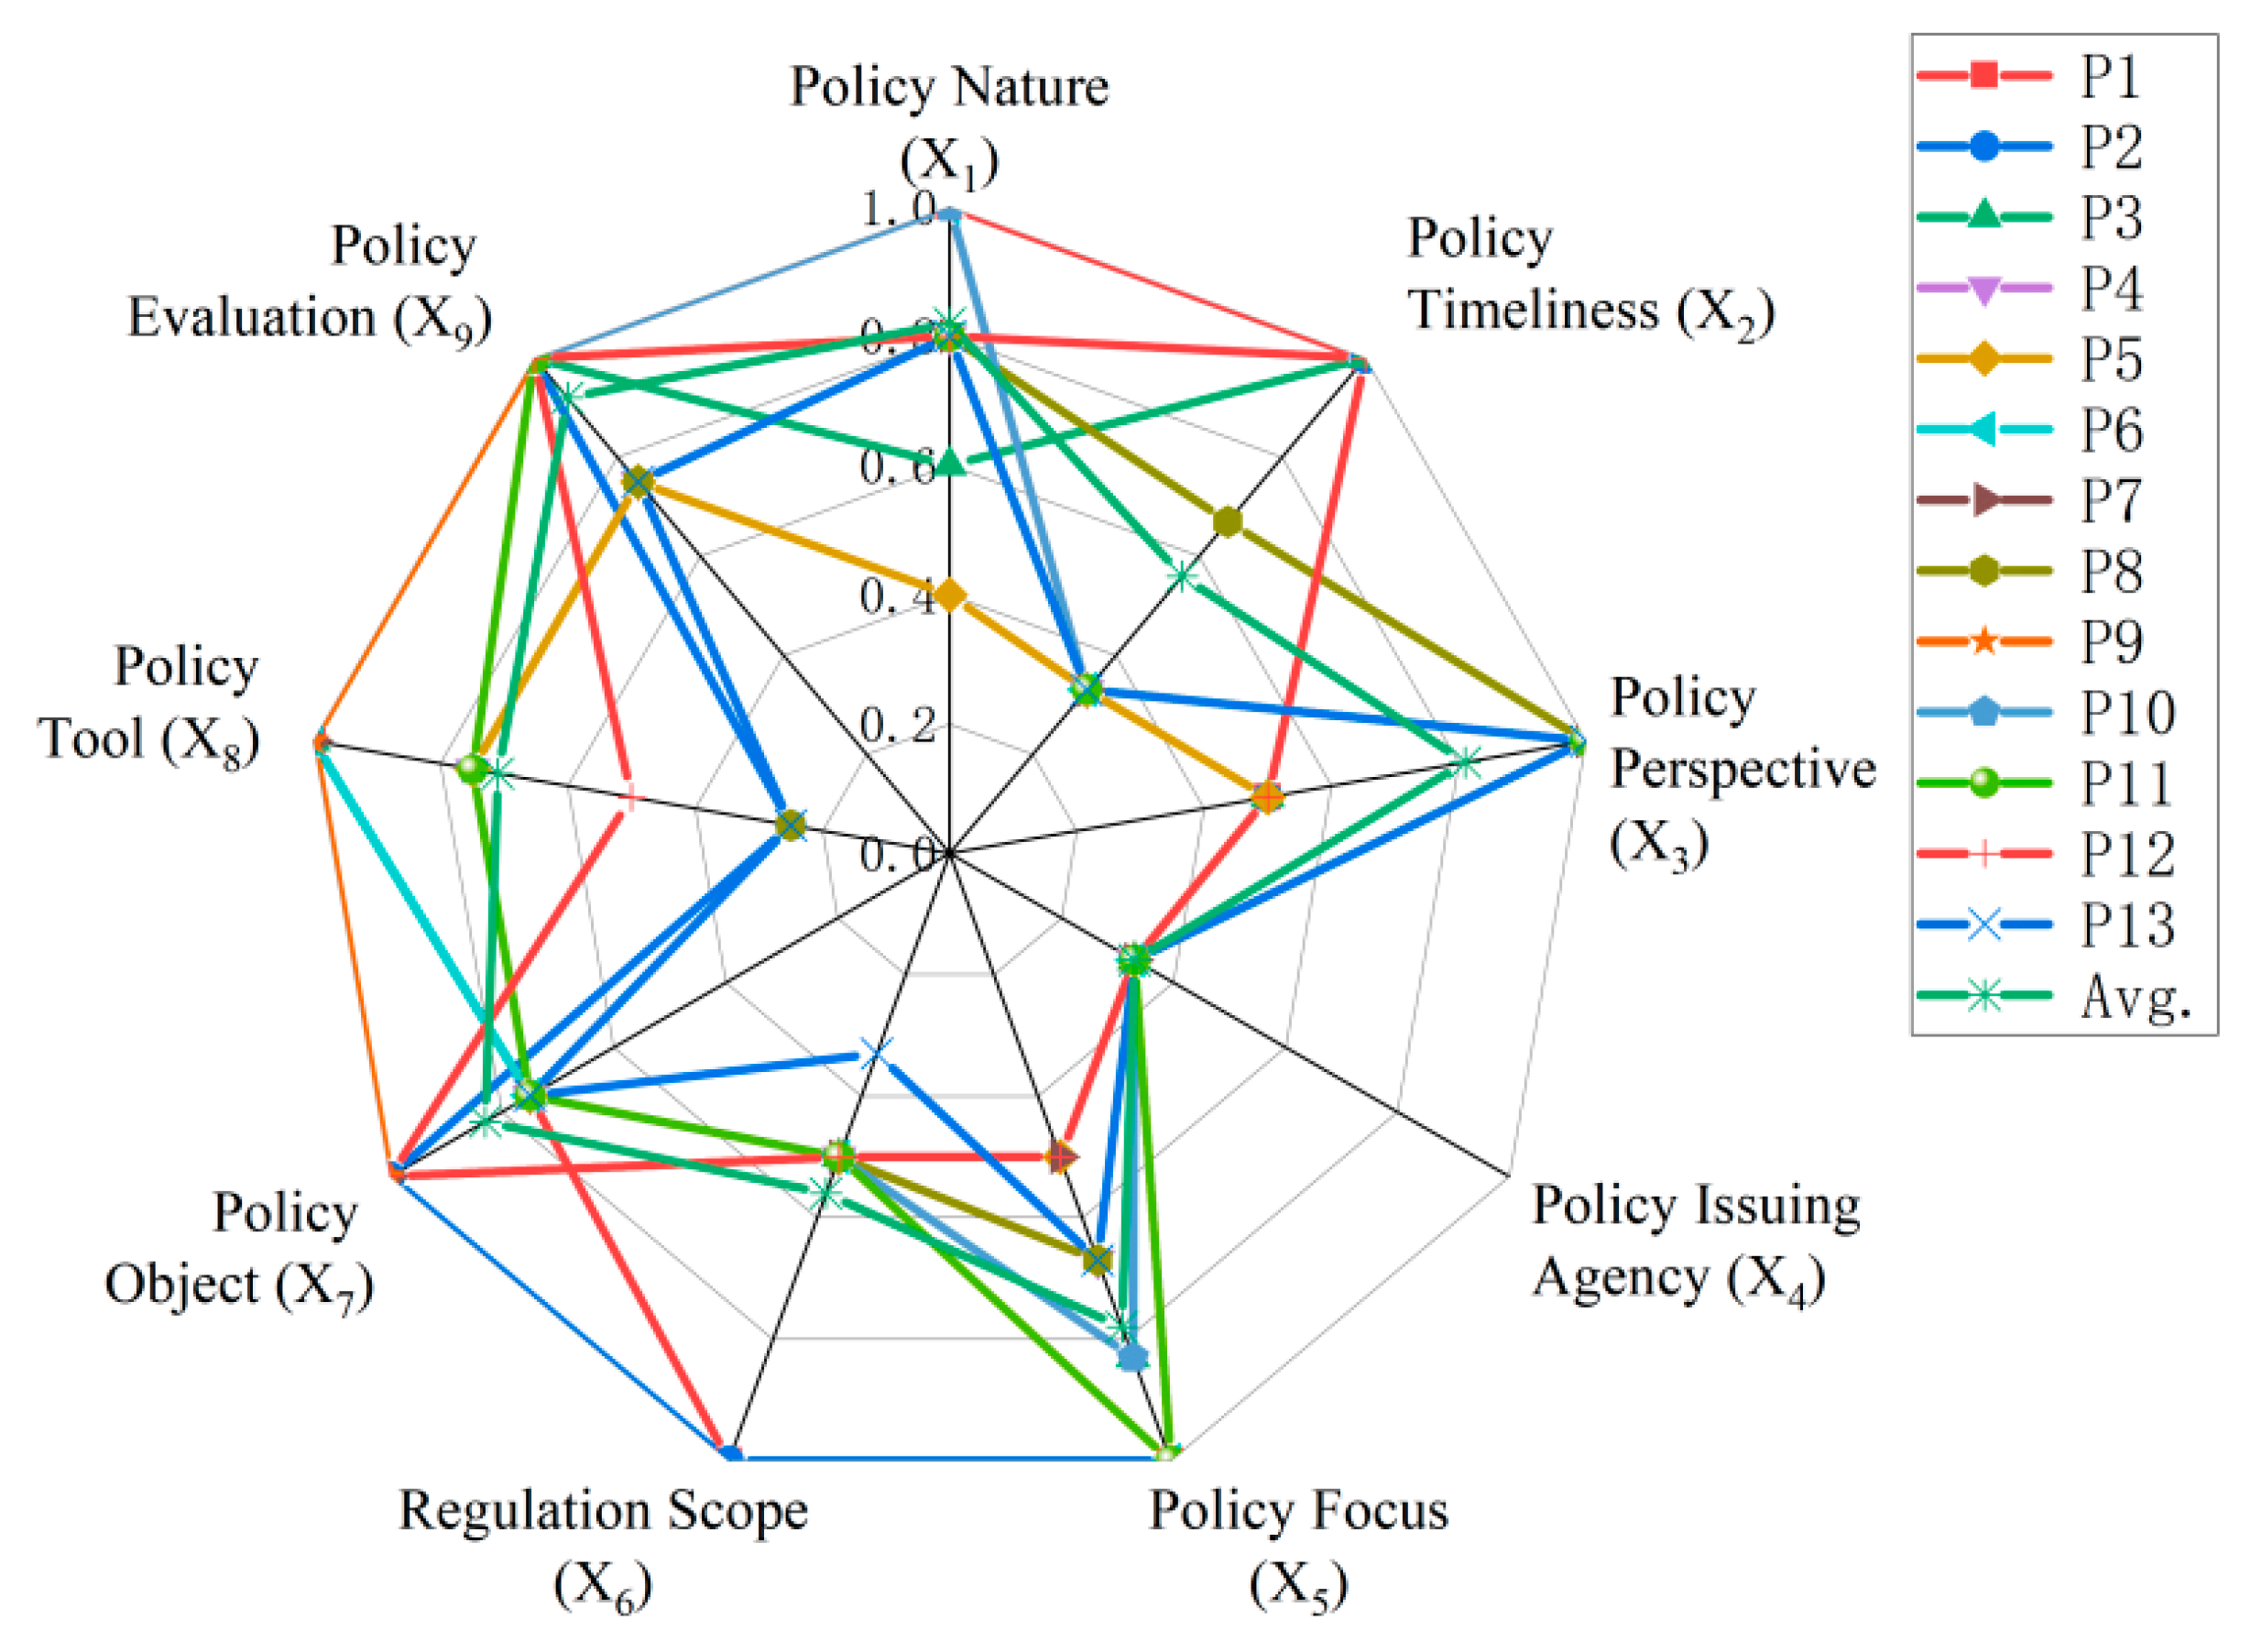
Figure 3 displays a Debra chart that illustrates the average values of the primary variables for the thirteen policies. It intuitively and clearly shows the shortcomings and strengths of the eco-environmental protection policies of the YREB, which is also the direction of future policy improvement. As shown in the figure, the highest average score among the nine primary variables is the X9Policy Evaluation, which is 0.92, indicating that the policies are well grounded, with clear objectives, scientific programs, and informative planning, and that there are no significant shortcomings in the overall framework of the policies. The next are X7Policy Objects and X1Policy Nature, with scores of 0.83 and 0.82. These scores indicate that most eco-environmental protection policies involve multi-party governance, and the role of policy is more comprehensive in terms of the objects. Additionally, these policies are formulated with full consideration of the various factors, making them more comprehensive. The average value of the scores for these nine primary variables is 0.70, and the scores for the variables X2Policy Timeliness, X4Policy Issuing Agency, and X6Regulation Scope are below the mean value. The score of X2Policy Timeliness is 0.56, indicating that the eco-environmental protection policy for the YREB does not integrate short-term, medium-term, and long-term targets organically. Local policies, in particular, tend to focus on setting short-term goals at the expense of long-term ones. The score of X4Policy Issuing Agency is 0.33, which is the lowest among the primary variables. This is because a single policy body generally issues current policies, and the proportion of policies issued jointly by multiple sectors is low. The score of X6Regulation Scope is 0.56, which shows that the current policy regulation scope of the eco-environmental protection policy of the YREB is not unified, and except for three national policies, the rest of the policies do not involve the overall eco-environmental governance of the YREB. The policies are formulated only based on the region in which the provinces are located, which is a lack of wholeness.
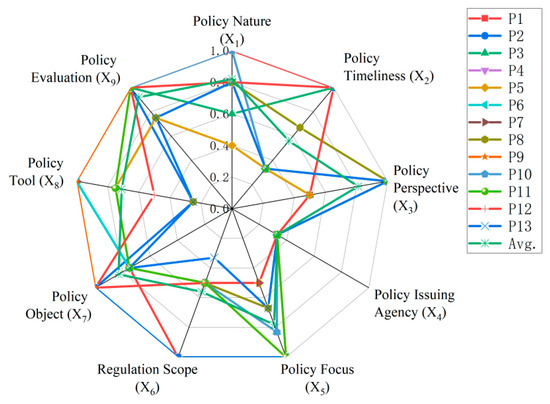
Figure 3.
Debra chart of 13 representative policies.
4.3. Analysis of PMC-Surface for 13 Representative Policies
The scores of each policy-level variable were entered into data analysis software in a 3 × 3 matrix format, and the PMC-Surface maps of the thirteen YREB eco-environmental protection policies were generated using 3D colour mapping surface maps, as shown in Figure 4, Figure 5, Figure 6, Figure 7, Figure 8, Figure 9, Figure 10, Figure 11, Figure 12, Figure 13, Figure 14, Figure 15 and Figure 16.

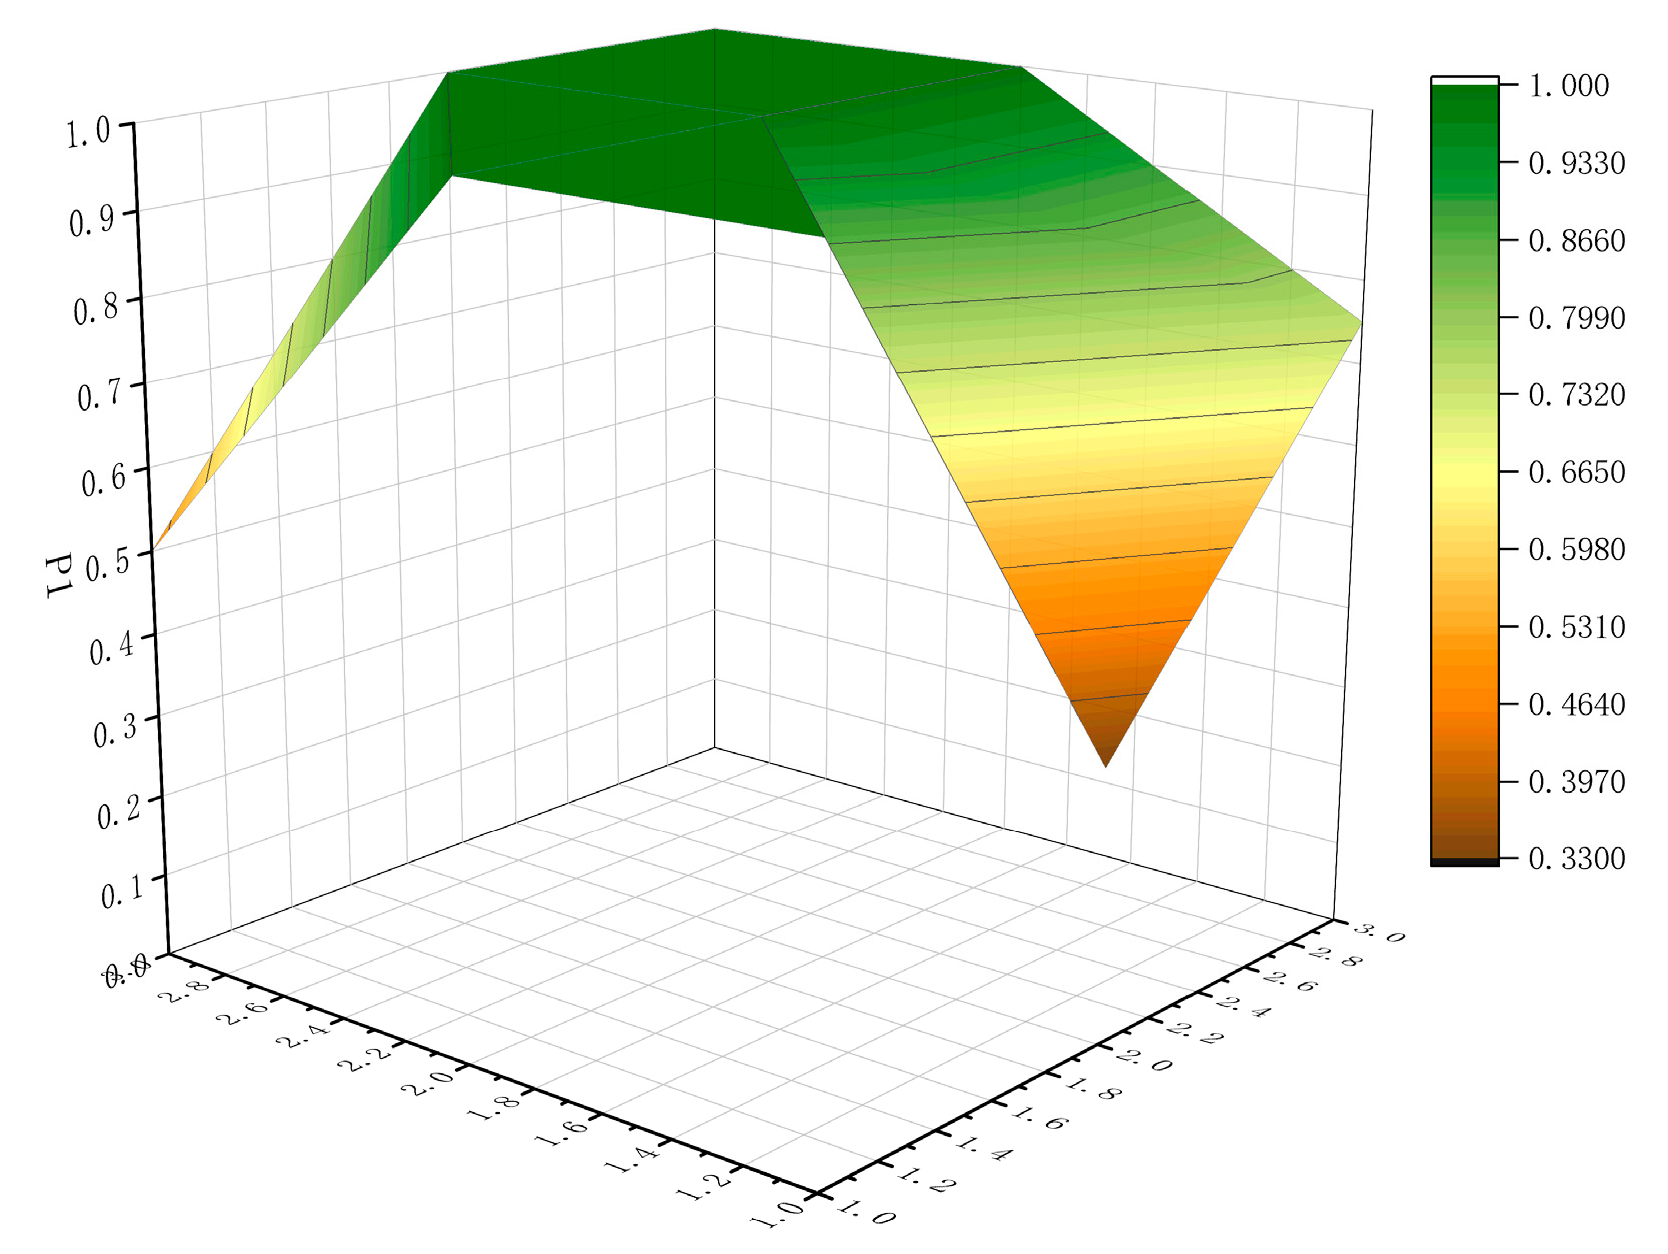
Figure 4.
The PMC-Surface for P1.
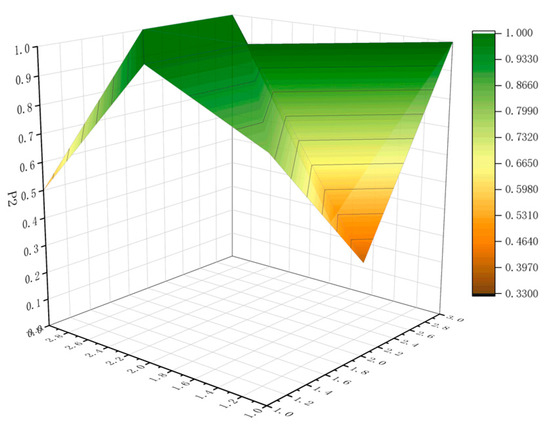
Figure 5.
The PMC-Surface for P2.
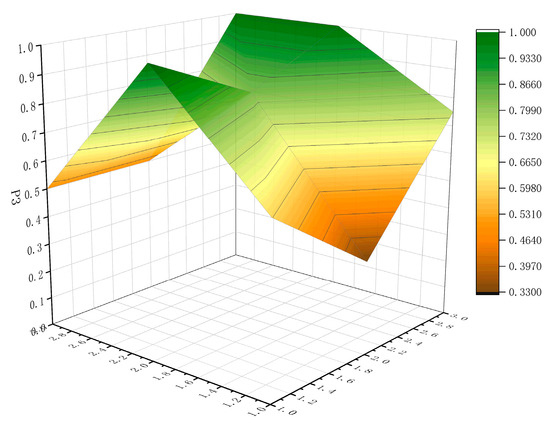
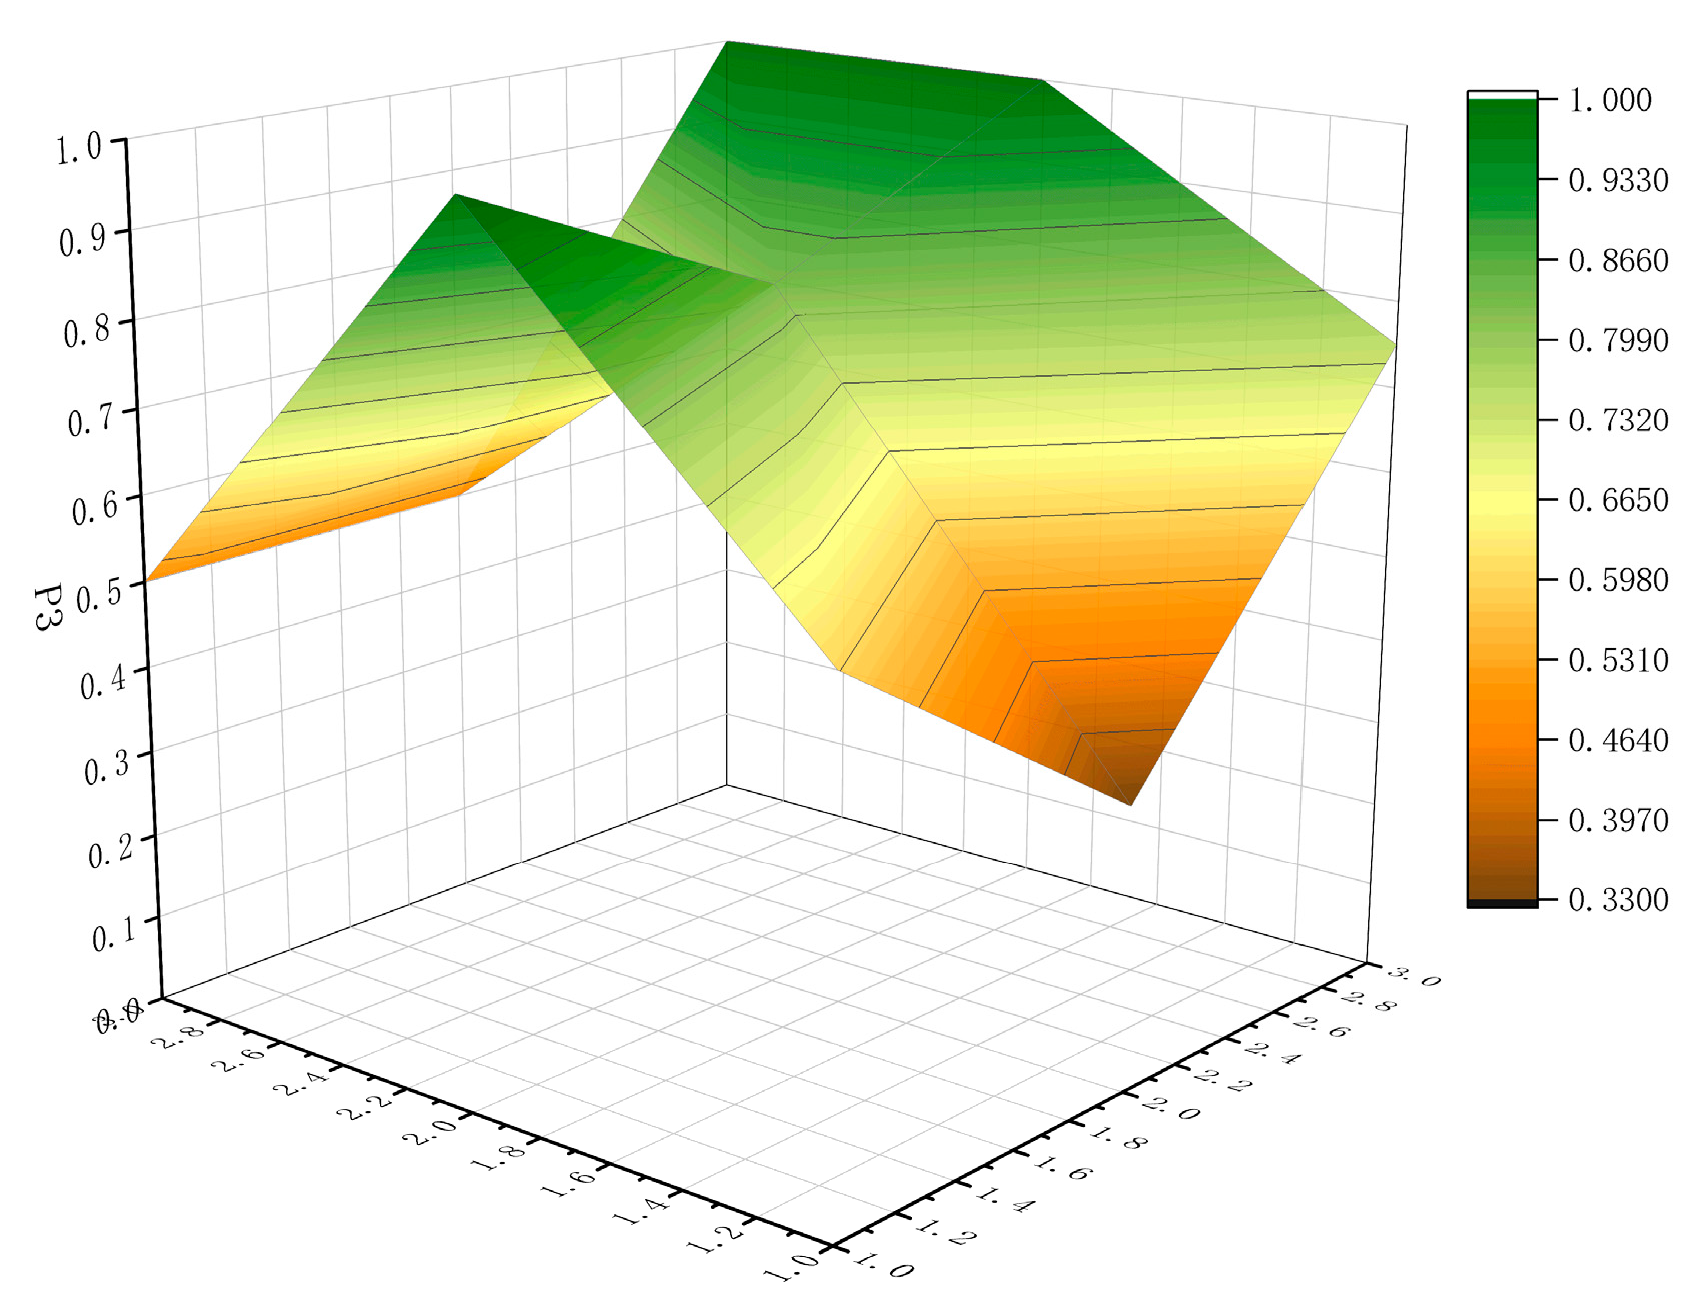
Figure 6.
The PMC-Surface for P3.
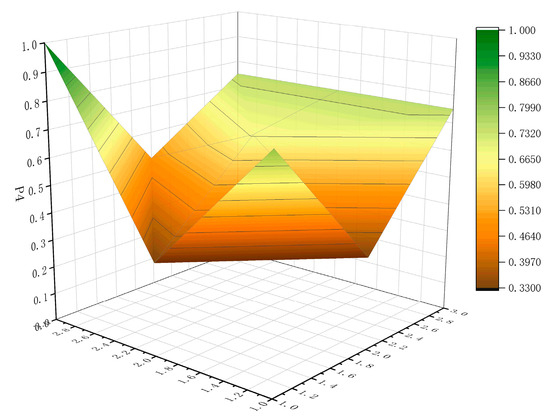
Figure 7.
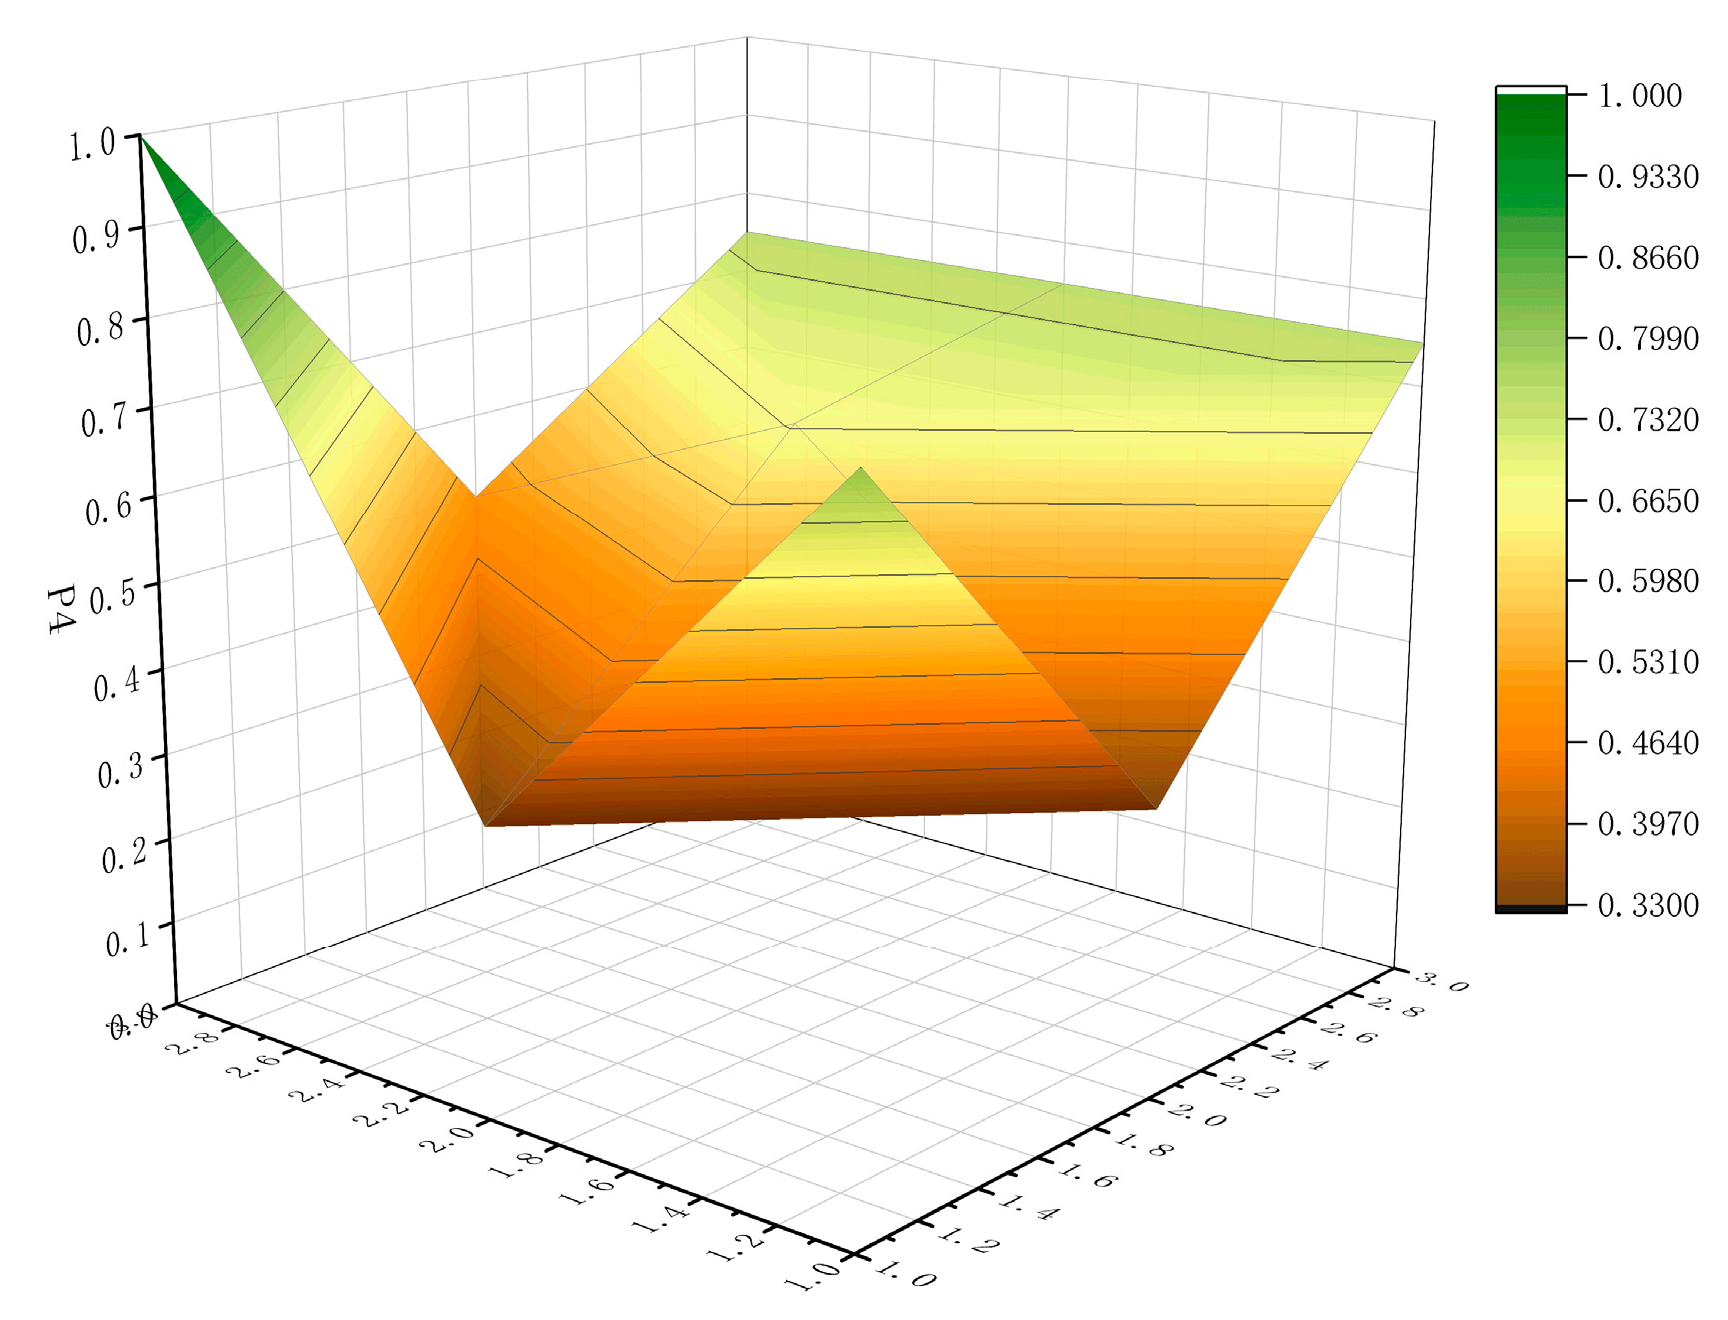
The PMC-Surface for P4.
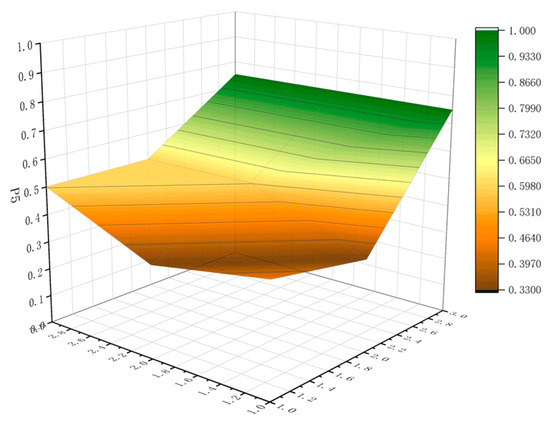
Figure 8.
The PMC-Surface for P5.
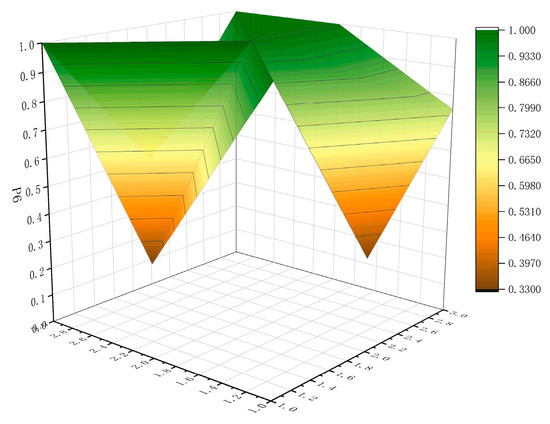
Figure 9.
The PMC-Surface for P6.
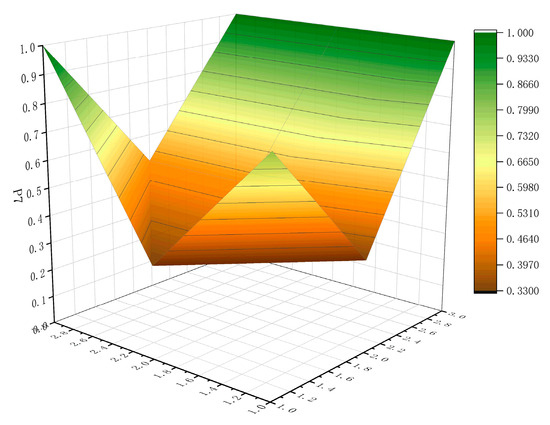
Figure 10.
The PMC-Surface for P7.
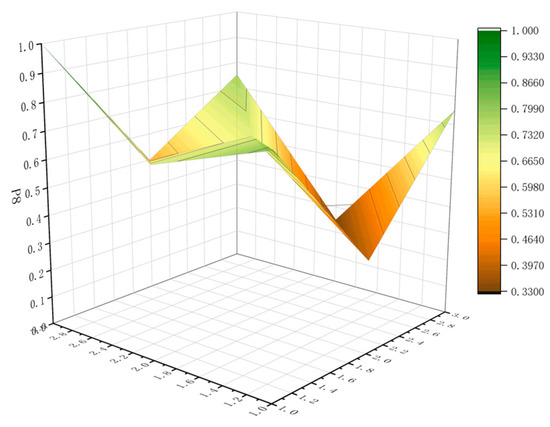
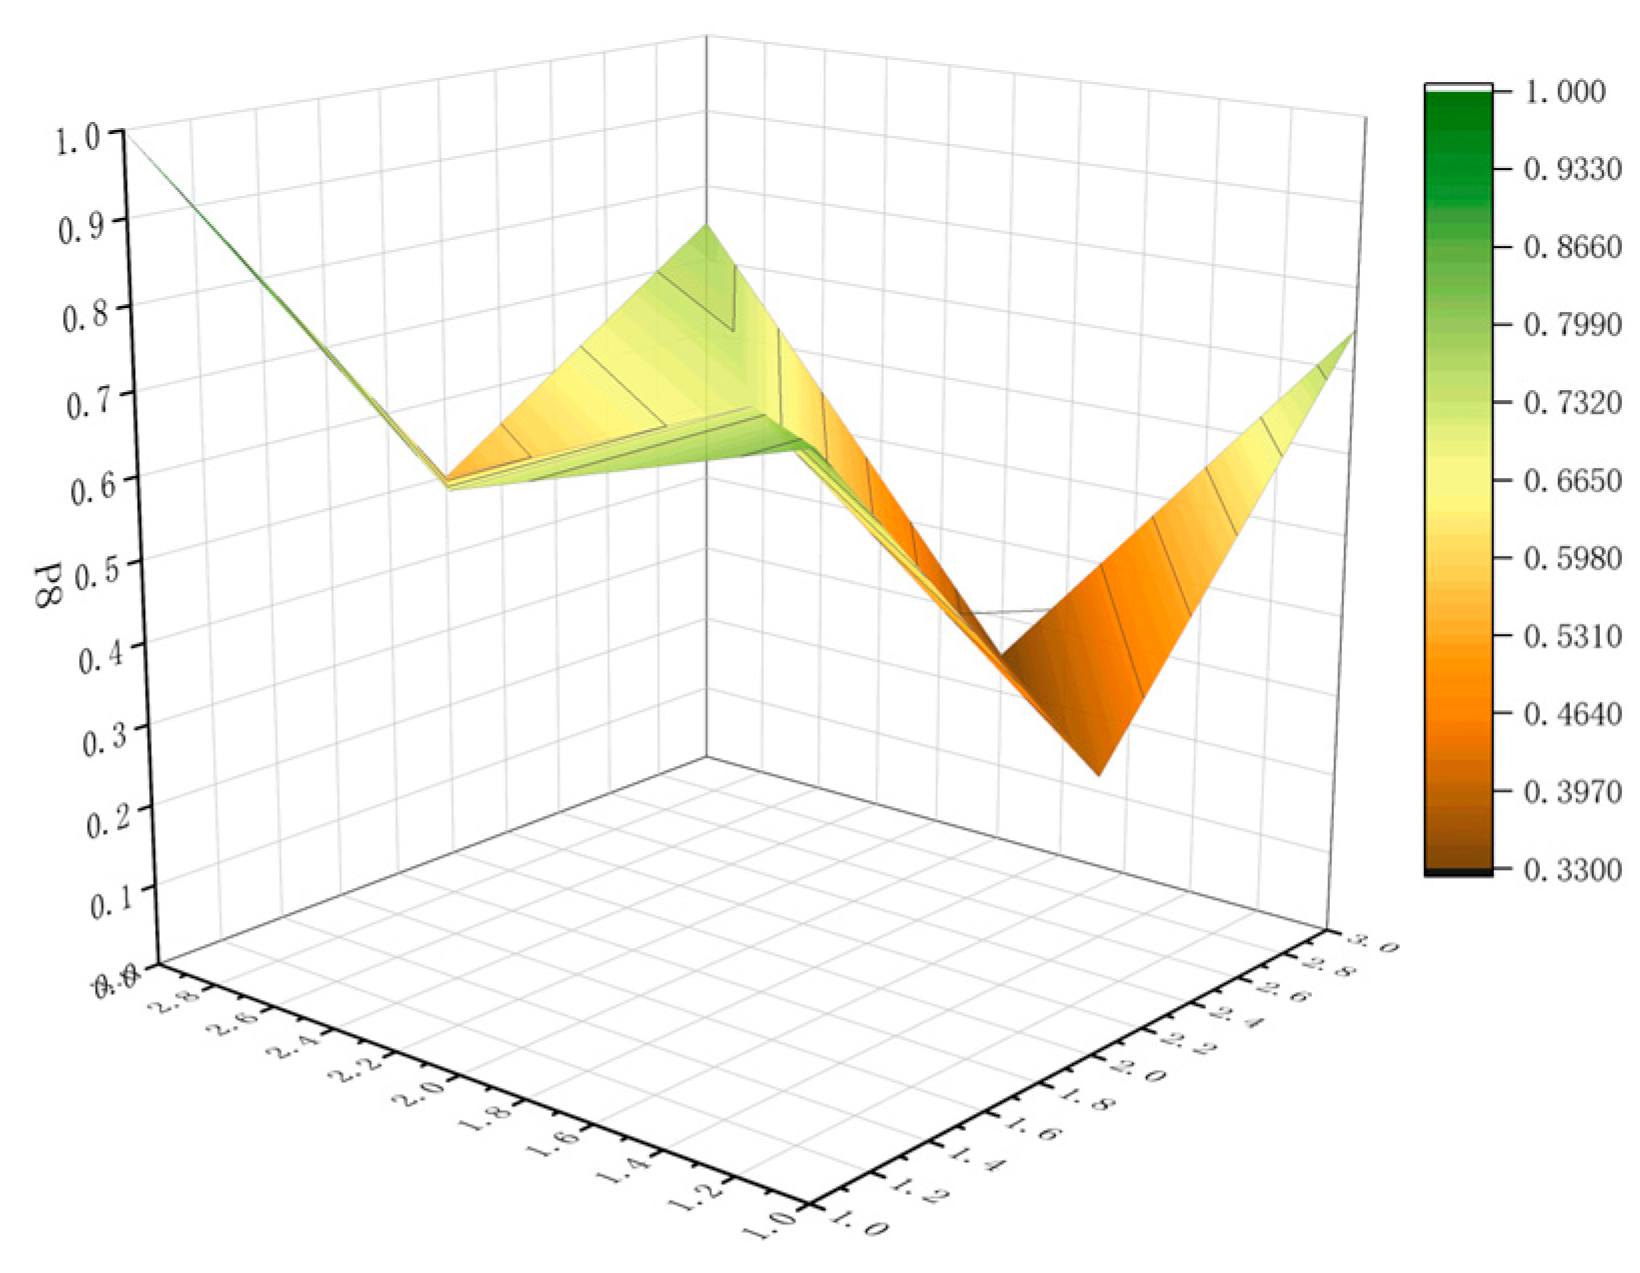
Figure 11.
The PMC-Surface for P8.
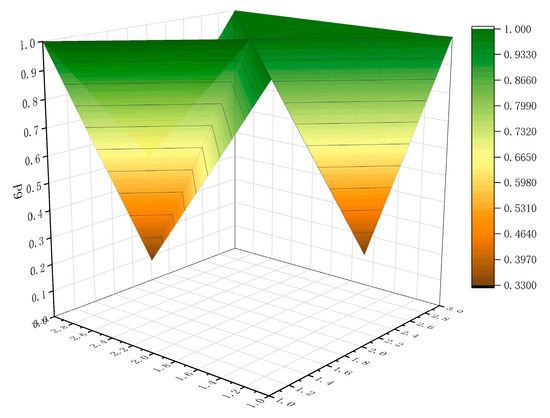
Figure 12.
The PMC-Surface for P9.
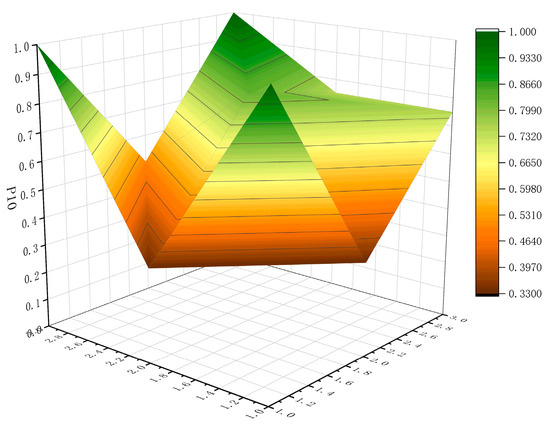
Figure 13.
The PMC-Surface for P10.

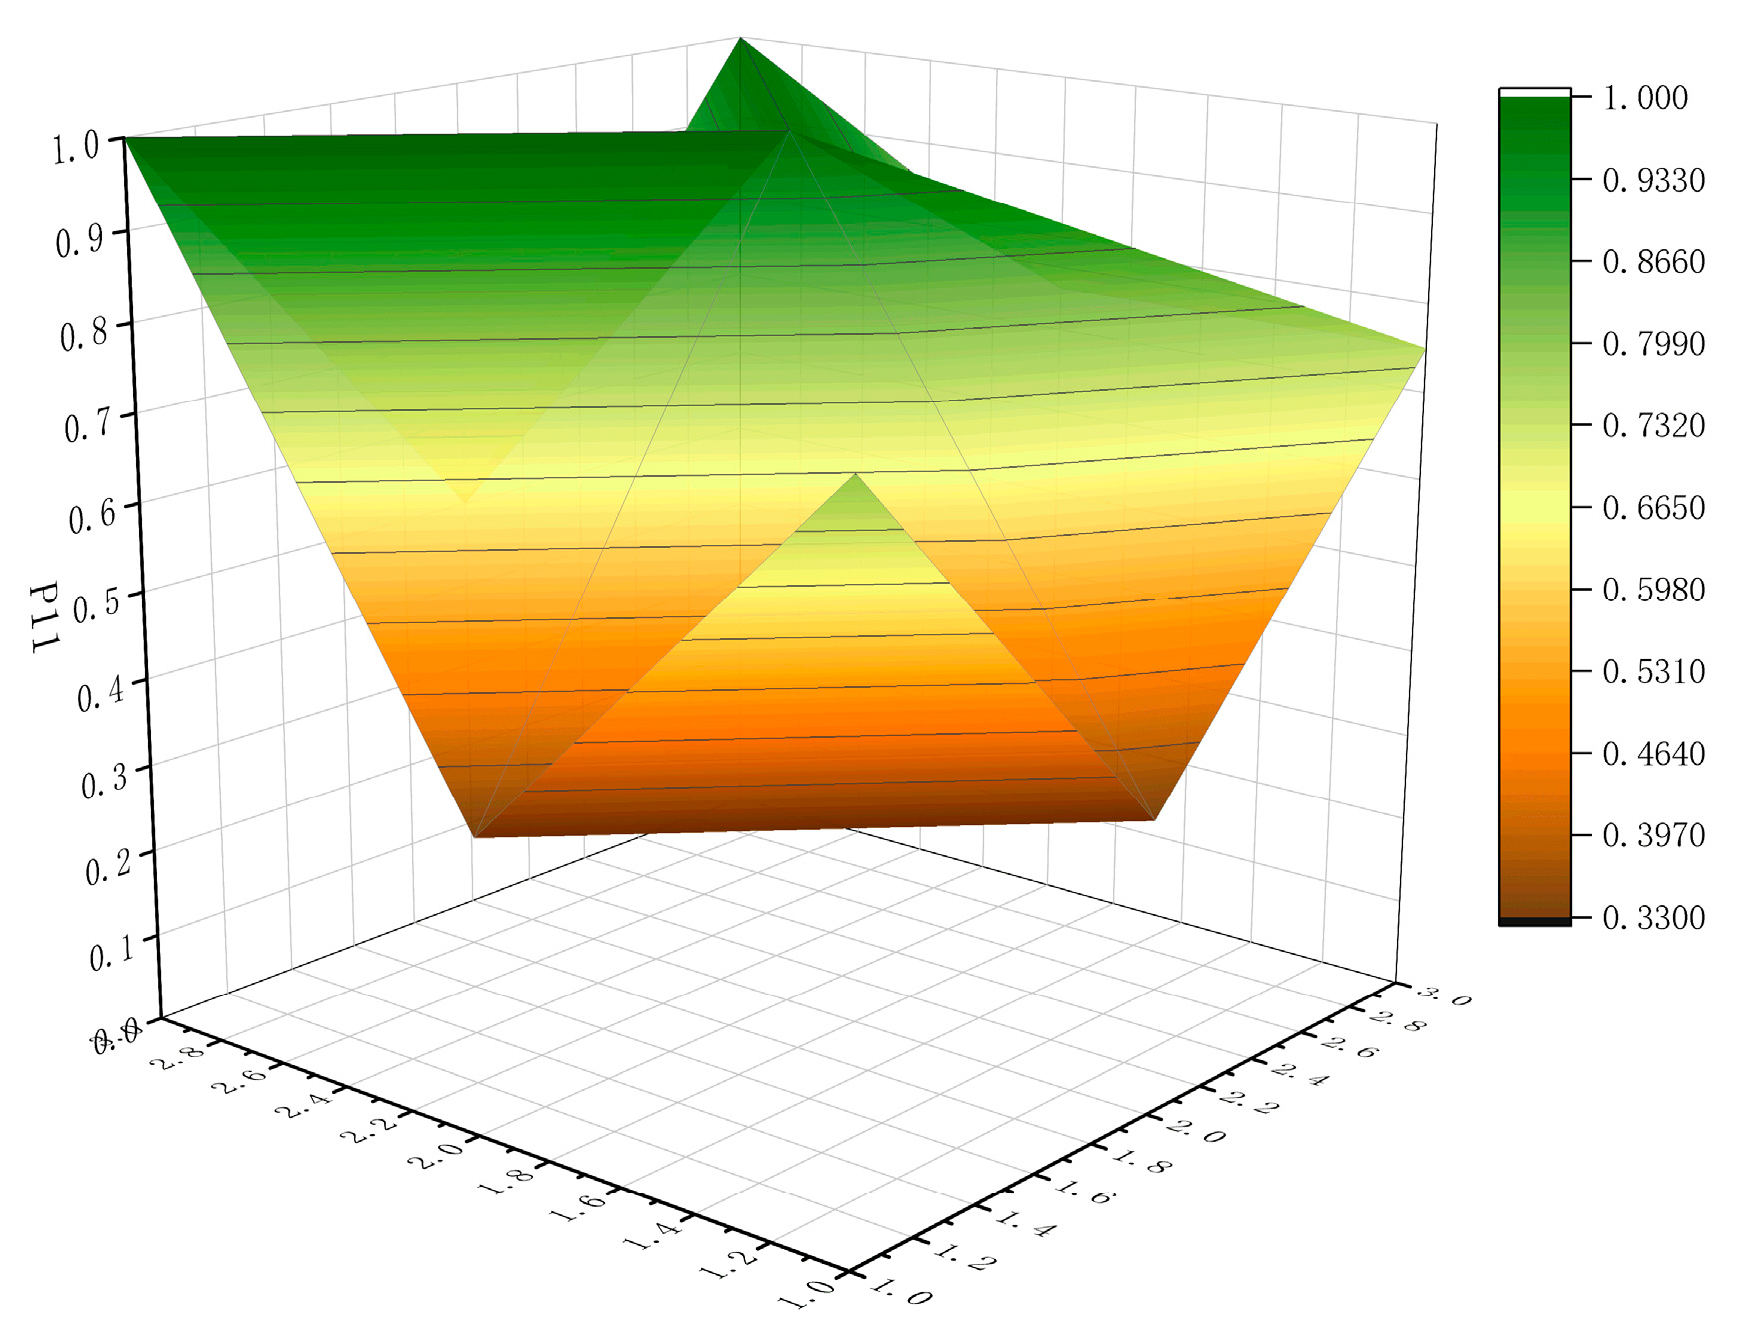
Figure 14.
The PMC-Surface for P11.
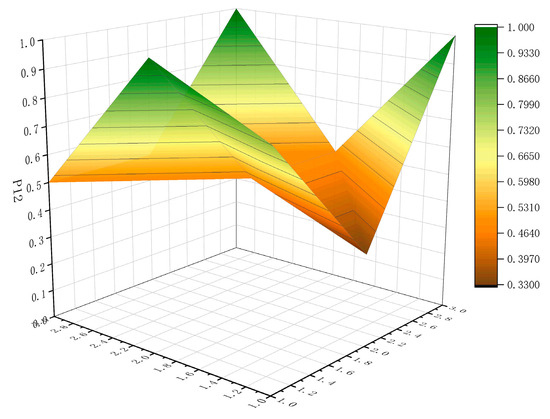
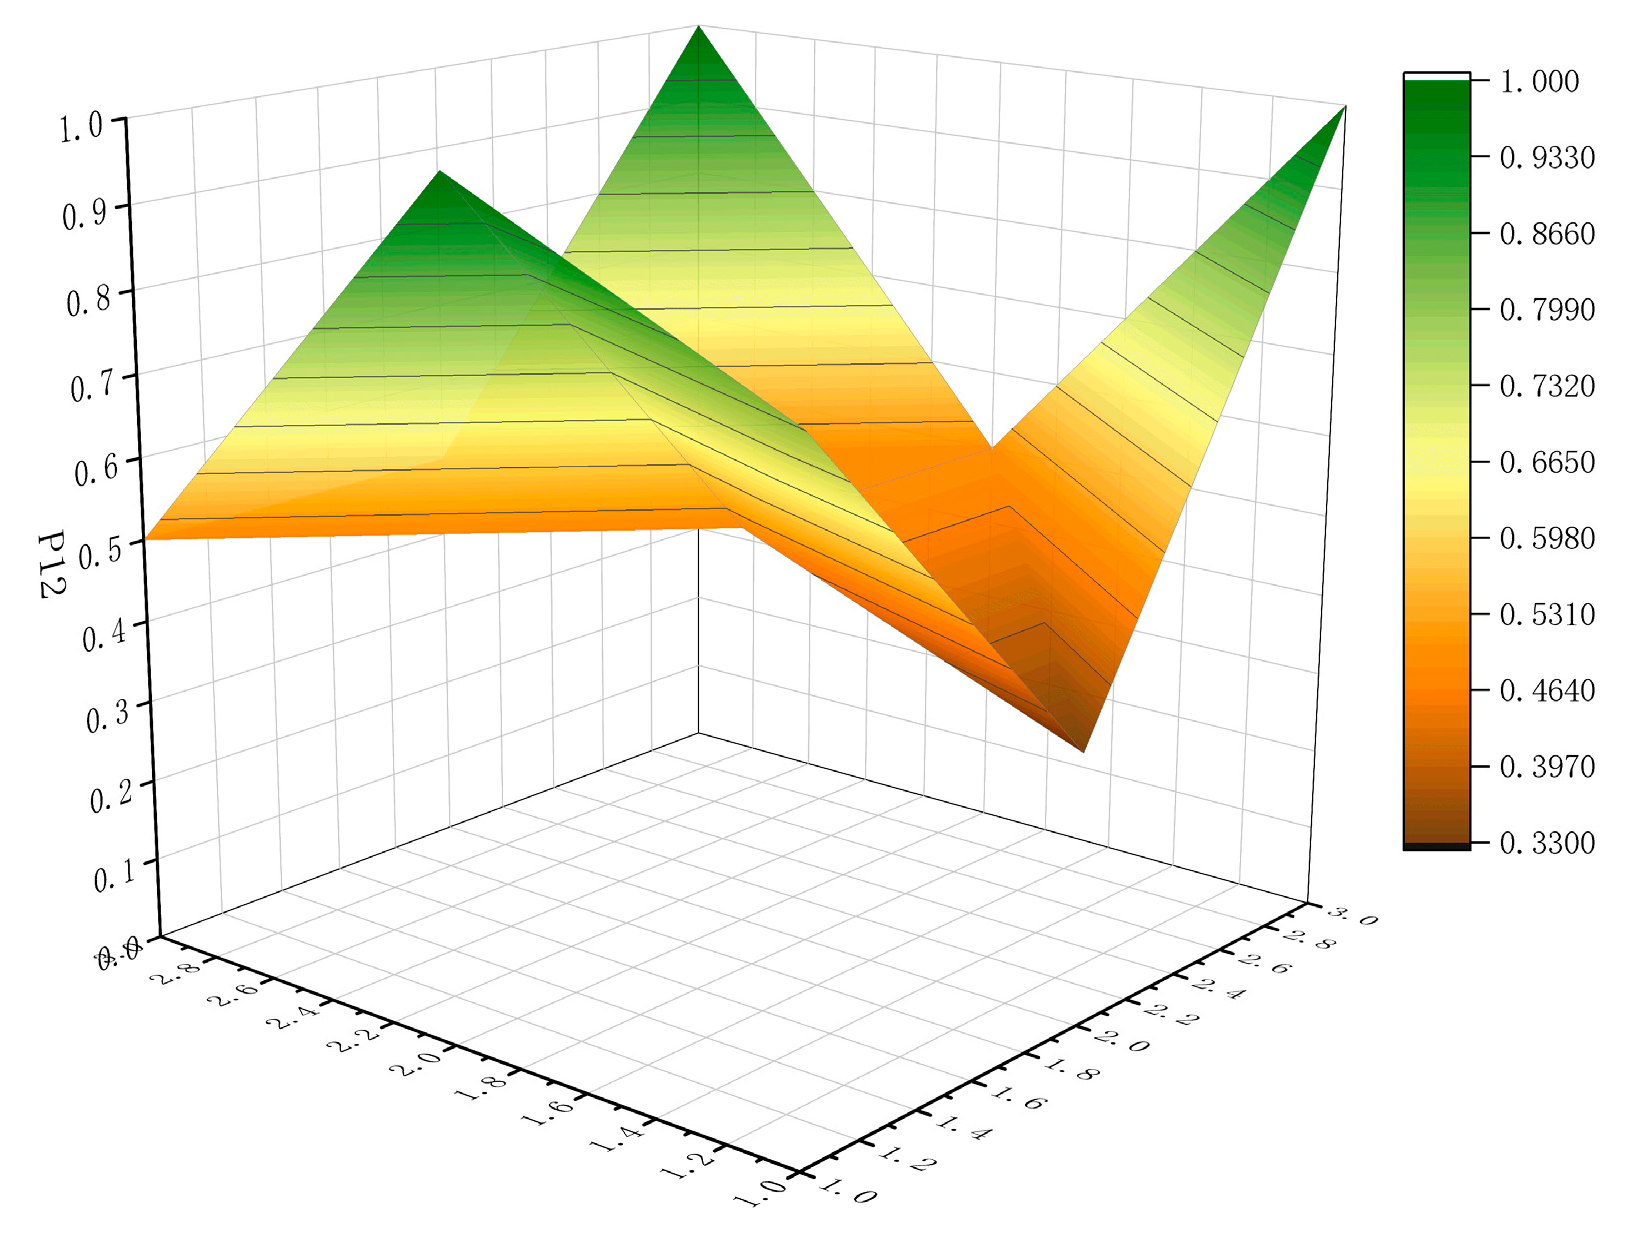
Figure 15.
The PMC-Surface for P12.

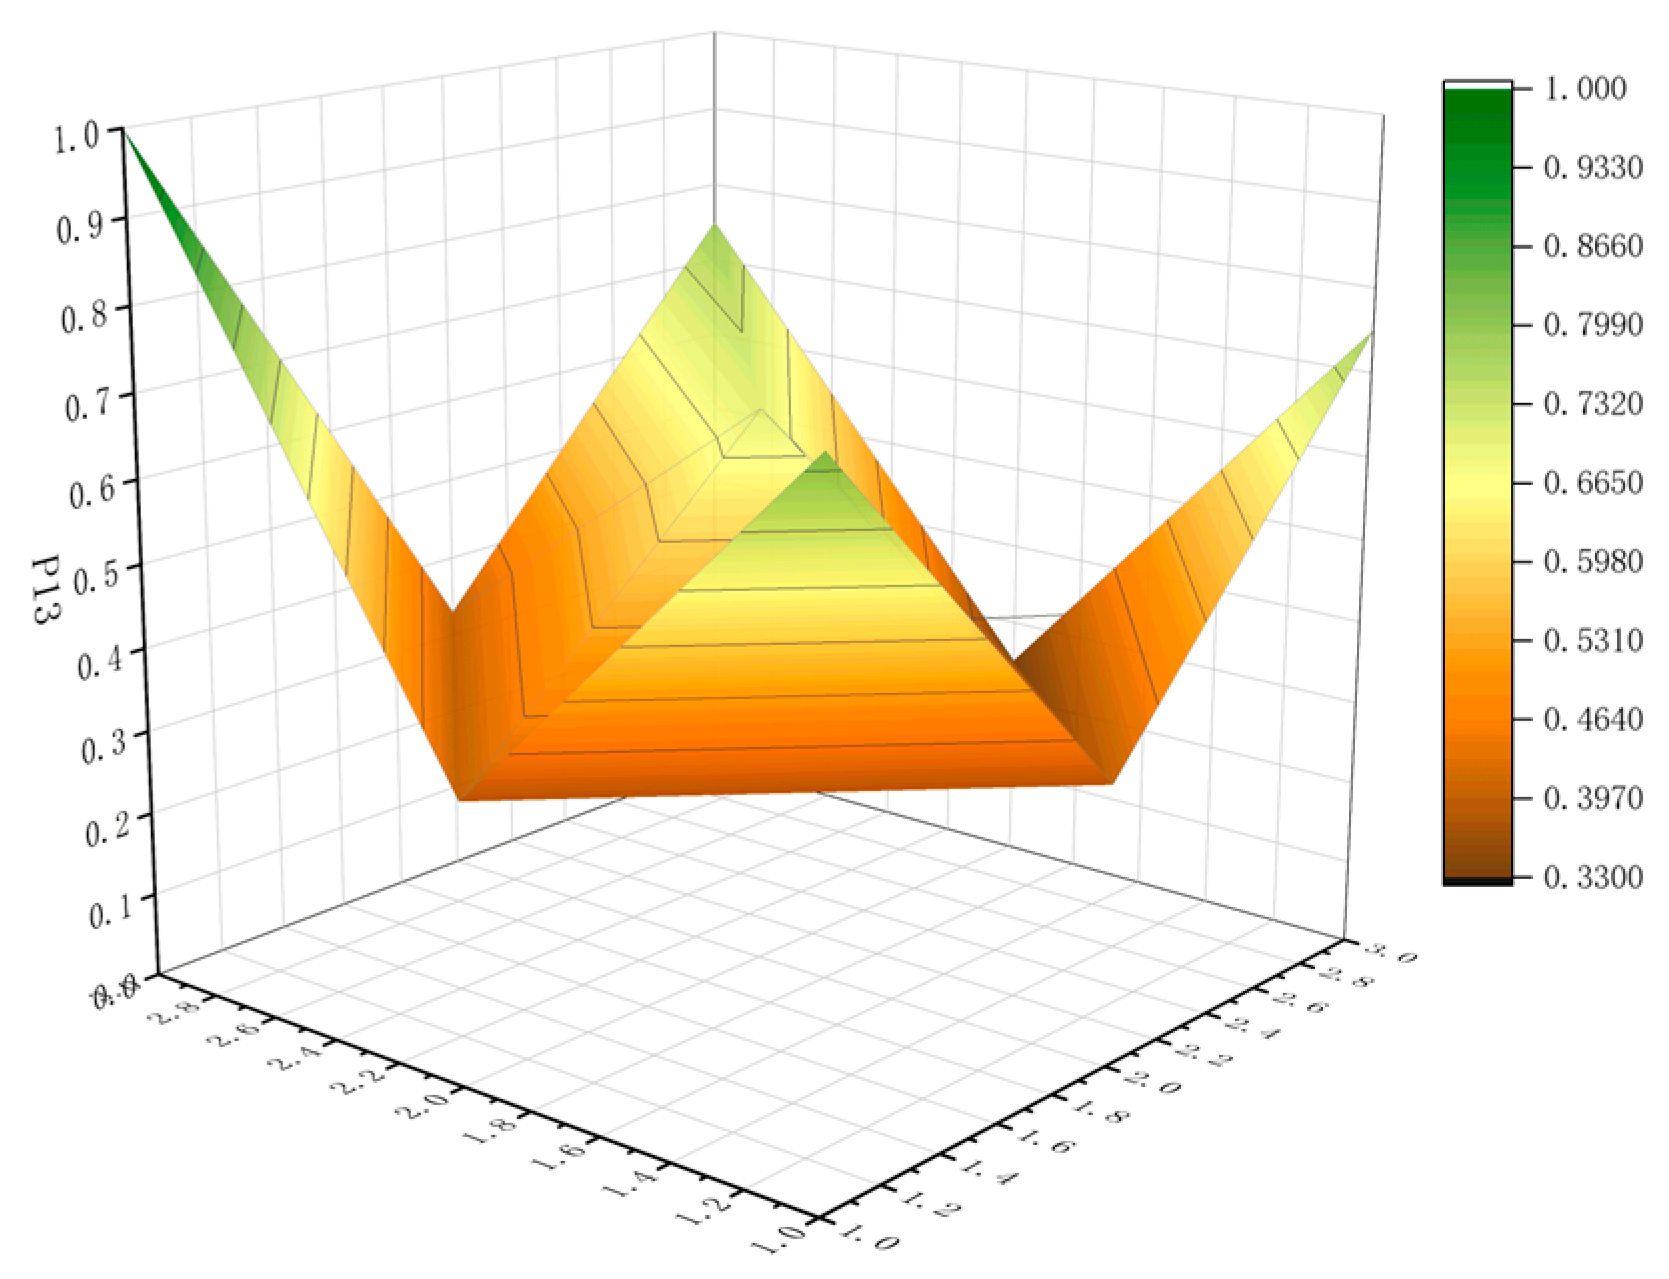
Figure 16.
The PMC-Surface for P13.
The different colours in the figures represent the policy’s score on the corresponding level 1 indicator, with a raised portion indicating that the policy scored higher on the corresponding level 1 indicator and a concave portion indicating that the policy scored lower on the corresponding level 1 indicator. The overall position of the surface is high or low, representing the overall quality of the policy. In contrast, the degree of undulation of the surface presents the level of internal consistency of that policy [33].
P1 has a PMC-Index of 7.58 and is ranked 1st with an “Excellent“ assessment level. Jointly formulated by the highest authority of the State Environmental Protection Department, the policy was taken as a master plan and guideline for eco-environmental protection in the YREB. The scores of X1Policy Nature, X5Policy Focus, X6Regulation Scope, X8Policy Tool, and X9Policy Evaluation of this policy are all full marks or above average, which shows that the policy is scientifically designed, rationally planned, and highly enforceable. The executability of a policy is crucial to determining its effectiveness [34]. However, the indicator scores for X3Policy Perspective and X7Policy Object are lower than the average in this policy. As an overarching policy at the national level, P1 only needs to propose a master plan from a macro perspective and does not need to be refined for specific tasks and implementation subjects. In their research on the policy, Wang et al. [35] pointed out that the top-level design and strategic deployment of the Ministry of Ecology and Environment have provided direction for the actions of the 11 provinces (municipalities) along the Yangtze River Economic Belt. Subsequently, the 11 provinces (municipalities) have gradually introduced corresponding local plans and implementation plans based on their strategic positions and ecological needs in the YREB, which is consistent with the results of this study.
P2 has a PMC-Index of 6.88 and is ranked 4th with an “Excellent“ assessment level. This policy serves as a working guide for further actions to develop the YREB. According to the assessment, the X3Policy Perspective and X8Policy Tool scored below average. P2 is a macro policy, and the content covered by the policy includes various aspects such as economic development, transportation, ecological protection, and town construction. Hence, as a part of the policy text, the eco-environment only presents the general guidance issued by the State Council and does not refine the work from a micro point of view. Liu [36] pointed out that the policy established a major strategy for regional development centred on the Yangtze River Basin, which had a macro-guiding significance. The macro policy aims to intervene and manage the areas involved in the policy from a comprehensive perspective, sometimes demonstrating less specific features [37]. Meanwhile, the financial subsidy mentioned in the policy text relates only to the construction of road transportation and shipping in the YREB, which does not include eco-environmental management. Therefore, the indicator optimisation path for this policy is proposed to be X8–X3.
P3 has a PMC-Index of 6.51 and is ranked 5th with an “Excellent“ assessment level. This policy gives instructions on improving the ecological functions of essential lakes in the YREB during the 14th Five-Year Plan period. In particular, X1Policy Nature, X3Policy Perspective, X6Regulation Scope, and X7Policy Objects scored below average. Since the policy takes a micro view and looks at the lake issues in the YREB and does not provide guidance on other issues in the basin, the scope of governance should not only encompass the overall situation but also pay attention to specific problems in subdivided areas [38]. The planning of P3 on the scope of governance seems more general, and there is no task target by region. Suggested paths for metrics optimisation can be found in X3-X1-X6-X7.
P4 ranked 10th with a PMC-Index of 5.88 and an “Acceptable“ assessment level. This policy is an action plan based on the relevant requirements of the Action Plan for Environmental Protection of the YREB issued by the Ministry of Environmental Protection and the Implementation Program for the Participation in the Construction of the YREB of Zhejiang Province. The scores of X2Policy Timeliness, X5Policy Focus, X6Regulation Scope, X7Policy Objects, X8Policy Tool, and X9Policy Evaluation are all below average. As a short-term action plan at the provincial level, the regulation area covered by the policy is only part of the YREB within Zhejiang Province. However, even short-term policies should focus on their continuity and stability, as well as put forward policy expectations [39]. P4 does not reflect these aspects, and the plan’s content only proposes the desired goals, with a lack of specific operational programs. Therefore, the suggested path for metric optimisation is X2-X5-X6-X7-X9-X8.
P5 has a PMC-Index of 4.81 and is ranked 13th with an “Acceptable“ assessment level. This policy has been assessed as equal to or below the average for each of the primary indicators. Since the Department of Transportation is a subordinate department of the Anhui Provincial Government, the policy focuses mainly on transportation. The policy perspective is the eco-environmental protection and green development of waterways in the YREB, which is a relatively single perspective. Policy formulation is based on the summary of the work completed in the current field [40]. P5 lacks a description of what has been accomplished and a targeted plan based on it. However, this policy simply offers methods and guidance without reflecting the expected ultimate goal and effect, leaving much room for improvement. Its metrics optimisation path can be X1-X6-X3-X2-X7-X6-X9-X8.
P6 has a PMC-Index of 6.91 and is ranked 3rd with an “Excellent“ assessment level. P6 is a policy with solid synergy to provide specific guidance on ecological restoration in the Yangtze River Basin. The scores for X2Policy Timeliness, X6Regulation Scope, and X7Policy Objects are below average. The policy was developed in 2023, remains in effect until the end of 2025, and is a short-term plan. As the policy is based on the holistic nature of the ecosystem of the Yangtze River hinterland and the systematic nature of the “One River, One Lake, Four Waters” watershed, it does not involve other watershed segments. Furthermore, the critical role of social organisations has been overlooked in implementing the programme. Social organisations constitute the cornerstone and backbone of the social structure; therefore, it is necessary to include them in planning during policy formulation [41]. The suggested path for optimising the metrics is X2-X7-X6.
P7 has a PMC-Index of 6.46 and is ranked 7th with an “Excellent“ assessment level. This policy clarifies the responsibilities and tasks of Jiangxi Province in the work of eco-environmental protection of the YREB in the new period. In particular, X2Policy Timeliness, X5Policy Focus, and X6Regulation Scope scored below average. The policy was issued by the Jiangxi Provincial Government in 2018, and its target was partially realised in 2018 and partially required to be realised by the end of 2020, which is a short-term policy. In a policy text, it is necessary to include all aspects within the policy field to ensure that the policy achieves its full effectiveness [42]. However, P7 lacks planning for water resource management, natural disaster prevention and control, and ecological compensation mechanisms, so that the policy focus is incomplete. Therefore, the metrics optimisation path for this policy is proposed as X5-X2-X6.
P8 has a PMC score of 5.72 and is ranked 11th with an “Acceptable” assessment level. This policy is the only one of the six local representative policies jointly issued by the provincial governments. It relies on the geographical location advantage of Chongqing Municipality’s proximity to Sichuan Province, where the two provinces have explored the possibility of collaborative ecological and environmental governance in the YREB. The scores for X5Policy Focus, X6Regulation Scope, X7Policy Object, X8Policy Tool, and X9Policy Evaluation are all below average. As the action plan given by P8 contains various areas besides the eco-environment, it also involves platform building, industrial collaboration, market integration, and public services. As a result, the policy does not fully utilise the policy tools. The efficiency of collaborative governance between departments in the public sector depends on the clear division of powers, which is determined by the unique public, political, and democratic characteristics of the sector [43]. However, there is no specific implementation plan for the eco-environment protection program in P8, and there is a lack of clarity in the division of competencies between the various sectors. Its metrics optimisation path is X8-X9-X5-X6-X7.
P9 has a PMC-Index of 7.16, with an “Excellent“ assessment level and ranked 2nd. P9 is a guiding policy that sets out a specific action plan for ecological restoration of the upper reaches of the Pearl River and Yangtze River. Among them, only X2Policy Timeliness and X6Regulation Scope scored below average. Since the policy was designated by Guizhou Province in 2019, the time required to achieve the policy tasks is by the end of 2020, which is a short-term policy. The scope covered by the policy is the upstream region of the YREB. To achieve greater policy effectiveness, it is essential to consider local objectives within the overall context. When addressing specific issues, the policy should take into account the importance of overall sustainable development goals [44]. Therefore, the suggested path for optimising the metrics is X2-X6.
P10 has a PMC-Index of 6.49, with an “Excellent“ assessment level and is ranked 6th. This policy is the overall action guideline for the province under the guidance of P1. Among them, the scores of X2Policy Timeliness, X6Regulation Scope, and X7Policy Object are lower than the average. The objectives proposed in this policy require completion by the end of 2020 and are short-term policies. As P10 does not involve mandatory means such as administrative orders, the policy implementation strength and voluntariness may decrease. Wang et al. [45] also reached a similar conclusion when studying the eco-environment problems in the YREB in Jiangsu Province, that is, the remediation of ecological environment problems requires the use of coercive measures. Therefore, the recommended path for optimising the indicators of this policy is X2-X7-X6.
P11 has a PMC-Index of 6.46, with an “Excellent“ assessment level and is ranked 7th. This policy is a plan for the ecological restoration of the Yangtze River Basin over the next three years, issued by Shanghai Municipality. Shanghai is located at the estuary of the Yangtze River, and this policy is of great significance. Among them, the scores of X1Policy Nature, X2Policy Timeliness, X6Regulation Scope, and X7Policy Object are lower than the average. It can be seen that the policy planning of P11 is not perfect, and the lack of policy feedback makes the policy lack sustainable motivation, while the policy object does not reflect the important role of social organisations in an international metropolis. Zhou et al. [46] analysed the main advantages and disadvantages of Shanghai’s ecological community construction when doing the exploration. They pointed out that the construction of the community depends on multi-party cooperation, in which social organisations should play their role. This is in line with the conclusions drawn in our study. The optimisation path of the indicators for this policy can refer to X2-X7-X6-X1.
P12 has a PMC-Index of 6.13, with an “Excellent“ assessment level and is ranked 9th. This policy is a special action plan under the overall eco-environmental protection plan promulgated by Yunnan Province. Among them, the scores of X1Policy Nature, X3Policy Perspective, X5Policy Focus, X6Regulation Scope, and X8Policy Tool are lower than the average. As the focus of this policy is on the protection of aquatic organisms, it basically does not involve other aspects of ecological environment protection, so the policy text is relatively thin. However, P12 has a comprehensive policy design for the protection of aquatic organisms, and other regions can learn from this policy in this field. Wang et al. [47] pointed out that the upstream of the Yangtze River is the area where rare fish are concentrated, and Yunnan Province is located at an important position in the upstream region of the Yangtze River. Therefore, Yunnan Province must formulate aquatic biological protection policies. The optimisation path of the policy indicators can refer to X3-X5-X8-X9-X6-X1.
P13 has a PMC-Index of 5.21, with an “Acceptable“ assessment level and is ranked 12th. This policy provides guidance and deployment for eco-environmental protection and lake water ecological protection in Hubei Province of the YREB. Among them, only the score of X3 Policy Perspective is higher than the average. As a programmatic document for eco-environmental protection in Hubei, P13 only proposes the key points of work in the policy text, without a detailed division of labour. Water resources management, biodiversity protection, and ecological compensation mechanisms are not covered in the policy. Zhang [48] conducted research on the ecological construction issues in the Hubei section of the YREB. She pointed out that as the province with the longest runoff mileage of the Yangtze River, Hubei is facing prominent contradictions between water supply and demand, serious water pollution, and deterioration of water ecology. Therefore, it is particularly critical to take corresponding measures at the policy level to achieve regulation. Therefore, the recommended optimisation path for the indicators of this policy is X8-X2-X6-X9-X5-X7-X1.
5. Discussion
By further summarising the PMC index analysis results on the thirteen representative policies in the YREB from Chapter 4, we can discuss the findings of this study. From the perspective of comprehensive policy effectiveness, the results of the analysis show that the representative policies selected in this study can play an effective role. This is consistent with previous research, which shows that the policies are formulated to consider the actual implementation effect, and the ecological environment protection in the Yangtze River Basin has been paid full attention to [49]. From a macro-regional perspective, policy effectiveness varies across different regions within the YREB. In the upper reach region, Guizhou Province exhibits more prominent policy effectiveness, while Sichuan Province and Chongqing show relatively lower effectiveness. The middle reach region demonstrates relatively stable performance overall, with Hunan Province yielding the most significant effect. There are great differences in the effectiveness of policies in the downstream areas, and the effects of eco-environmental protection policies are different. The formation of such differences may be due to regional disparities in geographic conditions and economic development, leading to divergences in policy direction and objectives. The trend of policies is often determined by economic development and location factors. Geographical conditions and economic development significantly impact the demand for environmental policies [50]. The combination of multiple factors, such as economic development stage, resource endowment, and geographical environment characteristics in different regions, has shaped the differentiated choices of local policymakers in policy objectives and implementation direction. Therefore, when formulating and implementing ecological and environmental protection policies, it is necessary to comprehensively consider the different geographical and economic conditions of different regions to promote policy implementation and development more effectively. From a micro-policy perspective, each policy varies regarding policy targets and control objectives. P1, P2, and P3 are macro policies focusing more on controlling and guiding the overall situation. Therefore, the specific and detailed tasks of the work are assigned to the local government. In comparison, the ten local policies, P4 to P13, focus on the specific local conditions and are formulated and implemented under the guidance of the central policy. Upon evaluation, we find that there is still room for improvement in current local policies. In the process of formulating and implementing local policies, it is necessary to conduct an in-depth analysis of the specific problems of the province and fully tap and use the advantageous resources of the region to ensure that the policies and measures meet the actual needs [51]. Therefore, local policies must pay attention to the province’s specific problems and advantageous resources. Eco-environmental protection requires policy synergism, ensuring that all aspects receive due attention. Policies ought to place greater emphasis on water resources management, ecological compensation mechanisms, and biodiversity conservation in order to achieve the sustainable development of the Yangtze River Basin.
The formulation and implementation of each policy are constrained and influenced by various factors. These influencing factors work together to shape policy outcomes, implementation, and effectiveness. Through the analysis of the differences in multiple policies and their reasons, we can summarise the influencing factors of eco-environmental protection policies in the YREB: natural geographical conditions, level of economic development, differences in policy implementation and execution, and willingness of public and non-governmental organisations. In terms of natural geographical conditions, the differences in physiognomy, climate, soil, ecosystem diversity, and other physical and geographical conditions in the Yangtze River Basin impact the formulation and implementation of ecological protection policies. Shanghai, Jiangsu, and Hubei are relatively flat, and wetlands and ports dominate the ecosystem. Therefore, the regional policy focuses on protecting coastal wetlands and coastal ecosystems. Sichuan, Chongqing, Guizhou, and Yunnan are plateau and mountain areas with complex geographical features and fragile eco-environments. Therefore, the regional policies focus on soil and water conservation and water resources protection. Zhejiang, Anhui, and Jiangxi are located in hilly areas with many essential lakes and wetlands. Therefore, the regional policy focuses on the water resources management and biodiversity protection of lakes and rivers. As the most complex province in the YREB, Hunan encompasses hills, mountains, basins, and plains. Therefore, policy formulation must comprehensively consider the protection of various ecological types [52]. In terms of the level of economic development, the economic level and development mode of different provinces affect the implementation and promotion of ecological protection policies to a certain extent. Due to the demand for industrial structure and economic development in some regions, the attention to ecological protection may be insufficient, or the executive ability may be reduced. In economically developed regions, such as Shanghai, Jiangsu, and Zhejiang, policies focus on the balance between economic development and ecological protection. In economically developing regions, such as Anhui, Jiangxi, and Hubei, policies pay more attention to environmental protection and sustainable development. In economically underdeveloped regions, such as Yunnan and Guizhou, policies pay more attention to the sustainable use of natural resources to improve the quality of development. In terms of the differences in policy implementation and execution, there are some differences in policy implementation among provinces. Local governments’ execution, resource allocation, and priorities will change due to the diversity of regions, resources, and objectives. These differences will affect the formulation, promotion and implementation of ecological protection policies. In terms of the willingness of public and non-governmental organisations, the effectiveness of policy implementation largely depends on the active participation of the public and non-governmental organisations. However, among the representative policies selected in this study, four policies did not mention the relevant content of public participation, and nine policies did not cover non-governmental organisations, which is one of the reasons for the low scores of some policies. The final effect of the policy will be affected by the public’s awareness of ecological protection, environmental protection awareness, and the participation and resource investment of non-governmental organisations.
Compared with previous studies, this study has differences in the research object, research methods, and research perspective. Firstly, in terms of research object, previous studies usually conducted in-depth analyses on the current situation and level of policies in a single province or part of the field [53]. In contrast, this study expands the scope of the research object, covering the ecological protection policies of provinces within the scope of the YREB and more comprehensively evaluating the policy effect. Secondly, in terms of research methods, traditional policy research methods often use qualitative analysis or simple text analysis to explain policy effectiveness [54], while this study makes a quantitative evaluation of the policy based on the PMC-Index model, which can objectively reflect the actual effectiveness of the policy. Finally, in terms of research perspective, previous studies have primarily focused on policy analysis from a particular perspective in order to put forward targeted and detailed countermeasures to solve practical problems [55]. This study further broadens the perspective based on the original research and fully considers the regional differences between different regions in the YREB, including geographical conditions, socio–economic development levels, and other factors that significantly impact policy formulation and implementation. Therefore, we can better understand the challenges faced by different regions in formulating and implementing eco-environmental protection policies to propose targeted policy optimisation paths.
6. Conclusions
Based on the epochal theme of eco-environmental protection and from the perspective of constructing an indicator system for evaluating ecological protection policies in the YREB, this study selects thirteen representative central and local policies from 1978 to the present. We evaluate them quantitatively through text mining and PMC-Index. Then, we combine China’s national conditions and policy characteristics to propose targeted optimisation paths at the macro and micro levels, providing a reference for improving existing policies and formulating new policies. The study conclusions are as follows:
At the macro level, the overall design of the eco-environmental protection policy of the YREB is more scientific and reasonable and has played an essential role in the comprehensive management of the Yangtze River Basin and the major protection of its ecology. Nine of the thirteen representative policies were assessed as “Excellent”, the remaining four were assessed as “Acceptable’, and no policy was assessed as either “Perfect” or “Poor”. The average PMC-Index of the thirteen representative policies was 6.32. It shows that the Chinese government attaches great significance to the eco-environmental problems of the YREB. The formulation of policies considers factors such as strategic planning for eco-environmental management, regulation and supervision, ecological compensation mechanisms, natural disaster prevention and control, and public participation. At the micro level, there is still room for improvement in the eco-environmental protection policies of the YREB. In conjunction with the PMC-Index model, the low average values of the indicator scores for X2Policy Timeliness, X4Policy Issuing Agency, and X6Regulation Scope indicate that the policy design needs to be improved in some areas. Most of the policies are short- and medium-term policies, lacking long-term planning; the issuing organisation is relatively single, and the awareness and ability of collaborative governance needs to be strengthened; and the regulatory scope of local policies does not focus on the YREB as a whole. In addition, the PMC-Index results and the keyword analysis indicate that some policies lack predictability and feedback. Moreover, regulatory policy tools are used more in policy planning, while induced policy tools and voluntary policy tools are used less. There are only a few policies that mention social organisations. Hence, the role of social organisations in ecological and environmental governance has not been entirely played. These problems are not only present in the thirteen representative policies in this assessment but are also common in formulating eco-environmental protection policies in the YREB. Subsequent development of relevant policies should be improved with this focus. The YREB is widely recognised as a significant region with a global impact. In this study, the nine representative policies for eco-environmental protection cover the upper, middle, and lower reaches of the YREB. These policies were implemented in provinces with varying degrees of development and diverse human and natural geographic environments, making the analysis results highly comprehensive and valuable. The evaluation and discussion of these policies not only improve the level of sustainable development of the Yangtze River Basin but also provide reference experience for basin governance in other regions of the world. Ultimately, this will aid in promoting global sustainable development and ecological protection.
There are some shortcomings in this study. First of all, although the indicator system construct of this study is based on text mining and semantic analysis, some individual researchers’ subjective factors influence the selection and design of secondary indicators. Second, the breadth and depth of the policy assessment are lacking due to the limited number of indicators, which makes it difficult to encompass all aspects involved in eco-environmental protection in the YREB. Finally, the representative policies of this study are limited to eco-environmental protection in the YREB. According to existing studies, there is a coupling relationship between environmental protection and economic development, and a horizontal comparison and assessment of economic and environmental policies is also necessary. In future research, the text mining accuracy can be improved by further screening a more comprehensive range of policy samples to optimise the PMC model’s indicator design. To address the issue of the number of indicators, the researcher can conduct multiple modelling to evaluate relevant policies comprehensively. In addition, future research should also consider cross-sectional comparisons and assessments between policies in different dimensions and cross-cutting fields.
Author Contributions
Conceptualization, Y.X.; Methodology, Z.W.; Software, Y.X.; Data curation, Z.W.; Writing—original draft, Z.W.; Writing—review & editing, Y.X.; Project administration, C.Z.; Funding acquisition, C.Z. All authors have read and agreed to the published version of the manuscript.
Funding
This research was supported by the Jiangsu Provincial Social Science Fund Project (23ZZC002) and the Major Project of Philosophy and Social Science Research in Jiangsu Universities (2023SJZD117).
Institutional Review Board Statement
Not applicable.
Informed Consent Statement
Not applicable.
Data Availability Statement
The data presented in this study are available on request from the corresponding author. The data are not publicly available due to privacy.
Conflicts of Interest
The authors declare no conflict of interest.
References
- Bernauer, T.; Böhmelt, T. Basins at risk: Predicting international river basin conflict and cooperation. Glob. Environ. Politics 2014, 14, 116–138. [Google Scholar] [CrossRef]
- Zhao, C.; Wang, P.; Zhang, G. A comparison of integrated river basin management strategies: A global perspective. Phys. Chem. Earth Parts A/B/C 2015, 89, 10–17. [Google Scholar] [CrossRef]
- Xia, J.; Li, Z.; Zeng, S.; Zou, L.; She, D.; Cheng, D. Perspectives on eco-water security and sustainable development in the Yangtze River Basin. Geosci. Lett. 2021, 8, 18. [Google Scholar] [CrossRef]
- Li, W.; Wu, J.; Du, H.; Wan, Y.; Yang, S.; Xiao, Y.; Wang, L. Impact assessment of waterway development on the socioeconomic conditions and ecosystem in the upper Yangtze River. River Res. Appl. 2022, 38, 988–999. [Google Scholar] [CrossRef]
- Hu, S.; Song, W.; Li, C.; Zhang, C.H. The evolution of industrial agglomerations and specialization in the Yangtze River Delta from 1990–2018: An analysis based on firm-level big data. Sustainability 2019, 11, 5811. [Google Scholar] [CrossRef]
- Cui, X.; Cai, T.; Deng, W.; Zheng, R.; Jiang, Y.; Bao, H. Indicators for evaluating high-quality agricultural development: Empirical study from Yangtze River Economic Belt, China. Soc. Indic. Res. 2022, 164, 1101–1127. [Google Scholar] [CrossRef] [PubMed]
- Chen, Y.; Zhang, S.; Huang, D.; Li, B.L.; Liu, J.; Liu, W.; Ma, J.; Wang, F.; Wang, Y.; Wu, S.; et al. The development of China’s Yangtze River Economic Belt: How to make it in a green way. Sci. Bull. 2017, 62, 648–651. [Google Scholar] [CrossRef]
- Braun, D. Organising the political coordination of knowledge and innovation policies. Sci. Public Policy. 2008, 35, 227–239. [Google Scholar] [CrossRef]
- Dinda, S. Environmental Kuznets curve hypothesis: A survey. Ecol. Econ. 2004, 49, 431–455. [Google Scholar] [CrossRef]
- Andreichyk, A.; Tsvetkov, P. Study of the Relationship between Economic Growth and Greenhouse Gas Emissions of the Shanghai Cooperation organisation Countries on the Basis of the Environmental Kuznets Curve. Resources 2023, 12, 80. [Google Scholar] [CrossRef]
- Jin, C.; Liu, Y.; Li, Z.; Gong, R.; Huang, M.; Wen, J. Ecological consequences of China’s regional development strategy: Evidence from water ecological footprint in Yangtze River Economic Belt. Environ. Dev. Sustain. 2022, 24, 13732–13747. [Google Scholar] [CrossRef]
- Liu, J.; Tian, Y.; Huang, K.; Yi, T. Spatial-temporal differentiation of the coupling coordinated development of regional energy-economy-ecology system: A case study of the Yangtze River Economic Belt. Ecol. Indic. 2021, 124, 107394. [Google Scholar] [CrossRef]
- Wang, Z.; Fang, C.; Cheng, S.; Wang, J. Evolution of coordination degree of eco-economic system and early-warning in the Yangtze River Delta. J. Geogr. Sci. 2013, 23, 147–162. [Google Scholar] [CrossRef]
- Yang, Y.; Lu, H.; Liang, D.; Chen, Y.; Tian, P.; Xia, J.; Wang, H.; Lei, X. Ecological sustainability and its driving factor of urban agglomerations in the Yangtze River Economic Belt based on three-dimensional ecological footprint analysis. J. Clean. Prod. 2022, 330, 129802. [Google Scholar] [CrossRef]
- Zhao, J.; Zhao, Y. Synergy/trade-offs and differential optimization of production, living, and ecological functions in the Yangtze River economic Belt, China. Ecol. Indic. 2023, 147, 109925. [Google Scholar] [CrossRef]
- Ma, X.; Li, Y.; Zhang, X.; Wang, C.; Li, Y.; Dong, B.; Gu, Y. Research on the ecological efficiency of the Yangtze River Delta region in China from the perspective of sustainable development of the economy-energy-environment (3E) system. Environ. Sci. Pollut. Res. 2018, 25, 29192–29207. [Google Scholar] [CrossRef] [PubMed]
- Robert, K.W.; Parris, T.M.; Leiserowitz, A.A. What is sustainable development? Goals, indicators, values, and practice. Environ. Sci. Policy Sustain. Dev. 2005, 47, 8–21. [Google Scholar] [CrossRef]
- Russell, E.P., III. Lost Among the Parts Per Billion: Ecological Protection at the United States Environmental Protection Agency, 1970–1993. Environ. Hist. 1997, 2, 29–51. [Google Scholar] [CrossRef]
- Xie, Z. China’s historical evolution of environmental protection along with the forty years’ reform and opening-up. Environ. Sci. Ecotechnol. 2020, 1, 100001. [Google Scholar] [CrossRef]
- Yin, Y.; Hou, Y.; Langford, C.; Bai, H.; Hou, X. Herder stocking rate and household income under the Grassland Ecological Protection Award Policy in northern China. Land Use Policy 2019, 82, 120–129. [Google Scholar] [CrossRef]
- Girma, W.; Beyene, F. Willingness to contribute to collective forest management: Evidence from Godere in the Gambela Region of Ethiopia. J. Socio Econ. 2012, 41, 79–86. [Google Scholar] [CrossRef]
- Tsang, S.; Kolk, A. The evolution of Chinese policies and governance structures on environment, energy and climate. Environ. Policy Gov. 2010, 20, 180–196. [Google Scholar] [CrossRef]
- Zhao, H.; Gu, X.; Yang, T.; Gu, B. Evolutionary Logic and Development Foresight of Environmental Collaborative Governance Policy in the Yangtze River Delta. Land 2022, 11, 1404. [Google Scholar] [CrossRef]
- Xiao, F. Coupling and collaborative assessment of ecological and environmental protection policies in the Yangtze River Economic Belt. J. Yangtze Univ. (Soc. Sci. Ed.) 2022, 45, 76–83. [Google Scholar] [CrossRef]
- Wen, C.; Lin, C. Ecological protection policy of the Yangtze River Economic Belt: Evolution, characteristics and strategic exploration. J. Hebei Univ. Econ. Trade 2021, 42, 70–77. [Google Scholar] [CrossRef]
- Estrada, M.A.R. Policy modeling: Definition, classification and evaluation. J. Policy Model. 2011, 33, 523–536. [Google Scholar] [CrossRef]
- Ruiz Estrada, M.A. The policy modeling research consistency index (PMC-index). SSRN Electron. J. 2010, 1–12. [Google Scholar] [CrossRef]
- Dai, S.; Zhang, W.; Lan, L. Quantitative evaluation of China’s ecological protection compensation policy based on PMC index model. Int. J. Environ. Res. Public Health 2022, 19, 10227. [Google Scholar] [CrossRef]
- Yang, C.; Yin, S.; Cui, D.; Mao, Z.; Sun, Y.; Jia, C.; An, S.; Wu, Y.; Li, X.; Zhao, Q.; et al. Quantitative evaluation of traditional Chinese medicine development policy: A PMC index model approach. Front. Public Health 2022, 10, 1041528. [Google Scholar] [CrossRef]
- Peng, R.; Chen, Q.K.; Li, X.; Chen, K.X. Evaluating the consistency of long-term care insurance policy using PMC index model. DEStech Trans. Comput. Sci. Eng. 2020, 45, 34219. [Google Scholar] [CrossRef]
- Wang, B.; Xing, Q. Evaluation of the Wind Power Industry Policy in China (2010–2021): A Quantitative Analysis Based on the PMC Index Model. Energies 2022, 15, 8176. [Google Scholar] [CrossRef]
- Adelle, C.; Weiland, S. Policy assessment: The state of the art. Impact Assess. Proj. Apprais. 2012, 30, 25–33. [Google Scholar] [CrossRef]
- Xiong, Y.; Zhang, C.; Qi, H. How effective is the fire safety education policy in China? A quantitative evaluation based on the PMC-index model. Saf. Sci. 2023, 161, 106070. [Google Scholar] [CrossRef]
- O’Toole, L.J., Jr. Research on Policy Implementation: Assessment and Prospects. J. Public Adm. Res. Theory 2000, 10, 263–288. [Google Scholar] [CrossRef]
- Wang, Y.; Du, W.; Qiu, J. Reflection on Further Promoting the Implementation of the Ecological Environment Protection Plan for the YREB. China Environ. Manag. 2019, 11, 86–92. [Google Scholar] [CrossRef]
- Liu, Y. Five key measures for the construction of the Yangtze River Economic Belt. Peoples Trib. Acad. Front. 2016, 2, 65–69. [Google Scholar] [CrossRef]
- Ghura, D. Macro policies, external forces, and economic growth in Sub-Saharan Africa. Econ. Dev. Cult. Chang. 1995, 43, 759–778. [Google Scholar] [CrossRef]
- Blatter, J.K. Geographic scale and functional scope in metropolitan governance reform: Theory and evidence from Germany. J. Urban Aff. 2006, 28, 121–150. [Google Scholar] [CrossRef]
- Kim, L.S.; Oh, S.Y. A Study on the Timeliness for Performance Evaluation of Government-supported Information Policies. J. Korea Acad. Ind. Coop. Soc. 2009, 10, 872–876. [Google Scholar] [CrossRef]
- Cairney, P.; Weible, C.M. The new policy sciences: Combining the cognitive science of choice, multiple theories of context, and basic and applied analysis. Policy Sci. 2017, 50, 619–627. [Google Scholar] [CrossRef]
- Guy, J.S. Social structures, social change and the metric/nonmetric distinction. Can. J. Adm. Sci. Rev. Can. Sci. Adm. 2023, 40, 283–293. [Google Scholar] [CrossRef]
- Howlett, M.; Rayner, J. Patching vs packaging in policy formulation: Assessing policy portfolio design. Politics Gov. 2013, 1, 170–182. [Google Scholar] [CrossRef]
- Torfing, J.; Sørensen, E.; Røiseland, A. Transforming the public sector into an arena for co-creation: Barriers, drivers, benefits, and ways forward. Adm. Soc. 2019, 51, 795–825. [Google Scholar] [CrossRef]
- Quental, N.; Lourenço, J.M.; da Silva, F.N. Sustainable Development Policy: Goals, Targets and Political Cycles. Sustain. Dev. 2011, 19, 15–29. [Google Scholar] [CrossRef]
- Wang, Z.; Zhu, H.; Sun, D. Analysis and control measures for water ecological environment problems of typical cities in Jiangsu section of the Yangtze River mainstream and the region around the Taihu Lake Lake. J. Environ. Eng. Technol. 2022, 12, 1064–1074. [Google Scholar] [CrossRef]
- Zhou, F.; Shang, Y. Research on Shanghai’s docking to promote the construction of ecological community in the Yangtze River Economic Belt. J. Soc. Sci. 2018, 9, 52–60. [Google Scholar] [CrossRef]
- Wang, Z.; Lu, M.; Lu, B.; Gao, X.; Liu, H. Some thoughts on strengthening the protection of aquatic biodiversity in the Yangtze River. Freshw. Fish. 2023, 53, 20–26. [Google Scholar] [CrossRef]
- Zhang, X. Problems, Causes and Countermeasures of Water Ecological Construction in Hubei Section of the Yangtze River Economic Belt. Hubei Soc. Sci. 2018, 2, 61–67. [Google Scholar] [CrossRef]
- She, Y.; Liu, Y.; Jiang, L.; Yuan, H. Is China’s river chief policy effective? Evidence from a quasi-natural experiment in the Yangtze River economic belt, China. J. Clean. Prod. 2019, 220, 919–930. [Google Scholar] [CrossRef]
- Pike, A.; Birch, K.; Cumbers, A.; MacKinnon, D.; McMaster, R. A geographical political economy of evolution in economic geography. Econ. Geogr. 2009, 85, 175–182. [Google Scholar] [CrossRef]
- Chatterton, P.; Style, S. Putting sustainable development into practice? The role of local policy partnership networks. Local Environ. 2001, 6, 439–452. [Google Scholar] [CrossRef]
- Li, Y.; Wu, F. The emergence of centrally initiated regional plan in China: A case study of Yangtze River Delta Regional Plan. Habitat Int. 2013, 39, 137–147. [Google Scholar] [CrossRef]
- Chien, S.S. The isomorphism of local development policy: A case study of the formation and transformation of national development zones in post-Mao Jiangsu, China. Urban Stud. 2008, 45, 273–294. [Google Scholar] [CrossRef]
- Isoaho, K.; Gritsenko, D.; Mäkelä, E. Topic modeling and text analysis for qualitative policy research. Policy Stud. J. 2021, 49, 300–324. [Google Scholar] [CrossRef]
- Margallo, M.; Ziegler-Rodriguez, K.; Vázquez-Rowe, I.; Aldaco, R.; Irabien, Á.; Kahhat, R. Enhancing waste management strategies in Latin America under a holistic environmental assessment perspective: A review for policy support. Sci. Total Environ. 2019, 689, 1255–1275. [Google Scholar] [CrossRef]


Disclaimer/Publisher’s Note: The statements, opinions and data contained in all publications are solely those of the individual author(s) and contributor(s) and not of MDPI and/or the editor(s). MDPI and/or the editor(s) disclaim responsibility for any injury to people or property resulting from any ideas, methods, instructions or products referred to in the content. |
© 2024 by the authors. Licensee MDPI, Basel, Switzerland. This article is an open access article distributed under the terms and conditions of the Creative Commons Attribution (CC BY) license (https://creativecommons.org/licenses/by/4.0/).