Article

The Impact of Proximity to Road Traffic on Heavy Metal Accumulation and Enzyme Activity in Urban Soils and Dandelion

by
Agata Bartkowiak
1,*,
Joanna Lemanowicz
1,
Magdalena Rydlewska
1 and
Paweł Sowiński
2
1
Department of Biogeochemistry and Soil Science, Faculty of Agriculture and Biotechnology, Bydgoszcz University of Science and Technology, Bernardyńska 6 St., 85-029 Bydgoszcz, Poland
2
Department of Soil Science and Microbiology, Faculty of Agriculture and Forestry, University of Warmia and Mazury in Olsztyn, Plac Łodzki 3, 10-727 Olsztyn, Poland
*
Author to whom correspondence should be addressed.
Sustainability 2024, 16(2), 812; https://doi.org/10.3390/su16020812
Submission received: 15 December 2023 / Revised: 15 January 2024 / Accepted: 16 January 2024 / Published: 17 January 2024
(This article belongs to the Special Issue The Relationship between Urban Greening, Agriculture and Soil Quality)

Abstract

:
Urban soils usually comprise a mosaic of various types and usually present with elevated contents of heavy metals. This is due to their long-term accumulation in the soil, which is ensured by the continuous emission of pollutants, including from road traffic. The aim of this study was to estimate the impact of traffic pollution on the state of the soil environment using a phytoindicator (Teraxacum officinale). The contents of selected heavy metals in the soil and dandelion organs and the activities of selected redox enzymes in the soil in the vicinity of a busy city road were determined. The degree and direction of the movement of heavy metal ions in plants were assessed using the translocation factor (TF) and bioaccumulation factor (BCF). Selected indicators (AF—absorption factor, CF—contamination factor, EF—enrichment factor, PN—Nemerow’s pollution index, PLI—pollutant load index) were used to determine possible heavy metal contamination in soils, and the adaptation mechanisms of dandelion were evaluated by assessing selected enzymatic and non-enzymatic antioxidising systems. The research results confirmed that the proximity of a busy street reduced the enzymatic activity of the soil and increased the content of heavy metals in the soil and in dandelion. The heavy metal content levels did not exceed the permissible standards for soils in communication areas. The indicators used did not provide a clear answer as to the degree of anthropogenic contamination with individual metals. The higher contents of the metals in question in the above-ground parts of plants suggest that they may be caused by the impact of atmospheric pollution and not by the metal contents in the soil.

1. Introduction

Urban soils form under the impact of significant anthropogenic transformations. Their physical, chemical, and biological properties are usually heterogeneous in different urban environments [1]. They perform versatile functions in urban areas, such as buffering and purifying pollutants. Urban soils are usually a mosaic of various types and subtypes and usually present with elevated heavy metal contents. In cities, car traffic is a significant source of heavy metal pollution, with large numbers of vehicles moving in relatively small areas [2,3]. Automotive contaminants are more dangerous than industrial pollution. They are caused by spreading in high concentrations at low altitudes and in the immediate vicinity of people. Their spatial distribution is linear in nature, and they are classified as area pollutants [4]. This is especially important in cities where traffic is dense and flows smoothly. Most heavy metals come from exhaust gases, car oil leaks, the wearing of tires, brake discs, and corrosion of metal vehicle parts [5,6,7]. The surface layers of urban soils near roads with heavy traffic are good indicators of heavy metal content [8].
Heavy metals are pollutants that present a very high potential risk to the biological environment. The bioavailability and toxicity of these metals are more related to the forms of their occurrence in the soil than to their total content. However, the total content of metal is most often used as a criterion for assessing soil contamination regardless of the actual bioavailability of the specific forms [9]. When making decisions targeted at reducing soil pollution and improving soil functions, it is crucial to analyse the content of mobile metal fractions in the soil [10]. Therefore, the accumulation of metals in the soil–plant system should be carefully examined [3]. The degree of environmental risk is usually assessed by bioindication methods using phytoindicators. The best plants for this purpose are those that are commonly found in a variety of habitats, less sensitive or insensitive to poisoning, and found in a wide geographic range. One such plant is dandelion, which grows wild in all temperate regions of the world, is a ubiquitous weed in gardens, meadows, lawns, and ruderal habitats, and often grows in highly polluted areas, such as along railway lines or in the dusty surroundings of industrial plants. Taraxacum officinale (dandelion) is a perennial herbaceous plant that is used as a biomonitor of environmental pollution in various countries around the world [11,12,13]. It is a widespread and easily identified plant and is highly tolerant to chemical pollution. The plant differs in accumulation between its above- and below-ground parts, which allows for a visualisation of the migration of heavy metals in its organs [14,15].
Plants are often exposed to various types of stress factors, both biotic and abiotic. As a result, the production of reactive oxygen species (ROS) may be impaired in plant cells, resulting in oxidative stress. This may lead to physiological and biochemical disorders harmful to the plant [16]. Reactive oxygen species include hydrogen peroxide H2O2, singlet oxygen 1O2, and ozone O3 [17]. There is an antioxidising system in plants. It is responsible for removing ROS and preventing the occurrence of oxidative stress. The antioxidising system includes a non-enzymatic system (including vitamin C, glutathione, carotenoids, chlorophylls) and enzymes (including catalase, superoxide dismutases, glutathione peroxidase) [18]. The activity of catalase is inhibited by many chemical compounds. It is therefore possible to assess the activity of the cellular antioxidant system by measuring catalase activity.
Chlorophyll is a natural compound required by photosynthetic organisms. The level and changes in chlorophyll contents constitute an important signal of changes related to, for example, environmental pollution resulting from anthropogenic activities [19]. Elevated levels of heavy metals interfere with chlorophyll synthesis by directly inhibiting an enzymatic stage or causing a deficiency in an essential nutrient [20,21]. The photosynthetic system is then damaged and, consequently, the plant reduces the chlorophyll content as an adaptive response.
Soil enzymes are considered indicators of soil quality, organic carbon decomposition, and nutrient mineralisation (C, N, P, S) [22,23]. Catalase is an enzyme of the class of oxidoreductases, which catalyse oxidation and reduction reactions. This enzyme catalyses the reduction of hydrogen peroxide into water and molecular oxygen. In the soil, toxic hydrogen peroxide is produced during respiration as a by-product of the activity of certain oxidoreductases [24]. Dehydrogenases catalyse the oxidation of organic compounds by removing electrons and protons from them.
The research hypothesis of this study assumes that the proximity of a busy street reduces the enzymatic activity of the soil and increases the content of heavy metals in the soil and in dandelion. Dandelions exposed to stress caused by an increase in heavy metals activate their non-enzymatic and enzymatic antioxidant systems.
The aim of this research was (I) to determine the content of selected heavy metals in the soil and dandelion organs and the activity of selected redox enzymes in the soil in the vicinity of a busy city road, (II) to assess the degree and direction of the movement of heavy metal ions in plants using the transfer factor (TF) and bioaccumulation factor (BCF), (III) to determine possible contamination with heavy metals in soils using selected indicators (AF—absorption factor, CF—contamination factor, EF—enrichment factor, PN—Nemerow’s pollution index, PLI—pollutant load index), and (IV) to assess the adaptation mechanisms of dandelion by assessing selected enzymatic and non-enzymatic antioxidising systems. These results will expand knowledge about the status of heavy metal pollution, potential health risks, and potential factors causing heavy metal accumulation in soil and plants. They will also provide more comprehensive and up-to-date information that can contribute to the better management of soils near roads with high traffic volumes.

2. Materials and Methods
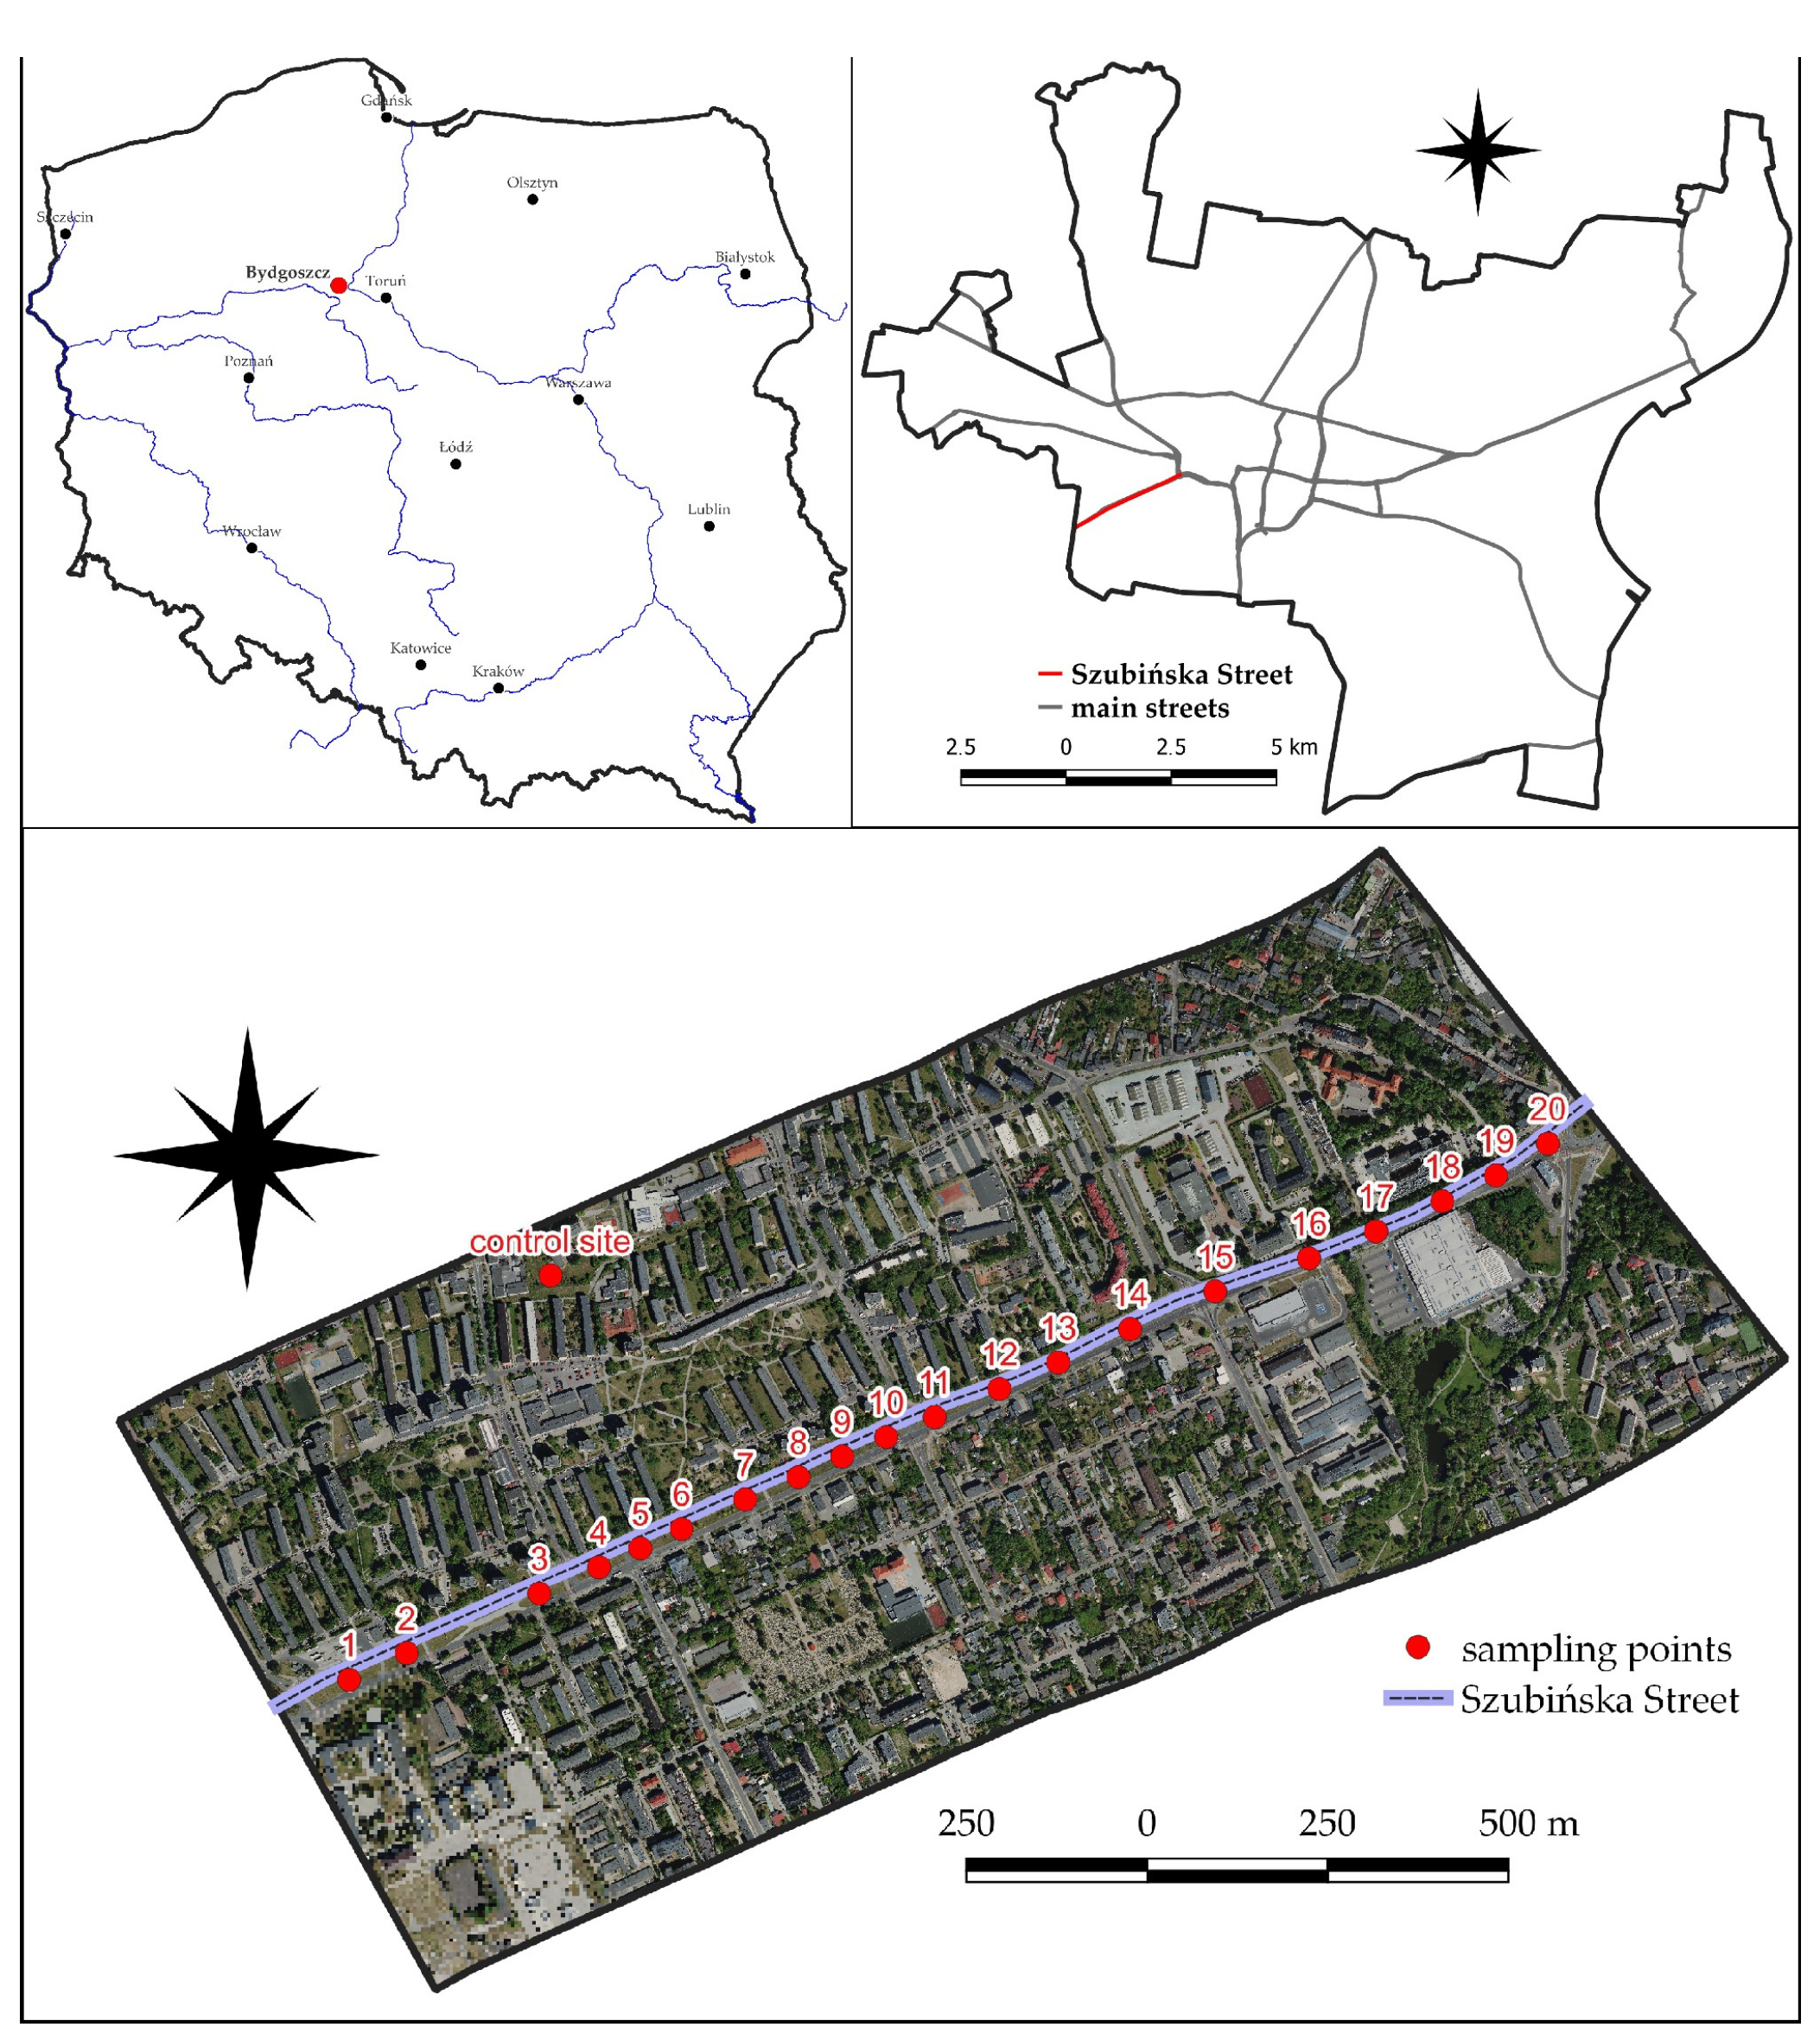
2.1. Study Area

Bydgoszcz is one of Poland’s largest cities, ranking 8th by population, which in 2022 was around 400,000, and 11th by area (176 km2). Bydgoszcz and its surroundings form an urban complex—an agglomeration with over 530,000 inhabitants. One third of this is the population living in rural areas surrounding the city. Two suburban communes, Białe Błota and Osielsko, are commuter zones for people who largely work in Bydgoszcz and take advantage of the city’s educational, cultural, and entertainment offerings. The research was carried out on a section of Szubińska Street in Bydgoszcz. Szubińska Street is located in the southwest of the city and is the most important exit route from the city towards Poznań, passing through Białe Błota. It is one of the most important elements of the city’s communication system and has some of the heaviest traffic in Bydgoszcz. During peak traffic times, 43,483 vehicles pass along the road daily. The road is a dual carriageway divided by a green median strip. The total length of the road is 1.3 km. Soil and plant samples for analysis were collected in May 2022. Soil sampling was carried out in accordance with the PN-ISO 10381-5 standard [25]. The green belt between the roads was divided into a grid of squares. Soil samples from each square were taken for analysis. Every bulk sample was combined from 10 individual samples. They were mixed thoroughly to obtain representative samples. It was assumed that soil contamination along the communication route was linear, so the sampling points were located in the immediate vicinity of the road in a 1.5–2.0 m wide strip in each driving direction. The research material included 20 soil samples taken from mineral horizons at a depth of 0–20 cm from the green belt using an Egner stick as a control point; a green square located 300 m from the direct range of a busy road was chosen. (Figure 1). Table 1 shows the coordinates for each site. Soil and plant material was collected from each sampling site in triplicate.

2.2. Soil Analysis

2.2.1. Physicochemical Properties

The soil samples were dried and sieved through a 2 mm mesh. The physical and chemical properties were determined in the soil material as follows: granulometric composition using a Mastersizer MS 2000 particle analyser (Malvern Instruments, Malvern, UK); pH in 1M KCl potentiometrically using a CPC-551 pH meter [26]; electrical conductivity of 1:5 soil–water extract (EC1:5) using the conductometric method [27]; organic carbon content (Corg) using Tiurin’s method by wet oxidation at 180 °C with a mixture of potassium dichromate and sulphuric acid [28]; total content of heavy metals (Zn, Cu, Ni, Pb, Cr, Cd) using the ASA method (SOLAAR S4) after mineralisation in a mixture of HF + HClO4 acids according to the method of Haluschak [29] and bioavailable forms after extraction with DTPA [30]. All analyses were conducted in triplicate, and the results were validated using certified material (reference soil sample—Loam Soil No. ERM—CC141).
Once we knew the total content of heavy metals and their available forms, the absorption factor (AF) [31] was calculated according to the formula:
% A F = C D T P A C T × 100
where CDTPA—content of DTPA-extracted forms (mg kg−1); CT—content of total forms (mg kg−1).

2.2.2. Enzymes in Soil

The tested activities of dehydrogenases and catalase were performed on fresh soil stored for two weeks at 4 °C. Dehydrogenases (DEHs) were determined using Thalmann’s method [32] after sample incubation with 2,3,5-triphenyltetrazolium chloride and measurement of the absorbance of triphenylformazan (TPF) at 546 nm and were expressed as mg TPF kg−1 24 h−1. Catalase activity (CAT) [EC 1.11.1.6] was determined using the method of Johnson and Temple [33] with 0.3% hydrogen peroxide solution as a substrate. The remaining H2O2 was determined by titration with 0.02M KMnO4 under acidic conditions.

2.3. Pollution Assessment Methodology

2.3.1. Contamination Factor (CF)

To determine the degree of soil contamination with heavy metals, the heavy metal contamination factor (CF) was calculated for each of the analysed metals according to the equation of Hakanson [34] and Ngole-Jeme [35]:
C F = C m   s a m p l e C m   b a c k g r o u n d
where Cm sample—the concentration of metal in the soil (mg kg−1); Cm background—the concentration of the same heavy metal in the background samples (in this case, the control sampling site) (mg kg−1).

2.3.2. Enrichment Factor (EF)

Due to the significant impact of anthropogenic changes, the percentage enrichment factor defined by Zonta et al. [36] and Losek and Weichul [37] was used to assess the soil, using the formula:
% E F = C C m i n C m a x C m i n × 100
where C—mean total concentration in the soil (mg kg−1); Cmin—minimum concentration (mg kg−1); and Cmax—maximum concentration (mg kg−1). EF < 2 is deficiency to minimal enrichment; EF 2–5 is moderate enrichment; EF 5–20 is significant enrichment; EF 20–40 is very high enrichment; and EF > 40 is extremely high enrichment [38].

2.3.3. The Nemerow Pollution Index (PN)

The Nemerow Pollution Index (PN) describes the integrated level of pollution in the study area and was calculated as follows [39,40]:
P N = ( C F ) 2 m a x + ( C F ) 2   m e a n 2
where CF (max) and CF (mean) are, respectively, the maximum and the average CF values for all the target heavy metal elements. The degree of heavy metal contamination is classified according to the following criteria: safe (PN ≤ 0.7), warning (0.7 < PN ≤ 1), light contamination (1 < PN ≤ 2), moderate contamination (2 < PN ≤ 3), and heavy contamination (PN > 3).

2.3.4. Pollution Load Index (PLI)

The pollutant load index (PLI) was also calculated and indicates the degree of soil contamination with heavy metals. The PLI for each site was calculated according to the formula of Tomlinson et al. [41]:
P L I = n C F Z n × C F C u × C F P b × C F N i × C F C d × C F C r
where CF—pollution factor; n—number of elements (6 in this study). In the case of the PLI, there are four categories: low contamination (PLI ≤ 1), moderate contamination (1 < PLI ≤ 2), high contamination (2 < PLI ≤ 5), and very high contamination (PLI > 5).

2.4. Plant Analysis

All the Taraxacum officinale plants gathered were at the same stage of development (flowering phase). The above-ground plant parts and the roots were analysed. The collected plants were washed with tap water and distilled water, and then the above-ground parts were separated from the roots. The plants were dried, ground using a grinder, and subjected to wet mineralisation in a microwave oven in a mixture of HNO3 and H2O2. The content of selected heavy metals in the plant material was determined using the ASA technique on Solaar S4 apparatus.

2.4.1. Translocation Factor (TF) and Bioaccumulation Factor (BCF)

The degree and direction of movement of heavy metal ions in the plant were assessed using the translocation factor (TF) and bioaccumulation factor (BCF). The TF is used to determine the mobility of contaminants in tested plants. The factor value was calculated using the following formula:
T F = C p C r
where Cp—content of heavy metal ions in plant shoot tissues (mg kg−1); Cr—concentration of heavy metal ions in roots (mg kg−1).
The value of the bioaccumulation factor (BCF) reflects the ability of plants to absorb metal ions from a soil solution and provides information on the movement of a metal from a soil solution to the above-ground parts and roots of the plant. The factor value was calculated according to the formula [42]:
B C F = C p C T
where Cp—content of heavy metal ions in above-ground plant parts (mg kg−1); CT—concentration of heavy metal ions in the soil (mg kg−1).

2.4.2. Catalase in Plants

Catalase activity (CAT) in the above-ground parts and roots of dandelion was determined using the method described by Kar and Mishra [43].

2.4.3. Chlorophyll Content

The chlorophyll-a (Chl-a) and chlorophyll-b (Chl-b) contents were determined by the method of Arnon et al. [44]. The chlorophyll content was determined using a spectrophotometer at wavelengths of 645 nm and 663 nm.

2.5. Statistical Analysis

Measures of location (min, max, arithmetic mean, and median), measures of variability (standard deviation—SD, coefficient of variation—CV%), and measures of asymmetry and concentration (skewness and kurtosis) were calculated for the results. CV values of 0–15%, 16–35%, and >36% indicate low, moderate, and sufficiently high variability, respectively [45]. The results of the analyses of the examined characteristics were also subjected to simple correlation analysis (p < 0.05) to determine the degree of dependency between individual characteristics. The Statistica.PL 13.3 package was used for statistical analysis [46]. All determinations were made in three replicates, and the results are presented as arithmetic means.

3. Results and Discussion

3.1. Physical and Chemical Soil Properties

According to the Polish Soil Classification [47], the tested soils were classified as anthropogenic soils (Urbisol). These soils are formed in urbanised areas, mainly in cities, and their origin is related to transformations caused by the construction development of various types. The grain size and physical and chemical properties of these soils vary greatly depending on the original parent rock of the soil and the type and amount of mixed-in or overlain anthropogenic materials. The grain size analysis showed that, in all the soil samples, the dominant fraction was the sand fraction (55.93–96.41%). The content of the silt fraction ranged from 11.71 to 40.16%, and the clay fraction from 0.99 to 3.90% (Table 2 and Table 3). According to the USDA [48], the tested soils were classified into the following granulometric groups: sand (2 soil samples), loamy sand (16 soil samples and control), and sandy loam (2 soil samples). The significant content of sand fraction and the small silt and clay fractions indicate low capacity for sorption (retention) of metals in the soil. Regardless of where samples were taken from, the reaction of the tested soils was alkaline (average pH—7.57) (Table 3). Similar results were obtained for soils of Bydgoszcz city by Różański and Dąbkowska-Naskręt [49] and Bartkowiak [50]. An alkaline reaction is typical for urban soils as it is mainly related to the deposition of alkaline materials in the form of dust and agents used to reduce ice on roads [15]. EC is the most frequently used parameter to assess soil salinity. At all sampling sites, EC ranged from 555 to 886 µS cm−1 (Table 2 and Table 3). According to FAO [51], an EC value in the range of 800 to 1600 μS cm−1 is considered high salinity, a level at which only plants resistant to very high levels of salinity can obtain high yields. However, according to Acosta et al. [52], an EC level above 8000 μS cm−1 affects all plants except very salt-tolerant ones, and it also changes the mobility of trace elements present in soils. The Corg content in the soils varied, ranging from 7.20 to 33.30 g kg−1. The coefficient of variation was >30%, indicating a wide variation in Corg in the soil material. Distribution analysis showed that most of the results were below the mean, as indicated by the median (13.55) being below the arithmetic mean. The measure of concentration (kurtosis) was positive (1.29) and indicated a greater concentration of results around the mean than for a normal distribution (Table 3). The varied Corg content is a characteristic feature of urbanised soils. In most natural soils, there is a gradual decrease in humus content down through the profile, whereas, in urban soils, the humus-enriched layer has either been removed or buried [53]. The soil of green areas, lawns, and city parks can often be enriched unevenly with organic matter in the form of peat, composts, or other organic fertilisers.

3.2. Heavy Metals in Soil

Urban soils, especially those under lawns along busy streets, accumulate significant amounts of heavy metals. Xia et al. [54] showed that the content of heavy metals in urban areas depends primarily on traffic intensity. The main source of soil contamination with metals (Cd, Cr, and Zn) is thus human transportation technologies [55]. The contents of heavy metals were variable among the tested soils. The total contents ranged as follows: Zn 104.83 to 345.35 mg kg−1, Cu 40.55 to 242.82 mg kg−1, Ni 7.90 to 16.91 mg kg−1, Pb 28.02 to 91.14 mg kg−1, Cd 0.25 to 0.47 mg kg−1, and Cr 17.98 to 58.61 mg kg−1 (Table 4). These contents were higher than those determined in the control soil (Table 2). The highest standard deviation was recorded for total zinc content, and the lowest was recorded for cadmium. The coefficients of variation for Zn, Cu, Pb, and Cd were very high, indicating that the soil material varied greatly in its content of these elements. The average content (mg kg−1) of the analysed metals can be presented in the following series: Zn (169.62) > Pb (52.62) > Cu (52.59) > Cr (24.15) > Ni (10.25) > Cd (0.39) (Table 4).
With respect to the standards resulting from the Regulation of the Minister of the Environment [56], the contents of all the tested heavy metals are acceptable. The analysed soils are therefore uncontaminated with Zn, Cu, Pb, Ni, Cd, and Cr. The significantly positive Pearson coefficients found between the total content of zinc and copper (r = 0.515; p ≤ 0.05) and between zinc and nickel (r = 0.556; p ≤ 0.05) (Table 5) may indicate a shared source of soil contamination. The linear relationship between individual heavy metals in the soil may result from their geochemical connections and may also provide information about their sources of origin [57,58,59]. Metals such as Zn, Cu, Pb, and Cd enter the soil environment near roads through the wearing of brake pads and leaking of lubricants, and Ni and Cr through the wearing of metal and chrome parts of cars [8,60,61]. According to Padmavathiammy and Li [62], the source of the environmental contents of metals along traffic routes may be exhaust emissions for Pb, tire abrasion for Zn, and engine and brake pad wear for Cu, Cd, and Ni. Some physical and chemical properties of soils, such as pH, texture, and organic carbon, are important parameters controlling the accumulation and availability of heavy metals in the soil environment [63,64]. The correlation analysis showed significant positive relationships between the clay fraction and the total contents of zinc (r = 0.548; p ≤ 0.05) and nickel (r = 0.521; p ≤ 0.05) and a significant negative relationship between the clay fraction and the total cadmium content (r = 0.585; p ≤ 0.05). Organic matter may be a factor that both releases and immobilises metals in the soil. This relationship was confirmed by the correlation analysis, which revealed that the total zinc content (r = 0.437, p ≤ 0.05) and total nickel content (r = 0.560, p ≤ 0.05) were each significantly positively correlated with organic carbon (Table 5). Linear regression shows that an increase of 1 pH in the soil caused a 4.57 mg∙kg−1 increase in the total zinc content and a 0.19 mg∙kg−1 increase in the total nickel content. Based on the coefficient of determination, it was found that organic carbon contributed 19.10% to the total zinc content and 31.3% to the total nickel content.
The average concentrations of bioavailable forms of Zn, Cu, Ni, Pb, Cd, and Cr in soil samples were, respectively, 16.52 mg kg−1, 5.22 mg kg−1, 0.21 mg kg−1, 2.37 mg kg−1, 0.03 mg kg−1, and 0.04 mg kg−1. The median values calculated for all the analysed forms of bioavailable metals are below the arithmetic mean, indicating that most of the results are below the average (Table 3). The low absorption factor (AF) values of 10.38% for Zn, 12.17% for Cu, 2.07% for Ni, 9.35% for Pb, 9.29% for Cd, and 0.17% for Cr do not represent a risk of accumulation of these metals in plants (Figure 2). It can be assumed that the impact of vehicle traffic consists mainly of soils being enriched with pollutants containing small amounts of mobile forms, which may undergo transformation over time depending on the prevailing soil conditions. The mobility and bioavailability of heavy metals in the soil environment are determined by soil conditions and the mechanisms of their binding with organic and inorganic soil components. Most metals are easily sorbed in soil to form poorly soluble organic and mineral compounds. In optimal conditions, they are not very mobile and are poorly available to plants. However, there are factors that facilitate their availability. These include, above all, a high concentration of a metal, acidic soil reaction, and contents of organic matter, colloidal clay, and EC [65,66,67]. The correlation analysis confirmed significant relationships between these soil parameters and bioavailable forms of the analysed metals (Table 5).

3.3. Evaluation of Heavy Metal Pollution

To determine the degree of anthropogenic impact on the tested soils, selected pollution indicators were used, CF, EF, PN, and PLI, whose values were calculated relative to the local geochemical background. Mafuyai et al. [68] report that calculated pollution indicators differ in their determinations of the degree of impact that environmental pollutants have on soil. These differences can be attributed to the differences in the approaches used in the methods for calculating enrichment factors. This is because some soil materials adopted as the geochemical background may have naturally high elemental concentrations and because global reference values may be higher or lower than local conditions. In our own research, the geochemical background was based on the content of heavy metals determined at a control point away from the busy road.
The average CF values were in the following order: Cu (3.68) > Zn (3.01) > Ni (2.14) > Pb (1.98) > Cd (1.85) > Cr (1.46) (Figure 3a). These results suggest that the soil near the road is moderately contaminated with Ni, Pb, Cd, and Cr and significantly contaminated (class 2) with Zn and Cu (class 3) [38]. According to Wang et al. [67], of the indices of the soil pollution levels, the CF meets the strictest criteria for assessing the pollution of an area.
The calculated values for the surface soil layer of the study area indicate that enrichment was extremely high for cadmium (EF = 63.10) and lead (EF = 50.0%), very high for zinc (EF = 26.94%), nickel (EF = 26.08%), and chromium (EF = 29.91%), and significant for copper (EF = 5.93%) (Figure 3b). The elevated EF values in urban soils are mainly the result of automotive and industrial emissions [50,68,69].
Nemerow’s pollution index (PN) illustrates the degree of soil contamination and thus assesses the impact of pollution on soil quality. By analysing the values of this indicator for individual metals, contamination was found to be heavy for zinc (PN = 4.53, class 5), copper (PN = 11.67, class 6), and lead (PN = 4.68, class 5), moderate for nickel (PN = 2.75, class 3), and light for cadmium (PN =1.91, class 2) and chromium (PN = 1.82, class 2) (Figure 3c).
The pollutant load index (PLI) is used to estimate the total soil contamination in a location. The PLI detects the deterioration in soil quality caused by heavy metal contamination. In the overlapping consideration content of the six heavy metals tested, the values for all sampling points indicate PLI class 3—moderate metal contamination (1 < PLI ≤ 2) (Figure 3d). Skorbiowicz et al. [8] report that the places where the PLI exceeds 1 are predominantly sites in urban areas. Heavy metals contamination in soils varies as a function of urbanisation [70].

3.4. The Activity of Enzymes in Soil

The activity of dehydrogenases in the soil was in the range of 0.389–0.722 mg TPF kg−1 24 h−1 (mean 0.547 mg TPF kg−1 24 h−1) (Table 6) and was 42% lower than the control (Table 2). Distribution analysis showed most of the results to be below average, as indicated by the median value being below the mean (0.532), and a positive skewness value (0.315) also confirms right-handed asymmetry. The CV rate (17.17% for DEHs) was in the middle class. This indicates moderate variability in the activity of this enzyme. The result of DEHs activity in the soil had a negative kurtosis value (−0.378). This shows that the results are less concentrated around the mean than would be for a normal distribution. According to Dec [71], low dehydrogenase activity in urban soils near road traffic is caused by low carbon and nitrogen contents. Dehydrogenases are one of the most important enzymes because they occur in active form only inside living cells. They are involved in the C cycle and microbial oxidative activity.
Soil CAT activity was also in the medium range (0.372–0.728 mg H2O2 kg−1 h−1), as indicated by the moderate value of the coefficient of variation (CV = 17.54%), with most of the results being below the arithmetic mean, as indicated by the median value (0.437) and the positive skewness value (1.648), which indicates the right-sided asymmetry of the distribution. The CAT activity in the soil collected along the road (mean 0.466 mg H2O2 kg−1 h−1) was 46% lower than the control (0.869 mg H2O2 kg−1 h−1). Significant positive correlations were found between Corg and DEHs activity (r = 0.959; p ≤ 0.05) and CAT (r = 0.596; p ≤ 0.05) (Table 5). The regression equations showed that increasing the Corg content by 1 g kg−1 resulted in an increase in DEHs of 0.0107 mg TPF kg−1 24 h−1 and an increase in CAT of 0.0089 mg H2O2 kg−1 h−1. Corg in soil is not only a source of enzymes but is also a substrate for enzyme degradation and thus affects the activity of enzymes in the soil [72]. According to Ma et al. [73], soil enzymes adhere to Corg and its fractions. A humus–protein complex is formed that protects the enzymes against decomposition. Therefore, the lack of significant changes in Corg content can be considered one of the reasons why the proximity of the road did not affect the activity of the tested soil enzymes. Correlation analysis showed that the clay content was significantly positively correlated with DEHs activity (r = 0.614; p ≤ 0.05) and with CAT (r = 0.539; p ≤ 0.05). According to Zimmerman and Ahn [74], clay minerals cause the adsorption of soil enzymes, which affects their affinity to mineral surfaces. The DEHs and CAT activity were found to significantly positively correlate with the content of some assimilable forms of heavy metals: (DEHs and A Zn r = 0.659; DEHs and A Cu r = 0.663; CAT and A Zn r = 0.613; CAT and A Cu r = 0.623; CAT and A Pb r = 0.689; p ≤ 0.05 and A Cr r = 0.623; p ≤ 0.05) (Table 5). According to Chaperon and Sauvé [75], Cu content correlates strongly with soil organic matter. Therefore, Cu occurs mainly as organic complexes, while most soluble Zn usually occurs in the form of a free ion [76]. It is probable that the determined content of metals and Corg in the tested soil samples activated dehydrogenase. Many trace elements are usually factors in the activating system, i.e., the enzymatic protein is unable to activate the substrate if the appropriate metal ion is missing. For some enzymes, metals are needed to form a bond between the enzyme and the substrate or between the enzyme, coenzyme, and substrate.

3.5. Heavy Metals in Plants

Plants differ in their requirements as to the amount and form of nutrients they require. For proper development, they need, among others: Zn, Cu, Fe, Mn, and Mo. These elements are also components of redox enzymes, activating them. Plants also take up other trace elements from the soil, including Pb, Ni, Cr, and Cd, which do not have any positive functions and are taken up merely as a result of their presence in the soil. Determining the amounts of heavy metals in the above-ground parts and roots of plants provides an additional opportunity to distinguish the source of their uptake by plants and provides valuable information on atmospheric air pollution [12,14]. The content of heavy metals was lower in the above-ground parts and roots of dandelions collected from the control site than in the plant material collected from the roadside (Table 7).
The average metal contents in the above-ground parts of plants sampled along Szubińska Street were arranged in the order ZnA-P > CuA-P > CrA-P > PbA-P > NiA-P, whereas in roots, the order was ZnR > CuR > PbR > NiR > CrR (Table 8). The research results indicate that the above-ground parts of the dandelion contained, on average, significantly higher amounts of chromium, lead, and nickel than the roots. Near-neutral or slightly alkaline soil reaction limits the mobility of elements, which suggests their poor absorption by plants. The accumulation of the metals in question in the above-ground parts of dandelions may be the result of atmospheric pollution. These metals occur in exhaust gases emitted into the atmosphere by car engines [3,5,12]. The high nickel content in the above-ground parts of dandelion is also related to this element’s high mobility and easy translocation to above-ground plant parts [14,65]. However, this was not confirmed by the correlation analysis. Instead, the study found a significantly positive relationship between the zinc content in the above-ground parts of plants and available zinc in the soil (r = 0.449; p ≤ 0.05) and a significantly positive relationship between the copper content in the above-ground parts and available lead (r = 0.577; p ≤ 0.05). The available forms of lead also significantly influenced the content of copper (r = 0.604; p ≤ 0.05) and chromium (r = 0.524; p ≤ 0.05) in dandelion roots (Table 5). However, the calculated coefficient of determination (R2) indicated that the available forms of zinc influenced only 33.3% of its content in the plant.
The calculated values of the translocation factor (TF ≥ 1), which is a measure of the movement of heavy metals once taken up by plants, confirmed that Ni (TF = 1.35), Pb (TF = 1.68), and Cr (TF = 3.82) are accumulated mainly in the above-ground parts of plants (Figure 4). The high degree of movement of Cr from the root to the above-ground part of the dandelion, compared to other heavy metals, proves the high mobility of this element. Similar results regarding lead were obtained by Zajęcka and Świercz [77]. The transport of absorbed metals within the plant depends primarily on the activity of phytochelatins—plant peptides whose task is to capture the collected metals from the cytoplasm and deposit them in vacuoles [78]. TF values may also depend on plant growing conditions and metal concentrations [79].
To assess the degree of the enrichment of dandelion in selected heavy metals relative to their contents in the soil, the bioaccumulation factor (BCF) was calculated. The BCF describes the plant’s ability to absorb heavy metals from the soil depending on the migration load. It is assumed that plants can accumulate heavy metals in their tissues. When BCF ≥ 0.1, such accumulation is assessed as weak. Moderate or intense accumulation occurs when BCF values are 0.1 ≤ 1 or >1, respectively [80]. The BCF values obtained for the tested metals showed the weak accumulation of zinc, copper, and lead in the above-ground parts of dandelion and intense accumulation of nickel (BCF = 1.36) and chromium (BCF = 1.03) (Figure 5). In the studies by Kabata-Pendias [64], the bioaccumulation index of green plants was ~1 for Zn and 0.7 for Cu and Pb. The present study showed lower bioaccumulation rates for these elements. This is probably due to the metal contents in the analysed soils being low.

3.6. The Activity of Catalase in Plants

Roadside plants can reduce their own contamination by modifying their enzymatic activity. Plant catalase activity is one of the basic indicators for assessing oxidative stress in plants. Oxidative stress occurs when free oxygen radicals are overproduced in significant amounts within cells. The activity of CATA–P was 11.018 mg H2O2 kg−1 h−1, and the activity of CATR was 1.134 H2O2 kg−1 h−1. These were higher than the control levels of CATA–P (0.986 H2O2 kg−1 h−1) and CATR (1.03 H2O2 kg−1 h−1) by 3% and 10%, respectively (Table 9).
An increase in catalase activity regardless of test plant (wheat, pea, and tomato seedlings) was noted in research by Baruah et al. [81]. This was probably due to increased H2O2 production under the influence of heavy metals having triggered the synthesis of CAT production, whose activity led to the subsequent degradation of H2O2. According to Rahmanian et al. [82], the activity of oxidative enzymatic systems (SOD, POD, and CAT) initially increases to protect the plant against harmful factors. Correlation analysis showed significant positive relationships between CATA–P activity and T Zn content in soil (r = 0.483; p ≤ 0.05). The value of the coefficient (R2) showed that only 23% of the variability in CATA–P was related to the T Zn content in soil. According to Tauqeer et al. [83], the activity of oxidative enzymes (superoxide dismutase, peroxidase, catalase, and ascorbate peroxidase) increased at lower metal levels (0.5 and 1.0 mM), whereas it decreased at higher metal levels (2.0 mM). No significant negative correlations were found between catalase activity in the above-ground parts and roots of dandelions exposed to road traffic and the content of heavy metals in either the soil or the plant. This was probably due to the contents of all the tested heavy metals in the soil being within permissible limits [56].

3.7. Chlorophyll Content

Assimilation pigments are low-molecular-weight substances found in thylakoid membranes in combination with proteins. The most important assimilation pigments include chlorophylls, which are non-enzymatic antioxidants. Like catalase, they constitute a defence against reactive oxygen species (ROS). The Chl-a content in dandelion ranged from 0.541 to 1.495 mg−1 f.w. The average content of chlorophyll-a (1.022 mg−1 f.w.) in dandelion collected along the road was 35% lower than the control (1.576 mg−1 f.w.) (Table 10).
The average Chl-b content (0.505 mg−1 f.w.) was also lower than the control (1.576 mg−1 f.w.). The median exceeding the mean content for both Chl-a and Chl-b indicated that most of the results were above average. For these two variables, it can be concluded that the distribution will be right skewed (skewness value > 0). The Chl-a and Chl-b content results had negative kurtosis (−2.134 and −2.115, respectively), showing that the results are less concentrated around the mean than for a normal distribution. Bretzel et al. [84] also showed a 20% higher content of Chl-a and Chl-b in control dandelion than in dandelion treated with street residues. The CV values for Chl-a (40.08) and Chl-b (41.38) indicate the parameter’s high variability, in addition to the content of assimilation pigments, another very important indicator for assessing physiological changes is the determination of the mutual ratio of chlorophyll-a to chlorophyll-b (Chl-a/Chl-b). The value of this indicator in the dandelion sampled along the road ranged from 1.923 to 2.515 (average 2.041) and was 4% higher compared to the control dandelion (Chl-a/Chl-b 1.950). An increase in the Chl-a/Chl-b value is treated as a reliable indicator of stress. It is assumed that chlorophyll-a and chlorophyll-b usually occur in plants at a ratio of 3:1. The total chlorophyll content (Chl-a + Chl-b) in the dandelion was 1.495 mg−1 f.w. However, the content of Chl-a + Chl-b in the dandelion collected from the control site was 38% higher (2.384 mg−1 f.w.). The contents of Ni and Cr contents in the above-ground part of the dandelion were found to correlate negatively with the contents of both Chl-a (respectively: r = −0.994; r = −0.924 at p ≤ 0.05) and Chl-b (respectively: r = −0.991; r = −0.907 at p ≤ 0.05). The determination coefficient (R2) showed that 99% and 89% of the variability in Chl-a and 98% and 87% of the variability in Chl-b were related to the content of, respectively, NiA-P and CrA-P in the above-ground part of the test plant. Regression equations showed that increasing the NiA-P content by 1 mg kg−1 resulted in decreases of 0.0602 mg−1 f.w. in Chl-a content and 0.0311 mg−1 f.w. in Chl-b, whereas increasing the Cr content by 1 mg kg−1 in the above-ground part of the dandelion affected decreases of 0.0249 mg−1 f.w. Chl-a and 0.0187 mg−1 f.w. in Chl-b. According to Li et al. [85], the accumulation of heavy metals reduces the total concentration of chlorophyll and negatively affects the value of the Chl-a/Ch-b ratio. When plants are under stress, Chl-a is hydrolysed more quickly than Chl-b. According to Houri et al. [21], a high content of heavy metals may lead to damage to the photosynthetic system and, consequently, to an increase in chlorophyll content as a plant adaptation method (Table 5).

4. Conclusions

This research showed that soil within the zone of influence of a busy street contained higher amounts of heavy metals than soil from a control sampling site. Their average content of total species decreased in the following order: Zn > Pb > Cu > Cr > Ni > Cd. These contents did not exceed permissible levels according to standards for soils in communication areas. The relationships between the analysed elements showed that most of the heavy metals in the road traffic area had similar anthropogenic origins. Their source may have been exhaust fumes emitted by motor vehicles.
The activity of redox enzymes in the soil exposed to road traffic was lower than in the control soil.
The research results indicated that the above-ground parts of the dandelion contained, on average, significantly higher amounts of chromium, lead, and nickel than the roots. The higher contents of the metals in question in the above-ground parts of plants suggest that they may be caused by the impact of atmospheric pollution and not by the metal contents in the soil. The obtained data may be useful in the long term for assessing how the accumulation and transfer of heavy metals from soil and air to specific plant species progresses, as well as for screening tests for potential hyperaccumulator plants.
Photosynthetic pigments (chlorophyll-a and chlorophyll-b) and catalase activity in the above-ground part and root played a role in the defence mechanisms of dandelion. Oxidative stress caused by the presence of total zinc in the substrate led to an increase in catalase activity in dandelion. Therefore, further research is necessary to better link the antioxidant system to soil metal contamination.
The indicators selected to determine soil heavy metal contamination (AF—absorption factor, CF—contamination factor, EF—enrichment factor, PN—pollution index, PLI—pollutant load index) differ from each other and do not provide a clear indication of the degree of anthropogenic contamination by individual metals. Therefore, methods should be developed to create a comprehensive package of information based on the total value of indicators that are useful in supporting soil remediation efforts.
Due to the increasing anthropogenic impacts on urban areas, monitoring soil pollution in cities is an essential activity as part of measures to improve the quality of life of inhabitants. Research on the environmental carrying capacity and critical thresholds of urban soil contamination is important in order to be able to establish a risk assessment system and better manage urban soil resources. Soil pollution assessment and soil quality testing must be regulated worldwide.

Author Contributions

Conceptualization, A.B. and J.L.; methodology, A.B., J.L., M.R. and P.S.; software, A.B., J.L. and P.S.; validation, A.B., J.L. and M.R.; formal analysis, A.B., J.L., M.R. and P.S.; investigation, A.B., J.L., M.R. and P.S.; resources, A.B. and J.L; data curation, A.B. and J.L.; writing—original draft preparation, A.B. and J.L.; writing—review and editing, A.B. and J.L.; visualization, A.B., J.L. and P.S.; supervision, A.B. and J.L.; project administration, A.B. All authors have read and agreed to the published version of the manuscript.

Funding

Bydgoszcz University of Science and Technology under Grant BN-WRiB-2/2022.

Institutional Review Board Statement

Not applicable.

Informed Consent Statement

Not applicable.

Data Availability Statement

Data is contained within the article.

Acknowledgments

The authors would like to thank the Faculty of Agriculture and Biotechnology, Bydgoszcz University of Science and Technology for their support for this research work.

Conflicts of Interest

The authors declare no conflicts of interest.

References

  1. Yang, J.-L.; Zhang, G.-L. Formation, characteristics and eco-environmental implications of urban soils—A review. Soil Sci. Plant Nutrit. 2015, 61, 30–46. [Google Scholar] [CrossRef]
  2. Wei, B.; Yang, L. A review of heavy metal contaminations in urban soils, urban road dusts and agricultural soils from China. Microchem. J. 2010, 94, 99–107. [Google Scholar] [CrossRef]
  3. Jankowski, K.; Ciepiela, G.A.; Jankowska, J.; Szulc, W.; Kolczarek, R.; Sosnowski, J.; Wiśniewska-Kadzajan, B.; Malinowska, E.; Radzka, E.; Czeluściński, W.; et al. Content of lead and cadmium in aboveground plant organs of grasses growing on the areas adjacent to route of big traffic. Environ. Sci. Pollut. Res. 2015, 22, 978–987. [Google Scholar] [CrossRef]
  4. Wieczorek, K.; Turek, A.; Szczesio, M.; Wolf, W. Comprehensive evaluation of metal pollution in urban soils of post-industrial city-Łódź, Poland. Molecules 2020, 25, 4350. [Google Scholar] [CrossRef] [PubMed]
  5. Johansson, C.; Norman, M.; Burman, L. Road traffic emission factors for heavy metals. Atmos. Environ. 2009, 43, 4681–4688. [Google Scholar] [CrossRef]
  6. Duong, T.T.T.; Lee, B.K. Determining contamination level of heavy metals in road dust from busy traffic areas with different characteristics. J. Environ. Manag. 2011, 92, 554–562. [Google Scholar] [CrossRef] [PubMed]
  7. Athanasopoulou, A.; Kollaros, G. Heavy metal contamination of soil due to road traffic. Am. J. Eng. Res. 2016, 5, 354–363. [Google Scholar]
  8. Skorbiłowicz, M.; Skorbiłowicz, E.; Rogowska, W. Heavy metal concentration in roadside soils on the Białystok-Budzisko route in northeastern Poland. Minerals 2021, 11, 1290. [Google Scholar] [CrossRef]
  9. Tytła, M. Identification of the chemical forms of heavy metals in municipal sewage sludge as a critical element of ecological risk assessment in terms of its agricultural or natural use. Int. J. Environ. Res. Public Heatlh 2020, 17, 4640. [Google Scholar] [CrossRef]
  10. Senila, M.; Levei, E.A.; Senila, L.R. Assessment of metals bioavailability to vegetables under field conditions using DGT, single extractions and multivariate statistics. Chem. Cent. J. 2012, 6, 119. [Google Scholar] [CrossRef]
  11. Czarnowska, K.; Milewska, A. The content of heavy metals in an indicator plant (Taraxacum officinale) in Warsaw. Pol. J. Environ. Stud. 2000, 9, 125–128. [Google Scholar]
  12. Petrova, S.; Yurukova, L.; Velcheva, I. Taraxacum officinale as a biomonitor of metals and toxic elements (Plovdiv, Bulgaria). Bulg. J. Agric. Sci. 2013, 19, 241–247. [Google Scholar]
  13. Kano, N.; Hori, T.; Zhang, H.; Miyamoto, M.; Anak, D.E.V.; Mishima, K. Study on the behavior and removal of cadmium and zinc using Taraxacum officinale and gazania under the application of biodegradable chelating agents. Appl. Sci. 2021, 11, 1557–1574. [Google Scholar] [CrossRef]
  14. Bomze, K.; Rutkowska, B.; Szulc, W. The content of trace metals in dandelion (Taraxacum officinale) depending on the distance from the transport route. Soil Sci. Ann. 2007, 58, 38–42. [Google Scholar]
  15. Kajka, J.; Rutkowska, B. Accumulation of selected heavy metals in soils and common dandelion (Taraxacum officinale) near a road with high traffic intensity. Soil Sci. Ann. 2018, 69, 11–16. [Google Scholar]
  16. Sarker, U.; Oba, S. Catalase, superoxide dismutase and ascorbate-glutathione cycle enzymes confer drought tolerance of Amaranthus tricolor. Sci Rep. 2018, 8, 16496. [Google Scholar] [CrossRef]
  17. Foyer, C.H.; Noctor, G. Managing the cellular redox hub in photosynthetic organisms. Plant Cell Environ. 2012, 35, 199–201. [Google Scholar] [CrossRef]
  18. Gill, S.S.; Tuteja, N. Reactive oxygen species and antioxidant machinery in abiotic stress tolerance in crop plants. Plant Physiol. Biochem. 2010, 48, 909–930. [Google Scholar] [CrossRef]
  19. Keeler, K.M.; Bunnell, D.B.; Diana, J.S.; Adams, J.V.; Mychek-Londer, J.G.; Warner, D.M.; Yule, D.L.; Vinson, M.R. Evaluating the importance of abiotic and biotic drivers on Bythotrephes biomass in Lakes Superior and Michigan. J. Great Lakes Res. 2015, 41, 150–160. [Google Scholar] [CrossRef]
  20. Talebzadeh, F.; Valeo, C. Evaluating the effects of environmental stress on leaf chlorophyll content as an index for tree health. Earth Environ. Sci. 2022, 1006, 012007. [Google Scholar] [CrossRef]
  21. Houri, T.; Khairallah, Y.; Zahab, A.A.; Osta, B.; Romanos, D.; Haddad, G. Heavy metals accumulation effects on the photo-synthetic performance of geophytes in Mediterranean reserve. J. King Saud Univ. Sci. 2020, 32, 874–880. [Google Scholar] [CrossRef]
  22. Dick, R.P.; Kandeler, E. Enzymes in soils. In Encyclopedia of Soils in the Environment; Hillel, D., Ed.; Elsevier: Amsterdam, The Netherlands, 2005; pp. 448–456. [Google Scholar] [CrossRef]
  23. Lemanowicz, J.; Bartkowiak, A.; Zielińska, A.; Jaskulska, I.; Rydlewska, M.; Klunek, K.; Polkowska, M. The Effect of enzyme activity on carbon sequestration and the cycle of available macro- (P, K, Mg) and microelements (Zn, Cu) in Phaeozems. Agriculture 2023, 13, 172. [Google Scholar] [CrossRef]
  24. Chabot, M.; Morales, E.; Cummings, J.; Rios, N.; Giatpaiboon, S.; Mogul, R. Simple kinetics, assay, and trends for soil microbial catalases. Anal. Biochem. 2020, 610, 113901. [Google Scholar] [CrossRef]
  25. PN-ISO 10381-5; Soil Quality—Sampling—Part 5: Guidance on the Procedure for the Investigation of Urban and Industrial Sites with Regard to Soil Contamination. Polish Standards Committee: Warsaw, Poland, 2009.
  26. PN-ISO 10390; Chemical and Agricultural Analysis: Determining Soil pH. Polish Standards Committee: Warszawa, Poland, 1997.
  27. Van Reeuwijk, L.P. Procedures for Soil Analysis, 6th ed.; ISRIC, FAO: Wageningen, The Netherlands, 2002. [Google Scholar]
  28. PN-ISO 14235; Chemical and Agricultural Analysis—Soil Quality—Determining the Content of Organic Carbon by Oxidation of Potassium Dichromate (VI) in the Environment of Sulphuric Acid (VI). Polish Standards Committee: Warsaw, Poland, 2003.
  29. Haluschak, P.; Laboratory Methods of Soil Analysis. Canada Manitoba Soil Survey. 2006; pp. 3–133. Available online: https://www.gov.mb.ca/agriculture/soil/soil-survey/pubs/laboratory_methods_of_soil_analysis.pdf (accessed on 14 December 2023).
  30. Lindsay, W.L.; Norvell, W.A. Development of a DTPA soil test for zinc, iron, manganese, and copper. Soil Sci. Soc. Am. J. 1978, 42, 421–428. [Google Scholar] [CrossRef]
  31. Obrador, A.; Alvarez, J.M.; Lopez-Valdivia, L.M.; Gonzalez, D.; Novillo, J.; Rico, M.I. Relationships of soil properties with Mn and Zn distribution in acidic soils and their uptake by a barley crop. Geoderma 2007, 137, 432–443. [Google Scholar] [CrossRef]
  32. Thalmann, A. Zur Methodik der Bestimung der Dehydrogenaseaktivität im Boden mittels Triphenyltetrazoliumchlorid (TTC). Landwirtsch. Forsch. 1968, 21, 249–258. [Google Scholar]
  33. Johnson, J.I.; Temple, K.L. Some variables affecting the measurements of catalase activity in soil. Soil Sci. Soc. Am. 1964, 28, 207–209. [Google Scholar] [CrossRef]
  34. Hakanson, L. An ecological risk index for aquatic pollution control: A sedimentological approach. Water Res. 1980, 14, 975–1001. [Google Scholar] [CrossRef]
  35. Ngole-Jeme, V.M. Heavy metals in soils along unpaved roads in south west Cameroon: Contamination levels and health risks. Ambio 2016, 45, 374–386. [Google Scholar] [CrossRef]
  36. Zonta, R.; Zaggia, L.; Argrse, E. Heavy metal and grain size distributions in estuarine shallow water sediments of the Cona Marsh (Venice Lagoon. Italy). Sci. Total Environ. 1994, 151, 19–28. [Google Scholar] [CrossRef]
  37. Loska, K.; Wiechuła, D. Application of principal component analysis for the estimation of source of heavy metal contamination in surface sediments from the Rybnik Reservoir. Chemosphere 2003, 51, 723–733. [Google Scholar] [CrossRef] [PubMed]
  38. Sutherland, R.A.; Tolosa, C.A.; Tack, F.M.G.; Verloo, M.G. Characterization of selected element concentrations and enrichment ratiosin background and anthropogenically impacted roadside areas. Arch. Environ. Contam. Toxicol. 2000, 38, 428–438. [Google Scholar] [CrossRef] [PubMed]
  39. Huang, Y.; Chen, Q.; Deng, M.; Japenga, J.; Li, T.; Yang, X.; He, Z. Heavy metal pollution and health risk assessment of agricultural soils in a typical peri-urban area in southeast China. J. Environ. Manag. 2018, 207, 159–168. [Google Scholar] [CrossRef]
  40. Martínez-Guijarro, R.; Paches, M.; Romero, I.; Aguado, D. Enrichment and contamination level of trace metals in the Mediterranean marine sediments of Spain. Sci. Total Environ. 2019, 693, 133566. [Google Scholar] [CrossRef]
  41. Tomlinson, D.L.; Wilson, J.G.; Harris, C.R.; Jeffrey, D.W. Problems in the assessment of heavy-metal levels in estuaries and the formation of a pollution index. Helgoländer Meeresuntersuchungen 1980, 33, 566–575. [Google Scholar] [CrossRef]
  42. Ali, H.; Khan, E.; Sajad, M.A. Phytoremediation of heavy metals—Concepts and applications. Chemosphere 2013, 91, 869–881. [Google Scholar] [CrossRef] [PubMed]
  43. Kar, M.; Mishra, D. Catalase, peroxidase, and polyphenoloxidase activities during rice leaf senescence. Plant Physiol. 1976, 57, 315–319. [Google Scholar] [CrossRef]
  44. Arnon, D.I.; Allen, M.B.; Whatley, F.R. Photosynthesis by isolated chloroplasts IV. General concept and comparison of three photochemical reactions. Biochim. Biophys. Acta 1956, 20, 449–461. [Google Scholar] [CrossRef]
  45. Wilding, L.P. Spatial variability: Its documentation, accommodation, and implication to soil surveys. In Soil Spatial Variability, 1st ed.; Nielsen, D.R., Bouma, J., Eds.; Pudoc: Wageningen, The Netherlands, 1985; pp. 166–194. [Google Scholar]
  46. Statistica. Data Analysis Software System, Version 12; TIBCO Software Inc.: Palo Alto, CA, USA, 2019; Available online: https://www.tibco.com/products/data-science (accessed on 28 September 2021).
  47. Polish Soil Classification (Systematyka Gleb Polski); Soil Science Society of Poland, Commission on Soil Genesis, Classification and Cartography, Wydawnictwo Uniwersytetu Przyrodniczego we Wrocławiu, Polskie Towarzystwo Gleboznawcze: Wrocław/Warszawa, Poland, 2019; 235p.
  48. USDA. Keys to Soil Taxonomy, 10th ed.; United States Department of Agriculture, Natural Resources Conservation Service: Washington, DC, USA, 2006; pp. 1–332. [Google Scholar]
  49. Różański, S.; Dąbkowska-Naskręt, H. Spatial and profile distribution of mercury in urbanozems of Bydgoszcz city. Environ. Prot. Nat. Resour. 2011, 49, 193–201. [Google Scholar]
  50. Bartkowiak, A. The accumulation of selected heavy metals in soils in the vicinityof a busy road. Soil Sci. Annu. 2020, 71, 118–124. [Google Scholar] [CrossRef]
  51. Abrol, I.P.; Yadav, J.S.P.; Massoud, F.I. Salt-Affected Soils and Their Management; FAO Soils Bulletin 39; FAO: Rome, Italy, 1988. [Google Scholar]
  52. Acosta, J.A.; Jansen, B.; Kalibitz, K.; Faz, A.; Martinez-Martinez, S. Salinity increases mobility of heavy metals in soils. Chemosphere 2011, 85, 1318–1324. [Google Scholar] [CrossRef] [PubMed]
  53. Lorenz, K.; Kandeler, E. Biochemical characterization of urban soil profiles from Stuttgart, Germany. Soil Biol. Biochem. 2005, 37, 1373–1385. [Google Scholar] [CrossRef]
  54. Xia, X.; Chen, X.; Liu, R.; Liu, H. Heavy metals in urban soils with various types of land use in Beijing, China. J. Hazard. Mater. 2011, 186, 2043–2050. [Google Scholar] [CrossRef] [PubMed]
  55. Wydro, U.; Jabłońska-Trypuć, A.; Hawrylik, E.; Butarewicz, A.; Rodziewicz, J.; Janczukowicz, W.; Wołejko, E. Heavy metals behavior in soil/plant system after sewage sludge application. Energies 2021, 14, 1584. [Google Scholar] [CrossRef]
  56. Regulation of the Minister of the Environment dated 1 September 2016 on assessment procedures for the land surface pollution (Journal of Laws, Item 1359, 5 September 2016). Available online: https://isap.sejm.gov.pl/isap.nsf/download.xsp/WDU20160001395/O/D20161395.pdf (accessed on 14 December 2023).
  57. Guo, G.; Wu, F.; Xie, F.; Zhang, R. Spatial distribution and pollution assessment of heavy metals in urban soils from southwest. China J. Environ. Sci. 2012, 24, 410–418. [Google Scholar] [CrossRef]
  58. Czech, T.; Baran, A.; Wieczorek, J. Content of heavy metals in soil and plants from an area Borzęcin municipality (Malopolska province). Ecol. Eng. 2014, 37, 89–98. [Google Scholar] [CrossRef]
  59. Bartkowiak, A.; Lemanowicz, J.; Lamparski, R. Assessment of selected heavy metals and enzyme activity in soils within the zone of influence of various tree species. Sci. Rap. 2020, 10, 14077–14086. [Google Scholar] [CrossRef]
  60. Christoforidis, A.; Stamatis, N. Heavy metal contamination in street dust and roadside soil along the major national road in Kavala’s region, Greece. Geoderma 2009, 151, 257–263. [Google Scholar] [CrossRef]
  61. Popoola, O.E.; Bamgbose, O.; Okonkwo, O.J.; Arowolo, T.A.; Popoola, A.O.; Awofolu, O.R. Heavy metals content in classroom dust of some public primary schools in Metropolitan Lagos, Nigeria. Res. J. Environ. Earth Sci. 2012, 4, 460–465. [Google Scholar]
  62. Padmavathiamma, P.K.; Li, L.Y. Phytoremediation Technology: Hyper-accumulation metals in plants. Water Air Soil Pollut. 2007, 184, 105–126. [Google Scholar] [CrossRef]
  63. Ashworth, D.J.; Alloway, B.J. Influence of dissolved organic matter on the solubility of heavy metals in sewage-sludge-amended soils. Commun. Soil Sci. Plant Anal. 2008, 39, 538–550. [Google Scholar] [CrossRef]
  64. Kabata-Pendias, A. Trace Elements in Soils and Plants, 4th ed.; CRC Press, Taylor & Francis Group: Boca Raton, FL, USA; London, UK; New York, NY, USA, 2011; ISBN 978-1-4200-9368-1. [Google Scholar]
  65. Szatanik-Kloc, A. Effect of pH and selected heavy metals in soils on their content in plants. Acta Agrophys. 2004, 4, 177–183. [Google Scholar]
  66. Mafuyai, G.M.; Kamoh, N.M.; Kangpe, N.S.; Ayuba, S.M.; Eneji, I.S. Heavy metals contamination in roadside dust along major traffic roads in Jos Metropolitan area, Nigeria. J. Environ. Earth Sci. 2015, 5, 48–57. [Google Scholar]
  67. Wang, C.; Ye, Z.; Wang, W.; Jin, M. Traffic-related heavy metal contamination in urban areas and correlation with traffic activity in China. Transp. Res. Rec. 2016, 2571, 80–89. [Google Scholar] [CrossRef]
  68. Ali, S.M.; Malik, R.N. Spatial distribution of metals in top soils of Islamabad City, Pakistan. Environ. Monit. Assess. 2011, 172, 1–16. [Google Scholar] [CrossRef] [PubMed]
  69. Atiemo, M.S.; Ofosu, G.F.; Mensah, H.K.; Tutu, A.O.; Linda Palm, N.D.M.; Blankson, S.A. Contamination Assessment of Heavy Metals in Road Dust from Selected Roads in Accra, Ghana. Res. J. Environ. Earth Sci. 2011, 3, 473–480. [Google Scholar]
  70. Magno, J.L.; Budianta, W. Spatial distribution and pattern of heavy metals in urban soils of Yogyakarta, Indonesia. Earth Environ. Sci. 2022, 1071, 012032. [Google Scholar] [CrossRef]
  71. Dec, D. Assessment of the microbiological activity in agricultural and urban soils. Soil Sci. Annu. 2014, 65, 156–160. [Google Scholar] [CrossRef]
  72. Hok, L.; de MoraesSá, J.C.; Reyes, M.; Boulakia, S.; Tivet, F.; Leng, V.; Kong, R.; Briedis, C.; da Cruz Hartman, D.; Ferreira, L.A.; et al. Enzymes and C pools as indicators of C build up in short-term conservation agriculture in a savanna ecosystem in Cambodia. Soil Tillage Res. 2018, 177, 125–133. [Google Scholar] [CrossRef]
  73. Ma, W.; Li, G.; Wu, J.; Xu, G.; Wu, J. Response of soil labile organic carbon fractions and carbon-cycle enzyme activities to vegetation degradation in a wet meadow on the Qinghai–Tibet Plateau. Geoderma 2020, 377, 114565. [Google Scholar] [CrossRef]
  74. Zimmerman, A.R.; Ahn, M.-Y. Organo-Mineral–Enzyme Interaction and Soil Enzyme Activity. In Soil Enzymology; Shukla, G., Varma, A., Eds.; Springer: Berlin/Heidelberg, Germany, 2011; pp. 271–292. [Google Scholar] [CrossRef]
  75. Chaperon, S.; Sauvé, S. Toxicity interaction of metals (Ag, Cu, Hg, Zn) to urease and dehydrogenase activities in soils. Soil Biol. Biochem. 2007, 39, 2329–2338. [Google Scholar] [CrossRef]
  76. Fotovat, A.; Naidu, R. Ion exchange resin and MINTEQA2 speciation of Zn and Cu in alkaline sodic and acidic soil extracts. Aust. J. Soil Res. 1997, 35, 711–726. [Google Scholar] [CrossRef]
  77. Zajęcka, E.; Świercz, A. Biomonitoring of the urban environment of Kielce and Olsztyn (Poland) based on studies of total and bioavailable lead content in soils and common dandelion (Taraxacum officinale agg.). Minerals 2021, 11, 52. [Google Scholar] [CrossRef]
  78. Khan, A.; Khan, S.; Khan, M.A.; Qamar, Z.; Waqas, M. The uptake and bioaccumulation of heavy metals by food plants, their effects on plants nutrients, and associated health risk: A review. Environ. Sci. Pollut. Res. 2015, 22, 13772–13799. [Google Scholar] [CrossRef] [PubMed]
  79. Mayerova, M.; Petrova, S.; Madaras, M.; Lipavsky, J.; Simon, T.; Vanek, T. Non-enhanced phytoextraction of cadmium, zinc, and lead by high-yielding crops. Environ. Sci. Pollut. Res. 2017, 24, 14706–14716. [Google Scholar] [CrossRef]
  80. Rigoletto, M.; Calza, P.; Gaggero, E.; Malandrino, M.; Fabbri, D. Bioremediation methods for the recovery of lead-contaminated soils: A review. Appl. Sci. 2020, 10, 3528. [Google Scholar] [CrossRef]
  81. Baruah, N.; Mondal, S.C.; Farooq, M.; Gogoi, N. Influence of Heavy Metals on Seed Germination and Seedling Growth of Wheat, Pea, and Tomato. Water Air Soil Pollut. 2019, 230, 273. [Google Scholar] [CrossRef]
  82. Rahmanian, M.; Habib, K.; Younes, R.D.; MirHasan, R.S. Effects of heavy metal resistant soil microbes inoculation and soil Cd concentration on growth and metal uptake of millet, couch grass and alfalfa. Afr. J. Microbiol. Res. 2011, 5, 403–410. [Google Scholar]
  83. Tauqeer, H.M.; Ali, S.; Rizwan, M.; Ali, Q.; Saeed, R.; Iftikhar, U.; Ahmad, R.; Farid, M.; Abbasi, G.H. Phytoremediation of heavy metals by Alternanthera bettzickiana: Growth and physiological response. Ecotoxicol. Environ. Saf. 2016, 126, 138–146. [Google Scholar] [CrossRef]
  84. Bretzel, F.; Benvenuti, S.; Pistelli, L. Metal contamination in urban street sediment in Pisa (Italy) can affect the production of antioxidant metabolites in Taraxacum officinale Weber. Environ. Sci. Pollut. Res. 2014, 21, 2325–2333. [Google Scholar] [CrossRef]
  85. Li, Y.; Liu, J.; Liu, Y.; Li, X. Effects of EDTA on mechanism of lead accumulation in typha orientalis Presl. Bull. Environ. Contam. Toxicol. 2009, 83, 553–557. [Google Scholar] [CrossRef] [PubMed]
Figure 1. Localisation of study area.
Sustainability 16 00812 g001
Figure 2. Available factor (AF).
Sustainability 16 00812 g002
Figure 3. Pollution assessment: (a) contamination factor (CF); (b) enrichment factor (EF); (c) the Nemerow Pollution Index (PN); (d) pollution load index (PLI).
Sustainability 16 00812 g003
Figure 4. Translocation factor (TF).
Sustainability 16 00812 g004
Figure 5. Bioaccumulation factor.
Sustainability 16 00812 g005
Table 1. Coordinates of sampling points (ETRS 89/EPSG 2180).
Sampling
Point
CoordinatesSampling
Point
CoordinatesSampling
Point
Coordinates
XYXYXY
1430,495.94583,743.908431,118.06584,023.8815431,695.07584,280.75
2430,575.70583,780.759431,178.57584,052.4816431,825.16584,326.41
3430,759.42583,863.2610431,239.62584,079.4317431,917.85584,363.81
4430,841.93583,899.5611431,306.73584,106.9418432,009.71584,405.07
5430,899.14583,925.4212431,396.39584,145.9919432,083.97584,440.82
6430,956.34583,952.3713431,477.80584,182.2920432,156.02584,484.83
7431,044.35583,993.0714431,577.36584,228.50C430,774.82584,302.76
C—control point.
Table 2. Selected physical, chemical, and biochemical parameters in control soil.
Selected physical and chemical properties
Sand (%)Silt (%)Clay (%)pH KClEC1:5
(µS cm−1)
Corg
(g kg−1)
77.5120.382.117.6955512.70
The total content of heavy metals (mg·kg−1)
ZnCuNiPbCdCr
56.3114.674.8013.900.0510.58
The available forms of heavy metals (mg·kg−1)
ZnCuNiPbCdCr
10.014.220.110.190.050.04
The activity of enzymes
DEHsCAT
0.9430.869
DEHs—dehydrogenases (mg TPF kg−1 24 h−1); CAT—catalase (mg H2O2 kg−1 h−1).
Table 3. Selected physical and chemical properties of soils near a road.
Fractions (%)pH KClEC1:5
(µS cm−1)
Corg
(g kg−1)
SandSiltClay
Min55.9311.710.997.305507.20
Max96.4140.163.907.7688533.30
Mean80.1019.561.627.5763015.35
Median81.3917.781,377.5860513.55
SD7.556.390.610.1387.326.34
CV9.4332.6637.651.6813.8941.30
Skewness−1.171.602.70−0.511.611.11
Kurtosis4.333.579.44−0.052.331.29
SD—standard deviation; CV—coefficient of variation.
Table 4. Total content and available forms of Zn, Cu, Pb, Ni, Cd, and Cr in soil.
Total ContentAvailable Forms
mg kg−1
ZnCuNiPbCdCrZnCuNiPbCdCr
Min104.840.557.9028.020.4634.5210.631.920.091.340.010.03
Max345.4242.916.9191.140.4755.1529.5913.160.706.220.110.05
Mean169.652.5910.2552.620.3924.1516.535.220.212.370.030.04
Median146.938.289.6620.630.4122.8014.834.900.172.070.030.04
SD120.350.691.9817.170.165.035.552.270.131.150.020.01
CV70.9096.3819.3632.6242.0220.8333.5543.4263.1548.5959.0959.09
Skewness1.743.062.012.77−0.452.060.871.992.872.271.54−0.02
Kurtosis2.729.695.349.20−1.134.13−0.246.649.615.542.63−0.74
SD—standard deviation; CV—coefficient of variation.
Table 5. Coefficient of linear correlation between soil parameters.
VariablesEquationrR2
DependentIndependent
T ZnT Cuy = 130.1737 + 0.6849x0.5150.265
T ZnT Niy = −0.3054 + 16.6608x0.5560.309
T ZnClayy = 69.931 + 59.5285x0.5480.301
T ZnCorgy = 963226 + 4.57011x0.4370.191
T NiClayy = 6.9486 + 1.8879x0.5210.272
T NiCorgy = 7.0132 + 0.1953x0.5600.313
T CdClayy = 0.5551 − 0.1252x−0.5850.342
A ZnT Zny = 8.2728 + 0.0495x0.5850.342
A ZnClayy = 7.3106 + 5.6691x0.6180.381
A ZnpHy = 221.93 − 27.1486x−0.6170.380
A ZnECy = −4.3792 + 0.0334x0.5160.227
A ZnCorgy = 3.5741 + 0.6469x0.7320.536
A CuClayy = 0.3444 + 3.0061x0.8250.681
A CuECy = −5.9796 + 0.0179x0.6980.487
A CuCorgy = 0.9859 + 0.2758x0.7860.618
A CuT Zny = 1.3954 + 0.023x0.6850.469
A CuT Niy = −2.4267 + 0.7639x0.7600.578
A CuA Zny = 1.1562 + 0.2462x0.6210.385
Zn A-PA Zny = 42.4903 + 1.4812x0.4480.333
Cu A-PA Pby = 14.7701 + 40.5993x0.5770.201
Chl aNi A-Py = 1.8199 − 0.0602x−0.9940.988
Chl bNi A-Py = 0.9193 − 0.0311x−0.9910.983
Chl aCr A-Py = 1.3511 − 0.0249x−0.9240.852
Chl bCr A-Py = 0.7763 − 0.0127x−0.9070.823
Cu RA Pby = 19.7261 + 35.459x0.6040.365
Cr RA Pby = 5.7472 + 2.776x0.5240.275
CATClayy = 0.3529 + 0.07x0.5390.291
CATCorgy = 0.352 + 0.0075x0.5960.356
CATA Zny = 0.3191 + 0.0089x0.6310.399
CATA Cuy = 0.3505 + 0.222x0.6230.388
CATA Pby = 0.3523 + 0.4851x0.6890.476
DEHsClayy = 0.3982 + 0.0913x0.6140.373
DEHsCorgy = 0.3342 + 0.0138x0.9590.920
DEHsA Zny = 0.3691 + 0.0107x0.6590.434
DEHsA Cuy = 0.4042 + 0.0272x0.6630.439
CAT A-PZn Ry = 0.8292 + 0.0024x0.8370.701
CAT A-PCu Ry = 0.9051 + 0.0038x0.7040.495
CAT RZn Ry = 0.9994 + 0.0017x0.8300.689
CAT RCu Ry = 1.0524 + 0.0027x0.7080.502
T—the total forms; A—available forms; A-P—the above-ground part; R—root.
Table 6. The activity of dehydrogenases (mg TPF kg−1 24 h−1) and catalase (mg H2O2 kg−1 h−1) in soli.
MinimumMaximumMeanMedianSD *CVSkewnessKurtosis
DEHs0.3890.7220.5460.5320.09417.140.315−0.378
CAT0.3720.7280.4660.4370.08217.541.6483.900
* SD—standard deviation; CV—coefficient of variation; DEHs—dehydrogenases (mg TPF kg−1 24 h−1); CAT—catalase (mg H2O2 kg−1 h−1).
Table 7. The content of heavy metals (mg kg−1) and the activity of catalase in the above-ground parts and roots of dandelion sampled from the control site.
ZnCuNiPbCdCrCAT
Above-ground parts of plant
22.568.435.697.51n.d.15.10.986
Root
31.227.996.124.38n.d.5.911.030
n.d.—not detection; CAT—catalase.
Table 8. The content of heavy metals in the above-ground parts and roots of dandelion collected along the road.
Above-Ground Parts of PlantRoot
mg kg−1
ZnCuNiPbCdCrZnCuNiPbCdCr
Min22.5618.035.7114.10n.d.5.6366.3221.644.042.50n.d.5.13
Max119.647.2822.9122.20n.d.44.0193.5442.7161.4123.10n.d.7.88
Mean69.1625.1213.5518.08n.d.24.8278.7529.0610.0610.77n.d.6.51
Median63.9723.5023.7718.05n.d.13.8778.2827.375.639.60n.d.17.26
SD16.017.266.652.41n.d.15.6711.134.9712.315.13n.d.1.12
CV23.1528.8949.0713.33n.d.63.1314.1317.09122.3347.66n.d.17.26
Skewness1.981.980.000.27n.d.0.220.281.133.900.67n.d.0.04
Kurtosis3.893.70−2.04−0.38n.d.−1.97−0.711.2316.240.35n.d.1.06
SD—standard deviation; CV—coefficient of variation; n.d.—not detection.
Table 9. The activity of catalase (mg H2O2 kg−1 h−1) in the above-ground parts (CATA–P) and in the roots of dandelion (CATR).
MinimumMaximumMeanMedianSD *CVSkewnessKurtosis
CATA–P1.0111.0451.0180.0140.08217.541.8063.853
CATR1.1271.1611.1341.1300.0080.7381.8434.036
* SD—standard deviation, CV—coefficient of variation.
Table 10. Content of chlorophyll-a (Chl a) and chlorophyll-b (Chl b) in dandelion.
MinimumMaximumMeanMedianSD *CVSkewnessKurtosis
Chl a0.5411.4951.0221.2750.41040.080.043−2.134
Chl b0.3210.7420.5050.6380.20941.380.010−2.115
Chl a/Chl b1.9232.5152.0412.0010.1215.923.24012.58
Chl a + Chl b0.8022.2261.4951.4550.61541.170.0352.165
* SD—standard deviation, CV—coefficient of variation.
Disclaimer/Publisher’s Note: The statements, opinions and data contained in all publications are solely those of the individual author(s) and contributor(s) and not of MDPI and/or the editor(s). MDPI and/or the editor(s) disclaim responsibility for any injury to people or property resulting from any ideas, methods, instructions or products referred to in the content.

