
Advanced Frequency Control Technique Using GTO with Balloon Effect for Microgrids with Photovoltaic Source to Lower Harmful Emissions and Protect Environment

 , , and
Abstract
1. Introduction
1.1. Literature Review
1.2. Contributions
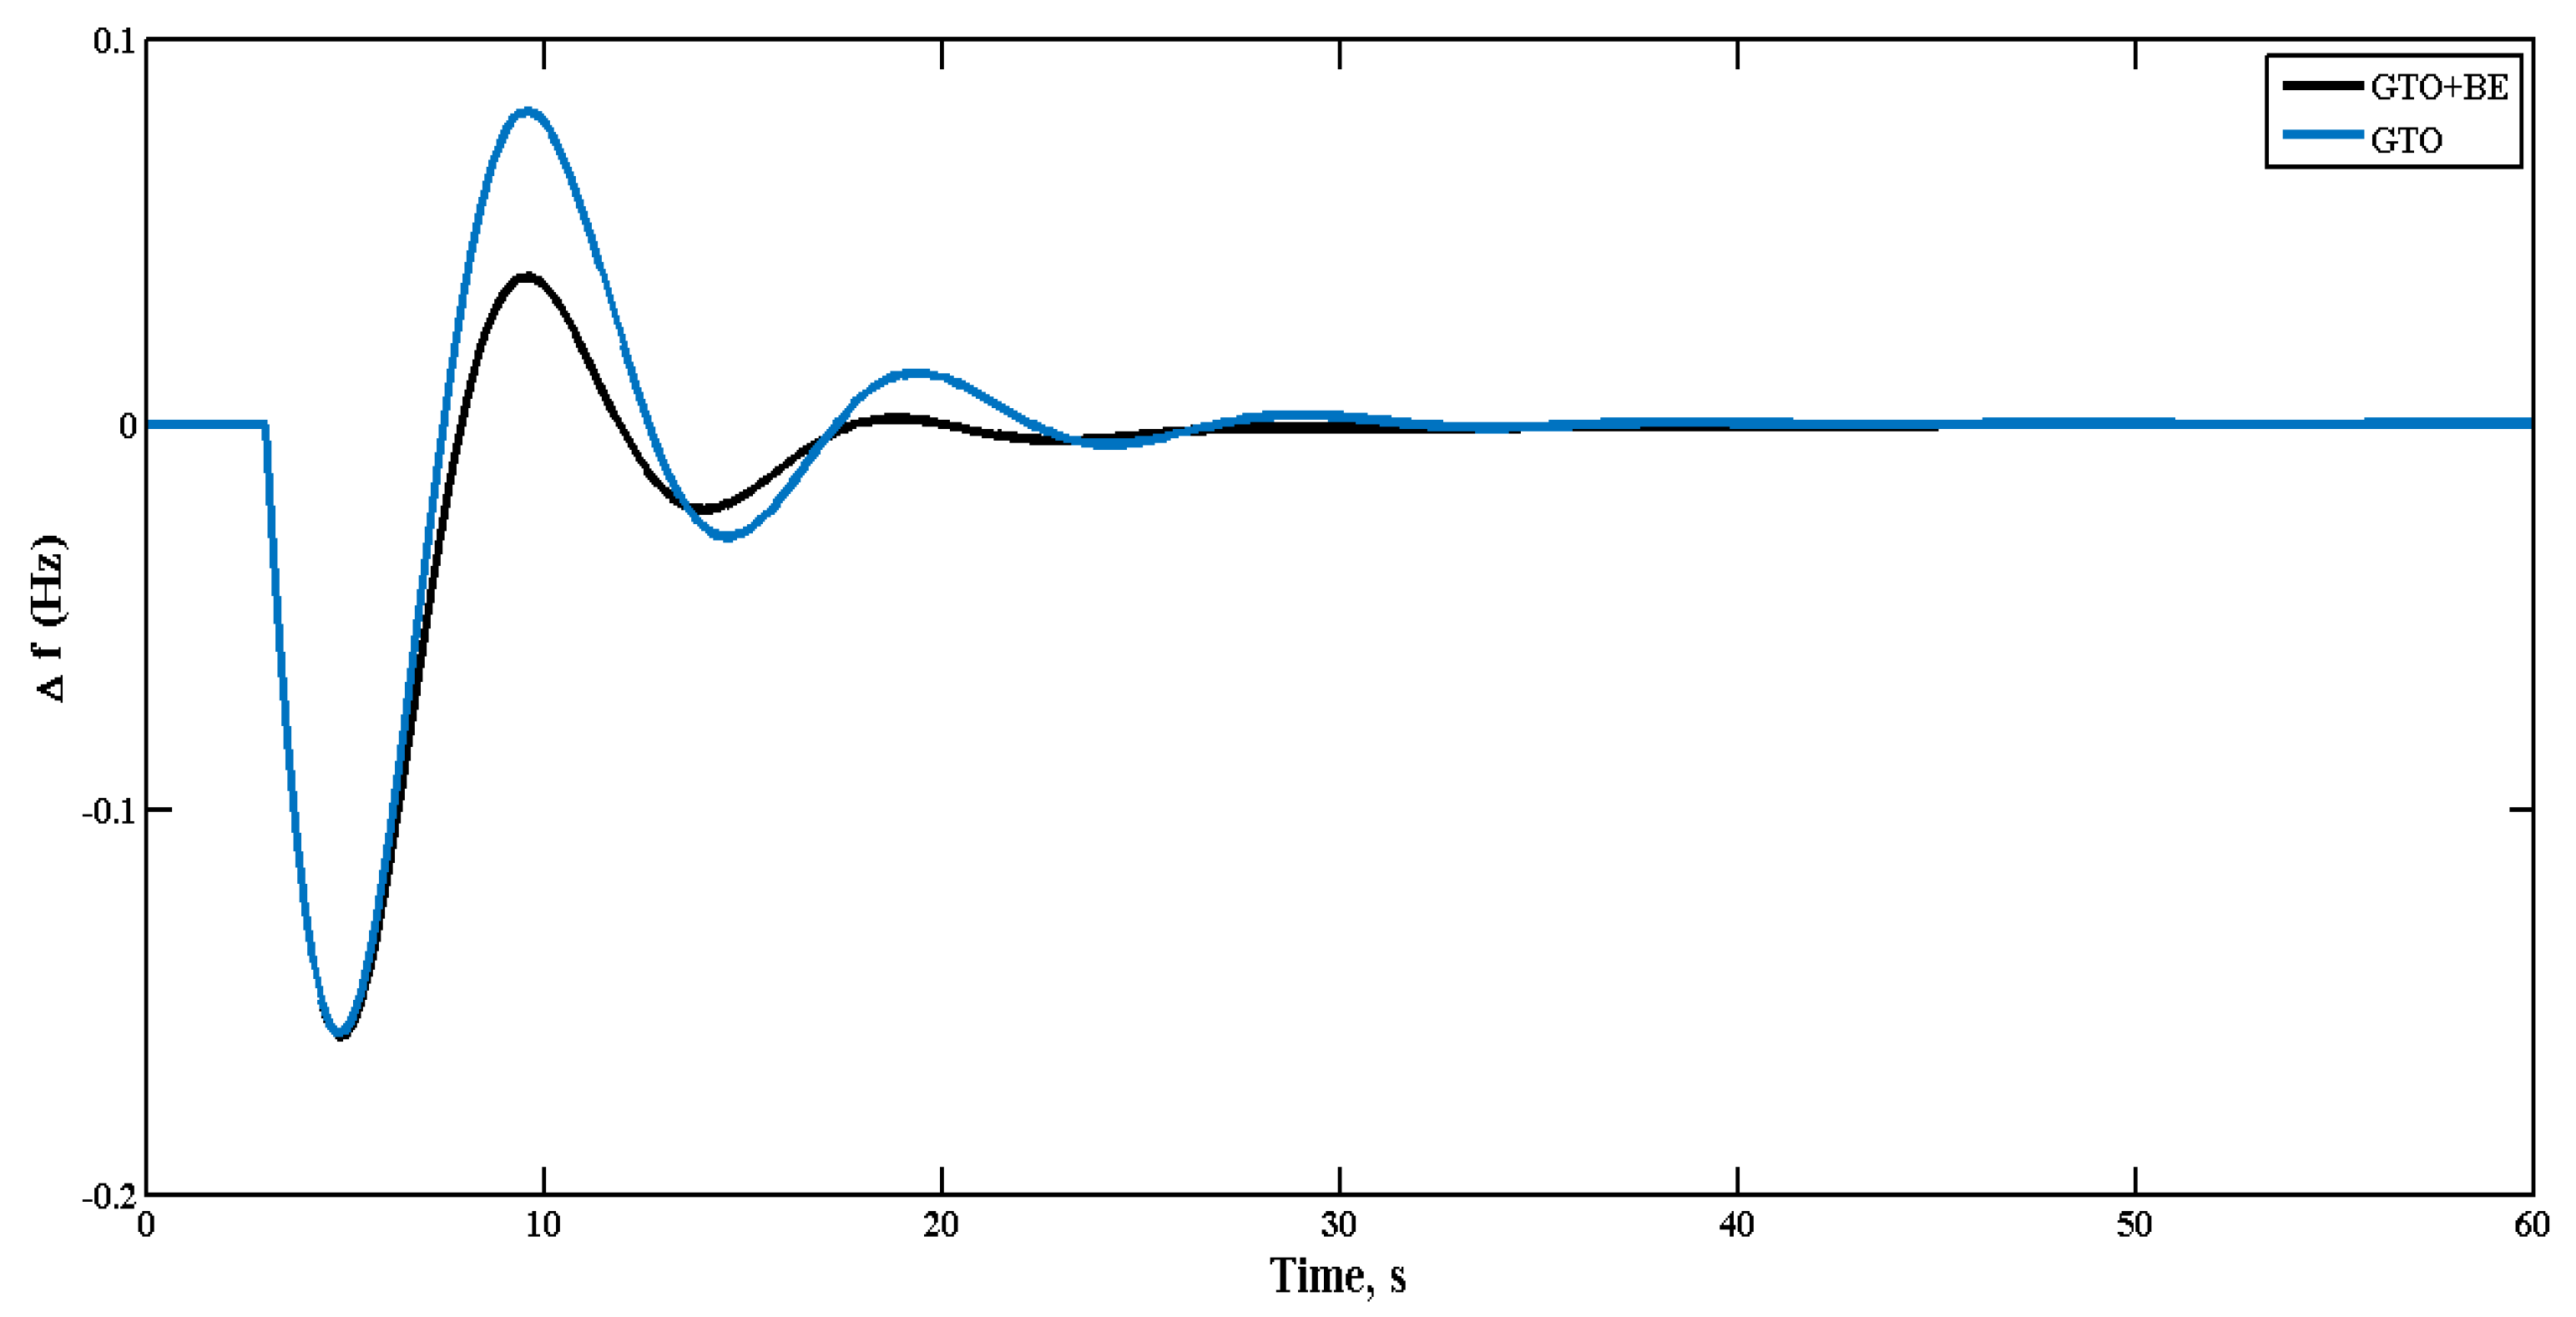
- An online adaptive LFC is presented using the GTO + BE optimization method;
- The effectiveness of a GTO + BE optimizer-adjusted integral controller in regulating frequency is discussed;
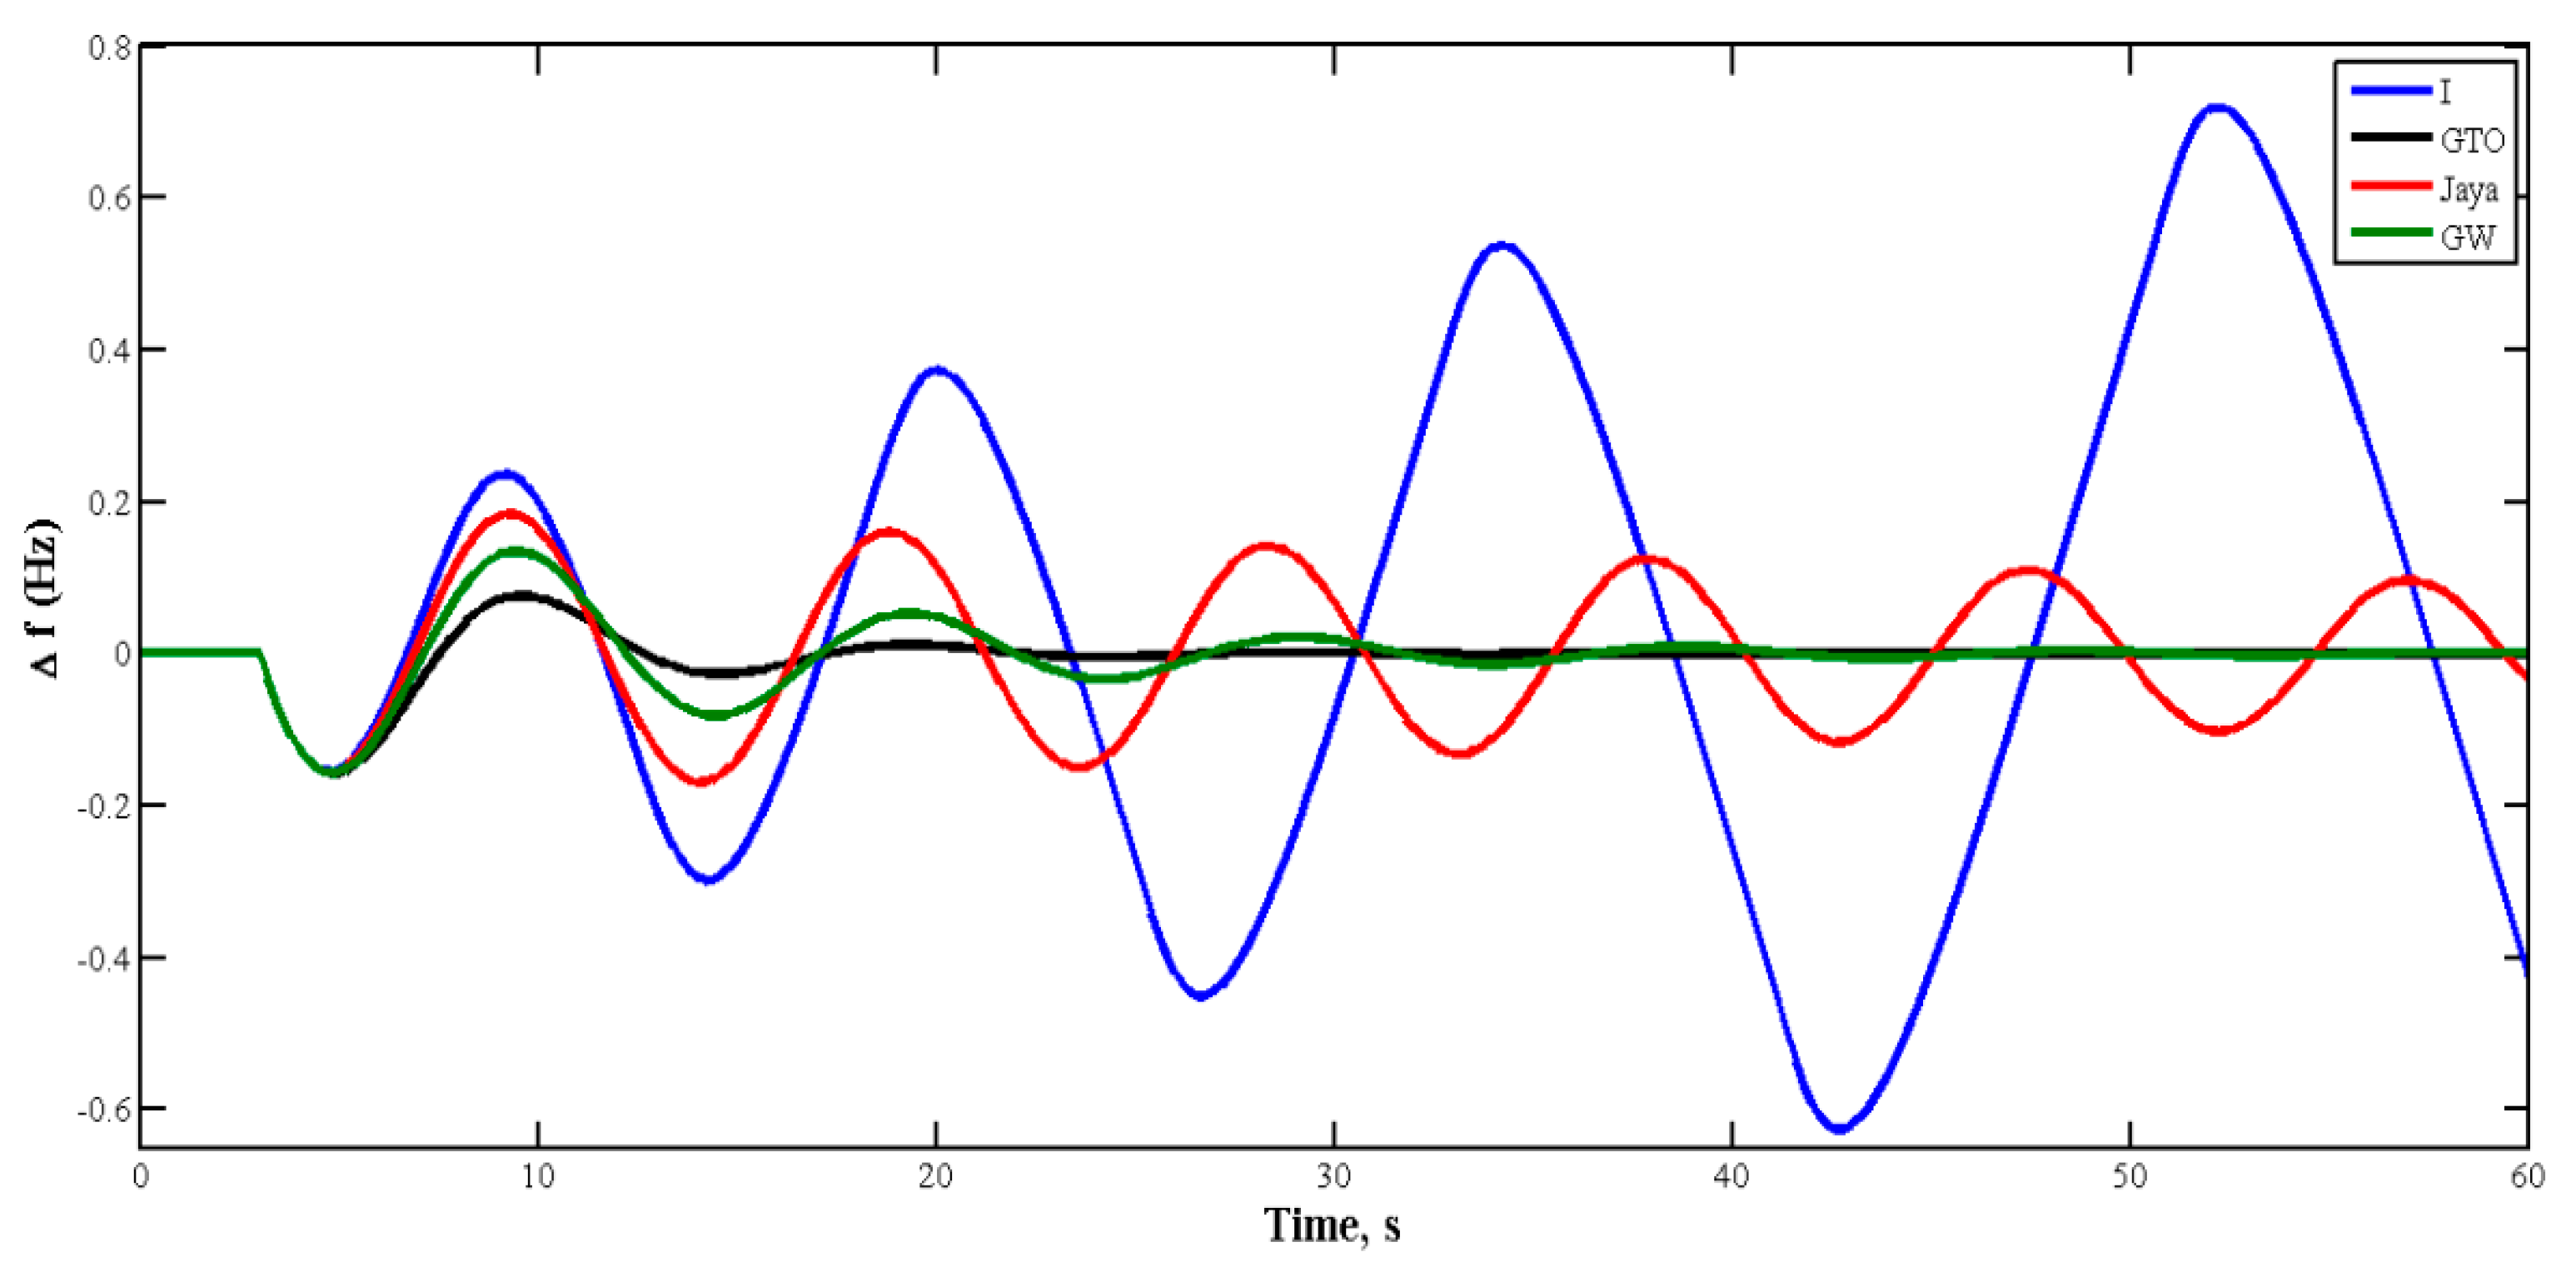
- A system with the proposed adaptive technique gives performance better than those systems with conventional GTO, GWO and Jaya Algorithms.
1.3. The Organization of the Paper
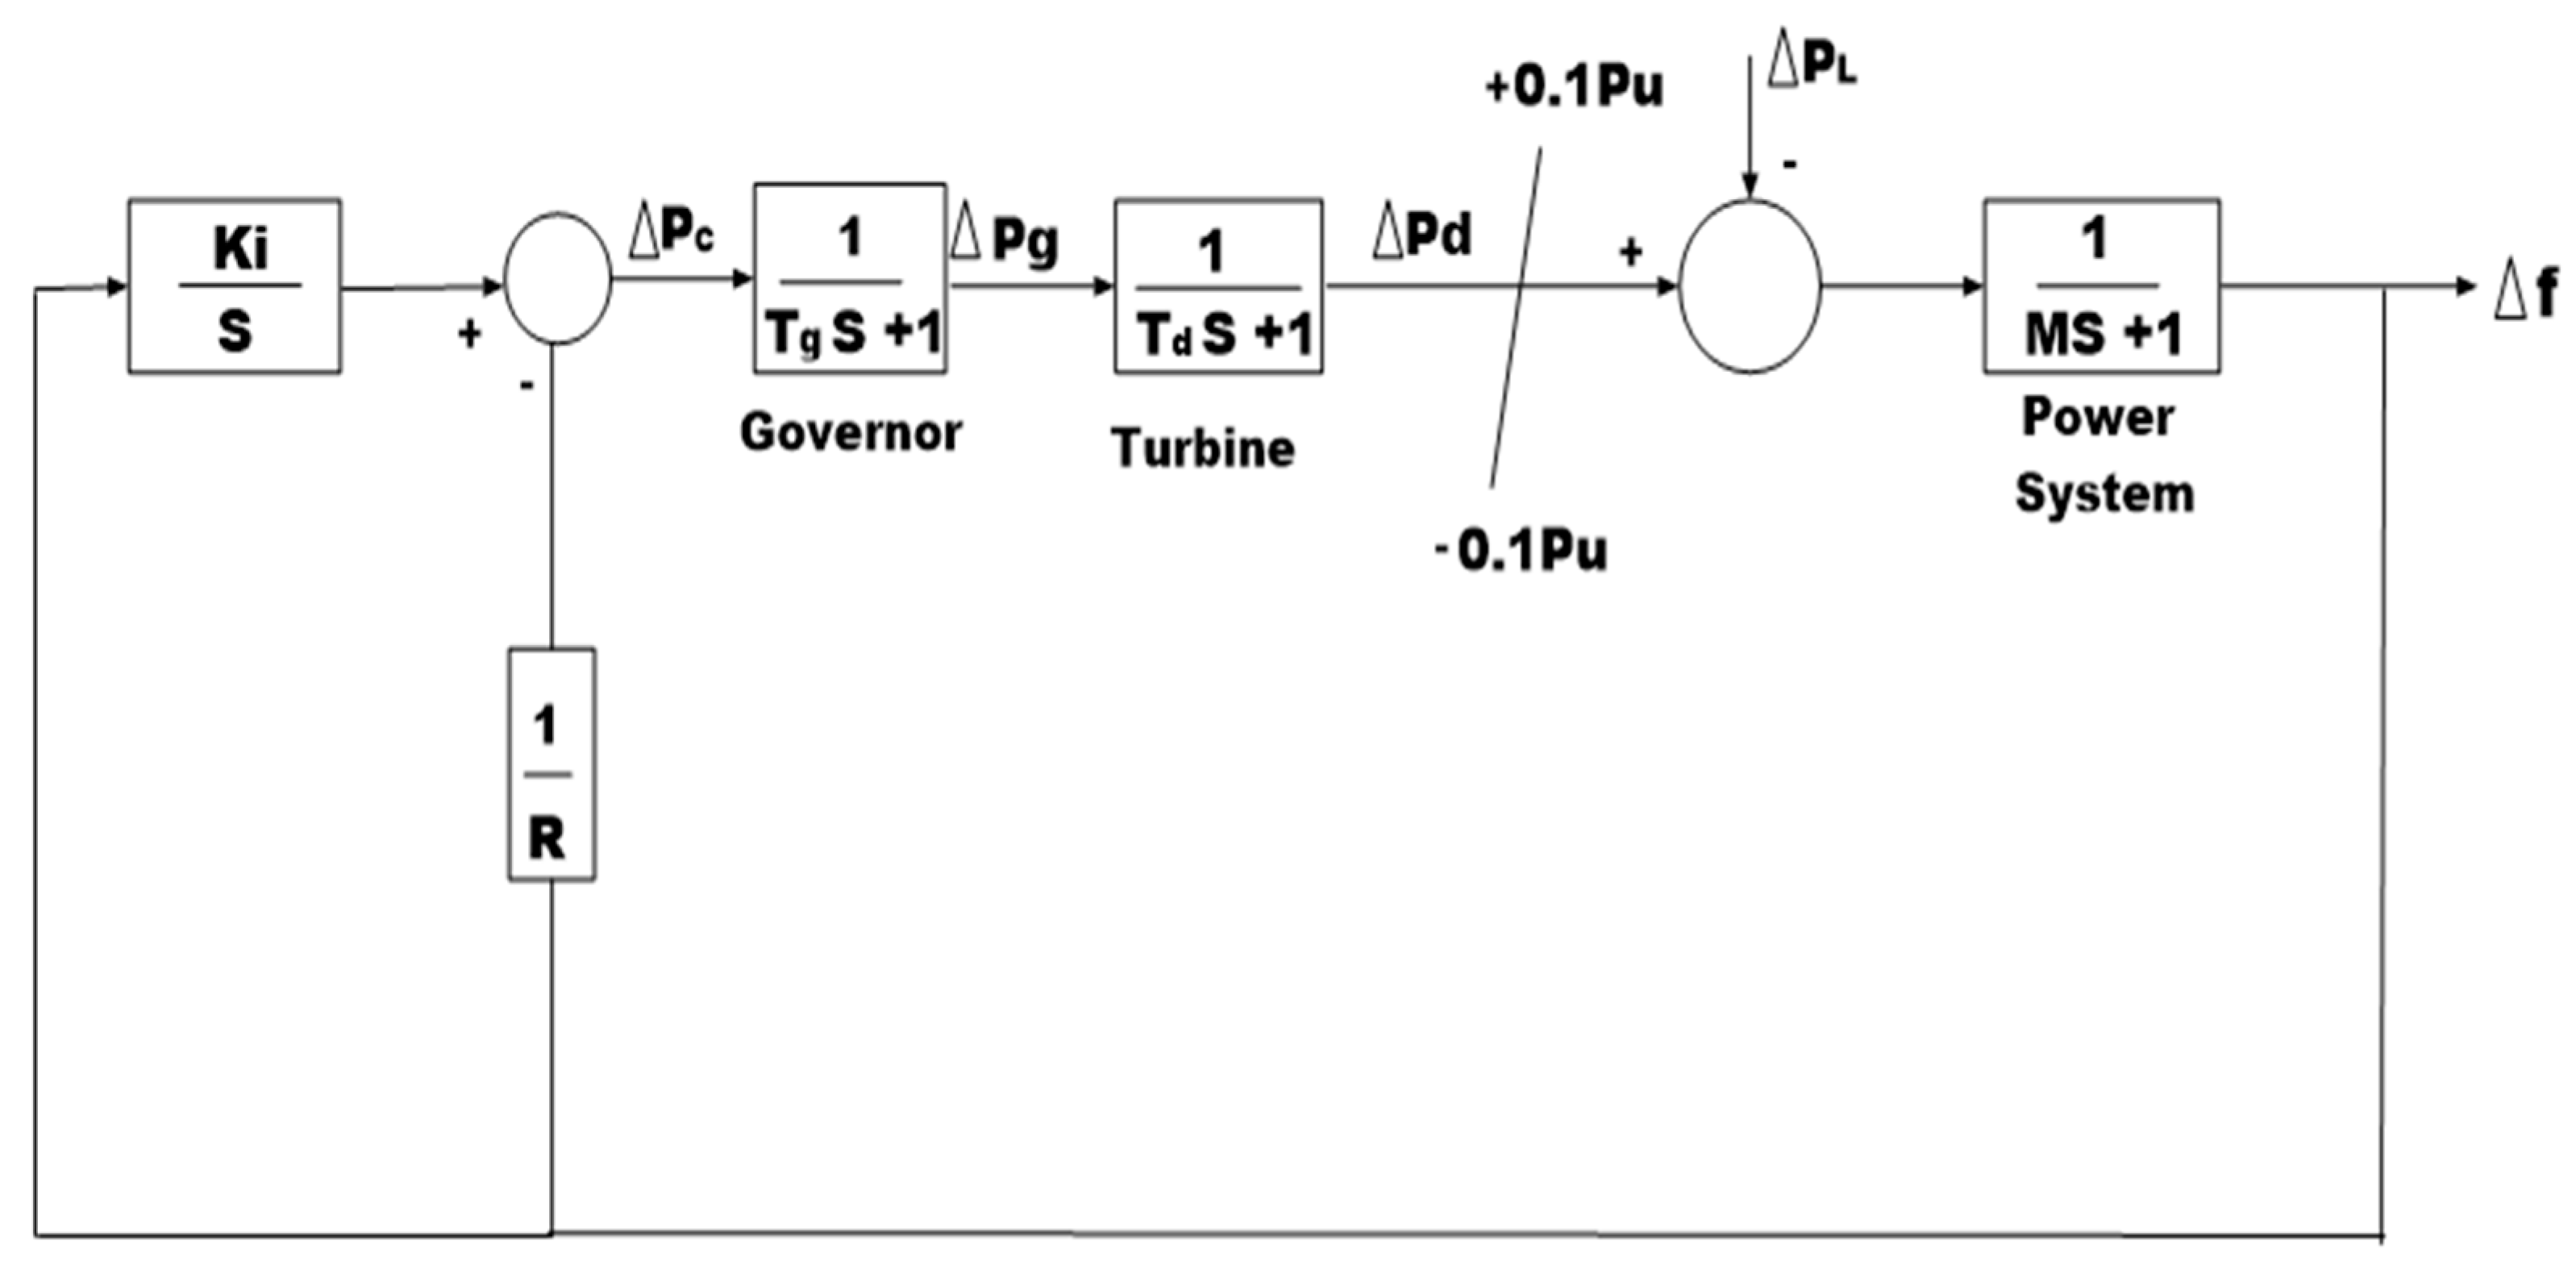
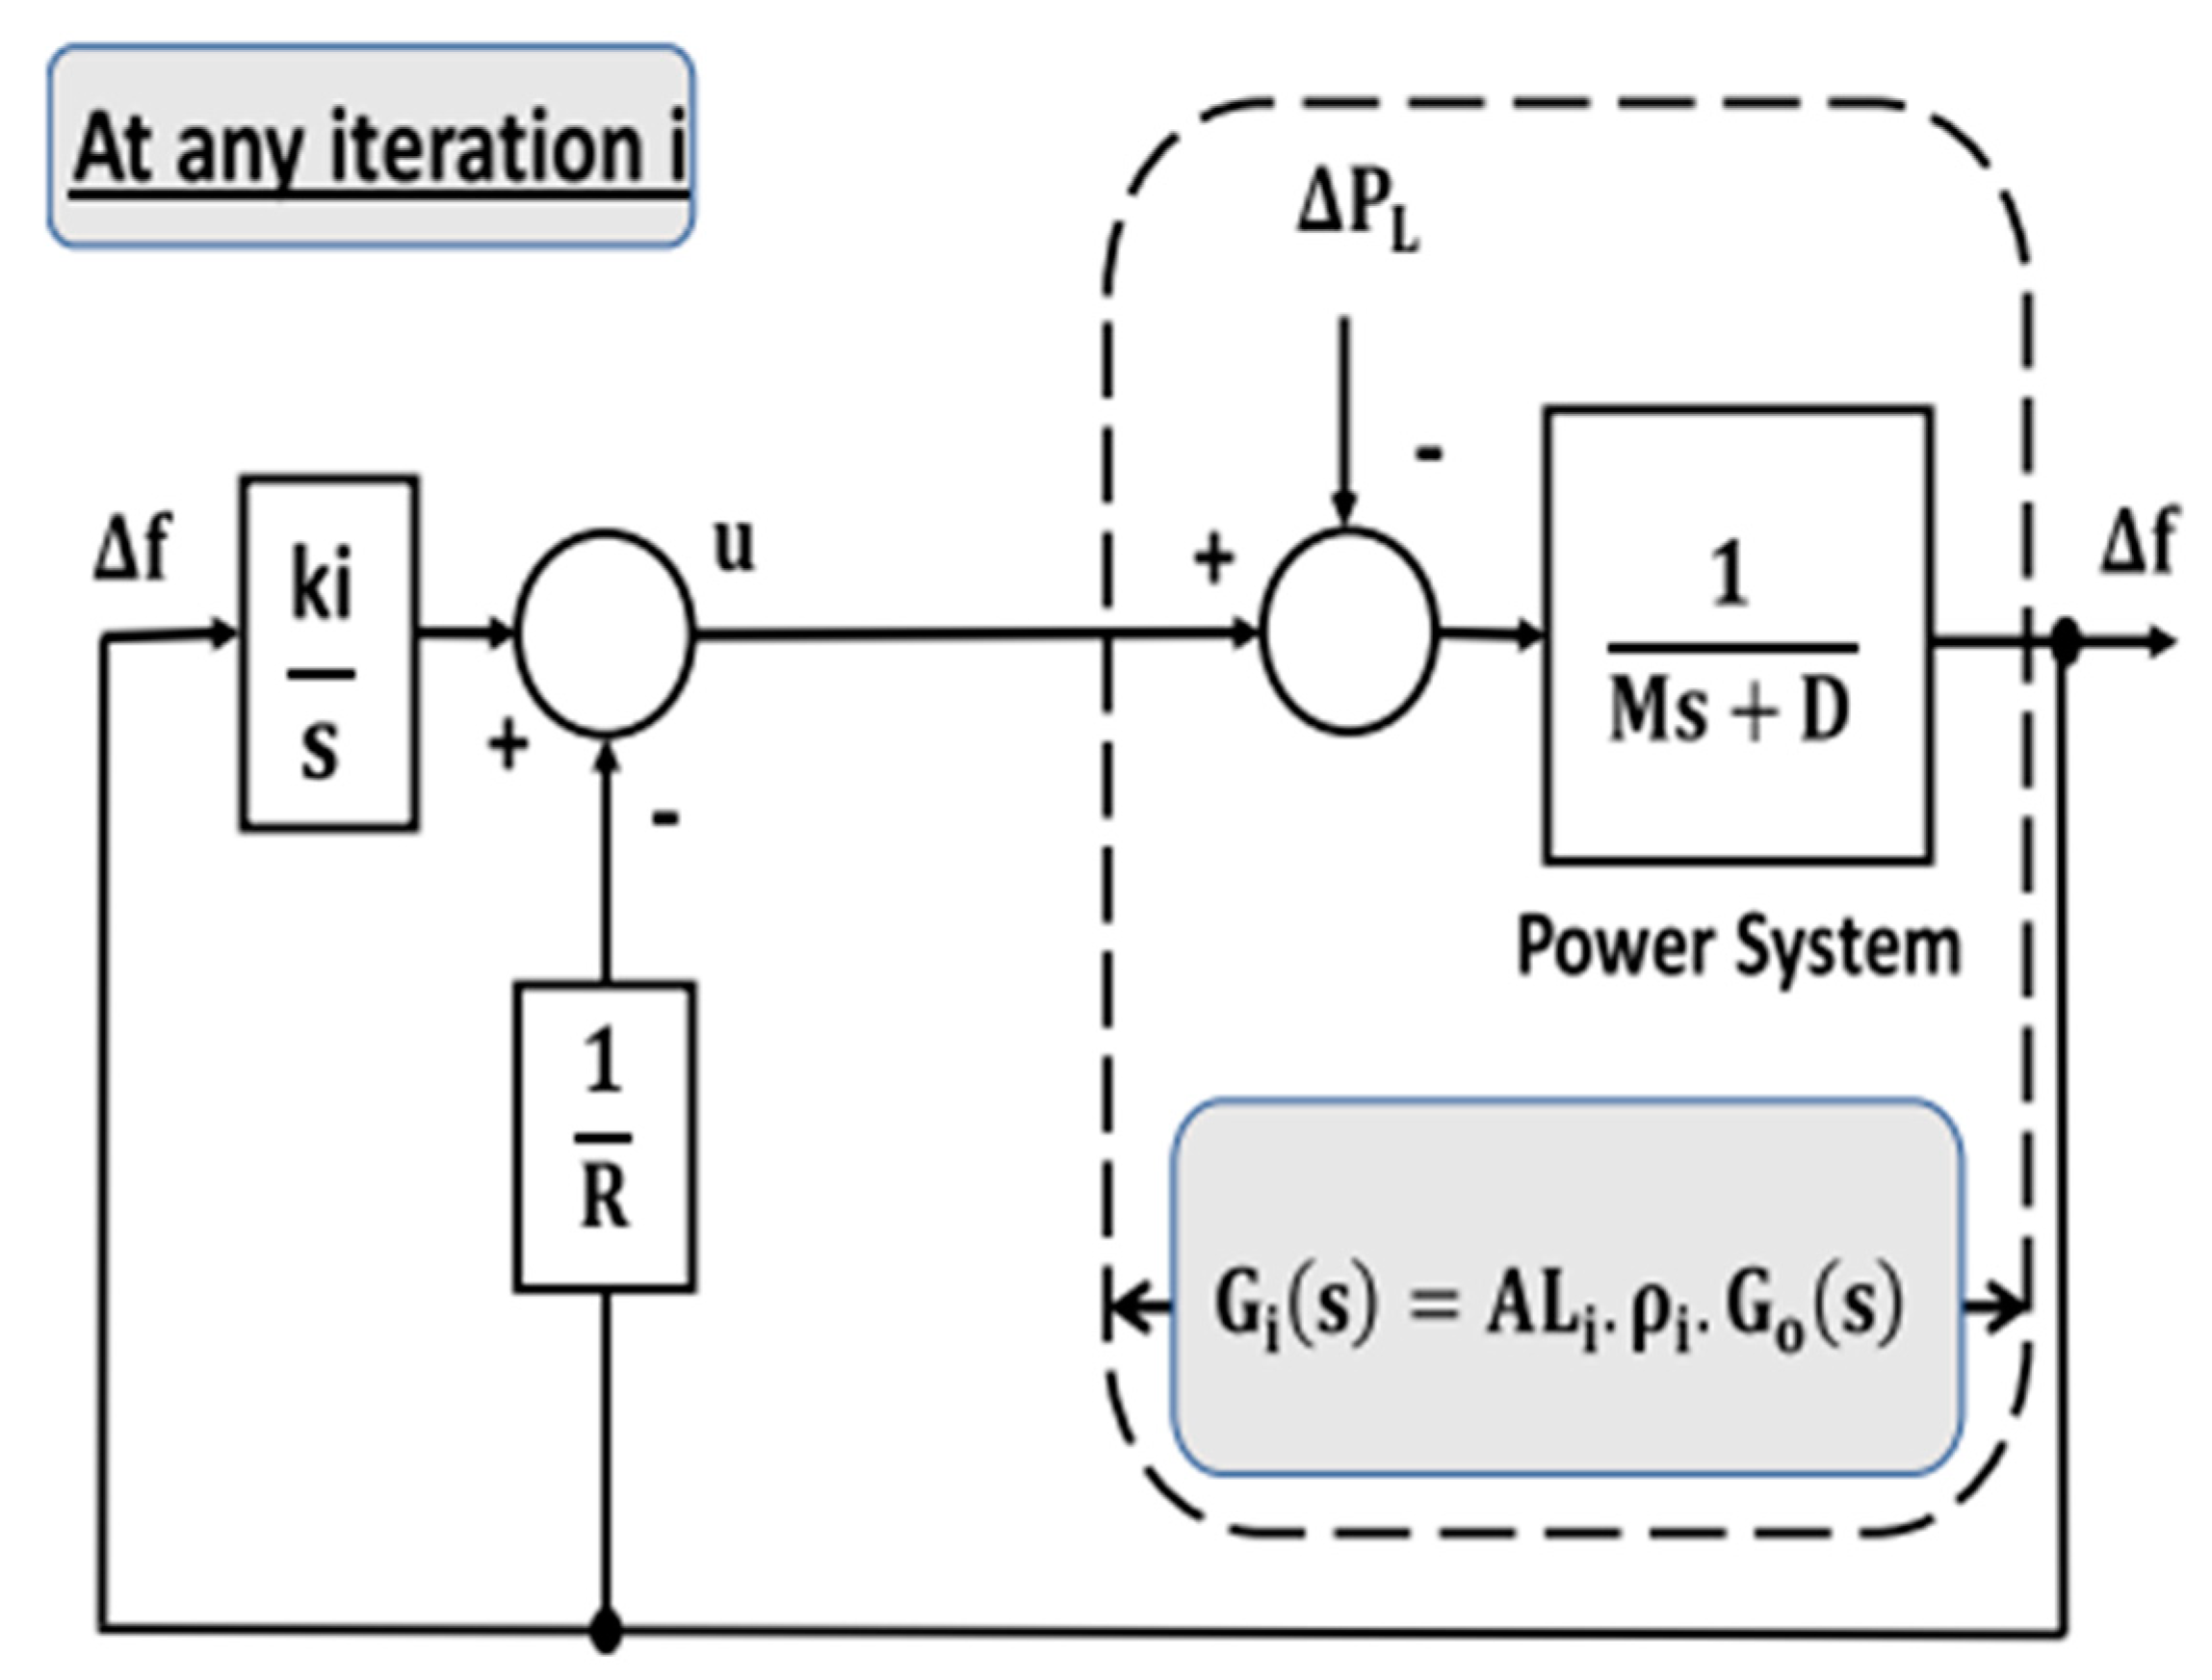
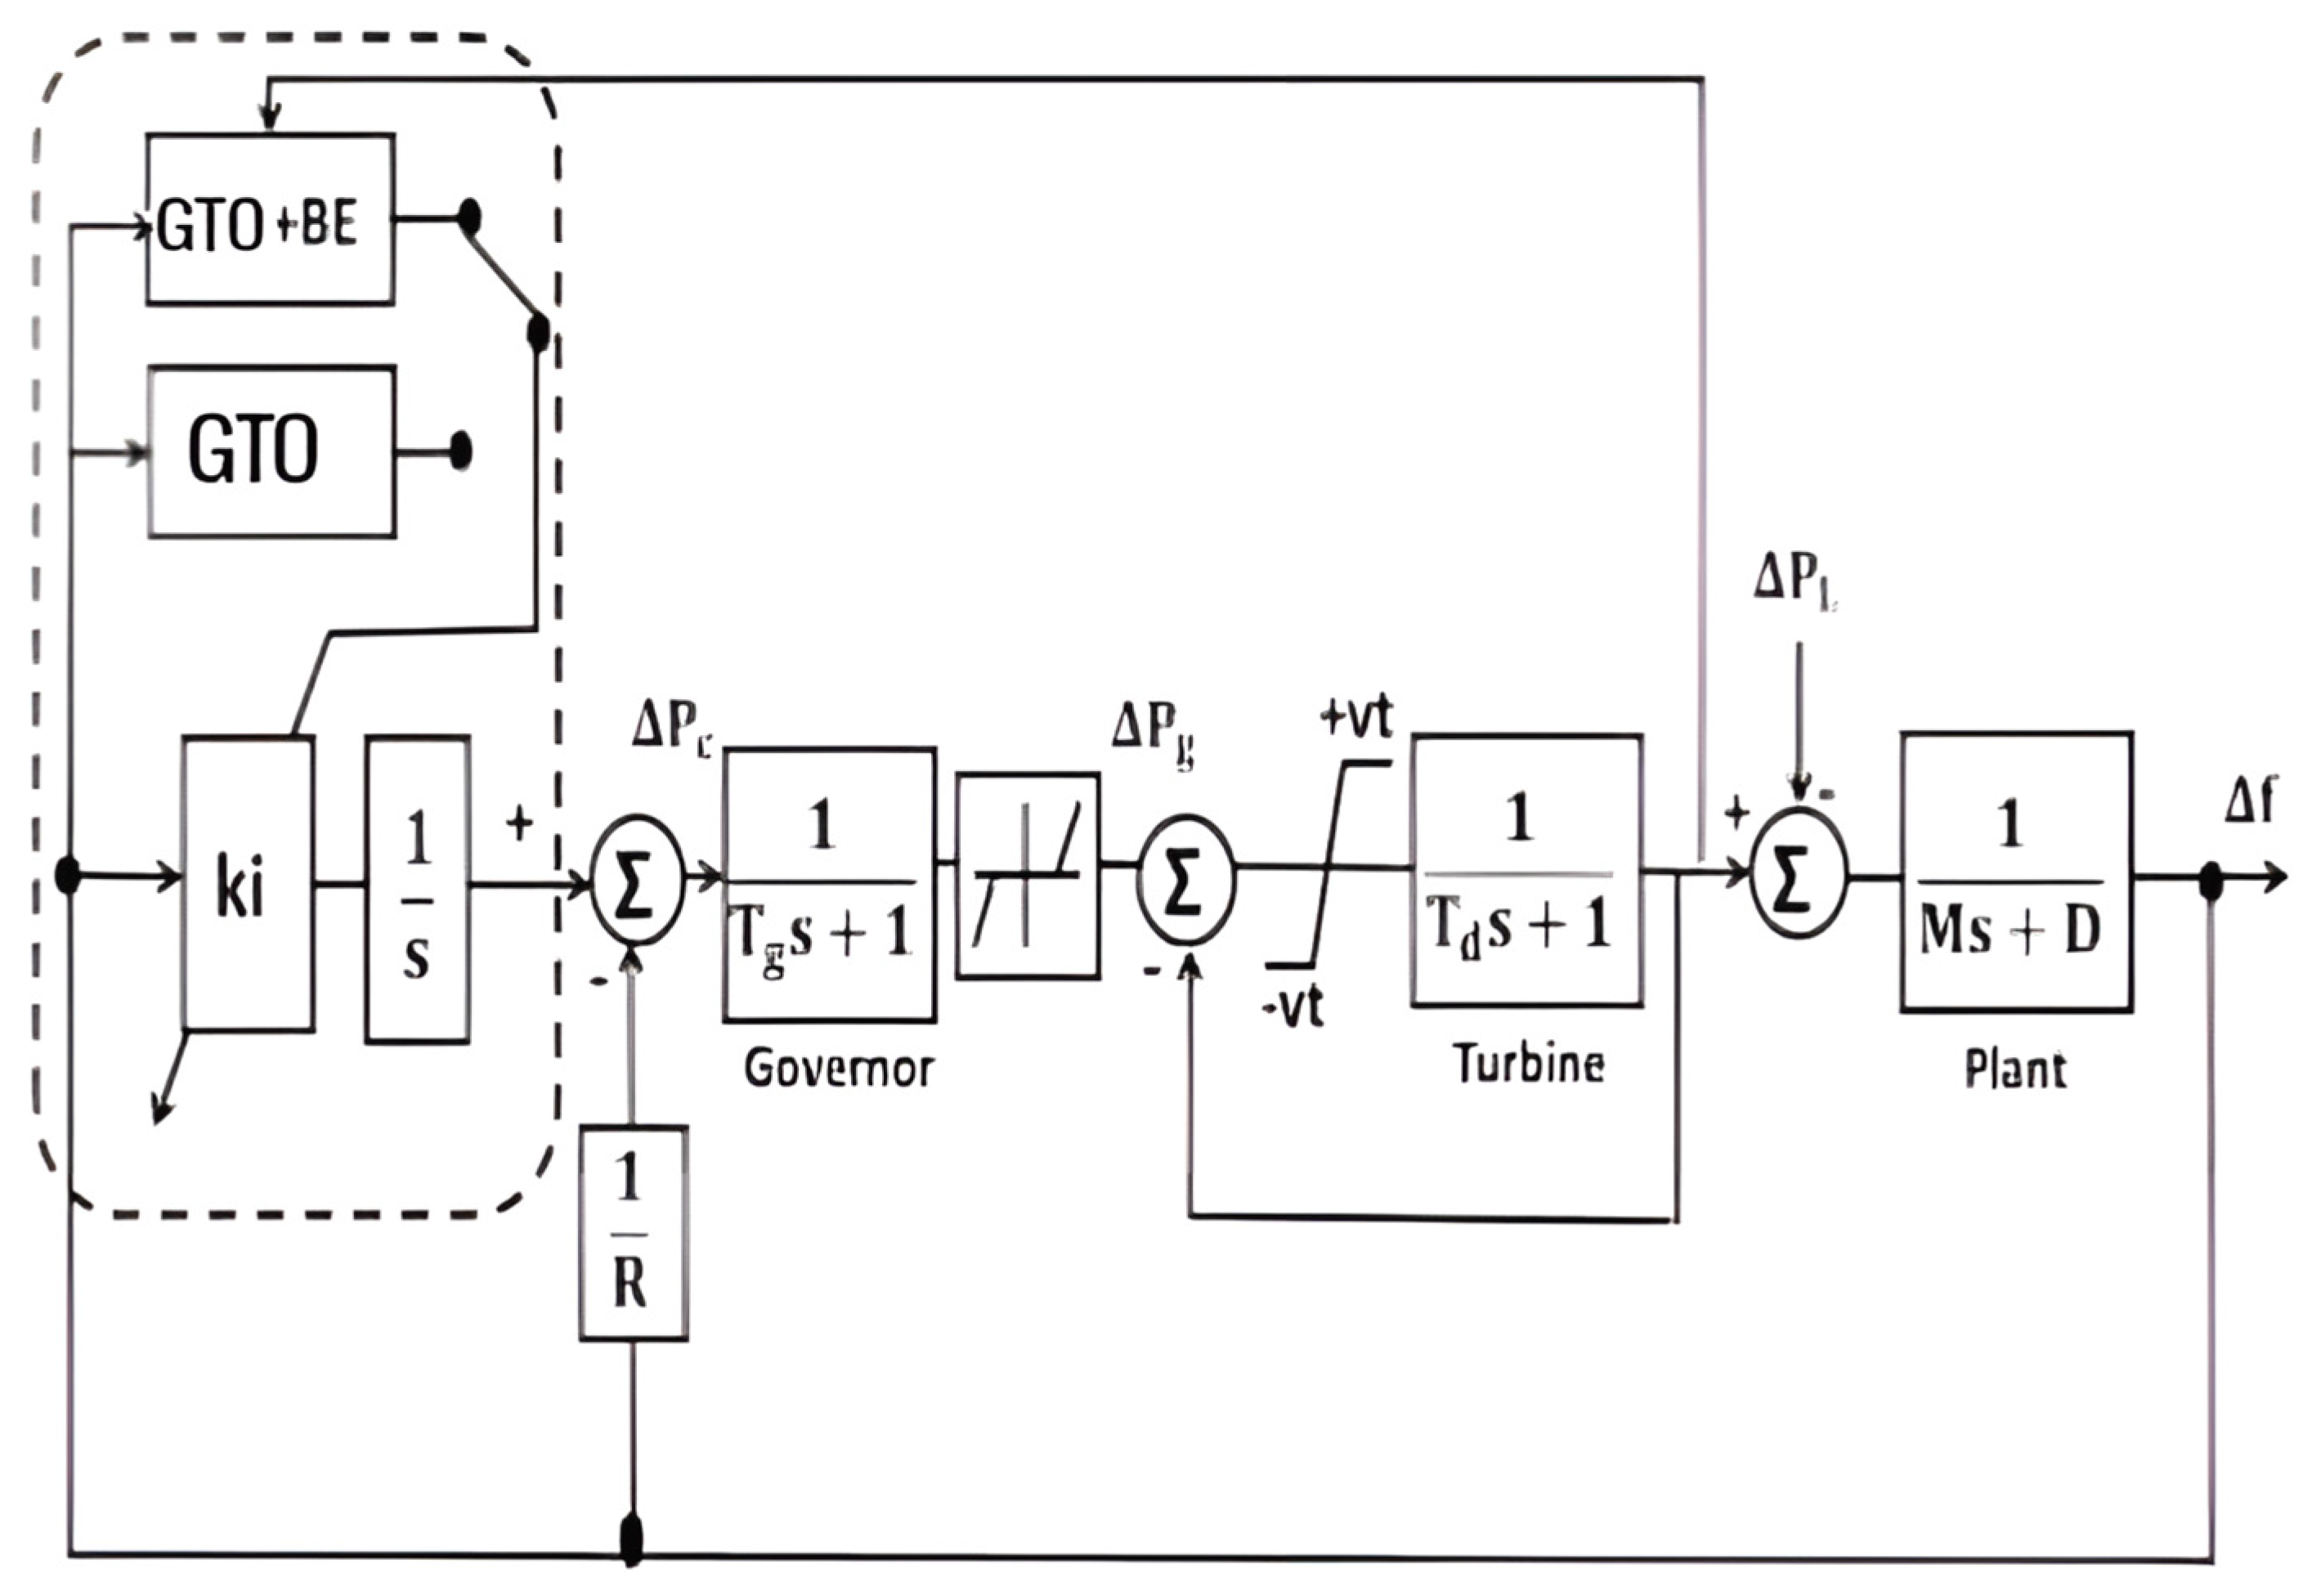
2. Power System Dynamic Model
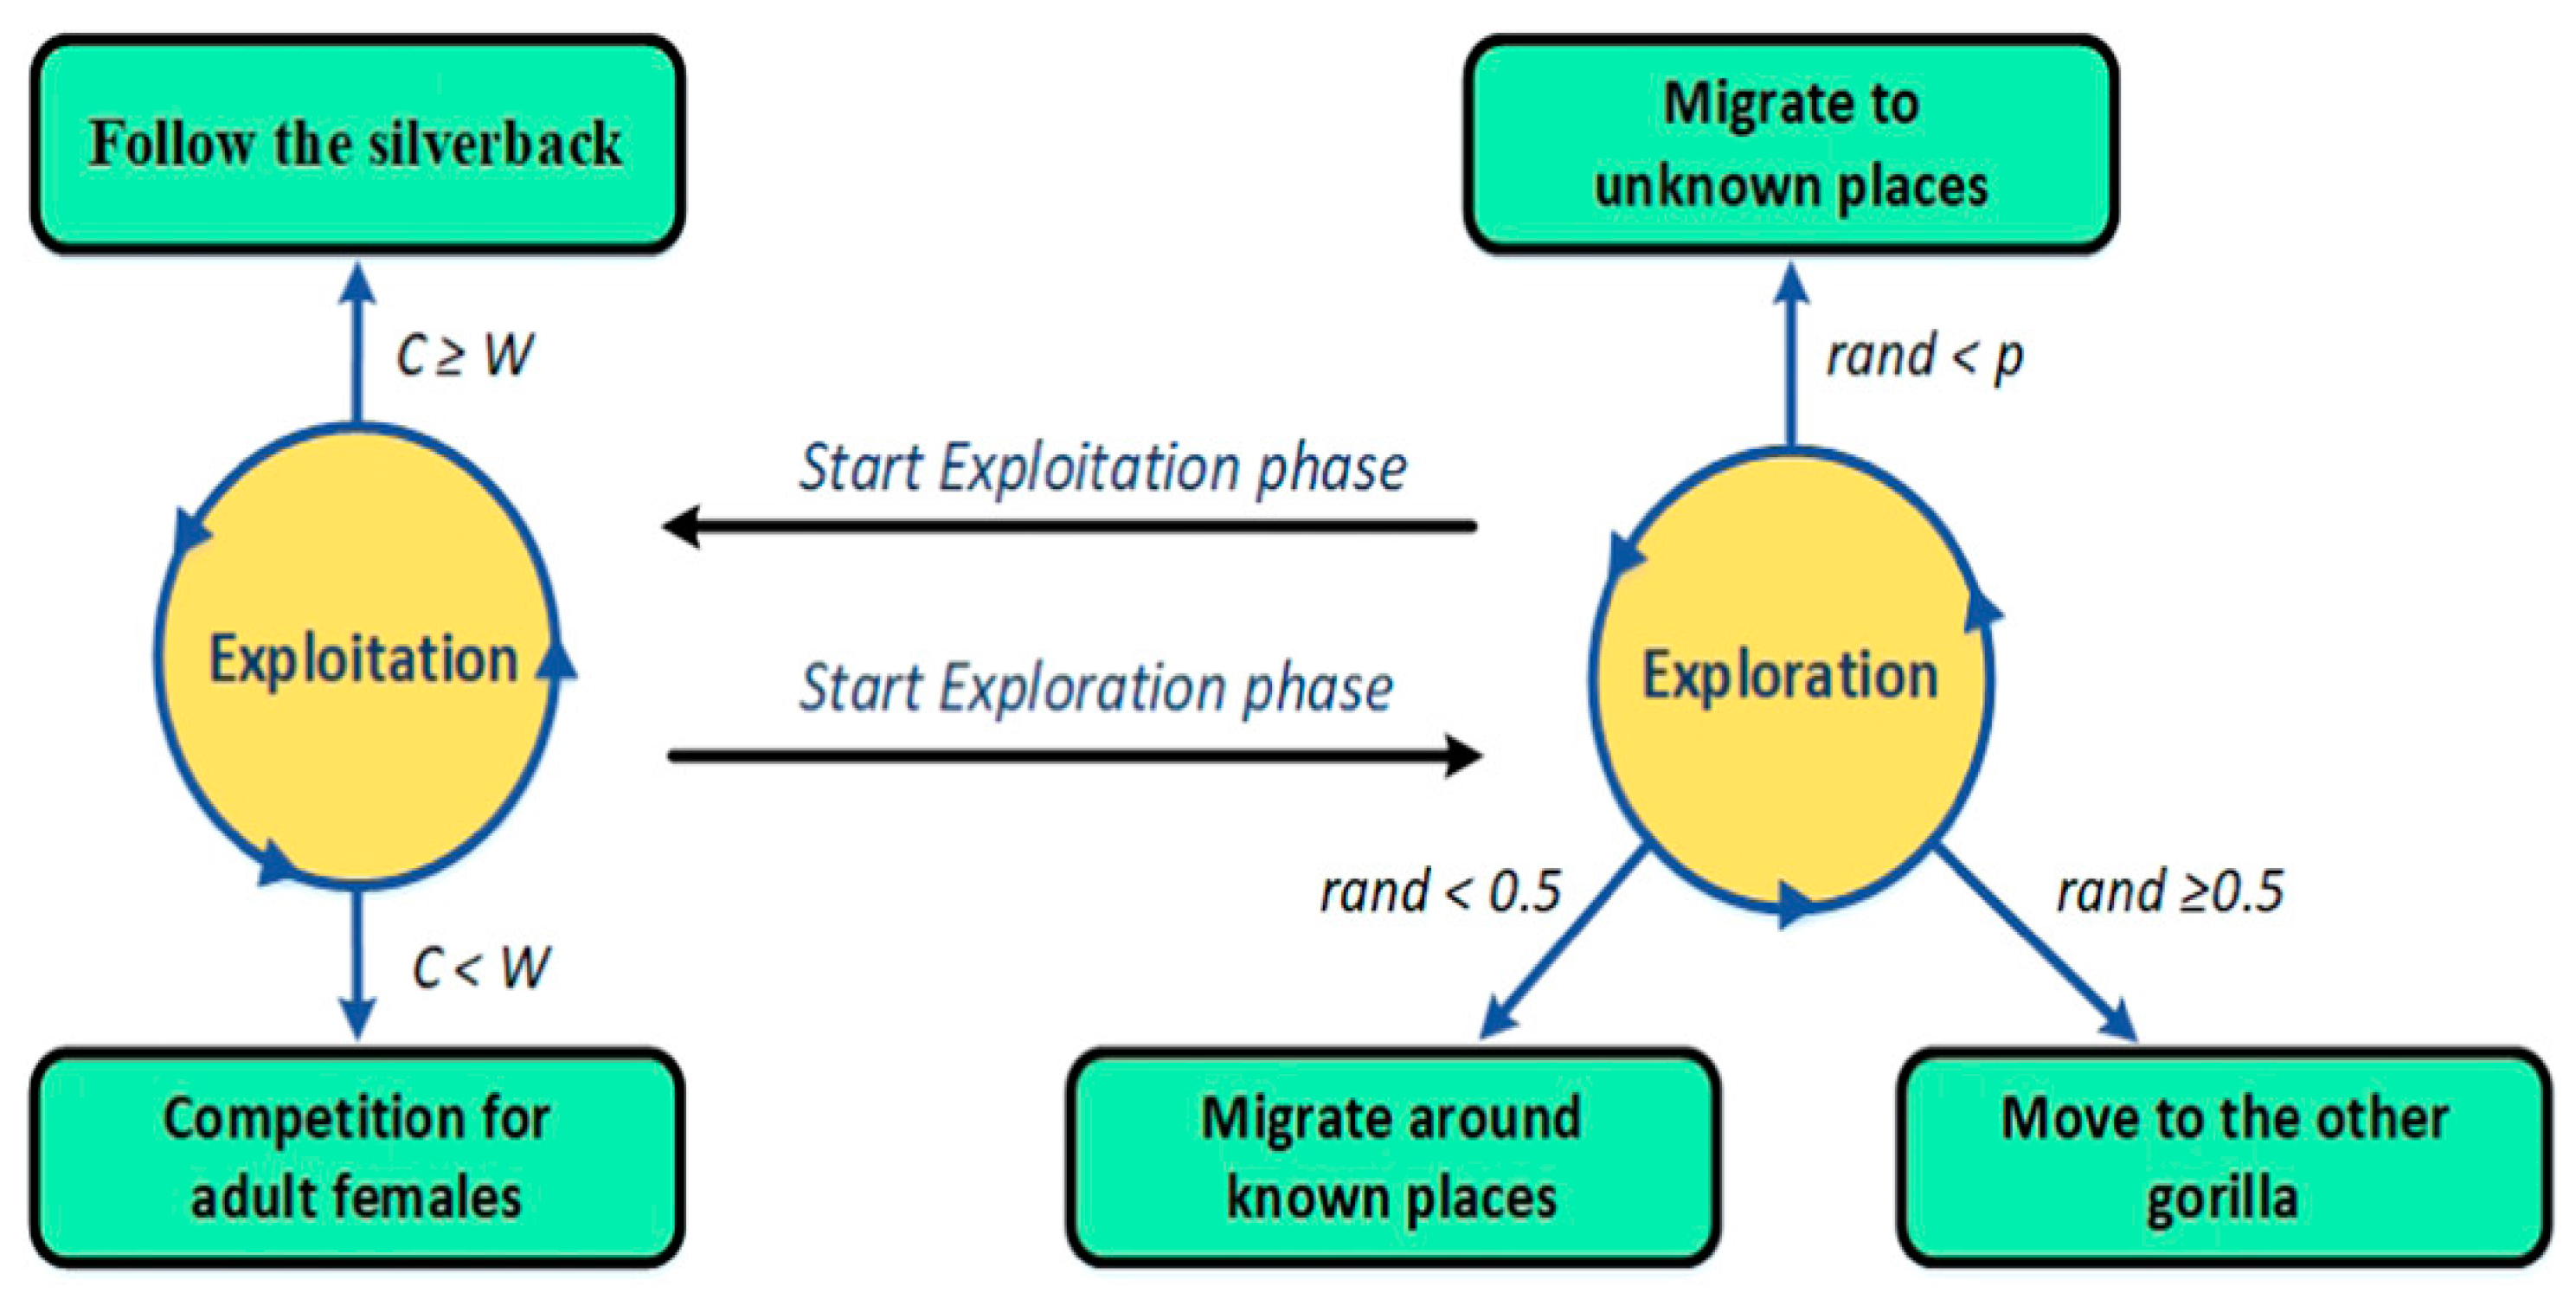
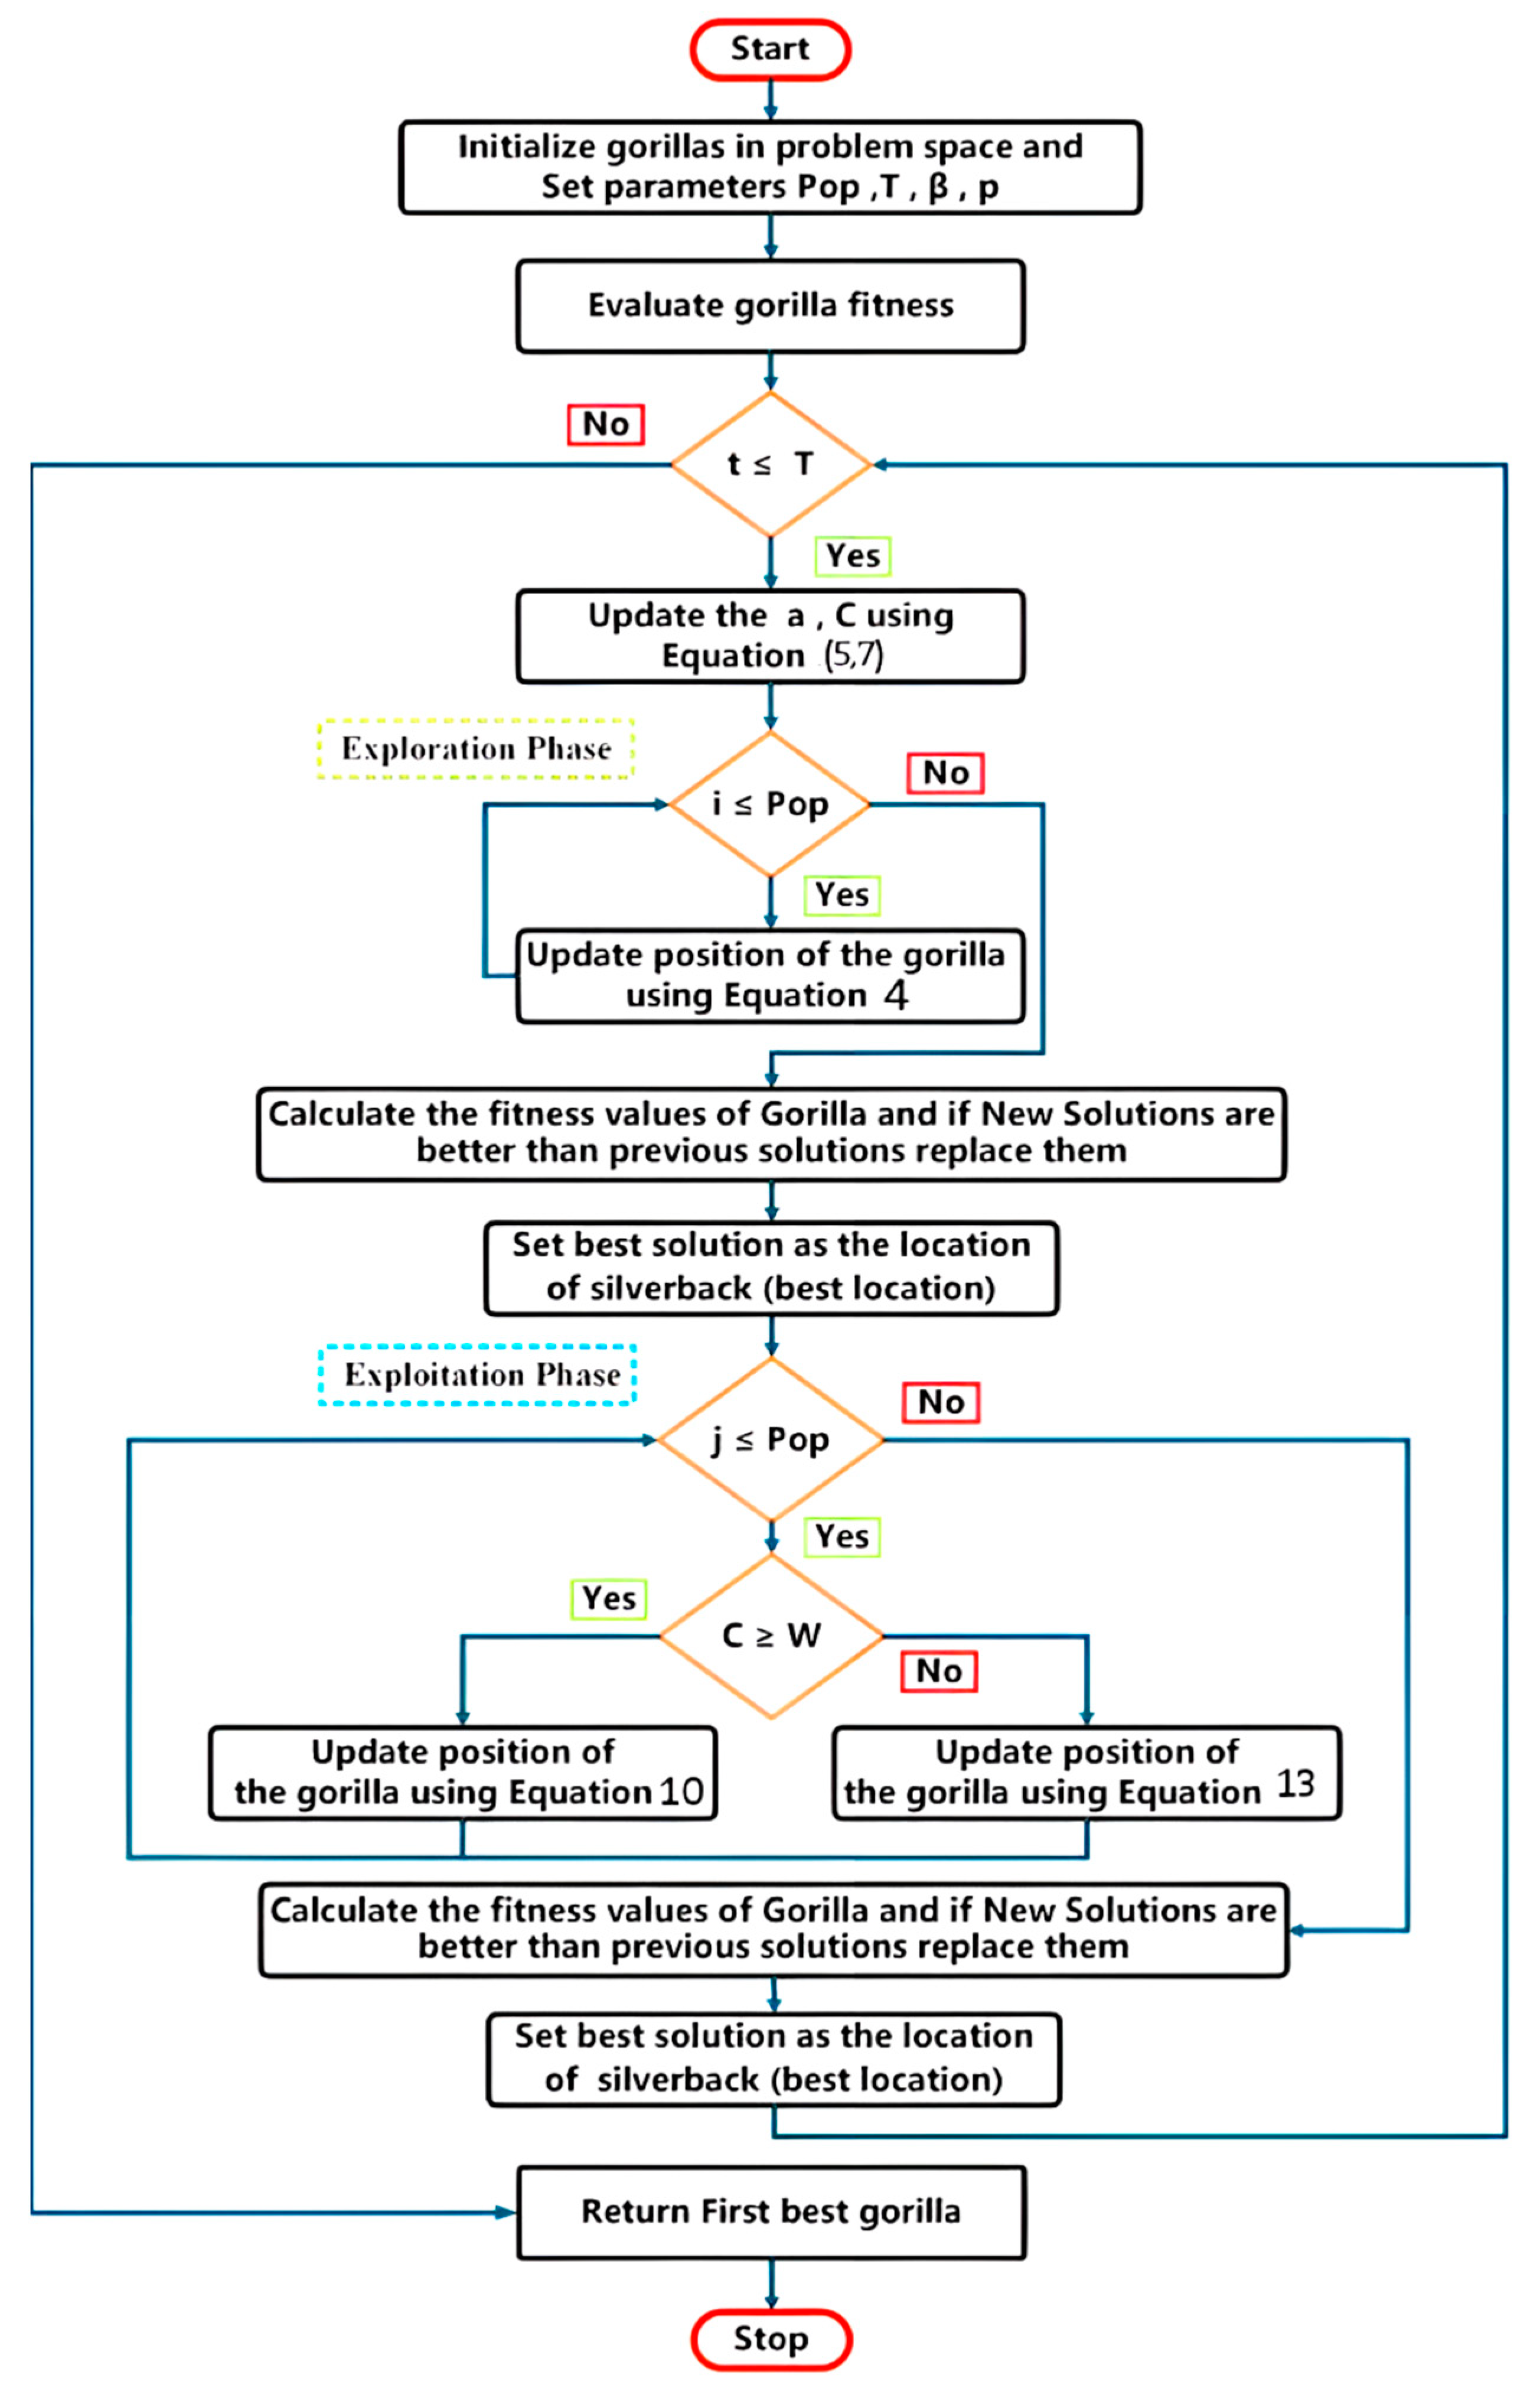
3. Artificial Gorilla Troops Optimization Algorithm (GTO)
- GTO exploration can be increased by migration to an unknown location;
- Moving on to the other gorillas will increase the balance between exploitation and exploration;
- GTO can search for different optimization spaces in more detail when it migrates towards a known location.
- Staying with the silverback, and
- A struggle associated with female adulthood.
3.1. Exploration Phase
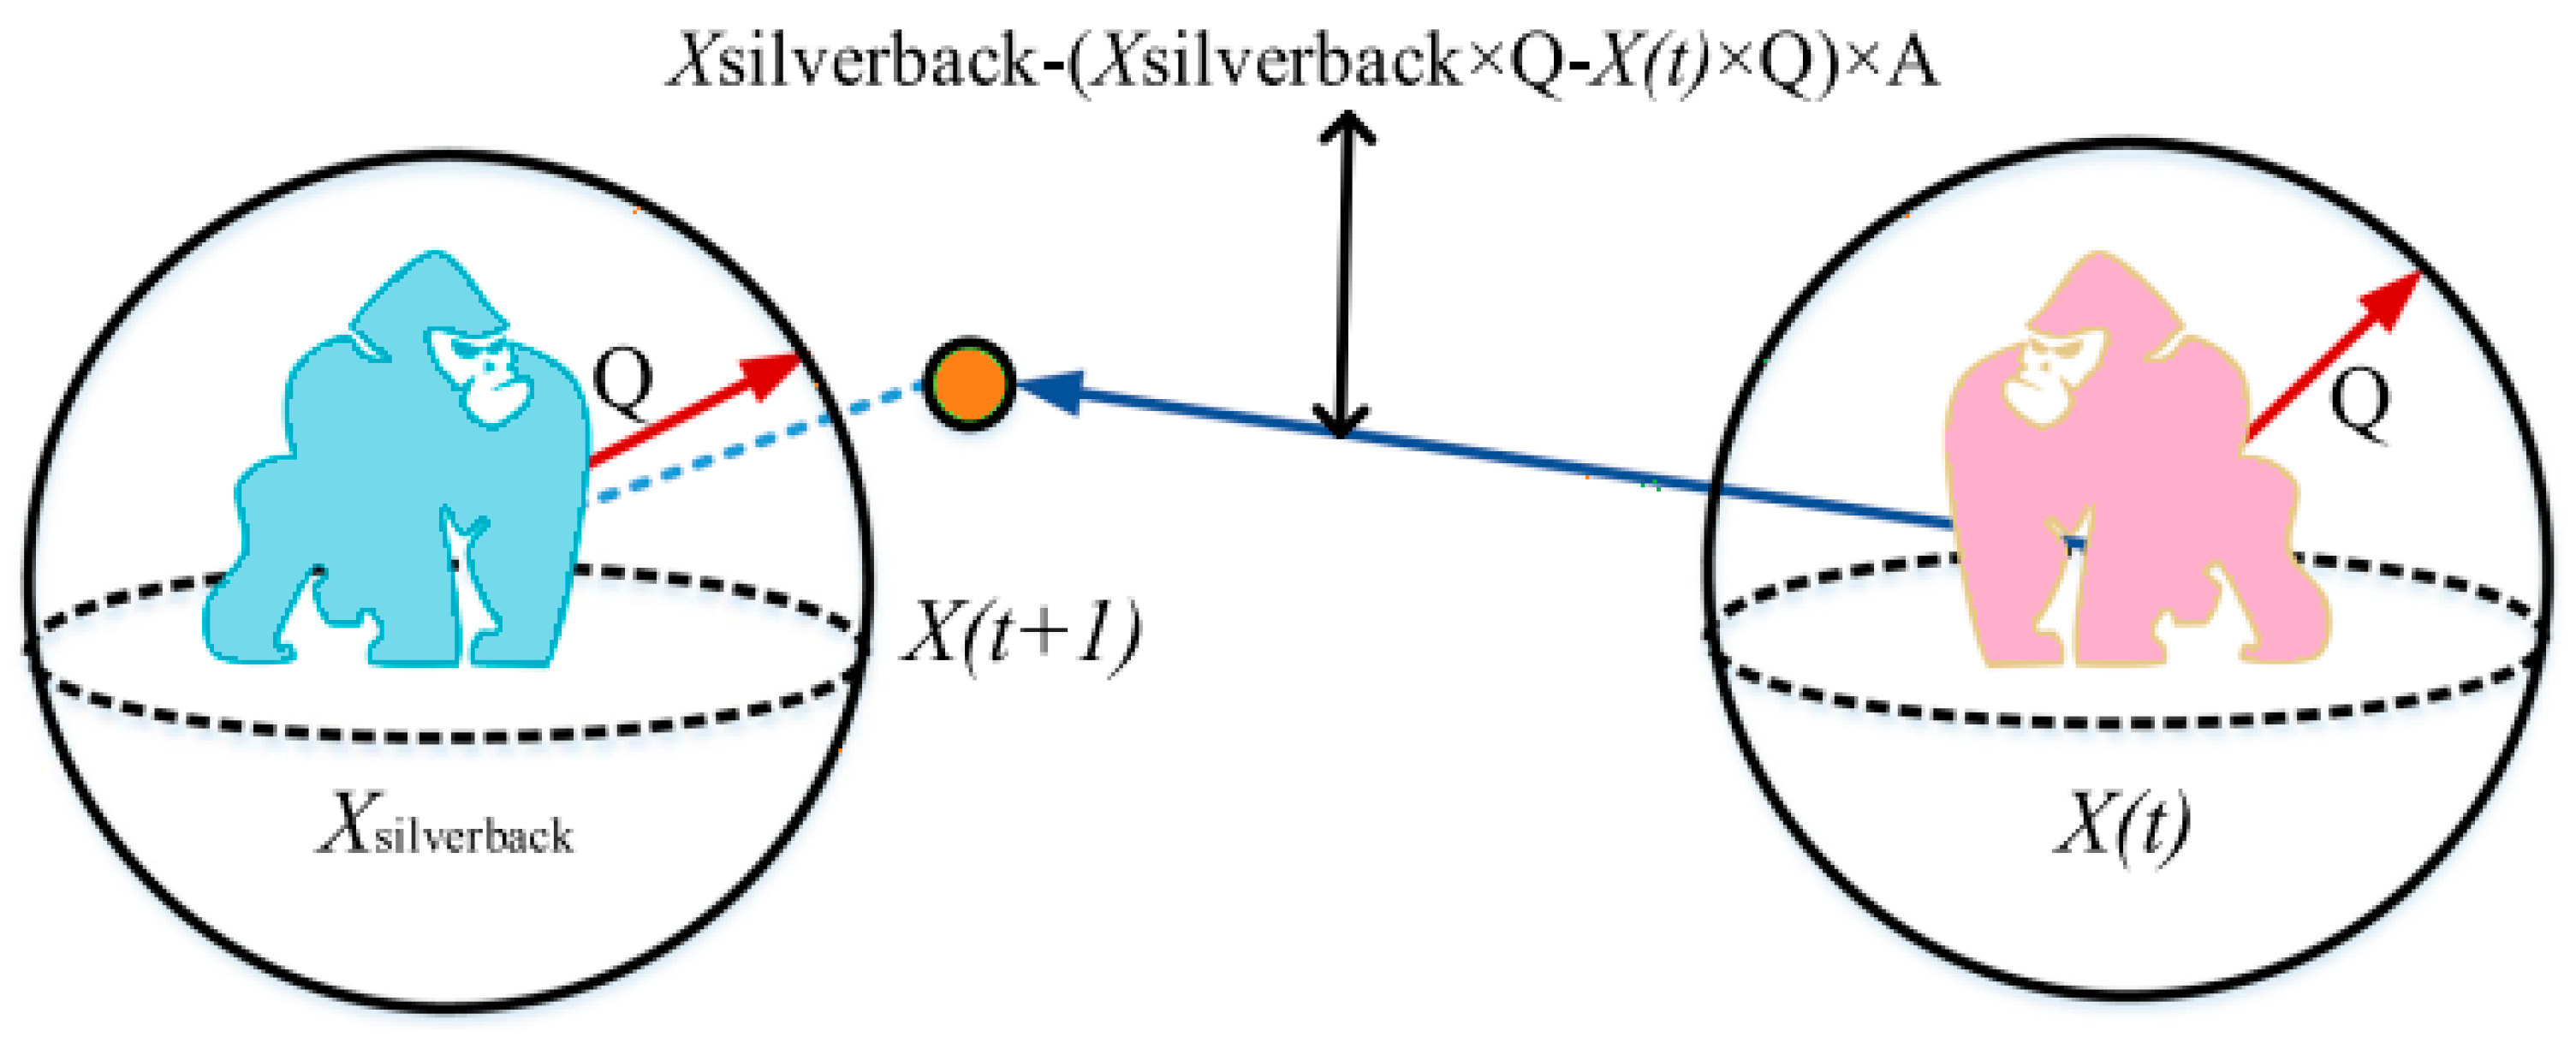
3.2. Exploitation Phase
3.2.1. Follow the Silverback
3.2.2. Competition for Adult Females
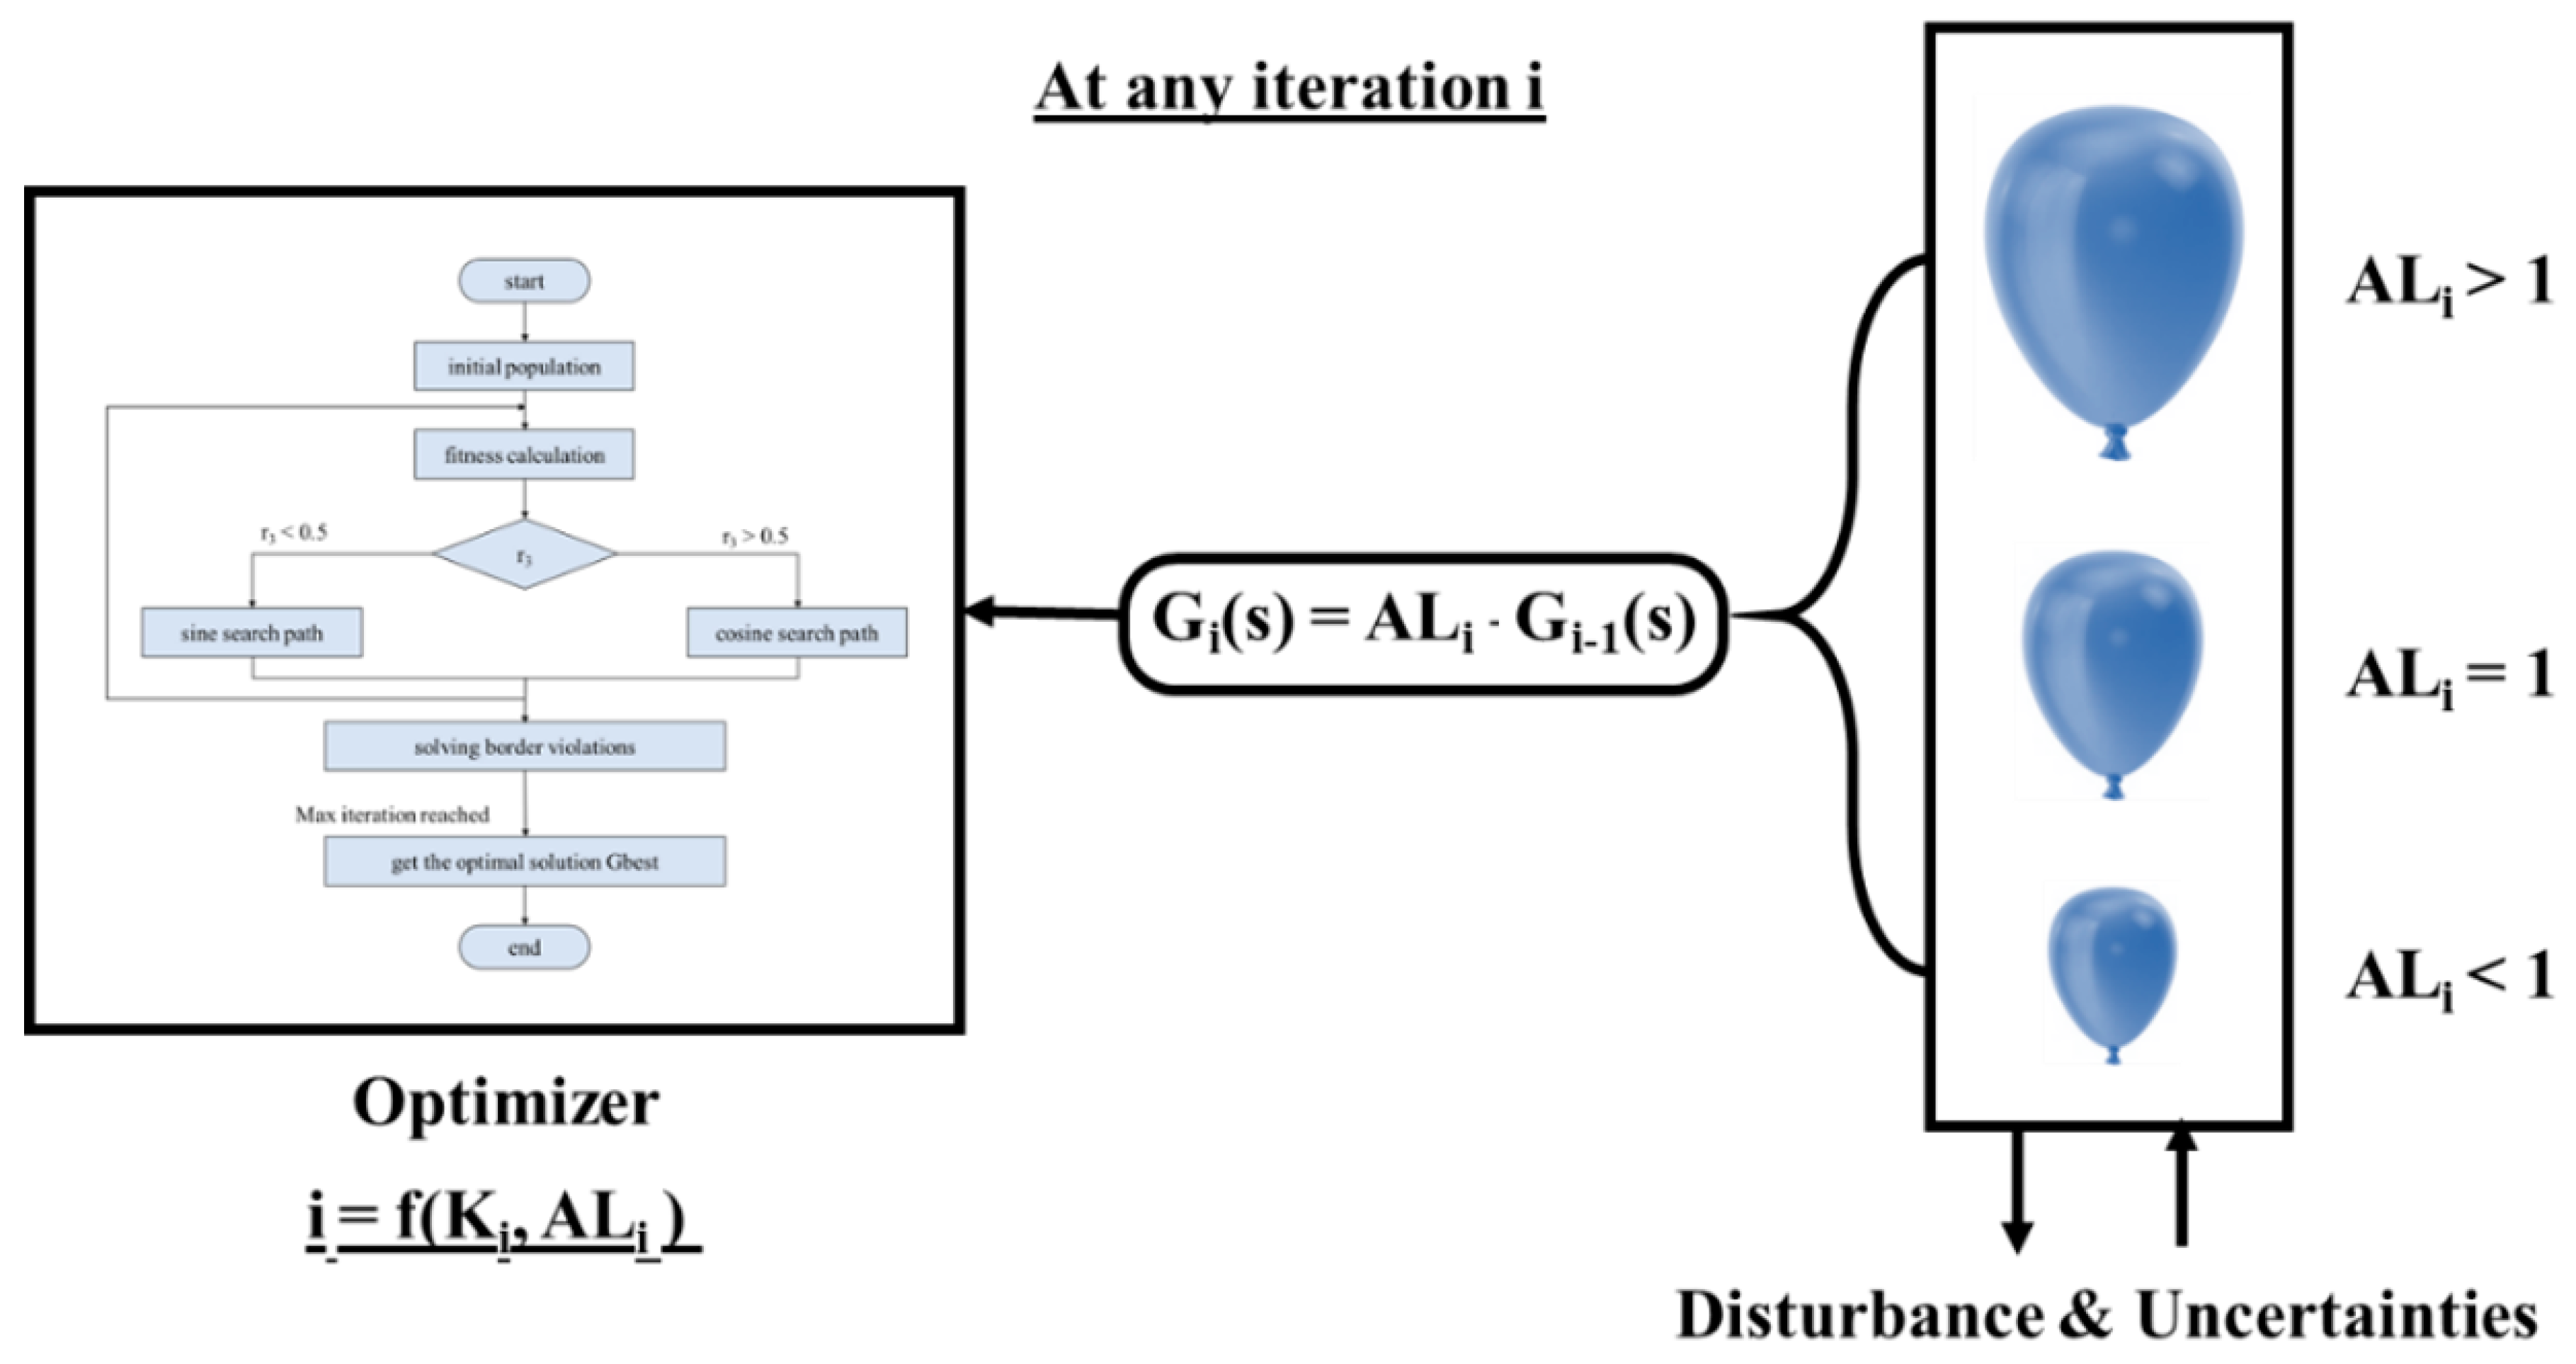
4. Balloon Effect (BE) Identifier
5. GTO-Based Balloon Effect Identifier
6. Results and Discussion
6.1. MATLAB Simulation Results
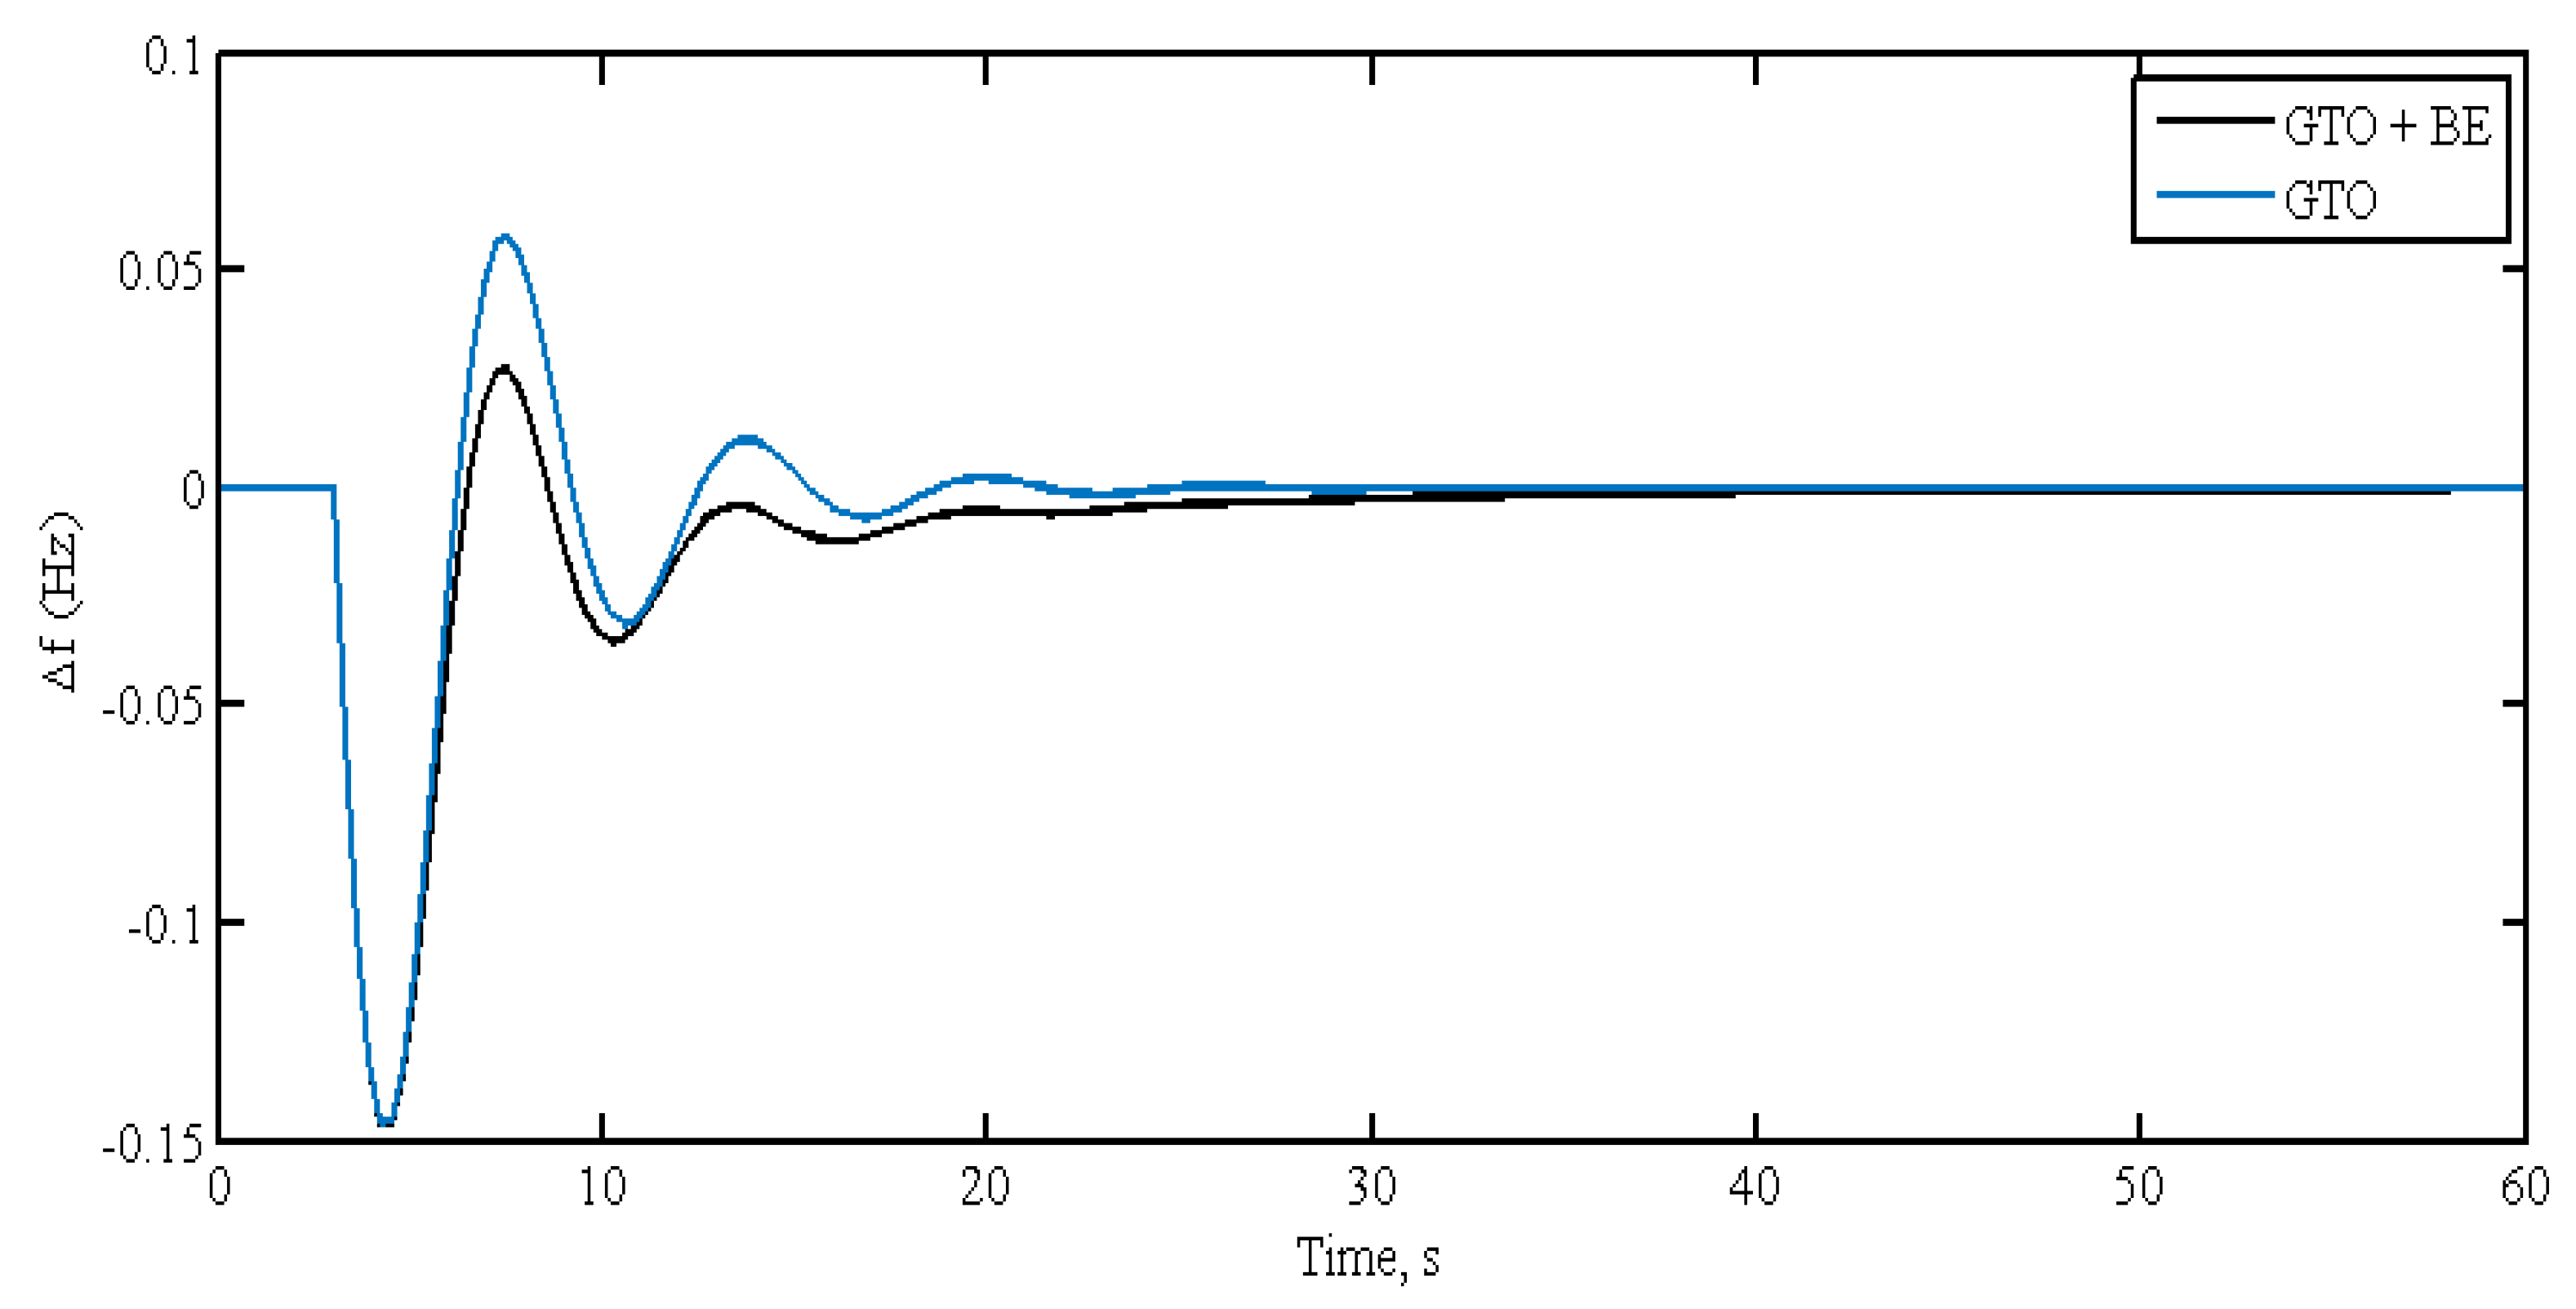
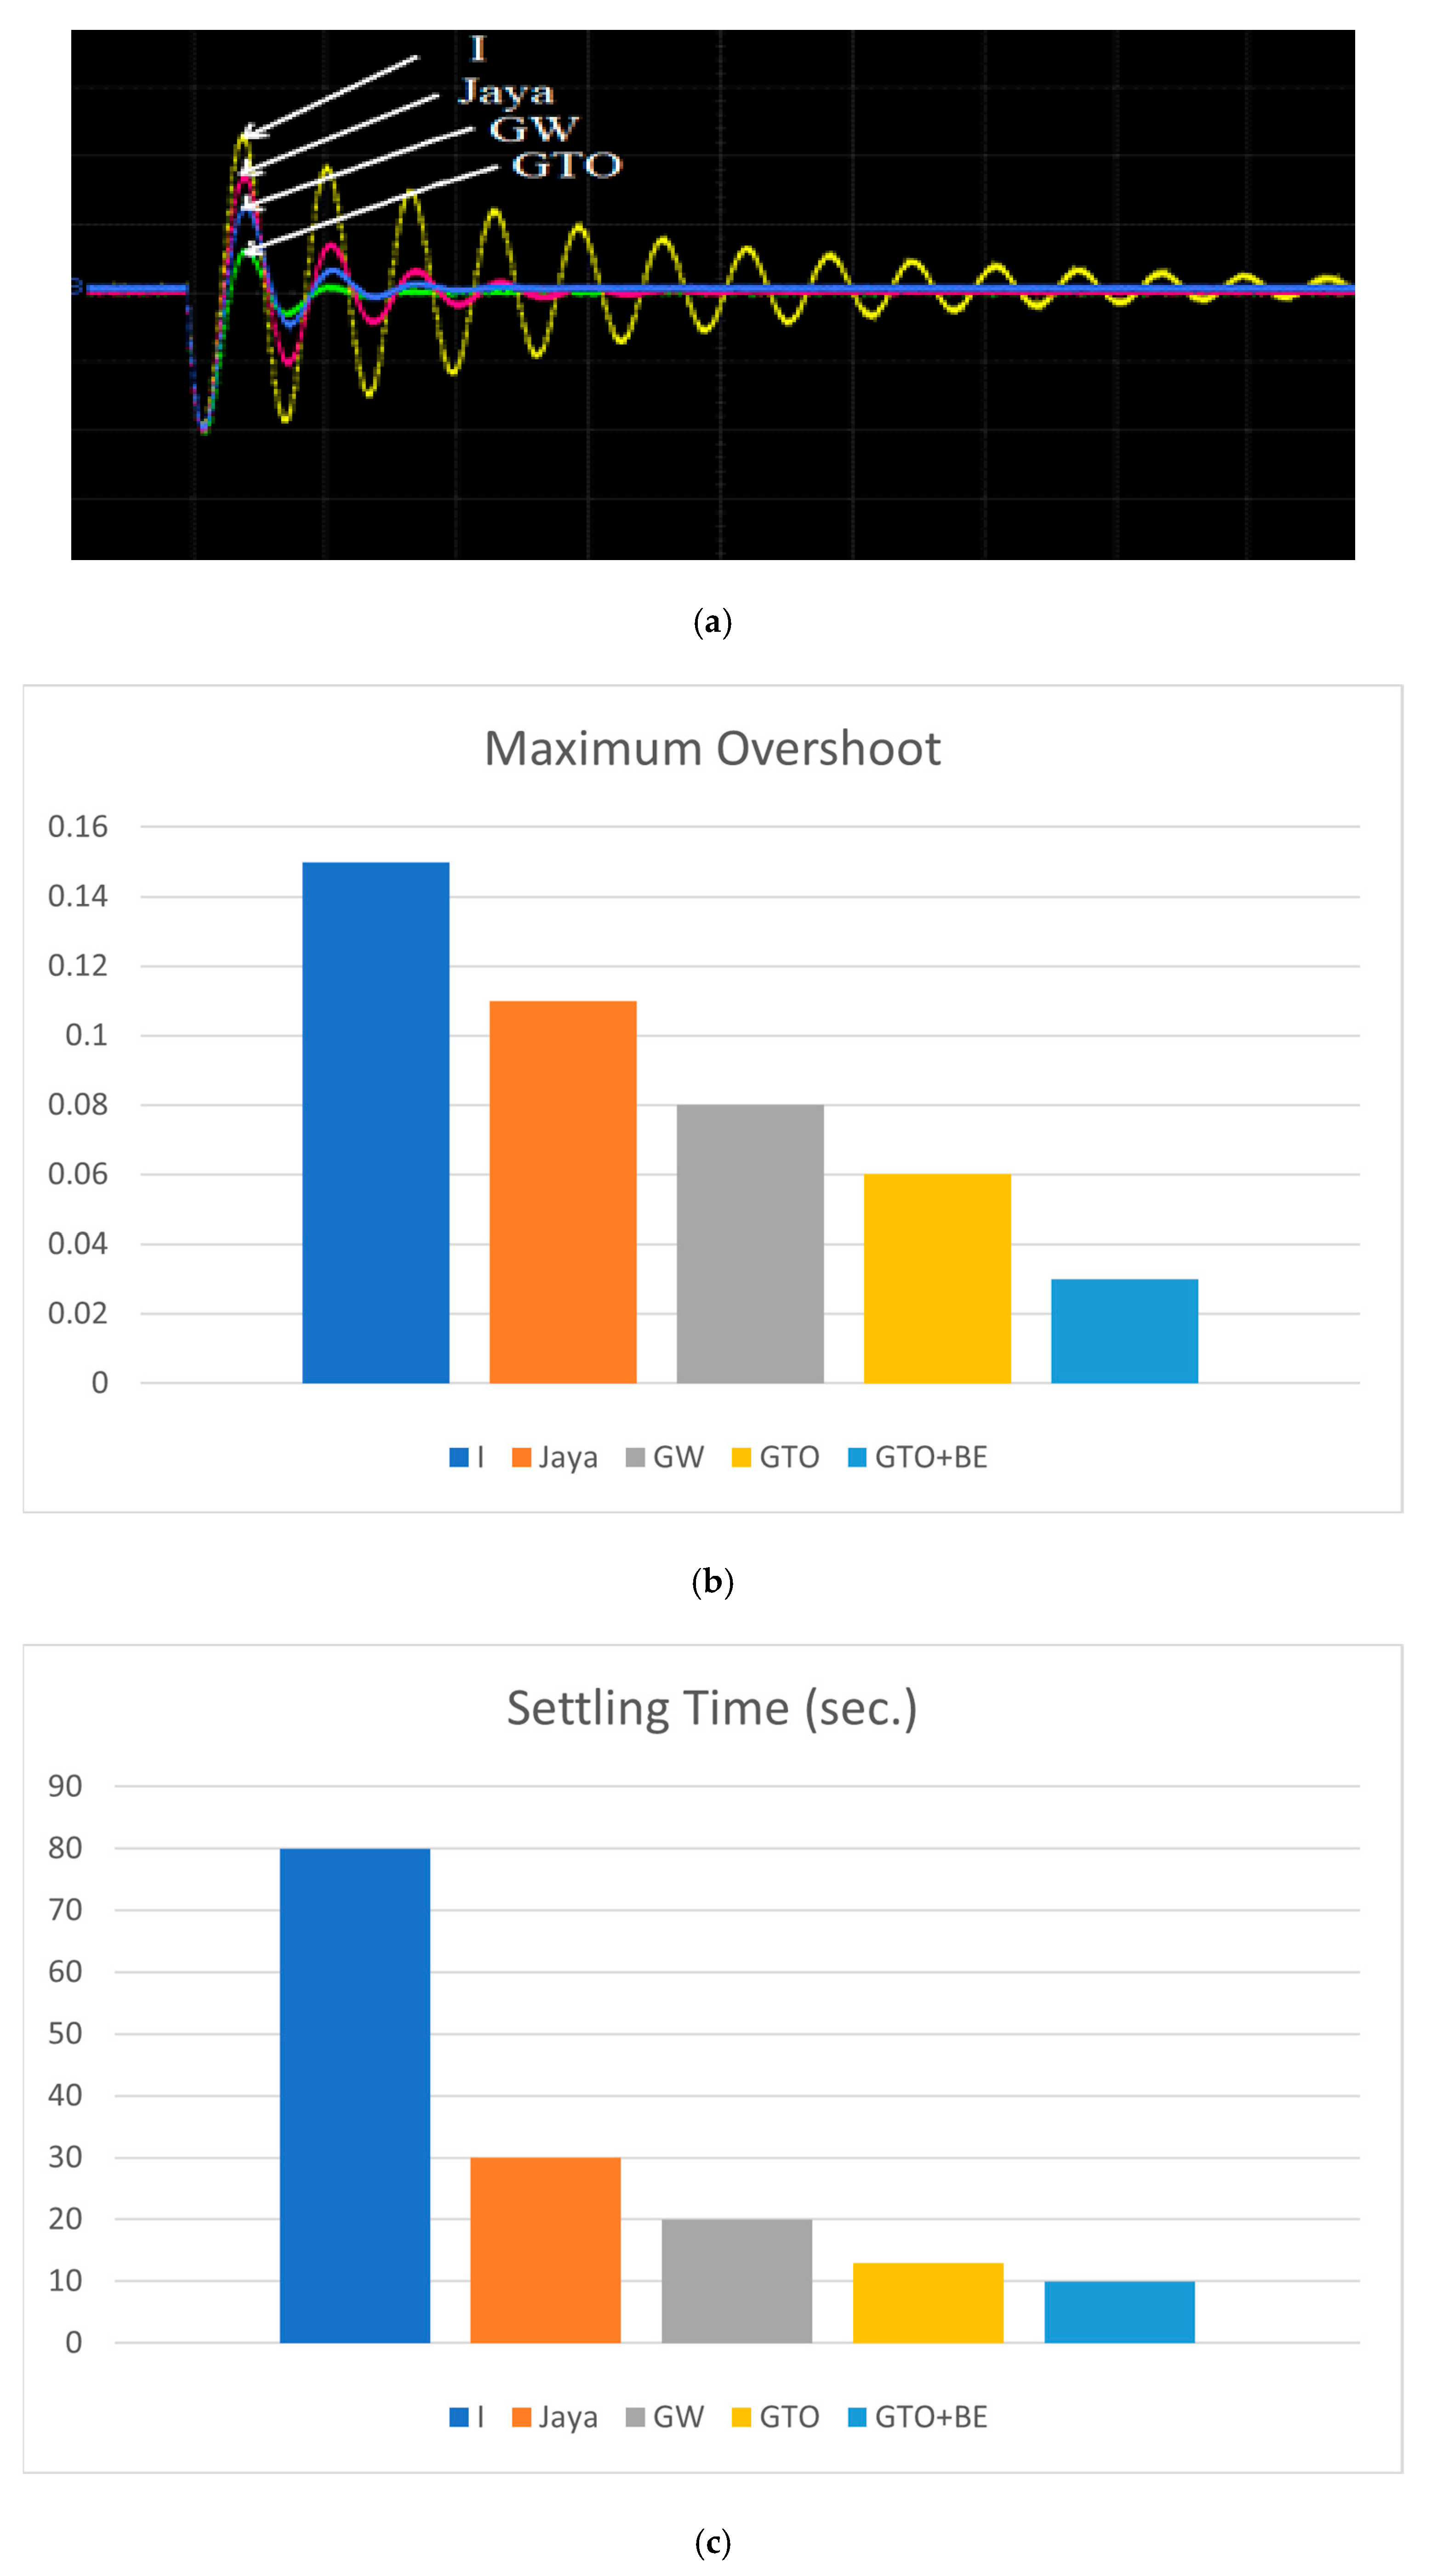
6.1.1. First Case
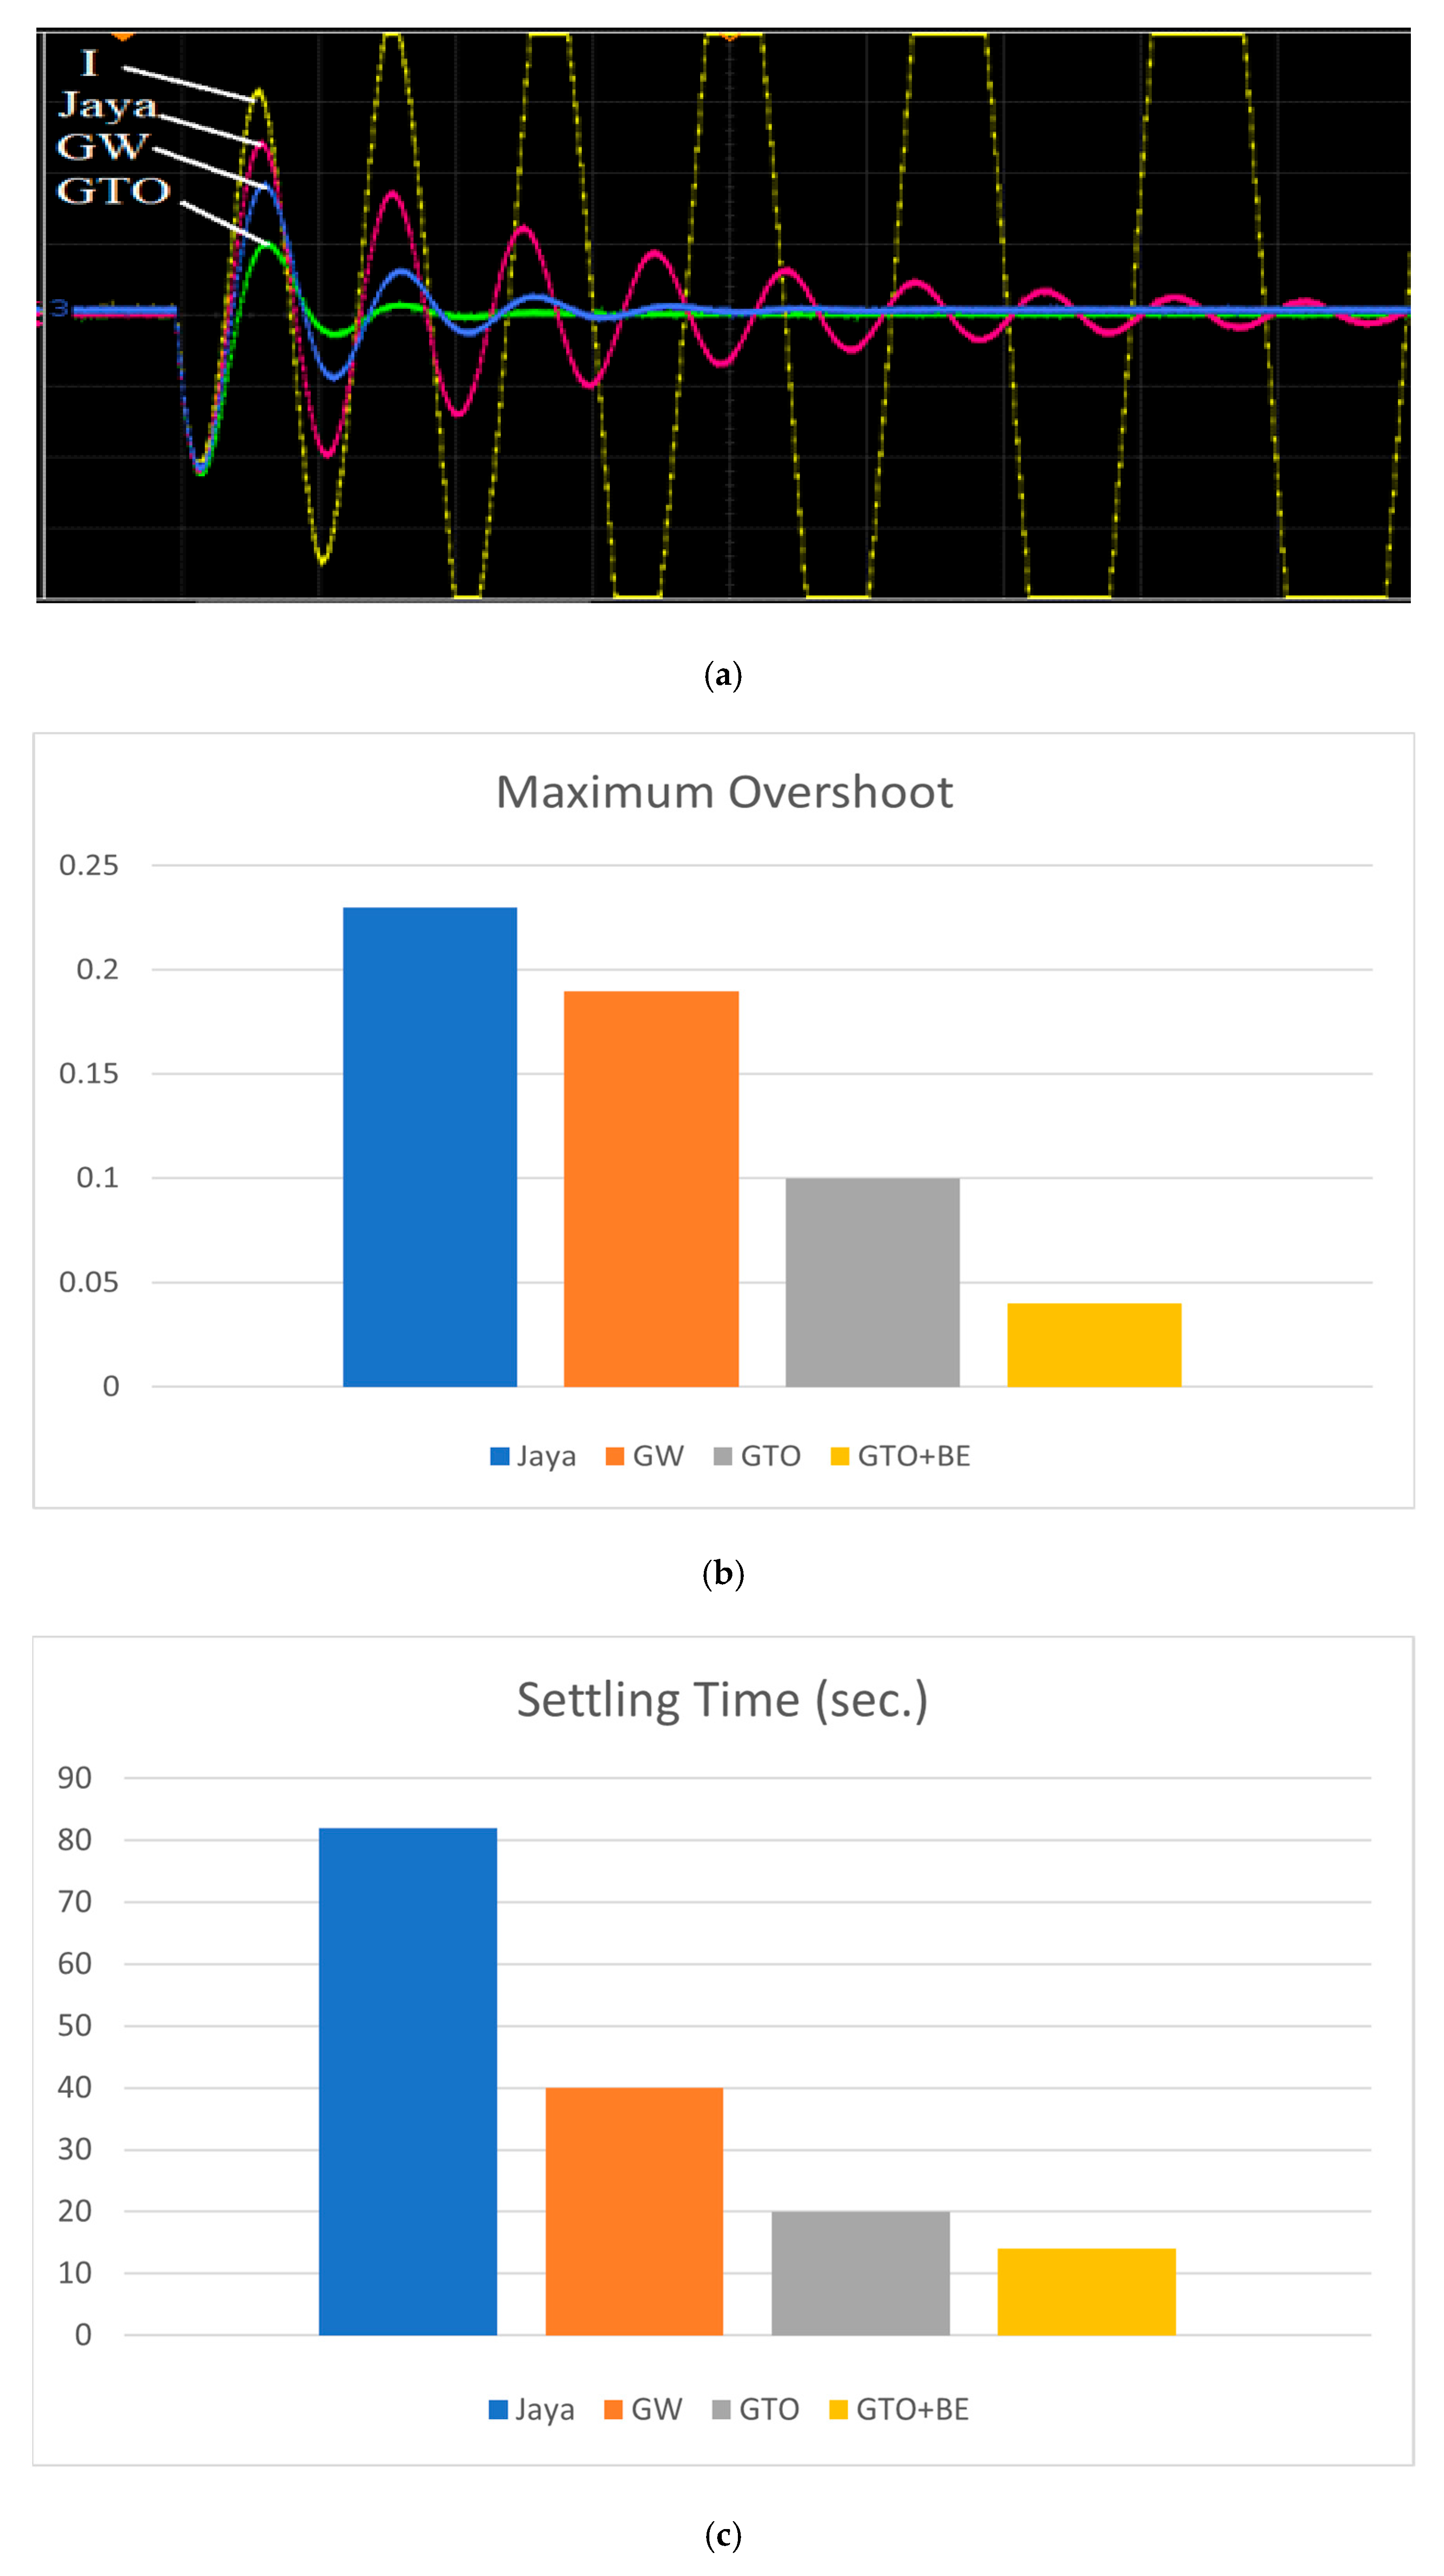
6.1.2. Second Case
6.1.3. Third Case
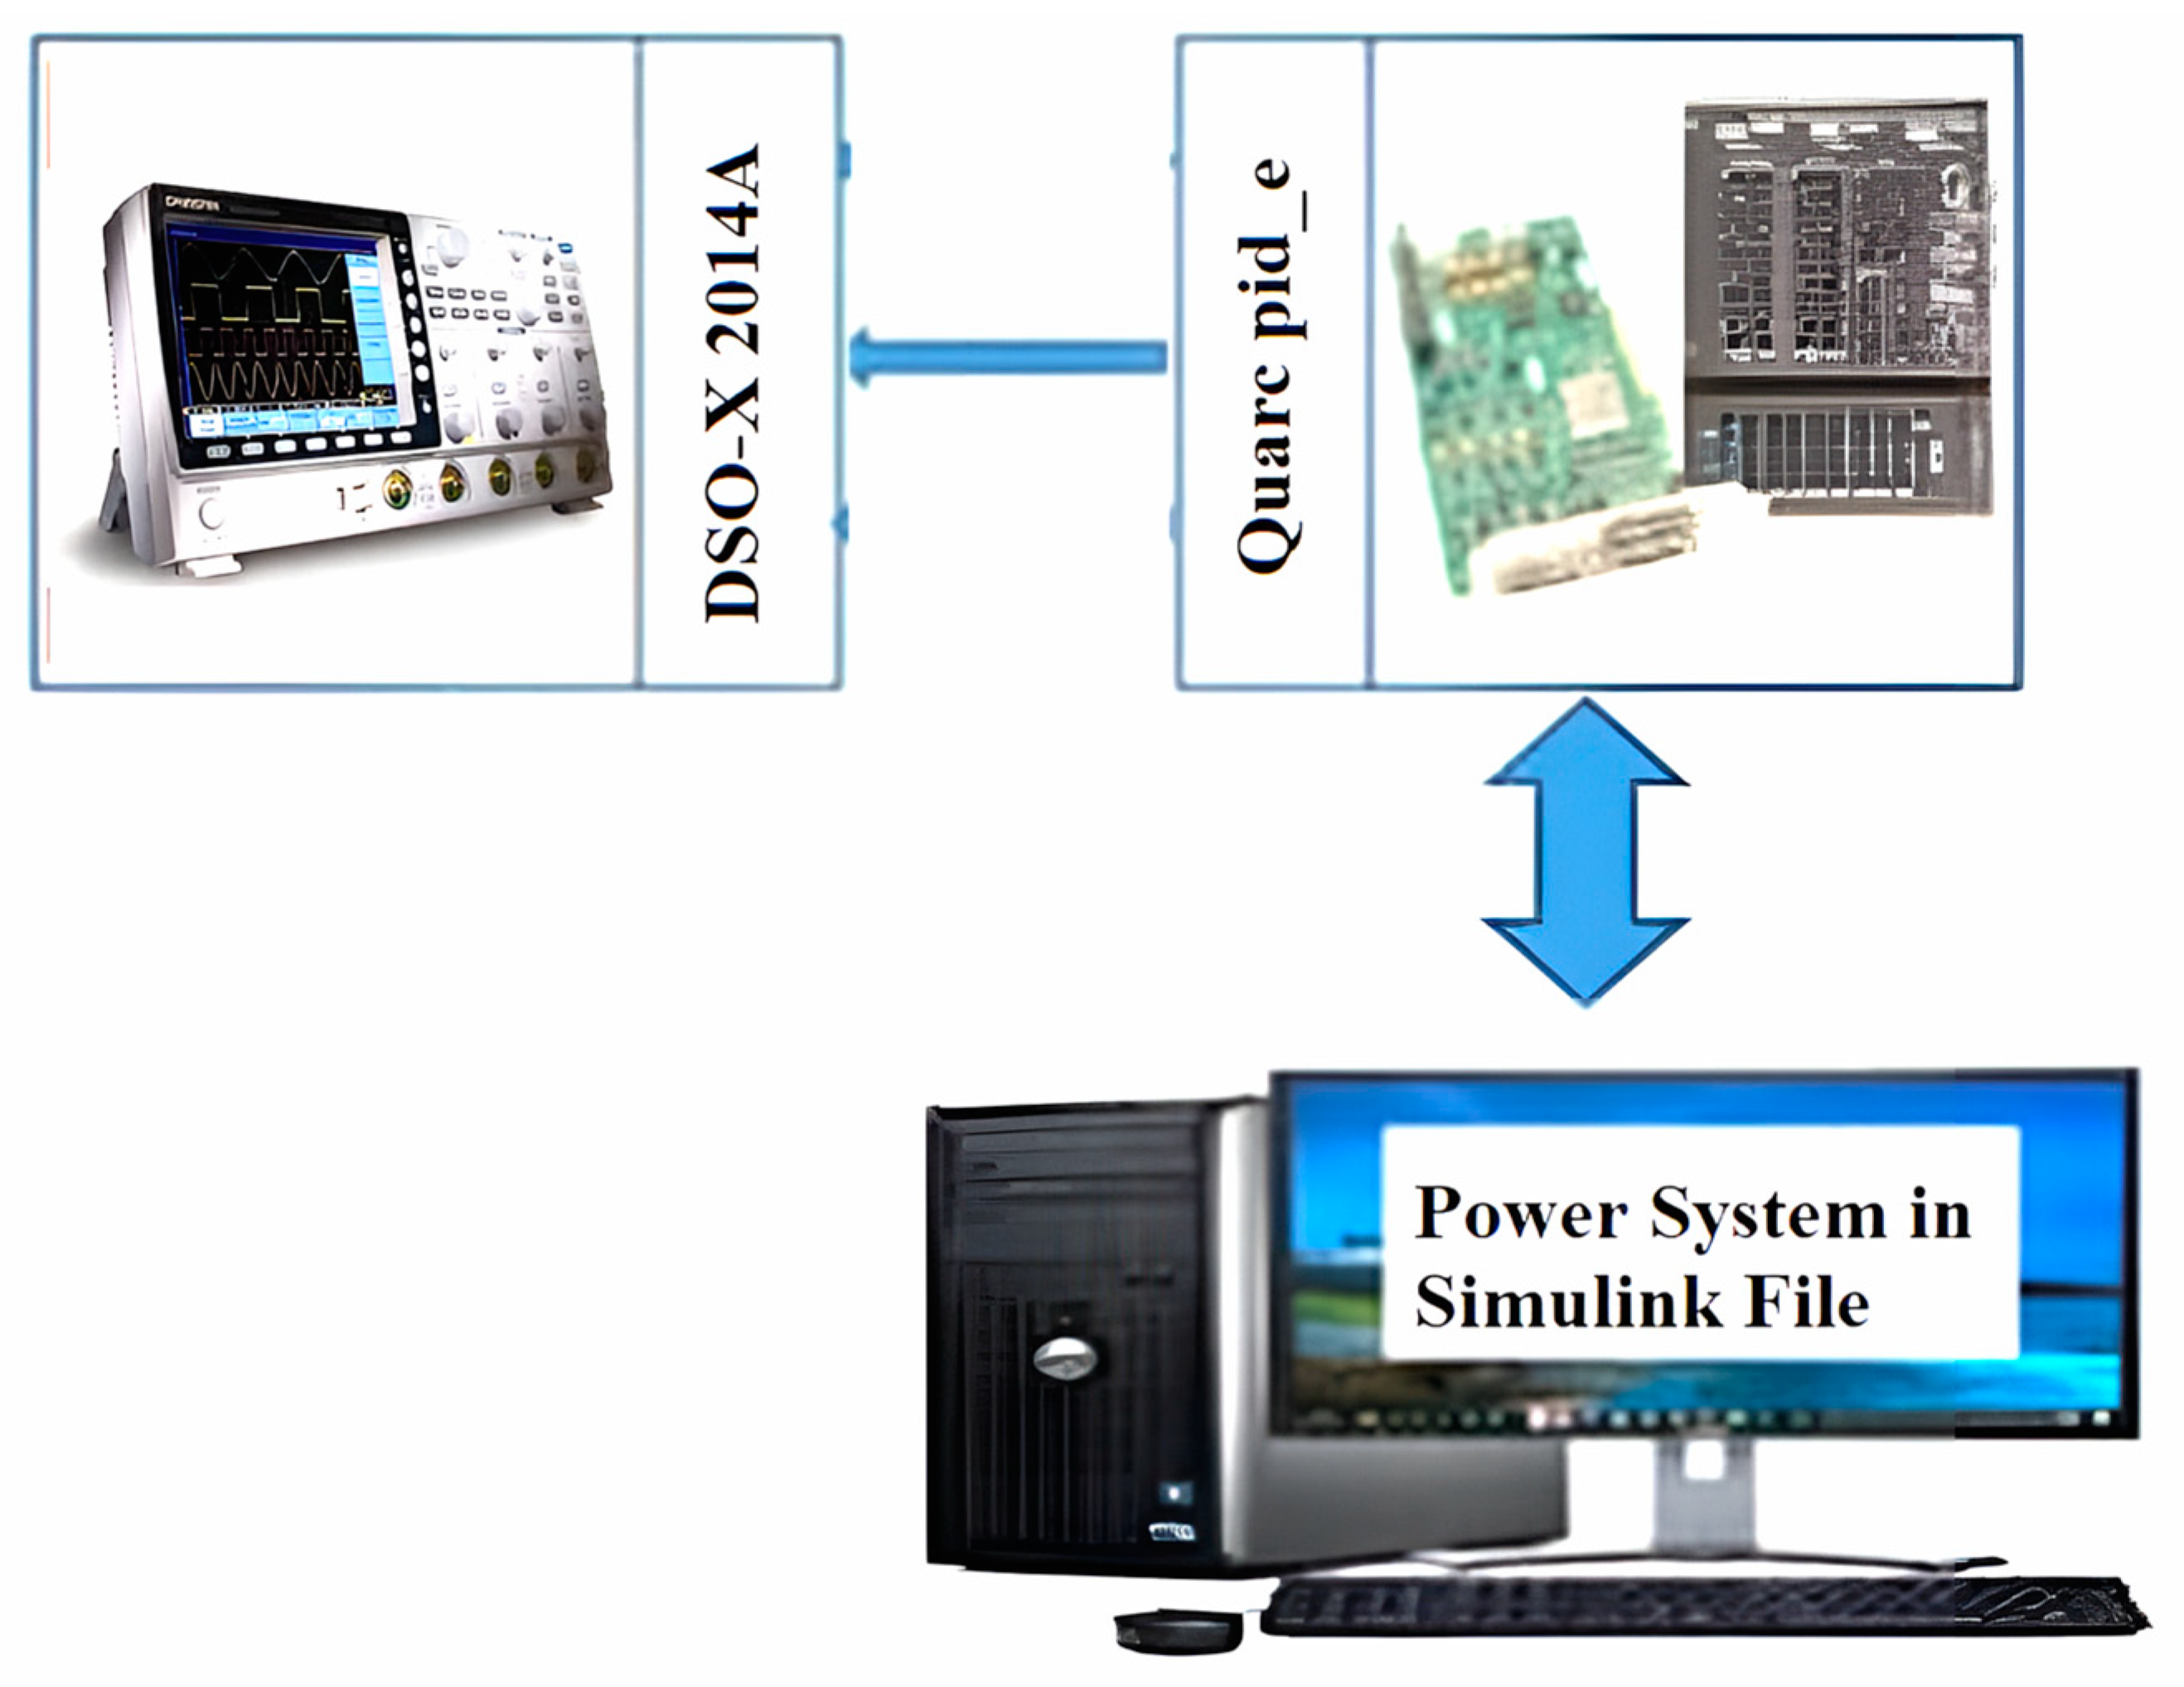
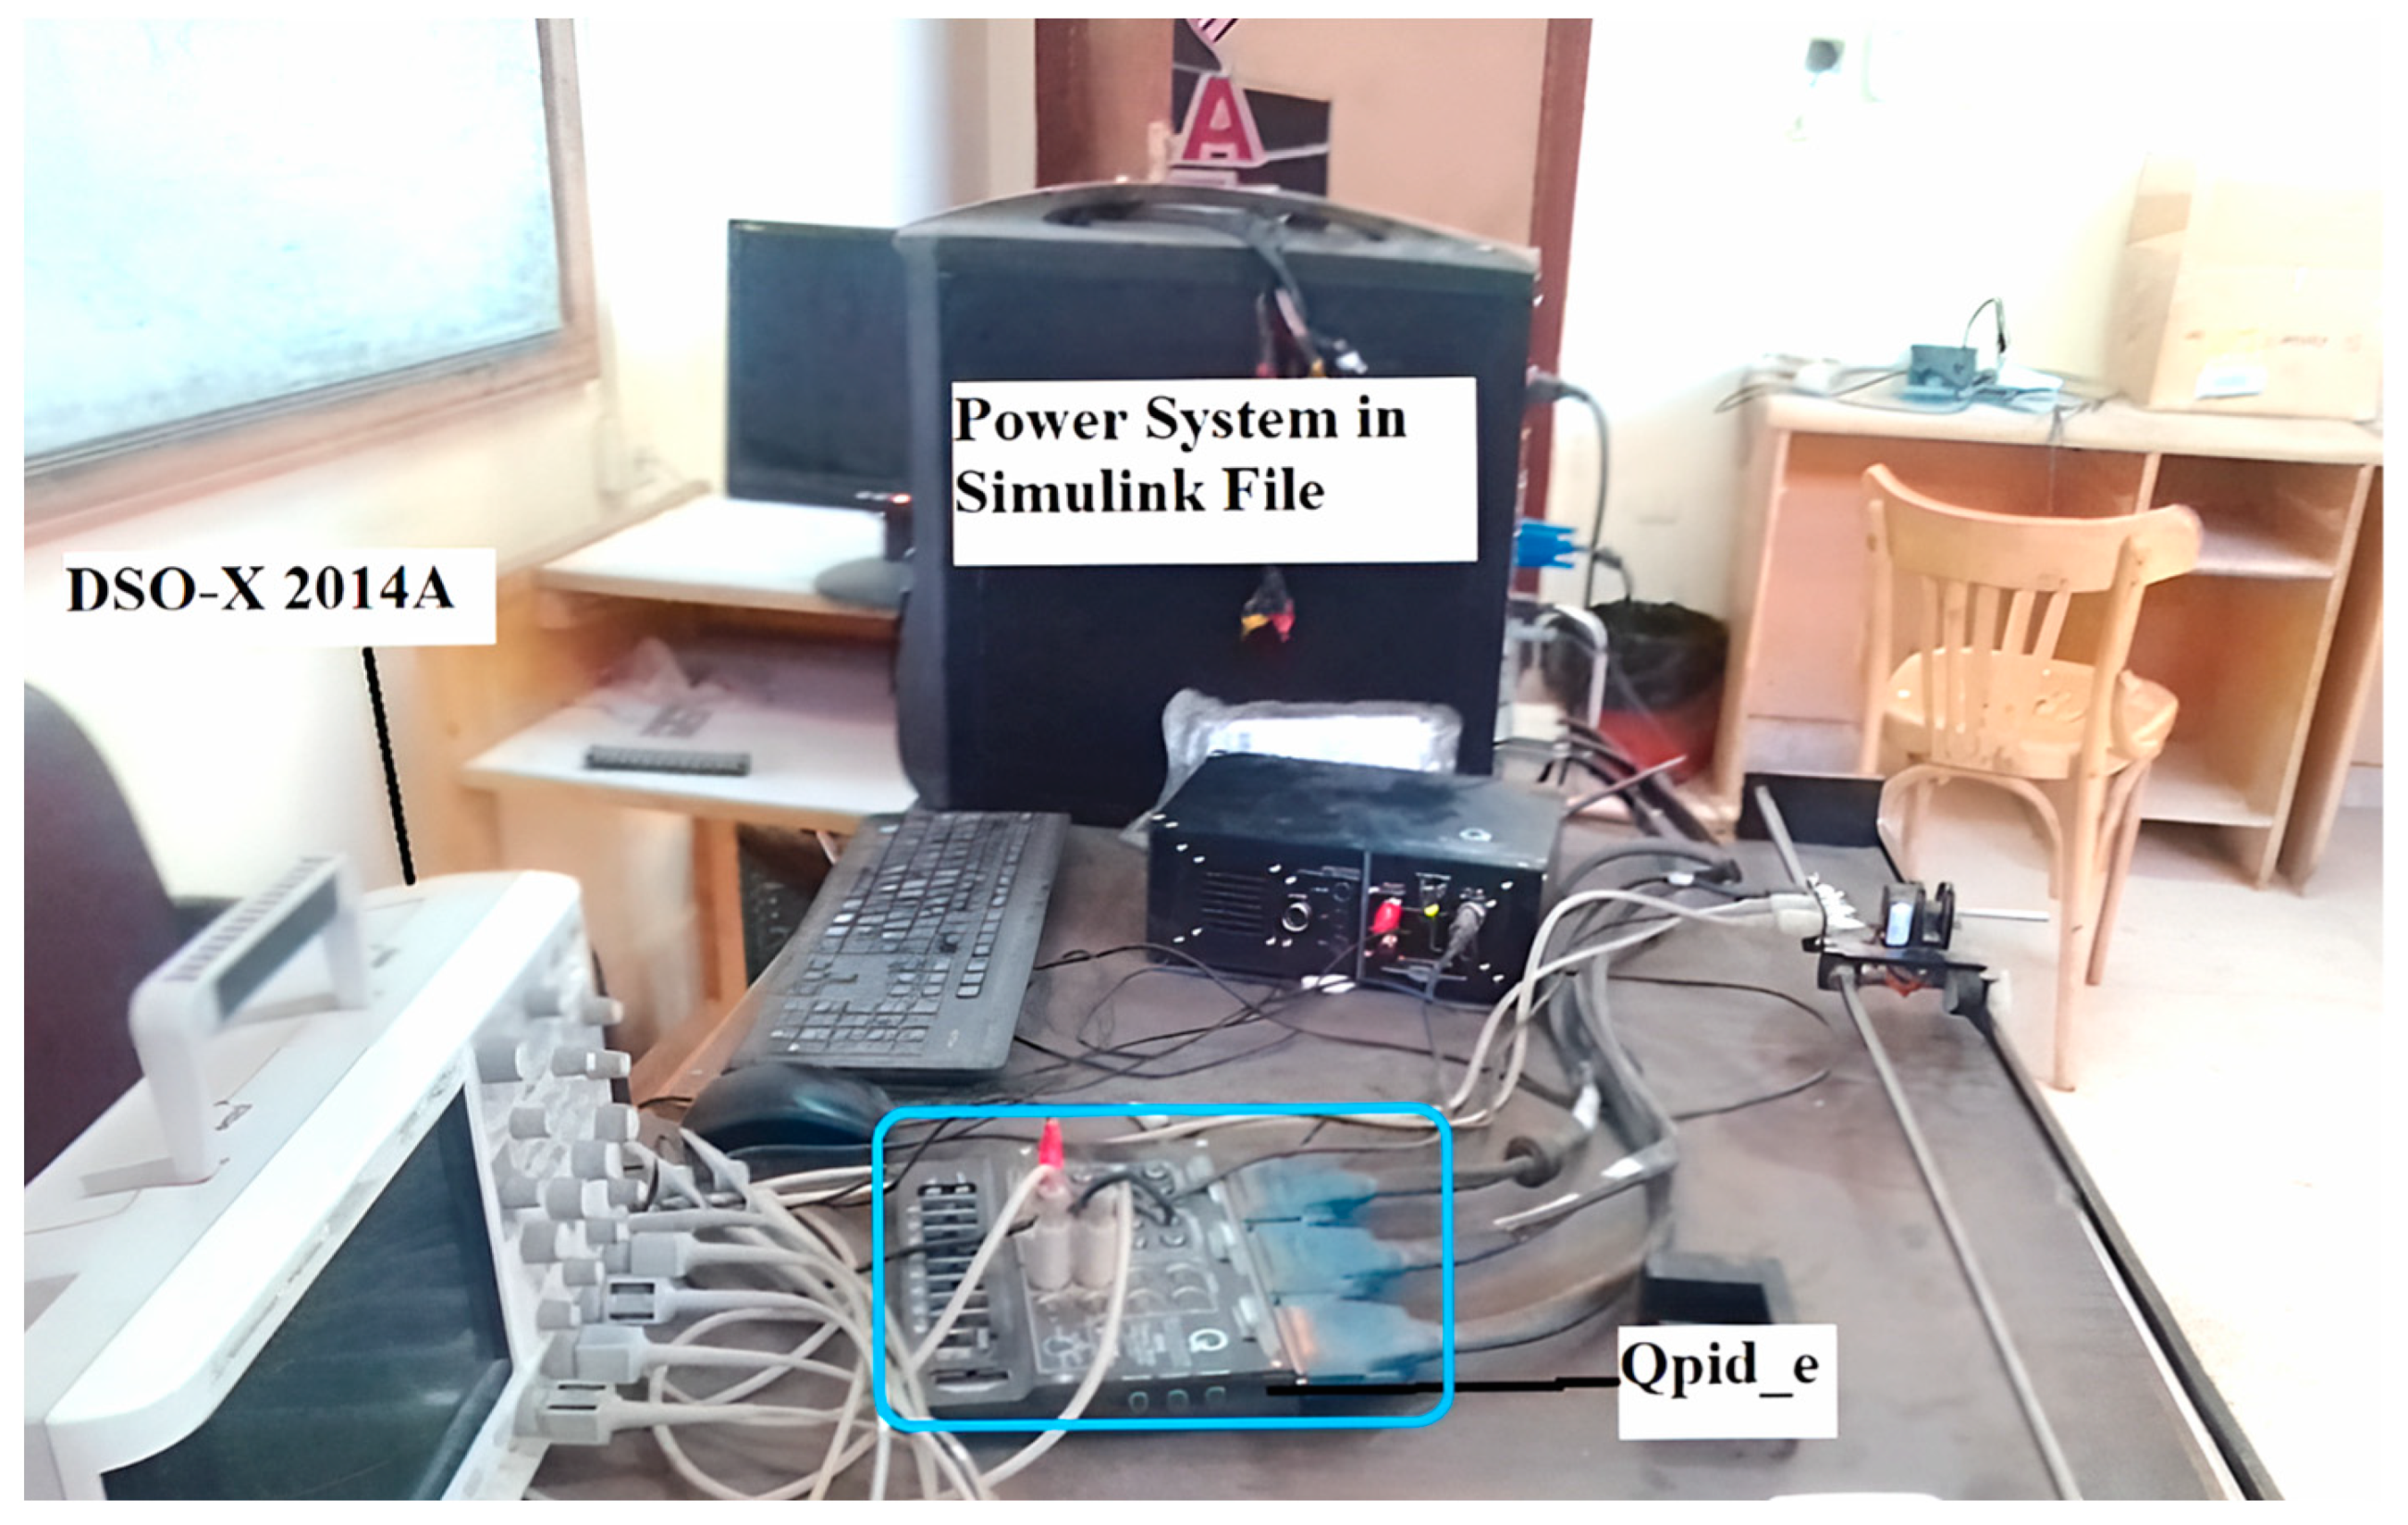
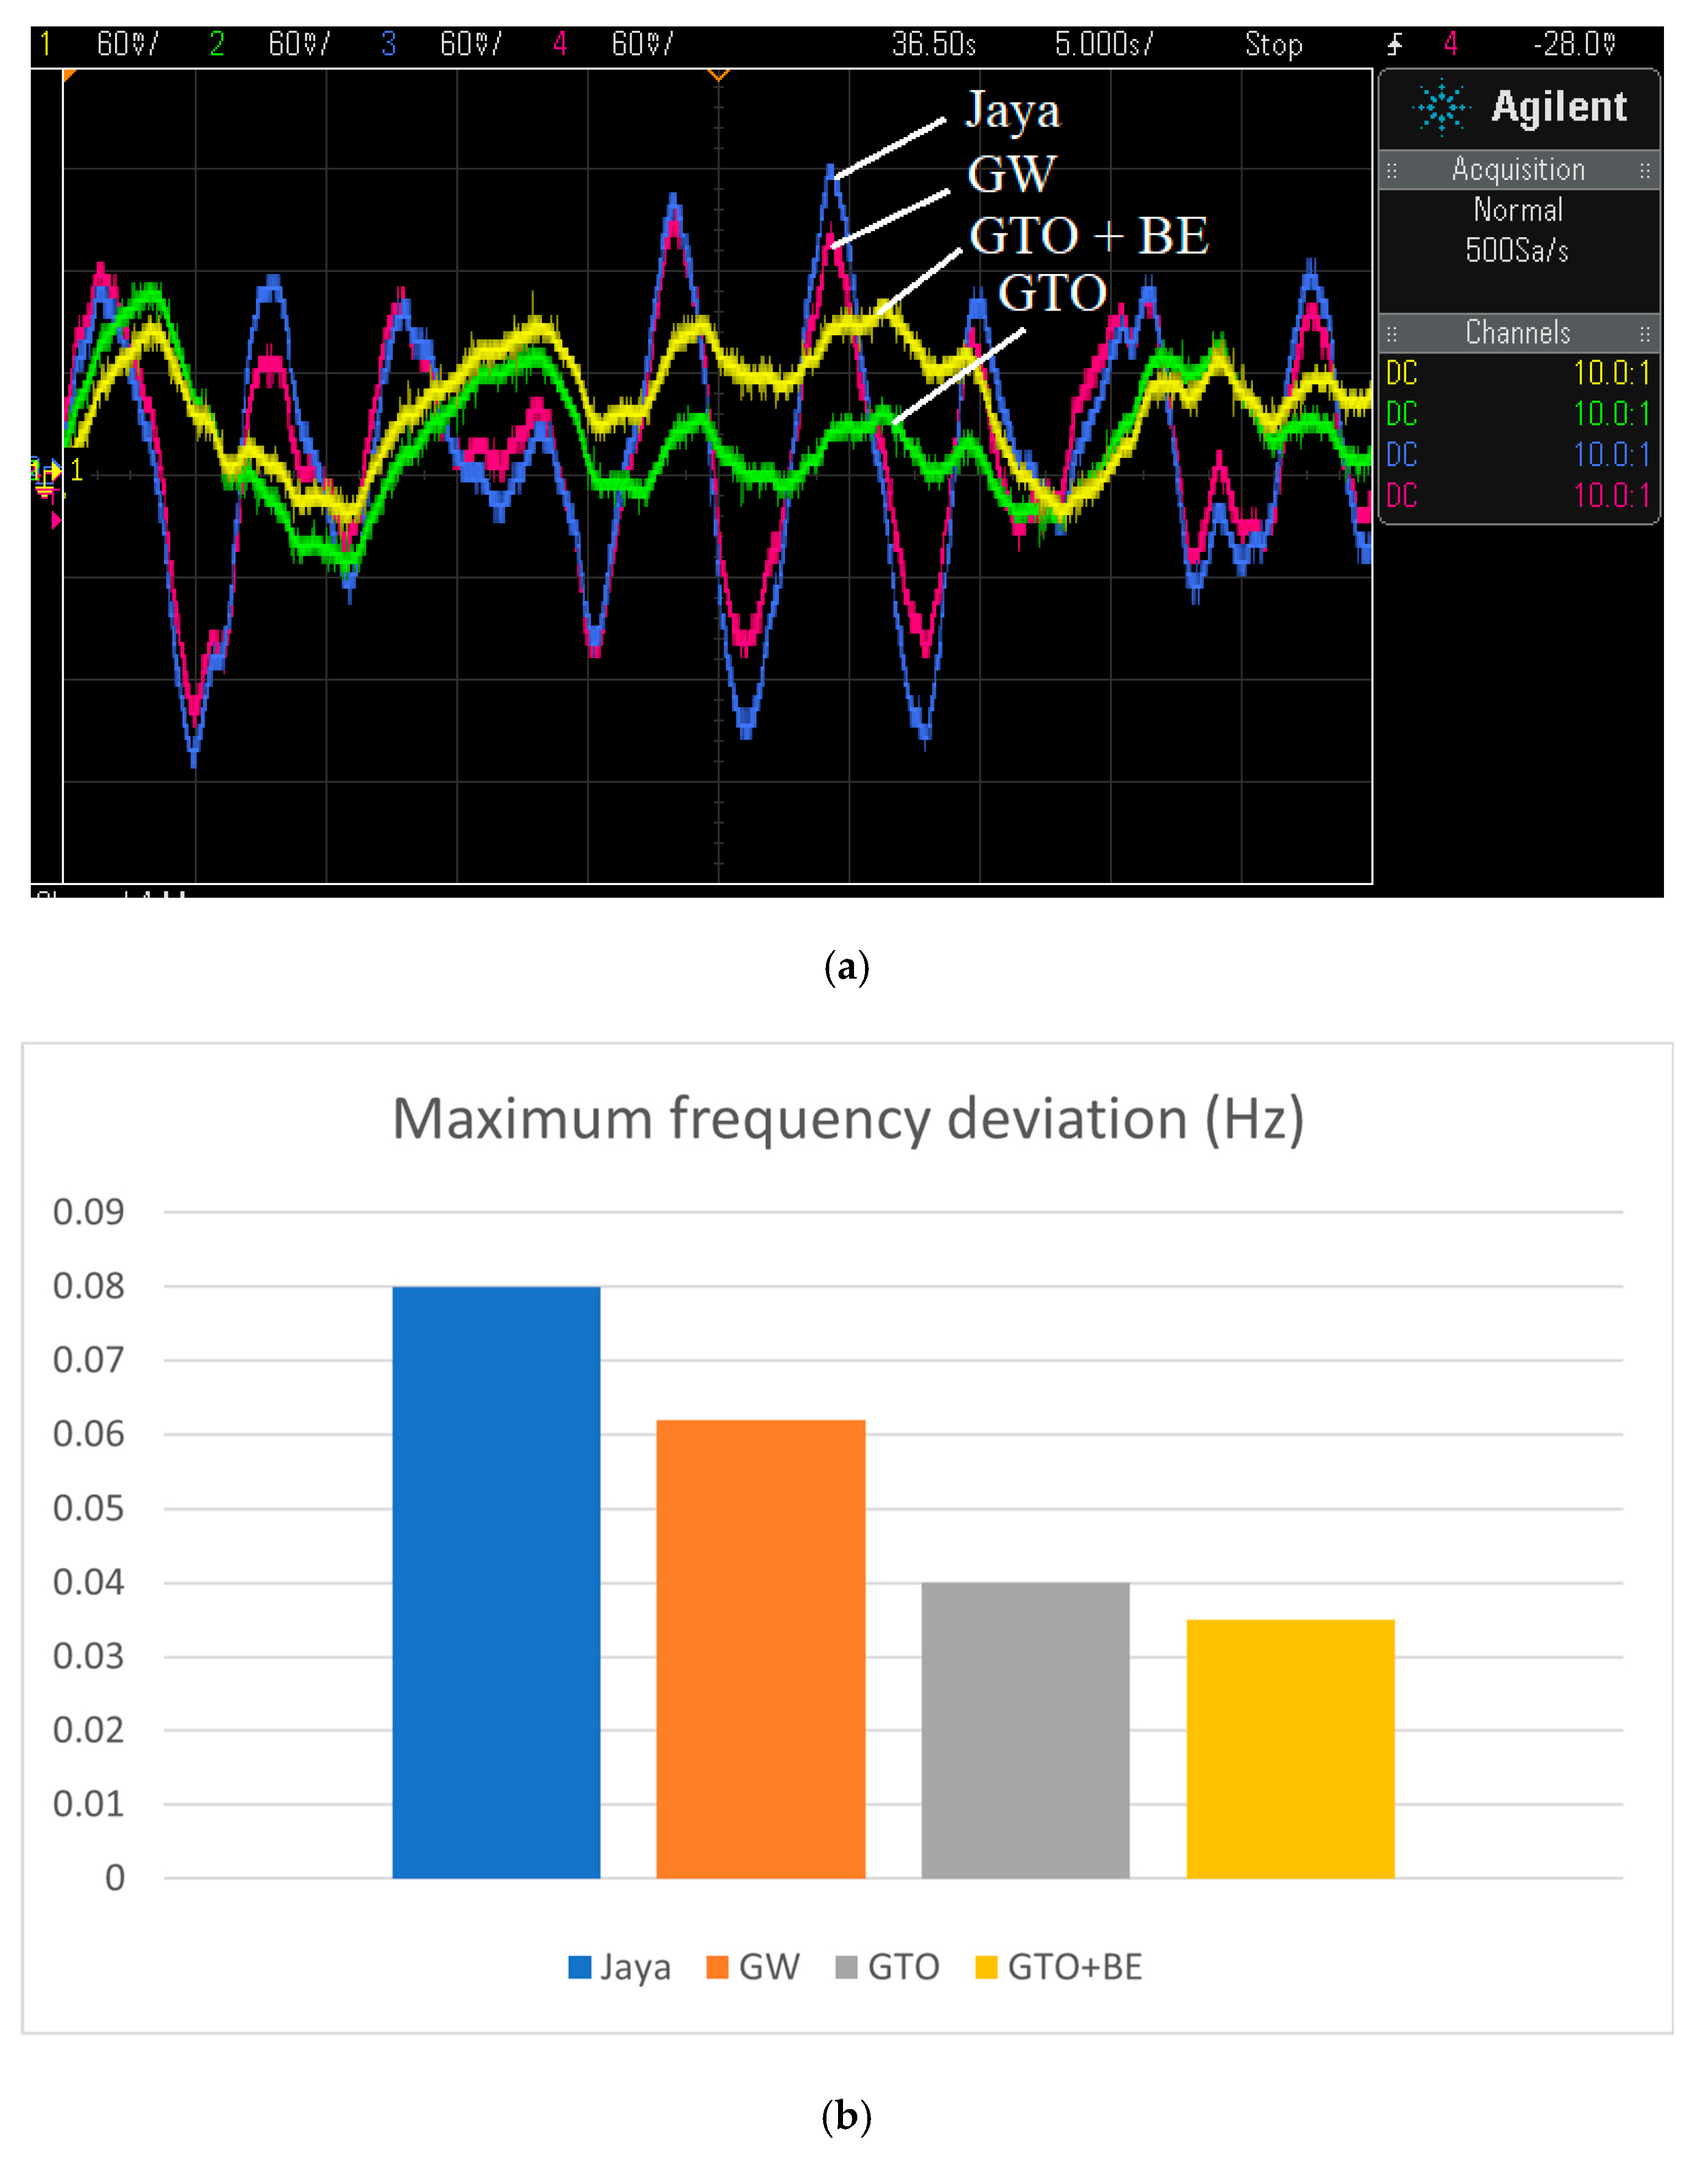
6.2. Real-Time Simulation Results
7. Conclusions
Author Contributions
Funding
Institutional Review Board Statement
Informed Consent Statement
Data Availability Statement
Conflicts of Interest
Correction Statement
References
- Armghan, A.; Azeem, M.K.; Armghan, H.; Yang, M.; Alenezi, F.; Hassan, M. Dynamical Operation Based Robust Nonlinear Control of DC Microgrid Considering Renewable Energy Integration. Energies 2021, 14, 3988. [Google Scholar] [CrossRef]
- Mureddu, M.; Caldarelli, G.; Chessa, A.; Scala, A.; Damiano, A. Green power grids: How energy from renewable sources affects networks and markets. PLoS ONE 2015, 10, e0135312. [Google Scholar] [CrossRef]
- Shang, Z.; Hossain, M.M.; Wycisk, R.; Pintauro, P.N. Poly(phenylene sulfonic acid)-expanded polytetrafluoroethylene composite membrane for low relative humidity operation in hydrogen fuel cells. J. Power Sources 2022, 535, 231375. [Google Scholar] [CrossRef]
- Mahmoud, M.M. Improved current control loops in wind side converter with the support of wild horse optimizer for enhancing the dynamic performance of PMSG-based wind generation system. Int. J. Model. Simul. 2022, 43, 952–966. [Google Scholar] [CrossRef]
- International Energy Agency (IEA). Snapshot of Global PV Markets 2022. 2022. Available online: https://iea-pvps.org/snapshot-reports/snapshot-2022/ (accessed on 20 October 2023).
- National Renewable Energy Laboratory (NREL). Air Quality Impacts of Solar Power. 2022. Available online: https://www.nrel.gov/docs/fy08osti/42169.pdf (accessed on 20 October 2023).
- World Resources Institute (WRI). Solar Power Can Protect Ecosystems and Biodiversity. 2022. Available online: https://www.wri.org/research/climate-biodiversity-and-forests (accessed on 20 October 2023).
- Khonakdari, T.H.; Kamarposhti, M.A. Real-time detection of microgrid islanding considering sources of uncertainty using type-2 fuzzy logic and PSO algorithm. PLoS ONE 2021, 16, e0257830. [Google Scholar] [CrossRef]
- Pascual, J.; Arcos-Aviles, D.; Ursúa, A.; Sanchis, P.; Marroyo, L. Energy management for an electro-thermal renewable–based residential microgrid with energy balance forecasting and demand side management. Appl. Energy 2021, 295, 117062. [Google Scholar] [CrossRef]
- Zheng, S.; Tang, X.; Song, B.; Lu, S.; Ye, B. Stable adaptive PI control for permanent magnet synchronous motor drive based on improved JITL technique. ISA Trans. 2013, 52, 539–549. [Google Scholar] [CrossRef]
- Yang, J.; Zeng, Z.; Tang, Y.; Yan, J.; He, H.; Wu, Y. Load Frequency Control in Isolated Micro-Grids with Electrical Vehicles Based on Multivariable Generalized Predictive Theory. Energies 2015, 8, 2145–2164. [Google Scholar] [CrossRef]
- Bevrani, H.; Habibi, F.; Babahajyani, P.; Watanabe, M.; Mitani, Y. Intelligent frequency control in an ac microgrid: Online PSO-based fuzzy tuning approach. IEEE Trans. Smart Grid 2012, 3, 1935–1944. [Google Scholar] [CrossRef]
- Som, S.; De, S.; Chakrabarti, S.; Sahoo, S.R.; Ghosh, A. A robust controller for battery energy storage system of an islanded ac microgrid. IEEE Trans. Ind. Inform. 2022, 18, 207–218. [Google Scholar] [CrossRef]
- Kerdphol, T.; Rahman, F.S.; Mitani, Y.; Watanabe, M.; Kufeoglu, S. Robust Virtual Inertia Control of an Islanded Microgrid Considering High Penetration of Renewable Energy. IEEE Access 2018, 6, 625–636. [Google Scholar]
- Li, Q.; Gao, M.; Lin, H.; Chen, Z.; Chen, M. MAS-based distributed control method for multi-microgrids with high-penetration renewable energy. Energy 2019, 171, 284–295. [Google Scholar] [CrossRef]
- Khalghani, M.R.; Khooban, M.H.; Mahboubi-Moghaddam, E.; Vafamand, N.; Goodarzi, M. A self-tuning load frequency control strategy for microgrids: Human brain emotional learning. Int. J. Electr. Power Energy Syst. 2016, 75, 311–319. [Google Scholar] [CrossRef]
- Tan, W. Tuning of PID load frequency controller for power systems. Energy Convers. Manag. 2009, 50, 1465–1472. [Google Scholar] [CrossRef]
- Shayeghi, H.; Shayanfar, H.A.; Jalili, A. Load frequency control strategies: A state-ofthe-art survey for the researcher. Energy Convers. Manag. 2009, 50, 344–353. [Google Scholar] [CrossRef]
- Xu, H.; Miao, S.; Zhang, C.; Shi, D. Optimal placement of charging infrastructures for large-scale integration of pure electric vehicles into grid. Int. J. Electr. Power Energy Syst. 2013, 53, 159–165. [Google Scholar] [CrossRef]
- Cao, Y.; Li, D.; Zhang, Y.; Tang, Q.; Khodaei, A.; Zhang, H.; Han, Z. Optimal Energy Management for Multi-Microgrid under a Transactive Energy Framework with Distributionally Robust Optimization. IEEE Trans. Smart Grid 2022, 13, 599–612. [Google Scholar] [CrossRef]
- Mazidi, M.; Rezaei, N.; Ardakani, F.J.; Mohiti, M.; Guerrero, J.M. A hierarchical energy management system for islanded multi-microgrid clusters considering frequency security constraints. Int. J. Electr. Power Energy Syst. 2020, 121, 106134. [Google Scholar] [CrossRef]
- Bevrani, H.; Golpîra, H.; Messina, A.R.; Hatziargyriou, N.; Milano, F.; Ise, T. Power system frequency control: An updated review of current solutions and new challenges. Electr. Power Syst. Res. 2021, 194, 107114. [Google Scholar] [CrossRef]
- Najafi, H.R.; Dastyar, F. Dynamic maximum available power of fixed-speed wind turbine at islanding operation. Int. J. Electr. Power Energy Syst. 2013, 47, 147–156. [Google Scholar] [CrossRef]
- Mahmoud, M.M.; Ratib, M.K.; Aly, M.M.; Abdel-Rahim, A.-M.M. Wind-driven permanent magnet synchronous generators connected to a power grid: Existing perspective and future aspects. Wind Eng. 2022, 46, 189–199. [Google Scholar] [CrossRef]
- Abubakr, H.; Vasquez, J.C.; Mohamed, T.H.; Guerrero, J.M. The concept of direct adaptive control for improving voltage and frequency regulation loops in several power system applications. Int. J. Electr. Power Energy Syst. 2022, 140, 108068. [Google Scholar] [CrossRef]
- Raya-Armenta, J.M.; Bazmohammadi, N.; Avina-Cervantes, J.G.; Sáez, D.; Vasquez, J.C.; Guerrero, J.M. Energy management system optimization in islanded microgrids: An overview and future trends. Renew. Sustain. Energy Rev. 2021, 149, 111327. [Google Scholar] [CrossRef]
- Kreishan, M.Z.; Zobaa, A.F. Optimal Allocation and Operation of Droop-Controlled Islanded Microgrids: A Review. Energies 2021, 14, 4653. [Google Scholar] [CrossRef]
- Alghamdi, S.; Sindi, H.F.; Rawa, M.; Alhussainy, A.A.; Calasan, M.; Micev, M.; Ali, Z.M.; Abdel Aleem, S.H.E. Optimal PID Controllers for AVR Systems Using Hybrid Simulated Annealing and Gorilla Troops Optimization. Fractal Fract. 2022, 6, 682. [Google Scholar] [CrossRef]
- Ali, M.; Kotb, H.; Aboras, K.M.; Abbasy, N.H. Design of Cascaded PI-Fractional Order PID Controller for Improving the Frequency Response of Hybrid Microgrid System Using Gorilla Troops Optimizer. IEEE Access 2021, 9, 150715–150732. [Google Scholar] [CrossRef]
- Mohamed, T.A.; Mustafa, M.K. Adaptive trainer for multi-layer perceptron using artificial gorilla troops optimizer algorithm. Int. J. Nonlinear Anal. Appl. 2023, 14, 843–852. [Google Scholar] [CrossRef]
- Dahab, Y.A.; Abubakr, H.; Mohamed, T.H. Adaptive Load Frequency Control of Power Systems Using Electro-Search Optimization Supported by the Balloon Effect. IEEE Access 2020, 8, 7408–7422. [Google Scholar] [CrossRef]
- Mohamed, T.H.; Alamin, M.A.M.; Hassan, A.M. Adaptive position control of a cart moved by a DC motor using integral controller tuned by Jaya optimization with Balloon effect. Comput. Electr. Eng. 2020, 87, 106786. [Google Scholar] [CrossRef]
- Ali, R.; Mohamed, T.H.; Qudaih, Y.S.; Mitani, Y. A new load frequency control approach in an isolated small power systems using coefficient diagram method. Int. J. Electr. Power Energy Syst. 2014, 56, 110–116. [Google Scholar] [CrossRef]
- Mohamed, T.H.; Abubakr, H.; Alamin, M.A.M.; Hassan, A.M. Modified WCA-Based Adaptive Control Approach Using Balloon Effect: Electrical Systems Applications. IEEE Access 2020, 8, 60877–60889. [Google Scholar] [CrossRef]
- Abdollahzadeh, B.; Gharehchopogh, F.S.; Mirjalili, S. Artificial gorilla troops optimizer: A new nature-inspired metaheuristic algorithm for global optimization problems. Int. J. Intell. Syst. 2021, 36, 5887–5958. [Google Scholar] [CrossRef]
- Bevrani, H. Robust Power System Frequency Control; Springer: Berlin/Heidelberg, Germany, 2009. [Google Scholar] [CrossRef]
- Mirjalili, S.; Mirjalili, S.M.; Lewis, A. Grey Wolf Optimizer. Adv. Eng. Softw. 2014, 69, 46–61. [Google Scholar] [CrossRef]
- Ali, M.I.A.E.; Diab, A.A.Z.; Hassan, A.A. Adaptive load frequency control based on dynamic jaya optimization algorithm of power system with renewable energy integration. In Proceedings of the 21st International Middle East Power Systems Conference (MEPCON), Cairo, Egypt, 17–19 December 2019. [Google Scholar] [CrossRef]
- Messenger, R.A.; Abtahi, A. Photovoltaic Systems Engineering, 3rd ed.; CRC Press: Boca Raton, FL, USA, 2010. [Google Scholar] [CrossRef]
- Rekioua, P.D.; Matagne, P.E. Optimization of Photovoltaic Power Systems, Modelization, Simulation and Control, 1st ed.; Springer: London, UK, 2012. [Google Scholar] [CrossRef]


| D | H = (M/2) | R | Tg | Td |
|---|---|---|---|---|
| (Pu/Hz) | (Pu·sec) | (Hz/Pu) | (sec) | (sec) |
| 0.015 | 0.08335 | 3 | 0.08 | 0.4 |
| Population Size (K) | 5 |
| Maximum Iteration (IT max) | 50 |
| Parameter to be set before optimization operation (P) | 0.03 |
| Beta (β) | 3 |
| Paramter select mechanism of migration (W) | 0.8 |
| The initial values of the design variables (Ki) | [0.04, 0.025, 0.017, 0.08, 0.030] |
| Maximum Iteration (IT max) | 50 |
| Population Size (k) | 5 |
| Convergence Constant (a) | 2 |
| Population Size (k) | 5 |
| Number of Generations (i) | 50 |
| Number of Design Variables (m) | 2 |
Disclaimer/Publisher’s Note: The statements, opinions and data contained in all publications are solely those of the individual author(s) and contributor(s) and not of MDPI and/or the editor(s). MDPI and/or the editor(s) disclaim responsibility for any injury to people or property resulting from any ideas, methods, instructions or products referred to in the content. |
© 2024 by the authors. Licensee MDPI, Basel, Switzerland. This article is an open access article distributed under the terms and conditions of the Creative Commons Attribution (CC BY) license (https://creativecommons.org/licenses/by/4.0/).
Share and Cite
Hussein, M.M.; Hamid, M.N.A.; Mohamed, T.H.; Al-Helal, I.M.; Alsadon, A.; Hassan, A.M. Advanced Frequency Control Technique Using GTO with Balloon Effect for Microgrids with Photovoltaic Source to Lower Harmful Emissions and Protect Environment. Sustainability 2024, 16, 831. https://doi.org/10.3390/su16020831
Hussein MM, Hamid MNA, Mohamed TH, Al-Helal IM, Alsadon A, Hassan AM. Advanced Frequency Control Technique Using GTO with Balloon Effect for Microgrids with Photovoltaic Source to Lower Harmful Emissions and Protect Environment. Sustainability. 2024; 16(2):831. https://doi.org/10.3390/su16020831
Chicago/Turabian StyleHussein, Mahmoud M., Mohamed Nasr Abdel Hamid, Tarek Hassan Mohamed, Ibrahim M. Al-Helal, Abdullah Alsadon, and Ammar M. Hassan. 2024. "Advanced Frequency Control Technique Using GTO with Balloon Effect for Microgrids with Photovoltaic Source to Lower Harmful Emissions and Protect Environment" Sustainability 16, no. 2: 831. https://doi.org/10.3390/su16020831
APA StyleHussein, M. M., Hamid, M. N. A., Mohamed, T. H., Al-Helal, I. M., Alsadon, A., & Hassan, A. M. (2024). Advanced Frequency Control Technique Using GTO with Balloon Effect for Microgrids with Photovoltaic Source to Lower Harmful Emissions and Protect Environment. Sustainability, 16(2), 831. https://doi.org/10.3390/su16020831