Article

Assessing User Acceptance of Automated Vehicles as a Precondition for Their Contribution to a More Sustainable Mobility

by
Margarita Martínez-Díaz
1,* and
Maximilià-Miquel Montes Carbó
2
1
Barcelona Innovative Transportation (BIT), UPC-BarcelonaTech, 08034 Barcelona, Spain
2
Civil Engineering School, UPC-BarcelonaTech, 08034 Barcelona, Spain
*
Author to whom correspondence should be addressed.
Sustainability 2024, 16(2), 895; https://doi.org/10.3390/su16020895
Submission received: 17 December 2023 / Revised: 11 January 2024 / Accepted: 18 January 2024 / Published: 20 January 2024
(This article belongs to the Section Sustainable Engineering and Science)

Abstract

:
Autonomous vehicles (AVs) have been proposed as vectors for more sustainable mobility, the adjective “sustainable” being understood as the union of usefulness for society (i.e., efficiency), environmental friendliness, and economic viability. The realization of social usefulness implies a primary condition, which is AVs’ adoption on the part of the population. This paper is aimed at identifying factors contributing to society’s willingness to shift to two different AV implementations: as private vehicles or as the basis for public transportation systems. To this end, data collected from a survey were analyzed using exploratory data analysis, exploratory factor analysis, and ordinal regression. Safety-related variables as well as the a priori appeal of AVs turned out to be the most influential for the adoption of both solutions. Therefore, informative campaigns focusing on the safety benefits of AVs could boost the modal shift. Further research starting from these hypotheses and accounting for the limitations of the sample used could help to resolve remaining doubts.

1. Introduction

In the past, autonomous vehicles (AVs) were presented as the solution to all problems related to transportation. In fact, they were announced as vectors for more sustainable mobility, considering the broader meaning of this term. As known, the adjective “sustainable” implies ( i ) environmentally friendly, ( i i ) useful for society, and ( i i i ) economically viable. According to past (or interested) statements, AVs would eliminate congestion, thus contributing to travel time savings, more productivity, and fewer emissions (note that, even disregarding the fact that AVs will mostly be electric, emissions increase in congestion and stop-and-go episodes), and they would also drastically reduce the number of accidents. If this were true, we could indeed say that they are sustainable.
However, over time, many doubts have arisen regarding the above statements. First, it is quite doubtful if AVs in the sense of fully automated vehicles (SAE 5 level; [1]) will one day become reality. Second, several studies have shown through simulation that the introduction of these vehicles would in fact imply an increase in the current congestion levels [2,3]. Finally, various surveys and studies have shown that some users are fascinated with the idea of AVs and would like to adopt them, while others would fear to travel in or near these vehicles. Note that AVs will have to coexist with less automated vehicles (and their drivers) for a long time.
However, there is positive news. For example, it seems quite clear that vehicles with automation levels 3 to 4 would suffice to change the mobility system, as passengers would only have to resume the driving task on specific occasions, and these levels of automation are feasible. However, note that the condition for these vehicles to be able to drive efficiently (i.e., not conservatively) is that they are connected, that is, that they turn out to be connected autonomous (or automated) vehicles (CAVs). These vehicles will be able to use, among others, vehicle-to-vehicle (V2V) communications and vehicle-to-infrastructure (V2I) communications to exchange information among themselves and with the infrastructure. With appropriate ad hoc traffic management strategies taking advantage of these data, the vehicles will be able to drive at high speeds and close distances, thus contributing to capacity increase without impairing safety [4,5]. In addition, the idea of a public transportation system based on AVs has arisen. A very efficient public transportation system taking advantage of AVs (i.e., CAVs) could foster a very positive mobility paradigm.
Nevertheless, the solution to the third abovementioned issue, i.e., to AV (or CAV) rate of adoption, is still not clear. Several studies have been performed to try to understand which user profiles are less likely to adopt AVs and the reasons behind this fact. Some trends are envisaged, but there are still no clear answers. In this context, the objective of this paper is to deepen the search for the factors that determine a higher or lower level of acceptance of AVs by specific population groups, but also by the general population. This search is performed for two different cases: first, for AVs substituting current private vehicles, and second, for AVs being the basis for public transportation systems (e.g., connected autonomous buses or shuttles). With this aim, data gathered through an online survey have been subjected to exploratory analysis, ordinal regression, and exploratory factor analysis. As it will be explained, safety perceptions and an a priori AV appeal seem to be the most determining factors in AV adoption.
The remainder of the paper is structured as follows: First, Section 2 summarizes the state of the art on AV adoption/acceptance; Section 3 explains the methodology used in this piece of research; Section 4 presents and discusses the main results obtained. Finally, the most significant conclusions of the paper are included in Section 5.

2. Background

Existing research on AV adoption can be restricted to a specific form of AV implementation or generalized, i.e., applicable to private AVs, shared AVs (SAVs), or mass transportation systems based on AVs. Similarly, some studies focus on the impact of specific factors on AV acceptance, while others are more comprehensive. The choice of the target users also implies a research decision, as their profiles can be varied or particular. In the next paragraphs, we include the main findings of highly cited works on the topic, belonging to all the above mentioned topics.
For example, ref. [6] performed a literature review on AV acceptance especially focused on users’ trust towards these vehicles. They concluded that, even though trust level varies depending on users’ profiles, it also does according to their ethical considerations. The authors suggested that ethical issues should be agreed on, clarified, and widespread to unblock user reluctance. Ref. [7] analyzed the relationship between AV acceptance and risk preference. First, they defined three innovative parameters, one as a measure of psychometric risk preference and two economic risk preference parameters. Then, they disseminated a stated preference survey in Singapore, answered by 1142 individuals, and analyzed the association of the former parameters with socioeconomic factors. Finally, they assessed the influence of risk preference on AV choice. The results showed that all the parameters contributed to predicting the level of AV acceptance. Females, the elderly, and low-income individuals were shown to be more risk-averse and, thus, less keen on adopting AVs. However, the authors warned that risk preference had been measured and modeled from the point of view of individuals, i.e., in a general way, and that particularizing it for different mode choices could lead to different results. For their part, the goal of [8] was to understand the impact of environmental concerns on (electric) AV adoption. Even though AVs are primarily thought to be electric, the reality is that a significant percentage of those acceptance studies do not mention this fact. Ref. [8] did, however. They applied the Technology Acceptance Model [9] to 470 responses to an online survey distributed in China. The results showed that green perceived usefulness, perceived ease of use, and environmental concern have a positive relationship with the users’ willingness to adopt AVs.
Ref. [10] covered a wide range of possible affecting factors. In 2017, they gathered data from 2036 Finnish citizens between 18 and 64 years old. Their aim was to establish to what extent people were ready for AVs and what concerns they had. They found that highly educated men living in cities were more likely to adopt AVs and at an earlier stage. They also found that car unavailability was related to a positive perception of AVs. Interestingly, the majority of respondents expressed their wish for AVs to have the option of manual drive. Ref. [11], in turn, conducted a systematic review of those contributions based on the acceptance of private AVs, making a distinction between those including behavioral theories and those that did not. They identified seven factors related to behavioral theories, namely perceived ease of use, attitude, social norm, trust, perceived usefulness, perceived risk, and compatibility, which significantly impacted AV acceptance. Safety, performance-to-price value, mobility, value of travel time, symbolic value, and environmental friendliness also had an impact.
One of the advantages initially offered by AVs was the fact that individuals usually unable to drive a traditional car, such as children, the elderly, or people with a disability, would be able to use them. Ref. [12] focused on the acceptance by this last group and is thus a good example of research targeting specific users. The researchers worked with a group of 444 UK participants with scarce or null walking abilities and a control group of people without impairments. The participants were interviewed about their feelings towards AVs and their responses were analyzed using, first, a structural topic modeling (STM) procedure and, second, a structural equation model (SEM). Results were very different between both groups, with the level of disability, the appeal of technology, the general level of anxiety, prior knowledge, the internal locus of control, and action orientation as the main factors affecting AV acceptance by people with walking difficulties. Ref. [13] also specified the target users, in this case millennials. The authors aimed to pay special attention to the impact of social factors and privacy concerns on AV adoption. To this end, they distributed an online questionnaire among Slovenian millennials born between the years 1981 and 2000 and studying at university. Afterwards, they analyzed the 359 received answers using SEM. The results highlighted the impact of privacy concerns together with perceived safety on general attitudes towards AVs. In addition, technological enthusiasm, social factors, perceived benefits, and facilitating qualities were shown to impact the participants’ attitudes to AVs. As expected, positive attitudes to AVs, perceived safety, and facilitating conditions led to a higher level of AV acceptance.
Among studies highlighting specific implementations of AVs, ref. [14] performed a literature review separately analyzing user willingness to use AVs or SAVs. Their analysis was based on an extended version of the Theory of Planned Behavior [15], as it also considered knowledge and perceived risk. The results were compared with those obtained after applying SEM to data collected in China through a survey answered by 906 individuals. According to this study, knowledge of AV technology and perceived risk turned out to be the main barrier to private AV and SAV adoption, which was also highly affected by the a priori attitude towards AVs. When focusing on private AVs, subjective norm plays an important role, while perceived behavioral control is more influential in the case of SAVs. SAV services were the target of [16]. Not only the role of safety and security perceptions but also that of factors such as the value of travel time were assessed, as these services imply detours to collect/drop off passengers. The authors used a multivariate integrated choice and latent variable approach to examine people’s willingness to adopt these SAV services. The results showed that commuters accepted sharing the vehicles with strangers more willingly than users who travelled for other purposes. In any case, the detour-related travel time was shown to affect acceptance more negatively. High-income individuals were less sensitive to this fact but only if they were able to work when travelling. Ref. [17] also focused on SAVs, specifically AV taxis, i.e., fairly small vehicles. They organized a panel of 834 individuals living in the USA, who were asked several questions. An exploratory factor analysis helped to identify four attitudinal dimensions: technology acceptance, risk-taking, traffic regulation, and driving enjoyment. Then, the authors used multinomial logistic regression to assess the influence of these factors on general attitudes towards AVs and on people’s willingness to adopt them, either as private vehicles or in the form of shared AV taxis. The results indicated that early adopters of technology and users with high compliance with traffic regulations had a positive attitude towards AVs and SAVs, as opposed to risk-averse people. Nevertheless, overall acceptance was found to be quite low. For their part, ref. [18] aimed at quantifying the role of the subjective value of travel time on peoples’ shift to AVs, but also to traditional public transportation. They elaborated and distributed a comprehensive survey, which was answered by 2229 Northern California commuters. Then, they defined a revealed preference mode choice model accounting for the impact of multitasking attitudes and behavior on modal choice. Results showed that public transport users willing to perform productive activities while commuting would shift to the private car if these tasks were not possible. If performing these tasks were possible in public transport but also in private vehicles (i.e., AVs), the latter would gain a 1.5% share.
Ref. [19] were more focused on methodologies than on results, even when they contributed with both to the state of the art. Indeed, their goal was to define a robust and generalizable methodology to assess AV acceptance independently of the type of AV service. They tested four frameworks that included sociodemographic as well as latent behavioral factors. A survey containing questions about all of them was launched online and answered by 507 people living in the Greater Dublin Area of the Republic of Ireland. The researchers used the gathered data in confirmatory factor analyses to specify and demonstrate scale reliability of indicator items, and convergent and discriminant validity of relationships among latent variables such as perceived benefits and perceived ease of use of AVs, public fears and anxieties regarding AVs, subjective norm, perceived behavioral control, attitudinal factors, etc. Then, they tested the four proposed models and validated their usefulness in assessing AV adoption intentions and choice between AV modes, namely private AVs, SAVs, or public transport based on AVs. Regarding the particular results obtained from their sample, they found that, despite the existence of fears in relation to safety and security, most people expected benefits from the implementation of AVs. The authors also found a strong positive relationship between environmental concerns and technology, being attitudes towards AV-based public transport especially favorable. As in previous studies, a priori favorable attitudes towards technology were linked to higher confidence and a feeling of being in control when using AVs. With regard to sociodemographic factors, one of the main conclusions was that females were more skeptical about technology-related benefits to society and, subsequently, more likely to adventure negative safety and security effects linked to AVs and to have lower expectations of AVs’ potential positive impacts.
The following studies provide interesting insights, partly because they used data beyond those obtained from stated preference surveys. Ref. [20] applied both the Theory of Planned Behavior [15] and the Technology Acceptance Model [9] to assess people’s intention to shift to AVs in the form of private vehicles or AV-based public transportation solutions. Very interesting data were collected from a gender-balanced sample of 74 individuals between 25 and 64 years old, who participated in a driving simulation experiment and answered a survey afterwards. The authors performed a hierarchical regression analysis, which highlighted the role of attitude toward the behavior, subjective norms, perceived behavioral control, and ease of use as predictors of intention to use AVs. As in other studies, AVs that allow manual control were shown to be accepted more willingly. Finally, ref. [21] is one of the few contributions to the state of the art that analyzed real experiences and perceptions of AV travelers. Specifically, 197 users of driverless shuttles implemented in the City of Vantaa were interviewed and their responses were statistically analyzed. The participants reported a higher safety perception of the driverless shuttles than of conventional buses. However, the perception of in-vehicle security of the driverless vehicles was much lower, especially in women.

3. Methodology

The following subsections explain the methodology used for this research, which is outlined in Figure 1.

3.1. Survey Design and Scope

The survey was defined in several iterations, after appropriately combining a number of questions that we wanted to include to account for specific factors with others that inspired previous studies consulted during the research on the state of the art. In addition, the order of the questions, the particular way in which each question was expressed, as well as the response options, were also carefully reviewed to avoid bias. Questions addressed the following topics:
  • Sociodemographics
  • Travel patterns and experiences
  • Driving profiles
  • General safety perceptions
  • Safety perceptions with regard to AV
  • Affinity for technology
  • Willingness-to-adopt questions
The English version of the survey can be found in Appendix A. Depending on the questions, answers could be binary (e.g., yes or no questions), categorical, or ordinal. Most of the latter were based on the Likert scale [22], the formulation of the possible answers being dependent on the particular question addressed. The last category, the willingness-to-adopt questions, included only two questions, which asked directly about the respondents’ likelihood of shifting to private AVs or public transportation systems based on AVs. These questions were the basis of the dependent variables in later analyses. The total list of variables linked to the survey and finally used in subsequent analyses is included in Table 1.
Note that the survey was also translated into Spanish and Catalan in order to reach the highest possible number of respondents. Unfortunately, economic and time constraints prevented the authors from producing in-person questionnaires, so the survey was distributed online. Unless this fact introduced an unavoidable bias, we tried to reach different respondent profiles by distributing the survey through very different channels (see Table 2).
We reached 380 respondents, approximately 23% from Catalonia, 29% from the rest of Spain, and 48% from other European countries. During the pre-processing, the answers of 4 of them were eliminated, as they had only partially addressed the questions. Statistically speaking, this number of respondents is enough to perform the desired analyses. However, from the point of view of population representativeness, a higher number of responses and a more balanced sample would have been desirable. This fact has been considered in the discussion section when interpreting the results.

3.2. Data Analyses

As shown in Figure 1, three different analyses were performed. We started with an exploratory data analysis, whose objective was twofold. First, we wanted to assess whether the responses were balanced, especially those related to socioeconomic factors. Second, we aimed to detect any striking particularities that could be further analyzed with more robust methods. In addition to calculating the percentages of the various responses, we looked for correlations among variables. Particularly, we looked for Spearman’s correlation, as it does not require normality and can be considered the non-parametric equivalent of the Pearson product-moment correlation. The second analysis used was factor analysis. Specifically, we used exploratory factor analysis (EFA), rather than confirmatory, as we had no prior knowledge of the factors underlying the assessed variables. We used the Generalized Least Squares extraction method, as it allows working with categorical and ordinal data. Although a high number of answers is desirable when doing EFA, our sample was mathematically sufficient, considering that practice requires a minimum ratio of 10 respondents per variable. The third analysis performed was ordinal regression. Again, it was selected given the ordinal nature of the dependent variables, “Willingness to shift to private AV” and “Willingness to shift to public transport based on AV”.

4. Results and Discussion

The following subsections describe and discuss the results obtained after performing the previously mentioned analyses.

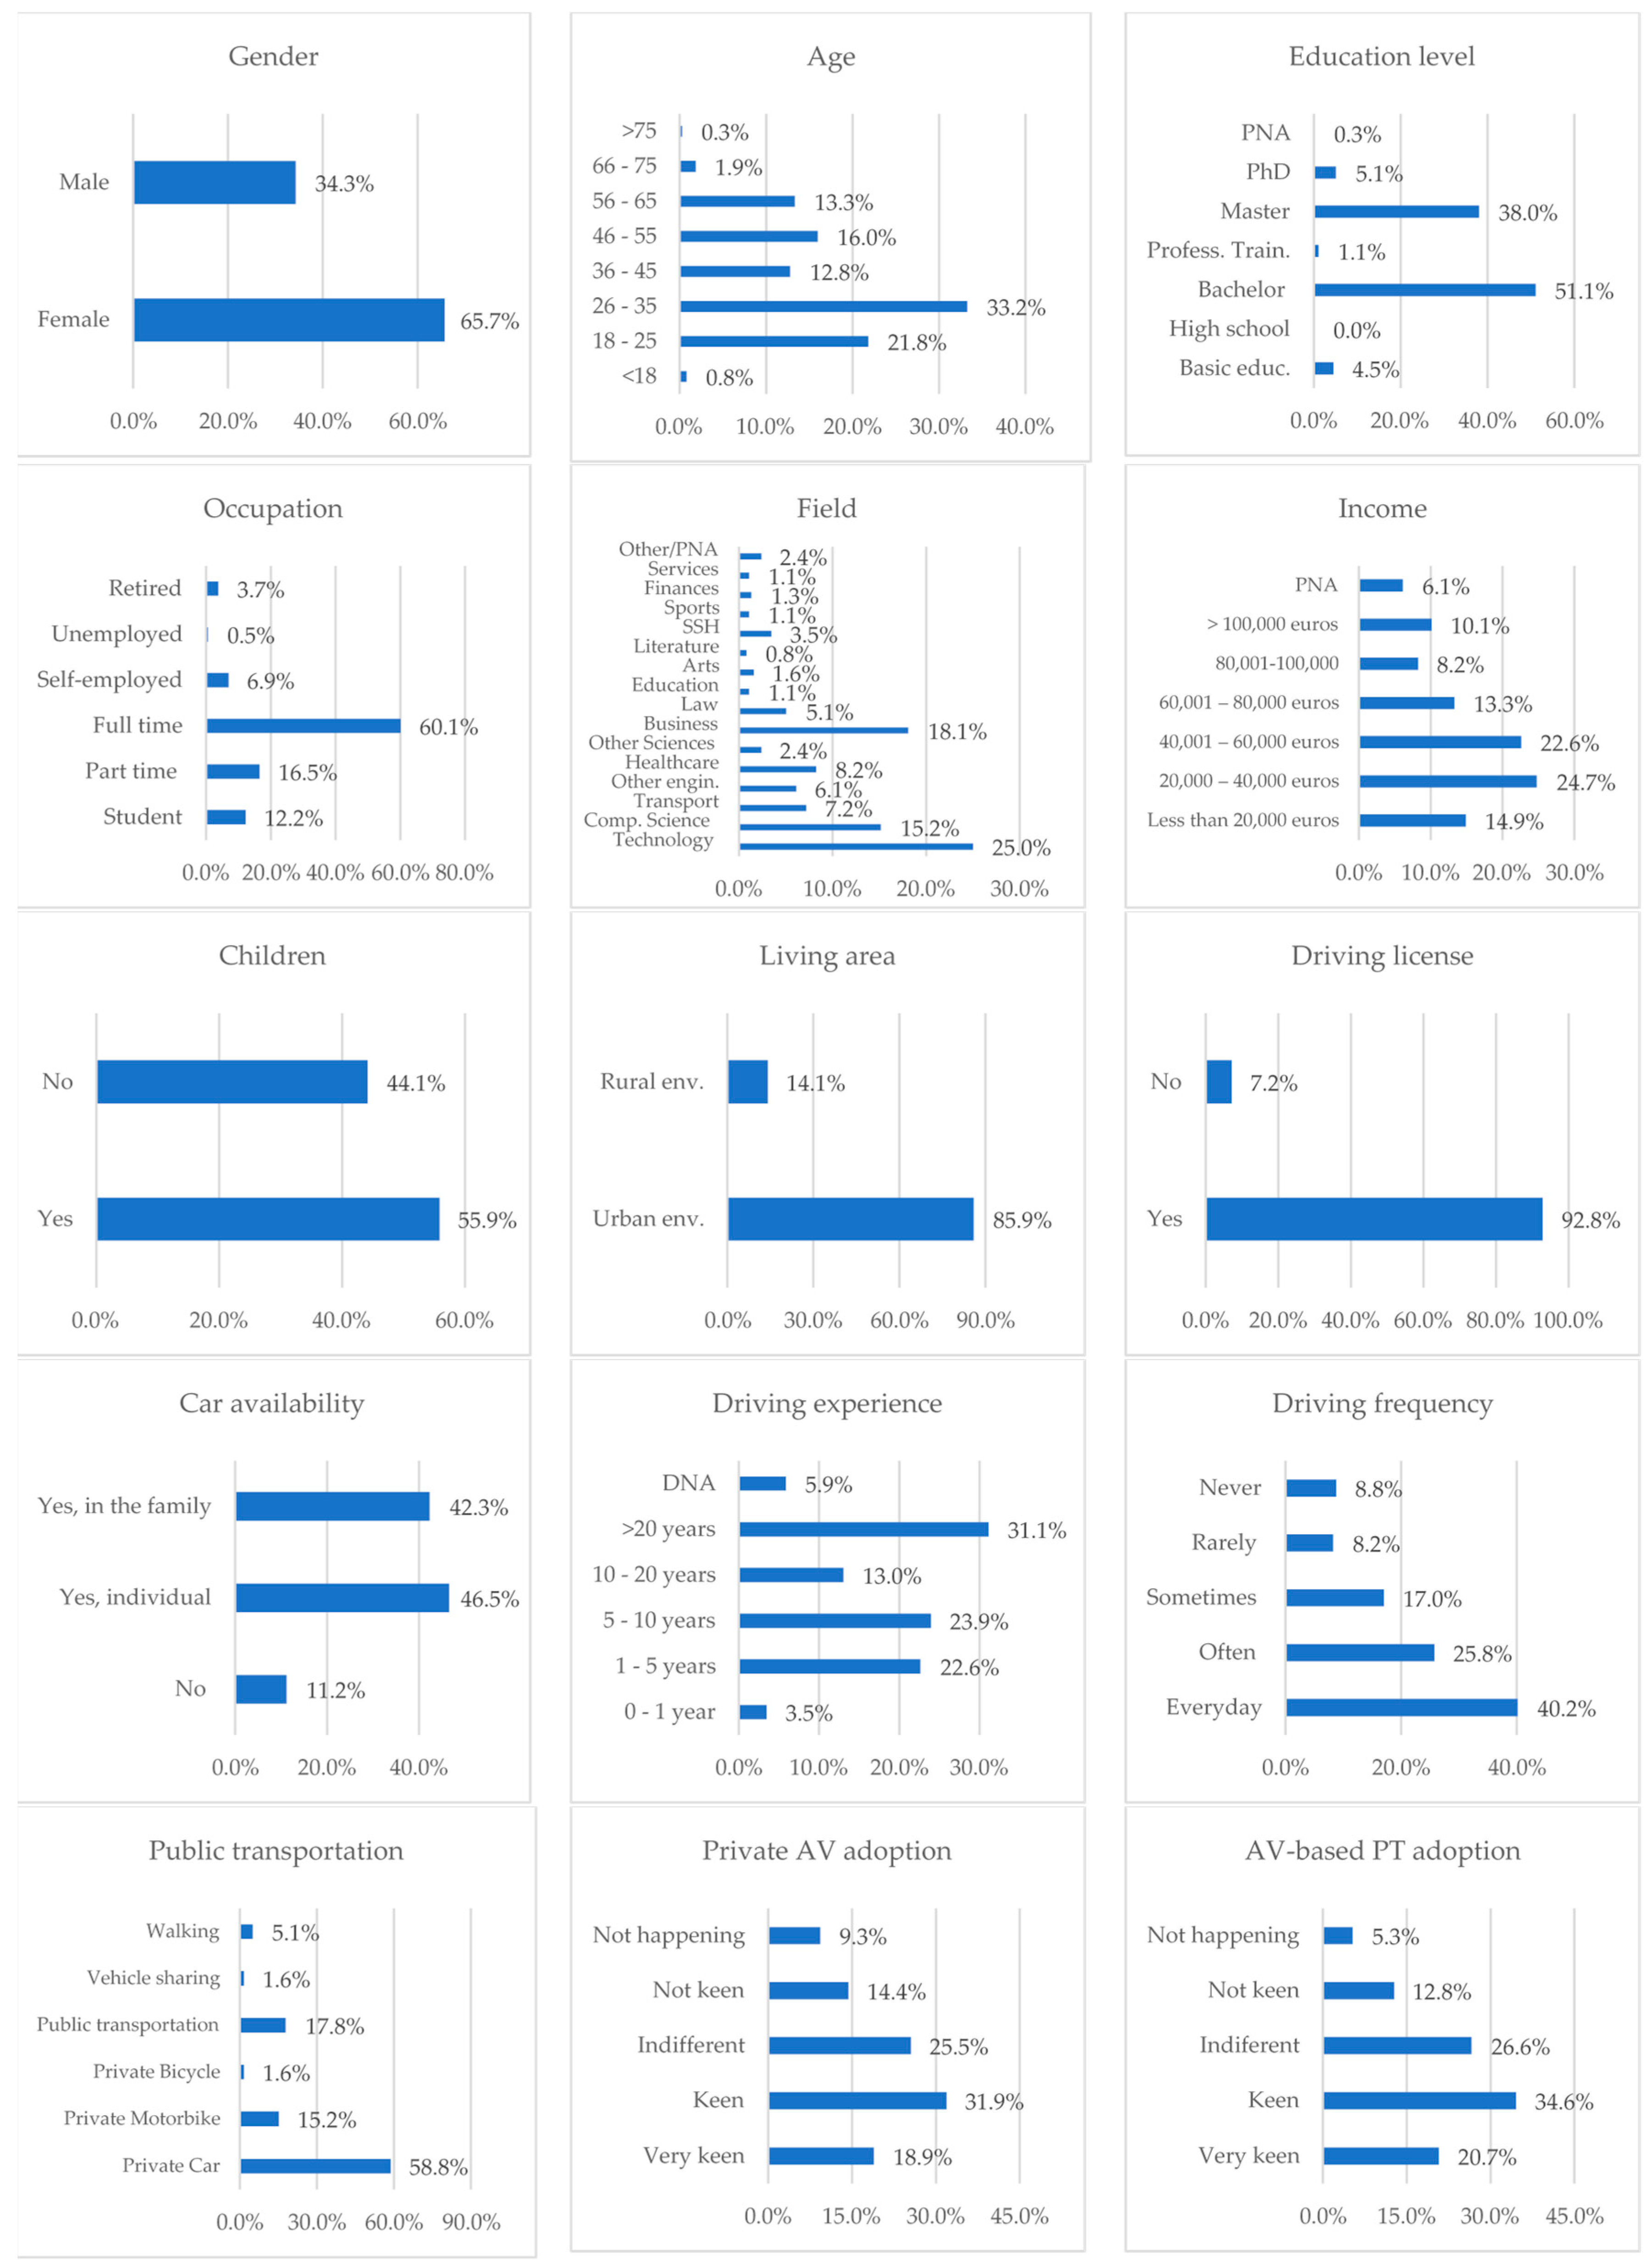
4.1. Exploratory Data Analysis

The first analysis conducted was exploratory. One of its goals was to assess the representativeness of the sample, given that the number of respondents was limited. This analysis was performed for all the questions of the survey. Figure 2 shows the frequencies of the responses to sociodemographic questions, as well as some of those related to travel patterns. Finally, the results for the two questions directly asking about the willingness to adopt private AVs or public transportation systems based on AVs are also included.
As can be seen, the sample is better balanced in terms of age than in terms of gender, with men being underrepresented (34.3%). Most respondents had a medium-high level of education (85.5%) and were full-time employees (60.1%) with an average income (473%). Interestingly, we received more responses from people related to technology (e.g., studying it or working with it), computer science, engineering, or business (74.1%). This issue is related to the non-ideal data collection method and already suggests that people from other fields were probably not even interested in answering a survey about AVs. It could be also hypothesized that people from the mentioned areas are more attracted by AVs and perhaps more likely to adopt them than individuals from other areas. The sample was well balanced in terms of the respondents having children or being childless (55.9 vs. 44.1%).
Most respondents lived in cities (85.9%) and had a driving license (92.8%, with different ranges of experience) and at least one private car available for the family (88.8%). Consequently, the most used mode of transportation was the private car, even when the percentage was lower (58.8%). The car was used daily in most cases (40.2%). We can again see some bias in the sample, as most respondents were frequent drivers. Again, it could be hypothesized that these respondents would be at least more likely than, e.g., usual pedestrians, to shift to AVs. In fact, this was the case for the answers to the questions regarding the adoption of AVs. More than 50% of the respondents would be keen or very keen on adopting them either as private vehicles (50.8%) or as the basis for public transportation systems (55.3%), and more than 25% were indifferent to both possibilities. This means they would not oppose a new transportation paradigm based on these vehicles. When focusing on the respondents rejecting AV adoption, the percentage is higher in the case of private vehicles (9.3% compared with 5.3% for AV-based public transportation systems).
We also checked the relationships between certain variables on the basis of the main ideas drawn from the state of the art. Figure 3, Figure 4 and Figure 5 show the relationship maps of some of them. On these maps, nodes represent variable categories and links represent the strength of influence between them. The larger nodes and the thicker link lines, the stronger the relationships. Figure 3 shows that there is no clear relationship between previous crash experiences as drivers and the safety perception while driving. The respondents probably felt that they were not to blame for the accident, or that it was just bad luck. Figure 4 shows that people who feel safe as passengers do so whether they are travelling in a private vehicle or on public transport. A slightly higher degree of safety is also observed among those who have not been involved in a previous accident. Finally, it can be seen in Figure 5 that there is a relationship between AV appeal and trust in AVs as means of transport. However, respondents tend to be more conservative if the passengers are not themselves but their immediate family members.
With regard to Spearman’s correlation, only one dependent variable, in particular the willingness to shift to private AV, correlated positively with the independent variables of education level and occupation for a significance level of 0.5. However, the correlation was weak in both cases.

4.2. Exploratory Factor Analysis

As explained, exploratory factor analysis was applied to all independent variables using the Generalized Least Squares (GLS) extraction method. In traditional factor analysis, it is assumed that the errors are homoscedastic and uncorrelated, but this assumption may not hold for real-world data. GLS extends the methodology by allowing for a more flexible covariance structure of the errors, accommodating situations where the variances of errors may vary across observations, or where correlations between errors exist. By incorporating a weighting matrix based on the specified covariance structure, GLS transforms the observed variables into a space where the assumptions of homoscedasticity and uncorrelated errors are met. This transformation enables a more accurate estimation of the factor loadings and unique variances, providing a robust framework for uncovering latent factors that contribute to observed variable variations while accounting for the complexities in the data’s error structure.
This technique was applied iteratively, eliminating those variables whose communalities after the extraction were smaller than 0.4. Note that factors, to be considered valid, must include at least three variables, and the correlation (loading) between these variables has to be of at least 0.3. A lower correlation would indicate a weak relationship between the variables and the factor. Table 3 includes the factors obtained using Varimax rotation and including only variables with communalities higher than 0.4. Two different extractions were made: the first one accepting all factors with eigenvalues higher than one (unrestricted extraction) and the second one limiting the number of factors to three. The Kaiser-Meyer-Olkin measure of sample adequacy was acceptable, reaching 0.685, and so was Bartlett’s test of sphericity, whose significance was null.
The usual exploratory factor analysis, i.e., without an a priori restriction of the number of factors, was not conclusive enough. Of the four resulting factors, two did not reach the minimum acceptable number of related variables, i.e., three. Additionally, factor 1 and factor 4 seemed to have similar meanings. Better, if not ideal, were the results obtained from the restricted model, in which the number of factors was set to 3. The first factor is positively measured by the variables of driving license, driving experience, driving frequency, driving skills, and driver profile, while driving after drinking alcohol and safety perception while driving are negatively related to it. This factor could be interpreted as “driver features”. The second factor is positively measured by age and driving experience, and negatively by preferred mode of transportation. It could be interpreted as “driving maturity”. Finally, the third factor is positively explained by the variables of AV appeal and safety perception in AVs. Even when it could be seen as a degree of trust in AVs, the fact that it is only related to two variables casts doubts on its significance, as does the correlation of these variables.

4.3. Regression Analysis

Several attempts were made in order to find the best regression models for the willingness to adopt private AVs and public transportation systems based on AVs, respectively, which were the dependent variables. The results of these attempts are included in Table 4 and the logic of their election was as follows: First, an attempt was made including all variables (model I). Second, several variables that have been shown to be correlated with others were gradually disregarded (models II and III). Third, considering that the former models were not satisfactory, further attempts were performed using the most promising independent variables to explain the dependent one according to the literature and the authors’ criterium (models IV to VII. Note that even though individually they had initially been proposed for one particular dependent variable, all of them were tested for both). Those last models were better than the more general ones. However, some coefficients were not significant. Therefore, two additional (much simpler) models were tested, in this case for the willingness to adopt private AVs (model VIII) and public transportation based on AVs (model IX), respectively, in which the independent variables were those whose coefficients had turned out to be significant in the former attempts. Indeed, those last models, based on safety perceptions and AV attraction, resulted in the most suitable ones for each of the dependent variables.
The goodness-of-fit of each of the models was first assessed via the −2log-likelihood, which is a measure of the model fit. In particular, the likelihood function represents the probability of observing the gathered data given the parameters of the model. When comparing different models, the model with the lower −2log-likelihood is generally considered a better fit for the data. For both dependent variables, we have compared all models with the intercept-only model, i.e., a model that includes no variables. Additionally, all models with a significant chi-square statistic (p < 0.0005) imply an improvement over the baseline intercept-only model. We have also checked the goodness-of-fit using Pearson’s chi-square statistic for the model. It aims to test whether the observed data are consistent with the fitted model. Assuming (null hypothesis) that the fit is good, a large p-value, i.e., the acceptance of this hypothesis, indicates that the data and the model predictions are similar and, thus, that the model is good. Finally, we have assessed the proportion of variance in the outcome that can be explained by the independent variables through the Nagelkerke pseudo-R value. The greater this value, the better predictor the model is.
Focusing on the best models, i.e., model VIII and model IX, it can be seen that an a priori appeal of AVs and the revealed safety perception while travelling in them are key factors to predict the public’s willingness to shift to AVs, both private and in the form of public transportation. Additionally, trust in AVs, represented by respondents not fearing for the safety of their families traveling with them, has been shown to influence private AV adoption. In the case of AV-based public transportation solutions, the general safety perception when traveling on current public transport would also have a positive impact.
Finally, the significant factors extracted during EFA were used as new stand-alone independent variables. Both driver features and driver maturity were shown to influence the willingness to shift to AVs, as Table 5 shows. Particularly people with long-standing driving experience and appropriate driving behavior seemed to be less likely to adopt them.

5. Conclusions

This paper aimed to contribute to the state of knowledge regarding AVs’ input into more sustainable mobility. In particular, we aimed to analyze to what extent they would be useful for society. We started with the statement that the main condition for usefulness to become reality is that users accept AVs as a transportation mode. Additionally, considering other characteristics of sustainable transportation such as efficiency and respect for the environment, we wanted to find out if there were differences in the adoption of AVs depending on the form of their implementation, namely as vectors for a new public transportation system or as private vehicles. Note that a high number of private vehicles driving with low occupancy increases consumption and the likelihood of congestion. Thus, a transportation system based on individual AVs would not be completely sustainable. The main conclusions drawn from the various analyses conducted are as follows:
  • For both types of AV-based solutions, the results showed that issues related to safety were those with higher impacts on adoption. This influence can be found in previous works (e.g., [11,13]). However, safety perceptions of AVs were similar across genders in this study, while other authors found females to be more safety-sensitive (e.g., [19]). It could be hypothesized that women willing to participate in an online survey on AVs do not represent the whole female spectrum. A deeper analysis in this regard would be desirable.
  • Particularizing for the case of AV-based public transportation systems, people already feeling safe when traveling on traditional public transportation were more willing to adopt them. This finding is consistent with other studies suggesting that the users of public transport who act as passengers are more likely to accept being passengers in driverless vehicles [21].
  • Previous attraction towards AVs also played a positive role in AV adoption, as demonstrated in previous works (e.g., [12,13]).
  • Conversely, other variables, such as the value of time (in the form of willingness to take advantage of travel time to perform any kind of task), did not show any effect on AV adoption. Previous works in the literature did find an influence of these variables (e.g., [16,18]). Thus, specific studies on these relationships are needed.
  • Additionally, the factor analysis suggested that actual driving features and experiences might influence AV adoption. Different results can be found in the state of the art with regard to the possible impact of these factors, which should be further analyzed.
  • Appeal cannot be easily influenced. However, safety perceptions can be, at least to some extent. Given the former results, stakeholders interested in AV adoption should try to clarify how AVs drive and their advantages from the safety point of view. Potential risks and their probabilities should also be explained. Information can shape perceptions, and informed individuals tend to make more objective decisions.
Finally, it is important to recall some insights from the exploratory data analysis already explained. For example, most respondents did have a car and used it as their preferred mode of transportation. This fact could have influenced the results obtained. Also note that the sample size was limited and that the gender ratio was unbalanced, as was the rate of people living in or outside cities. Therefore, the results of this work should not be taken for granted, but as a starting point for future research.

Author Contributions

Conceptualization, M.M.-D.; methodology, M.M.-D. and M.-M.M.C.; formal analysis, M.M.-D. and M.-M.M.C.; writing—original draft preparation, M.M.-D.; writing—review and editing, M.M.-D. and M.-M.M.C. All authors have read and agreed to the published version of the manuscript.

Funding

This research received no external funding.

Institutional Review Board Statement

Not applicable.

Informed Consent Statement

Informed consent was obtained from all subjects involved in the study.

Data Availability Statement

The data used to perform this research are kept by the authors, who may transfer them for academic use in particular cases and with the permission of the participants.

Conflicts of Interest

The authors declare no conflicts of interest.

Appendix A

This appendix contains the English version of the survey. Text in quotation marks was the introduction.
“The introduction of highly automated vehicles (AVs) will represent a milestone in the evolution of transportation and personal mobility. AVs are expected to significantly reduce accidents and congestion, while being economically and environmentally beneficial. However, much work remains to be done to make these improvements a reality. Furthermore, it remains to be defined which scenario is the most positive in terms of the level of automation truly necessary, the modalities of cooperation between autonomous vehicles, which type of vehicles should be automated (e.g., public transport or private vehicles, vehicles transporting people or only goods), the most suitable driving environments (e.g., city versus motorway), etc.
This survey tries to study people’s willingness to use automated transport, and the reasons/conditions why they would or would not like to use it. Before starting the survey, a little piece of information is provided so that everyone is able to answer the survey properly. Afterwards, the survey will not take more than 10 min.
The Society of Automotive Engineers (SAE) defines 6 levels of driving automation ranging from 0 (fully manual) to 5 (fully autonomous), as can be seen in the following figure:
Table A1. Summary of SAE automation levels [4].
SAE LevelControlsEnvironm. MonitoringDriving Superv.Scenarios
0: all onDriverDriverDriverAll
1: hands onDriverDriverDriverSome
2: hands offDriver + vehicleDriverDriverSome
3: eyes offVehicleVehicleDriverSome
4: mind offVehicleVehicleDriver + vehicleSome
5: all offVehicleVehicleVehicleAll
There is a difference between autonomous and automated vehicles. Autonomous vehicles refer to automated vehicles with a SAE 5 level of automation, which means full automation. This is usually overlooked in non-scientific media or advertisement, where the adjective “autonomous” is indiscriminately used. Note that AVs are expected to behave cooperatively and to exchange information among them, with the infrastructure and with other devices (e.g., mobile phones). The aim of this cooperation is to improve mobility in terms of efficiency, safety, emissions and consumptions.”
  • QUESTIONNAIRE
  • PART 1: SOCIODEMOGRAPHIC
    1.
    What is your gender?
    • Male
    • Female
    • Non-binary
    • Prefer not to answer
    2.
    What is your age?
    • Under 18
    • 18–25
    • 26–35
    • 36–45
    • 46–55
    • 56–65
    • Over 65
    3.
    Prefer not to answer
    • Education level
    • Basic education
    • High school degree
    • College degree
    • Master’s degree
    • Doctorate degree
    • Prefer not to answer
    4.
    Current occupation:
    • Student
    • Part time job
    • Full time job
    • Self-employed
    • Unemployed
    • Retired
    • Other:
    • Prefer not to answer
    5.
    Which of the following categories best describe the field you work (worked) or study in:
    • Technology
    • Computer Science
    • Transportation
    • Other engineering fields
    • Healthcare
    • Other Sciences (Math, Physics, etc.)
    • Business
    • Law
    • Pre-university education
    • Arts
    • Literature
    • Social Sciences and Humanities
    • Sports
    • Other:
    • Prefer not to answer
    6.
    Income per year:
    • Less than 20,000 euros
    • 20,000–40,000 euros
    • 40,001–60,000 euros
    • 60,001–100,000 euros
    • More than 100,000 euros
    • Prefer not to answer
    7.
    Do you have children?
    • Yes
    • No
    • Prefer not to answer
    8.
    Where do you live?
    • Urban environment
    • Rural environment
    • Prefer not to answer
  • PART 2: CURRENT MOBILITY/DRIVING BEHAVIOR
    9.
    What is your primary transportation mode?
    • Private Car
    • Private Motorbike
    • Private Bicycle
    • Public transportation (train, metro, bus, etc.)
    • Carsharing, moto sharing, carpooling
    • Walking
    • Other
    10.
    Do you have a driving license?
    • Yes
    • No
    11.
    If you have a driving license, how many years of experience do you have?
    • 0–1 year
    • 1–5 years
    • 5–10 years
    • 10–20 years
    • More than 20 years
    • Does not apply
    12.
    Do you have a car in your household?
    • Yes, I share a car in my family
    • Yes, I have my own car
    • No
    13.
    How often do you drive a car?
    • Everyday
    • Often (3–5 times a week)
    • Sometimes (1–2 times a week)
    • Rarely (2–5 times a month)
    • Never
    14.
    How do you rate your driving skills?
    • Professional
    • Above average
    • Average
    • Bad
    • Very bad
    15.
    What type of driver would you describe yourself as?
    • Aggressive
    • Average
    • Cautious
    16.
    How fast do you drive?
    • Above speed limits
    • According to speed limits
    • Slower than speed limits
    17.
    Which is your usual safety perception when you are driving?
    • Very safe
    • Safe
    • Moderate
    • Rather unsafe
    • Very unsafe
    • Don’t drive
    18.
    How safe do you feel when being a passenger in a private car? (General feeling not considering the particular driver)
    • Very safe
    • Safe
    • Moderate
    • Rather unsafe
    • Very unsafe
    19.
    How safe do you feel when being a passenger in public transportation? (General feeling not considering the particular driver)
    • Very safe
    • Safe
    • Moderate
    • Rather unsafe
    • Very unsafe
    20.
    Do you perform other tasks while driving? Texting, cell phone calls, music choosing, destination selection, eating…
    • Yes
    • No
    • I do not drive
    21.
    If you do, how often do you perform these other tasks
    • All the time (every ride)
    • Frequently (almost every ride)
    • Moderate
    • Occasionally
    • Rarely
    22.
    Have you ever driven under the influence of alcohol or drugs?
    • Yes
    • No
    • Prefer not to answer
    23.
    If you have, how often have you driven under the influence of alcohol or drugs?
    • Every time I go out
    • Frequently
    • Moderate
    • Sometimes
    • Once
    • I have not done it
    • Prefer not to answer
    24.
    How much importance do you give/would you give to safety when choosing a new vehicle?
    • Most importance
    • Very importance
    • Moderate
    • Low importance
    • No importance
    25.
    Which are the most important factors when choosing among different public transportation providers, if available? Multiple answers allowed.
    • Safety
    • Frequency
    • Comfort
    • Price
    • Punctuality
    • Other
    26.
    What do you do while being a passenger on public transportation?
    • Work
    • Study
    • Entertainment (videogame, tv series, reading a book)
    • Nothing/Rest
    • Other
    27.
    Have you ever been involved in a car crash while driving?
    • Yes
    • No
    28.
    Have you ever been involved in a crash while being a passenger?
    • Yes, in a private car
    • Yes, in public transportation
    • No
    29.
    Have you ever driven a car with advanced driving assistance systems? (Cruise control, automatic braking, lane departure detection, blind spot detection, accident prevention systems…)
    • Yes
    • No
    30.
    Either as driver or as passenger, how much safer do you feel if the car has advanced driving assistance systems?
    • Much safer
    • Safer
    • Same as without assistance
    • Less safe
    • Much less safe
    31.
    How much do you think this kind of assistance systems contributes to road safety and to avoid accidents?
    • A lot
    • Pretty much
    • Moderate
    • A bit
    • Do not help
  • PART 3: PERCEPTIONS ABOUT AUTOMATED/AUTONOMOUS VEHICLES
    32.
    How familiar are you with the concept of autonomous vehicles?
    • Expert
    • Very familiar
    • Familiar
    • A little familiar
    • Non-familiar. The information provided before was my first approach to the topic.
    33.
    How excited (attracted) are you in general with the idea of fully autonomous vehicles (SAE level 5)?
    • Very excited
    • A bit excited
    • Do not care
    • Not excited
    • Against it
    34.
    How safe do you think you would feel as a passenger in a fully automated car (SAE5)?
    • Very safe
    • Safe
    • Moderate
    • Not safe
    • Not very safe
    35.
    What would your safety perception be circulating in a traditional vehicle but in a mixed environment sharing the road with autonomous vehicles?
    • Very safe
    • Safe
    • Same as nowadays
    • Less safe than nowadays
    • Very unsafe
    36.
    Would you be concerned if your family or closest people travelled in fully automated vehicles?
    • Very concerned
    • Concerned
    • Same as if it is a human driven vehicle
    • Less concerned
    • Not concerned
    37.
    Would you be concerned if your goods travelled in fully automated vehicles?
    • Very concerned
    • Concerned
    • Same as if it is human-driven vehicle
    • Less concerned
    • Not concerned
    38.
    What aspects concern you about fully automated vehicles? (Multiple answers allowed)
    • Not having control of the vehicle
    • The possibility of a technological error (mechanical failure breakdown)
    • Technology’s incorrect reasoning in a difficult situation (software failure)
    • The possibility of the car/system being hacked
    • Ethical issues
    • I have no concerns
    • Other
    39.
    How safe do you think autonomous vehicles (SAE5) would be compared to human-driven vehicles? Note that we are now not asking about your safety perception, but about actual consequences of these vehicles’ introduction.
    • Much safer
    • Safer
    • Same
    • Less safe
    • Really dangerous
    40.
    How many accidents do you think will take place with autonomous vehicles (SAE5) sharing the road network with other vehicles, compared to nowadays? Note that we are not asking about your safety perception, but about actual consequences of these vehicles’ introduction.
    • Little to no accidents
    • Less accidents than now
    • Same amount of accidents
    • More accidents
    • Much more accidents
    41.
    How keen on shifting to a private fully autonomous vehicle would you be considering it would have a reasonable price?
    • Very keen
    • Keen
    • Moderate
    • Not keen
    • Not happening
    • What would you do while riding a fully autonomous vehicle (SAE level 5)?
    • Work
    • Study
    • Entertainment (videogame, tv series, reading a book)
    • Nothing/Rest
    • Other
    42.
    How keen on shifting to a public transportation system based on fully autonomous vehicles (e.g., SAE5 level buses) would you be considering it would have a reasonable price?
    • Very keen
    • Keen
    • Moderate
    • Not keen
    • Not happening
    43.
    What reasons would motivate you to shift to an autonomous vehicle (SAE5), either private or public? Multiple answers allowed
    • Self-comfort
    • Emissions reduction linked to their driving efficiency
    • Traffic fluidity improvements (travel time savings)
    • Avoidance of accidents (minimizing human errors, no driving under the influence of alcohol, tired)
    • The possibility of doing things (e.g., working) during the journey
    • The excitement for technological improvements and evolution
    • Nothing
    • Other
    44.
    In the event of an expected crash between the automated car and pedestrians or another car, how do you think the car should react?
    • Trying to save the largest most amount of people
    • Trying to save its own passenger/s
    • Trying to save the pedestrians or other cars involved, no matter their number.
    • Trying to save the youngest people involved
    45.
    Which autonomy level would you choose for your car, disregarding differences in the price?
    • Non-autonomous at all
    • With basic driving assistance systems (SAE 1–2)
    • Partially (conditioned) automated (SAE 3)
    • Highly automated (SAE 4)
    • Fully automated (SAE 5)
    46.
    How should future mobility be? Multiple answers allowed
    • Based on private autonomous vehicles.
    • Based on shared autonomous vehicles
    • Based on autonomous public transportation and private autonomous vehicles
    • With autonomous public transportation and traditional private vehicles
    • Based on SAE5 vehicles
    • Based on SAE4 vehicles
    • Based on SAE3 or inferior vehicles
    • Based on soft transportation modes (walking, bicycle, scooters, etc.)

References

  1. J3016A:SEP2016; Taxonomy and Definitions for Terms Related to Driving Automation Systems for On-Road Motor Vehicles. Society of Automotive Engineers: Warrendale, PA, USA, 2016.
  2. Ntousakis, I.A.; Nikolos, I.K.; Papageorgiou, M. On microscopic modelling of adaptive cruise control systems. Transp. Res. Proc. 2015, 6, 111–127. [Google Scholar] [CrossRef]
  3. Martínez-Díaz, M.; Soriguera, F.; Pérez, I. Technology: A necessary but not sufficient condition for future personal mobility. Sustainability 2018, 10, 4141. [Google Scholar] [CrossRef]
  4. Martínez-Díaz, M.; Soriguera, F.; Pérez, I. Autonomous driving: A bird´s eye view. IET Intell. Transp. Syst. 2019, 13, 563–579. [Google Scholar] [CrossRef]
  5. Sala, M.; Soriguera, F. Capacity of a freeway lane with platoons of autonomous vehicles mixed with regular traffic. Transp. Res. Part B Methodol. 2021, 147, 116–131. [Google Scholar] [CrossRef]
  6. Adnan, N.; Md Nordin, S.; bin Bahruddin, M.; Ali, M. How trust can drive forward the user acceptance to the technology? In-vehicle technology for autonomous vehicle. Transp. Res. Part A Policy Pract. 2018, 118, 819–836. [Google Scholar] [CrossRef]
  7. Wang, S.; Zhao, J. Risk preference and adoption of autonomous vehicles. Transp. Res. Part A Policy Pract. 2019, 126, 215–229. [Google Scholar] [CrossRef]
  8. Wu, J.; Liao, H.; Wang, J.; Chen, T. The role of environmental concern in the public acceptance of autonomous electric vehicles: A survey from China. Transp. Res. Part F Traffic Psychol. Behav. 2019, 60, 37–46. [Google Scholar] [CrossRef]
  9. Fishbein, M.; Ajzen, I. Belief, Attitude, Intention and Behavior: An Introduction to Theory and Research; Addison-Wesley: Reading, MA, USA, 1975. [Google Scholar]
  10. Liljamo, T.; Liimatainen, H.; Pöllänen, M. Attitudes and concerns on automated vehicles. Transp. Res. Part F Traffic Psychol. Behav. 2018, 59, 24–44. [Google Scholar] [CrossRef]
  11. Jing, P.; Xu, G.; Chen, Y.; Shi, Y.; Zhan, F. The Determinants behind the acceptance of autonomous vehicles: A systematic review. Sustainability 2020, 12, 1719. [Google Scholar] [CrossRef]
  12. Bennett, R.; Vijaygopal, R.; Kottasz, R. Attitudes towards autonomous vehicles among people with physical disabilities. Transp. Res. Part A Policy Pract. 2019, 127, 1–17. [Google Scholar] [CrossRef]
  13. Ljubi, K.; Groznik, A. Role played by social factors and privacy concerns in autonomous vehicle adoption. Transp. Policy 2023, 132, 1–15. [Google Scholar] [CrossRef]
  14. Peng, J.; Huang, H.; Ran, B.; Zhan, F.; Shi, Y. Exploring the factors affecting mode choice intention of autonomous vehicle based on an extended theory of planned Behavior—A case study in china. Sustainability 2019, 11, 1155. [Google Scholar] [CrossRef]
  15. Icek, A. The theory of planned behavior. Organ. Behav. Hum. Decis. Process. 1991, 50, 179–211. [Google Scholar]
  16. Lavieri, P.; Bhat, C. Modeling individuals’ willingness to share trips with strangers in an autonomous vehicle future. Transp. Res. Part A Policy Pract. 2019, 124, 242–261. [Google Scholar] [CrossRef]
  17. Wang, S.; Jiang, Z.; Noland, R.; Mondschein, A. Attitudes towards privately-owned and shared autonomous vehicles. Transp. Res. Part F Traffic Psychol. Behav. 2020, 72, 297–306. [Google Scholar] [CrossRef]
  18. Malokin, A.; Circella, G.; Mokhtarian, P. How do activities conducted while commuting influence mode choice? Using revealed preference models to inform public transportation advantage and autonomous vehicle scenarios. Transp. Res. Part A Policy Pract. 2019, 124, 82–114. [Google Scholar] [CrossRef]
  19. Acheampong, R.; Cugurullo, F. Capturing the behavioural determinants behind the adoption of autonomous vehicles: Conceptual frameworks and measurement models to predict public transport, sharing and ownership trends of self-driving cars. Transp. Res. Part F Traffic Psychol. Behav. 2019, 62, 349–375. [Google Scholar] [CrossRef]
  20. Buckley, L.; Kaye, S.A.; Pradhan, A.K. Psychosocial factors associated with intended use of automated vehicles: A simulated driving study. Accid. Anal. Prev. 2018, 115, 202–208. [Google Scholar] [CrossRef] [PubMed]
  21. Salonen, A.O. Passenger’s subjective traffic safety, in-vehicle security and emergency management in the driverless shuttle bus in Finland. Transp. Policy 2018, 61, 106–110. [Google Scholar] [CrossRef]
  22. Likert, R. A technique for the measurement of attitudes. Arch. Psychol. 1932, 22, 55. [Google Scholar]
Figure 1. Methodological framework.
Sustainability 16 00895 g001
Figure 2. Exploratory data analysis of sociodemographic and dependent variables (PNA: prefer not to answer; DNA: does not apply).
Sustainability 16 00895 g002
Figure 3. Relationships between crash experiences as driver and general safety perception while driving.
Sustainability 16 00895 g003
Figure 4. Relationships between crash experiences and general safety perception as passenger.
Sustainability 16 00895 g004
Figure 5. Relationships between safety perception while travelling by AV and AV appeal.
Sustainability 16 00895 g005
Table 1. Variables considered in the analyses.
VariableTypeDenomin.
Willingness to shift to private AVOrdinalShift_AV, 1
Willingness to shift to public AV OrdinalShift_ptAV, 2
GenderCategoricalGender, 3
AgeOrdinalAge, 4
Education levelCategoricalEd_level, 4
OccupationCategoricalOcc, 5
FieldCategoricalField, 6
IncomeOrdinalIncome, 7
ChildrenBinaryChildren, 8
ResidenceCategoricalResidence, 9
Car licenseBinaryLic, 10
Car availabilityCategoricalCar_avail., 11
Driving experienceOrdinalDr_exp, 12
Driving frequencyOrdinalDr_fq, 13
Transport modeCategoricalDr_mode, 14
Crash drivingBinaryCrash_dr, 15
Crash as passengerBinaryCrash_pax, 16
Experience with ADASBinaryAdas, 17
Tasks while drivingBinaryTask_dr, 18
Frequency of tasksOrdinalTask_fq, 19
Tasks on public transportBinaryTask_pt, 20
Alcohol while drivingBinaryAlc_dr, 21
Driving skillsOrdinalDr_skills, 22
Driver profileCategoricalDr_profile, 23
Safety perception while drivingOrdinalSafe_dr, 24
Safety perception as passengerOrdinalSafe_pax, 25
Safety perception on public transportOrdinalSafe_ptpax, 26
AV appealOrdinalAV_app, 27
Safety perception in AVOrdinalSafe_AV, 28
Safety perception family in AVOrdinalSafe_famAV, 29
Table 2. Survey distribution channels.
ChannelTarget Respondents
WhatsAppAuthors’ direct contacts and subsequent chains of contacts
InstagramAuthors’ direct contacts and subsequent chains of contacts
E-mailRelated associations or focus groups (e.g., Associació de Municipis per la Mobilitat i el Transport Urbà)
LinkedInUsers directly linked with the authors or their institution but also following topics/people related to transportation, AVs, automation, etc. Transport companies and authorities were also labeled (e.g., EIT Urban Mobility).
Amazon Mech. TurkCrowdsourcing marketplace in which respondents are paid
SurveyCircleQuid pro quo platform used for research and market purposes
RedditNetwork of communities where users share their interests
ForumsGroups related to particular forms of mobility (e.g., cyclists, motorists, etc.)
Table 3. Results of the exploratory factor analysis.
Communalities (Unrestricted)Rotated Component Matrix 1 (Unrestricted)Rotated Component Matrix 2 (Restricted)
VariableInitialExtractionF1F2F3F4F1F2F3
Age0.5910.927 0.956 0.880
License0.5940.9460.363 0.8840.771
Dr_exp0.6730.714 0.734 0.3570.3420.815
Dr_fq0.3440.4870.459 0.462
Dr_mode0.3160.434 −0.409 −0.340
Alc_dr0.3730.432−0.388 −0.407−0.572
Dr_skills0.4430.6160.760 0.589
Dr_profile0.3800.4310.474 0.3500.602
Safe_dr0.5110.676−0.774 −0.754
AV_app0.5270.619 0.780 0.830
Safe_AV0.5320.847 0.913 0.846
1 Convergence after 4 iterations. 2 Convergence after 5 iterations.
Table 4. Results of the ordinal regression analysis.
Dependent VariableIndependent VariablesModel-Fit DataGoodness-of-FitPseudo-R
−2Loglikel 1.Chi-SquareSig.Chi-SquareSig.Nagelkerke
Shift_AV I: 3 to 29694.396454.32701539.690.0040.736
II: 4, 5, 6, 7, 8, 9, 10, 11, 12, 13, 14, 15, 16, 18, 19, 20, 21, 22, 23, 24, 25, 26, 29893.78254.93301425.4490.3120.517
III: 4, 5, 7, 8, 9, 10, 11, 12, 13, 14, 15, 16, 18, 19, 20, 21, 22, 24, 25, 29938.942209.77101394.9260.6910.449
IV: 9, 11, 12, 13, 14, 15, 16, 17, 18, 19, 21, 22, 23, 25, 28, 29853.015295.69801377.9570.8810.571
V: 10, 11, 12, 13, 14, 15, 16, 17, 18, 19, 20, 21, 22, 23, 24, 25, 26, 28, 29836.045312.668<0.0011418.140.6170.593
VI: 4, 8, 9, 10, 11, 14, 20, 26, 27, 28, 29805.533332.665<0.0011362.6160.7150.616
VII: 14, 26, 27, 28511.725306.530<0.01506.0320.8430.585
VIII: 27, 28, 29339.744310.7640210.580.8400.590
Shift_ptAVI: 3 to 29785.470315.87703364.56600.600
II: 4, 5, 6, 7, 8, 9, 10, 11, 12, 13, 14, 15, 16, 18, 19, 20, 21, 22, 23, 24, 25, 26, 29899.435201.91202689.61400.439
III: 4, 5, 7, 8, 9, 10, 11, 12, 13, 14, 15, 16, 18, 19, 20, 21, 22, 24, 25, 29936.942164.40502104.71300.374
IV: 9, 11, 12, 13, 14, 15, 16, 17, 18, 19, 21, 22, 23, 25, 28, 29825.57129.3060.061898.00300.079
V: 10, 11, 12, 13, 14, 15, 16, 17, 18, 19, 20, 21, 22, 23, 24, 25, 26, 28, 29890.984210.39901705.16500.453
VI: 4, 8, 9, 10, 11, 14, 20, 26, 27, 28, 29881.771210.44701318.1160.9240.453
VII: 14, 26, 27, 28566.465192.2360571.6450.160.423
IX: 26, 27, 28361.951186.8860227.6750.4940.414
1 1148.713 (AV) and 1101.347 (ptAV) for intercept only.
Table 5. Regression with extracted factors as only independent variables.
Dependent VariableIndependent VariablesGoodness-of-FitPseudo-R
Nagelkerke
Chi-Sq.Sign.
Shift_AVF1, F2214.0810.9980.952
Shift_ptAVF1, F22.6820.9750.945
Disclaimer/Publisher’s Note: The statements, opinions and data contained in all publications are solely those of the individual author(s) and contributor(s) and not of MDPI and/or the editor(s). MDPI and/or the editor(s) disclaim responsibility for any injury to people or property resulting from any ideas, methods, instructions or products referred to in the content.

