Abstract
Shield tunnel segment uplift is a common phenomenon in construction. Excessive and unstable uplift will affect tunnel quality and safety seriously, shorten the tunnel life, and is not conducive to the sustainable management of the tunnel’s entire life cycle. However, segment uplift is affected by many factors, and it is challenging to predict the uplift amount and determine its cause accurately. Existing research mainly focuses on analyzing uplift factors and the uplift trend features for specific projects, which is difficult to apply to actual projects directly. This paper sorts out the influencing factors of segment uplift and designs a spatial-temporal data fusion mechanism for prediction. On this basis, we extract the key influencing factors of segment uplift, construct a prediction model of segment uplift amount based on Extreme Gradient Boosting (XGBoost) v2.0.3, and use SHapley Additive exPlanation (SHAP) v0.44.0 to locate factors affecting uplift, forming an Auxiliary Decision-making System for Segment Uplift Control (ADS-SUC). An ADS-SUC not only detects the sudden change of the segment uplift successfully and predicts the segment uplift in practical engineering accurately, it also provides a feasible method to control the uplift in time, which is of great significance for reducing the construction risk of the tunnel project and ensuring the quality of the completed tunnel.
1. Introduction
During shield tunneling, a gap exists between the segment and the stratum [1]. After the segment comes out of the tail shield, the segment tends to move due to unbalanced force [2], so the segment displacement is inevitable, and the most common phenomenon is segment uplift. Excessive uplift of segments during the construction period may cause problems such as segment misalignment, damage, cracking, and water leakage [3,4], which is not conducive to the long-term stable operation of the tunnel, thereby posing hidden dangers to the future operation quality of the tunnel and even urban safety. In the case of a considerable segment uplift, the site usually takes measures to control the attitude of the shield in advance to weaken the uplift, and sometimes adjusts related parameters to reduce the segment uplift. However, due to the complexity of mechanism of segment uplift, it takes work to predict and control it.
Many researchers, both domestically and internationally, have conducted extensive research on the issue of segment uplift. Among them, most researchers have focused on studying the influencing factors of segment uplift, while some have explored the prediction of the amount of segment uplift based on this research.
1.1. Research Status of Segment Uplift Factors
In terms of factors affecting segment uplift, existing research is mainly conducted from two perspectives: mechanical analysis and data analysis. In mechanical analysis, numerical simulation is a common method. Kasper et al. [5,6,7] used the finite element model to simulate and analyze the influence of factors such as formation characteristics, tunnel depth, and slurry characteristics on the segment uplift. Both Ji et al. [8] and Huang et al. [9] used the sensitivity analysis method to rank the weights of the segment uplift factors, and both obtained the most significant weight of grouting-related factors. However, the former used numerical simulation and indoor synchronous grouting tests as research methods; the latter is based on the equivalent beam model. Chen et al. [10] established a three-dimensional numerical model, revealed the interaction mechanism of shield-segment-soil, and found that the jack thrust has the most significant impact on segment uplift. Lv et al. [11] and Shu et al. [12], respectively, focused on the study of formation characteristics and the impact of changes in the slurry consolidation characteristics under the formation seepage effect on the segment uplift. Some studies use theoretical analysis methods to analyze the influencing factors of segment uplift. Dai et al. [13] conducted a mechanical analysis on the segment and considered that the segment uplift is mainly affected by the combined force of the formation, grouting, and the segment. Based on the literature [13], Wang et al. [14] established a longitudinal floating model using the theory of elastic foundation beams, considering the time-varying characteristics of grout and the influence of grouting pressure. Liang et al. [15] conducted a mechanical analysis of the segment section. They found, through parameter sensitivity analysis, that the residual thrust of the jack is one of the main buoyancy forces. Hu et al. [16] established a segment floating motion model and considered the influence of slurry viscous resistance on segment uplift. Geng et al. [17], based on the analysis of the principle of segment uplift, and combined with actual engineering, proposed that shield attitude control, total thrust, and propulsion speed also have an impact on segment uplift. The above studies have explored the factors affecting the uplift based on mechanical analysis, but due to the complexity of the mechanical relationship, different modeling methods and model simplification angles, and reliance on different projects, the conclusions obtained by the existing studies are different and lack general guidance.
In addition, some researchers have analyzed the factors influencing uplift through engineering data. Through comprehensive on-site experiments, Zhou and Ji [18] established the relationship between individual sensitive parameters and segment uplift, finding that grouting pressure and slurry composition ratio are the most sensitive factors affecting segment uplift. Dong et al. [19], starting from field-measured data and mechanical analysis, analyzed the temporal variation pattern of single-ring segment uplift and compared changes in segment uplift amount, pitch and roll angles, and excess excavation of soil volume, thereby obtaining preliminary insights into the relationship with segment uplift. Cheng et al. [20] used on-site measurements and numerical simulations to analyze the uplift of tunnels in an actual project and found that the removal of dumped soil and the pit excavation will also affect the uplift of tunnels. Geng et al. [21], combining field data and mathematical-statistical methods, selected data from small sections to discuss the influence of formation and shield excavation parameters on segment uplift patterns. From a data perspective, the studies take dozens of ring data in specific scenarios as examples to analyze the relationship between segment uplift and factors. However, this analysis relies on clear trends in data variations, and the resulting relationships may have a random contingency. The robustness of the results remains to be tested.
Whether from a mechanical or data-oriented perspective, most current research is conducted over short distances or in single scenarios, and the considered factors need to be more comprehensive. The influencing factors obtained so far have yet to form a relatively complete system. Furthermore, there are partially consistent conclusions about the relationship between segment uplift and influencing factors, but contradictory situations exist. Therefore, current research lacks verification over long distances, and there is no universal conclusion about the relationship between factors and the uplift of the segment.
1.2. Research Status of Segment Uplift Prediction
In predicting segment uplift, mainstream methods focus on deriving uplift calculation formulas based on force analysis. Lv et al. [11] used the theory of force balance to derive a calculation formula for segment uplift amount under the rebound effect of the weak strata foundation. They combined their experience to determine the amount of the segment uplift in the slurry, ultimately achieving the prediction of the maximum amount of segment uplift. Shu et al. [12], by improving the equivalent beam model, considered the consolidation characteristics of synchronous grouting in strata with different permeability, established a segment uplift analysis model, and predicted the average uplift of the segment. Lin et al. [22], based on force analysis, considered segment uplift as comprising three parts: slurry-induced uplift amount (S1), uplift amount due to overlying soil compression (S2), and segment’s self-deformation (S3). They derived the values of S1 and S2 through the uplift analysis model and determined S3 empirically, thereby predicting the final uplift of a single-ring segment. Similarly, Geng et al. [23] established a mechanical model to derive segment uplift for two stages, before and after slurry solidification, thus obtaining the relatively stable uplift of the segment. Zhang et al. [24], considering the time-varying nature of uplift force, the superposition effect of shield construction steps, and the distribution of slurry pressure, constructed a theoretical model for tunnel segment uplift based on a double-sided elastic foundation beam and obtained theoretical solutions for segment uplift under individual construction step loads and calculated the total uplift using the cumulative method. The predictions of segment uplift based on mechanical analysis are mainly focused on deriving maximum or relatively stable stage uplift of segments. However, the obtained relationship results are primarily qualitative, making it challenging to guide the construction process. Therefore, these methods are often used in the construction planning stage.
In recent years, artificial intelligence (AI) models based on machine learning algorithms have been widely used in the engineering field. For example, Raja [25] proposed a gene expression programming (GEP) method to predict liquefaction-induced lateral spreading/displacement (Dh), which solves a difficult task of civil/geotechnical engineers. In the field of tunnel engineering, machine learning is used to complete the prediction of surface settlement [26,27] and the prediction and control of shield attitude [28,29,30]. Kim et al. [26] used five machine learning algorithms: support vector machine (SVR), random forest (RF), gradient boosting machine (GBM), extreme gradient boosting algorithm (XGBM), and light GBM (LGBM) to establish prediction models for tunnel surface settlement to find a more suitable prediction model for surface settlement. Ning et al. [27] integrated GRA, LSTM, and SPC to achieve real-time online prediction of surface settlement. Huang et al. [28] improved the three algorithms of MLP, SVM, and GBR based on GA and PCA for the prediction of shield attitude. Chen et al. [29] proposed a shield attitude intelligent prediction model based on Bayesian-LGBM and completed the effectiveness verification in Guiyang Rail Transit Line 3. Wada et al. [30] used gradient boosting trees to predict the optimal point of the shield jack’s resultant force in the shield’s propulsion direction, which was used to guide the shield’s excavation guidance and demonstrated the possibility of autonomous shield driving in the future. Therefore, it is of great significance to effectively solve complex problems in engineering by leveraging the powerful learning capabilities of machine learning to establish artificial intelligence models and mine the relationships between coupled data.
In addition to the mentioned studies, exploratory research has emerged utilizing machine learning methods for segment uplift prediction. Ye et al. [31] and Chen et al. [32] employed machine learning algorithms for predicting the uplift process of individual ring segments in a tunnel. They analyzed the relationship between the uplift of a single unique point and its variation over time. However, their dataset was limited, using only 100-ring and 20-ring data as the study subjects. When the environment is stable, the uplift of the segment within a short distance may not change much, so the effectiveness of the approach is challenging to validate. Moreover, estimating future segment uplift amount for construction sites still heavily relies on historical measurement data. While this method provides valuable references in a single situation, it exhibits a noticeable “lag” when faced with changing scenarios. Consequently, construction sites often adjust their uplift control objectives post-factum, lacking effective means of segment uplift control.
Currently, the research findings have not yet been validated over longer distances, and due to the variability of the environment, understanding the relationship between factors and segment uplift, and achieving advanced predictions of changes in the final segment uplift trend, are crucial for ensuring the quality of formed tunnels. In response to the prediction and control requirements of segment uplift during shield tunnel construction, this paper designs an auxiliary decision-making system for segment uplift control. This system aims to overcome the limitations of existing research, which relies on empirical estimation and has difficulty explaining the relationship between uplift and influencing factors, thus addressing the challenges of uplift prediction and control. Consequently, this study utilizes a large amount of available construction data from the construction site and employs machine learning models to describe the implicit relationship between construction parameters and segment uplift to predict the final uplift amount of the segment. Additionally, the SHAP method is used to analyze further the relationship between various influencing factors and the amount of uplift, optimize uplift control measures, provide auxiliary decision-making for on-site construction, and ultimately ensure the quality of the formed tunnel.
The remaining sections of the paper are divided into four parts for exposition. The second part summarizes the influencing factors of segment uplift discussed in the existing literature. The third part introduces the key modules within the construction-assisting decision framework based on segment uplift prediction. The fourth part presents this model’s application process and effects in engineering projects and analyzes the auxiliary decision-making results in typical sections. Finally, the entire paper is summarized and prospected.
2. Analysis of Factors Influencing Segment Uplift
This paper conducted a literature search on the analysis of factors influencing segment uplift from the Science Direct, American Society of Civil Engineers (ASCE), Wanfang, and CNKI databases from 2013 to 2023. The retrieved literature was then categorized and summarized based on the types of influencing factors (Figure 1).
We have categorized the factors influencing uplift discussed in the existing literature into five types: grouting system, geological conditions, attitude control, segmental assembly, and propulsion system (as shown in Figure 1a). Among these, over 90% of the relevant literature indicates a close correlation between grouting system factors and segment uplift. Geological conditions are the next most frequently mentioned factor type, while a few papers discuss the influence of attitude control factors on segment uplift. Regarding specific influencing factors, most studies agree that grouting pressure, slurry density, slurry mixture ratio, and the vertical component of total thrust force are vital factors affecting uplift. However, the significance of these factors varies across the different literature. For instance, the literature [21] concludes that the vertical component of total thrust has the lowest weight among all influencing factors. In contrast, the literature [33] believes it has the most significant impact on segment uplift.
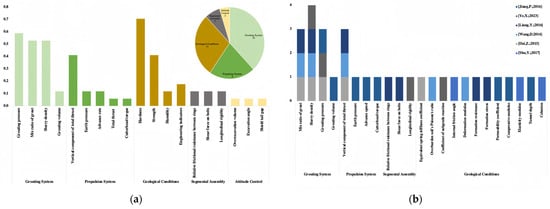

Figure 1.
A Summary of the Influencing Factors in the Literature from 2013 to 2023. (a) Proportion of Factor Occurrence Times; (b) Factor Frequency Statistics in the Prediction Literature [12,13,14,15,31,34].
Figure 1.
A Summary of the Influencing Factors in the Literature from 2013 to 2023. (a) Proportion of Factor Occurrence Times; (b) Factor Frequency Statistics in the Prediction Literature [12,13,14,15,31,34].
Regarding the types of influencing factors, there has been relatively limited research on the impact of grouting volume within the grouting system on segment uplift. In the propulsion system, there is some controversy surrounding the influence of propulsion speed on uplift. Concerning segment assembly, the primary focus is on the forces between and within segment rings. In terms of tunnel geological conditions, due to differences in research perspectives and strata studied, the influencing factors involved in stratigraphic conditions are scattered and can be roughly divided into two categories: engineering indicators and physical property parameters. Among them, the physical property parameters of soil conditions involve strength, humidity, and hardness, and it can be found that the influence of soil hardness parameters on uplift has received more attention.
Furthermore, we analyzed the types and frequencies of influencing factors related to uplift prediction in the literature (Figure 1b). We found that the results align closely with the summary presented in Figure 1a, except for factors related to the attitude control of the tunnel boring machine (TBM), which were not included. Apart from the high-frequency influencing factors, most of the remaining factors appeared only in individual predictive studies. This phenomenon is because the prediction of segment uplift is often carried out under particular circumstances, and the analysis is for simple and specific flotation cases. Hence, more comprehensive consideration of the factors affecting flotation is needed.
Therefore, based on analyzing all the relevant literature on uplift influencing factors and considering the data availability for various factor categories, we have assembled a candidate feature set for constructing prediction models of segment uplift. This effort aims to assist in the design of models for segment uplift prediction.
3. Materials and Methods
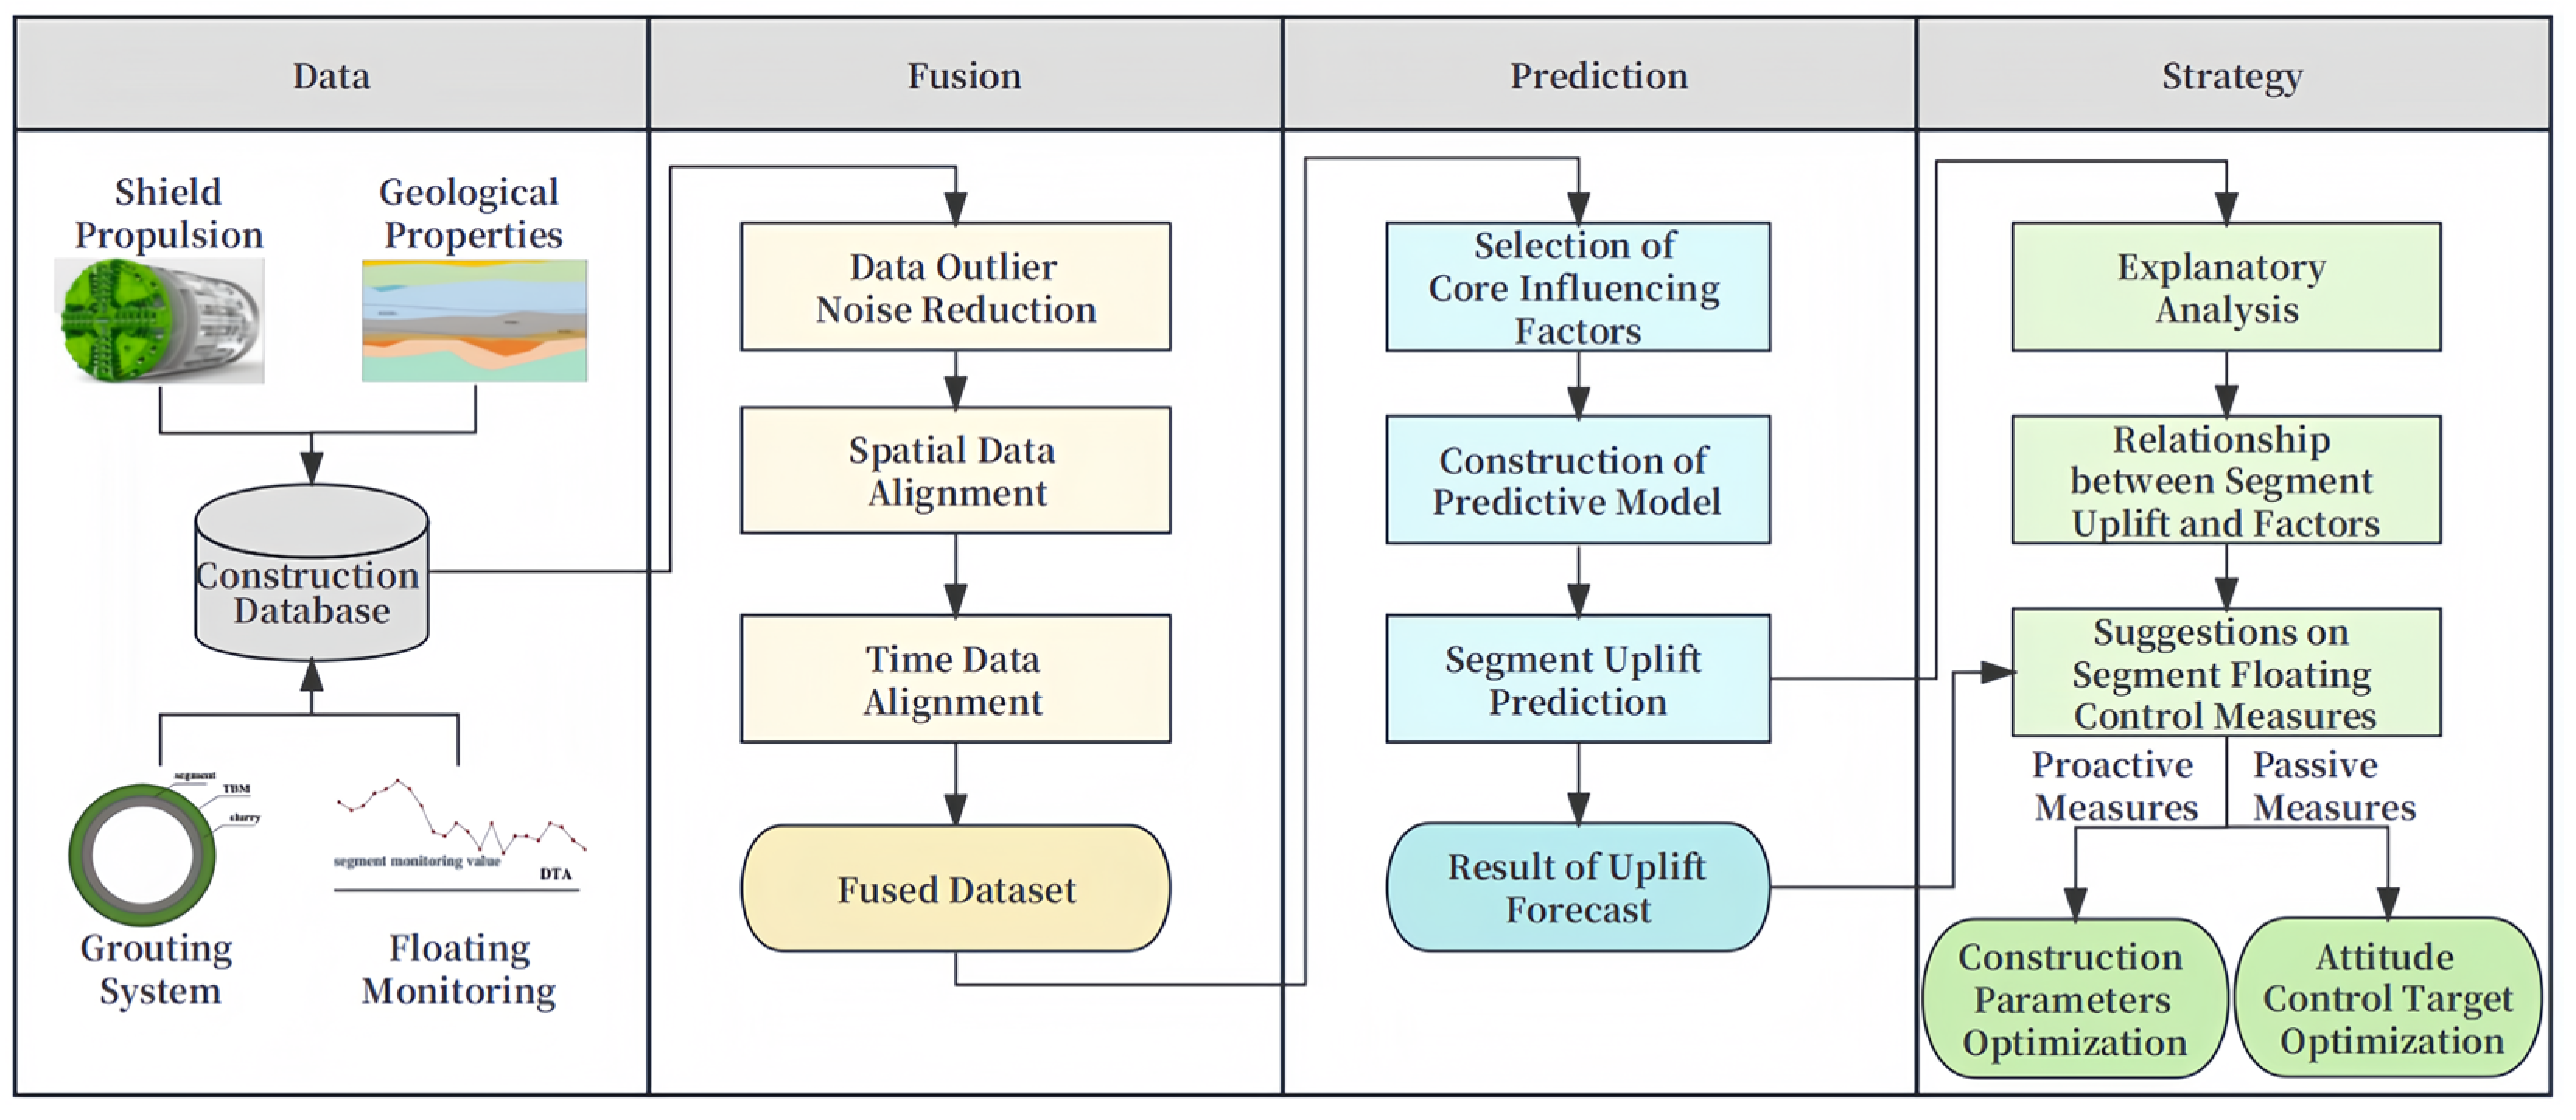
In order to prevent segment uplift from posing quality threats to the project, we explored segment uplift factors and future trends based on construction data and finally established an auxiliary decision-making system for the segment uplift control to help the construction site manage the segment uplift (ADS-SUC, See Figure 2). On the one hand, the ADS-SUC offers a relatively precise prediction of the uplift amount, supporting the engineering site in mitigating uplift through attitude control. On the other hand, it elucidates the relationship between segment uplift and influencing factors. When feasible within the project, it provides parameter optimization solutions to minimize uplift, ensuring the stability and subsequent quality of the tunnel.
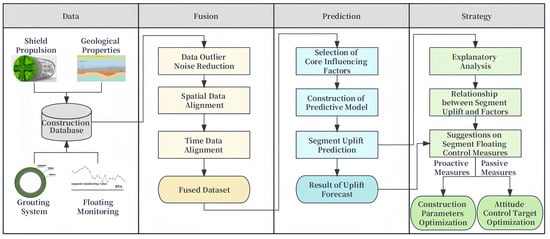
Figure 2.
Framework of Auxiliary Decision-Making System for Segment Uplift Control (ADS-SUC).
The ADS-SUC consists of four modules: data, fusion, prediction, and strategy. The functions of each module are introduced as follows:
- Data Module
In the data module, we drew upon the influencing factors mentioned in the existing literature and considered the availability of construction data to identify these factors comprehensively. We defined the initial dataset to include propulsion parameters derived from tunnel boring machine sensors, geological condition parameters representing the strata environment where the segments are located, and grouting system parameters governing the gap between the tunnel boring machine and the segments. Our predictive target was the ultimate uplift value of the segments.
- 2.
- Fusion Module
Following the handling of data outliers in the fusion module, we conducted spatial and temporal alignment studies as the input parameters were diverse, originating from various sources, and exhibited distinct spatiotemporal characteristics. This process ensured the effectiveness and scientific validity of the input parameters.
- 3.
- Prediction Module
Within the prediction module, we designed and selected features that influence uplift. After filtering for feature importance, core features were chosen as inputs for the model. After that, we constructed a predictive model for the stable uplift amount of the segments, which refers to the segment uplift that occurs after 24 h of grouting completion.
- 4.
- Strategy Module
In the strategy module, we employed interpretative analysis methods to investigate the relationship between factors affecting uplift and the actual uplift. Combining this analysis with segment uplift predictions, we assessed whether uplift control was necessary. Ultimately, we proposed two categories of measures: the first involves proactive actions through the optimization of construction parameters to reduce uplift, and the second entails passive measures achieved by optimizing the tunnel boring machine’s posture control objectives to offset uplift.
3.1. Data Preparation and Fusion
Based on the analysis of factors influencing segment uplift, this paper explores the relationship between grouting system, propulsion system, geological condition, and segment uplift amount. A summary of the data is provided in Table 1. The data related to grouting system and propulsion system were obtained from sensors integrated into the tunnel boring machine. Formation characteristics data were computed based on geological exploration report survey data, while segment uplift data were measured by on-site construction personnel. In this study, we initially processed the data by removing outliers, interpolating missing values, and applying data smoothing techniques to ensure data quality. Furthermore, due to differences in data sources and categories, different feature parameters exhibit corresponding temporal or spatial characteristics. Therefore, all data need to be aligned and integrated in both the temporal and spatial domains.

Table 1.
Data Profile.
The data’s temporal and spatial alignment mainly include two aspects: temporal-spatial alignment of construction parameters and the calculation of time and distance differences.
- Temporal-Spatial Alignment of Construction Parameters
- Temporal Alignment
For construction parameters such as grouting volume, grouting pressure, slurry density, earth pressure, disc cutter torque, and total thrust, alignment follows the data frequency consistency principle. Due to the high data acquisition frequency of the tunnel boring machine, each ring segment collects thousands of numerical values. Consequently, the parameters for each ring segment are transformed according to the calculation principles, with each parameter corresponding to a single data point. This ensures that the data are organized on a “ring” basis.
- Spatial Alignment
Spatial displacement alignment is required for earth pressure, total thrust, and cutterhead torque. For example, earth pressure reflects the disturbance at the cutterhead’s cutting position. However, there is approximately rings between the shield tail and the cutting point. The earth pressure measured at ring () represents the soil pressure at the environment of ring () in the segment. Therefore, the earth pressure at ring is the earth pressure measured at ring (), which means the earth pressure needs to be spatially shifted forward by a distance of rings. The same principle applies to total thrust and cutterhead torque. The calculation method for the earth pressure at ring is as shown in Equations (1)–(3):
In the equations, and represent the total thrust and cutterhead torque at ring R, respectively, while and represent the total thrust and cutterhead torque at ring , respectively.
- 2.
- Calculation of Time and Distance Differences
- Time Difference
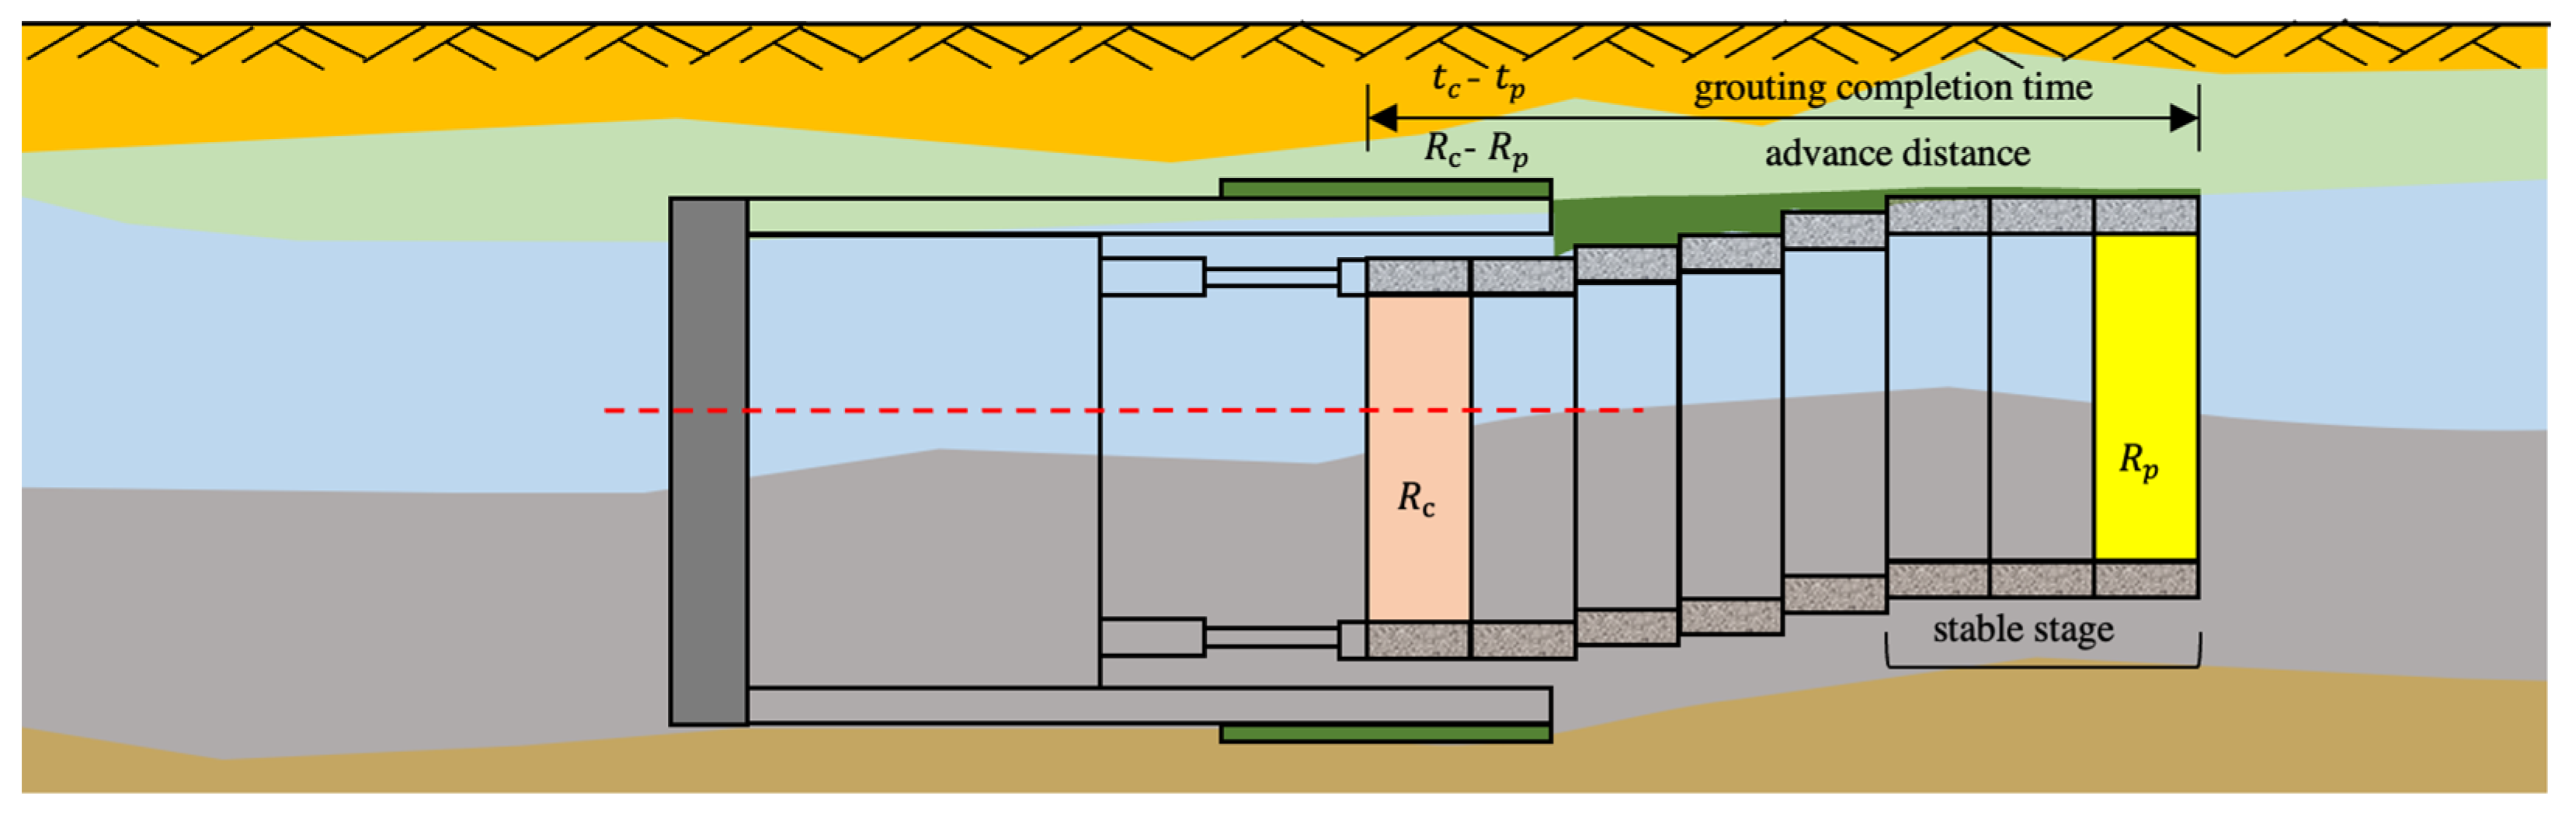
In this paper, the completion time of grouting is represented as the time difference between the end of grouting and the stability of the uplift quantity (Figure 3). If at time , uplift monitoring is performed on the segment (where completes grouting at time ) in the stable uplift phase, then the completion time of grouting for the segment at this moment, denoted as , is calculated as shown in Equation (4):

Figure 3.
Temporal−Spatial Characteristics of Segments Uplift.
- Distance Difference
After the assembly of segments, the spatial position of the segment remains relatively fixed, and there will be no large displacement that will cause changes in the surrounding formation environment. Therefore, the physical properties of each ring segment will not change during the entire uplift process, and one-to-one correspondence is sufficient. For the advance distance parameter, it means the advance distance of the shield machine after the ring is assembled (Figure 3). Hence, when performing uplift monitoring on the segment during the stable uplift phase at time , and the corresponding latest assembled ring number is , the advancement distance of the segment should be calculated as a difference, as shown in Equation (5):
3.2. Feature Selection
To reduce the impact of non-important factors on the model, we performed feature selection for dimensionality reduction. This paper uses the feature gain method built into XGBoost to calculate feature importance. It measures the importance of features by calculating the information gain “Gain” (Equation (6)) that each feature brings in tree node splitting, thus identifying the key influencing factors of segment uplift.
In the equation, and represent the sums of first-order derivatives of all samples in the left and right subtrees, respectively. In contrast, and represent the sums of second-order derivatives of all samples in the left and right subtrees, and λ is the regularization hyperparameter.
After calculating the information gain for each feature, we obtained a ranking of feature importance from largest to smallest (see Figure 4). According to the results, this paper first discovered a high correlation between earth pressure and segment uplift, followed by physical properties of the soil, including water content, internal friction angle, and density. Next were various factors in the grouting system. The importance scores of the last five features were all below 9, contributing less to the model’s predictions. Moreover, the top 15 features already covered three categories of parameters from the original dataset. Therefore, to ensure model computational speed and reduce complexity, this paper removed five features: cohesion (C), static lateral pressure coefficient (SLPC), saturation density (SD), the total grouting volume in the ring (GV-t), and cutterhead torque (CT). The final 15 selected input features, in order of feature importance, are earth pressure (EP), water content (WC), internal friction angle (IFA), unit weight of soil (UWC), middle grouting volume (GV-m), grouting pressure difference (GPD), upper-middle grouting volume ratio (GVR-um), slurry density (SD), advance distance (AD), upper load (UL), compression coefficient (CC), tunnel burial depth (TBD), total thrust (TT), upper grouting volume (GV-u), and grouting completion time (GCT).
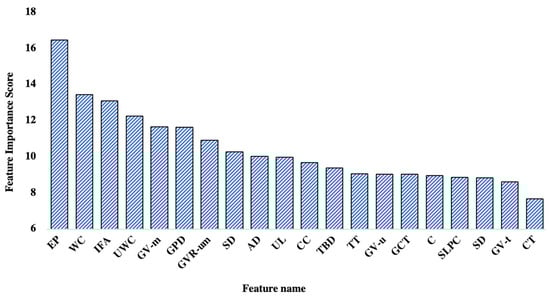
Figure 4.
Feature Importance Ranking.
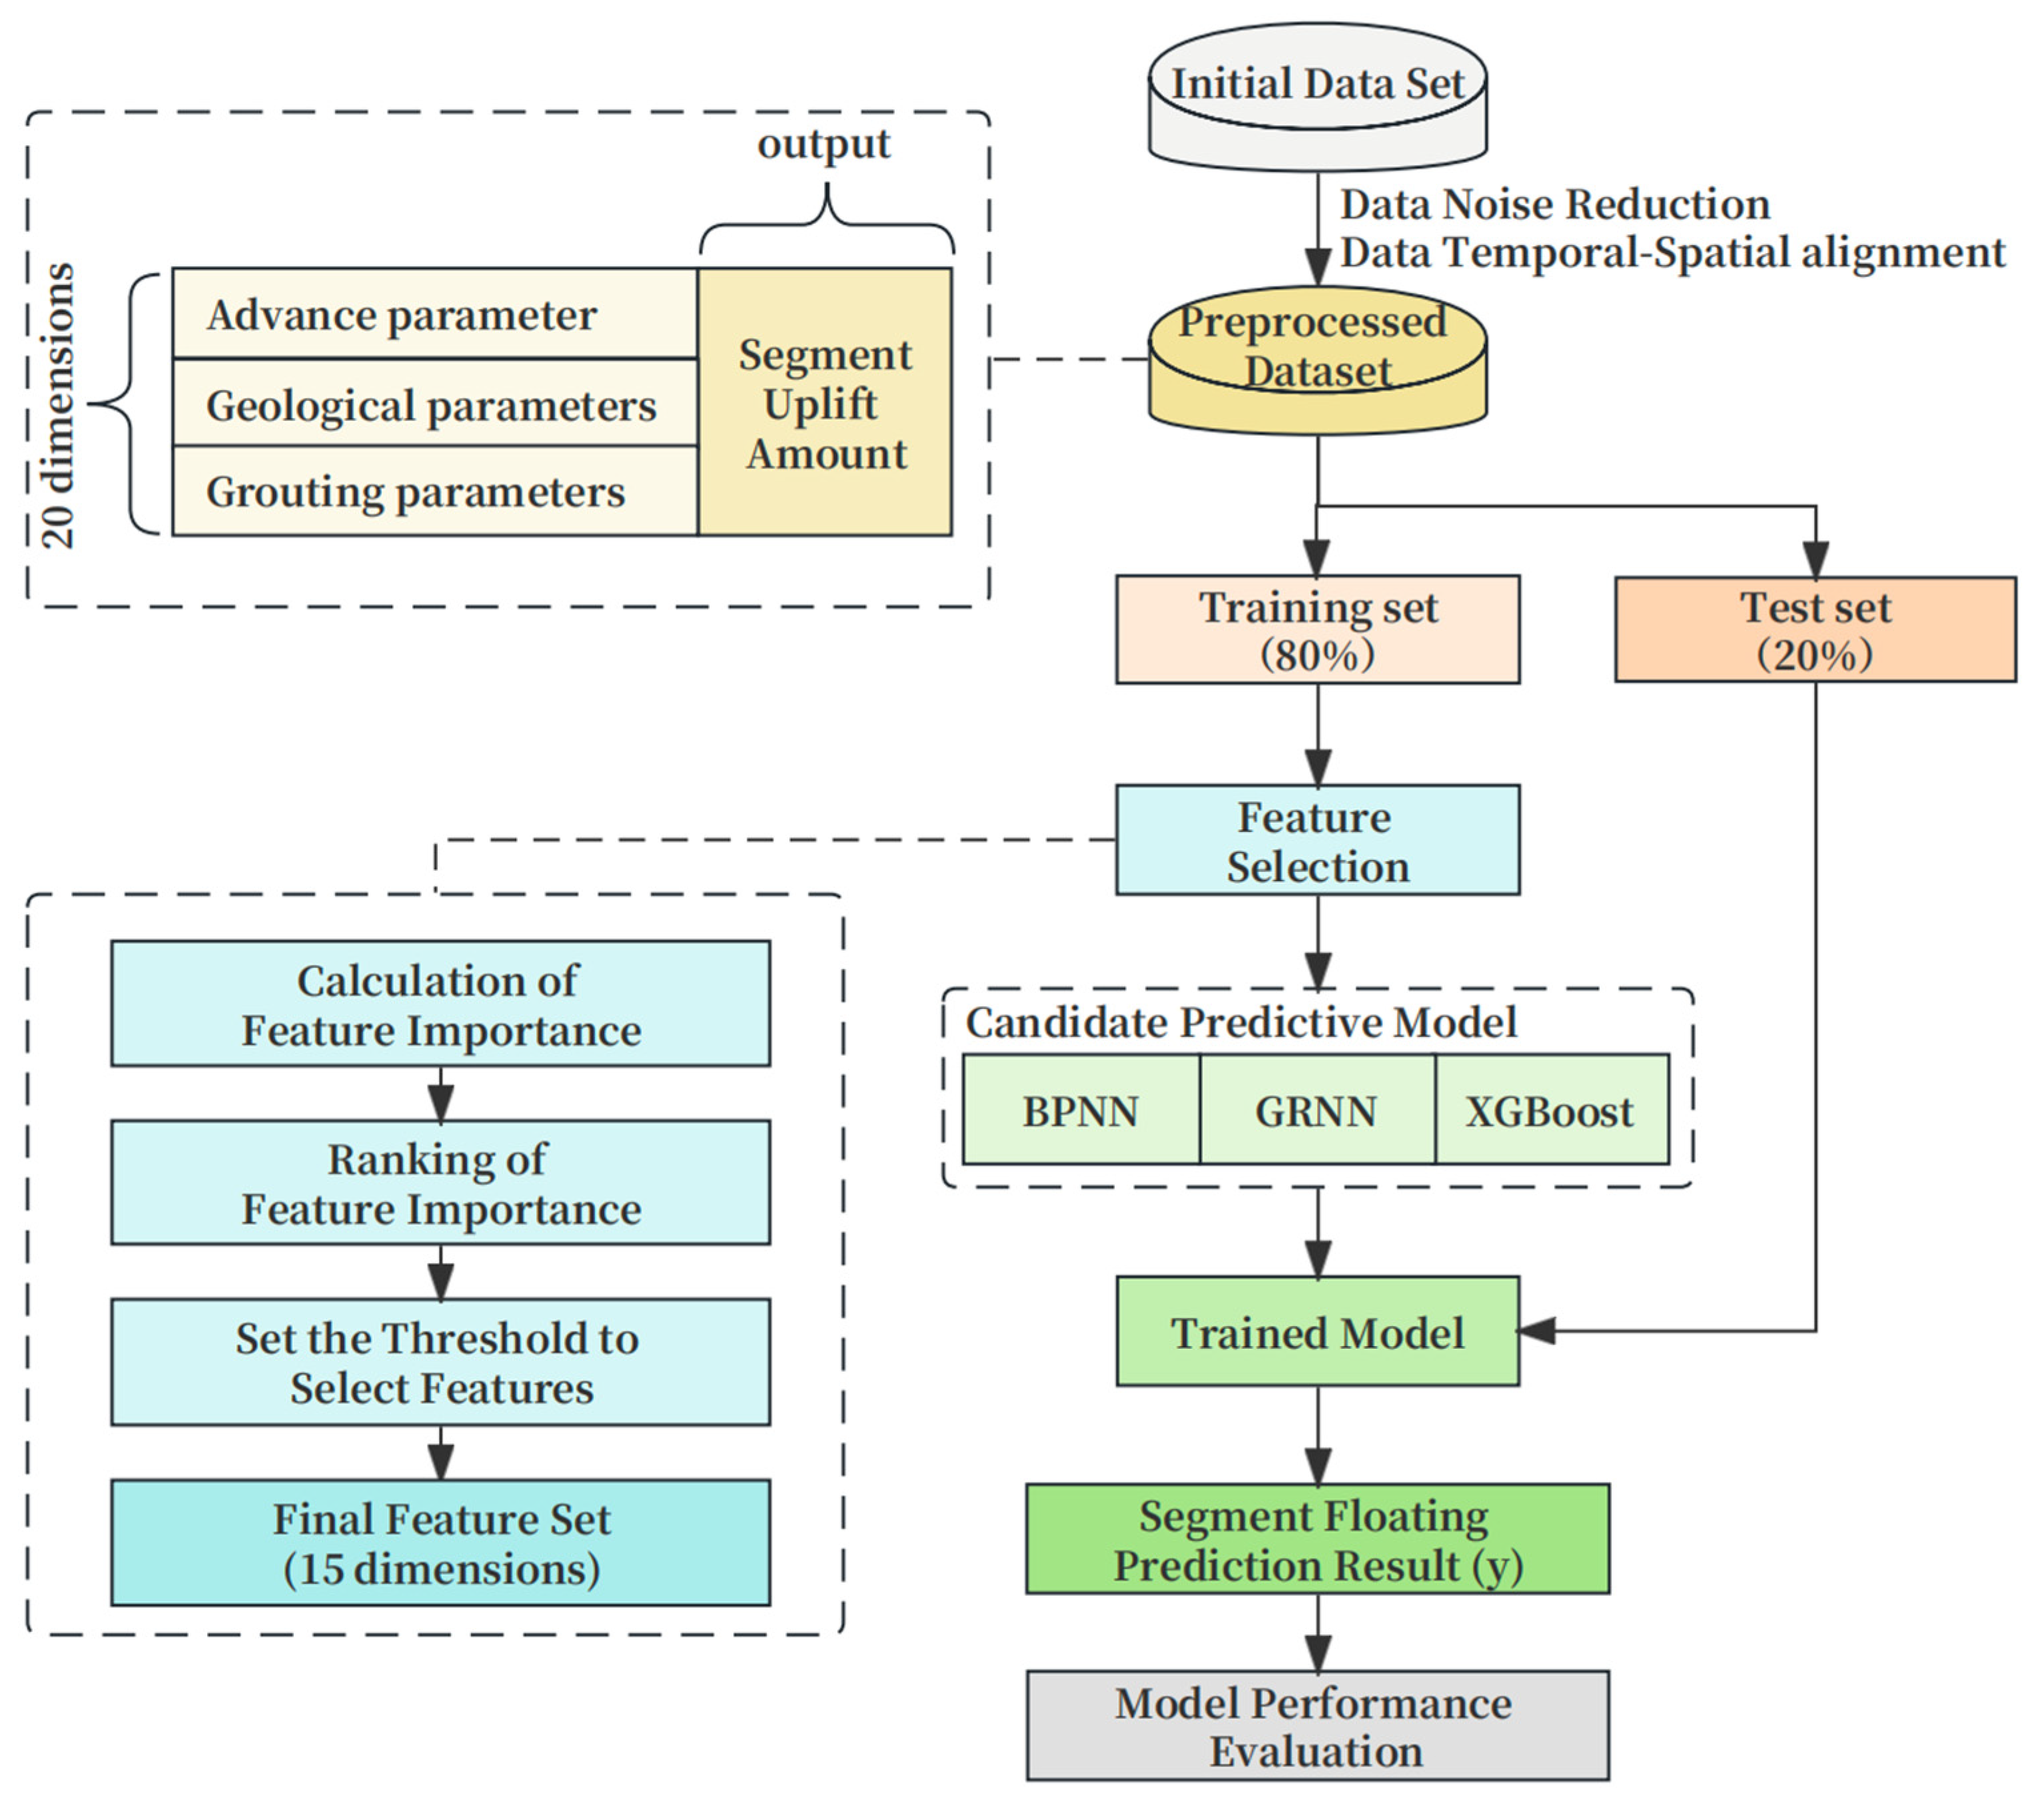
3.3. Construction of the Prediction Model
The relationship between segment uplift and influencing factors is highly complex, making simple linear models inadequate for explanation. Machine learning algorithms excel at solving nonlinear problems, so in this study, machine learning algorithms were employed to predict segment uplift (Figure 5), and, initially, to perform data denoising and spatial-temporal fusion on the initial dataset. Then, the preprocessed dataset was randomly divided into a training set (80%) and a testing set (20%) in a ratio of 8:2. The training set was used for model training. In contrast, the testing set assessed and validated the model’s predictive performance. This model takes three sets of 15-dimensional variables, selected after feature selection, as inputs and the final segment uplift amount as the output variable.
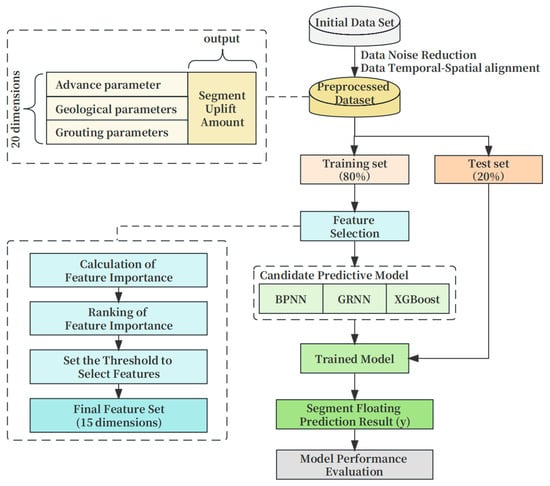
Figure 5.
Construction Process of the Prediction Model.
For the segment uplift prediction problem, the dataset has the characteristics of medium size, high-dimensionality, and nonlinear relationships of coupling between parameters. In addition, combined with the current application status and effects of machine learning algorithms in the field of tunnel engineering, we selected backpropagation network (BP), extreme gradient boosting algorithm (XGBoost) v2.0.3, and generalized regression neural network (GRNN) among many regression prediction algorithms as candidate algorithms for this prediction model. Among them, BP and XGBoost are representative methods within the field of machine learning and have seen numerous successful applications in tunnel engineering. As early as 1998, Shi [33] successfully used BP to predict ground subsidence. XGBoost has strong prediction capabilities and the ability to process high-dimensional data. It has outstanding prediction effects on various prediction problems in the field of tunnel engineering, including the prediction of ground subsidence [34], propulsion speed [35], etc. GRNN is not a typical prediction algorithm, but in 2016, Jiang and Chen [36] used GRNN to achieve the prediction of ground subsidence caused by tunnel construction, and it was used to predict the segment uplift process in the article [31] and achieved better prediction results.
3.3.1. BP
The basic idea of BP is to adjust the weights and thresholds of the neural network to minimize the error mean square value by minimizing the error between the network output and the expected output. Gradient search technology is used to adjust the weights and thresholds along the negative gradient direction of the network error change. Therefore, the learning process of the BP neural network is to propagate the error backward while modifying the weighting coefficient process [37]. The BP neural network can adapt to various complex nonlinear mapping relationships and has strong approximation and generalization capabilities.
3.3.2. XGBoost
XGBoost is an ensemble learning algorithm that iteratively trains multiple weak learners and combines them into a strong learner and uses gradient boosting technology to gradually optimize the performance of the model. XGBoost selects the optimal features for splitting in each iteration, establishes a tree structure through a greedy method, and introduces regularization terms to prevent overfitting. Therefore, through reasonable model complexity control and integrated learning strategies, XGBoost performs well on unseen data and has good generalization capabilities. In addition, it also supports functions such as processing missing values, automatic pruning, and feature importance ranking.
3.3.3. GRNN
GRNN is a neural network model based on probability density estimation. GRNN uses a Radial Basis Function (RBF) network, in which each sample has a basis function in the network to make predictions by learning the similarities between samples. The characteristic of GRNN is that it uses a probability density function to represent the relationship between samples. For the prediction of new samples, the output of neighboring samples is weighted and averaged, avoiding iterative optimization during the training process, thus having faster training speed and simple network structure.
3.4. SHAP-Based Control Decisions
3.4.1. SHAP-Based Interpretive Analysis
To address the challenge of interpreting the impact range and contribution relationships of various features on the model output, we utilized tools from the SHAP (SHapley Additive exPlanation) method to explain the segment flotation prediction model, which allowed us to quantify the degree to which each feature influences the final prediction.
SHAP is a post hoc explanation method for machine learning models and is an additive feature attribution method. It explains the model as a linear function of binary variables [38]. The core concept of SHAP is to measure the marginal contribution of each feature to the prediction result using Shapley values (SHAP value). These values indicate the extent to which a feature causes the prediction result to deviate from the mean. Consequently, SHAP helps explain how the model makes predictions based on feature values and which feature values positively or negatively impact the prediction result. The model generates a prediction value for each prediction sample, and the SHAP value is the numerical allocation to each feature in that sample’s prediction result. The results of SHAP values conform to the following Equation (7):
In this equation, represents the feature of the sample, the model’s prediction for the sample is denoted as , the baseline value for the entire model (the mean of the target variable for all samples) is , and represents the SHAP value for . When , it indicates that this feature has a positive contribution to the predicted target value, effectively increasing the prediction. Conversely, when , it implies a negative contribution, decreasing the prediction.
Therefore, applying the SHAP method allows for the interpretation of the predictive model, revealing the dependence of single or multiple features on segment uplift. Besides, it aids in optimizing control parameters and control objectives for segment flotation, facilitating decision-making in control management.
3.4.2. Decision-Making Process of Uplift Control
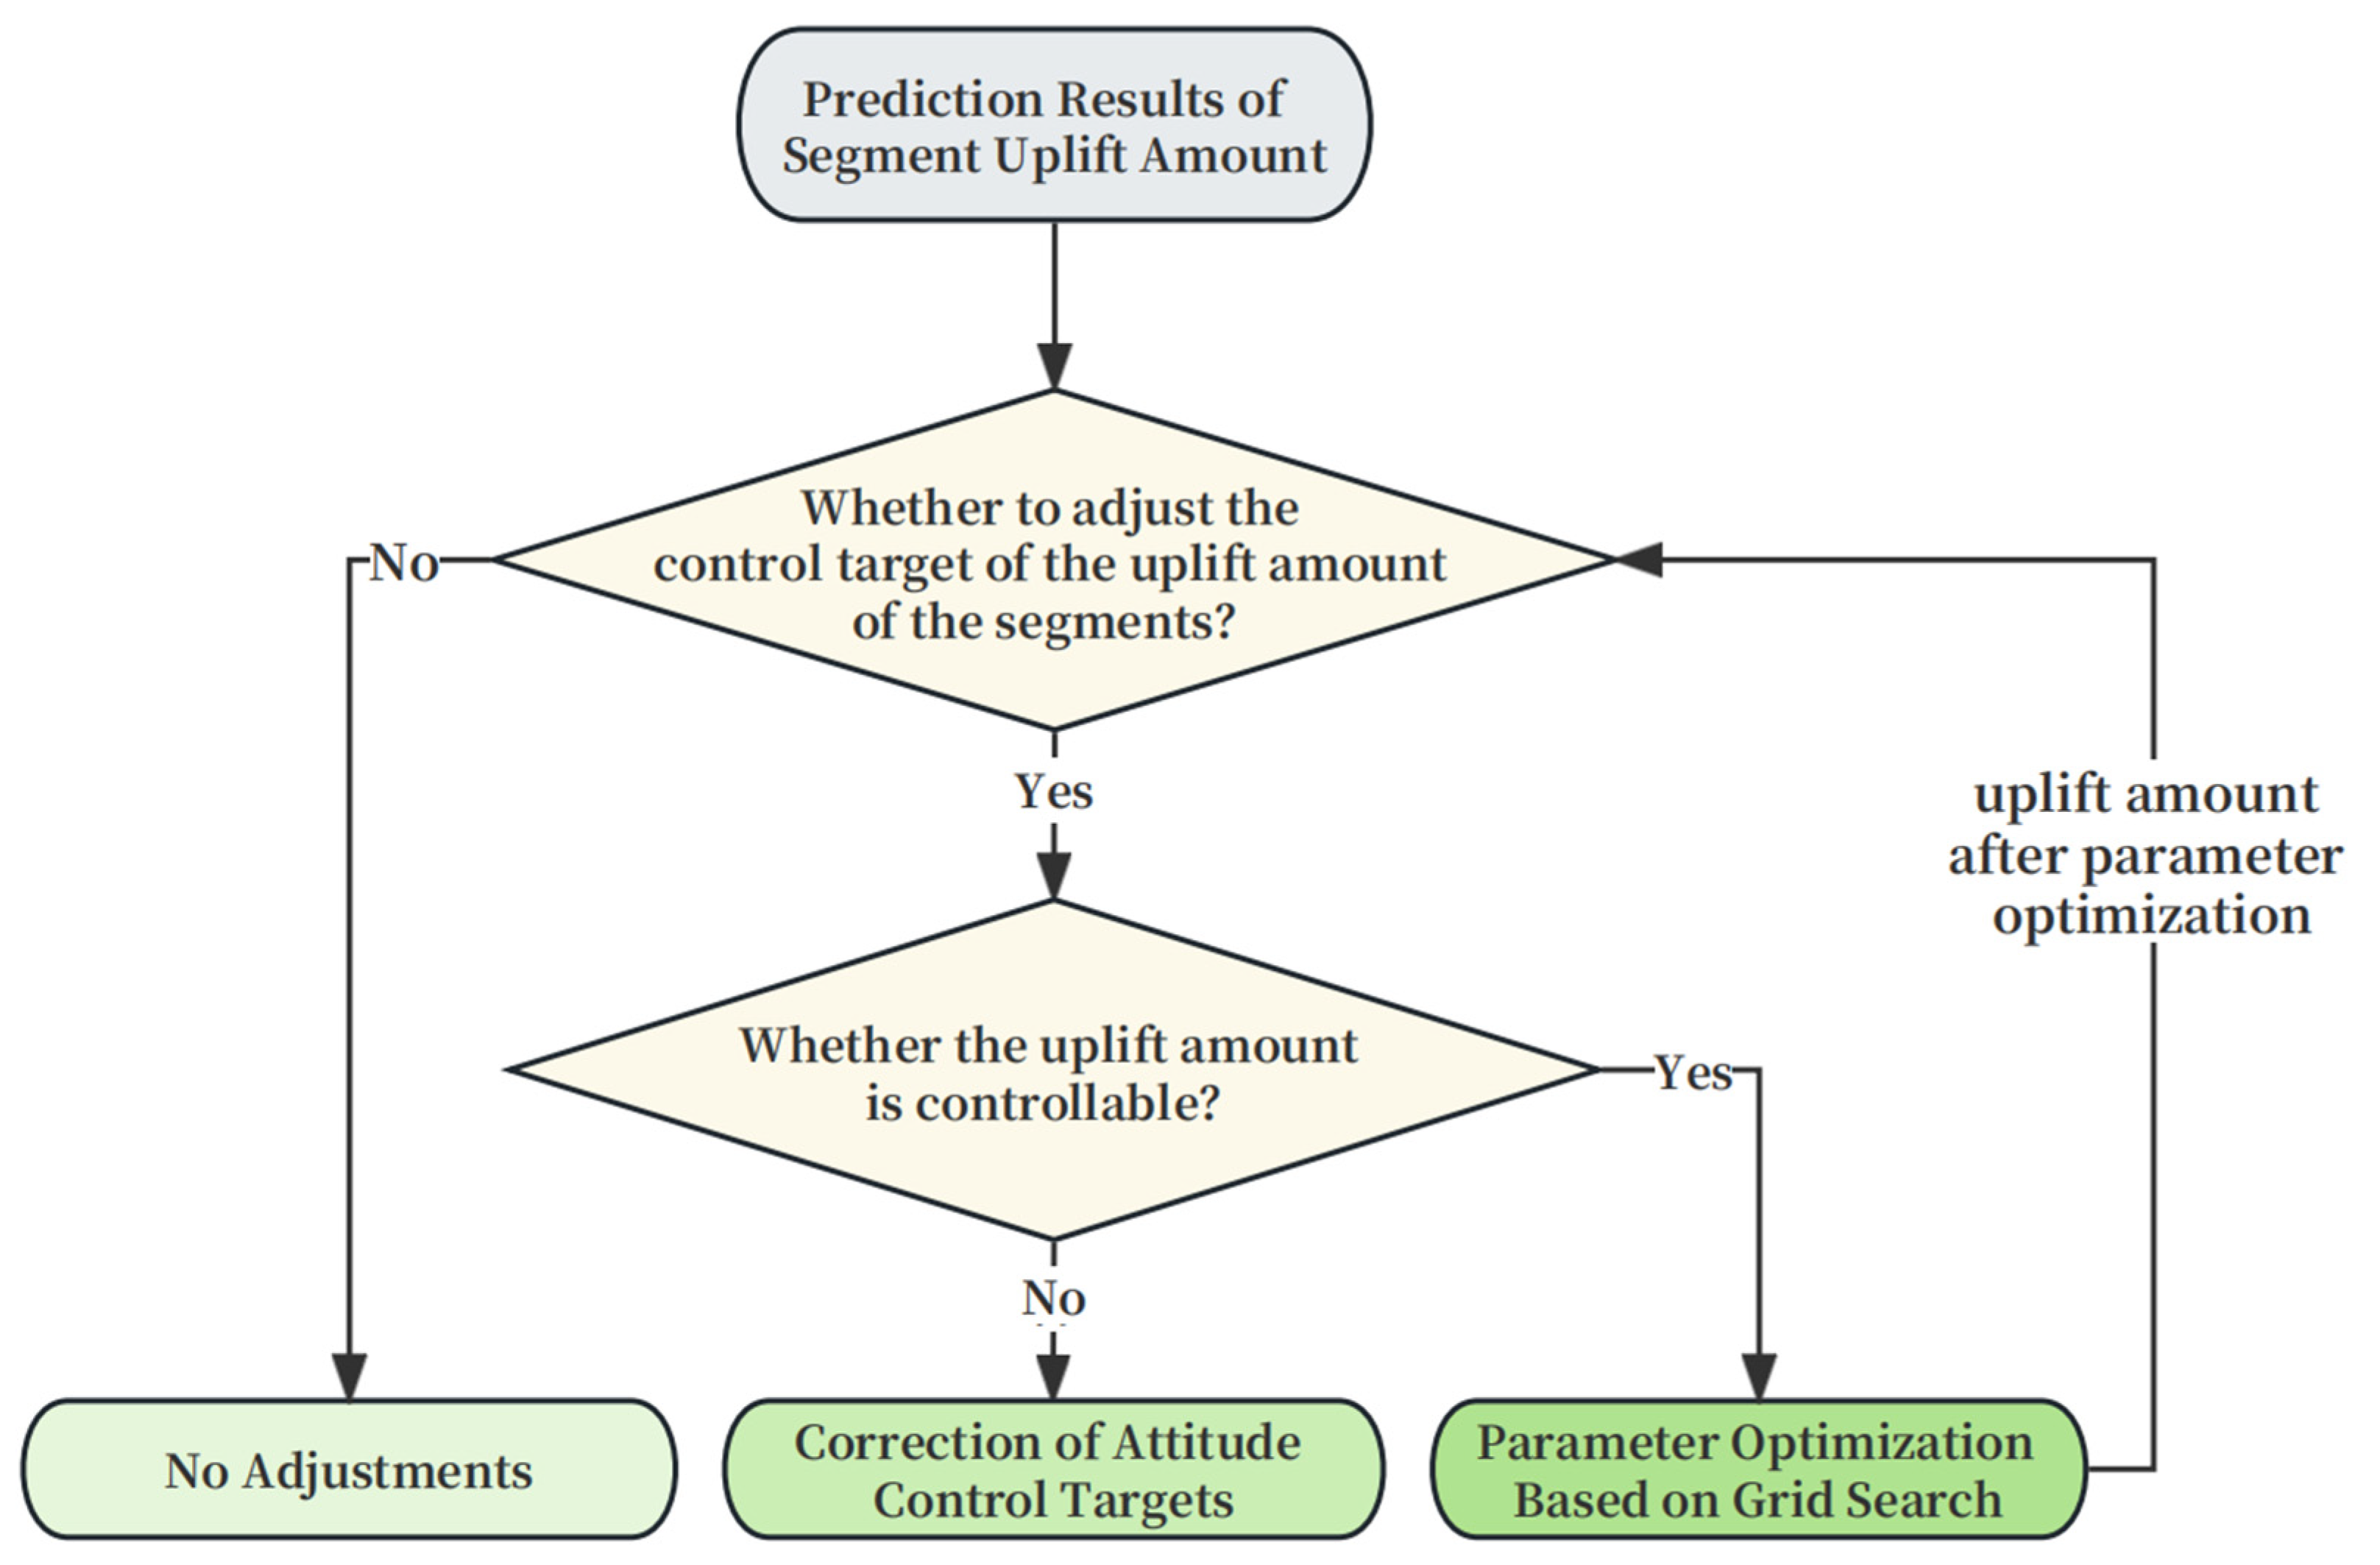
In conjunction with the obtained uplift amount prediction and the relationship between uplift and influencing factors, we have designed the decision process for segment uplift control (see Figure 6). Putting the optimized construction data into the prediction model, we obtain an expected uplift control value as the segment uplift control target. First, based on the uplift prediction value obtained by the prediction model, compare whether the uplift level of the segment is within a safe and acceptable control range to determine whether the uplift amount affects the adjustment of the segment uplift target. Suppose the predictions indicate that adjusting the segment uplift objectives is necessary. We further assess whether the current uplift amount is controllable based on the relationship between uplift and influencing factors. Conversely, if no adjustment is required, no action is taken. Secondly, when the uplift amount is controllable, we employ a grid search method to optimize the controllable parameters, resulting in an optimized segment uplift amount. Conversely, if the uplift amount is uncontrollable, we directly modify the shield machine’s attitude control objectives to compensate for the segment uplift, achieved through the advanced design of the attitude control objectives. Lastly, the optimized uplift amount re-enters the control decision process for further assessment.

Figure 6.
Segment Uplift Control Decision-Making Process.
4. Results
4.1. Project Overview
4.1.1. Project Background
This paper conducted on-site application verification of segment uplift prediction and control based on a tunnel engineering project. The tunnel section has a total length of approximately 5713 m, comprising 3175 rings. The depth of the top of the tunnel ranges from 12.1 to 21.55 m. The project mainly traverses soil layers consisting of silty clay, gray clay, and gray silty clay (see Figure 7). In the horizontal direction, the tunnel has a minimum turning radius, denoted as R, of 1600 m. In the vertical direction, the maximum gradient of the tunnel is 11.5‰.
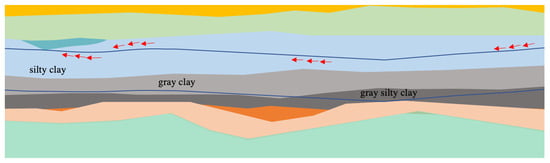
Figure 7.
Section Diagram of Project Crossing Strata.
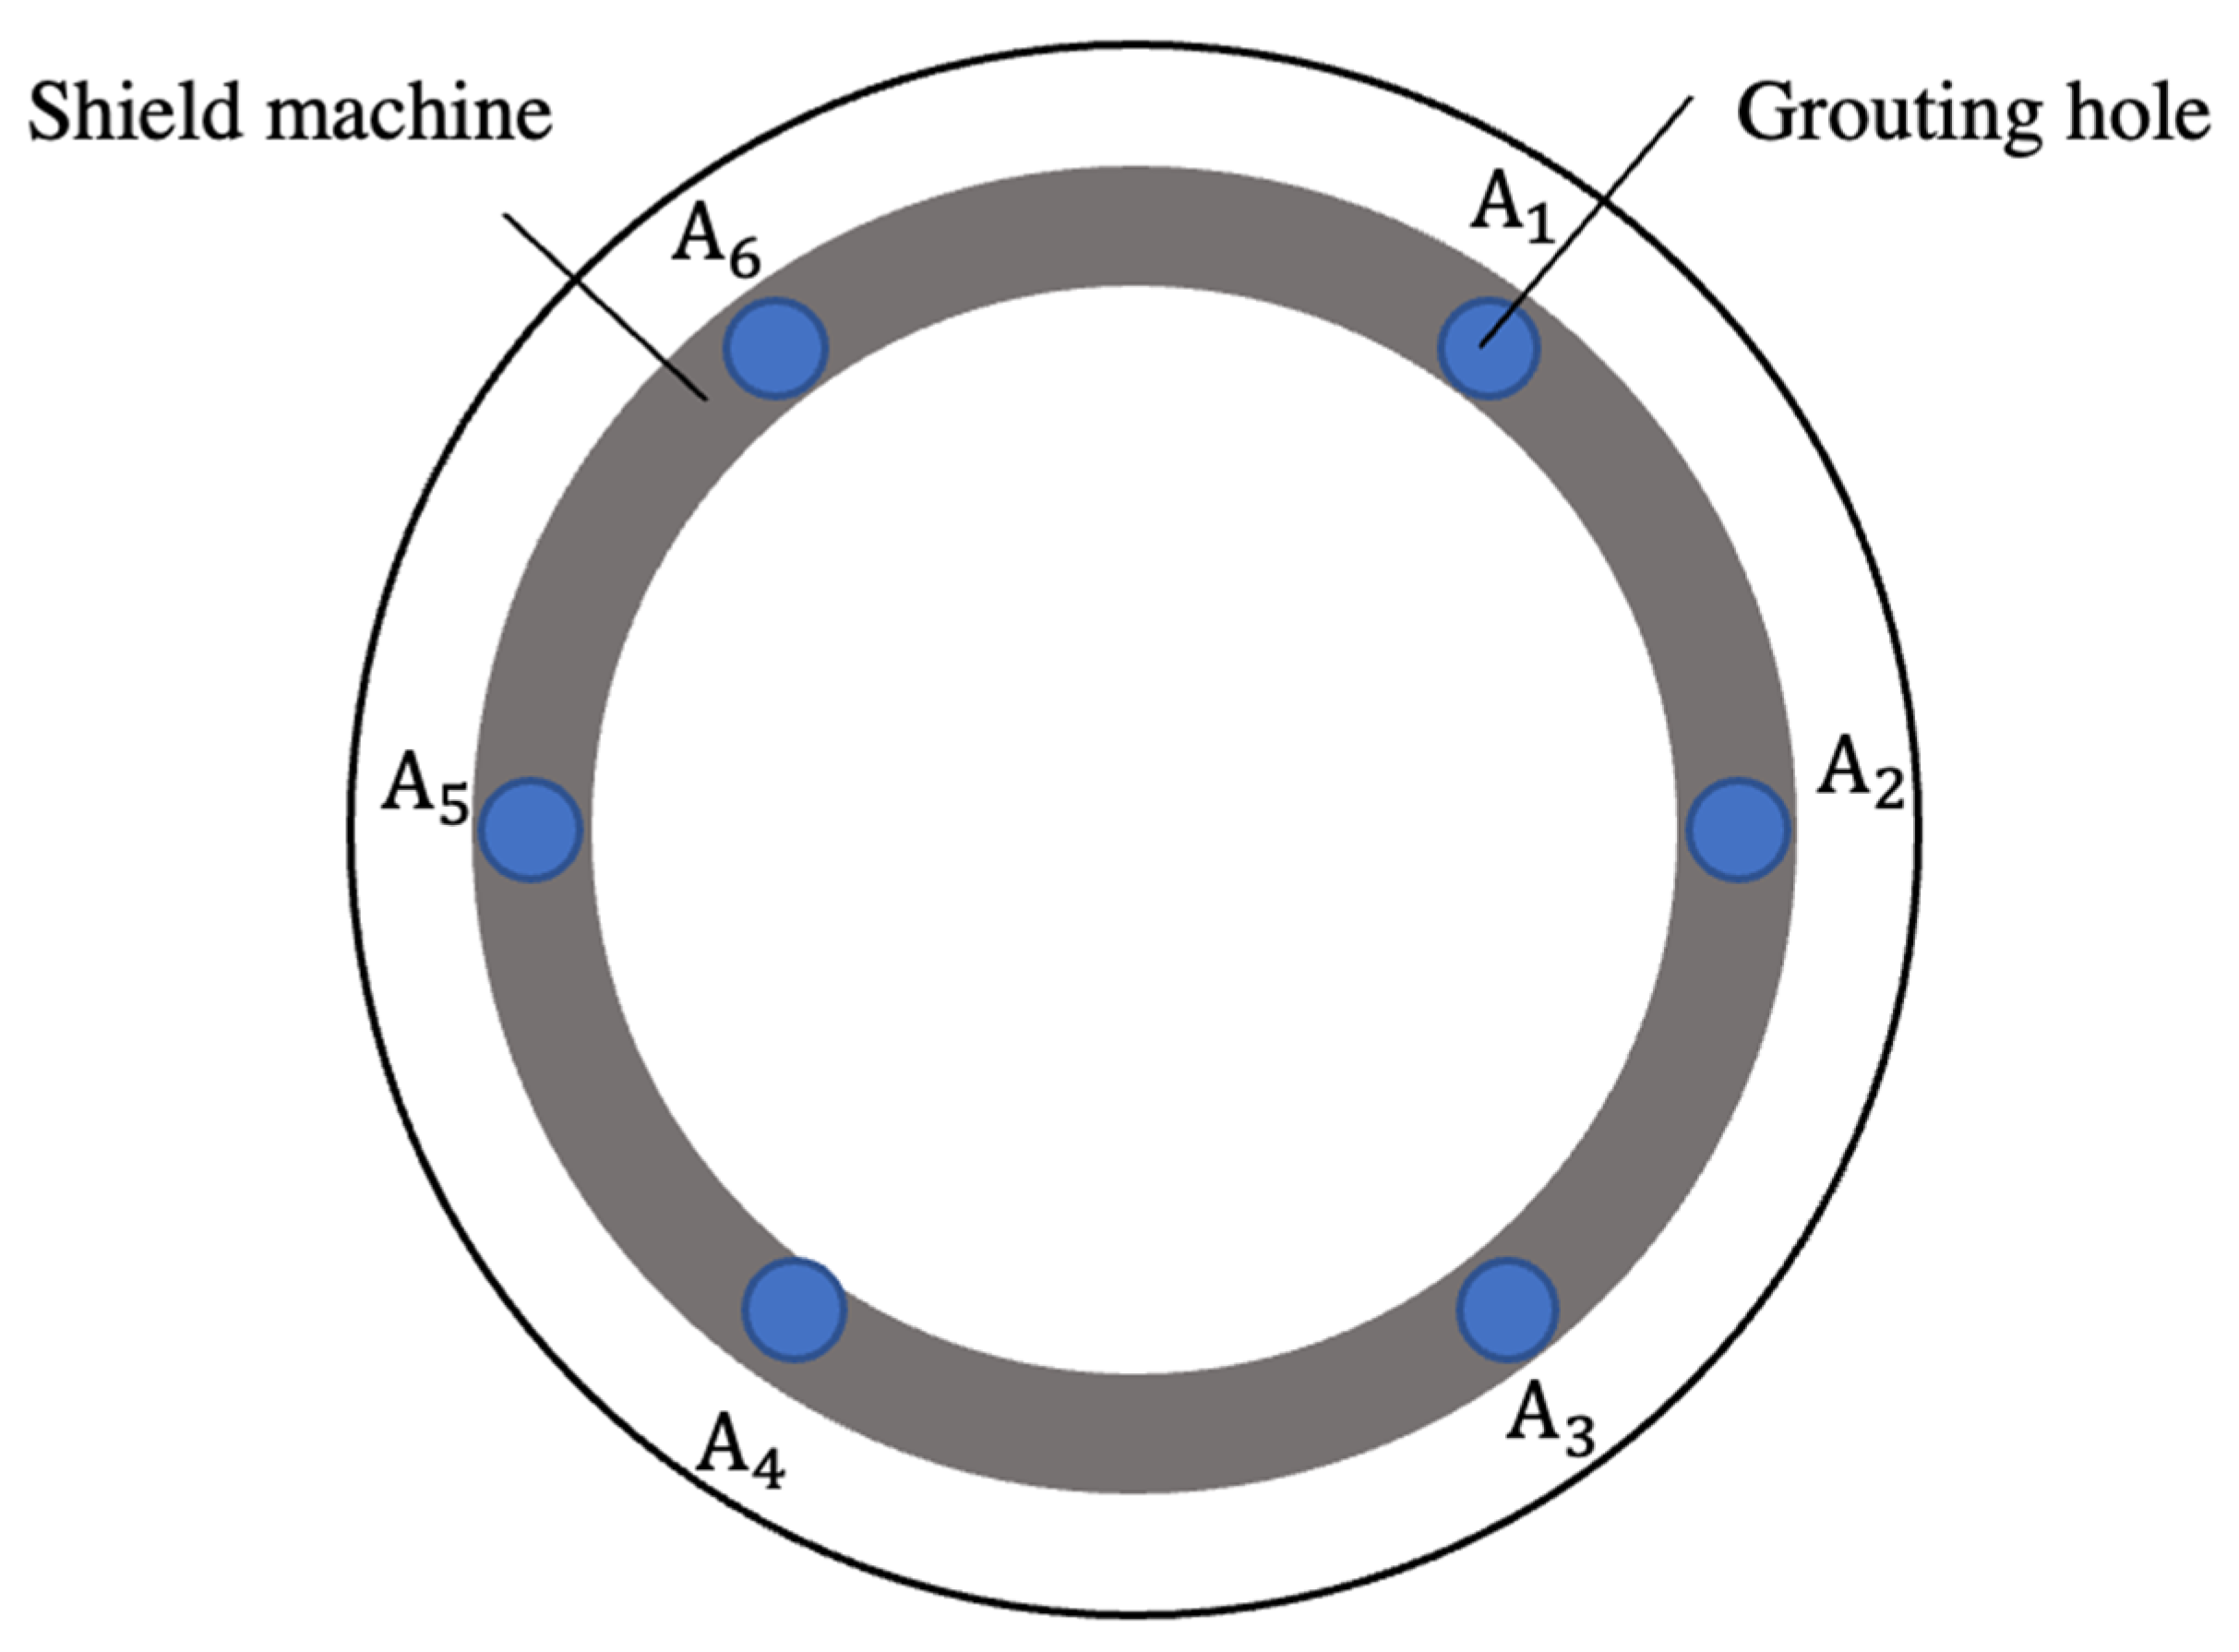
The tunnel boring machine used in this project is a soil pressure balanced tunnel boring machine equipped with a six-zone control system for the hydraulic jacks. The cutterhead has a cutting diameter of 9.4 m, and the outer diameter of the segments is 9 m, with a segment ring width of 1.8 m. The grouting system comprises six grouting holes labeled (see Figure 8), with and performing upper-segment grouting, and handling mid-segment grouting, and and managing lower segment grouting. The entire project section employs single-phase slurry for simultaneous grouting and back grouting.
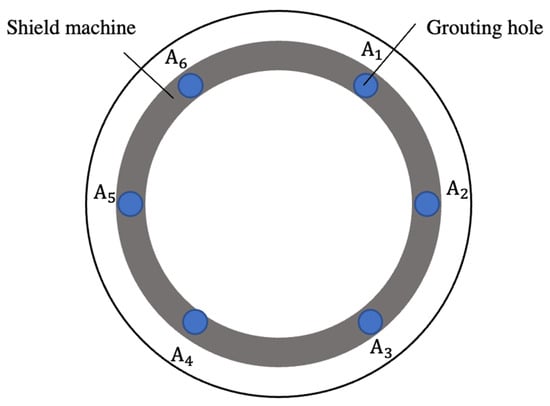
Figure 8.
Distribution of Grouting Holes.
4.1.2. Application Process
ADS-SUC was applied in this project to predict and control segment uplift during the stability phase. In the initial phase, model validation was carried out for rings 1 to 2000, involving the learning process of the segment uplift prediction mode and the fitting relationship between segment uplift and influencing factors. Subsequently, the model was tested on rings 2000 to 2400 to evaluate its performance and generalization ability, preventing model overfitting. Finally, after ring 2400, the model was officially implemented to implement segment uplift prediction and control, following the “uplift amount prediction-factor analysis-control decision”.
4.1.3. Application Effect
This study conducted a comparative analysis of the performance of predictive models using three machine learning algorithms: BP, GRNN, and XGBoost. We also compared the commonly used Short-Term Moving Average (SMA) method on construction sites. For assessing the application’s effectiveness, four metrics, namely Mean Absolute Error (MAE), Mean Squared Error (MSE), Root Mean Squared Error (RMSE) and R-squared (), were selected as evaluation criteria for model accuracy and fit (Equations (8)–(11)). MAE, MSE and RMSE are indicators of prediction accuracy, while is used to evaluate the quality of the relationship fit.
In the equations, represents the actual value, represents the predicted value, is the sample mean, is the error generated by predictions, and is the error generated by the mean.
For this project, 724 valid samples were obtained from the data in the first 1 to 2000 rings after preprocessing. We randomly split these samples into training and validation sets with an 8:2 ratio for model training. Table 2 shows the setting of each model parameter. Subsequently, rings 2001 to 2400 were used as a test set to predict uplift.
Table 2.
Model Algorithm Parameters.
Table 3 presents the results of various metrics for the three models on the training and test sets. In terms of fitting, except for BP, both XGBoost and GRNN exhibit excellent fitting on the training set, with scores above 0.9. However, on the test set, XGBoost performs the best with an of 0.958, followed by GRNN, while BP has the lowest at 0.788. Regarding prediction accuracy, XGBoost has the slightest MAE, MSE and RMSE on the training and test sets, with MAE within 4 mm, MSE less than 30 and RMSE less than 5. Therefore, among the three models, XGBoost demonstrates the best overall accuracy. Due to its robust fitting and reliable prediction performance, XGBoost was chosen for this study’s uplift prediction of tunnel segments.
Table 3.
Calculation Results of Evaluation Indicators of Model Prediction Effect.
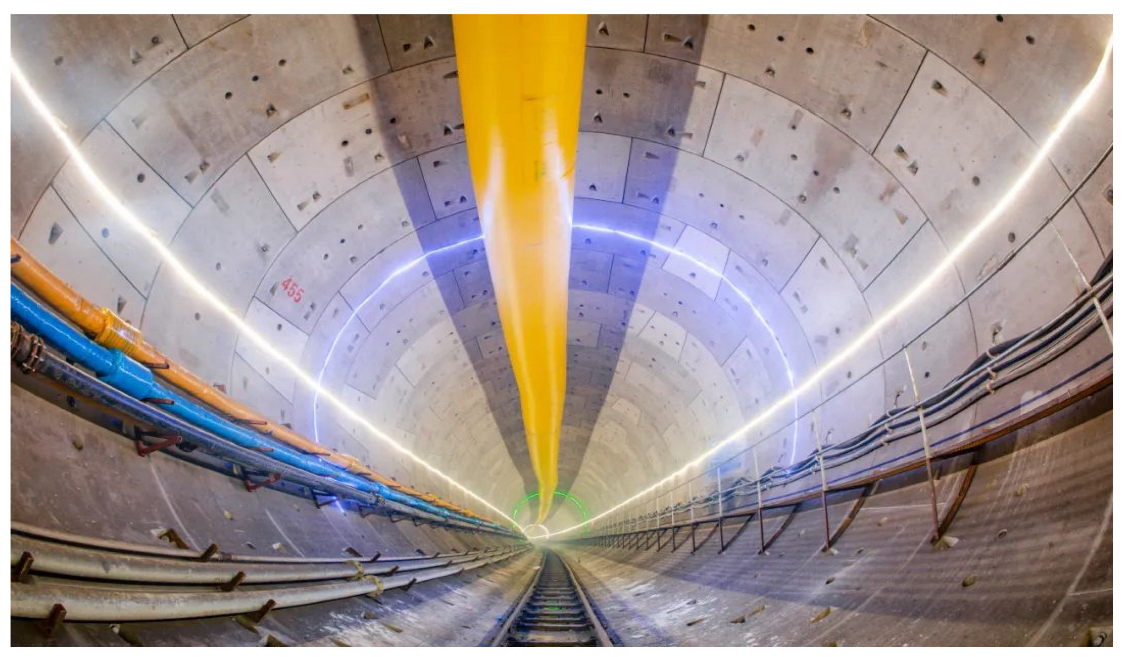
We applied ADS-SUC in rings 2401 to 2600. The predicted uplift values for the tunnel segments showed a maximum error of 23 mm compared to the actual uplift measurements, with an average absolute deviation of 9 mm. These deviations fall within the acceptable range for on-site construction. During this interval, the tunnel segments exhibited excellent performance (see Figure 9), with deviations in segment alignment and gaps between segments controlled within 3 mm. There were no issues such as water leakage or segment breakage.

Figure 9.
Assembly Quality of the Tunnel.
4.2. Case Study
To comprehensively evaluate the uplift prediction performance of the forecasting model and the effectiveness of uplift measures, this paper analyzed the prediction results and trend capturing in two typical sections: rings 2450 to 2488 and rings 2550 to 2600. We also compared the on-site estimation method (SMA). Additionally, by combining the uplift prediction values with the obtained relationships between uplift and influencing factors, decisions on uplift control were made to determine the uplift control measures in different scenarios, achieving control over the shield tunnel segments’ uplift.
4.2.1. Case One
- Prediction Performance
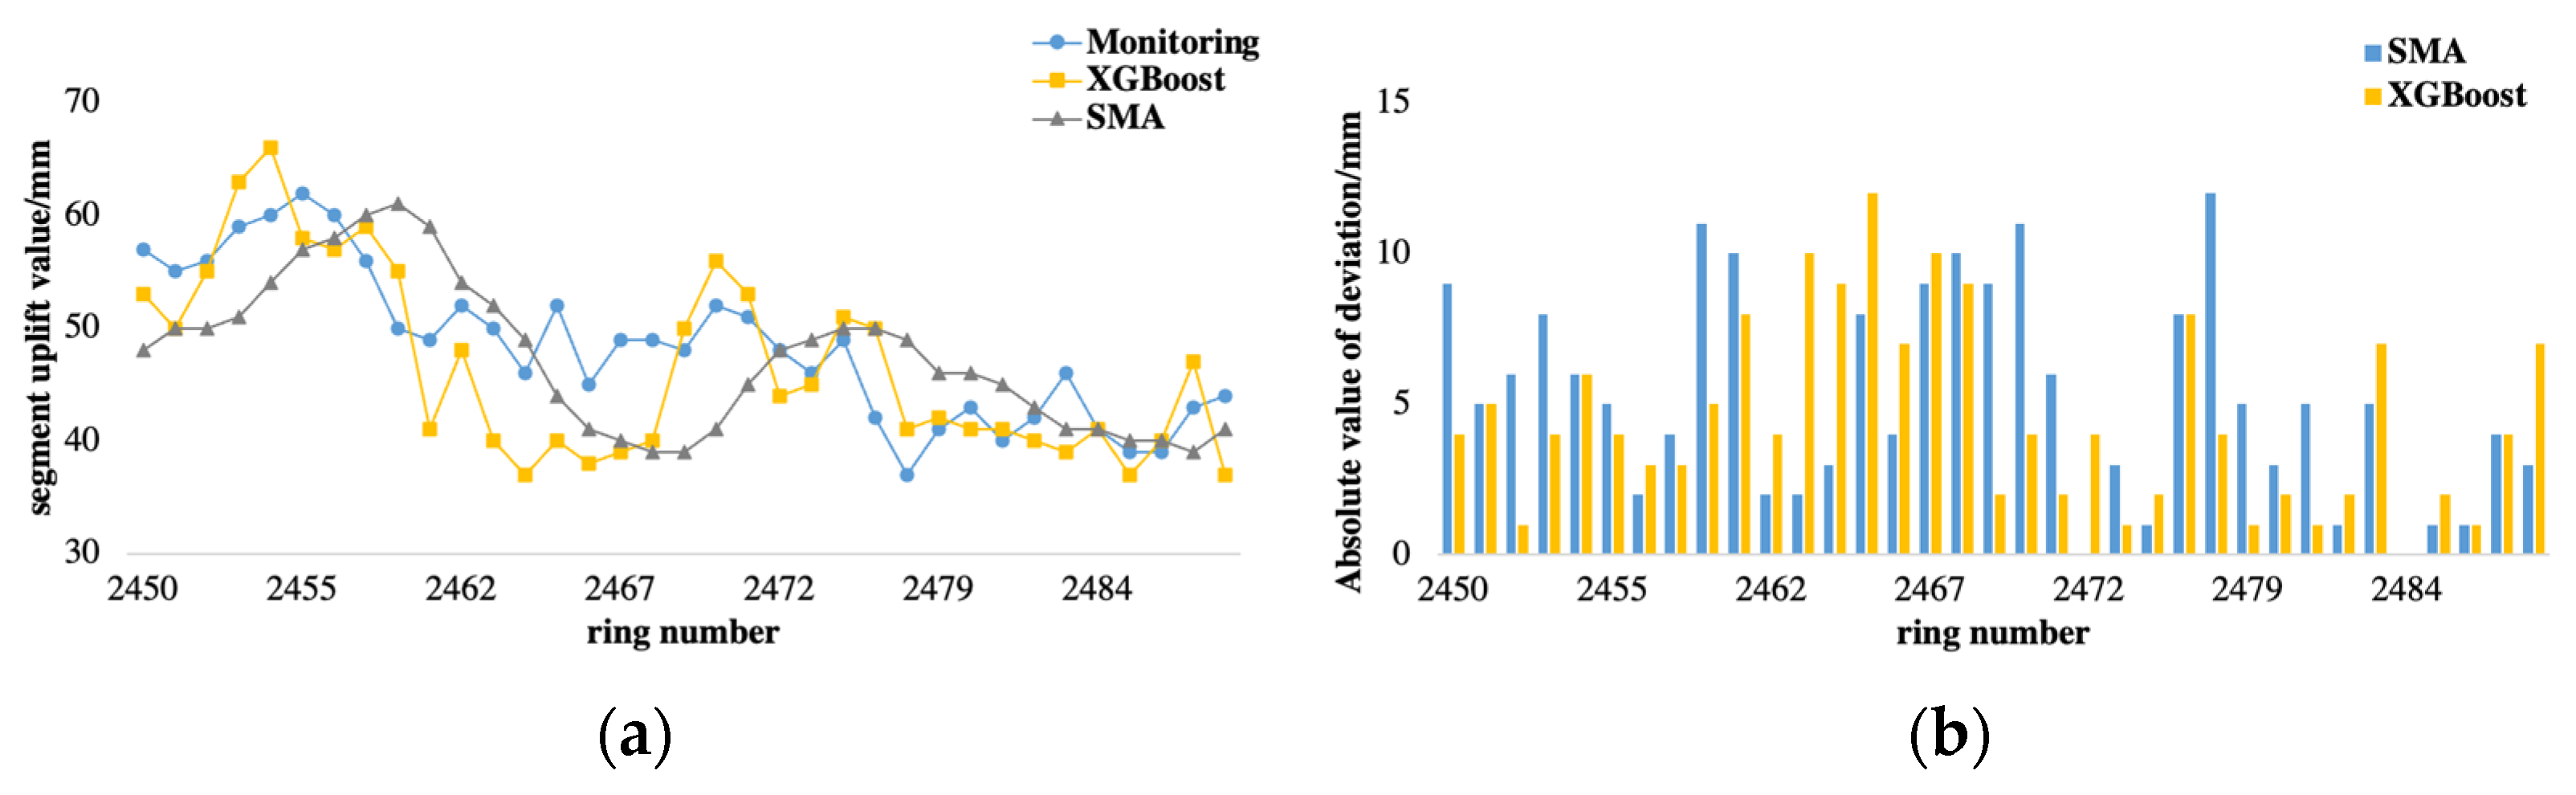
In the 2450 to 2488 segments range, the actual measured uplift of tunnel segments falls within 37 to 62 mm. The predicted uplift values by the XGBoost-based prediction model (XGBoost-SU-PM) range from 37 to 66 mm, while SMA ranges from 39 to 61 mm (Figure 10a). Regarding prediction accuracy (Figure 10b), both methods have a maximum absolute error of 12 mm. Regarding trend capture (Figure 10a), SMA relies on historical uplift monitoring data, and its predictions gradually approach the new uplift level, resulting in lagging and slow-changing trend predictions. The XGBoost-SU-PM adjusts rapidly in response to changes in critical parameters within the relationship model, allowing it to capture and represent changes in uplift trends.
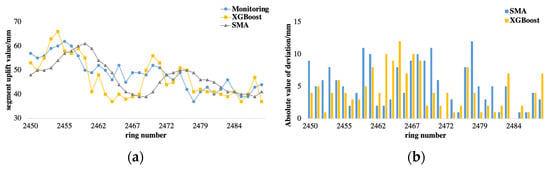
Figure 10.
Predicted Results for Segments 2450 to 2488. (a) Predicted Results and Monitoring Values; (b) Absolute Deviation of the Predictions.
- 2.
- Local Explanatory Analysis Based on SHAP
Figure 11a,b depicts the feature contribution analysis and feature density scatter plot for the 2450~2488 ring section. In Figure 11a, the horizontal axis represents the absolute mean of SHAP values for all calculated feature contributions, measuring the extent of each input feature’s contribution to the uplift of the segments. The vertical axis ranks all input features based on the model. Figure 11b illustrates the distribution of SHAP values for each feature across the entire dataset. Here, the horizontal axis represents SHAP values, with positive values indicating a positive impact on the uplift when the SHAP value is positive and a suppressive effect when it is negative. The color of each point represents the feature’s magnitude, with blue indicating smaller values and red indicating larger values.
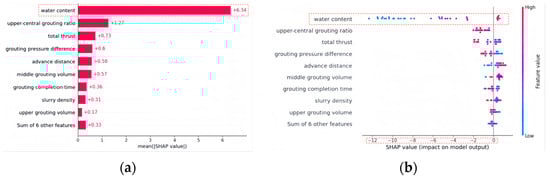
Figure 11.
Relationship Between Segment Uplift and Influencing Factors for Segments 2450 to 2488. (a) Feature Contribution Analysis; (b) Feature Density Scatter Plot.
The feature contribution ranking in Figure 11a shows that multiple factors affect segment uplift, including soil physical properties, features related to the grouting system, and the tunnel boring machine’s (TBM) advancement status. Furthermore, it aligns with the existing literature and practical engineering experience. This section shows that moisture content is the most crucial factor contributing to uplift, followed by upper-central grouting ratio and total thrust. Combining this with Figure 11b, it is apparent that an increase in moisture content has a positive strengthening effect on uplift, making the segments more prone to uplift.
- 3.
- Construction Decision Recommendations
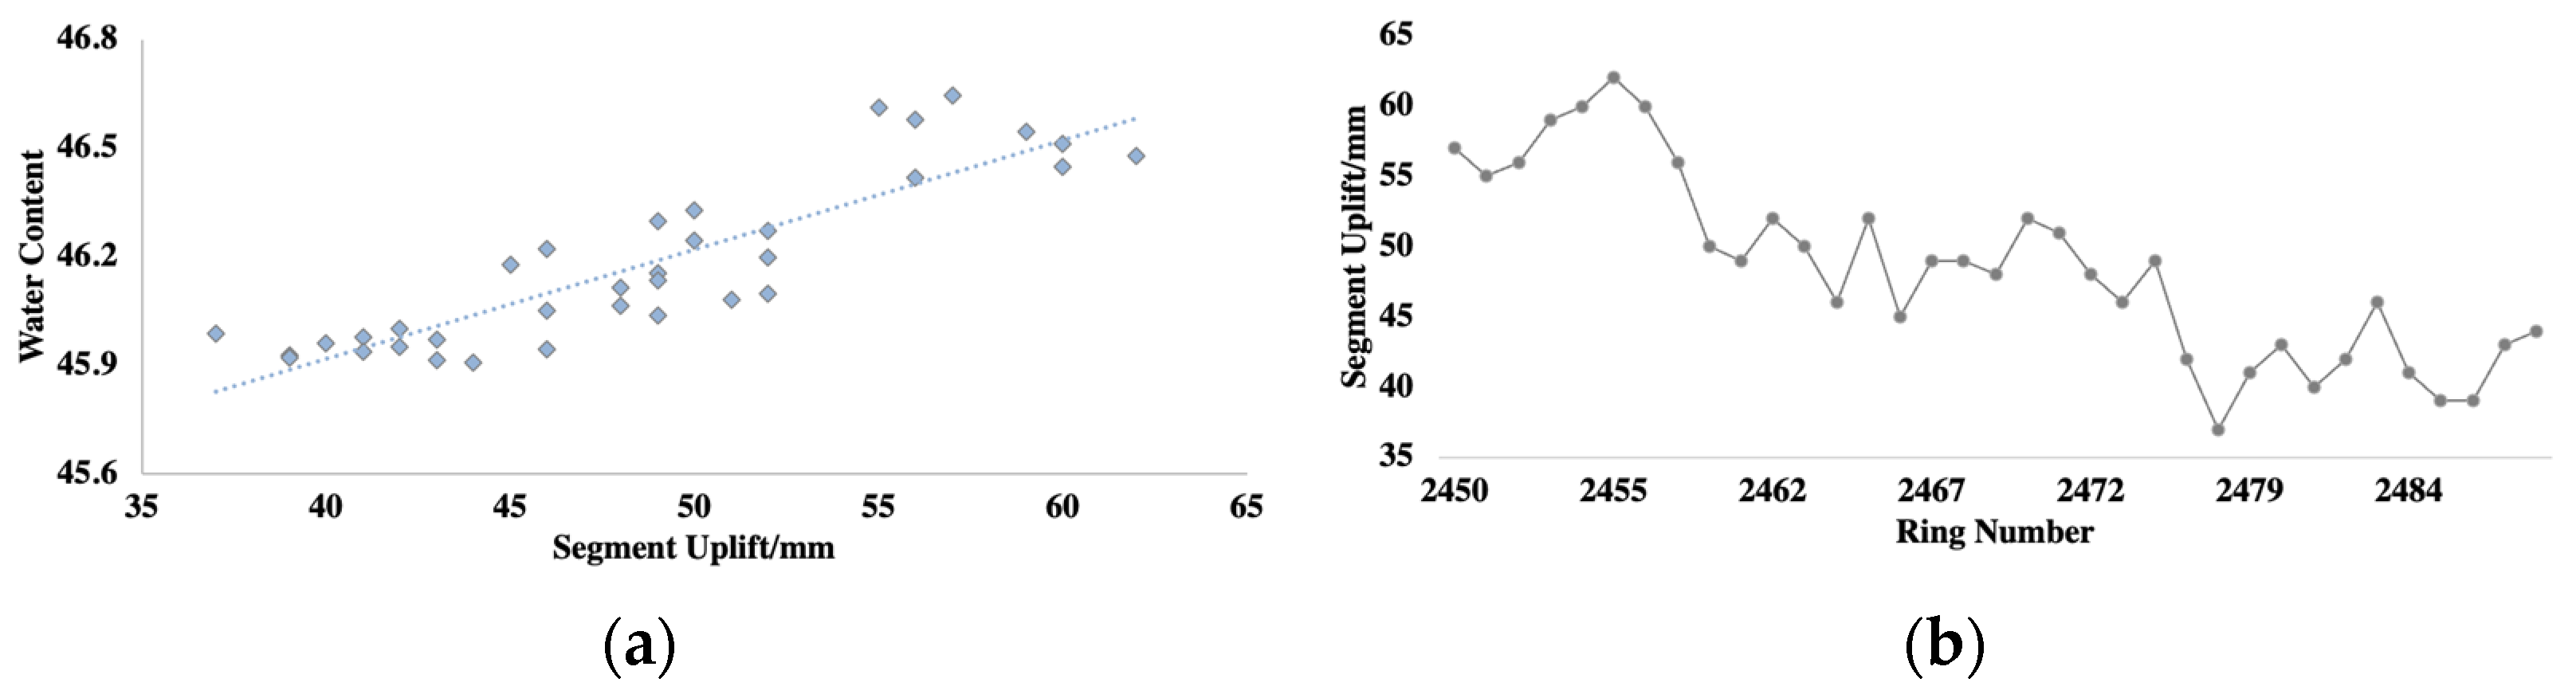
Based on the uplift predictions and relationship analysis results, the uplift of the segments in the range of rings 2450 to 2488 gradually fluctuates from 60 mm to around 40 mm. Furthermore, the water content is the primary factor influencing the segment uplift, while controllable factors such as the grouting ratio have a minor inhibitory effect on uplift. Therefore, ADS-SUC provides a strategy to adjust the shield machine’s posture control targets to ensure better control of the deviation between the final stable position of the segments and the tunnel’s design axis.
Figure 12 illustrates a scatter plot of the trend in water content and segment uplift within this range and a line graph showing the cumulative uplift of the segments. A clear positive linear relationship exists between uplift and water content, indicating that uplift increases with higher water content (Figure 12a). According to Figure 12b, the actual cumulative uplift monitored for the segments gradually decreases from 60 mm to around 40 mm, consistent with the predicted trend.
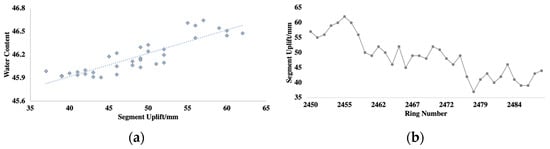
Figure 12.
Ring 2450 to 2488. (a) Scatter Plot of Water Content vs. Uplift Amount; (b) Diagram of Segment Uplift Variation.
4.2.2. Case Two
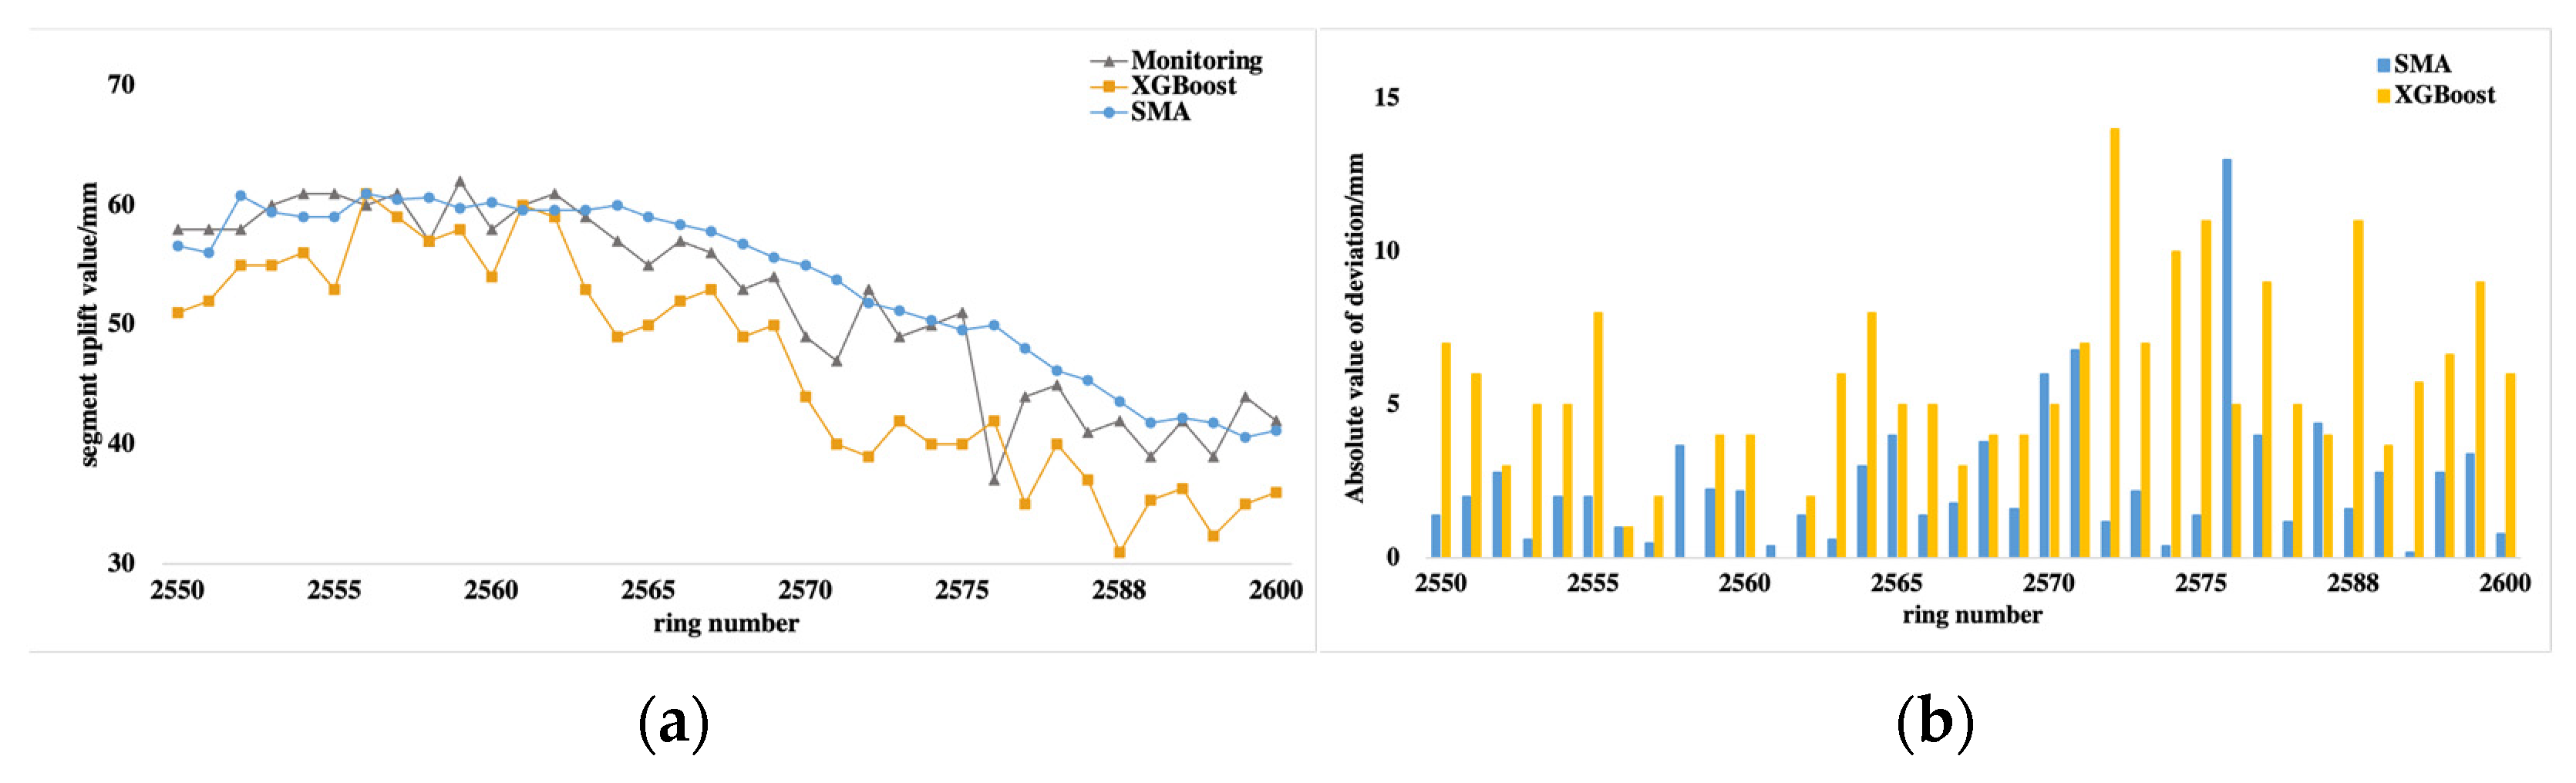
- Prediction Performance
In the interval from ring 2550 to 2600, the actual segment uplift ranged from 37 mm to 62 mm. The predictions from XGBoost-SU-PM were 31 mm to 61 mm, while SMA’s predictions fell within 41 mm to 61 mm (Figure 13a). Figure 13b reveals that in terms of prediction accuracy, XGBoost had an average absolute error of 6 mm, while SMA had an average absolute error of 3 mm. Concerning maximum absolute error, both methods were within 15 mm, which is acceptable for on-site construction. SMA exhibited slightly better prediction accuracy than XGBoost. The analysis suggests that short-term moving average predictions heavily rely on historical uplift data. Consequently, in situations where uplift changes are minor, predictions based on historical data tend to be reliable. Regarding trend capturing, XGBoost continued to identify the downward trend in uplift earlier.
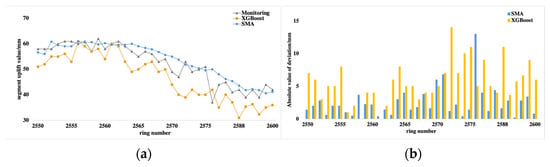
Figure 13.
Predicted Results for Segments 2550 to 2600. (a) Predicted Results and Monitoring Values; (b) Absolute Deviation of the Predictions.
- 2.
- Local Explanatory Analysis Based on SHAP
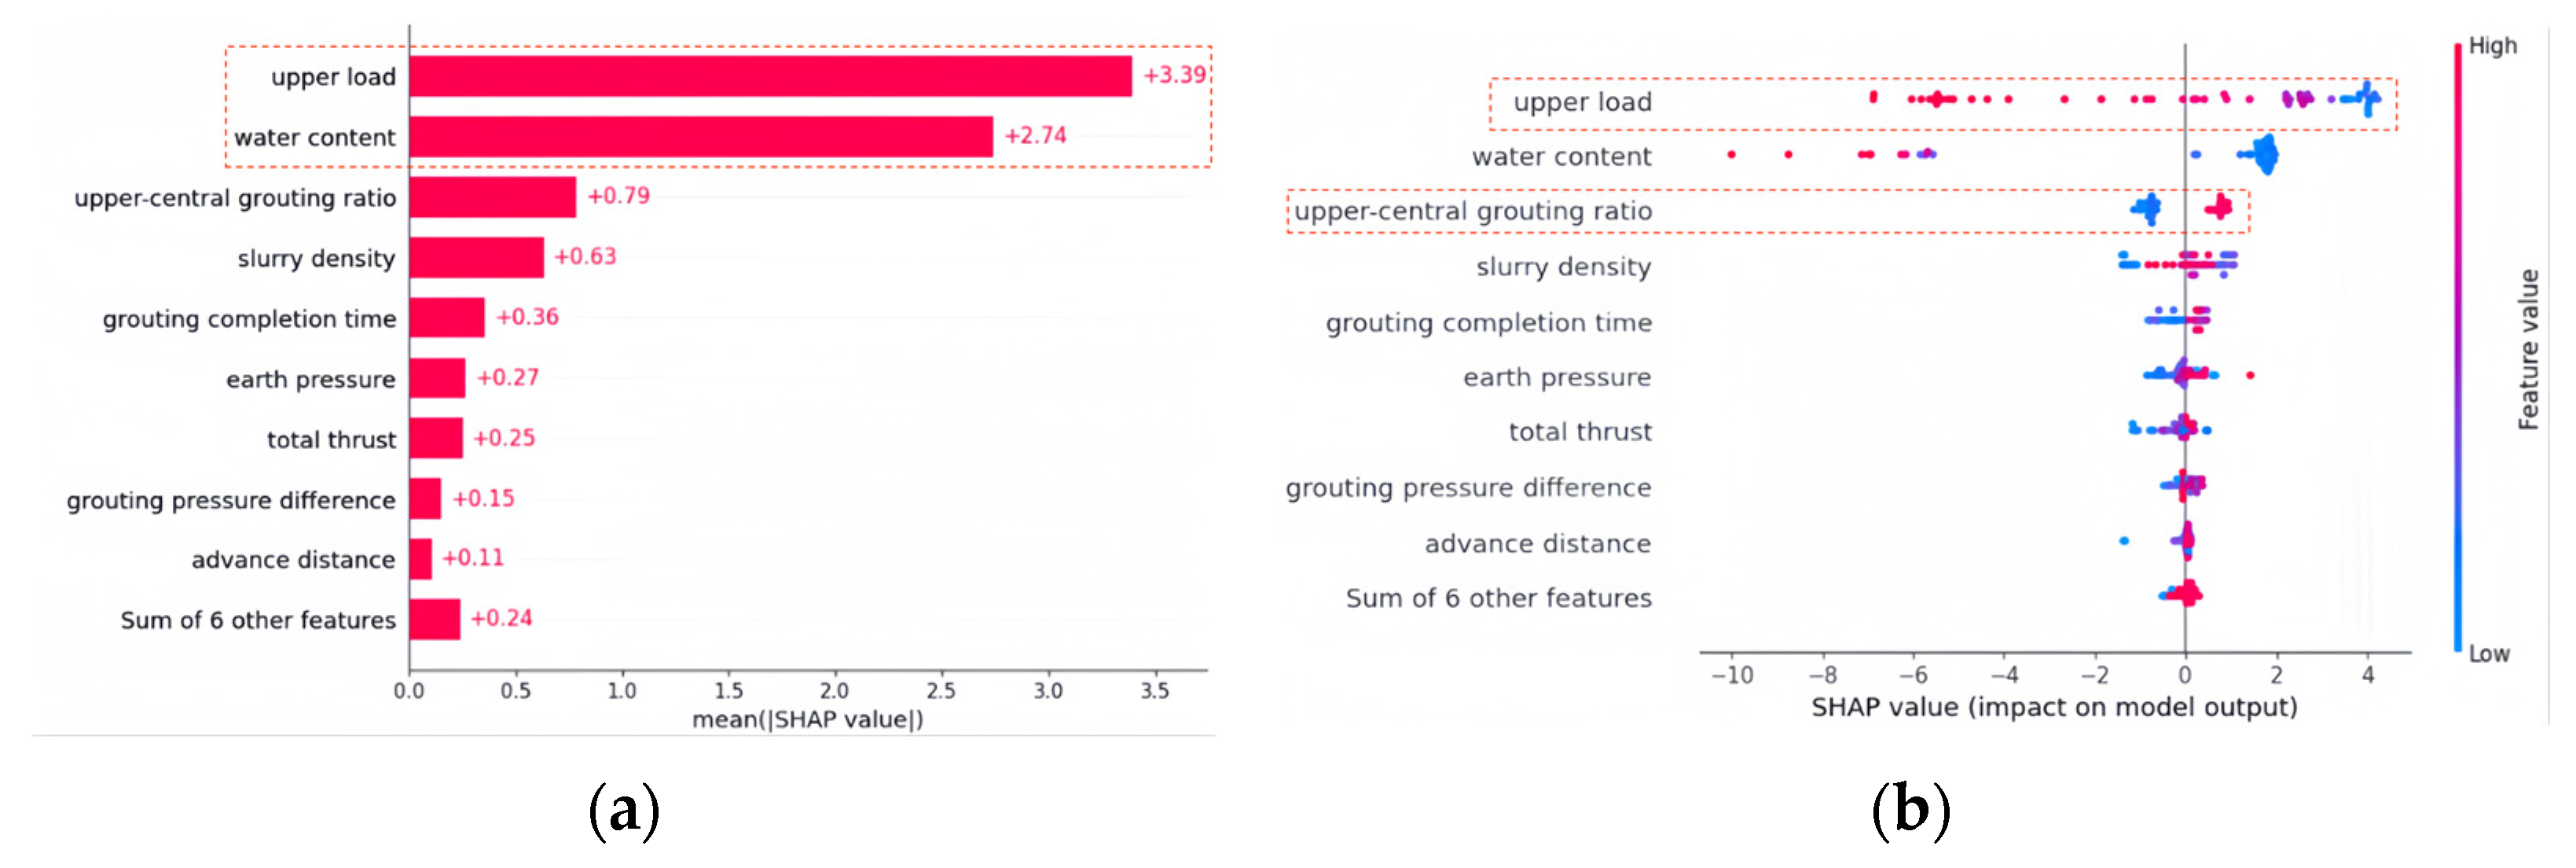
Figure 14a,b represents the feature contribution analysis and feature density scatter plot for the segment from ring 2550 to 2600. In this segment, the upper load and moisture content are identified as the most critical factors influencing segment uplift, followed by the upper grouting ratio, slurry density, and grouting completion time (Figure 14a). Combining Figure 14b, an increase in the upper load and a decrease in grouting ratio could exert an inhibitory effect on segment uplift.
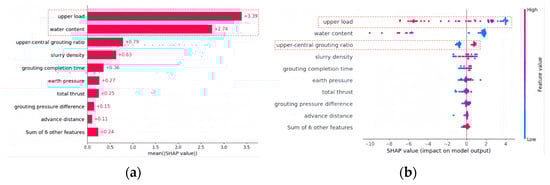
Figure 14.
Relationship Between Segment Uplift and Influencing Factors for Segments 2550 to 2600. (a) Feature Contribution Analysis; (b) Feature Density Scatter Plot.
- 3.
- Construction Decision Recommendations
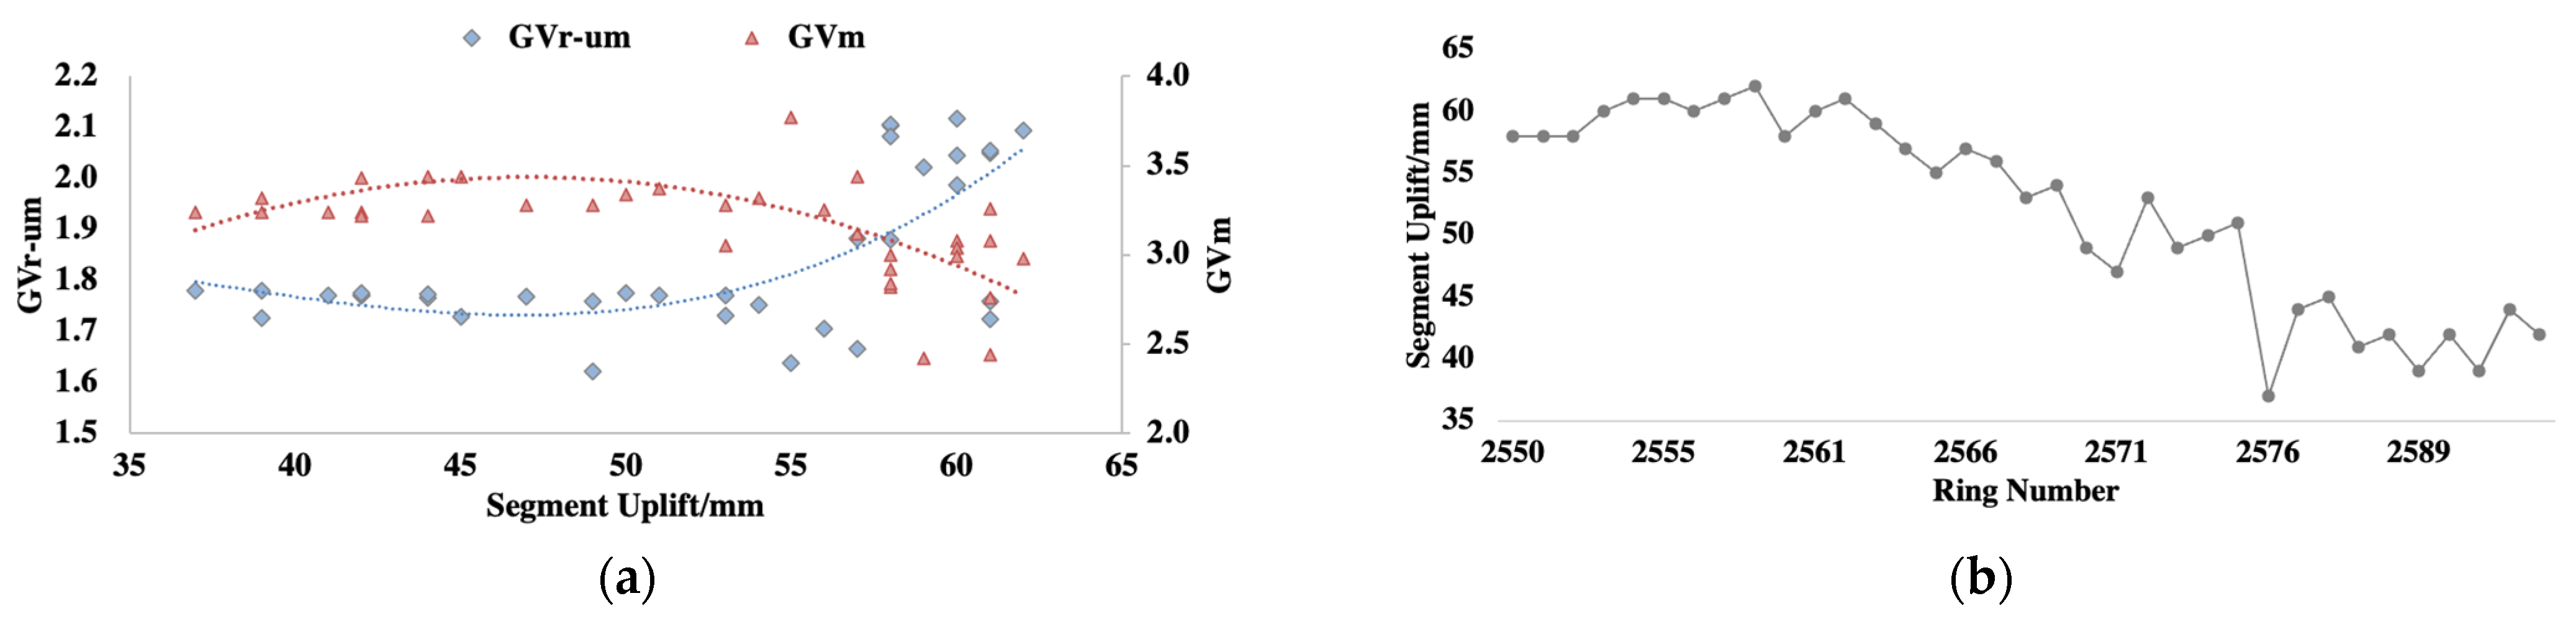
Based on the prediction and relationship analysis results, there is a gradual downward trend in segment uplift under the current circumstances. The most critical factors influencing segment uplift are upper load, moisture content, and grouting ratio. Therefore, optimizing parameters is recommended in combination with the uplift prediction values. ADS-SUC suggests keeping the total grouting volume constant to inhibit segment uplift by reducing the proportion of upper and middle grouting. Figure 15 illustrates scatter plots depicting segment uplift concerning changes in grouting ratios and middle grouting total volume, along with a line chart demonstrating the cumulative uplift variation after implementing the control measures.
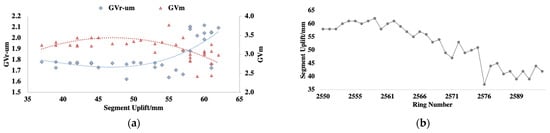
Figure 15.
Ring 2550 to 2600. (a) Scatter Plot of Grout Ratio vs. Uplift Amount; (b) Diagram of Segment Uplift Variation.
The uplift amount from ring 2550 to 2600 remained consistently at 60 mm. Based on the grouting ratio optimization results provided by ADS-SUC, on-site construction personnel increased the total volume of middle grouting, reducing the upper-to-middle grouting ratio. As evident from Figure 15a,b, initially around 2.0, the grouting ratio was gradually lowered to approximately 1.7. Consequently, the uplift, which started at the initial 60 mm level, gradually decreased and eventually stabilized at 40 mm, confirming the effectiveness of this measure.
5. Discussion
This paper constructs an auxiliary decision-making system of segment uplift control (ADS-SUC) to address the prediction and control of segment uplift. Based on a literature review of nearly ten years, this research identified uplift factors. It determined three categories of 15-dimensional construction parameters as input variables: grouting system, advance system, and geological conditions. Three prediction models, namely BP, XGBoost, and GRNN, were established to predict the final uplift of the segment. Additionally, the relationship between uplift and factors was analyzed using the SHAP method, providing recommendations for response measures in different uplift scenarios. The system was applied and verified in an engineering project. The characteristics of the ADS-SUC proposed in this study are as follows:
1. ADS-SUC fully considers various factors that affect segment uplift, as well as the temporal and spatial characteristics of different categories of construction parameters, and designs and completes the organic integration of temporal and spatial of parameters.
2. The segment uplift prediction model (XGBoost-SU-PM) in ADS-SUC realizes the segment uplift prediction and captures the uplift trend changes early. Among them, the predicted final segment uplift serves as a reference for on-site uplift planning, and the early detection of uplift trends optimizes the timing of uplift control.
3. ADS-SUC combines uplift prediction and relationship analysis results to propose uplift control schemes under different scenarios, which achieves an integrated approach involving uplift prediction, factor analysis, and control decision-making, assisting in the on-site management of segment uplift issues.
In summary, this paper uses machine learning algorithms to predict the segment uplift in the stable stage and has high prediction accuracy. This breaks through the unreliability and lack of guidance available on on-site uplift control problems of empirical estimation or theoretical analysis in previous uplift prediction studies. In addition, unlike existing studies that focus on the prediction of the uplift process of single-ring segments, this study predicts the multi-ring segment uplift in the future and captures the changing trend of uplift to reduce the occurrence of tunnel quality and safety problems caused by sudden changes in segment uplift. Finally, this study proposes more specific uplift control measures based on the relationship model between influencing factors and uplift.
Although this paper has established fundamental methods for segment uplift prediction and control, future research could consider aggregating historical construction data from multiple tunnels, which allows the model to learn from a broader range of uplift scenarios, further enhancing its robustness and resilience. In addition, the uplift control strategy in this article is proposed for specific projects, and uplift control strategies are different in different situations. Therefore, in the future, the similarities and differences of uplift control strategies can be considered in different types of engineering projects.
Author Contributions
Conceptualization, M.H. and J.S.; methodology, M.H., J.S. and B.W.; software, J.S. and Z.X.; validation, M.H., B.W. and H.W.; investigation, M.H. and J.S.; data curation, J.S. and Z.X.; writing—original draft preparation, M.H. and J.S.; writing—review and editing, M.H. and J.S.; visualization, J.S. All authors have read and agreed to the published version of the manuscript.
Funding
This research received no external funding.
Institutional Review Board Statement
Not applicable.
Informed Consent Statement
Not applicable.
Data Availability Statement
The data presented in this study are available on request from the corresponding author. The data are not publicly available due to the specificity of research work.
Acknowledgments
This research did not receive any specific grant from funding agencies in the public, commercial, or not-for-profit sectors.
Conflicts of Interest
Author Huiming Wu was employed by the company Shanghai Tunnel Engineering Co., Ltd. The remaining authors declare that the research was conducted in the absence of any commercial or financial relationships that could be construed as a potential conflict of interest.
References
- Shen, Z. Analysis and control of tunnel segment uplift during shield tunneling. Mod. Tunneling Technol. 2004, 41, 51–56. [Google Scholar] [CrossRef]
- Xiao, M.; Sun, W.; Han, X. Research on upward moving of segments of shield tunnel. Rock Soil Mech. 2009, 30, 1041–1045+1056. [Google Scholar] [CrossRef]
- Chang, S.H.; Choi, S.W.; Bae, G.J. Assessment of fire-induced damage on concrete segment of shield TBM tunnel. Key Eng. Mater. 2006, 321, 322–327. [Google Scholar] [CrossRef]
- Hong, K.; Feng, H. Development and Thinking of Tunnels and Underground Engineering in China in Recent 2 Years (From 2019 to 2020). Tunn. Constr. 2021, 41, 1259–1280. [Google Scholar] [CrossRef]
- Kasper, T.; Meschke, G. A 3D finite element simulation model for TBM tunnelling in soft ground. Int. J. Numer. Anal. Methods Geomech. 2004, 28, 1441–1460. [Google Scholar] [CrossRef]
- Kasper, T.; Meschke, G. A numerical study of the effect of soil and grout material properties and cover depth in shield tunnelling. Comput. Geotech. 2006, 33, 234–247. [Google Scholar] [CrossRef]
- Kasper, T.; Meschke, G. On the influence of face pressure, grouting pressure and TBM design in soft ground tunnelling. Tunn. Undergr. Space Technol. 2006, 21, 160–171. [Google Scholar] [CrossRef]
- Ji, C.; Wang, P.; Li, X.; Di, H. Analysis of Factors Weighing on Shield Tunnel Segment Uplift during Construction in Soft Soil Strata. In Proceedings of the 2014 China Tunnel and Underground Engineering Conference (CTUC) and the 18th Annual Meeting of the Tunnel and Underground Engineering Branch of the China Civil Engineering Society, Hangzhou, China, 24 November 2014; Modern Tunnel Technology Editorial Office: Chengdu, China, 2014; pp. 169–176. [Google Scholar]
- Huang, Z.; Shu, Y.; Ji, C.; Qiao, S.; You, X. Analysis of Weight of Influencing Factors of Shield Tunnel Segment Uplifting during Construction Based on Equivalent Beam Model. Tunn. Constr. 2016, 36, 1295–1301. [Google Scholar] [CrossRef]
- Chen, R.; Meng, F.; Ye, Y.; Liu, Y. Numerical simulation of the uplift behavior of shield tunnel during construction stage. Soils Found. 2018, 58, 370–381. [Google Scholar] [CrossRef]
- Lv, Q.; Zhou, J.; Yang, Z.; Wang, L.; Liu, J. Prediction of Shield Tunnel Segment Up-lifting Caused by Formation Rebound. Tunn. Constr. 2017, 37, 87–93. [Google Scholar] [CrossRef]
- Shu, Y.; Ji, C.; Zhou, S.; He, C.; Huang, Z.; Zhang, S. Prediction for shield tunnel segment uplift considering the effect of stratum permeability. Chin. J. Rock Mech. Eng. 2017, 36, 3516–3524. [Google Scholar] [CrossRef]
- Dai, Z. Mechanism and Control of Shield Tunnel Tail Uplift of Tunnel Segments. China Railw. Sci. 2013, 34, 59–66. [Google Scholar] [CrossRef]
- Wang, D.; Yuan, J.; Zhu, Z.; Zhu, Y. Theoretical solution of longitudinal upward movement of underwater shield tunnel and its application. Rock Soil Mech. 2014, 35, 3079–3085. [Google Scholar] [CrossRef]
- Liang, Y.; Yang, J.; Lin, H. Study on Uplift and Force of Segment during Construction Stage of Large-diameter Shield Tunnel. Mod. Tunneling Technol. 2016, 53, 91–97. [Google Scholar] [CrossRef]
- Hu, Y.; Xu, X.; Huang, P.; He, J.; Li, L.; Wang, Z. Mechanism and Control of Segment Floating of Shield Tunnel Based on Newtonian Kinematics. Constr. Technol. 2020, 49, 93–99. [Google Scholar] [CrossRef]
- Geng, D.; Hu, Y.; Jiang, Y.; Wang, N. Research on the Calculation of Segment Floating Considering the Action Degree of Soil Arching Effect. In Advanced Tunneling Techniques and Information Modeling of Underground Infrastructure: Proceedings of the 6th GeoChina International Conference on Civil & Transportation Infrastructures: From Engineering to Smart & Green Life Cycle Solutions--Nanchang, China, 2021; Springer International Publishing: Cham, Switzerland, 2021; pp. 16–36. [Google Scholar] [CrossRef]
- Zhou, S.; Ji, C. Tunnel segment uplift model of earth pressure balance shield in soft soils during subway tunnel construction. Int. J. Rail Transp. 2014, 2, 221–238. [Google Scholar] [CrossRef]
- Dong, S.; Yang, P.; Jiang, C.; Wang, Y. Analysis of Mechanism and Controls of Segment Floating of Shield Tunnels. J. Undergr. Space Eng. 2016, 12, 49–54. [Google Scholar]
- Cheng, W.; Song, Z.; Tian, W.; Wang, Z. Shield tunnel uplift and deformation characterisation: A case study from Zhengzhou metro. Tunn. Undergr. Space Technol. 2018, 79, 83–95. [Google Scholar] [CrossRef]
- Geng, D.; Liao, Y.; Hu, Y.; Jiang, Y. Research on the Floating Law and Influencing Factors of Mud-Water Shield in Composite Strata. J. East China Jiaotong Univ. 2021, 38, 47–53. [Google Scholar] [CrossRef]
- Lin, W.; Zhang, M.; Xiao, X.; Wu, H.; Jia, W. Analysis on Floating Mechanism of Large-Diameter Shield Tunnel Segments Considering the Viscosity Characteristics of Slurry. J. China Foreign Highw. 2019, 39, 164–169. [Google Scholar] [CrossRef]
- Geng, D.; Hu, Y.; Jiang, Y.; Wang, N.; Hu, W. Modified calculation model for segment floating in slurry shield tunnel. J. Perform. Constr. Facil. 2021, 35, 04021068. [Google Scholar] [CrossRef]
- Zhang, J.; Li, M.; Chen, J.; Yu, L.; Li, Y.; Yang, G.; Wang, Y. Prediction Methods for Segment Uplift in Large-diameter Shield Tunnels Based on Double Elastic Foundation Beams. Mod. Tunn. Technol. 2023, 60, 159–167. [Google Scholar] [CrossRef]
- Raja, M.; Abdoun, T.; El-Sekelly, W. Smart prediction of liquefaction-induced lateral spreading. J. Rock Mech. Geotech. Eng. 2023, in press. [Google Scholar] [CrossRef]
- Kim, D.; Kwon, K.; Pham, K.; Oh, J.; Choi, H. Surface settlement prediction for urban tunneling using machine learning algorithms with Bayesian optimization. Autom. Constr. 2022, 140, 104331. [Google Scholar] [CrossRef]
- Ning, X.; An, Y.; Ju, L.; Wang, W. Real-time online prediction of surface settlement considering spatiotemporal characteristics during foundation excavation. Autom. Constr. 2023, 150, 104831. [Google Scholar] [CrossRef]
- Huang, H.; Chang, J.; Zhang, D.; Zhang, J.; Wu, H.; Li, G. Machine learning-based automatic control of tunneling posture of shield machine. J. Rock Mech. Geotech. Eng. 2022, 14, 1153–1164. [Google Scholar] [CrossRef]
- Chen, H.; Li, X.; Feng, Z.; Wang, L.; Qin, Y.; Skibniewski, M. Shield attitude prediction based on Bayesian-LGBM machine learning. Inf. Sci. 2023, 632, 105–129. [Google Scholar] [CrossRef]
- Wada, K.; Sugiyama, H.; Nozawa, K.; Honda, M.; Yamamoto, S. Guidance System for Directional Control in Shield Tunneling Using Machine Learning Techniques. In Proceedings of the 18th International Conference on Computing in Civil and Building Engineering: ICCCBE 2020; Springer International Publishing: Cham, Switzerland, 2021; pp. 73–88. [Google Scholar] [CrossRef]
- Ye, X.; Zhang, X.; Zhang, H.; Ding, Y.; Chen, Y. Prediction of lining upward movement during shield tunneling using machine learning algorithms and field monitoring data. Transp. Geotech. 2023, 41, 101002. [Google Scholar] [CrossRef]
- Chen, J.; Jin, J.; Li, X.; Yang, G.; Li, M.; Jin, Q. Segment Uplift of LargeDiameter Tunnel Crossing Yellow River During Construction Based on XGBoost Algorithm. Tunn. Constr. 2023, 43, 72–80. [Google Scholar] [CrossRef]
- Shi, J.; Ortigao, J.A.R.; Bai, J. Modular neural networks for predicting settlements during tunneling. J. Geotech. Geoenvironmental Eng. 1998, 124, 389–395. [Google Scholar] [CrossRef]
- Xia, H.; Huang, Y.; Yin, H.; Zhang, L. A Method of Ground Subsidence Forecast for Shield Construction Based on XGBoost Algorithm. Railw. Stand. Des. 2023, 67, 140–147. [Google Scholar] [CrossRef]
- Du, Q.; Zhang, S.; Zhang, C.; Li, X.; Xiao, Y.; Li, X.; Zhao, S.; Fu, Y. Prediction Method for Slurry Balance Shield Tunneling Speed Based on Mean Filtering & Denoising and XGBoost Algorithm. Mod. Tunn. Technol. 2022, 59, 14–23. [Google Scholar] [CrossRef]
- Jiang, P.; Chen, J. Displacement prediction of landslide based on generalized regression neural networks with K-fold cross-validation. Neurocomputing 2016, 198, 40–47. [Google Scholar] [CrossRef]
- Wei, D.; Kang, J. Design of BP neural network. Comput. Eng. Des. 1998, 2, 48–50. [Google Scholar]
- Lundberg, S.M.; Erion, G.G.; Lee, S.I. Consistent individualized feature attribution for tree ensembles. arXiv 2018, arXiv:1802.03888. [Google Scholar] [CrossRef]


Disclaimer/Publisher’s Note: The statements, opinions and data contained in all publications are solely those of the individual author(s) and contributor(s) and not of MDPI and/or the editor(s). MDPI and/or the editor(s) disclaim responsibility for any injury to people or property resulting from any ideas, methods, instructions or products referred to in the content. |
© 2024 by the authors. Licensee MDPI, Basel, Switzerland. This article is an open access article distributed under the terms and conditions of the Creative Commons Attribution (CC BY) license (https://creativecommons.org/licenses/by/4.0/).