
Air Quality Benefits of Renewable Energy: Evidence from China’s Renewable Energy Heating Policy


Abstract
1. Introduction
2. Policy Background
3. Data and Methodology
3.1. Data
3.1.1. Air Quality Data
3.1.2. Municipal Central Heating
3.1.3. City-Level Socioeconomic Data
3.2. Summary Statistics
3.3. Model Specification
4. Empirical Results
4.1. Baseline Results
4.2. Robustness Checks
4.2.1. Parallel Pre-Trends and Dynamic Effects of the REHP
4.2.2. Placebo Tests
4.2.3. Alternative Treatment Variable
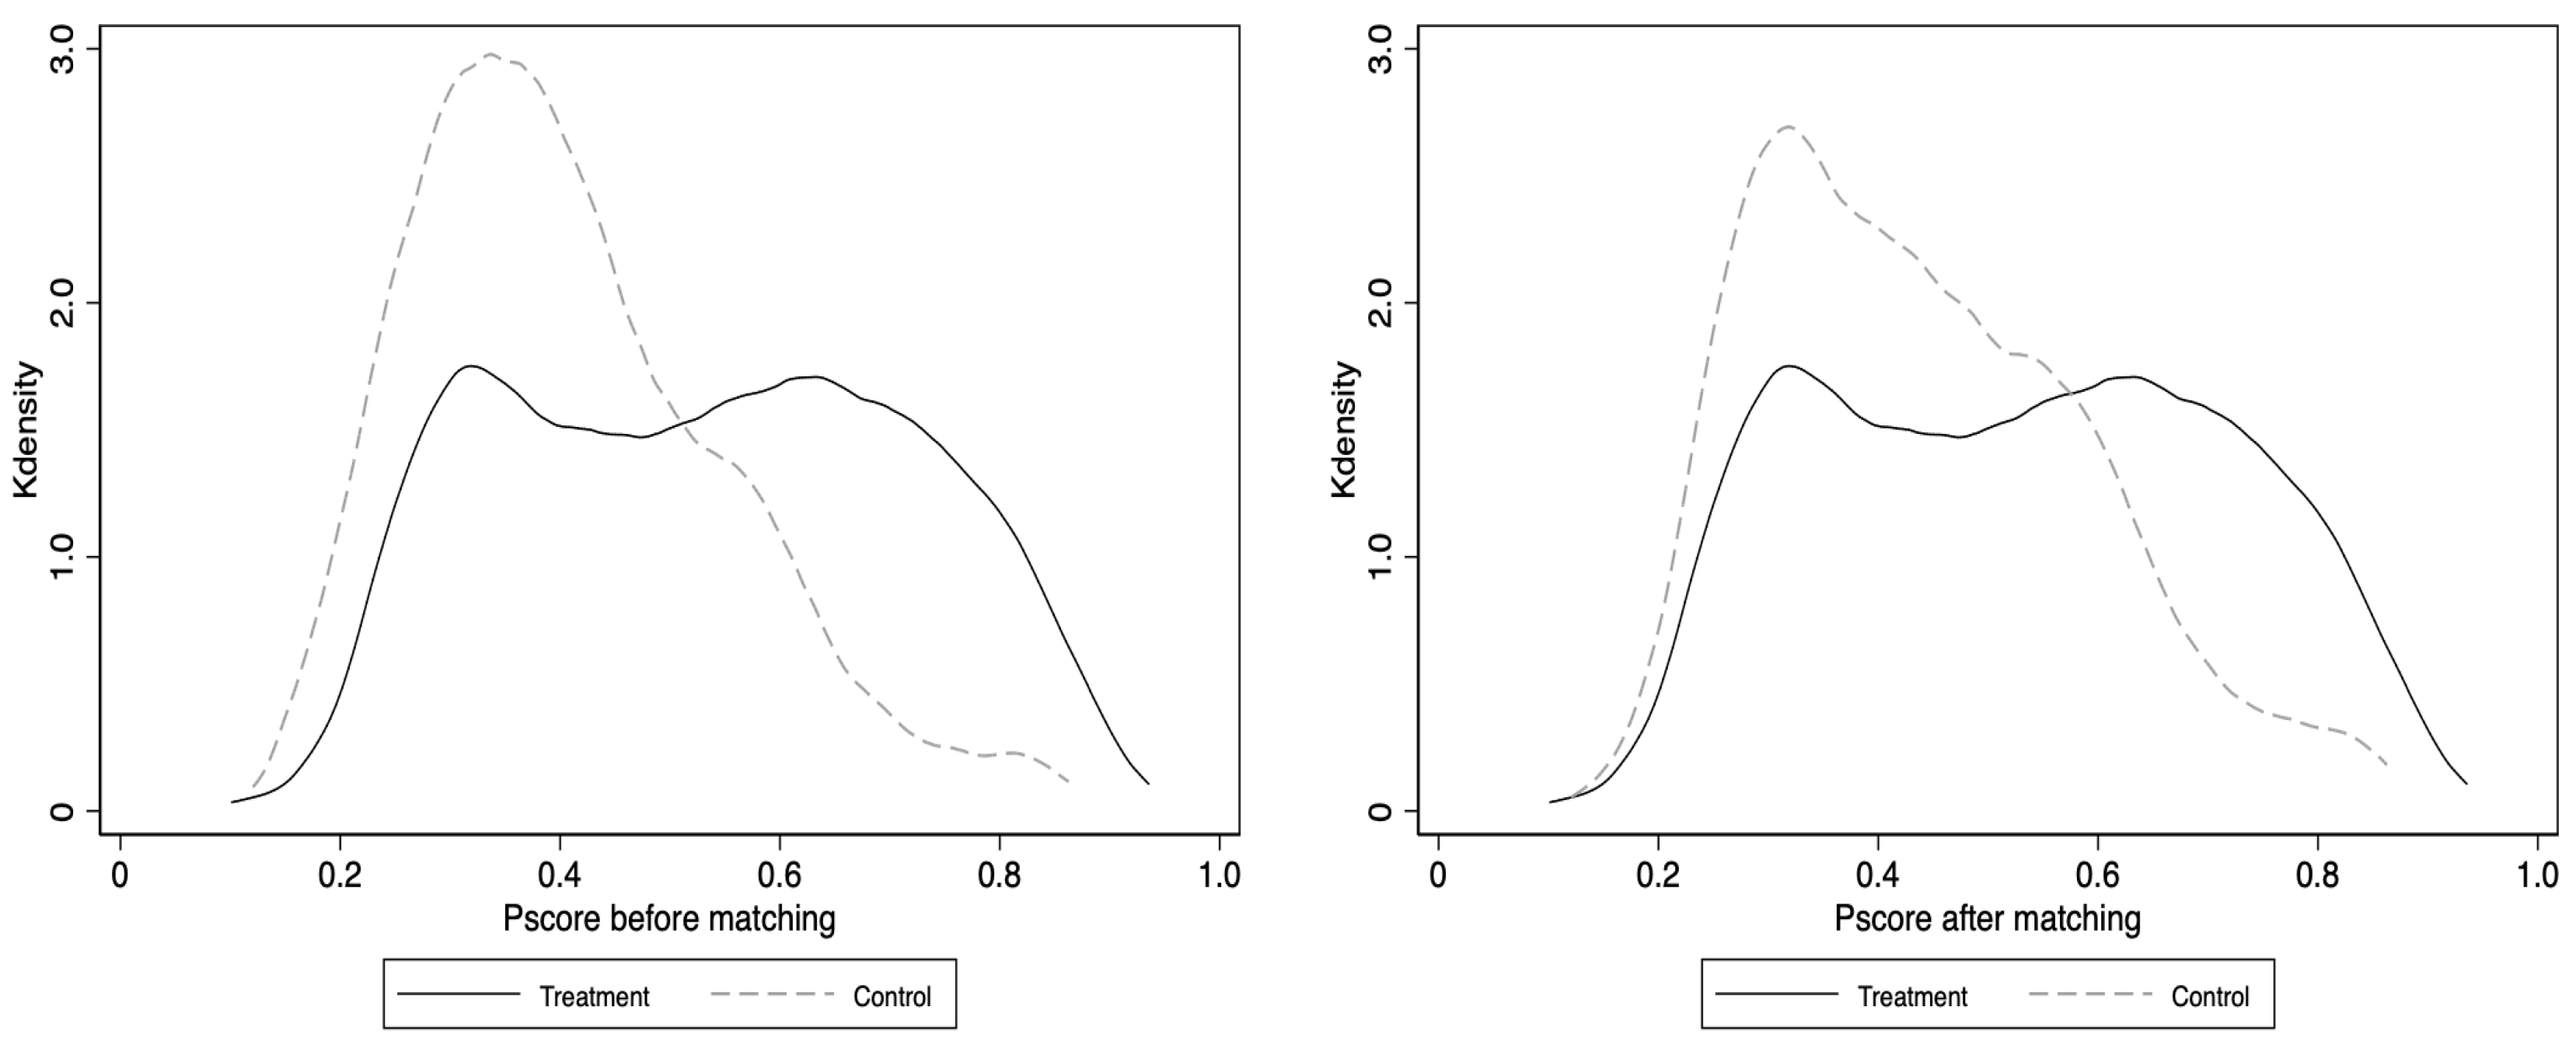
4.2.4. Alternative Propensity Matching Methods
4.2.5. The Effect on Air Quality During the Heating Season
4.2.6. Eliminating the Interference of Other Policies
5. Further Discussions
5.1. Heterogeneity Effects
5.2. Mechanism Analysis
6. Conclusions
Author Contributions
Funding
Institutional Review Board Statement
Informed Consent Statement
Data Availability Statement
Conflicts of Interest
Appendix A

| Province | Num. | Cities |
|---|---|---|
| (1) Municipal Central Heating (Treatment Group) | ||
| Beijing | 1 | Beijing |
| Tianjin | 1 | Tianjin |
| Hebei | 11 | Baoding, Tangshan, Langfang, Zhangjiakou, Chengde, Cangzhou, Shijiazhuang, Qinhuangdao, Hengshui, Xingtai, Handan |
| Inner Mongolia | 9 | Ulanqab, Wuhai, Baotou, Hulunbuir, Hohhot, Bayannur, Chifeng, Tongliao, Ordos |
| Shanxi | 11 | Linfen, Luliang, Datong, Taiyuan, Xinzhou, Jinzhong, Jincheng, Shuozhou, Yuncheng, Changzhi, Yangquan |
| Shandong | 16 | Dongying, Linyi, Weihai, Dezhou, Rizhao, Zaozhuang, Tai ’an, Jinan, Jining, Zibo, Binzhou, Weifang, Yantai, Liaocheng, Heze, Qingdao |
| Heilongjiang | 12 | Qitaihe, Yichun, Jiamusi, Shuangyashan, Harbin, Daqing, Mudanjiang, Suihua, Jixi, Hegang, Heihe, Tsitsihar |
| Jilin | 8 | Jilin, Siping, Songyuan, Baicheng, Baishan, Liaoyuan, Tonghua, Changchun |
| Liaoning | 14 | Dandong, Dalian, Fushun, Chaoyang, Benxi, Shenyang, Panjin, Yingkou, Huludao, Liaoyang, Tieling, Jinzhou, Fuxin, Anshan |
| Shaanxi | 10 | Xianyang, Shangluo, Ankang, Baoji, Yan’an, Yulin, Hanzhong, Weinan, Xi’an, Tongchuan |
| Ningxia | 5 | Zhongwei, Wuzhong, Guyuan, Shizuishan, Yinchuan |
| Gansu | 12 | Lanzhou, Jiayuguan, Tianshui, Dingxi, Pingliang, Qingyang, Zhangye, Wuwei, Baiyin, Jiuquan, Jinchang, Longnan |
| Qinghai | 3 | Haidong, Hainan Tibetan Autonomous Prefecture, Xining |
| Xinjiang | 4 | Urumqi, Karamay, Turpan, Hami |
| Henan | 15 | Sanmenxia, Nanyang, Shangqiu, Anyang, Pingdingshan, Kaifeng, Xinxiang, Luoyang, Luohe, Puyang, Jiaozuo, Xuchang, Zhengzhou, Zhumadian, Hebi |
| Anhui | 1 | Hefei |
| Jiangsu | 1 | Xuzhou |
| Total | 134 | |
| (2) Partial or District-based Heating (Treatment Group) | ||
| Anhui | 7 | Wuhu, Bengbu, Huainan, Suzhou, Huaibei, Fuyang, Bozhou |
| Jiangsu | 6 | Lianyungang, Changzhou, Nanjing, Yangzhou, Suzhou, Huai ’an |
| Hubei | 3 | Shiyan, Xiangyang, Jingmen |
| Guizhou | 1 | Liupanshui |
| Tibet | 2 | Lhasa, Naqu |
| Total | 19 | |
| (3) No municipal Central Heating (Control Group) | ||
| Henan | 2 | Xinyang, Zhoukou |
| Anhui | 8 | Lu’an, Anqing, Xuancheng, Chizhou, Chuzhou, Tongling, Maanshan, Huangshan |
| Jiangsu | 6 | Nantong, Suqian, Wuxi, Taizhou, Yancheng, Zhenjiang |
| Hubei | 9 | Xianning, Xiaogan, Yichang, Wuhan, Jingzhou, Ezhou, Suizhou, Huanggang, Huangshi |
| Guizhou | 5 | Anshun, Bijie, Guiyang, Zunyi, Tongren |
| Sichuan | 18 | Leshan, Neijiang, Nanchong, Yibin, Bazhong, Guangyuan, Guang’an, Deyang, Chengdu, Panzhihua, Luzhou, Meishan, Mianyang, Zigong, Ziyang, Dazhou, Suining, Ya’an |
| Yunnan | 8 | Lincang, Lijiang, Baoshan, Kunming, Zhaotong, Pu’er, Qujing, Yuxi |
| Tibet | 4 | Shannan, Xigaze, Qamdo, Nyingchi |
| Shanghai | 1 | Shanghai |
| Chongqing | 1 | Chongqing |
| Zhejiang | 11 | Lishui, Taizhou, Jiaxing, Ningbo, Hangzhou, Wenzhou, Huzhou, Shaoxing, Zhoushan, Quzhou, Jinhua |
| Fujian | 9 | Sanming, Nanping, Xiamen, Ningde, Quanzhou, Zhangzhou, Fuzhou, Putian, Longyan |
| Jiangxi | 11 | Shangrao, Jiujiang, Nanchang, Ji’an, Yichun, Fuzhou, Xinyu, Jingdezhen, Pingxiang, Ganzhou, Yingtan |
| Hunan | 13 | Loudi, Yueyang, Changde, Zhangjiajie, Huaihua, Zhuzhou, Yongzhou, Xiangtan, Yiyang, Hengyang, Shaoyang, Chenzhou, Changsha |
| Guangdong | 21 | Dongguan, Zhongshan, Yunfu, Foshan, Guangzhou, Huizhou, Jieyang, Meizhou, Shantou, Shanwei, Jiangmen, Heyuan, Shenzhen, Qingyuan, Zhanjiang, Chaozhou, Zhuhai, Zhaoqing, Maoming, Yangjiang, Shaoguan |
| Guangxi | 14 | Beihai, Nanning, Chongzuo, Laibin, Liuzhou, Guilin, Wuzhou, Hechi, Yulin, Baise, Guigang, Hezhou, Qinzhou, Fangchenggang |
| Hainan | 4 | Sanya, Sansha, Danzhou, Haikou |
| Total | 145 | |
References
- Cesur, R.; Tekin, E.; Ulker, A. Air pollution and infant mortality: Evidence from the expansion of natural gas infrastructure. Econ. J. 2017, 127, 330–362. [Google Scholar] [CrossRef]
- Beach, B.; Hanlon, W.W. Coal smoke and mortality in an early industrial economy. Econ. J. 2018, 128, 2652–2675. [Google Scholar] [CrossRef]
- Johnsen, R.; LaRiviere, J.; Wolff, H. Fracking, coal, and air quality. J. Assoc. Environ. Resour. Econ. 2019, 6, 1001–1037. [Google Scholar] [CrossRef]
- Chu, Y.; Holladay, J.S.; Qiu, Y.; Tian, X.-L.; Zhou, M. Air pollution and mortality impacts of coal mining: Evidence from coalmine accidents in China. J. Environ. Econ. Manag. 2023, 121, 102846. [Google Scholar] [CrossRef]
- Jiang, Y.; Hu, S.; Wu, Y.; Xia, J.; Fu, L. Decarbonize Urban Heating System: China Building Energy and Emission Yearbook 2023; Springer Nature: Berlin/Heidelberg, Germany, 2022. [Google Scholar]
- Sweidan, O.D. The geopolitical risk effect on the us renewable energy deployment. J. Clean. Prod. 2021, 293, 126189. [Google Scholar] [CrossRef]
- Lee, C.-C.; Hussain, J.; Chen, Y. The optimal behavior of renewable energy resources and government’s energy consumption subsidy design from the perspective of green technology implementation. Renew. Energy 2022, 195, 670–680. [Google Scholar] [CrossRef]
- Onder, M.; Yigit, E. Assessment of respirable dust exposures in an opencast coal mine. Environ. Monit. Assess. 2009, 152, 393–401. [Google Scholar] [CrossRef]
- Aneja, V.P.; Isherwood, A.; Morgan, P. Characterization of particulate matter (pm10) related to surface coal mining operations in appalachia. Atmos. Environ. 2012, 54, 496–501. [Google Scholar] [CrossRef]
- Knuckles, T.L.; Stapleton, P.A.; Minarchick, V.C.; Esch, L.; McCawley, M.; Hendryx, M.; Nurkiewicz, T.R. Air pollution particulate matter collected from an appalachian mountaintop mining site induces microvascular dysfunction. Microcirculation 2013, 20, 158–169. [Google Scholar] [CrossRef]
- Ito, K.; Zhang, S. Willingness to pay for clean air: Evidence from air purifier markets in China. J. Political Econ. 2020, 128, 1627–1672. [Google Scholar] [CrossRef]
- Chen, Y.; Ebenstein, A.; Greenstone, M.; Li, H. Evidence on the impact of sustained exposure to air pollution on life expectancy from China’s huai river policy. Proc. Natl. Acad. Sci. USA 2013, 110, 12936–12941. [Google Scholar] [CrossRef] [PubMed]
- Fan, M.; He, G.; Zhou, M. The winter choke: Coal-fired heating, air pollution, and mortality in China. J. Health Econ. 2020, 71, 102316. [Google Scholar] [CrossRef] [PubMed]
- Arora, V.; Cai, Y.; Jones, A. The national and international impacts of coal-to-gas switching in the Chinese power sector. Energy Econ. 2016, 60, 416–426. [Google Scholar] [CrossRef]
- Liu, H.; Mauzerall, D.L. Costs of clean heating in China: Evidence from rural households in the beijing-tianjin-hebei region. Energy Econ. 2020, 90, 104844. [Google Scholar] [CrossRef]
- Zhang, Y.; Li, W.; Wu, F. Does energy transition improve air quality? Evidence derived from China’s Winter Clean Heating Pilot (WCHP) project. Energy 2020, 206, 118130. [Google Scholar] [CrossRef]
- Song, C.; Liu, B.; Cheng, K.; Cole, M.A.; Dai, Q.; Elliott, R.J.; Shi, Z. Attribution of air quality benefits to clean winter heating policies in China: Combining machine learning with causal inference. Environ. Sci. Technol. 2023, 57, 17707–17717. [Google Scholar] [CrossRef]
- Tan, X.; Chen, G.; Chen, K. Clean heating and air pollution: Evidence from northern China. Energy Rep. 2023, 9, 303–313. [Google Scholar] [CrossRef]
- Zhou, X.; Feng, C. The impact of environmental regulation on fossil energy consumption in China: Direct and indirect effects. J. Clean. Prod. 2017, 142, 3174–3183. [Google Scholar] [CrossRef]
- Zhao, J.; Jiang, Q.; Dong, X.; Dong, K. Would environmental regulation improve the greenhouse gas benefits of natural gas use? A Chinese case study. Energy Econ. 2020, 87, 104712. [Google Scholar] [CrossRef]
- Wang, E.Z.; Lee, C.C. The impact of clean energy consumption on economic growth in China: Is environmental regulation a curse or a blessing? Int. Rev. Econ. Financ. 2022, 77, 39–58. [Google Scholar] [CrossRef]
- Lee, C.C.; Yuan, Z.; Lee, C.C.; Chang, Y.F. The impact of renewable energy technology innovation on energy poverty: Does climate risk matter? Energy Econ. 2022, 116, 106427. [Google Scholar] [CrossRef]
- Lee, C.C.; Chen, M.P.; Yuan, Z. Is information and communication technology a driver for renewable energy? Energy Econ. 2023, 124, 106786. [Google Scholar] [CrossRef]
- Madaleno, M.; Dogan, E.; Taskin, D. A step forward on sustainability: The nexus of environmental responsibility, green technology, clean energy and green finance. Energy Econ. 2022, 109, 105945. [Google Scholar] [CrossRef]
- Khan, K.; Su, C.W.; Rehman, A.U.; Ullah, R. Is technological innovation a driver of renewable energy? Technol. Soc. 2022, 70, 102044. [Google Scholar] [CrossRef]
- Lee, C.C.; Wang, C.S. Does natural resources matter for sustainable energy development in China: The role of technological progress. Resour. Policy 2022, 79, 103077. [Google Scholar] [CrossRef]
- Meyer, B.D. Natural and quasi-experiments in economics. J. Bus. Econ. Stat. 1995, 13, 151–161. [Google Scholar] [CrossRef]
- Angrist, J.D.; Pischke, J.-S. Mostly Harmless Econometrics: An Empiricist’s Companion; Princeton University Press: Princeton, NJ, USA, 2009. [Google Scholar]
- Gertler, P.J.; Martinez, S.; Premand, P.; Rawlings, L.B.; Vermeersch, C.M. Impact Evaluation in Practice; World Bank Publications: Chicago, IL, USA, 2016. [Google Scholar]
- Almond, D.; Chen, Y.; Greenstone, M.; Li, H. Winter heating or clean air? unintended impacts of China’s huai river policy. Am. Econ. Rev. 2009, 99, 184–190. [Google Scholar] [CrossRef]
- National Research Council. Urbanization, Energy, and Air Pollution in China: The Challenges Ahead: Proceedings of a Symposium; National Academies Press: Washington, DC, USA, 2005. [Google Scholar]
- Buffa, S.; Cozzini, M.; D’antoni, M.; Baratieri, M.; Fedrizzi, R. 5th generation district heating and cooling systems: A review of existing cases in Europe. Renew. Sustain. Energy Rev. 2019, 104, 504–522. [Google Scholar] [CrossRef]
- Kabeyi, M.J.B.; Olanrewaju, O.A. Sustainable energy transition for renewable and low carbon grid electricity generation and supply. Front. Energy Res. 2022, 9, 743114. [Google Scholar] [CrossRef]
- Revinova, S.; Lazanyuk, I.; Gabrielyan, B.; Shahinyan, T.; Hakobyan, Y. Hydrogen in Energy Transition: The Problem of Economic Efficiency, Environmental Safety, and Technological Readiness of Transportation and Storage. Resources 2024, 13, 92. [Google Scholar] [CrossRef]
- Chen, Z.; Kahn, M.E.; Liu, Y.; Wang, Z. The consequences of spatially differentiated water pollution regulation in China. J. Environ. Econ. Manag. 2018, 88, 468–485. [Google Scholar] [CrossRef]
- Su, Y.; Chen, X.; Li, Y.; Liao, J.; Ye, Y.; Zhang, H.; Huang, N.; Kuang, Y. China’s 19-year city-level carbon emissions of energy consumptions, driving forces and regionalized mitigation guidelines. Renew. Sustain. Energy Rev. 2014, 35, 231–243. [Google Scholar] [CrossRef]
- Shi, K.; Chen, Y.; Yu, B.; Xu, T.; Yang, C.; Li, L.; Huang, C.; Chen, Z.; Liu, R.; Wu, J. Detecting spatiotemporal dynamics of global electric power consumption using DMSP-OLS nighttime stable light data. Appl. Energy 2016, 184, 450–463. [Google Scholar] [CrossRef]
- Elvidge, C.D.; Baugh, K.E.; Kihn, E.A.; Kroehl, H.W.; Davis, E.R.; Davis, C.W. Relation between satellite observed visible-near infrared emissions, population, economic activity and electric power consumption. Int. J. Remote Sens. 1997, 18, 1373–1379. [Google Scholar] [CrossRef]
- Chand, T.K.; Badarinath, K.; Elvidge, C.; Tuttle, B. Spatial characterization of electrical power consumption patterns over india using temporal DMSP-OLS night-time satellite data. Int. J. Remote Sens. 2009, 30, 647–661. [Google Scholar] [CrossRef]
- Townsend, A.C.; Bruce, D.A. The use of night-time lights satellite imagery as a measure of Australia’s regional electricity consumption and population distribution. Int. J. Remote Sens. 2010, 31, 4459–4480. [Google Scholar] [CrossRef]
- Moser, P.; Voena, A. Compulsory licensing: Evidence from the trading with the enemy act. Am. Econ. Rev. 2012, 102, 396–427. [Google Scholar] [CrossRef]
- Chari, A.; Liu, E.M.; Wang, S.Y.; Wang, Y. Property rights, land misallocation, and agricultural efficiency in China. Rev. Econ. Stud. 2021, 88, 1831–1862. [Google Scholar] [CrossRef]
- Rosenbaum, P.R.; Rubin, D.B. Reducing bias in observational studies using subclassification on the propensity score. J. Am. Stat. Assoc. 1984, 79, 516–524. [Google Scholar] [CrossRef]
- D’Agostino, R.B., Jr. Propensity score methods for bias reduction in the comparison of a treatment to a non-randomized control group. Stat. Med. 1998, 17, 2265–2281. [Google Scholar] [CrossRef]
- Stern, D.I. The rise and fall of the environmental Kuznets curve. World Dev. 2004, 32, 1419–1439. [Google Scholar] [CrossRef]
- Zheng, Y.; Peng, J.; Xiao, J.; Su, P.; Li, S. Industrial structure transformation and provincial heterogeneity characteristics evolution of air pollution: Evidence of a threshold effect from China. Atmos. Pollut. Res. 2020, 11, 598–609. [Google Scholar] [CrossRef]
- He, L.; Wu, M.; Wang, D.; Zhong, Z. A study of the influence of regional environmental expenditure on air quality in China: The effectiveness of environmental policy. Environ. Sci. Pollut. Res. 2018, 25, 7454–7468. [Google Scholar] [CrossRef] [PubMed]
- Bernauer, T.; Koubi, V. Are bigger governments better providers of public goods? Evidence from air pollution. Public Choice 2013, 156, 593–609. [Google Scholar] [CrossRef]
- Gao, Y.; Sampattavanija, S. Air quality and winter heating: Some evidence from china. Int. J. Energy Econ. Policy 2022, 12, 455–469. [Google Scholar] [CrossRef]
- Abadie, A.; Imbens, G.W. Large sample properties of matching estimators for average treatment effects. Econometrica 2006, 74, 235–267. [Google Scholar] [CrossRef]
- Baser, O. Too much ado about propensity score models? comparing methods of propensity score matching. Value Health 2006, 9, 377–385. [Google Scholar] [CrossRef]
- Benedetto, U.; Head, S.J.; Angelini, G.D.; Blackstone, E.H. Statistical primer: Propensity score matching and its alternatives. Eur. J. Cardio-Thorac. Surg. 2018, 53, 1112–1117. [Google Scholar] [CrossRef]
- Aw, J.; Kleeman, M.J. Evaluating the first-order effect of intraannual temperature variability on urban air pollution. J. Geophys. Res. Atmos. 2003, 108, 1–18. [Google Scholar] [CrossRef]
- Dominick, D.; Latif, M.T.; Juahir, H.; Aris, A.Z.; Zain, S.M. An assessment of influence of meteorological factors on pm sub (10) and no sub (2) at selected stations in malaysia. Sustain. Environ. Res. 2012, 22, 305–315. [Google Scholar]
- Jayamurugan, R.; Kumaravel, B.; Palanivelraja, S.; Chockalingam, M. Influence of temperature, relative humidity and seasonal variability on ambient air quality in a coastal urban area. Int. J. Atmos. Sci. 2013, 2013, 264046. [Google Scholar] [CrossRef]
- Yang, D.; Wang, X.; Xu, J.; Xu, C.; Lu, D.; Ye, C.; Wang, Z.; Bai, L. Quantifying the influence of natural and socioeconomic factors and their interactive impact on pm2. 5 pollution in china. Environ. Pollut. 2018, 241, 475–483. [Google Scholar] [CrossRef] [PubMed]
- Bickerstaff, K.; Walker, G. Public understandings of air pollution: The ‘localisation’ of environmental risk. Glob. Environ. Chang. 2001, 11, 133–145. [Google Scholar] [CrossRef]
- Wang, S.; Zhang, R.; Wan, L.; Chen, J. Has central government environmental protection interview improved air quality in China? Ecol. Econ. 2023, 206, 107750. [Google Scholar] [CrossRef]
- Jayasooriya, V.; Ng, A.; Muthukumaran, S.; Perera, B. Green infrastructure practices for improvement of urban air quality. Urban For. Urban Green. 2017, 21, 34–47. [Google Scholar] [CrossRef]
- Chen, Y.; Yao, Z.; Zhong, K. Do environmental regulations of carbon emissions and air pollution foster green technology innovation: Evidence from China’s prefecture-level cities. J. Clean. Prod. 2022, 350, 131537. [Google Scholar] [CrossRef]
- Semenza, J.C.; Wilson, D.J.; Parra, J.; Bontempo, B.D.; Hart, M.; Sailor, D.J.; George, L.A. Public perception and behavior change in relationship to hot weather and air pollution. Environ. Res. 2008, 107, 401–411. [Google Scholar] [CrossRef]
- Maione, M.; Mocca, E.; Eisfeld, K.; Kazepov, Y.; Fuzzi, S. Public perception of air pollution sources across europe. Ambio 2021, 50, 1150–1158. [Google Scholar] [CrossRef]
- Porter, M.E.; Linde, C.V.D. Toward a new conception of the environment-competitiveness relationship. J. Econ. Perspect. 1995, 9, 97–118. [Google Scholar] [CrossRef]


| Variable | Definition |
| LnAQI | Natural logarithm of Air Quality Index (dimensionless) |
| LnSO2 | Natural logarithm of the average annual SO2 concentration (g/m3) |
| LnCO | Natural logarithm of the average annual CO concentration (g/m3) |
| LnNO2 | Natural logarithm of the average annual NO2 concentration (g/m3) |
| LnPM2.5 | Natural logarithm of the average annual PM2.5 concentration (g/m3) |
| LnGDP | Natural logarithm of GDP per capita (CNY) |
| LnPop | Natural logarithm of population density (people/km2) |
| LnInd | Natural logarithm of number of industrial enterprises above designated size |
| Exp | Ratio of government general public budget expenditure of GDP |
| IndStr | Proportion of added value of tertiary industry |
| LnCoal | Total consumption of standard coal (million tons) |
| EnvReg | Natural logarithm of (1+word frequency of environment in government reports) |
| TechExp | Ratio of government expenditure on science and technology to GDP |
| Panel A: Comparison of air quality and energy consumption | ||||||||
| Variable | Central heating Regions | Non-Central Heating Regions | Diff. in Mean | T-stat | ||||
| Obs. | Mean | Std. Dev. | Obs. | Mean | Std. Dev. | |||
| LnAQI | 1180 | 4.401 | 0.238 | 1349 | 4.214 | 0.259 | 0.188 *** | 18.908 |
| LnSO2 | 1180 | 2.808 | 0.645 | 1349 | 2.417 | 0.552 | 0.391 *** | 16.415 |
| LnCO | 1180 | −0.136 | 0.361 | 1349 | −0.197 | 0.288 | 0.061 *** | 4.698 |
| LnNO2 | 1180 | 3.381 | 0.338 | 1349 | 3.208 | 0.377 | 0.174 *** | 12.107 |
| LnPM2.5 | 1180 | 3.732 | 0.370 | 1349 | 3.566 | 0.421 | 0.166 *** | 10.441 |
| LnCoal | 1242 | 11.58 | 0.866 | 1431 | 11.46 | 0.830 | 0.119 *** | 3.628 |
| Panel B: Descriptive statistics of variables in whole sample | ||||||||
| Variable | Obs. | Mean | Min | Max | Median | Std. Dev | ||
| LnAQI | 2529 | 4.301 | 3.521 | 5.129 | 4.313 | 0.266 | ||
| LnSO2 | 2529 | 2.600 | 0.734 | 4.770 | 2.519 | 0.628 | ||
| LnCO | 2529 | −0.169 | −1.147 | 1.017 | −0.193 | 0.325 | ||
| LnNO2 | 2529 | 3.289 | 1.540 | 4.190 | 3.320 | 0.370 | ||
| LnPM2.5 | 2529 | 3.643 | 1.720 | 4.817 | 3.648 | 0.407 | ||
| LnCoal | 2673 | 11.52 | 7.406 | 13.60 | 11.53 | 0.849 | ||
| LnGDP | 2642 | 10.88 | 9.227 | 12.46 | 10.85 | 0.527 | ||
| LnPop | 2654 | 5.663 | 0.244 | 8.100 | 5.848 | 1.092 | ||
| LnInd | 2647 | 6.556 | 1.099 | 9.536 | 6.600 | 1.203 | ||
| Exp | 2642 | 0.221 | 0.0440 | 2.060 | 0.184 | 0.141 | ||
| IndStr | 2642 | 0.454 | 0.198 | 0.839 | 0.450 | 0.0920 | ||
| EnvReg | 2549 | 3.831 | 1.386 | 4.942 | 3.871 | 0.409 | ||
| TechExp | 2649 | 10.57 | 6.252 | 15.53 | 10.47 | 1.511 | ||
| (1) | (2) | (3) | (4) | |
|---|---|---|---|---|
| Model | Benchmark DID | PSM-DID | ||
| Dep.Variable | AQI | AQI | AQI | AQI |
| Treat × Post | −0.0215 *** | −0.0195 *** | −0.0404 *** | −0.0359 *** |
| (0.0074) | (0.0068) | (0.0096) | (0.0088) | |
| LnGdp | 0.0695 *** | 0.1213 *** | ||
| (0.0213) | (0.0273) | |||
| LnPop | 0.1960 ** | 0.0414 | ||
| (0.0831) | (0.1596) | |||
| LnInd | 0.0052 | −0.0220 | ||
| (0.0118) | (0.0192) | |||
| Exp | −0.0864 | −0.1710 | ||
| (0.1035) | (0.1559) | |||
| IndStr | −0.2040 *** | −0.1583 | ||
| (0.0623) | (0.1040) | |||
| City FEs | Yes | Yes | Yes | Yes |
| Year FEs | Yes | Yes | Yes | Yes |
| Observation | 2529 | 2504 | 1146 | 1146 |
| adj. | 0.923 | 0.929 | 0.935 | 0.938 |
| Variable | Unmatched Matched | Mean | %bias | %Reduct |bias| | t-Test | ||
|---|---|---|---|---|---|---|---|
| Treated | Control | t | p > |t| | ||||
| LnGDP | U | 10.849 | 10.893 | −9.4 | 98.8 | −2.34 | 0.019 |
| M | 10.852 | 10.851 | 0.1 | 0.03 | 0.978 | ||
| LnPop | U | 5.466 | 5.995 | −65.3 | 94.7 | −16.49 | 0.000 |
| M | 5.484 | 5.513 | −3.5 | -0.77 | 0.444 | ||
| LnInd | U | 6.325 | 6.866 | −52.8 | 85.1 | −13.26 | 0.000 |
| M | 6.341 | 6.421 | −7.8 | −1.74 | 0.081 | ||
| Exp | U | 0.218 | 0.192 | 32.1 | 100.0 | 8.08 | 0.000 |
| M | 0.218 | 0.218 | 0.0 | 0.00 | 0.999 | ||
| IndStr | U | 0.458 | 0.447 | 14.7 | 13.9 | 3.68 | 0.000 |
| M | 0.457 | 0.466 | −12.6 | −3.04 | 0.002 | ||
| (1) | (2) | (3) | (4) | |
|---|---|---|---|---|
| Dep.Variable | SO2 | CO | NO2 | PM2.5 |
| Treat × Post | −0.2831 *** | −0.0757 * | −0.0572 *** | −0.0715 *** |
| (0.0372) | (0.0411) | (0.0204) | (0.0202) | |
| LnGDP | −0.0906 | −0.0898 | 0.1940 *** | 0.0478 |
| (0.1326) | (0.0710) | (0.0476) | (0.0615) | |
| LnPop | −0.1016 | 0.0019 | −0.0816 | −0.3206 |
| (0.5075) | (0.2764) | (0.2632) | (0.2138) | |
| LnInd | 0.0819 | 0.0490 | −0.1028 *** | 0.0886 ** |
| (0.0674) | (0.0540) | (0.0367) | (0.0370) | |
| Exp | −0.2803 | −0.8172 ** | −0.2974 | −0.2161 |
| (0.5118) | (0.4121) | (0.2926) | (0.2932) | |
| IndStr | 0.1656 | 0.4083 | −0.0219 | −0.3149 |
| (0.3666) | (0.3381) | (0.2262) | (0.1922) | |
| City FEs | Yes | Yes | Yes | Yes |
| Year FEs | Yes | Yes | Yes | Yes |
| Observation | 1146 | 1146 | 1146 | 1146 |
| adj. | 0.887 | 0.862 | 0.939 | 0.933 |
| (1) | (2) | (3) | |
|---|---|---|---|
| Dep.Variable | AQI | AQI | AQI |
| Treat × Post-1 | 0.0026 | ||
| (0.0068) | |||
| Treat × Post-2 | −0.0038 | ||
| (0.0077) | |||
| Treat × Post-3 | −0.0032 | ||
| (0.0088) | |||
| LnGDP | 0.0695 *** | 0.0685 *** | 0.0686 *** |
| (0.0214) | (0.0213) | (0.0213) | |
| LnPop | 0.2120 ** | 0.2062 ** | 0.2064 ** |
| (0.0850) | (0.0841) | (0.0839) | |
| LnInd | 0.0079 | 0.0068 | 0.0069 |
| (0.0119) | (0.0119) | (0.0119) | |
| Exp | −0.1104 | −0.0989 | −0.1013 |
| (0.1038) | (0.1041) | (0.1037) | |
| IndStr | −0.1691 *** | −0.1817 *** | −0.1800 *** |
| (0.0624) | (0.0627) | (0.0627) | |
| City FEs | Yes | Yes | Yes |
| Year FEs | Yes | Yes | Yes |
| Observation | 2504 | 2504 | 2504 |
| adj. | 0.929 | 0.929 | 0.929 |
| (1) | (2) | (3) | (4) | |
|---|---|---|---|---|
| Excluding Heating Cases in Certain Residential Areas | Considering Time-Varying Heating Cases | |||
| Dep.Variable | AQI | AQI | AQI | AQI |
| Treat × Post | −0.0198 ** | −0.0179 ** | −0.0215 *** | −0.0195 *** |
| (0.0078) | (0.0072) | (0.0074) | (0.0068) | |
| LnGDP | 0.0692 *** | 0.0695 *** | ||
| (0.0213) | (0.0213) | |||
| LnPop | 0.1966 ** | 0.1960 ** | ||
| (0.0830) | (0.0831) | |||
| LnInd | 0.0061 | 0.0052 | ||
| (0.0118) | (0.0118) | |||
| Exp | −0.0854 | −0.0864 | ||
| (0.1033) | (0.1035) | |||
| IndStr | −0.2029 *** | −0.2040 *** | ||
| (0.0627) | (0.0623) | |||
| City FEs | Yes | Yes | Yes | Yes |
| Year FEs | Yes | Yes | Yes | Yes |
| Observation | 2529 | 2504 | 2529 | 2504 |
| adj. | 0.923 | 0.929 | 0.923 | 0.929 |
| (1) | (2) | (3) | |
|---|---|---|---|
| Nearest Neighbor Matching (1:2) | Radius Matching | Kernel Matching | |
| Dep.Variable | AQI | AQI | AQI |
| Treat × Post | −0.0310 ** | −0.0246 *** | −0.0359 *** |
| (0.0124) | (0.0090) | (0.0086) | |
| LnGDP | 0.1467 *** | 0.1152 *** | 0.1280 *** |
| (0.0244) | (0.0236) | (0.0251) | |
| LnPop | 0.2206 | 0.2134 ** | 0.1156 |
| (0.1397) | (0.1013) | (0.1262) | |
| LnInd | −0.0428 ** | −0.0123 | −0.0259 |
| (0.0198) | (0.0148) | (0.0161) | |
| Exp | −0.1602 | −0.1192 | −0.0393 |
| (0.1730) | (0.1176) | (0.1445) | |
| IndStr | −0.1098 | −0.1361 | −0.1235 |
| (0.1486) | (0.0920) | (0.1008) | |
| City FEs | Yes | Yes | Yes |
| Year FEs | Yes | Yes | Yes |
| Observation | 1699 | 2503 | 2482 |
| adj. | 0.951 | 0.940 | 0.948 |
| (1) | (2) | (3) | (4) | (5) | |
|---|---|---|---|---|---|
| Dep.Variable | AQI | SO2 | CO | NO2 | PM2.5 |
| Treat × Post | −0.0413 ** | −0.2922 *** | −0.1000 ** | −0.0477 ** | −0.0806 *** |
| (0.0187) | (0.0670) | (0.0392) | (0.0211) | (0.0239) | |
| LnGdp | 0.1644 *** | 0.1518 | −0.0209 | 0.1012 | 0.1996 *** |
| (0.0475) | (0.1651) | (0.0985) | (0.0747) | (0.0608) | |
| LnPop | 0.1167 | 0.5328 | 0.1507 | −0.3369 | −0.1946 |
| (0.2030) | (0.6821) | (0.2639) | (0.2223) | (0.2307) | |
| LnInd | −0.0533 | 0.0276 | 0.0216 | 0.0817 ** | −0.0668 |
| (0.0367) | (0.0943) | (0.0580) | (0.0323) | (0.0431) | |
| Exp | −0.6062 ** | −0.7707 | −0.9263 ** | −0.2043 | −0.7599 ** |
| (0.2850) | (0.7832) | (0.4556) | (0.3345) | (0.3732) | |
| IndStr | −0.2516 | 0.6641 | 0.3142 | −0.1228 | 0.0155 |
| (0.2335) | (0.6382) | (0.3947) | (0.2148) | (0.2590) | |
| City FEs | Yes | Yes | Yes | Yes | Yes |
| Year FEs | Yes | Yes | Yes | Yes | Yes |
| Observation | 1163 | 1163 | 1163 | 1163 | 1163 |
| adj. | 0.935 | 0.909 | 0.874 | 0.944 | 0.952 |
| (1) | (2) | (3) | (4) | |
|---|---|---|---|---|
| New Energy Demonstration Cities Policy | Clean Heating Plan for Winter in the Northern Region | |||
| Dep.Variable | AQI | AQI | AQI | AQI |
| Treat × Post | −0.0241 *** | −0.0206 *** | −0.0190 ** | −0.0156 ** |
| (0.0085) | (0.0076) | (0.0078) | (0.0071) | |
| LnGDP | 0.0677 *** | 0.0689 *** | ||
| (0.0216) | (0.0212) | |||
| LnPop | 0.1982 ** | 0.2048 ** | ||
| (0.0885) | (0.0841) | |||
| LnInd | −0.0034 | 0.0111 | ||
| (0.0130) | (0.0123) | |||
| Exp | −0.1816 | −0.1146 | ||
| (0.1111) | (0.1047) | |||
| IndStr | −0.2361 *** | −0.2207 *** | ||
| (0.0657) | (0.0627) | |||
| City FEs | Yes | Yes | Yes | Yes |
| Year FEs | Yes | Yes | Yes | Yes |
| Observation | 1993 | 1972 | 2394 | 2364 |
| adj. | 0.923 | 0.930 | 0.916 | 0.924 |
| (1) | (2) | (3) | (4) | (5) | |
|---|---|---|---|---|---|
| Temperature Heterogeneity | Region Heterogeneity | ||||
| Low | High | East | Middle | West | |
| Dep.Variable | AQI | AQI | QI | AQI | AQI |
| Treat × Post | −0.0542 *** | −0.0281 *** | −0.0648 *** | −0.0014 | 0.0188 |
| (0.0122) | (0.0088) | (0.0081) | (0.0113) | (0.0152) | |
| LnGDP | 0.1051 *** | 0.0179 | 0.0616 * | 0.0856 ** | 0.0679 |
| (0.0311) | (0.0309) | (0.0315) | (0.0355) | (0.0511) | |
| LnPop | 0.0985 | 0.3146 * | 0.3028 *** | 0.1291 | 0.0672 |
| (0.0822) | (0.1628) | (0.1151) | (0.1578) | (0.1236) | |
| LnInd | 0.0393 ** | −0.0409 ** | −0.0148 | 0.0253 | −0.0400 |
| (0.0170) | (0.0160) | (0.0168) | (0.0204) | (0.0315) | |
| Exp | 0.0818 | −0.3085 * | −0.2515 | −0.0913 | −0.1262 |
| (0.1325) | (0.1568) | (0.1582) | (0.1825) | (0.2248) | |
| IndStr | −0.1786 * | −0.1529 | −0.0164 | −0.2588 ** | −0.1116 |
| (0.0916) | (0.0998) | (0.1113) | (0.1149) | (0.1073) | |
| City FEs | Yes | Yes | Yes | Yes | Yes |
| Year FEs | Yes | Yes | Yes | Yes | Yes |
| Observation | 1000 | 1469 | 1009 | 918 | 489 |
| adj. | 0.919 | 0.935 | 0.956 | 0.896 | 0.939 |
| Panel A: Consumption of Coal | ||||
|---|---|---|---|---|
| (1) | (2) | |||
| Dep.Variable | LnCoal | LnCoal | ||
| Treat × Post | −0.1378 *** | −0.0700 ** | ||
| (0.0372) | (0.0308) | |||
| Controls | No | Yes | ||
| City FEs | Yes | Yes | ||
| Year FEs | Yes | Yes | ||
| Observation | 6831 | 6584 | ||
| adj. | 0.942 | 0.951 | ||
| Panel B: Government Environmental Regulations and Technology Expenditure | ||||
| (1) | (2) | (3) | (4) | |
| Dep.Variable | AQI | AQI | AQI | AQI |
| Treat × Post × EnvReg | −0.0050 *** | −0.0044 ** | ||
| (0.0019) | (0.0017) | |||
| EnvReg | 0.0005 | 0.0005 | ||
| (0.0058) | (0.0055) | |||
| Treat × Post × TechExp | −0.0434 * | −0.0396 * | ||
| (0.0230) | (0.0214) | |||
| TechExp | 0.0049 | 0.0040 | ||
| (0.0201) | (0.0195) | |||
| Controls | No | Yes | No | Yes |
| City FEs | Yes | Yes | Yes | Yes |
| Year FEs | Yes | Yes | Yes | Yes |
| Observation | 2438 | 2432 | 2508 | 2504 |
| adj. | 0.923 | 0.927 | 0.925 | 0.929 |
Disclaimer/Publisher’s Note: The statements, opinions and data contained in all publications are solely those of the individual author(s) and contributor(s) and not of MDPI and/or the editor(s). MDPI and/or the editor(s) disclaim responsibility for any injury to people or property resulting from any ideas, methods, instructions or products referred to in the content. |
© 2024 by the authors. Licensee MDPI, Basel, Switzerland. This article is an open access article distributed under the terms and conditions of the Creative Commons Attribution (CC BY) license (https://creativecommons.org/licenses/by/4.0/).
Share and Cite
Tang, A.; Zhu, Y.; Gu, W.; Wang, C. Air Quality Benefits of Renewable Energy: Evidence from China’s Renewable Energy Heating Policy. Sustainability 2024, 16, 9268. https://doi.org/10.3390/su16219268
Tang A, Zhu Y, Gu W, Wang C. Air Quality Benefits of Renewable Energy: Evidence from China’s Renewable Energy Heating Policy. Sustainability. 2024; 16(21):9268. https://doi.org/10.3390/su16219268
Chicago/Turabian StyleTang, Aidi, Yunxuan Zhu, Wenjia Gu, and Ce Wang. 2024. "Air Quality Benefits of Renewable Energy: Evidence from China’s Renewable Energy Heating Policy" Sustainability 16, no. 21: 9268. https://doi.org/10.3390/su16219268
APA StyleTang, A., Zhu, Y., Gu, W., & Wang, C. (2024). Air Quality Benefits of Renewable Energy: Evidence from China’s Renewable Energy Heating Policy. Sustainability, 16(21), 9268. https://doi.org/10.3390/su16219268